Embed Size (px)
Citation preview

Insurance Risk StudySeventh Edition 2012
Empower Results™
Insurance Risk Study
Contents
About Aon BenfieldAon Benfield, a division of Aon plc (NYSE: AON), is the world’s leading reinsurance intermediary and full-service capital advisor. We empower our clients to better understand, manage and transfer risk through innovative solutions and personalized access to all forms of global reinsurance capital across treaty, facultative and capital markets. As a trusted advocate, we deliver local reach to the world’s markets, an unparalleled investment in innovative analytics, including catastrophe management, actuarial and rating agency advisory. Through our professionals’ expertise and experience, we advise clients in making optimal capital choices that will empower results and improve operational effectiveness for their business. With more than 80 offices in 50 countries, our worldwide client base has access to the broadest portfolio of integrated capital solutions and services. To learn how Aon Benfield helps empower results, please visit aonbenfield.com.
3 Foreword
4 Global Risk Parameters
6 U.S. Risk Parameters
7 U.S. Reserve Adequacy and Risk
8 Modeling the Underwriting Cycle
9 New Paradigm Optimization
10 Motor Insurance in China
11 A Different View of Risk
18 Global Wind and Earthquake Risk
20 Robust Risk Management
21 Global Crop Insurance Penetration
22 Correlation Considerations
23 Global Correlation between Lines
24 Macroeconomic Correlation
25 Global Market Review
31 Afterword: The Disappearing Risk
3
Aon Benfield
Foreword
Twenty years ago, on August 24, 1992, Hurricane Andrew made landfall in Homestead, Florida, and fundamentally changed the insurance industry forever. It precipitated the analytic era of insurance risk management, with its focus on computer simulation models and statistical quantification of risk. Results of the last twenty years show the great strengths of the new era, but also some weaknesses. The industry has become both more robust and more fragile. 2005 demonstrated the new robustness: despite four landfalling hurricanes, including Katrina, only seven U.S. companies became impaired in 2005, the second lowest total in the last twenty years. 2001 showed fragility with the surprise World Trade Center terrorist attack, which contributed to the 41 impairments that year, the second highest total. 2011 again challenged the global insurance industry with unexpected, un-modeled losses from the Tōhoku tsunami and Thailand floods.
Time and time again we see perils with robust, widely accepted models being more effectively managed through insurance, reinsurance and other mechanisms. There is now broad agreement on the need to model and understand as many insured risks as possible. Since its first edition in April 2006, the Insurance Risk Study has provided a consistent set of global benchmark risk parameters based on empirical data. The Study is designed to put the analysis of liability and non-catastrophic property lines on an equal footing with risks analyzed using catastrophe models and to help expand the universe of effectively modeled risk as far as possible.
In this year’s Study we maintain our philosophy of complementing catastrophe models. However, motivated by the fragility caused by un-modeled events, we also report on catastrophic risk — but from a purely empirical point of view. A series of Aon Benfield cartogram maps, starting on page 11, illustrate global exposure to wind, earthquake and flood perils. These cartogram maps are based on up to 100 years of historical data. They form the basis for a robust, consistent, and global complement and backup to traditional catastrophe models. Last year’s tsunami, Thailand floods and U.S. severe weather outbreaks, which were not modeled or only poorly modeled, illustrate the need for such backup risk management.
Another addition to the Study this year provides expanded coverage of opportunities in the insurance world. Which parts are growing and which are shrinking? Where are the opportunities to write more profitable business? Aon Benfield can provide its clients with very granular market intelligence to create business plans that are realistic, actionable, fact-based and, above all, profitable. Our approach, from sizing the opportunity through identifying distribution channel dynamics, assessing competitor behavior, and understanding what it takes to compete and win, is illustrated and explained on pages 25 to 30.
The Aon Benfield Insurance Risk Study continues to be the industry’s leading set of risk parameters for modeling and benchmarking underwriting risk. It is part of a suite of capabilities that help position Aon Benfield as a true business partner on questions of risk management, growth and operational performance. The Study is a cornerstone of Aon Benfield Analytics’ integrated and comprehensive risk modeling and risk assessment capabilities. Our reinsurance optimization framework, explicitly linking reinsurance and capital and quantifying the resulting volatility reduction, combines client data with risk parameters from the Study to generate a credible assessment of baseline underwriting volatility. Our global risk and capital strategy practice, providing ERM and economic capital modeling services and the ReMetrica® software platform, uses the Study to benchmark risk, quantify capital adequacy and allocate capital to risk drivers. The massive database underlying the Study is supported by more than 400 local professionals within Aon Benfield’s global analytics team who are available to work with you to customize the basic parameters reported in the Study to answer your specific, pressing business questions.
All of our work within the analytics team is motivated by client questions. We are grateful to clients who have invited us to share in the task of helping them analyze their most complex business problems. Dynamic and interactive working groups always lead to innovative, and often unexpected, solutions. If you have questions or suggestions for items we could explore in future editions please contact your local Aon Benfield broker or any of the contacts listed on the back page.
4
Insurance Risk Study
PeruMexicoTaiwanGreece
PhilippinesSingaporeIndonesia
BrazilHong Kong
Dominican RepublicRomania
NicaraguaSlovakia
ColombiaPakistan
ArgentinaPanama
HondurasU.S.
EcuadorVietnam
South KoreaEl SalvadorVenezuela
UruguayHungary
IndiaPolandChina
FranceJapan
MalaysiaTurkey
NetherlandsChile
BoliviaCanada
U.K.Switzerland
ItalyAustria
SpainGermanyAustralia
South AfricaIsrael
Denmark
PhilippinesGreece
NicaraguaHong Kong
RomaniaPanamaEcuador
DenmarkIndonesia
SlovakiaVenezuelaHonduras
ChinaSingapore
El SalvadorPeruU.S.U.K.
South AfricaVietnamMalaysia
ArgentinaCanadaPoland
Dominican RepublicColombia
PakistanBrazilChile
NetherlandsIndiaItaly
UruguayTurkeyBolivia
MexicoGermany
Czech RepublicSpain
AustriaSwitzerland
AustraliaHungary
South KoreaTaiwanFranceJapanIsrael
14%12%
15%16%16%17%17%18%20%21%22%23%25%25%26%27%28%28%30%
33%34%34%35%
37%38%
43%43%
42%42%
45%46%47%
51%53%53%55%57%
61%62%
65%66%68%
70%77%
84%93%
96%
5%5%6%7%7%8%8%8%8%8%9%9%9%10%11%11%12%12%12%12%13%13%13%13%14%14%14%15%15%15%15%16%16%17%18%18%18%18%
22%
22%22%
25%23%
50%
37%41%
46%
64%
Americas Asia Pacific Europe, Middle East & Africa
Motor Property
Global Risk Parameters
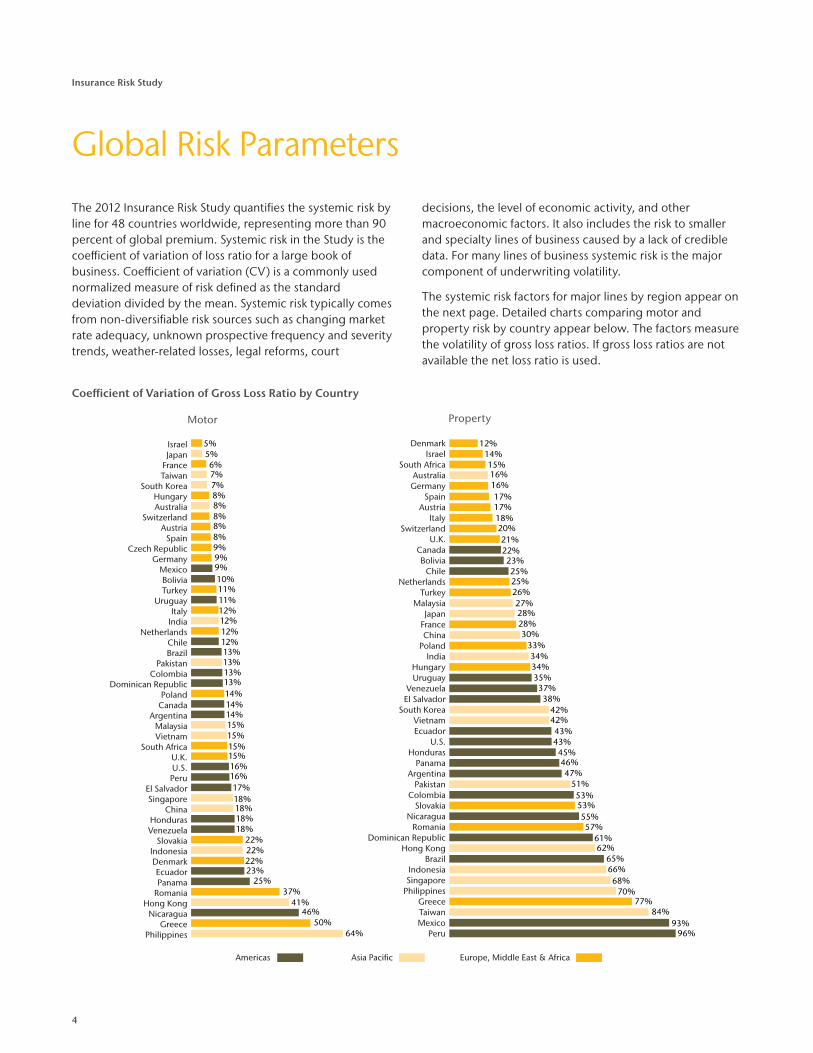
The 2012 Insurance Risk Study quantifies the systemic risk by line for 48 countries worldwide, representing more than 90 percent of global premium. Systemic risk in the Study is the coefficient of variation of loss ratio for a large book of business. Coefficient of variation (CV) is a commonly used normalized measure of risk defined as the standard deviation divided by the mean. Systemic risk typically comes from non-diversifiable risk sources such as changing market rate adequacy, unknown prospective frequency and severity trends, weather-related losses, legal reforms, court
decisions, the level of economic activity, and other macroeconomic factors. It also includes the risk to smaller and specialty lines of business caused by a lack of credible data. For many lines of business systemic risk is the major component of underwriting volatility.
The systemic risk factors for major lines by region appear on the next page. Detailed charts comparing motor and property risk by country appear below. The factors measure the volatility of gross loss ratios. If gross loss ratios are not available the net loss ratio is used.
Coefficient of Variation of Gross Loss Ratio by Country

5
Aon Benfield
Underwriting Volatility for Major Lines by Country, Coefficient of Variation of Loss Ratio for Each Line
Reported CVs are of gross loss ratios, except for Argentina, Australia, Bolivia, Chile, Ecuador, India, Malaysia, Singapore, Uruguay, and Venezuela, which are of net loss ratios.
Accident & Health is defined differently in each country; it may include pure accident A&H coverage, credit A&H, and individual or group A&H. In the U.S., A&H makes up about 80 percent of the “Other” line of business with the balance of the line being primarily credit insurance.
Mot
or
Mot
or -
Pe
rson
al
Mot
or -
Com
mer
cial
Prop
erty
Prop
erty
- Pe
rson
al
Prop
erty
- C
omm
erci
al
Gen
eral
Li
abili
ty
Acc
iden
t &
Hea
lth
Mar
ine,
A
viat
ion
&
Tra
nsit
Wor
kers
’ C
omp
ensa
tion
Cre
dit
Fid
elit
y
& S
uret
y
Americas
Argentina 14% 47% 57% 29% 9% 274%
Bolivia 10% 23% 16%
Brazil 13% 65% 50% 72% 70% 49% 45% 72%
Canada 14% 22% 17% 36% 35% 42% 78% 96% 104%
Chile 12% 25% 49% 58% 23% 52%
Colombia 13% 53% 68% 25% 16% 76%
Dominican Republic 13% 61% 86% 72%
Ecuador 23% 43% 51% 92%
El Salvador 17% 38% 15% 97%
Honduras 18% 45% 10% 243%
Mexico 9% 93% 63% 44%
Nicaragua 46% 55% 58% 170%
Panama 25% 46% 18% 99%
Peru 16% 96% 65% 23% 23% 130%
Uruguay 11% 35%
U.S. 16% 14% 24% 43% 48% 34% 38% 53% 39% 27% 69%
Venezuela 18% 37% 20% 230%
Asia Pacific
Australia 8% 16% 23% 32% 54% 10% 30%
China 18% 16% 30% 63% 38% 29% 20% 13% 127%
Hong Kong 41% 62% 86% 22% 65% 78%
India 12% 34% 13% 30%
Indonesia 22% 29% 66% 132% 52% 65% 87% 123%
Japan 5% 28% 12% 10% 16% 6%
Malaysia 15% 27% 119% 30% 36% 89%
Pakistan 13% 51% 36%
Philippines 64% 70% 72% 74% 87% 163%
Singapore 18% 68% 41% 75% 40%
South Korea 7% 7% 42% 33% 52%
Taiwan 7% 7% 84% 50% 23% 73% 79%
Vietnam 15% 42% 38% 11% 30%
Europe, Middle East & Africa
Austria 8% 17% 13% 49% 21% 13% 20% 50%
Czech Republic 9%
Denmark 22% 12% 15% 15% 18% 18% 27% 25%
France 6% 28% 31% 23% 29% 25% 48%
Germany 9% 16% 17% 30% 26% 19% 22% 50%
Greece 50% 77% 83% 84%
Hungary 8% 34%
Israel 5% 14% 56%
Italy 12% 18% 25% 19% 43% 42% 64%
Netherlands 12% 25% 25% 51% 34% 33%
Poland 14% 33%
Romania 37% 57% 88%
Slovakia 22% 53%
South Africa 15% 15% 67% 35% 39%
Spain 8% 8% 17% 12% 21% 33% 13% 33% 46% 112%
Switzerland 8% 20% 22% 11% 50% 81%
Turkey 11% 8% 26% 26% 38% 12% 61% 80%
U.K. 15% 15% 19% 21% 20% 27% 33% 5%

6
Insurance Risk Study
U.S. Risk Parameters Over TimeThe Insurance Risk Study, now in its seventh edition, has published gross loss ratio CVs for Schedule P lines of business each year since its inception. The first edition CVs were based on data from 1992 — 2005. Since then, six additional years of results have added 43 percent more data to the analysis.
The table on the right compares the published CVs from the first edition of the Insurance Risk Study to the current CVs. For many lines of business the CV is remarkably consistent from the first edition to seventh edition, showing that the methodology for estimation of CV is robust. Those lines which have experienced large changes in estimated CV from the original study are mostly longer tailed casualty lines that have seen significant loss development on old accident years and greatly improved pricing in recent years.
Coefficient of Variation of Gross Loss Ratio
Line of Business 1st Edition 7th Edition Change
Private Passenger Auto 14% 14% 0%
Commercial Auto 24% 24% 0%
Workers' Compensation 26% 27% 1%
Commercial Multi Peril 32% 34% 2%
Medical Malpractice — Claims-Made 33% 42% 9%
Medical Malpractice — Occurrence 35% 35% 0%
Other Liability — Occurrence 36% 38% 2%
Special Liability 39% 39% 0%
Other Liability — Claims-Made 39% 41% 2%
Reinsurance — Liability 42% 67% 25%
Products Liability — Occurrence 43% 47% 4%
International 45% 72% 27%
Homeowners 47% 48% 1%
Reinsurance — Property 65% 85% 20%
Reinsurance — Financial 81% 93% 12%
Products Liability — Claims-Made 102% 100% -2%
U.S. Risk Parameters
The U.S. portion of the Insurance Risk Study uses data from ten years of NAIC annual statements for 2,319 individual groups and companies. The database covers all 22 Schedule P lines of business and contains 1.7 million records of individual company observations from accident years 1992–2011.
The charts below show the loss ratio volatility for each Schedule P line, with and without the effect of the underwriting cycle. The effect of the underwriting cycle is removed by normalizing loss ratios by accident year prior to computing volatility. This adjustment decomposes loss ratio volatility into its loss and premium components.
14%
17%
24%
27%
31%
34%
35%
38%
39%
41%
42%
47%
48%
53%
67%
69%
72%
85%
93%
98%
100%
143%
13%
15%
18%
19%
32%
36%
28%
27%
30%
27%
31%
34%
41%
50%
44%
51%
56%
57%
61%
58%
49%
100%Financial Guaranty
Special Property
Products Liability – Claims-Made
Reinsurance – Financial
Reinsurance – Property
International
Fidelity and Surety
Reinsurance – Liability
Other
Homeowners
Products Liability – Occurrence
Medical PL – Claims-Made
Other Liability – Claims-Made
Special Liability
Other Liability – Occurrence
Commercial Multi Peril
Medical PL – Occurrence
Warranty
Workers’ Compensation
Commercial Auto
Auto Physical Damage
Private Passenger Auto
Financial Guaranty
Special Property
Products Liability – Claims-Made
Reinsurance – Financial
Reinsurance – Property
International
Fidelity and Surety
Reinsurance – Liability
Other
Homeowners
Products Liability - Occurrence
Medical PL – Claims-Made
Other Liability – Claims-Made
Special Liability
Other Liability – Occurrence
Commercial Multi Peril
Medical PL – Occurrence
Warranty
Workers’ Compensation
Commercial Auto
Auto Physical Damage
Private Passenger Auto
Coefficient of Variation of Gross Loss Ratio | 1992–2011
All Risk No Underwriting Cycle Risk
7
Aon Benfield
U.S. Reserve Adequacy and Risk
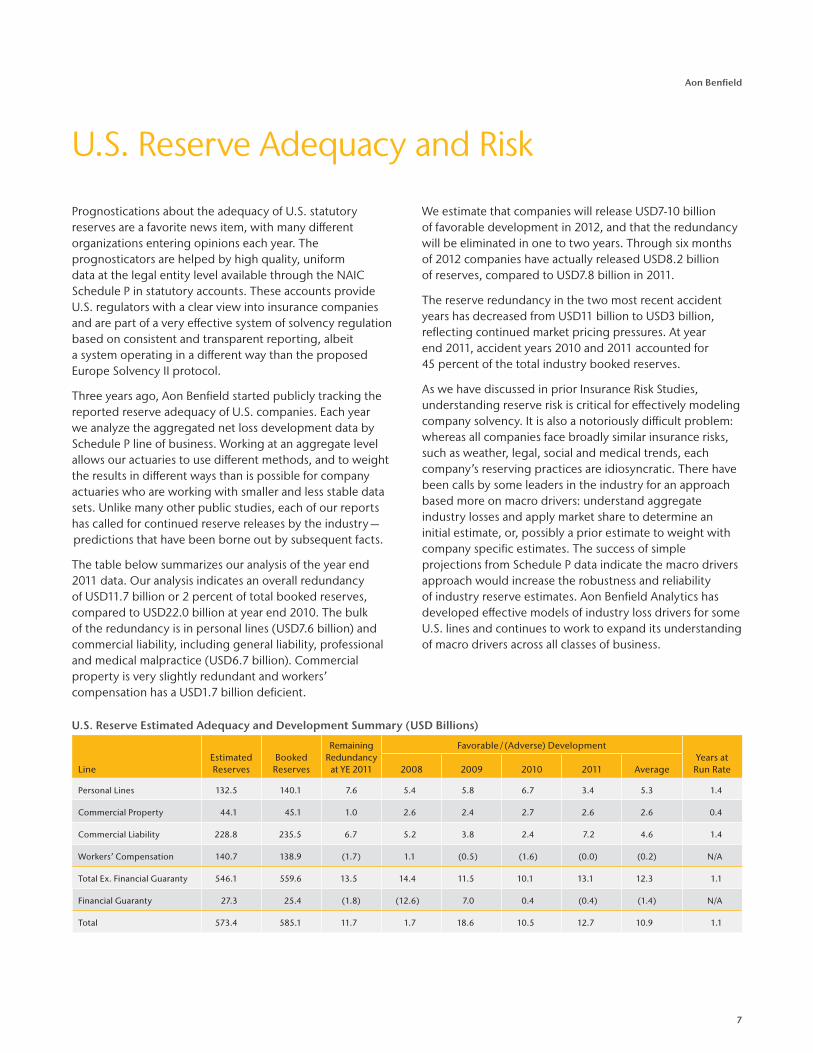
U.S. Reserve Estimated Adequacy and Development Summary (USD Billions)
LineEstimated Reserves
Booked Reserves
Remaining Redundancy
at YE 2011
Favorable / (Adverse) DevelopmentYears at
Run Rate2008 2009 2010 2011 Average
Personal Lines 132.5 140.1 7.6 5.4 5.8 6.7 3.4 5.3 1.4
Commercial Property 44.1 45.1 1.0 2.6 2.4 2.7 2.6 2.6 0.4
Commercial Liability 228.8 235.5 6.7 5.2 3.8 2.4 7.2 4.6 1.4
Workers’ Compensation 140.7 138.9 (1.7) 1.1 (0.5) (1.6) (0.0) (0.2) N/A
Total Ex. Financial Guaranty 546.1 559.6 13.5 14.4 11.5 10.1 13.1 12.3 1.1
Financial Guaranty 27.3 25.4 (1.8) (12.6) 7.0 0.4 (0.4) (1.4) N/A
Total 573.4 585.1 11.7 1.7 18.6 10.5 12.7 10.9 1.1
Prognostications about the adequacy of U.S. statutory reserves are a favorite news item, with many different organizations entering opinions each year. The prognosticators are helped by high quality, uniform data at the legal entity level available through the NAIC Schedule P in statutory accounts. These accounts provide U.S. regulators with a clear view into insurance companies and are part of a very effective system of solvency regulation based on consistent and transparent reporting, albeit a system operating in a different way than the proposed Europe Solvency II protocol.
Three years ago, Aon Benfield started publicly tracking the reported reserve adequacy of U.S. companies. Each year we analyze the aggregated net loss development data by Schedule P line of business. Working at an aggregate level allows our actuaries to use different methods, and to weight the results in different ways than is possible for company actuaries who are working with smaller and less stable data sets. Unlike many other public studies, each of our reports has called for continued reserve releases by the industry — predictions that have been borne out by subsequent facts.
The table below summarizes our analysis of the year end 2011 data. Our analysis indicates an overall redundancy of USD11.7 billion or 2 percent of total booked reserves, compared to USD22.0 billion at year end 2010. The bulk of the redundancy is in personal lines (USD7.6 billion) and commercial liability, including general liability, professional and medical malpractice (USD6.7 billion). Commercial property is very slightly redundant and workers’ compensation has a USD1.7 billion deficient.
We estimate that companies will release USD7-10 billion of favorable development in 2012, and that the redundancy will be eliminated in one to two years. Through six months of 2012 companies have actually released USD8.2 billion of reserves, compared to USD7.8 billion in 2011.
The reserve redundancy in the two most recent accident years has decreased from USD11 billion to USD3 billion, reflecting continued market pricing pressures. At year end 2011, accident years 2010 and 2011 accounted for 45 percent of the total industry booked reserves.
As we have discussed in prior Insurance Risk Studies, understanding reserve risk is critical for effectively modeling company solvency. It is also a notoriously difficult problem: whereas all companies face broadly similar insurance risks, such as weather, legal, social and medical trends, each company’s reserving practices are idiosyncratic. There have been calls by some leaders in the industry for an approach based more on macro drivers: understand aggregate industry losses and apply market share to determine an initial estimate, or, possibly a prior estimate to weight with company specific estimates. The success of simple projections from Schedule P data indicate the macro drivers approach would increase the robustness and reliability of industry reserve estimates. Aon Benfield Analytics has developed effective models of industry loss drivers for some U.S. lines and continues to work to expand its understanding of macro drivers across all classes of business.
8
Insurance Risk Study
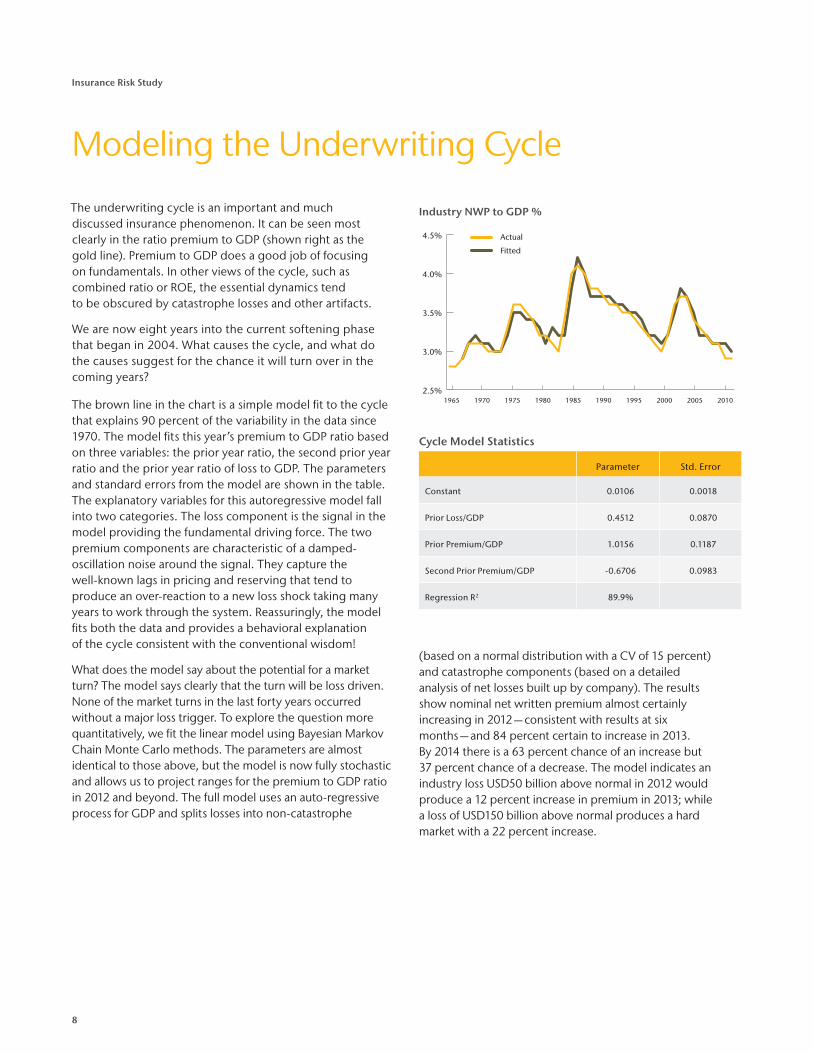
The underwriting cycle is an important and much discussed insurance phenomenon. It can be seen most clearly in the ratio premium to GDP (shown right as the gold line). Premium to GDP does a good job of focusing on fundamentals. In other views of the cycle, such as combined ratio or ROE, the essential dynamics tend to be obscured by catastrophe losses and other artifacts.
We are now eight years into the current softening phase that began in 2004. What causes the cycle, and what do the causes suggest for the chance it will turn over in the coming years?
The brown line in the chart is a simple model fit to the cycle that explains 90 percent of the variability in the data since 1970. The model fits this year’s premium to GDP ratio based on three variables: the prior year ratio, the second prior year ratio and the prior year ratio of loss to GDP. The parameters and standard errors from the model are shown in the table. The explanatory variables for this autoregressive model fall into two categories. The loss component is the signal in the model providing the fundamental driving force. The two premium components are characteristic of a damped-oscillation noise around the signal. They capture the well-known lags in pricing and reserving that tend to produce an over-reaction to a new loss shock taking many years to work through the system. Reassuringly, the model fits both the data and provides a behavioral explanation of the cycle consistent with the conventional wisdom!
What does the model say about the potential for a market turn? The model says clearly that the turn will be loss driven. None of the market turns in the last forty years occurred without a major loss trigger. To explore the question more quantitatively, we fit the linear model using Bayesian Markov Chain Monte Carlo methods. The parameters are almost identical to those above, but the model is now fully stochastic and allows us to project ranges for the premium to GDP ratio in 2012 and beyond. The full model uses an auto-regressive process for GDP and splits losses into non-catastrophe
Industry NWP to GDP %
2.5%
3.0%
3.5%
4.0%
4.5%Fitted
Data
2010200520001995199019851980197519701965
Actual
Fitted
Wheat
Modeling the Underwriting Cycle
Cycle Model Statistics
Parameter Std. Error
Constant 0.0106 0.0018
Prior Loss/GDP 0.4512 0.0870
Prior Premium/GDP 1.0156 0.1187
Second Prior Premium/GDP -0.6706 0.0983
Regression R2 89.9%
(based on a normal distribution with a CV of 15 percent) and catastrophe components (based on a detailed analysis of net losses built up by company). The results show nominal net written premium almost certainly increasing in 2012 — consistent with results at six months — and 84 percent certain to increase in 2013. By 2014 there is a 63 percent chance of an increase but 37 percent chance of a decrease. The model indicates an industry loss USD50 billion above normal in 2012 would produce a 12 percent increase in premium in 2013; while a loss of USD150 billion above normal produces a hard market with a 22 percent increase.
9
Aon Benfield
New Paradigm Optimization
Current Portfolio
E�cient Frontier (with constraints)
Risk
Rew
ard
(Pr
emiu
m)
?
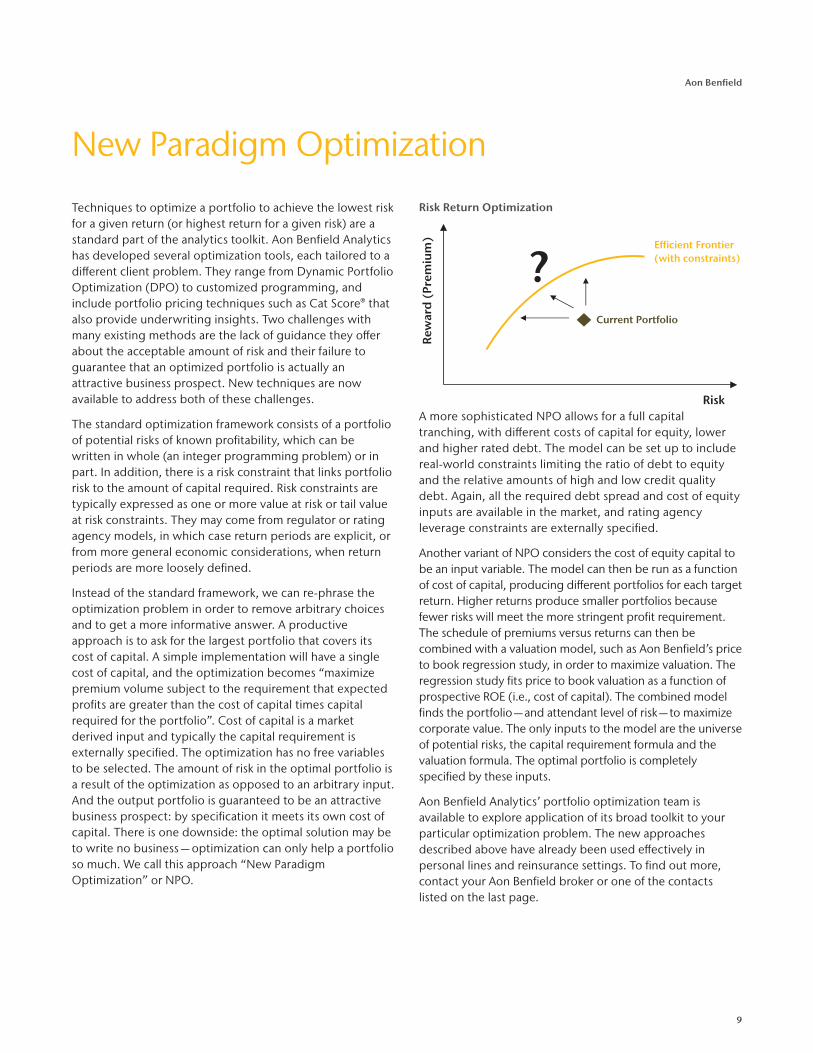
Techniques to optimize a portfolio to achieve the lowest risk for a given return (or highest return for a given risk) are a standard part of the analytics toolkit. Aon Benfield Analytics has developed several optimization tools, each tailored to a different client problem. They range from Dynamic Portfolio Optimization (DPO) to customized programming, and include portfolio pricing techniques such as Cat Score® that also provide underwriting insights. Two challenges with many existing methods are the lack of guidance they offer about the acceptable amount of risk and their failure to guarantee that an optimized portfolio is actually an attractive business prospect. New techniques are now available to address both of these challenges.
The standard optimization framework consists of a portfolio of potential risks of known profitability, which can be written in whole (an integer programming problem) or in part. In addition, there is a risk constraint that links portfolio risk to the amount of capital required. Risk constraints are typically expressed as one or more value at risk or tail value at risk constraints. They may come from regulator or rating agency models, in which case return periods are explicit, or from more general economic considerations, when return periods are more loosely defined.
Instead of the standard framework, we can re-phrase the optimization problem in order to remove arbitrary choices and to get a more informative answer. A productive approach is to ask for the largest portfolio that covers its cost of capital. A simple implementation will have a single cost of capital, and the optimization becomes “maximize premium volume subject to the requirement that expected profits are greater than the cost of capital times capital required for the portfolio”. Cost of capital is a market derived input and typically the capital requirement is externally specified. The optimization has no free variables to be selected. The amount of risk in the optimal portfolio is a result of the optimization as opposed to an arbitrary input. And the output portfolio is guaranteed to be an attractive business prospect: by specification it meets its own cost of capital. There is one downside: the optimal solution may be to write no business — optimization can only help a portfolio so much. We call this approach “New Paradigm Optimization” or NPO.
A more sophisticated NPO allows for a full capital tranching, with different costs of capital for equity, lower and higher rated debt. The model can be set up to include real-world constraints limiting the ratio of debt to equity and the relative amounts of high and low credit quality debt. Again, all the required debt spread and cost of equity inputs are available in the market, and rating agency leverage constraints are externally specified.
Another variant of NPO considers the cost of equity capital to be an input variable. The model can then be run as a function of cost of capital, producing different portfolios for each target return. Higher returns produce smaller portfolios because fewer risks will meet the more stringent profit requirement. The schedule of premiums versus returns can then be combined with a valuation model, such as Aon Benfield’s price to book regression study, in order to maximize valuation. The regression study fits price to book valuation as a function of prospective ROE (i.e., cost of capital). The combined model finds the portfolio — and attendant level of risk — to maximize corporate value. The only inputs to the model are the universe of potential risks, the capital requirement formula and the valuation formula. The optimal portfolio is completely specified by these inputs.
Aon Benfield Analytics’ portfolio optimization team is available to explore application of its broad toolkit to your particular optimization problem. The new approaches described above have already been used effectively in personal lines and reinsurance settings. To find out more, contact your Aon Benfield broker or one of the contacts listed on the last page.
Risk Return Optimization
10
Insurance Risk Study
Motor Insurance in China
Motor insurance is the largest line of business in China, constituting over 70 percent of premium in the property and casualty market. Since the product’s inception in China it has been a heavily regulated line of business. Authorization to write business, pricing, product design, and policy wordings have historically been under the tight control of the China Insurance Regulatory Commission (CIRC). This has severely limited product differentiation and innovation amongst Chinese insurers. But as with everything else in China, regulation is rapidly changing.
In recent years, the CIRC has implemented regulatory reforms and has signaled future reforms that will allow greater competition in the marketplace and the entry of foreign insurers. These changes offer early adopters the opportunity to materially increase market share in a low volatility line of business. Experience in the U.S., Australia and Europe shows that first movers are able to write profitable risks while those that are slow to adapt suffer from adverse selection.
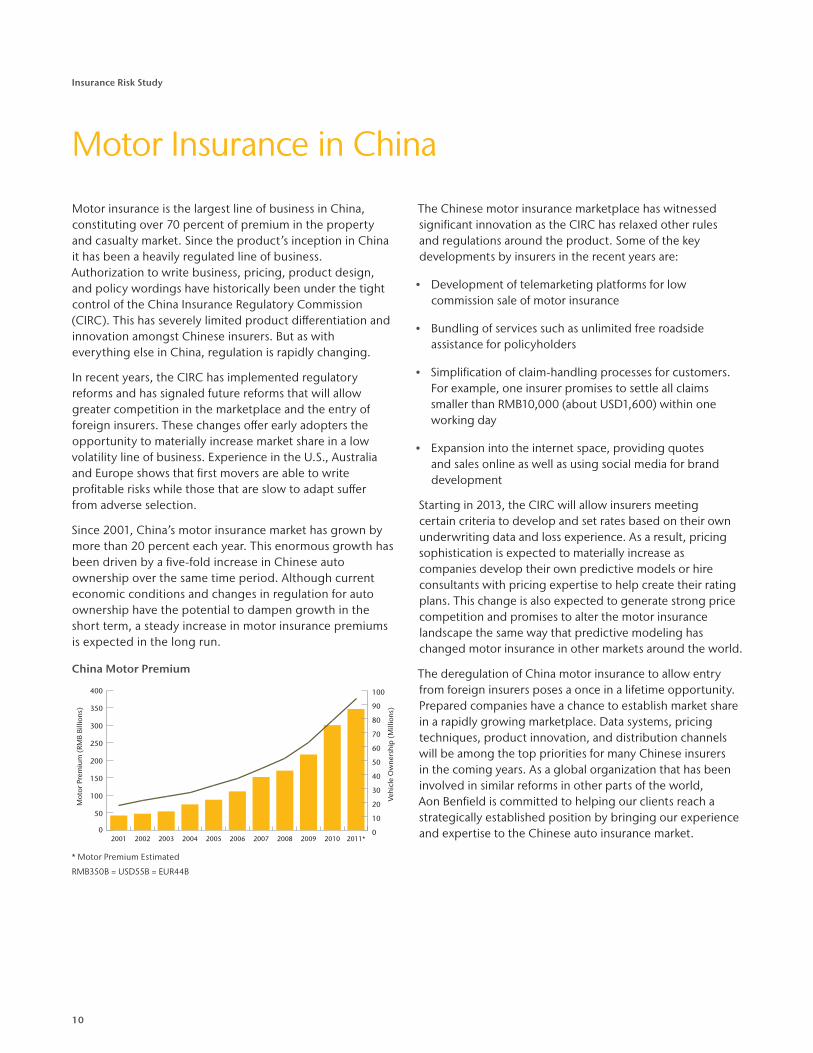
Since 2001, China’s motor insurance market has grown by more than 20 percent each year. This enormous growth has been driven by a five-fold increase in Chinese auto ownership over the same time period. Although current economic conditions and changes in regulation for auto ownership have the potential to dampen growth in the short term, a steady increase in motor insurance premiums is expected in the long run.
The Chinese motor insurance marketplace has witnessed significant innovation as the CIRC has relaxed other rules and regulations around the product. Some of the key developments by insurers in the recent years are:
• Development of telemarketing platforms for low commission sale of motor insurance
• Bundling of services such as unlimited free roadside assistance for policyholders
• Simplification of claim-handling processes for customers. For example, one insurer promises to settle all claims smaller than RMB10,000 (about USD1,600) within one working day
• Expansion into the internet space, providing quotes and sales online as well as using social media for brand development
Starting in 2013, the CIRC will allow insurers meeting certain criteria to develop and set rates based on their own underwriting data and loss experience. As a result, pricing sophistication is expected to materially increase as companies develop their own predictive models or hire consultants with pricing expertise to help create their rating plans. This change is also expected to generate strong price competition and promises to alter the motor insurance landscape the same way that predictive modeling has changed motor insurance in other markets around the world.
The deregulation of China motor insurance to allow entry from foreign insurers poses a once in a lifetime opportunity. Prepared companies have a chance to establish market share in a rapidly growing marketplace. Data systems, pricing techniques, product innovation, and distribution channels will be among the top priorities for many Chinese insurers in the coming years. As a global organization that has been involved in similar reforms in other parts of the world, Aon Benfield is committed to helping our clients reach a strategically established position by bringing our experience and expertise to the Chinese auto insurance market.0
50
100
150
200
250
300
350
400
2011*2010200920082007200620052004200320022001
Mot
or P
rem
ium
(RM
B Bi
llion
s)
Vehi
cle
Ow
ners
hip
(M
illio
ns)
0
10
20
30
40
50
60
70
80
90
100
* Motor Premium Estimated
China Motor Premium
RMB350B = USD55B = EUR44B
11
Aon Benfield
A Different View of Risk
The following pages present different views of the world — views based on population, economics
and exposure to risk. A series of Aon Benfield cartograms highlight global insured risk concentrations
and largely explain relative international catastrophe reinsurance pricing. The cartogram maps and
underlying data can be used as a traditional backup to model-based catastrophe risk management.
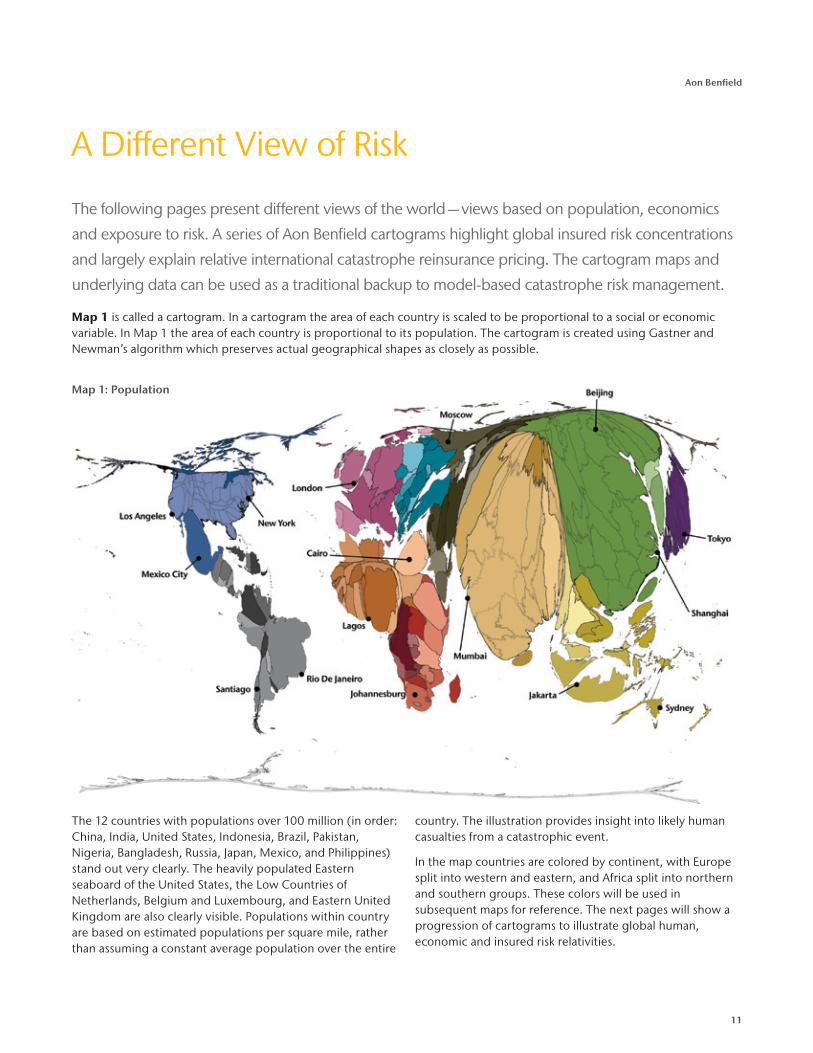
Map1 is called a cartogram. In a cartogram the area of each country is scaled to be proportional to a social or economic variable. In Map 1 the area of each country is proportional to its population. The cartogram is created using Gastner and Newman’s algorithm which preserves actual geographical shapes as closely as possible.
The 12 countries with populations over 100 million (in order: China, India, United States, Indonesia, Brazil, Pakistan, Nigeria, Bangladesh, Russia, Japan, Mexico, and Philippines) stand out very clearly. The heavily populated Eastern seaboard of the United States, the Low Countries of Netherlands, Belgium and Luxembourg, and Eastern United Kingdom are also clearly visible. Populations within country are based on estimated populations per square mile, rather than assuming a constant average population over the entire
country. The illustration provides insight into likely human casualties from a catastrophic event.
In the map countries are colored by continent, with Europe split into western and eastern, and Africa split into northern and southern groups. These colors will be used in subsequent maps for reference. The next pages will show a progression of cartograms to illustrate global human, economic and insured risk relativities.
Map 1: Population
12
Insurance Risk Study
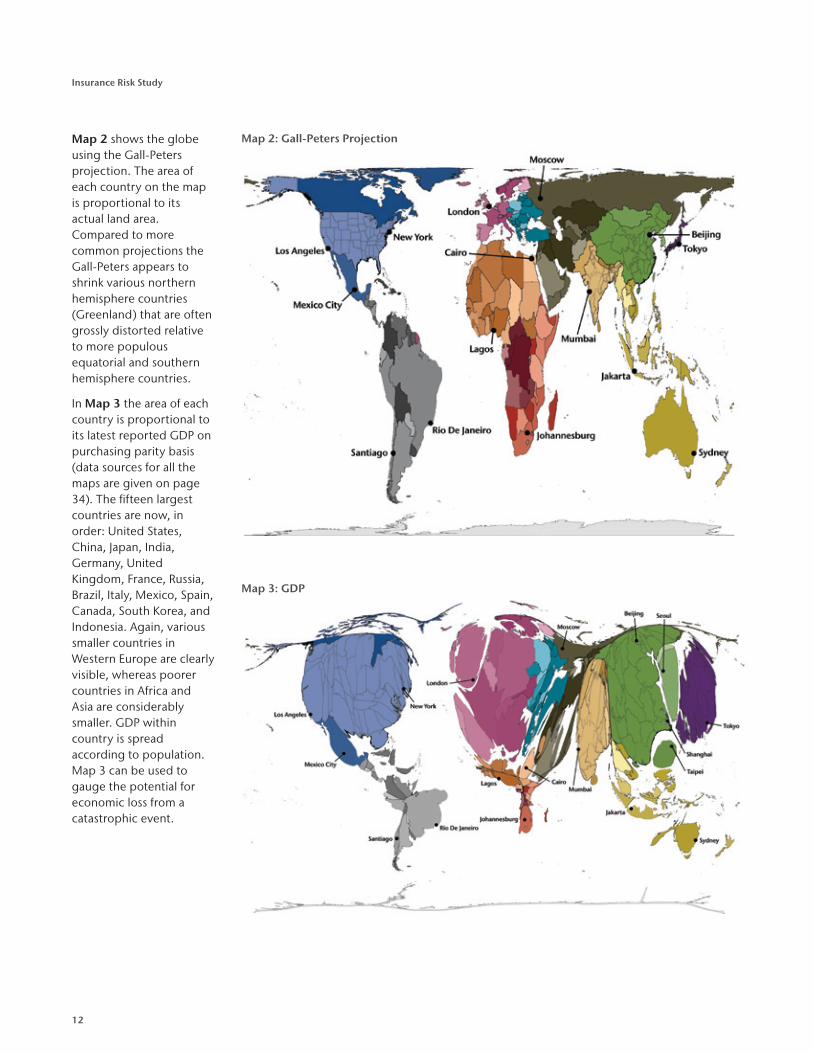
Map 2: Gall-Peters ProjectionMap 2 shows the globe using the Gall-Peters projection. The area of each country on the map is proportional to its actual land area. Compared to more common projections the Gall-Peters appears to shrink various northern hemisphere countries (Greenland) that are often grossly distorted relative to more populous equatorial and southern hemisphere countries.
In Map 3 the area of each country is proportional to its latest reported GDP on purchasing parity basis (data sources for all the maps are given on page 34). The fifteen largest countries are now, in order: United States, China, Japan, India, Germany, United Kingdom, France, Russia, Brazil, Italy, Mexico, Spain, Canada, South Korea, and Indonesia. Again, various smaller countries in Western Europe are clearly visible, whereas poorer countries in Africa and Asia are considerably smaller. GDP within country is spread according to population. Map 3 can be used to gauge the potential for economic loss from a catastrophic event.
Map 3: GDP
13
Aon Benfield
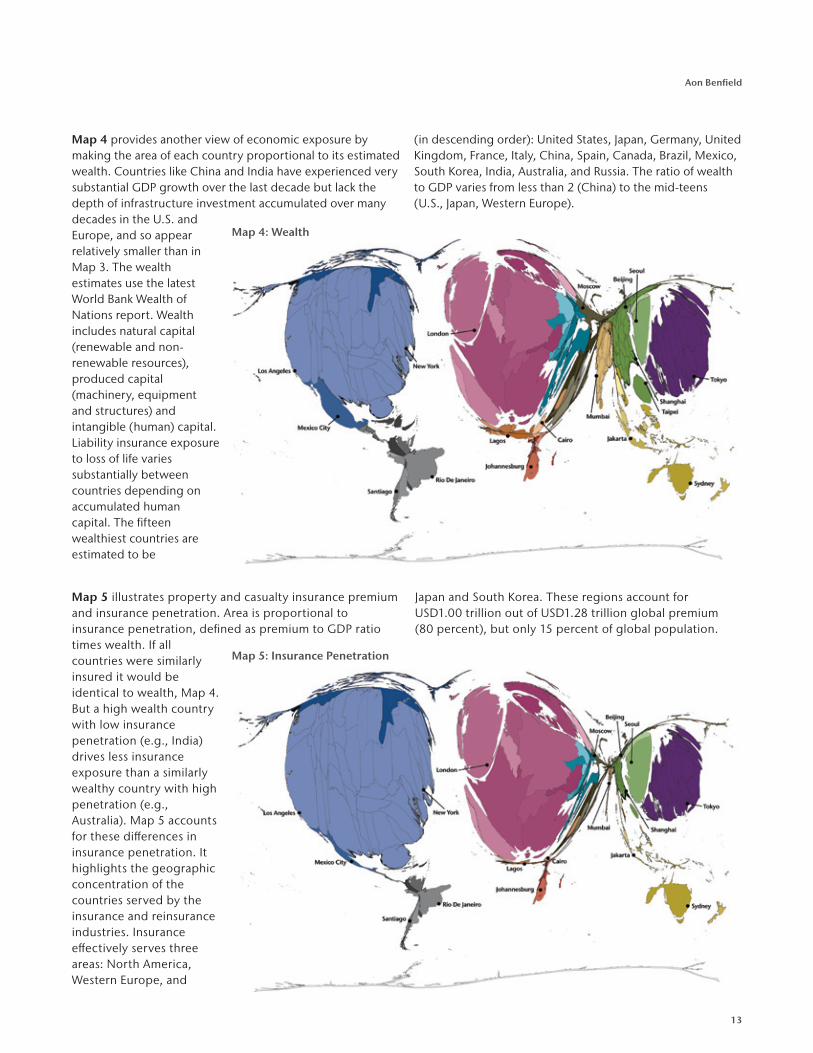
Map 4 provides another view of economic exposure by making the area of each country proportional to its estimated wealth. Countries like China and India have experienced very substantial GDP growth over the last decade but lack the depth of infrastructure investment accumulated over many decades in the U.S. and Europe, and so appear relatively smaller than in Map 3. The wealth estimates use the latest World Bank Wealth of Nations report. Wealth includes natural capital (renewable and non-renewable resources), produced capital (machinery, equipment and structures) and intangible (human) capital. Liability insurance exposure to loss of life varies substantially between countries depending on accumulated human capital. The fifteen wealthiest countries are estimated to be
(in descending order): United States, Japan, Germany, United Kingdom, France, Italy, China, Spain, Canada, Brazil, Mexico, South Korea, India, Australia, and Russia. The ratio of wealth to GDP varies from less than 2 (China) to the mid-teens (U.S., Japan, Western Europe).
Map 4: Wealth
Map 5 illustrates property and casualty insurance premium and insurance penetration. Area is proportional to insurance penetration, defined as premium to GDP ratio times wealth. If all countries were similarly insured it would be identical to wealth, Map 4. But a high wealth country with low insurance penetration (e.g., India) drives less insurance exposure than a similarly wealthy country with high penetration (e.g., Australia). Map 5 accounts for these differences in insurance penetration. It highlights the geographic concentration of the countries served by the insurance and reinsurance industries. Insurance effectively serves three areas: North America, Western Europe, and
Japan and South Korea. These regions account for USD1.00 trillion out of USD1.28 trillion global premium (80 percent), but only 15 percent of global population.
Map 5: Insurance Penetration
14
Insurance Risk Study
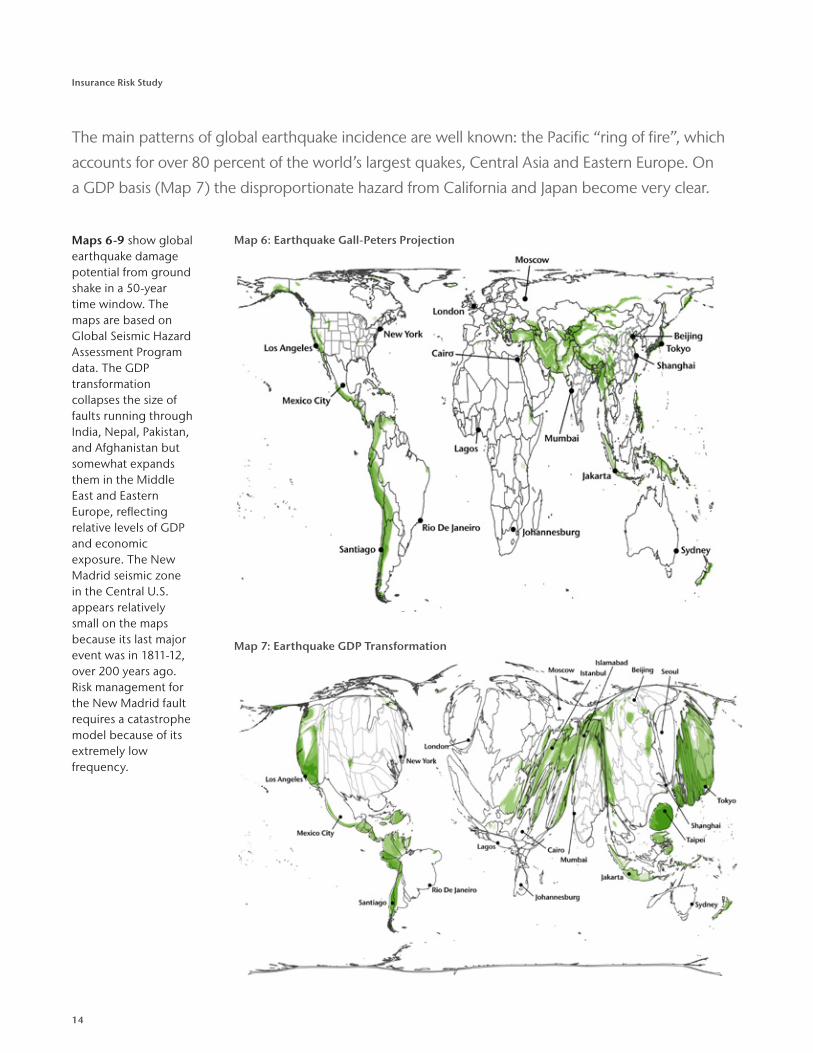
The main patterns of global earthquake incidence are well known: the Pacific “ring of fire”, which
accounts for over 80 percent of the world’s largest quakes, Central Asia and Eastern Europe. On
a GDP basis (Map 7) the disproportionate hazard from California and Japan become very clear.
Maps 6-9 show global earthquake damage potential from ground shake in a 50-year time window. The maps are based on Global Seismic Hazard Assessment Program data. The GDP transformation collapses the size of faults running through India, Nepal, Pakistan, and Afghanistan but somewhat expands them in the Middle East and Eastern Europe, reflecting relative levels of GDP and economic exposure. The New Madrid seismic zone in the Central U.S. appears relatively small on the maps because its last major event was in 1811-12, over 200 years ago. Risk management for the New Madrid fault requires a catastrophe model because of its extremely low frequency.
Map 6: Earthquake Gall-Peters Projection
Map 7: Earthquake GDP Transformation
15
Aon Benfield
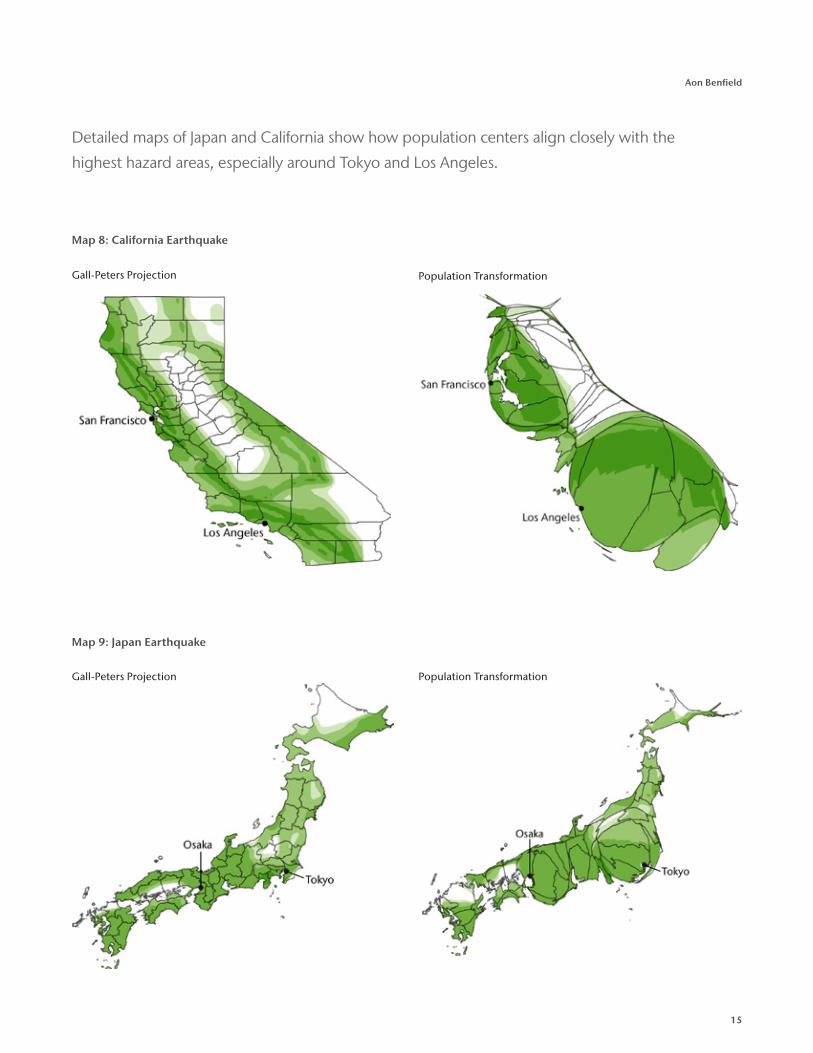
Map 9: Japan Earthquake
Gall-Peters Projection
Population TransformationGall-Peters Projection
Population Transformation
Detailed maps of Japan and California show how population centers align closely with the
highest hazard areas, especially around Tokyo and Los Angeles.
Map 8: California Earthquake
16
Insurance Risk Study
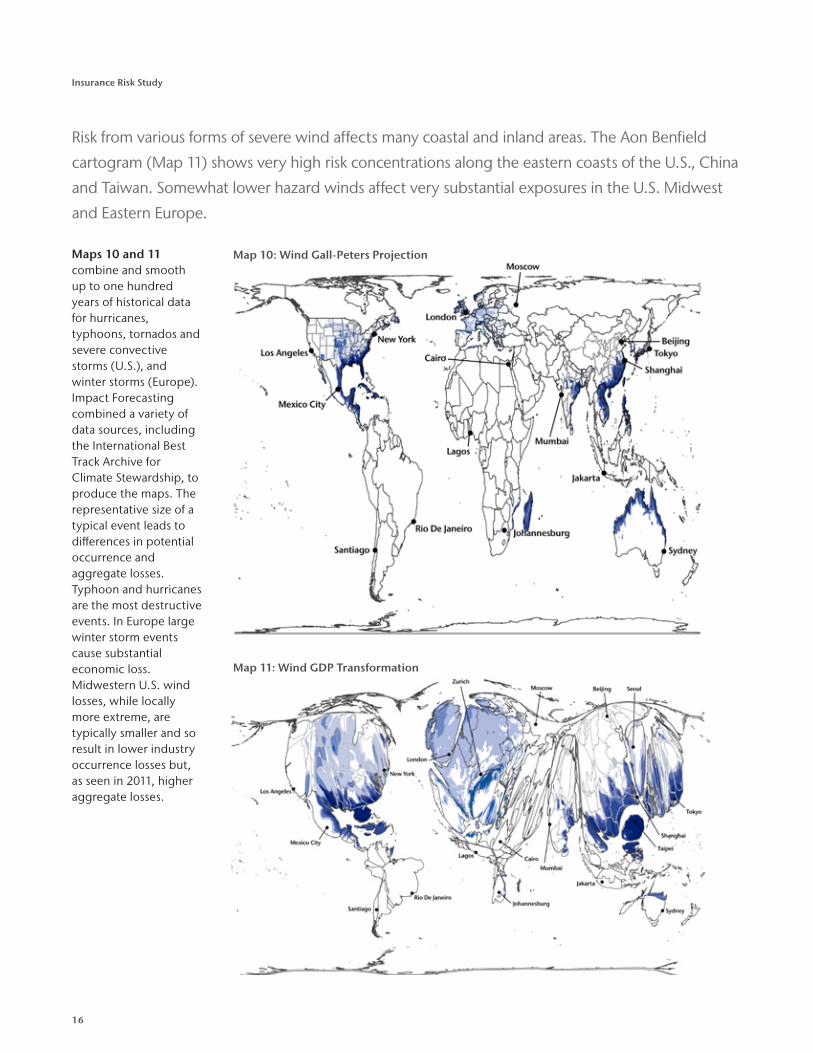
Risk from various forms of severe wind affects many coastal and inland areas. The Aon Benfield
cartogram (Map 11) shows very high risk concentrations along the eastern coasts of the U.S., China
and Taiwan. Somewhat lower hazard winds affect very substantial exposures in the U.S. Midwest
and Eastern Europe.
Maps 10 and 11 combine and smooth up to one hundred years of historical data for hurricanes, typhoons, tornados and severe convective storms (U.S.), and winter storms (Europe). Impact Forecasting combined a variety of data sources, including the International Best Track Archive for Climate Stewardship, to produce the maps. The representative size of a typical event leads to differences in potential occurrence and aggregate losses. Typhoon and hurricanes are the most destructive events. In Europe large winter storm events cause substantial economic loss. Midwestern U.S. wind losses, while locally more extreme, are typically smaller and so result in lower industry occurrence losses but, as seen in 2011, higher aggregate losses.
Map 10: Wind Gall-Peters Projection
Map 11: Wind GDP Transformation
17
Aon Benfield
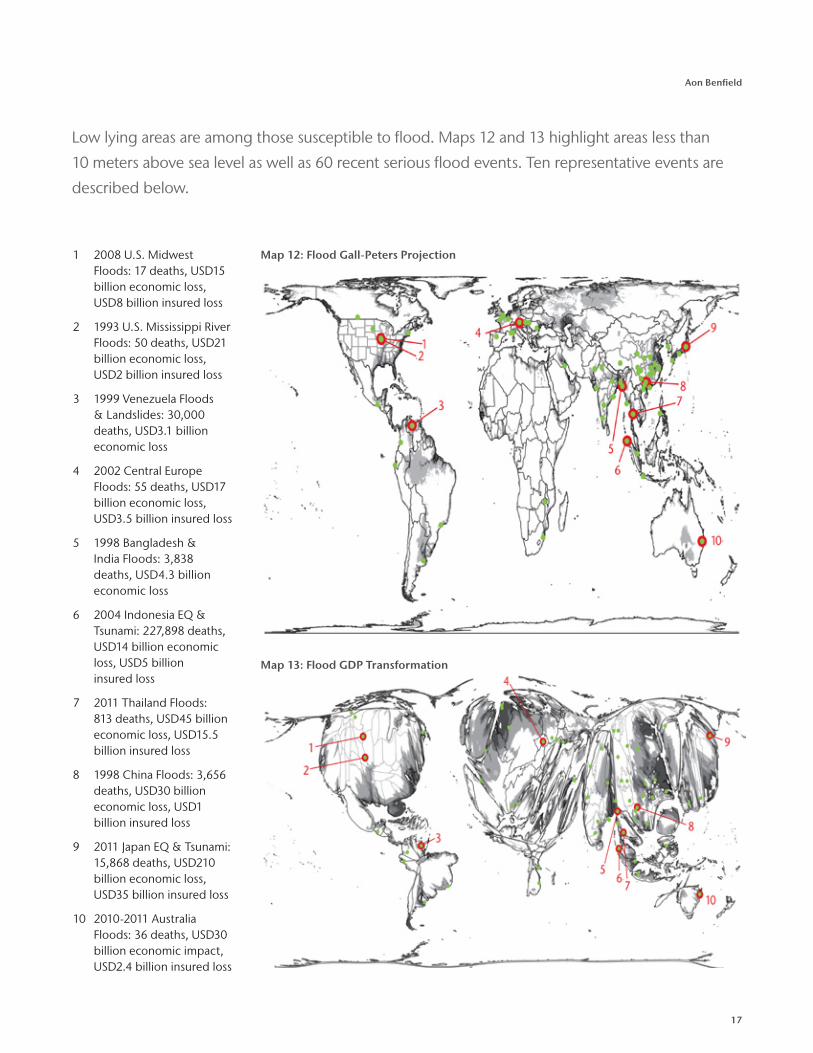
Low lying areas are among those susceptible to flood. Maps 12 and 13 highlight areas less than
10 meters above sea level as well as 60 recent serious flood events. Ten representative events are
described below.
1 2008 U.S. Midwest Floods: 17 deaths, USD15 billion economic loss, USD8 billion insured loss
2 1993 U.S. Mississippi River Floods: 50 deaths, USD21 billion economic loss, USD2 billion insured loss
3 1999 Venezuela Floods & Landslides: 30,000 deaths, USD3.1 billion economic loss
4 2002 Central Europe Floods: 55 deaths, USD17 billion economic loss, USD3.5 billion insured loss
5 1998 Bangladesh & India Floods: 3,838 deaths, USD4.3 billion economic loss
6 2004 Indonesia EQ & Tsunami: 227,898 deaths, USD14 billion economic loss, USD5 billion insured loss
7 2011 Thailand Floods: 813 deaths, USD45 billion economic loss, USD15.5 billion insured loss
8 1998 China Floods: 3,656 deaths, USD30 billion economic loss, USD1 billion insured loss
9 2011 Japan EQ & Tsunami: 15,868 deaths, USD210 billion economic loss, USD35 billion insured loss
10 2010-2011 Australia Floods: 36 deaths, USD30 billion economic impact, USD2.4 billion insured loss
Map 12: Flood Gall-Peters Projection
Map 13: Flood GDP Transformation
18
Insurance Risk Study
Global Wind and Earthquake Risk
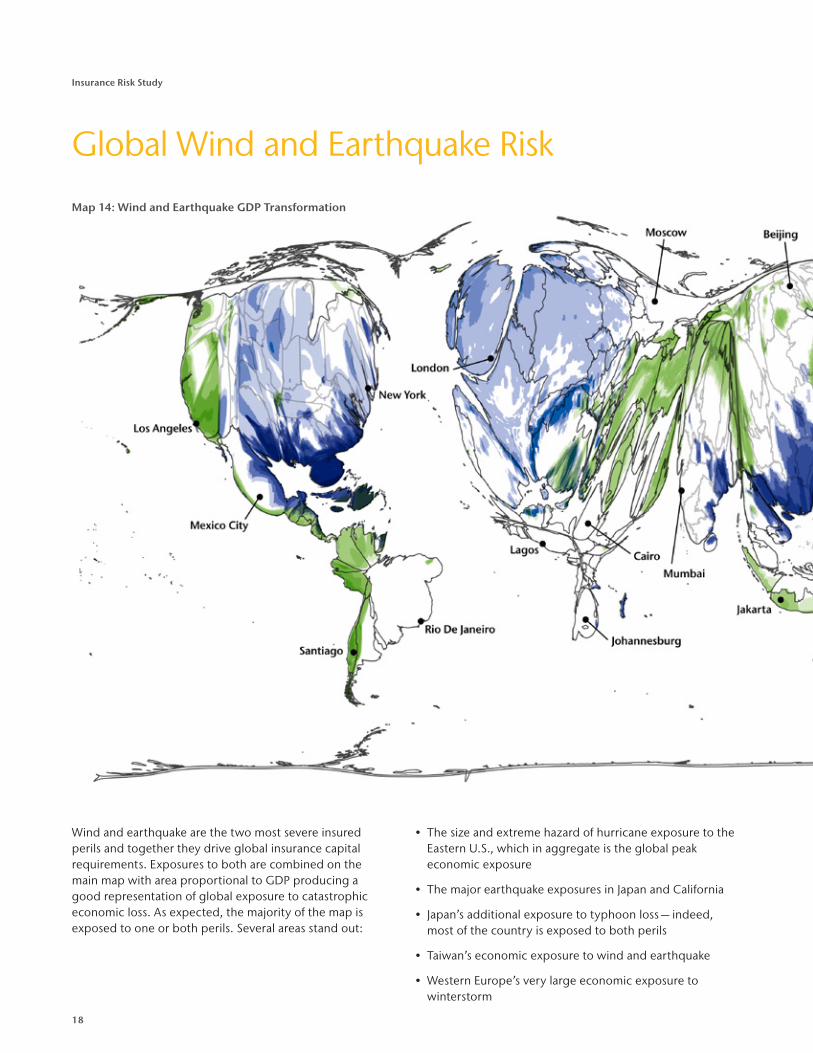
Map 14: Wind and Earthquake GDP Transformation
Wind and earthquake are the two most severe insured perils and together they drive global insurance capital requirements. Exposures to both are combined on the main map with area proportional to GDP producing a good representation of global exposure to catastrophic economic loss. As expected, the majority of the map is exposed to one or both perils. Several areas stand out:
• The size and extreme hazard of hurricane exposure to the Eastern U.S., which in aggregate is the global peak economic exposure
• The major earthquake exposures in Japan and California
• Japan’s additional exposure to typhoon loss — indeed, most of the country is exposed to both perils
• Taiwan’s economic exposure to wind and earthquake
• Western Europe’s very large economic exposure to winterstorm
19
Aon Benfield
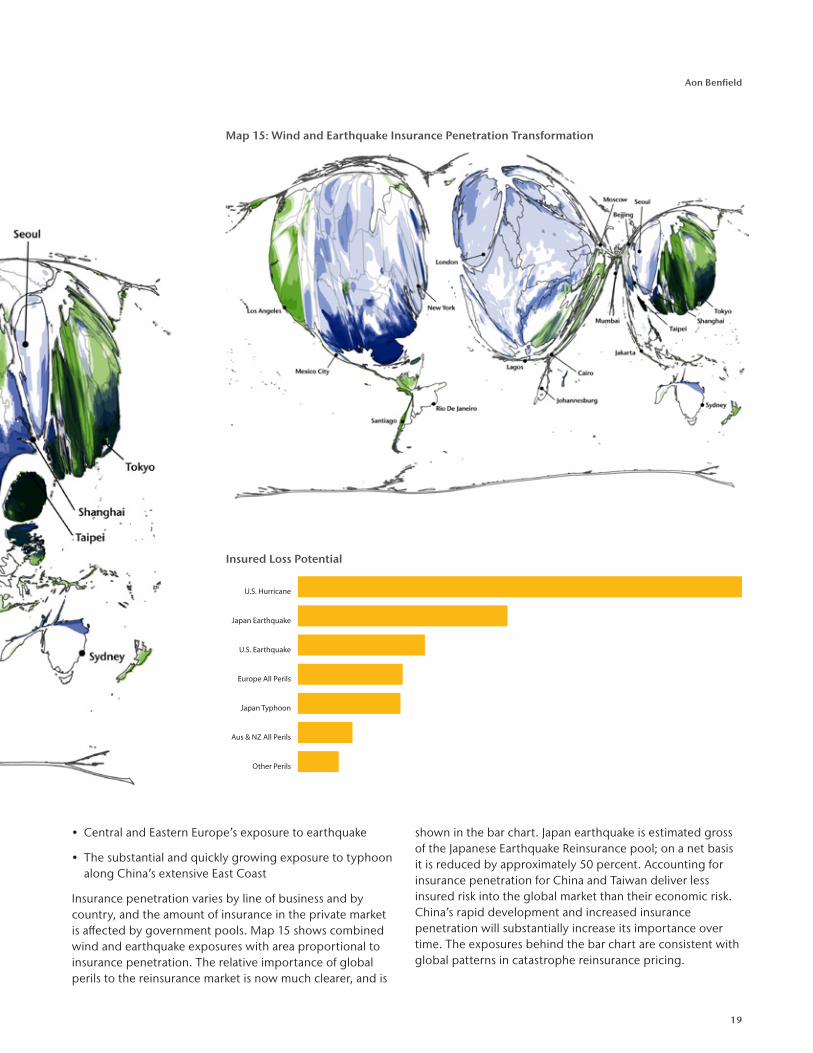
• Central and Eastern Europe’s exposure to earthquake
• The substantial and quickly growing exposure to typhoon along China’s extensive East Coast
Insurance penetration varies by line of business and by country, and the amount of insurance in the private market is affected by government pools. Map 15 shows combined wind and earthquake exposures with area proportional to insurance penetration. The relative importance of global perils to the reinsurance market is now much clearer, and is
shown in the bar chart. Japan earthquake is estimated gross of the Japanese Earthquake Reinsurance pool; on a net basis it is reduced by approximately 50 percent. Accounting for insurance penetration for China and Taiwan deliver less insured risk into the global market than their economic risk. China’s rapid development and increased insurance penetration will substantially increase its importance over time. The exposures behind the bar chart are consistent with global patterns in catastrophe reinsurance pricing.
Other Perils
Aus & NZ All Perils
Japan Typhoon
Europe All Perils
U.S. Earthquake
Japan Earthquake
U.S. Hurricane
Insured Loss Potential
Map 15: Wind and Earthquake Insurance Penetration Transformation
20
Insurance Risk Study
Robust Risk Management
Several catastrophic events during 2011 caused surprisingly large losses to the insurance industry, including the Tōhoku earthquake, Thailand floods and killer tornados in the U.S. These events underscore the importance of robust risk management to supplement sophisticated simulation modeling. Intelligent visualization of exposure, leveraging lessons from historical events and deterministic scenarios are all important parts of comprehensive and robust risk management.
The Aon Benfield cartograms shown on the previous pages are an excellent way to understand concentrations in an insurance portfolio. Maps 8 and 9 show how, combined with risk hazard assessments, cartograms deliver greater insight into risk drivers than traditional maps which only display geographical area. Maps 12 and 13 show what can be learned from historical flood events. They help identify at-risk areas that should be prioritized for further risk management via value and insured limit concentration monitoring and reporting.
Three ingredients are needed in order to use exposure information to derive robust “what-if” analyses for risk management.
• How frequent are representative events? The maps and cartograms, and the data underlying them, provide a rich source of information on absolute and relative frequency for wind and earthquake. They can be used to prioritize additional risk management efforts globally.
• How large are representative events? For a hurricane or typhoon, what is the radius of damaging wind speeds? For a tornado, what is the path length and width? For flood, understanding topography (Map 13), bathymetry and river valley geography will inform potential event sizes.
• Within each event, what range of damage can be expected? Newsreels show sensational pictures of very local total devastation caused by catastrophic events, but they rarely zoom-out to show the bigger picture. Within a band of hurricane or typhoon winds, what is a typical damage ratio? What about within a tornado track or the path of a broad winter storm?
A good example where we have answers to these three questions and can effectively supplement catastrophe models is for U.S. tornadoes. Aon Benfield Analytics has used this approach to produce Tornado Viewing Guides for clients. They compute what-if losses from three major historical tornadoes — only allowing them to touch-down anywhere east of the Rockies. The potential frequency of extreme tornadoes
can be estimated from the historical record. It shows about one F4 or F5 tornado per 500,000 square kilometers per year. The average frequency can be further refined by state. Maps 10 and 11 illustrate approximate frequency for the Midwest.
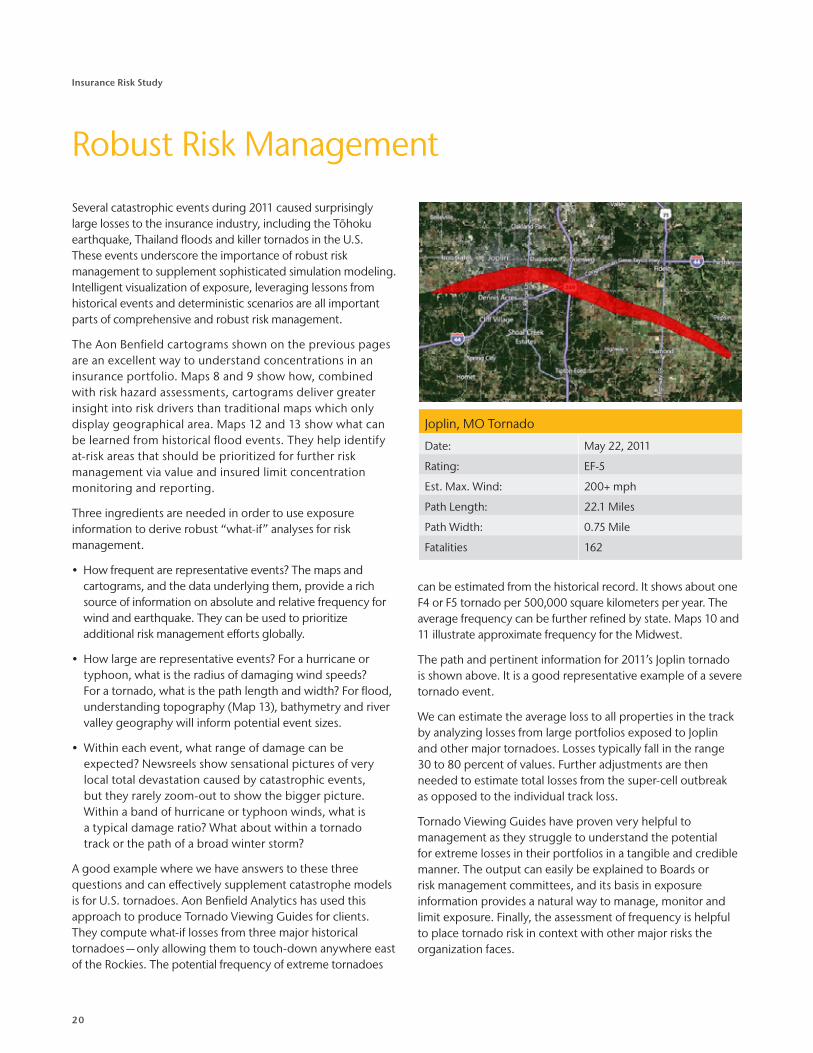
The path and pertinent information for 2011’s Joplin tornado is shown above. It is a good representative example of a severe tornado event.
We can estimate the average loss to all properties in the track by analyzing losses from large portfolios exposed to Joplin and other major tornadoes. Losses typically fall in the range 30 to 80 percent of values. Further adjustments are then needed to estimate total losses from the super-cell outbreak as opposed to the individual track loss.
Tornado Viewing Guides have proven very helpful to management as they struggle to understand the potential for extreme losses in their portfolios in a tangible and credible manner. The output can easily be explained to Boards or risk management committees, and its basis in exposure information provides a natural way to manage, monitor and limit exposure. Finally, the assessment of frequency is helpful to place tornado risk in context with other major risks the organization faces.
Joplin, MO Tornado
Date: May 22, 2011
Rating: EF-5
Est. Max. Wind: 200+ mph
Path Length: 22.1 Miles
Path Width: 0.75 Mile
Fatalities 162
21
Aon Benfield
Global Crop Insurance Penetration
Agriculture Production (Million Metric Tons)
Crop Insurance Penetration
0 to 50
50 to 100
100 to 200
200 to 400
over 400
High
Medium
Low
Agriculture Production (Million Metric Tons)
Crop Insurance Penetration
0 to 50
50 to 100
100 to 200
200 to 400
over 400
High
Medium
Low
In last year’s Insurance Risk Study, we discussed Aon Benfield’s Crop Reinsurance Solutions (ACReS) models for the U.S. and China. Both markets have seen substantial increases in crop insurance premium over the last 10 years and China, in particular, has potential for continued significant growth. In 2011 alone, China’s crop insurance premium increased by 28 percent.
Crop insurance continues to expand globally and is currently available in some form in 105 countries around the world. Significant expansion efforts are being made in China, India, Pakistan, Brazil, Ukraine, Columbia, Vietnam, South Korea, Malaysia, and Thailand. International aid projects encouraging the development of agricultural risk management programs are also in progress in Sub-Saharan Africa, Ukraine, India, and Bangladesh.
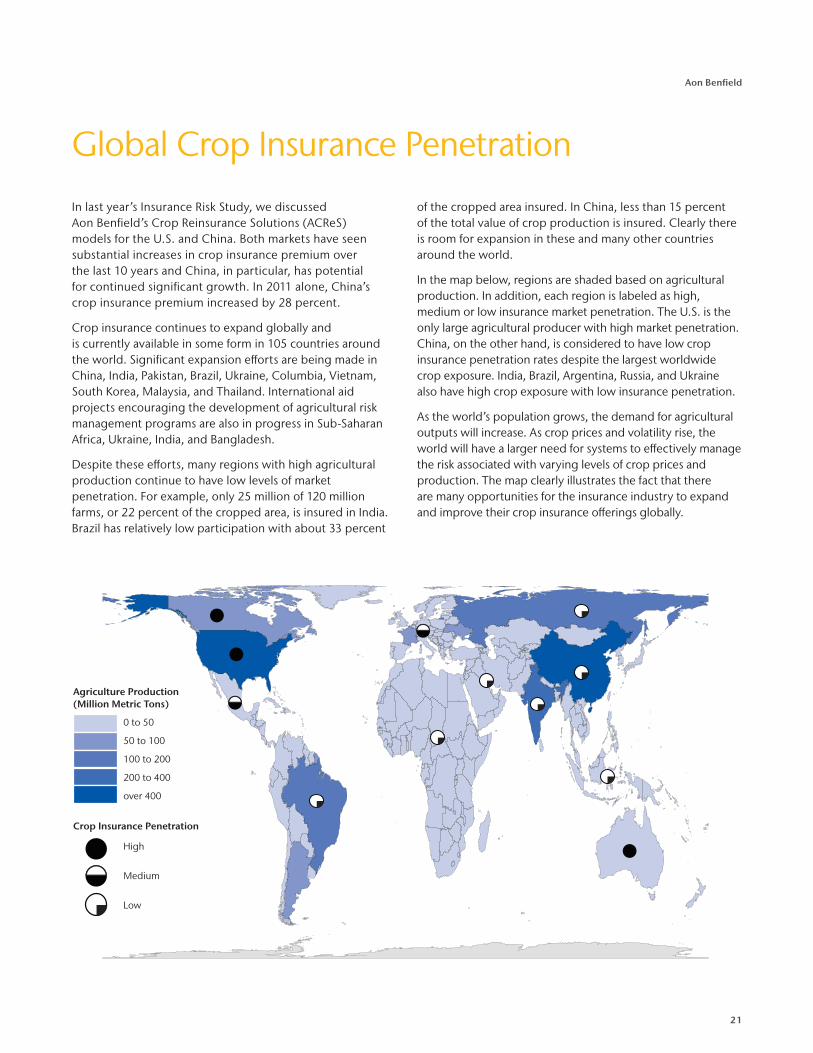
Despite these efforts, many regions with high agricultural production continue to have low levels of market penetration. For example, only 25 million of 120 million farms, or 22 percent of the cropped area, is insured in India. Brazil has relatively low participation with about 33 percent
of the cropped area insured. In China, less than 15 percent of the total value of crop production is insured. Clearly there is room for expansion in these and many other countries around the world.
In the map below, regions are shaded based on agricultural production. In addition, each region is labeled as high, medium or low insurance market penetration. The U.S. is the only large agricultural producer with high market penetration. China, on the other hand, is considered to have low crop insurance penetration rates despite the largest worldwide crop exposure. India, Brazil, Argentina, Russia, and Ukraine also have high crop exposure with low insurance penetration.
As the world’s population grows, the demand for agricultural outputs will increase. As crop prices and volatility rise, the world will have a larger need for systems to effectively manage the risk associated with varying levels of crop prices and production. The map clearly illustrates the fact that there are many opportunities for the insurance industry to expand and improve their crop insurance offerings globally.
22
Insurance Risk Study
Correlation Considerations
U.S.
Hom
eow
ners
Pers
onal
Aut
o Li
abili
ty
Com
mer
cial
M
ulti
Per
il
Com
mer
cial
Aut
o
Wor
kers
’ C
omp
ensa
tion
Oth
er L
iab
ility
Occ
Med
ical
Mal
pra
ctic
e C
M
Oth
er L
iab
ility
CM
Prod
ucts
Lia
bili
ty
Occ
Homeowners 8% 24% 9% -2% 0% 2% -2% 13%
Personal Auto Liability 8% 30% 30% 33% 32% 51% 43% 45%
Commercial Multi Peril 24% 30% 53% 43% 49% 57% 43% 40%
Commercial Auto 9% 30% 53% 60% 67% 71% 44% 71%
Workers’ Compensation -2% 33% 43% 60% 61% 68% 62% 63%
Other Liability Occ 0% 32% 49% 67% 61% 77% 58% 66%
Medical Malpractice CM 2% 51% 57% 71% 68% 77% 70% 72%
Other Liability CM -2% 43% 43% 44% 62% 58% 70% 33%
Products Liability Occ 13% 45% 40% 71% 63% 66% 72% 33%
Correlation between lines of business is central to a realistic assessment of aggregate portfolio risk, and in fact becomes increasingly significant for larger companies where there is little idiosyncratic risk to mask correlation. Most modeling exercises are carried out at the product or business unit level and then aggregated to the company level. In many applications, the results are more sensitive to the correlation and dependency assumptions made when aggregating results than to all the detailed assumptions made at the business unit level.
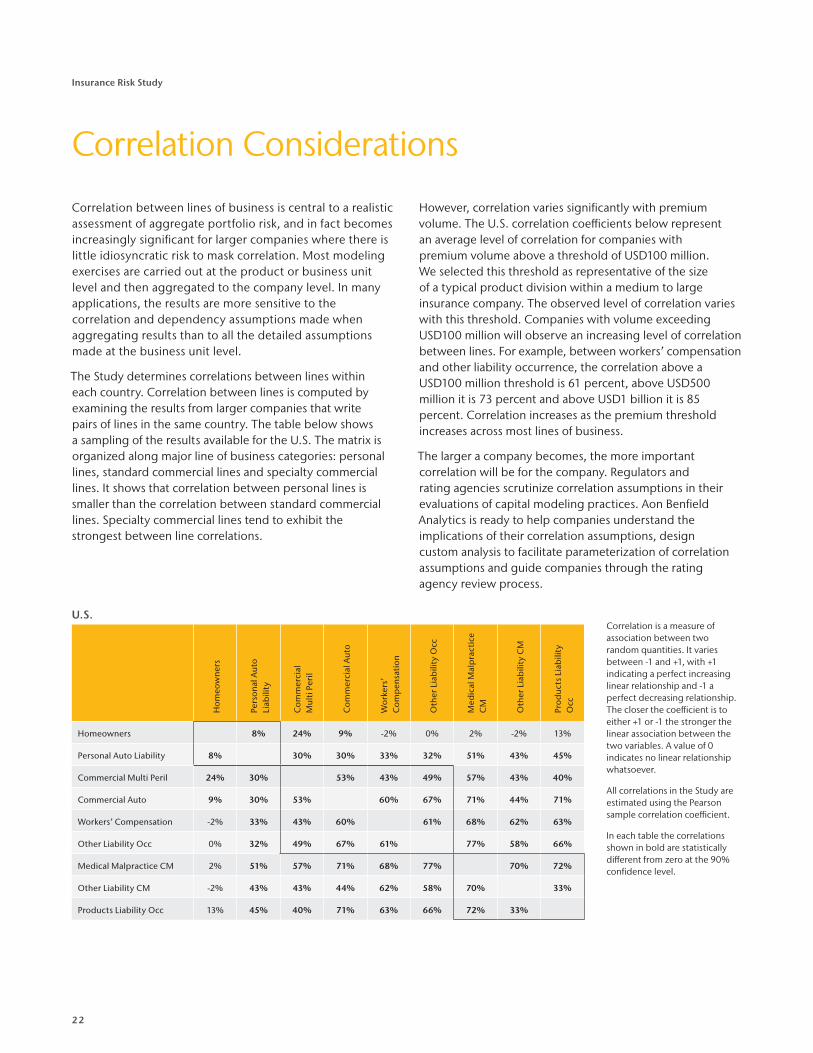
The Study determines correlations between lines within each country. Correlation between lines is computed by examining the results from larger companies that write pairs of lines in the same country. The table below shows a sampling of the results available for the U.S. The matrix is organized along major line of business categories: personal lines, standard commercial lines and specialty commercial lines. It shows that correlation between personal lines is smaller than the correlation between standard commercial lines. Specialty commercial lines tend to exhibit the strongest between line correlations.
However, correlation varies significantly with premium volume. The U.S. correlation coefficients below represent an average level of correlation for companies with premium volume above a threshold of USD100 million. We selected this threshold as representative of the size of a typical product division within a medium to large insurance company. The observed level of correlation varies with this threshold. Companies with volume exceeding USD100 million will observe an increasing level of correlation between lines. For example, between workers’ compensation and other liability occurrence, the correlation above a USD100 million threshold is 61 percent, above USD500 million it is 73 percent and above USD1 billion it is 85 percent. Correlation increases as the premium threshold increases across most lines of business.
The larger a company becomes, the more important correlation will be for the company. Regulators and rating agencies scrutinize correlation assumptions in their evaluations of capital modeling practices. Aon Benfield Analytics is ready to help companies understand the implications of their correlation assumptions, design custom analysis to facilitate parameterization of correlation assumptions and guide companies through the rating agency review process.
Correlation is a measure of association between two random quantities. It varies between -1 and +1, with +1 indicating a perfect increasing linear relationship and -1 a perfect decreasing relationship. The closer the coefficient is to either +1 or -1 the stronger the linear association between the two variables. A value of 0 indicates no linear relationship whatsoever.
All correlations in the Study are estimated using the Pearson sample correlation coefficient.
In each table the correlations shown in bold are statistically different from zero at the 90% confidence level.
23
Aon Benfield
Global Correlation between Lines
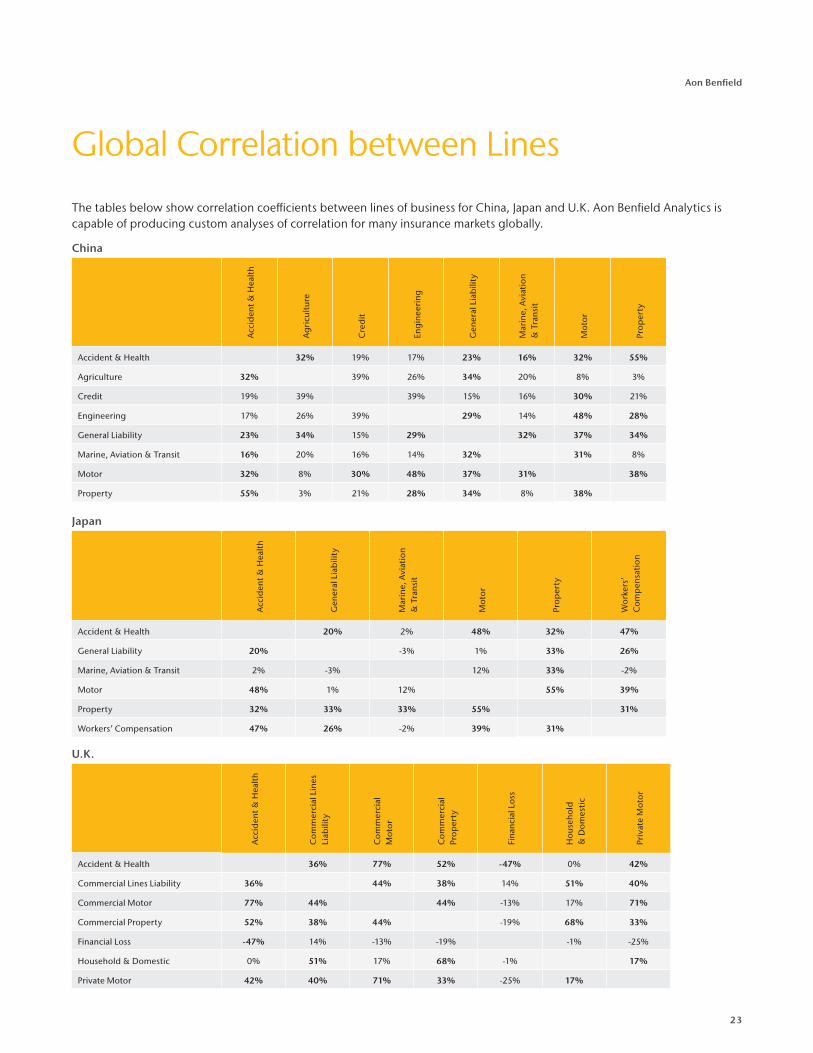
The tables below show correlation coefficients between lines of business for China, Japan and U.K. Aon Benfield Analytics is capable of producing custom analyses of correlation for many insurance markets globally.
China A
ccid
ent &
Hea
lth
Ag
ricu
ltur
e
Cre
dit
Eng
inee
ring
Gen
eral
Lia
bili
ty
Mar
ine,
Avi
atio
n
& T
rans
it
Mot
or
Prop
erty
Accident & Health 32% 19% 17% 23% 16% 32% 55%
Agriculture 32% 39% 26% 34% 20% 8% 3%
Credit 19% 39% 39% 15% 16% 30% 21%
Engineering 17% 26% 39% 29% 14% 48% 28%
General Liability 23% 34% 15% 29% 32% 37% 34%
Marine, Aviation & Transit 16% 20% 16% 14% 32% 31% 8%
Motor 32% 8% 30% 48% 37% 31% 38%
Property 55% 3% 21% 28% 34% 8% 38%
U.K.
Acc
iden
t & H
ealt
h
Com
mer
cial
Lin
es
Liab
ility
Com
mer
cial
M
otor
Com
mer
cial
Pr
oper
ty
Fina
ncia
l Los
s
Hou
seho
ld
& D
omes
tic
Priv
ate
Mot
or
Accident & Health 36% 77% 52% -47% 0% 42%
Commercial Lines Liability 36% 44% 38% 14% 51% 40%
Commercial Motor 77% 44% 44% -13% 17% 71%
Commercial Property 52% 38% 44% -19% 68% 33%
Financial Loss -47% 14% -13% -19% -1% -25%
Household & Domestic 0% 51% 17% 68% -1% 17%
Private Motor 42% 40% 71% 33% -25% 17%
Japan
Acc
iden
t & H
ealt
h
Gen
eral
Lia
bili
ty
Mar
ine,
Avi
atio
n
& T
rans
it
Mot
or
Prop
erty
Wor
kers
’ C
omp
ensa
tion
Accident & Health 20% 2% 48% 32% 47%
General Liability 20% -3% 1% 33% 26%
Marine, Aviation & Transit 2% -3% 12% 33% -2%
Motor 48% 1% 12% 55% 39%
Property 32% 33% 33% 55% 31%
Workers’ Compensation 47% 26% -2% 39% 31%
24
Insurance Risk Study
Macroeconomic Correlation
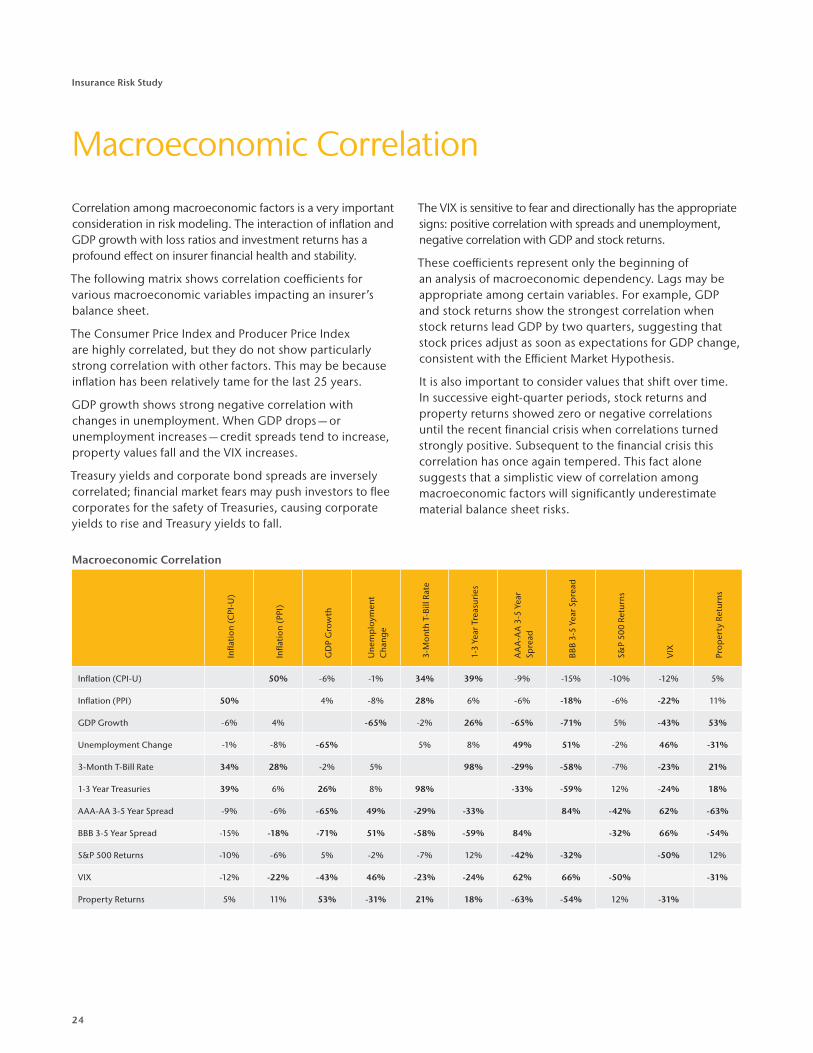
Correlation among macroeconomic factors is a very important consideration in risk modeling. The interaction of inflation and GDP growth with loss ratios and investment returns has a profound effect on insurer financial health and stability.
The following matrix shows correlation coefficients for various macroeconomic variables impacting an insurer’s balance sheet.
The Consumer Price Index and Producer Price Index are highly correlated, but they do not show particularly strong correlation with other factors. This may be because inflation has been relatively tame for the last 25 years.
GDP growth shows strong negative correlation with changes in unemployment. When GDP drops — or unemployment increases — credit spreads tend to increase, property values fall and the VIX increases.
Treasury yields and corporate bond spreads are inversely correlated; financial market fears may push investors to flee corporates for the safety of Treasuries, causing corporate yields to rise and Treasury yields to fall.
The VIX is sensitive to fear and directionally has the appropriate signs: positive correlation with spreads and unemployment, negative correlation with GDP and stock returns.
These coefficients represent only the beginning of an analysis of macroeconomic dependency. Lags may be appropriate among certain variables. For example, GDP and stock returns show the strongest correlation when stock returns lead GDP by two quarters, suggesting that stock prices adjust as soon as expectations for GDP change, consistent with the Efficient Market Hypothesis.
It is also important to consider values that shift over time. In successive eight-quarter periods, stock returns and property returns showed zero or negative correlations until the recent financial crisis when correlations turned strongly positive. Subsequent to the financial crisis this correlation has once again tempered. This fact alone suggests that a simplistic view of correlation among macroeconomic factors will significantly underestimate material balance sheet risks.
Macroeconomic Correlation
Infla
tion
(CPI
-U)
Infla
tion
(PP
I)
GD
P G
row
th
Une
mp
loym
ent
Cha
nge
3-M
onth
T-B
ill R
ate
1-3
Year
Tre
asur
ies
AA
A-A
A 3
-5 Y
ear
Spre
ad
BBB
3-5
Year
Sp
read
S&P
500
Retu
rns
VIX
Prop
erty
Ret
urns
Inflation (CPI-U) 50% -6% -1% 34% 39% -9% -15% -10% -12% 5%
Inflation (PPI) 50% 4% -8% 28% 6% -6% -18% -6% -22% 11%
GDP Growth -6% 4% -65% -2% 26% -65% -71% 5% -43% 53%
Unemployment Change -1% -8% -65% 5% 8% 49% 51% -2% 46% -31%
3-Month T-Bill Rate 34% 28% -2% 5% 98% -29% -58% -7% -23% 21%
1-3 Year Treasuries 39% 6% 26% 8% 98% -33% -59% 12% -24% 18%
AAA-AA 3-5 Year Spread -9% -6% -65% 49% -29% -33% 84% -42% 62% -63%
BBB 3-5 Year Spread -15% -18% -71% 51% -58% -59% 84% -32% 66% -54%
S&P 500 Returns -10% -6% 5% -2% -7% 12% -42% -32% -50% 12%
VIX -12% -22% -43% 46% -23% -24% 62% 66% -50% -31%
Property Returns 5% 11% 53% -31% 21% 18% -63% -54% 12% -31%
25
Aon Benfield
Global Market Review
Top 50 Markets by Gross Written Premium
CountryP&C GWP
(USD Billions)GDP
(USD Billions)Population (Millions)
Premium / GDP Ratio
GDP per Capita
U.S. 480.7 15,094.0 313.8 3.2% 48,094 Japan 81.4 5,869.5 127.4 1.4% 46,083 Germany 69.8 3,577.0 81.3 2.0% 43,995 France 66.7 2,776.3 65.6 2.4% 42,302 U.K. 62.1 2,417.6 63.0 2.6% 38,345 China 57.5 7,298.1 1,343.2 0.8% 5,433 S. Korea 53.9 1,116.2 48.9 4.8% 22,846 Italy 40.0 2,198.7 61.3 1.8% 35,891 Canada 32.2 1,736.9 34.3 1.9% 50,637 Australia 31.2 1,488.2 22.0 2.1% 67,599 Spain 30.4 1,493.5 47.0 2.0% 31,748 Brazil 25.4 2,492.9 205.7 1.0% 12,118 Netherlands 14.4 840.4 16.7 1.7% 50,233 Russia 13.6 1,850.4 138.1 0.7% 13,401 Switzerland 12.5 636.1 7.7 2.0% 83,084 Norway 10.4 483.7 4.7 2.2% 102,745 Belgium 10.3 513.4 10.4 2.0% 49,184 Austria 9.6 419.2 8.2 2.3% 51,004 Mexico 9.1 1,154.8 115.0 0.8% 10,044 Argentina 8.8 447.6 42.2 2.0% 10,610 Sweden 8.8 538.2 9.1 1.6% 59,122 Denmark 8.0 333.2 5.5 2.4% 60,114 Poland 7.7 513.8 38.4 1.5% 13,375 India 7.6 1,676.1 1,205.1 0.5% 1,391 Venezuela 7.3 315.8 28.0 2.3% 11,261 Turkey 6.9 778.1 79.7 0.9% 9,757 South Africa 6.8 408.1 48.8 1.7% 8,360 Iran 4.3 482.4 78.9 0.9% 6,117 Ireland 4.3 217.7 4.7 2.0% 46,097 Portugal 4.1 238.9 10.8 1.7% 22,157 Finland 4.1 266.6 5.3 1.5% 50,647 Czech Republic 4.0 215.3 10.2 1.9% 21,151 Malaysia 3.8 278.7 29.2 1.4% 9,550 Israel 3.8 242.9 7.6 1.6% 31,999 Colombia 3.7 328.4 45.2 1.1% 7,260 U.A.E. 3.6 360.1 5.3 1.0% 67,767 Chile 3.5 248.4 17.1 1.4% 14,555 Thailand 3.4 345.6 67.1 1.0% 5,152 Greece 3.3 303.1 10.8 1.1% 28,145 Taiwan 3.0 466.8 23.1 0.6% 20,197 New Zealand 2.9 161.9 4.3 1.8% 37,397 Luxembourg 2.8 58.4 0.5 4.8% 114,742 Indonesia 2.7 845.7 248.2 0.3% 3,407 Ukraine 2.7 165.0 44.9 1.6% 3,678 Hong Kong 2.1 243.3 7.2 0.9% 34,012 Singapore 2.1 259.8 5.4 0.8% 48,538 Romania 2.0 189.8 21.8 1.1% 8,686 Puerto Rico 1.8 96.3 4.0 1.9% 24,072 Saudi Arabia 1.8 577.6 26.5 0.3% 21,768 Hungary 1.7 140.3 10.0 1.2% 14,089 Grand Total 1,244.4 65,201.0 4,859.3 1.9% 13,418
U.S.
Middle East & Africa
Rest of Europe
Rest of Euro Area
U.K.
Germany
France
Rest of APAC
South Korea
Japan
China
Rest of Americas
CanadaBrazil
Brazil
U.S.
Middle East & AfricaRest of Europe
Rest of Euro Area
U.K.
Germany
France
Rest of APAC
South KoreaJapan
ChinaRest of Americas
Canada
U.S.
Middle East & Africa
Rest of EuropeRest of Euro Area
U.K.
Germany
France
Rest of APAC
South Korea
JapanChina
Rest of AmericasCanadaBrazil
Global Premium by Product Line
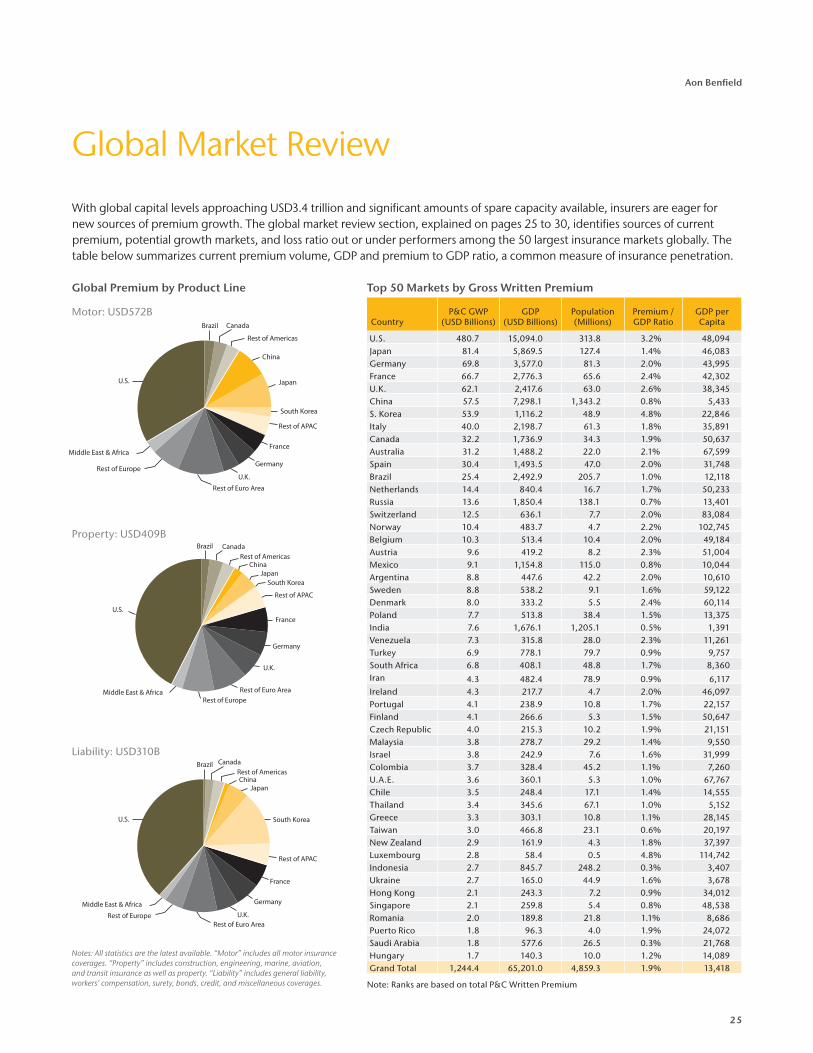
With global capital levels approaching USD3.4 trillion and significant amounts of spare capacity available, insurers are eager for new sources of premium growth. The global market review section, explained on pages 25 to 30, identifies sources of current premium, potential growth markets, and loss ratio out or under performers among the 50 largest insurance markets globally. The table below summarizes current premium volume, GDP and premium to GDP ratio, a common measure of insurance penetration.
Motor: USD572B
Property: USD409B
Liability: USD310B
Note: Ranks are based on total P&C Written Premium
Notes: All statistics are the latest available. “Motor” includes all motor insurance coverages. “Property” includes construction, engineering, marine, aviation, and transit insurance as well as property. “Liability” includes general liability, workers’ compensation, surety, bonds, credit, and miscellaneous coverages.
26
Insurance Risk Study
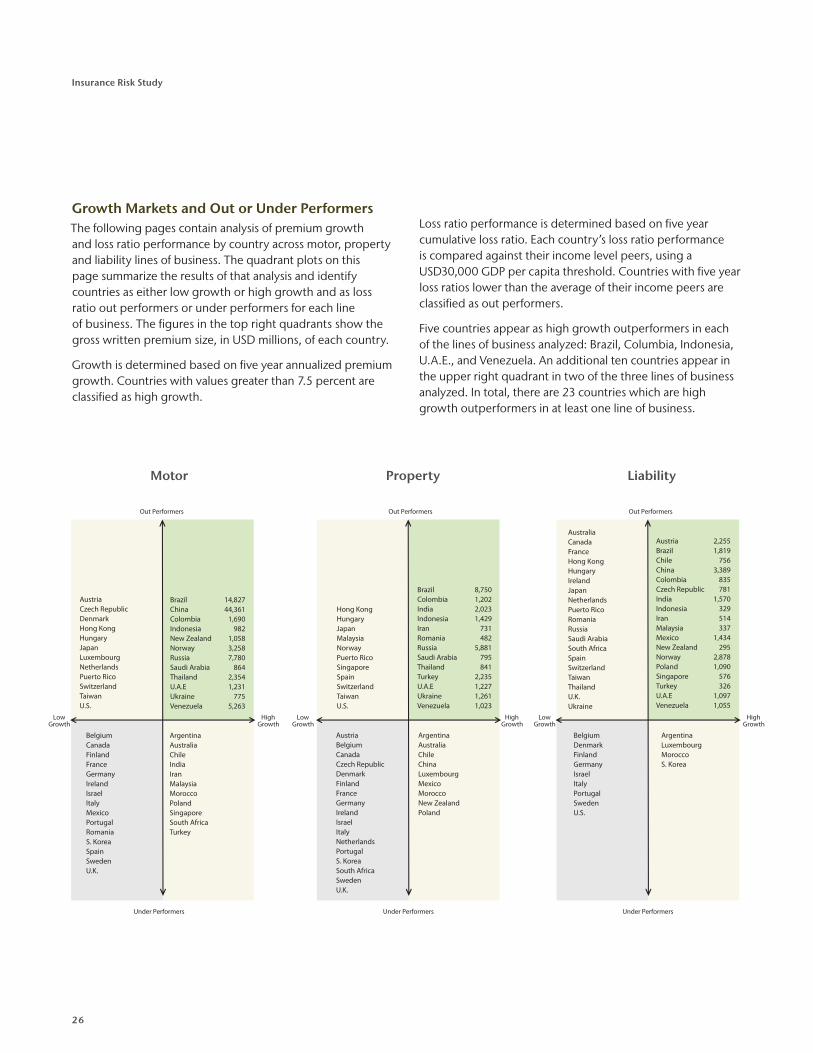
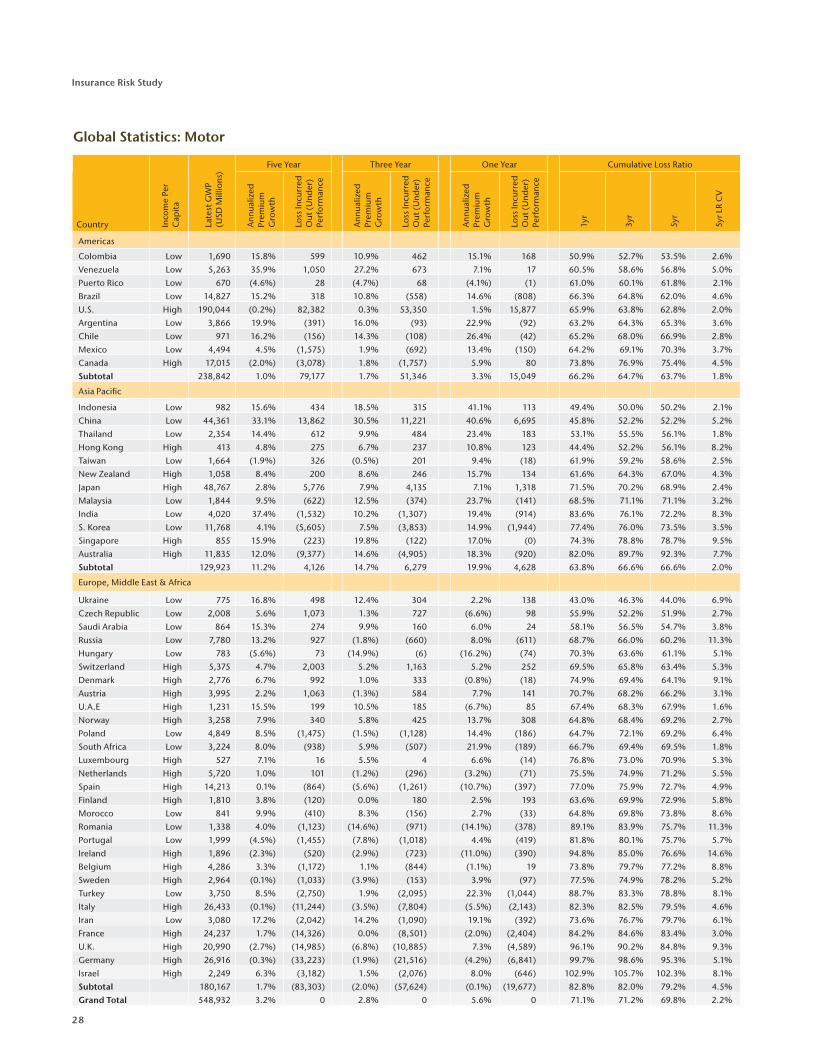
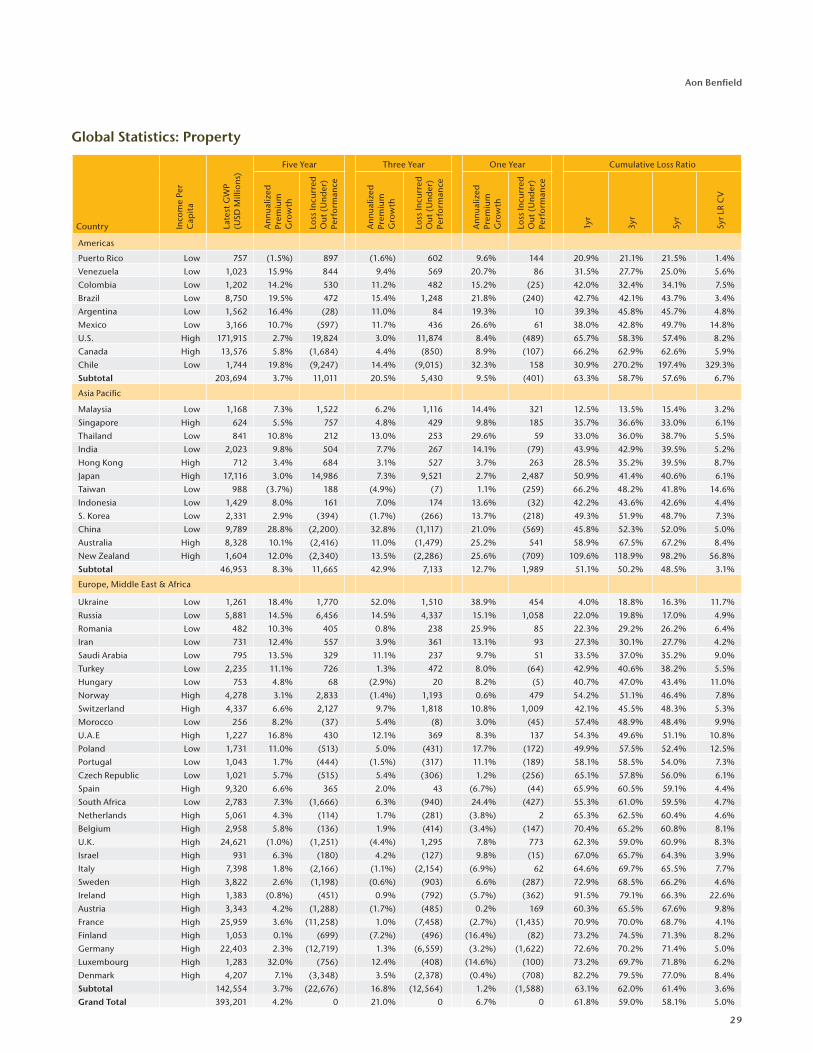
Growth Markets and Out or Under PerformersThe following pages contain analysis of premium growth and loss ratio performance by country across motor, property and liability lines of business. The quadrant plots on this page summarize the results of that analysis and identify countries as either low growth or high growth and as loss ratio out performers or under performers for each line of business. The figures in the top right quadrants show the gross written premium size, in USD millions, of each country.
Growth is determined based on five year annualized premium growth. Countries with values greater than 7.5 percent are classified as high growth.
Loss ratio performance is determined based on five year cumulative loss ratio. Each country’s loss ratio performance is compared against their income level peers, using a USD30,000 GDP per capita threshold. Countries with five year loss ratios lower than the average of their income peers are classified as out performers.
Five countries appear as high growth outperformers in each of the lines of business analyzed: Brazil, Columbia, Indonesia, U.A.E., and Venezuela. An additional ten countries appear in the upper right quadrant in two of the three lines of business analyzed. In total, there are 23 countries which are high growth outperformers in at least one line of business.
PropertyMotor Liability
LowGrowth
HighGrowth
Out Performers
Under Performers
Out Performers
Under Performers
Out Performers
Under Performers
Austria 2,255Brazil 1,819Chile 756China 3,389Colombia 835Czech Republic 781India 1,570Indonesia 329Iran 514Malaysia 337Mexico 1,434New Zealand 295Norway 2,878Poland 1,090Singapore 576Turkey 326U.A.E 1,097Venezuela 1,055
Brazil 8,750Colombia 1,202India 2,023Indonesia 1,429Iran 731Romania 482Russia 5,881Saudi Arabia 795Thailand 841Turkey 2,235U.A.E 1,227Ukraine 1,261Venezuela 1,023
Brazil 14,827China 44,361Colombia 1,690Indonesia 982New Zealand 1,058Norway 3,258Russia 7,780Saudi Arabia 864Thailand 2,354U.A.E 1,231Ukraine 775Venezuela 5,263
Hong KongHungaryJapanMalaysiaNorwayPuerto RicoSingaporeSpainSwitzerlandTaiwanU.S.
AustriaBelgiumCanadaCzech RepublicDenmarkFinlandFranceGermanyIrelandIsraelItalyNetherlandsPortugalS. KoreaSouth AfricaSwedenU.K.
ArgentinaAustraliaChileChinaLuxembourgMexicoMoroccoNew ZealandPoland
ArgentinaLuxembourgMoroccoS. Korea
AustraliaCanadaFranceHong KongHungaryIrelandJapanNetherlandsPuerto RicoRomaniaRussiaSaudi ArabiaSouth AfricaSpainSwitzerlandTaiwanThailandU.K.Ukraine
BelgiumDenmarkFinlandGermanyIsraelItalyPortugalSwedenU.S.
AustriaCzech RepublicDenmarkHong KongHungaryJapanLuxembourgNetherlandsPuerto RicoSwitzerlandTaiwanU.S.
BelgiumCanadaFinlandFranceGermanyIrelandIsraelItalyMexicoPortugalRomaniaS. KoreaSpainSwedenU.K.
ArgentinaAustraliaChileIndiaIranMalaysiaMoroccoPolandSingaporeSouth AfricaTurkey
LowGrowth
HighGrowth
LowGrowth
HighGrowth
27
Aon Benfield
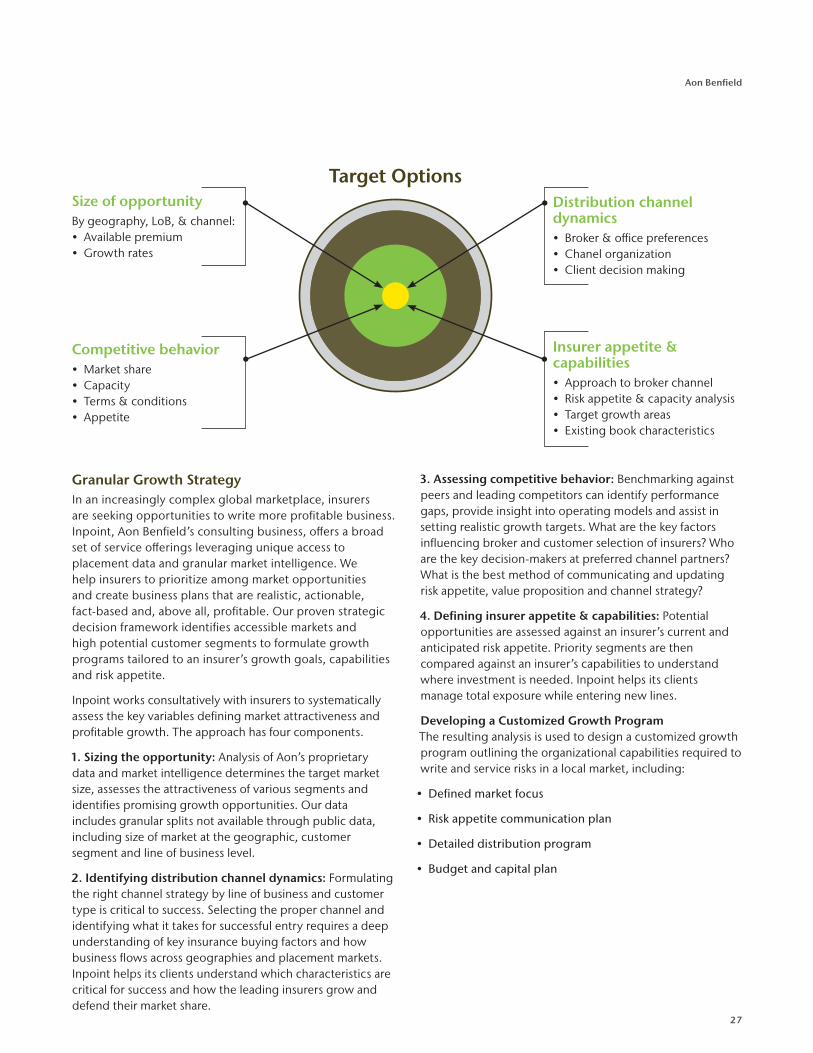
Granular Growth StrategyIn an increasingly complex global marketplace, insurers are seeking opportunities to write more profitable business. Inpoint, Aon Benfield’s consulting business, offers a broad set of service offerings leveraging unique access to placement data and granular market intelligence. We help insurers to prioritize among market opportunities and create business plans that are realistic, actionable, fact-based and, above all, profitable. Our proven strategic decision framework identifies accessible markets and high potential customer segments to formulate growth programs tailored to an insurer’s growth goals, capabilities and risk appetite.
Inpoint works consultatively with insurers to systematically assess the key variables defining market attractiveness and profitable growth. The approach has four components.
1. Sizing the opportunity: Analysis of Aon’s proprietary data and market intelligence determines the target market size, assesses the attractiveness of various segments and identifies promising growth opportunities. Our data includes granular splits not available through public data, including size of market at the geographic, customer segment and line of business level.
2. Identifying distribution channel dynamics: Formulating the right channel strategy by line of business and customer type is critical to success. Selecting the proper channel and identifying what it takes for successful entry requires a deep understanding of key insurance buying factors and how business flows across geographies and placement markets. Inpoint helps its clients understand which characteristics are critical for success and how the leading insurers grow and defend their market share.
3. Assessing competitive behavior: Benchmarking against peers and leading competitors can identify performance gaps, provide insight into operating models and assist in setting realistic growth targets. What are the key factors influencing broker and customer selection of insurers? Who are the key decision-makers at preferred channel partners? What is the best method of communicating and updating risk appetite, value proposition and channel strategy?
4. Defining insurer appetite & capabilities: Potential opportunities are assessed against an insurer’s current and anticipated risk appetite. Priority segments are then compared against an insurer’s capabilities to understand where investment is needed. Inpoint helps its clients manage total exposure while entering new lines.
Developing a Customized Growth Program The resulting analysis is used to design a customized growth program outlining the organizational capabilities required to write and service risks in a local market, including:
• Defined market focus
• Risk appetite communication plan
• Detailed distribution program
• Budget and capital plan
Size of opportunityBy geography, LoB, & channel:• Available premium• Growth rates
Competitive behavior• Market share• Capacity• Terms & conditions• Appetite
Distribution channel dynamics• Broker & office preferences• Chanel organization• Client decision making
Insurer appetite & capabilities• Approach to broker channel• Risk appetite & capacity analysis• Target growth areas• Existing book characteristics
Target Options
28
Insurance Risk Study
Global Statistics: Motor
Five Year Three Year One Year Cumulative Loss Ratio
Country Inco
me
Per
Cap
ita
Late
st G
WP
(USD
Mill
ions
)
Ann
ualiz
ed
Prem
ium
G
row
th
Loss
Incu
rred
O
ut (
Und
er)
Perf
orm
ance
Ann
ualiz
ed
Prem
ium
G
row
th
Loss
Incu
rred
O
ut (
Und
er)
Perf
orm
ance
Ann
ualiz
ed
Prem
ium
G
row
th
Loss
Incu
rred
O
ut (
Und
er)
Perf
orm
ance
1yr
3yr
5yr
5yr L
R C
V
Americas
Colombia Low 1,690 15.8% 599 10.9% 462 15.1% 168 50.9% 52.7% 53.5% 2.6%
Venezuela Low 5,263 35.9% 1,050 27.2% 673 7.1% 17 60.5% 58.6% 56.8% 5.0%
Puerto Rico Low 670 (4.6%) 28 (4.7%) 68 (4.1%) (1) 61.0% 60.1% 61.8% 2.1%
Brazil Low 14,827 15.2% 318 10.8% (558) 14.6% (808) 66.3% 64.8% 62.0% 4.6%
U.S. High 190,044 (0.2%) 82,382 0.3% 53,350 1.5% 15,877 65.9% 63.8% 62.8% 2.0%
Argentina Low 3,866 19.9% (391) 16.0% (93) 22.9% (92) 63.2% 64.3% 65.3% 3.6%
Chile Low 971 16.2% (156) 14.3% (108) 26.4% (42) 65.2% 68.0% 66.9% 2.8%
Mexico Low 4,494 4.5% (1,575) 1.9% (692) 13.4% (150) 64.2% 69.1% 70.3% 3.7%
Canada High 17,015 (2.0%) (3,078) 1.8% (1,757) 5.9% 80 73.8% 76.9% 75.4% 4.5%
Subtotal 238,842 1.0% 79,177 1.7% 51,346 3.3% 15,049 66.2% 64.7% 63.7% 1.8%
Asia Pacific
Indonesia Low 982 15.6% 434 18.5% 315 41.1% 113 49.4% 50.0% 50.2% 2.1%
China Low 44,361 33.1% 13,862 30.5% 11,221 40.6% 6,695 45.8% 52.2% 52.2% 5.2%
Thailand Low 2,354 14.4% 612 9.9% 484 23.4% 183 53.1% 55.5% 56.1% 1.8%
Hong Kong High 413 4.8% 275 6.7% 237 10.8% 123 44.4% 52.2% 56.1% 8.2%
Taiwan Low 1,664 (1.9%) 326 (0.5%) 201 9.4% (18) 61.9% 59.2% 58.6% 2.5%
New Zealand High 1,058 8.4% 200 8.6% 246 15.7% 134 61.6% 64.3% 67.0% 4.3%
Japan High 48,767 2.8% 5,776 7.9% 4,135 7.1% 1,318 71.5% 70.2% 68.9% 2.4%
Malaysia Low 1,844 9.5% (622) 12.5% (374) 23.7% (141) 68.5% 71.1% 71.1% 3.2%
India Low 4,020 37.4% (1,532) 10.2% (1,307) 19.4% (914) 83.6% 76.1% 72.2% 8.3%
S. Korea Low 11,768 4.1% (5,605) 7.5% (3,853) 14.9% (1,944) 77.4% 76.0% 73.5% 3.5%
Singapore High 855 15.9% (223) 19.8% (122) 17.0% (0) 74.3% 78.8% 78.7% 9.5%
Australia High 11,835 12.0% (9,377) 14.6% (4,905) 18.3% (920) 82.0% 89.7% 92.3% 7.7%
Subtotal 129,923 11.2% 4,126 14.7% 6,279 19.9% 4,628 63.8% 66.6% 66.6% 2.0%
Europe, Middle East & Africa
Ukraine Low 775 16.8% 498 12.4% 304 2.2% 138 43.0% 46.3% 44.0% 6.9%
Czech Republic Low 2,008 5.6% 1,073 1.3% 727 (6.6%) 98 55.9% 52.2% 51.9% 2.7%
Saudi Arabia Low 864 15.3% 274 9.9% 160 6.0% 24 58.1% 56.5% 54.7% 3.8%
Russia Low 7,780 13.2% 927 (1.8%) (660) 8.0% (611) 68.7% 66.0% 60.2% 11.3%
Hungary Low 783 (5.6%) 73 (14.9%) (6) (16.2%) (74) 70.3% 63.6% 61.1% 5.1%
Switzerland High 5,375 4.7% 2,003 5.2% 1,163 5.2% 252 69.5% 65.8% 63.4% 5.3%
Denmark High 2,776 6.7% 992 1.0% 333 (0.8%) (18) 74.9% 69.4% 64.1% 9.1%
Austria High 3,995 2.2% 1,063 (1.3%) 584 7.7% 141 70.7% 68.2% 66.2% 3.1%
U.A.E High 1,231 15.5% 199 10.5% 185 (6.7%) 85 67.4% 68.3% 67.9% 1.6%
Norway High 3,258 7.9% 340 5.8% 425 13.7% 308 64.8% 68.4% 69.2% 2.7%
Poland Low 4,849 8.5% (1,475) (1.5%) (1,128) 14.4% (186) 64.7% 72.1% 69.2% 6.4%
South Africa Low 3,224 8.0% (938) 5.9% (507) 21.9% (189) 66.7% 69.4% 69.5% 1.8%
Luxembourg High 527 7.1% 16 5.5% 4 6.6% (14) 76.8% 73.0% 70.9% 5.3%
Netherlands High 5,720 1.0% 101 (1.2%) (296) (3.2%) (71) 75.5% 74.9% 71.2% 5.5%
Spain High 14,213 0.1% (864) (5.6%) (1,261) (10.7%) (397) 77.0% 75.9% 72.7% 4.9%
Finland High 1,810 3.8% (120) 0.0% 180 2.5% 193 63.6% 69.9% 72.9% 5.8%
Morocco Low 841 9.9% (410) 8.3% (156) 2.7% (33) 64.8% 69.8% 73.8% 8.6%
Romania Low 1,338 4.0% (1,123) (14.6%) (971) (14.1%) (378) 89.1% 83.9% 75.7% 11.3%
Portugal Low 1,999 (4.5%) (1,455) (7.8%) (1,018) 4.4% (419) 81.8% 80.1% 75.7% 5.7%
Ireland High 1,896 (2.3%) (520) (2.9%) (723) (11.0%) (390) 94.8% 85.0% 76.6% 14.6%
Belgium High 4,286 3.3% (1,172) 1.1% (844) (1.1%) 19 73.8% 79.7% 77.2% 8.8%
Sweden High 2,964 (0.1%) (1,033) (3.9%) (153) 3.9% (97) 77.5% 74.9% 78.2% 5.2%
Turkey Low 3,750 8.5% (2,750) 1.9% (2,095) 22.3% (1,044) 88.7% 83.3% 78.8% 8.1%
Italy High 26,433 (0.1%) (11,244) (3.5%) (7,804) (5.5%) (2,143) 82.3% 82.5% 79.5% 4.6%
Iran Low 3,080 17.2% (2,042) 14.2% (1,090) 19.1% (392) 73.6% 76.7% 79.7% 6.1%
France High 24,237 1.7% (14,326) 0.0% (8,501) (2.0%) (2,404) 84.2% 84.6% 83.4% 3.0%
U.K. High 20,990 (2.7%) (14,985) (6.8%) (10,885) 7.3% (4,589) 96.1% 90.2% 84.8% 9.3%
Germany High 26,916 (0.3%) (33,223) (1.9%) (21,516) (4.2%) (6,841) 99.7% 98.6% 95.3% 5.1%
Israel High 2,249 6.3% (3,182) 1.5% (2,076) 8.0% (646) 102.9% 105.7% 102.3% 8.1%
Subtotal 180,167 1.7% (83,303) (2.0%) (57,624) (0.1%) (19,677) 82.8% 82.0% 79.2% 4.5%
Grand Total 548,932 3.2% 0 2.8% 0 5.6% 0 71.1% 71.2% 69.8% 2.2%
29
Aon Benfield
Global Statistics: Property
Five Year Three Year One Year Cumulative Loss Ratio
Country Inco
me
Per
Cap
ita
Late
st G
WP
(USD
Mill
ions
)
Ann
ualiz
ed
Prem
ium
G
row
th
Loss
Incu
rred
O
ut (
Und
er)
Perf
orm
ance
Ann
ualiz
ed
Prem
ium
G
row
th
Loss
Incu
rred
O
ut (
Und
er)
Perf
orm
ance
Ann
ualiz
ed
Prem
ium
G
row
th
Loss
Incu
rred
O
ut (
Und
er)
Perf
orm
ance
1yr
3yr
5yr
5yr
LR C
V
Americas
Puerto Rico Low 757 (1.5%) 897 (1.6%) 602 9.6% 144 20.9% 21.1% 21.5% 1.4%
Venezuela Low 1,023 15.9% 844 9.4% 569 20.7% 86 31.5% 27.7% 25.0% 5.6%
Colombia Low 1,202 14.2% 530 11.2% 482 15.2% (25) 42.0% 32.4% 34.1% 7.5%
Brazil Low 8,750 19.5% 472 15.4% 1,248 21.8% (240) 42.7% 42.1% 43.7% 3.4%
Argentina Low 1,562 16.4% (28) 11.0% 84 19.3% 10 39.3% 45.8% 45.7% 4.8%
Mexico Low 3,166 10.7% (597) 11.7% 436 26.6% 61 38.0% 42.8% 49.7% 14.8%
U.S. High 171,915 2.7% 19,824 3.0% 11,874 8.4% (489) 65.7% 58.3% 57.4% 8.2%
Canada High 13,576 5.8% (1,684) 4.4% (850) 8.9% (107) 66.2% 62.9% 62.6% 5.9%
Chile Low 1,744 19.8% (9,247) 14.4% (9,015) 32.3% 158 30.9% 270.2% 197.4% 329.3%
Subtotal 203,694 3.7% 11,011 20.5% 5,430 9.5% (401) 63.3% 58.7% 57.6% 6.7%
Asia Pacific
Malaysia Low 1,168 7.3% 1,522 6.2% 1,116 14.4% 321 12.5% 13.5% 15.4% 3.2%
Singapore High 624 5.5% 757 4.8% 429 9.8% 185 35.7% 36.6% 33.0% 6.1%
Thailand Low 841 10.8% 212 13.0% 253 29.6% 59 33.0% 36.0% 38.7% 5.5%
India Low 2,023 9.8% 504 7.7% 267 14.1% (79) 43.9% 42.9% 39.5% 5.2%
Hong Kong High 712 3.4% 684 3.1% 527 3.7% 263 28.5% 35.2% 39.5% 8.7%
Japan High 17,116 3.0% 14,986 7.3% 9,521 2.7% 2,487 50.9% 41.4% 40.6% 6.1%
Taiwan Low 988 (3.7%) 188 (4.9%) (7) 1.1% (259) 66.2% 48.2% 41.8% 14.6%
Indonesia Low 1,429 8.0% 161 7.0% 174 13.6% (32) 42.2% 43.6% 42.6% 4.4%
S. Korea Low 2,331 2.9% (394) (1.7%) (266) 13.7% (218) 49.3% 51.9% 48.7% 7.3%
China Low 9,789 28.8% (2,200) 32.8% (1,117) 21.0% (569) 45.8% 52.3% 52.0% 5.0%
Australia High 8,328 10.1% (2,416) 11.0% (1,479) 25.2% 541 58.9% 67.5% 67.2% 8.4%
New Zealand High 1,604 12.0% (2,340) 13.5% (2,286) 25.6% (709) 109.6% 118.9% 98.2% 56.8%
Subtotal 46,953 8.3% 11,665 42.9% 7,133 12.7% 1,989 51.1% 50.2% 48.5% 3.1%
Europe, Middle East & Africa
Ukraine Low 1,261 18.4% 1,770 52.0% 1,510 38.9% 454 4.0% 18.8% 16.3% 11.7%
Russia Low 5,881 14.5% 6,456 14.5% 4,337 15.1% 1,058 22.0% 19.8% 17.0% 4.9%
Romania Low 482 10.3% 405 0.8% 238 25.9% 85 22.3% 29.2% 26.2% 6.4%
Iran Low 731 12.4% 557 3.9% 361 13.1% 93 27.3% 30.1% 27.7% 4.2%
Saudi Arabia Low 795 13.5% 329 11.1% 237 9.7% 51 33.5% 37.0% 35.2% 9.0%
Turkey Low 2,235 11.1% 726 1.3% 472 8.0% (64) 42.9% 40.6% 38.2% 5.5%
Hungary Low 753 4.8% 68 (2.9%) 20 8.2% (5) 40.7% 47.0% 43.4% 11.0%
Norway High 4,278 3.1% 2,833 (1.4%) 1,193 0.6% 479 54.2% 51.1% 46.4% 7.8%
Switzerland High 4,337 6.6% 2,127 9.7% 1,818 10.8% 1,009 42.1% 45.5% 48.3% 5.3%
Morocco Low 256 8.2% (37) 5.4% (8) 3.0% (45) 57.4% 48.9% 48.4% 9.9%
U.A.E High 1,227 16.8% 430 12.1% 369 8.3% 137 54.3% 49.6% 51.1% 10.8%
Poland Low 1,731 11.0% (513) 5.0% (431) 17.7% (172) 49.9% 57.5% 52.4% 12.5%
Portugal Low 1,043 1.7% (444) (1.5%) (317) 11.1% (189) 58.1% 58.5% 54.0% 7.3%
Czech Republic Low 1,021 5.7% (515) 5.4% (306) 1.2% (256) 65.1% 57.8% 56.0% 6.1%
Spain High 9,320 6.6% 365 2.0% 43 (6.7%) (44) 65.9% 60.5% 59.1% 4.4%
South Africa Low 2,783 7.3% (1,666) 6.3% (940) 24.4% (427) 55.3% 61.0% 59.5% 4.7%
Netherlands High 5,061 4.3% (114) 1.7% (281) (3.8%) 2 65.3% 62.5% 60.4% 4.6%
Belgium High 2,958 5.8% (136) 1.9% (414) (3.4%) (147) 70.4% 65.2% 60.8% 8.1%
U.K. High 24,621 (1.0%) (1,251) (4.4%) 1,295 7.8% 773 62.3% 59.0% 60.9% 8.3%
Israel High 931 6.3% (180) 4.2% (127) 9.8% (15) 67.0% 65.7% 64.3% 3.9%
Italy High 7,398 1.8% (2,166) (1.1%) (2,154) (6.9%) 62 64.6% 69.7% 65.5% 7.7%
Sweden High 3,822 2.6% (1,198) (0.6%) (903) 6.6% (287) 72.9% 68.5% 66.2% 4.6%
Ireland High 1,383 (0.8%) (451) 0.9% (792) (5.7%) (362) 91.5% 79.1% 66.3% 22.6%
Austria High 3,343 4.2% (1,288) (1.7%) (485) 0.2% 169 60.3% 65.5% 67.6% 9.8%
France High 25,959 3.6% (11,258) 1.0% (7,458) (2.7%) (1,435) 70.9% 70.0% 68.7% 4.1%
Finland High 1,053 0.1% (699) (7.2%) (496) (16.4%) (82) 73.2% 74.5% 71.3% 8.2%
Germany High 22,403 2.3% (12,719) 1.3% (6,559) (3.2%) (1,622) 72.6% 70.2% 71.4% 5.0%
Luxembourg High 1,283 32.0% (756) 12.4% (408) (14.6%) (100) 73.2% 69.7% 71.8% 6.2%
Denmark High 4,207 7.1% (3,348) 3.5% (2,378) (0.4%) (708) 82.2% 79.5% 77.0% 8.4%
Subtotal 142,554 3.7% (22,676) 16.8% (12,564) 1.2% (1,588) 63.1% 62.0% 61.4% 3.6%
Grand Total 393,201 4.2% 0 21.0% 0 6.7% 0 61.8% 59.0% 58.1% 5.0%
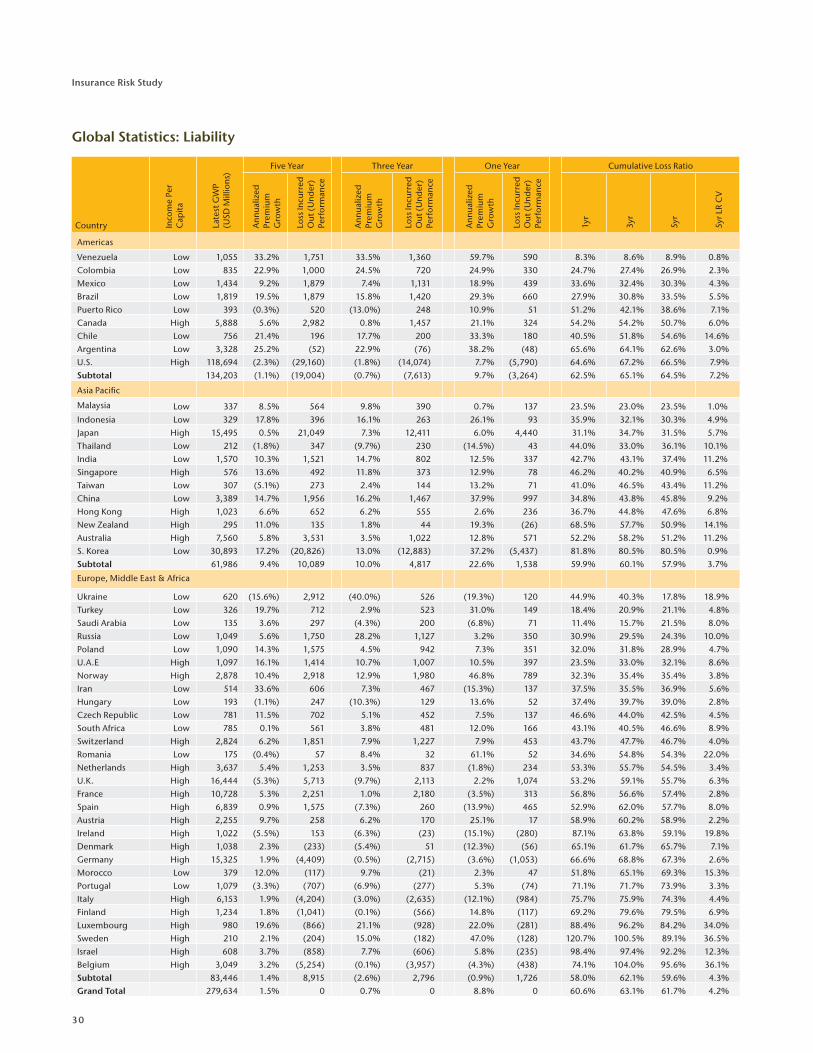
30
Insurance Risk Study
Global Statistics: Liability
Five Year Three Year One Year Cumulative Loss Ratio
Country Inco
me
Per
Cap
ita
Late
st G
WP
(USD
Mill
ions
)
Ann
ualiz
ed
Prem
ium
G
row
th
Loss
Incu
rred
O
ut (
Und
er)
Perf
orm
ance
Ann
ualiz
ed
Prem
ium
G
row
th
Loss
Incu
rred
O
ut (
Und
er)
Perf
orm
ance
Ann
ualiz
ed
Prem
ium
G
row
th
Loss
Incu
rred
O
ut (
Und
er)
Perf
orm
ance
1yr
3yr
5yr
5yr L
R C
V
Americas
Venezuela Low 1,055 33.2% 1,751 33.5% 1,360 59.7% 590 8.3% 8.6% 8.9% 0.8%Colombia Low 835 22.9% 1,000 24.5% 720 24.9% 330 24.7% 27.4% 26.9% 2.3%Mexico Low 1,434 9.2% 1,879 7.4% 1,131 18.9% 439 33.6% 32.4% 30.3% 4.3%Brazil Low 1,819 19.5% 1,879 15.8% 1,420 29.3% 660 27.9% 30.8% 33.5% 5.5%Puerto Rico Low 393 (0.3%) 520 (13.0%) 248 10.9% 51 51.2% 42.1% 38.6% 7.1%Canada High 5,888 5.6% 2,982 0.8% 1,457 21.1% 324 54.2% 54.2% 50.7% 6.0%Chile Low 756 21.4% 196 17.7% 200 33.3% 180 40.5% 51.8% 54.6% 14.6%Argentina Low 3,328 25.2% (52) 22.9% (76) 38.2% (48) 65.6% 64.1% 62.6% 3.0%U.S. High 118,694 (2.3%) (29,160) (1.8%) (14,074) 7.7% (5,790) 64.6% 67.2% 66.5% 7.9%Subtotal 134,203 (1.1%) (19,004) (0.7%) (7,613) 9.7% (3,264) 62.5% 65.1% 64.5% 7.2%
Asia Pacific
Malaysia Low 337 8.5% 564 9.8% 390 0.7% 137 23.5% 23.0% 23.5% 1.0%Indonesia Low 329 17.8% 396 16.1% 263 26.1% 93 35.9% 32.1% 30.3% 4.9%Japan High 15,495 0.5% 21,049 7.3% 12,411 6.0% 4,440 31.1% 34.7% 31.5% 5.7%Thailand Low 212 (1.8%) 347 (9.7%) 230 (14.5%) 43 44.0% 33.0% 36.1% 10.1%India Low 1,570 10.3% 1,521 14.7% 802 12.5% 337 42.7% 43.1% 37.4% 11.2%Singapore High 576 13.6% 492 11.8% 373 12.9% 78 46.2% 40.2% 40.9% 6.5%Taiwan Low 307 (5.1%) 273 2.4% 144 13.2% 71 41.0% 46.5% 43.4% 11.2%China Low 3,389 14.7% 1,956 16.2% 1,467 37.9% 997 34.8% 43.8% 45.8% 9.2%Hong Kong High 1,023 6.6% 652 6.2% 555 2.6% 236 36.7% 44.8% 47.6% 6.8%New Zealand High 295 11.0% 135 1.8% 44 19.3% (26) 68.5% 57.7% 50.9% 14.1%Australia High 7,560 5.8% 3,531 3.5% 1,022 12.8% 571 52.2% 58.2% 51.2% 11.2%S. Korea Low 30,893 17.2% (20,826) 13.0% (12,883) 37.2% (5,437) 81.8% 80.5% 80.5% 0.9%Subtotal 61,986 9.4% 10,089 10.0% 4,817 22.6% 1,538 59.9% 60.1% 57.9% 3.7%
Europe, Middle East & Africa
Ukraine Low 620 (15.6%) 2,912 (40.0%) 526 (19.3%) 120 44.9% 40.3% 17.8% 18.9%Turkey Low 326 19.7% 712 2.9% 523 31.0% 149 18.4% 20.9% 21.1% 4.8%Saudi Arabia Low 135 3.6% 297 (4.3%) 200 (6.8%) 71 11.4% 15.7% 21.5% 8.0%Russia Low 1,049 5.6% 1,750 28.2% 1,127 3.2% 350 30.9% 29.5% 24.3% 10.0%Poland Low 1,090 14.3% 1,575 4.5% 942 7.3% 351 32.0% 31.8% 28.9% 4.7%U.A.E High 1,097 16.1% 1,414 10.7% 1,007 10.5% 397 23.5% 33.0% 32.1% 8.6%Norway High 2,878 10.4% 2,918 12.9% 1,980 46.8% 789 32.3% 35.4% 35.4% 3.8%Iran Low 514 33.6% 606 7.3% 467 (15.3%) 137 37.5% 35.5% 36.9% 5.6%Hungary Low 193 (1.1%) 247 (10.3%) 129 13.6% 52 37.4% 39.7% 39.0% 2.8%Czech Republic Low 781 11.5% 702 5.1% 452 7.5% 137 46.6% 44.0% 42.5% 4.5%South Africa Low 785 0.1% 561 3.8% 481 12.0% 166 43.1% 40.5% 46.6% 8.9%Switzerland High 2,824 6.2% 1,851 7.9% 1,227 7.9% 453 43.7% 47.7% 46.7% 4.0%Romania Low 175 (0.4%) 57 8.4% 32 61.1% 52 34.6% 54.8% 54.3% 22.0%Netherlands High 3,637 5.4% 1,253 3.5% 837 (1.8%) 234 53.3% 55.7% 54.5% 3.4%U.K. High 16,444 (5.3%) 5,713 (9.7%) 2,113 2.2% 1,074 53.2% 59.1% 55.7% 6.3%France High 10,728 5.3% 2,251 1.0% 2,180 (3.5%) 313 56.8% 56.6% 57.4% 2.8%Spain High 6,839 0.9% 1,575 (7.3%) 260 (13.9%) 465 52.9% 62.0% 57.7% 8.0%Austria High 2,255 9.7% 258 6.2% 170 25.1% 17 58.9% 60.2% 58.9% 2.2%Ireland High 1,022 (5.5%) 153 (6.3%) (23) (15.1%) (280) 87.1% 63.8% 59.1% 19.8%Denmark High 1,038 2.3% (233) (5.4%) 51 (12.3%) (56) 65.1% 61.7% 65.7% 7.1%Germany High 15,325 1.9% (4,409) (0.5%) (2,715) (3.6%) (1,053) 66.6% 68.8% 67.3% 2.6%Morocco Low 379 12.0% (117) 9.7% (21) 2.3% 47 51.8% 65.1% 69.3% 15.3%Portugal Low 1,079 (3.3%) (707) (6.9%) (277) 5.3% (74) 71.1% 71.7% 73.9% 3.3%Italy High 6,153 1.9% (4,204) (3.0%) (2,635) (12.1%) (984) 75.7% 75.9% 74.3% 4.4%Finland High 1,234 1.8% (1,041) (0.1%) (566) 14.8% (117) 69.2% 79.6% 79.5% 6.9%Luxembourg High 980 19.6% (866) 21.1% (928) 22.0% (281) 88.4% 96.2% 84.2% 34.0%Sweden High 210 2.1% (204) 15.0% (182) 47.0% (128) 120.7% 100.5% 89.1% 36.5%Israel High 608 3.7% (858) 7.7% (606) 5.8% (235) 98.4% 97.4% 92.2% 12.3%Belgium High 3,049 3.2% (5,254) (0.1%) (3,957) (4.3%) (438) 74.1% 104.0% 95.6% 36.1%Subtotal 83,446 1.4% 8,915 (2.6%) 2,796 (0.9%) 1,726 58.0% 62.1% 59.6% 4.3%Grand Total 279,634 1.5% 0 0.7% 0 8.8% 0 60.6% 63.1% 61.7% 4.2%
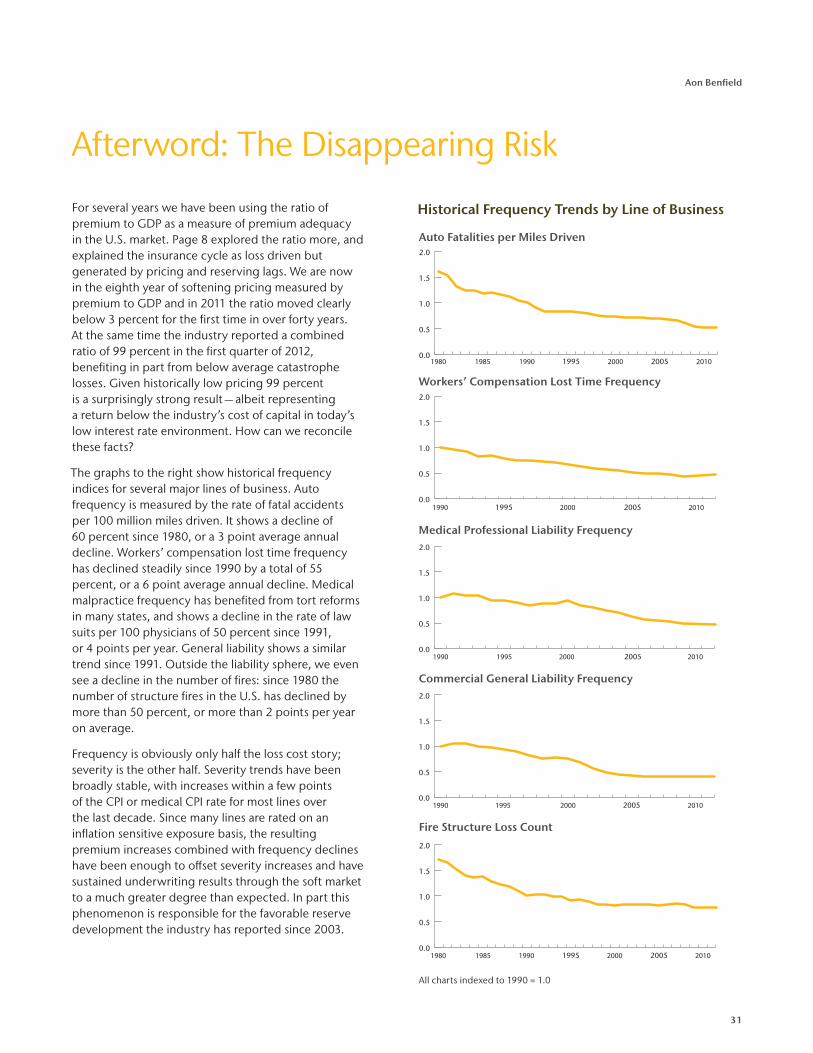
31
Aon Benfield
Afterword: The Disappearing Risk
For several years we have been using the ratio of premium to GDP as a measure of premium adequacy in the U.S. market. Page 8 explored the ratio more, and explained the insurance cycle as loss driven but generated by pricing and reserving lags. We are now in the eighth year of softening pricing measured by premium to GDP and in 2011 the ratio moved clearly below 3 percent for the first time in over forty years. At the same time the industry reported a combined ratio of 99 percent in the first quarter of 2012, benefiting in part from below average catastrophe losses. Given historically low pricing 99 percent is a surprisingly strong result — albeit representing a return below the industry’s cost of capital in today’s low interest rate environment. How can we reconcile these facts?
The graphs to the right show historical frequency indices for several major lines of business. Auto frequency is measured by the rate of fatal accidents per 100 million miles driven. It shows a decline of 60 percent since 1980, or a 3 point average annual decline. Workers’ compensation lost time frequency has declined steadily since 1990 by a total of 55 percent, or a 6 point average annual decline. Medical malpractice frequency has benefited from tort reforms in many states, and shows a decline in the rate of law suits per 100 physicians of 50 percent since 1991, or 4 points per year. General liability shows a similar trend since 1991. Outside the liability sphere, we even see a decline in the number of fires: since 1980 the number of structure fires in the U.S. has declined by more than 50 percent, or more than 2 points per year on average.
Frequency is obviously only half the loss cost story; severity is the other half. Severity trends have been broadly stable, with increases within a few points of the CPI or medical CPI rate for most lines over the last decade. Since many lines are rated on an inflation sensitive exposure basis, the resulting premium increases combined with frequency declines have been enough to offset severity increases and have sustained underwriting results through the soft market to a much greater degree than expected. In part this phenomenon is responsible for the favorable reserve development the industry has reported since 2003.
0.0
0.5
1.0
1.5
2.0
20102000199019851980 20051995
Auto Fatalities per Miles Driven
0.0
0.5
1.0
1.5
2.0
201020001990 20051995
Workers’ Compensation Lost Time Frequency
0.0
0.5
1.0
1.5
2.0
2010200019951990 2005
Medical Professional Liability Frequency
0.0
0.5
1.0
1.5
2.0
2010200019951990 2005
Commercial General Liability Frequency
Historical Frequency Trends by Line of Business
0.0
0.5
1.0
1.5
2.0
20102000199019851980 20051995
Fire Structure Loss Count
All charts indexed to 1990 = 1.0
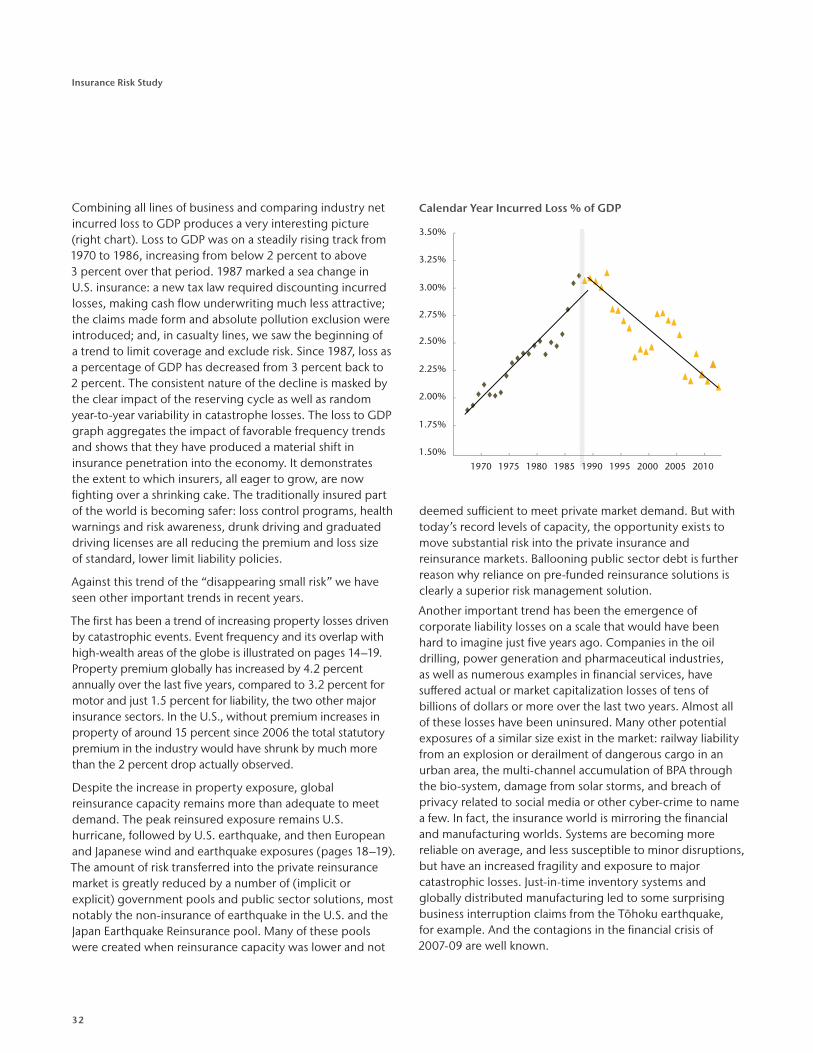
32
Insurance Risk Study
deemed sufficient to meet private market demand. But with today’s record levels of capacity, the opportunity exists to move substantial risk into the private insurance and reinsurance markets. Ballooning public sector debt is further reason why reliance on pre-funded reinsurance solutions is clearly a superior risk management solution.
Another important trend has been the emergence of corporate liability losses on a scale that would have been hard to imagine just five years ago. Companies in the oil drilling, power generation and pharmaceutical industries, as well as numerous examples in financial services, have suffered actual or market capitalization losses of tens of billions of dollars or more over the last two years. Almost all of these losses have been uninsured. Many other potential exposures of a similar size exist in the market: railway liability from an explosion or derailment of dangerous cargo in an urban area, the multi-channel accumulation of BPA through the bio-system, damage from solar storms, and breach of privacy related to social media or other cyber-crime to name a few. In fact, the insurance world is mirroring the financial and manufacturing worlds. Systems are becoming more reliable on average, and less susceptible to minor disruptions, but have an increased fragility and exposure to major catastrophic losses. Just-in-time inventory systems and globally distributed manufacturing led to some surprising business interruption claims from the Tōhoku earthquake, for example. And the contagions in the financial crisis of 2007-09 are well known.
Combining all lines of business and comparing industry net incurred loss to GDP produces a very interesting picture (right chart). Loss to GDP was on a steadily rising track from 1970 to 1986, increasing from below 2 percent to above 3 percent over that period. 1987 marked a sea change in U.S. insurance: a new tax law required discounting incurred losses, making cash flow underwriting much less attractive; the claims made form and absolute pollution exclusion were introduced; and, in casualty lines, we saw the beginning of a trend to limit coverage and exclude risk. Since 1987, loss as a percentage of GDP has decreased from 3 percent back to 2 percent. The consistent nature of the decline is masked by the clear impact of the reserving cycle as well as random year-to-year variability in catastrophe losses. The loss to GDP graph aggregates the impact of favorable frequency trends and shows that they have produced a material shift in insurance penetration into the economy. It demonstrates the extent to which insurers, all eager to grow, are now fighting over a shrinking cake. The traditionally insured part of the world is becoming safer: loss control programs, health warnings and risk awareness, drunk driving and graduated driving licenses are all reducing the premium and loss size of standard, lower limit liability policies.
Against this trend of the “disappearing small risk” we have seen other important trends in recent years.
The first has been a trend of increasing property losses driven by catastrophic events. Event frequency and its overlap with high-wealth areas of the globe is illustrated on pages 14–19. Property premium globally has increased by 4.2 percent annually over the last five years, compared to 3.2 percent for motor and just 1.5 percent for liability, the two other major insurance sectors. In the U.S., without premium increases in property of around 15 percent since 2006 the total statutory premium in the industry would have shrunk by much more than the 2 percent drop actually observed.
Despite the increase in property exposure, global reinsurance capacity remains more than adequate to meet demand. The peak reinsured exposure remains U.S. hurricane, followed by U.S. earthquake, and then European and Japanese wind and earthquake exposures (pages 18–19). The amount of risk transferred into the private reinsurance market is greatly reduced by a number of (implicit or explicit) government pools and public sector solutions, most notably the non-insurance of earthquake in the U.S. and the Japan Earthquake Reinsurance pool. Many of these pools were created when reinsurance capacity was lower and not
Calendar Year Incurred Loss % of GDP
0.0
3.50%
3.25%
3.00%
2.75%
2.50%
2.25%
2.00%
1.75%
1.50%
19651970 1975 1980 1985 1990 1995 2000 2005 2010
0.2
0.4
0.6
0.8
1.0
1.2
1.4
1.6
1.8
2010
2008
2006
2004
2002
2000
1998
1996
1994
1992
1991
1990
1989
1988
1987
1986
1985
1984
1983
1982
1981
1980
2011
2009
2007
2005
2003
2001
1999
1997
1995
1993
1991
1.50%
1.75%
2.00%
2.25%
2.50%
2.75%
3.00%
3.25%
3.50%
1965 1970 1975 1980 1985 1990 1995 2000 2005 2010
1970 1975 1980 1985 1990 1995 2000 2005 2010
33
Aon Benfield
Just as insurance capacity has been deployed to effectively transfer and manage property risks once thought too large, the industry today needs a similar expansion of capacity for casualty and non-traditional exposures to help drive meaningful growth over the next decade. In moving to self-insurance or no insurance, an important independent oversight function is lost: the loss control and process review of the risk taker. Such a service, backed by a risk indemnity, has been so effective for small risks that they are rapidly decreasing. To reverse the resulting long-term decline in the insurance growth and decreasing loss to GDP, the industry needs to creatively and constructively grapple with large, harder to quantify risk.
What lessons can we draw from the successful transfer of mega-property risks to insurers and reinsurers for potential casualty capacity? Analytics and catastrophe models apply science and statistics to the problem of estimating losses. Models provide a common currency for risk — a currency shared by risk assumers, regulators, rating agencies, and, crucially, capital providers — and they support market pricing that is transparent and predictable. The same computer modeling techniques used so successfully to manage property risk are now developing to the point where some mega-casualty perils could be understood well enough to support insurance solutions — provided there is adequate demand.
The global pooling provided by reinsurance (whether traditional or non-traditional capital markets) is key to creating capacity: reinsurance provides property capacity for a number of independent but highly volatile risk towers that together drive adequate, but manageable, leverage of capital and so adequate returns on capital. Success in providing higher capacity to casualty and other non-property risks will not be based on one or two highly skewed covers, but on an adequate portfolio of such covers. Success will feed on itself, with more risk attracting more capital and driving more cost effective coverage. The first steps will come from an open attitude to risk from insurers, and, equally importantly, a greater appreciation for the value of the insurance product from a range of insureds. Aon Benfield continues to work with its clients and reinsurance markets to help facilitate a creative and responsible approach to risk innovation through new products, often with reinsurance support, to drive insurance growth in the coming decade.
34
Insurance Risk Study
Sources:
Global Risk Parameters
ANIA (Italy), Association of Vietnam Insurers, BaFin (Germany), Banco Central del Uruguay, Bank Negara Malaysia, CADOAR (Dominican Republic), Cámara de Aseguradores de Venezuela, Comisión Nacional de Bancos y Seguros de Honduras, Comisión Nacional de Seguros y Fianzas (Mexico), Danish FSA, Dirección General de Seguros (Spain), DNB (Denmark), E&Y Annual Statements (Israel), Finma (Switzerland), FMA (Austria), FSA (U.K.), HKOCI (Hong Kong), http://www.bapepam.go.id/perasuransian/index.htm (Indonesia), ICA (Australia), Insurance Commission (Philippines), IRDA Handbook on Indian Insurance Statistics, Korea Financial Supervisory Service, Monetary Authority of Singapore, MSA Research Inc. (Canada), Quest Data Report (South Africa), Romanian Insurance Association, Slovak Insurance Association, SNL Financial (U.S.), Superintendencia de Banca y Seguros (Peru), Superintendencia de Bancos y Otras Instituciones Financieras de Nicaragua, Superintendencia de Bancos y Seguros (Ecuador), Superintendencia de Pensiones de El Salvador, Superintendencia de Pensiones, Valores y Seguros (Bolivia), Superintendencia de Seguros de la Nación (Argentina), Superintendencia de Seguros Privados (Brazil), Superintendencia de Seguros y Reaseguros de Panama, Superintendencia de Valores y Seguros de Chile, Superintendencia Financiera de Colombia, Taiwan Insurance Institution, The Insurance Association of Pakistan, The Statistics of Japanese Non-Life Insurance Business, Turkish Insurance and Reinsurance Companies Association, Yearbooks Of China’s Insurance, and annual financial statements
© 2012 Aon Benfield. This document is intended for general information purposes only and should not be construed as advice or opinions on any specific facts or circumstances. The comments in this summary are based upon Aon Benfield’s preliminary analysis of publicly available information. The content of this document is made available on an “as is” basis, without warranty of any kind. Aon Benfield disclaims any legal liability to any person or organization for loss or damage caused by or resulting from any reliance placed on that content. Aon Benfield reserves all rights to the content of this document.
Scan here to access prior editions of the Insurance Risk Study.
U.S. Risk Parameters
SNL Financial
U.S. Reserve Adequacy and Risk
SNL Financial, A.M. Best
Modeling the Underwriting Cycle
A.M. Best, U.S. Bureau of Economic Analysis
Motor Insurance in China
China Statistical Yearbooks, Yearbooks of China’s Insurance
A Different View of Risk
Axco Insurance Information Services, EM-DAT International Disaster Database, Global Seismic Hazard Assessment Program (GSHAP), Impact Forecasting (Aon Benfield), International Best Track Archive for Climate Stewardship (IBTrACS), LandScan 2006™ High Resolution global Population Data Set, Penn World Table Version 7.0, USGS EROS GTOPO30 global digital elevation model, World Bank 2005 The Wealth of Nations Dataset
Global Crop Insurance Penetration
USDA Foreign Agricultural Service
Correlation Considerations
FSA (U.K.), SNL Financial (U.S.), The Statistics of Japanese Non-Life Insurance Business, Yearbooks Of China’s Insurance
Macroeconomic Correlation
Bloomberg, Case-Schiller U.S. National Home Price Index, U.S. Bureau of Economic Analysis, U.S Bureau of Labor & Statistics, Yahoo! Finance
Global Market Review
Axco Insurance Information Services, CIA World Factbook July 2012 Population Estimates, IMF World Economic Outlook Database April 2012 Edition
Afterword
A.M. Best, Insurance Services Office (ISO), National Council on Compensation Insurance, Inc. (NCCI), National Fire Protection Association (NFPA), National Highway Traffic Safety Association (NHTSA), National Practitioner DataBank, U.S. Bureau of Economic Analysis
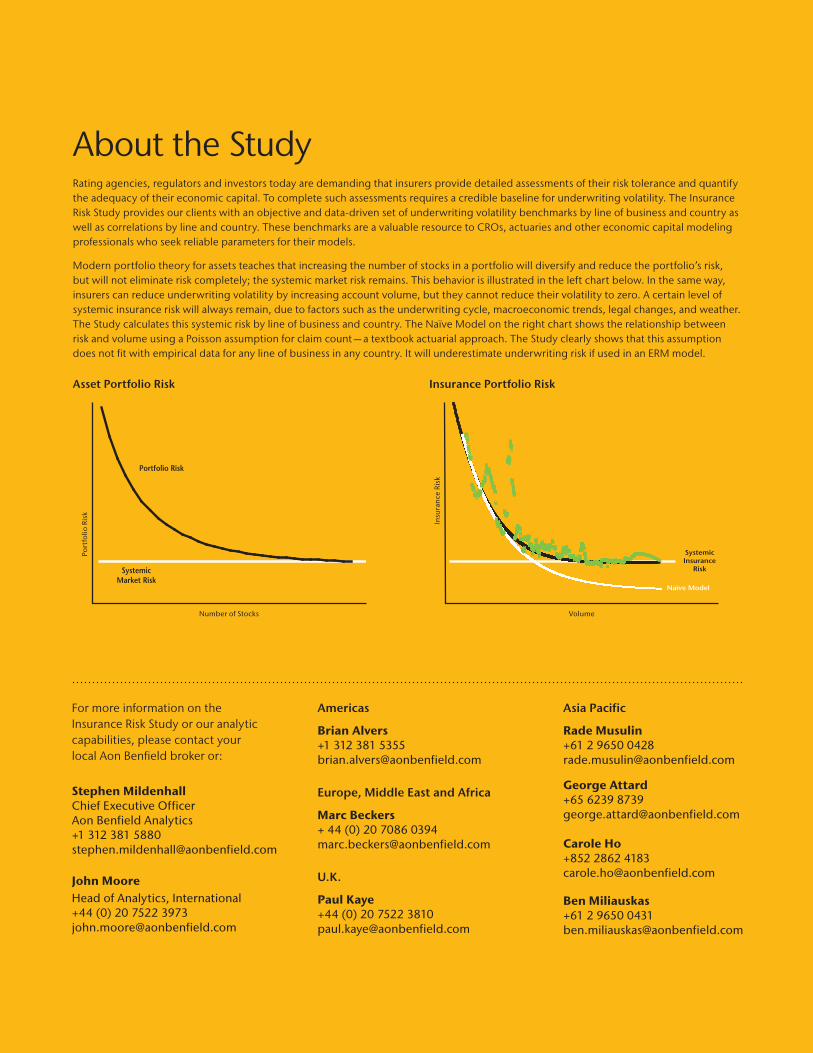
35
Aon Benfield
For more information on the Insurance Risk Study or our analytic capabilities, please contact your local Aon Benfield broker or:
StephenMildenhallChief Executive Officer Aon Benfield Analytics+1 312 381 [email protected]
JohnMooreHead of Analytics, International+44 (0) 20 7522 [email protected]
Americas
BrianAlvers+1 312 381 [email protected]
Europe, Middle East and Africa
MarcBeckers+ 44 (0) 20 7086 [email protected]
U.K.
PaulKaye+44 (0) 20 7522 [email protected]
Asia Pacific
RadeMusulin+61 2 9650 [email protected]
GeorgeAttard+65 6239 [email protected]
CaroleHo+852 2862 [email protected]
BenMiliauskas+61 2 9650 [email protected]
About the StudyRating agencies, regulators and investors today are demanding that insurers provide detailed assessments of their risk tolerance and quantify the adequacy of their economic capital. To complete such assessments requires a credible baseline for underwriting volatility. The Insurance Risk Study provides our clients with an objective and data-driven set of underwriting volatility benchmarks by line of business and country as well as correlations by line and country. These benchmarks are a valuable resource to CROs, actuaries and other economic capital modeling professionals who seek reliable parameters for their models.
Modern portfolio theory for assets teaches that increasing the number of stocks in a portfolio will diversify and reduce the portfolio’s risk, but will not eliminate risk completely; the systemic market risk remains. This behavior is illustrated in the left chart below. In the same way, insurers can reduce underwriting volatility by increasing account volume, but they cannot reduce their volatility to zero. A certain level of systemic insurance risk will always remain, due to factors such as the underwriting cycle, macroeconomic trends, legal changes, and weather. The Study calculates this systemic risk by line of business and country. The Naïve Model on the right chart shows the relationship between risk and volume using a Poisson assumption for claim count — a textbook actuarial approach. The Study clearly shows that this assumption does not fit with empirical data for any line of business in any country. It will underestimate underwriting risk if used in an ERM model.
Port
folio
Ris
k
Insurance Portfolio RiskAsset Portfolio Risk
Number of Stocks Volume
Insu
ranc
e Ri
sk
Portfolio Risk
SystemicMarket Risk
SystemicInsurance
Risk
Naïve Model

200 E Randolph Street Chicago Illinois 60601 t: +1 312 381 5300 | f: +1 312 381 0160 | aonbenfield.com
Copyright Aon Benfield Inc 2012 | #10032 - 08/2012