Embed Size (px)
Citation preview
Index investing has profoundly changed the way investors seek returns, manage risk,
and build portfolios. For nearly 50 years, index investment vehicles have lowered
costs and simplified access to diversified investments for all investors, from
sophisticated institutions to individuals. Technology and data have also transformed
the range of investments that can be tracked by an index. Choice now extends
beyond traditional equity indexes, which include stocks in proportion to their market-
capitalization, to a whole array of more dynamic indexes compiled according to other
methodologies.1 These can be used to create investment products that serve a wide
variety of needs – for example, products that track indexes with exposure to specific
investment styles such as value or quality stocks.
Change is often disruptive to established norms, however, and there has been a
cadence of commentary citing concern about the growth of index investing. Some of
the headlines have been arresting,2 but many of the underlying arguments either are
not supported in the data or would benefit from greater clarity and a common
language around key concepts, such as asset ownership versus asset management;
the size of assets managed by external managers relative to the total market value of
investable assets; and shareholder activism versus activist investors. Although the
benefits of index investing are widely recognized, these concerns have focused on its
market impact. We see two themes emerging.
First, some commentators have sought to examine the role that index investing plays
in capital markets. In particular, they ask whether index funds, by which we refer in
this paper to index mutual funds and exchange traded funds (ETFs), have the
potential to distort investment flows, create stock price bubbles, or conversely,
exacerbate a decline in market prices.3
Second, other commentators have explored index investing, stock ownership, and
competition, attributing higher consumer prices, escalating executive
compensation, and even aspects of wealth inequality to index investment products.4
This academic discourse is often referred to as the literature on ‘common ownership’
– a shorthand term for the ownership by a single entity of shares of multiple companies
in an industry.
In this ViewPoint, we outline some of the key elements of the debate around index
investing, with the objective of differentiating core concepts and providing a
practical perspective. We focus here on index investing in relation to company
stocks and the equity markets.5 We begin by defining the spectrum of investment
styles at the center of this debate, from the more active to the more index driven, and
put the relative adoption of each style in perspective. We then draw out some of the
distinct concepts at play, and address the impact of index investing on the equity
markets. Finally, we examine the theories around common ownership, building on
our ViewPoint entitled “Index Investing and Common Ownership Theories.”6
VIEWPOINT
OCT 2017 Index Investing Supports Vibrant
Capital Markets
The opinions expressed are as of October 2017 and may change as subsequent conditions vary.
Barbara Novick
Vice Chairman
Ananth Madhavan
Global Head of
Research, ETF and
Index Investments
Jasmin Sethi
Legal &
Compliance, US
Sarah Matthews
Global Public Policy
Group, EMEA
Samara Cohen
ETF and Index
Investments
Theodore Bunzel
Corporate Strategy
In this ViewPoint
Key observations
The active-index investment
continuum: Not a binary choice
Investment styles in
perspective: How big is index?
Core concepts
Impact of index investing on
equity markets
Theories on common ownership
Conclusion
2
4
5
8
11
16
17
GR0917G-268626-801480

2
Key Observations
1. Index investing has profoundly changed the way investors seek returns, manage risk, and build portfolios.
• Index investing has been transformational in providing low cost access to diversified investments for all investors,
from institutions to individuals.
• Technology has extended the range of investments that can be indexed, providing choices beyond the traditional
market-capitalization weighted indexes to more dynamic indexes, such as those tracking investment styles and value
or quality stocks.
• Global trends driving the adoption of index investing strategies, include:
i. Growing awareness of the value proposition they offer, in seeking to track, rather than beat, a benchmark
index;
ii. increased focus on fees and transparency by regulators and investors; and
iii. shift in brokerage and advice models that has seen investment advisers increasingly act less as stock or
fund selectors, and focus more on building diversified portfolios, often delivered through index funds.
2. Despite its popularity, the relative scale of index investing is still small. Index investing overall represents
less than 20% of global equities. Index funds and ETFs together represent just over 12% of the US equity
universe, and 7% of the global equity universe.7
• While index investing is currently growing at a faster rate than active strategies, the balance of active and index
management is self-regulating.
• Underperformance by many active strategies has helped increase the appeal of index strategies. If index
investing were to grow large enough to affect price discovery, any short term price fluctuations of individual
stocks would be used by active managers to improve their performance.
• Improved active performance would attract flows back into active strategies. Intuitively, the market will
continuously adjust to an equilibrium.
• Further, while differentiating between active and index strategies is often a useful shorthand, in practice the
investment landscape is not a binary choice between two styles, but rather a continuum of investment strategies that
range from the more active to the more index driven. As a manager of both active and index based investment
solutions, we see important and complementary roles for both.
3. The evolution of investment norms is generating an important debate regarding the impact of index investing
on investment flows, stock prices, and the efficiency of capital markets.
• Greater clarity and a common language around core concepts would facilitate a more constructive discussion,
including:
• The difference between asset owners and asset managers;
• Distinguishing the various forms of index investment products;
• Threshold reporting and what it can tell us; and
• The difference between an “active investment manager” and an “activist investor.”
GR0917G-268626-801480
3
Key Observations (cont’d)
4. Investment flows into different asset classes and sectors are driven by overall asset allocation decisions
made by asset owners, not by the appeal of certain products or investment styles.
• Some commentators are concerned that index funds may drive investment flows into the asset class, sector or region
of the moment, only to see a rapid decline when sentiment reverses.8
• In practice, investment products are tools for implementing the individual asset allocation decisions that are made by
asset owners. In the absence of index funds, these asset allocation decisions would be executed via an alternative
means, such as individual stocks or active funds.
• Drivers for asset allocation decisions include macroeconomic developments and interest rate policy, not the
choice of product.
• The vast diversity of index benchmarks, strategies, and products means that index assets are not limited to flowing
into (or out of) a small set of static strategies, but rather are dispersed widely throughout the investable universe.
Moreover, indexes themselves are not static. The stocks included are rebalanced periodically, reflecting the dynamics
of the competitive landscapes that they track.
5. Pricing efficiency has benefited from leaps in technology, which continues to bring increasing information and
transparency to stock markets. While index investing does play a role, the price discovery process is still
dominated by active stock selectors.
• Price discovery, the process by which new information is incorporated into a stock’s price, is driven by trading activity
among buyers and sellers. This takes place at great speed and continues to get faster.
• Due to its relatively low turnover and small size compared to active strategies, trading driven by index investing plays
a small role in the price discovery process for individual stocks.
• For every $1 of US equity trades driven by index strategies, managers seeking active returns (in excess of
benchmark) trade approximately $22.9
• The trading of ETF shares on exchanges in the secondary market does not directly drive buying and selling of the
underlying stocks. Purchases and sales of stocks driven by the ETF creation and redemption process account for
only 5% of all US stock market trading.10
• However, ETFs contribute to price discovery in two important ways:
• For example, trading in the US of ETFs invested in international stocks aids price discovery when the domestic
markets are closed.
• Trading of ETFs is a way to express views and contribute to the valuation of sectors, regions or asset classes.
6. Academics continue to argue each side of the debate around index investing and common ownership. Given
the early stage of research in this area, policy proposals are premature.
• Some recent academic literature on common ownership has sought to link asset managers and index investing with
negative outcomes for consumers, including higher prices for goods and services. Some authors have gone further
in proposing policy measures. However, we believe that these theories rest on some fundamental misconceptions,
and do not provide a plausible causal explanation.
• A growing number of more recent academic papers challenge the assumptions, methodology, and conclusions of the
original academic work on this topic, as part of a robust academic dialogue.
• As with all academic theories, it takes time to test hypotheses and arrive at a conclusion. Given the preliminary stage
of this work and the conflicting conclusions, premature policy measures could do more harm than good.
GR0917G-268626-801480
The active-index investment continuum:
Not a binary choice
Differentiating between active and index strategies is often a
useful shorthand, and indeed, we use this broad distinction
throughout this paper. However, whereas much of the
current dialogue pitches active and index investment
strategies against each other as opposites, the investment
landscape is in practice more nuanced. This is important to
establish at the outset, as the role of any of these investment
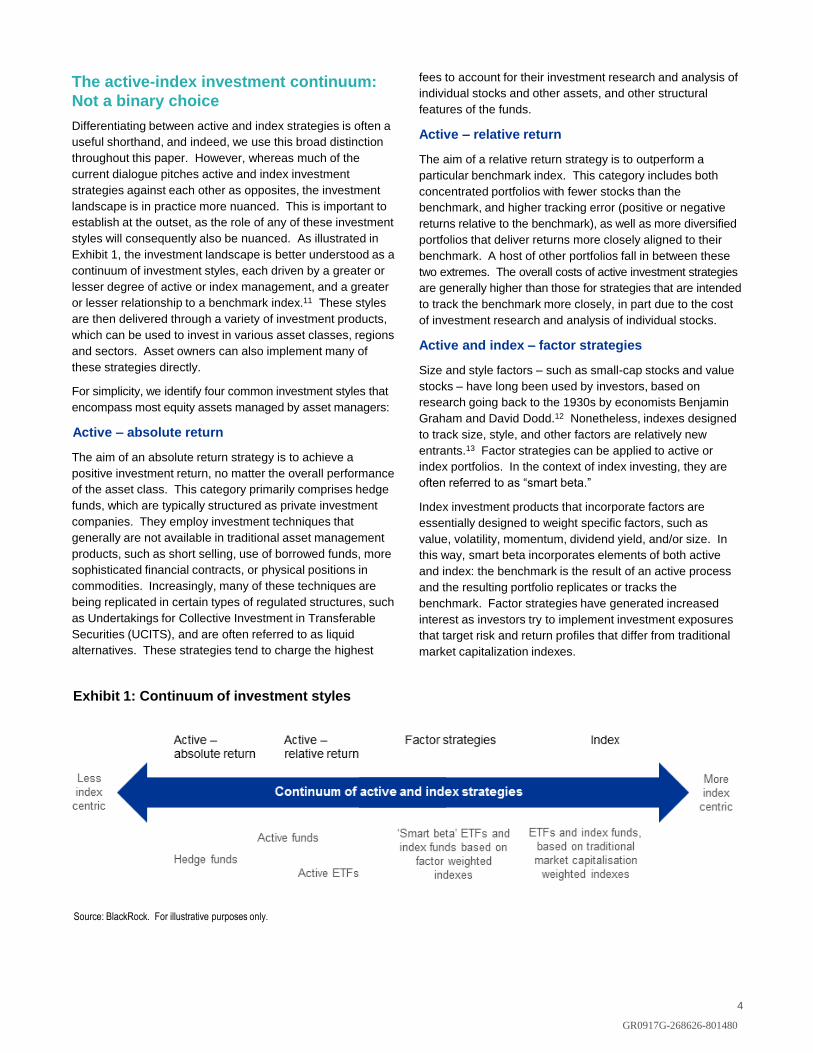
styles will consequently also be nuanced. As illustrated in
Exhibit 1, the investment landscape is better understood as a
continuum of investment styles, each driven by a greater or
lesser degree of active or index management, and a greater
or lesser relationship to a benchmark index.11 These styles
are then delivered through a variety of investment products,
which can be used to invest in various asset classes, regions
and sectors. Asset owners can also implement many of
these strategies directly.
For simplicity, we identify four common investment styles that
encompass most equity assets managed by asset managers:
Active – absolute return
The aim of an absolute return strategy is to achieve a
positive investment return, no matter the overall performance
of the asset class. This category primarily comprises hedge
funds, which are typically structured as private investment
companies. They employ investment techniques that
generally are not available in traditional asset management
products, such as short selling, use of borrowed funds, more
sophisticated financial contracts, or physical positions in
commodities. Increasingly, many of these techniques are
being replicated in certain types of regulated structures, such
as Undertakings for Collective Investment in Transferable
Securities (UCITS), and are often referred to as liquid
alternatives. These strategies tend to charge the highest
fees to account for their investment research and analysis of
individual stocks and other assets, and other structural
features of the funds.
Active – relative return
The aim of a relative return strategy is to outperform a
particular benchmark index. This category includes both
concentrated portfolios with fewer stocks than the
benchmark, and higher tracking error (positive or negative
returns relative to the benchmark), as well as more diversified
portfolios that deliver returns more closely aligned to their
benchmark. A host of other portfolios fall in between these
two extremes. The overall costs of active investment strategies
are generally higher than those for strategies that are intended
to track the benchmark more closely, in part due to the cost
of investment research and analysis of individual stocks.
Active and index – factor strategies
Size and style factors – such as small-cap stocks and value
stocks – have long been used by investors, based on
research going back to the 1930s by economists Benjamin
Graham and David Dodd.12 Nonetheless, indexes designed
to track size, style, and other factors are relatively new
entrants.13 Factor strategies can be applied to active or
index portfolios. In the context of index investing, they are
often referred to as “smart beta.”
Index investment products that incorporate factors are
essentially designed to weight specific factors, such as
value, volatility, momentum, dividend yield, and/or size. In
this way, smart beta incorporates elements of both active
and index: the benchmark is the result of an active process
and the resulting portfolio replicates or tracks the
benchmark. Factor strategies have generated increased
interest as investors try to implement investment exposures
that target risk and return profiles that differ from traditional
market capitalization indexes.
4
Source: BlackRock. For illustrative purposes only.
Exhibit 1: Continuum of investment styles
GR0917G-268626-801480
Investment styles in perspective: How big
is index investing?
Investment styles can be expressed through a variety of
vehicles, including hedge funds, active and index funds,
separate accounts, and CIFs. When considering the
popularity of one style over another, we must first address
the practical reality that, while some types of asset
management data are relatively easy to obtain and verify,
data for which there is no definitive public source can only be
estimated. Sizing different investment styles serves as an
example of this challenge.
Commentators often use data on index funds to draw
conclusions about the equity market as a whole. However,
this extrapolation is incomplete as index funds represent only
a subset of possible ways to invest in equity markets.
Commentators also tend to focus on assets under
management (AUM) – that is, the amount of capital
managed according to one style or another – as a way to
measure index investing relative to other investment styles.
The AUM of one investment style over another provides
some insights regarding investor style preferences, but it
does not tell us about the amount of stock trading it drives, or
how much of the total stock market is owned or transacted
by a given investment style. Moreover, discussion of active
and index AUM often overlooks the fact that the majority of
global equity assets are owned and managed by individual
owners directly (institutions or individual investors), rather
than managed on their behalf by external asset managers.
Instead, to understand the true footprint of market
participation, we analyze the percentage and dollar value of
total equity market capitalization owned and traded by a given
investment style by product type or ownership structure.
xxxx
5
A look at the development of indexes and index investments
Financial indexes have become indispensable parts of the capital markets and investment process. They are used for myriad
purposes: tracking the performance of markets or sectors; measuring portfolio manager skill versus a benchmark; as building
blocks for portfolios; and, as key inputs to stock price discovery in global markets.
In the 1970s, asset managers created investment products that tracked the stocks and performance of financial indexes in the
form of separately managed accounts and index funds. This development was based on concepts rooted in the Efficient
Market Hypothesis developed by economists including William Sharpe, John Lintner, Eugene Fama, and Paul Samuelson,15
and transformd financial indexes from information to investments.
In the 1980’s, stock exchanges and broker-dealers introduced stock index futures – capital markets contracts that provide
investment exposure to an index of stocks. At that time, some commentators contended that stock index futures would
dominate capital markets, impairing rather than improving them.
Today, the growth of index investing, chiefly via ETFs, is not only significant, but has also increased in 2016 and 2017.16 This
has catalysed new questions about index investing and the ownership of company stock, and renewed those questions posed
in the early years of index markets regarding the impact of index investing on efficient price formation for stocks.
Index strategies
This category is sometimes referred to as “index investing”;
however, this label may give the false impression of a fully
automated approach to investment management. These
strategies do seek to track the composition and performance
of an index closely, but require specialist portfolio
management expertise to do so.
Index strategies are offered in various product structures,
including index funds,14 collective investment funds (CIFs)
and separate accounts. Index providers and sponsors of
index funds generally look to construct and track
benchmarks that are (i) transparent, (ii) investable and (iii)
strictly rules-based.
• Transparent means that the rules of the index, its risk-
return profile, and the constituents are disclosed.
• Investable means that a material amount of capital can be
invested in the index constituents and the index’s
published return can be tracked.
• Strictly rules-based means that no portfolio manager
intervenes in determining the investment universe and
holdings of the fund (away from managing the
minimization of tracking error, transaction costs or other
restrictions). The portfolio management process for index
investments does not rely on fundamental analysis of
individual stocks and maintains economies of scale that
tend to facilitate lower expense ratios.
Having defined the continuum of investment styles that form
the foundation of this debate, we next examine each in
context, including their relative size and adoption.
GR0917G-268626-801480
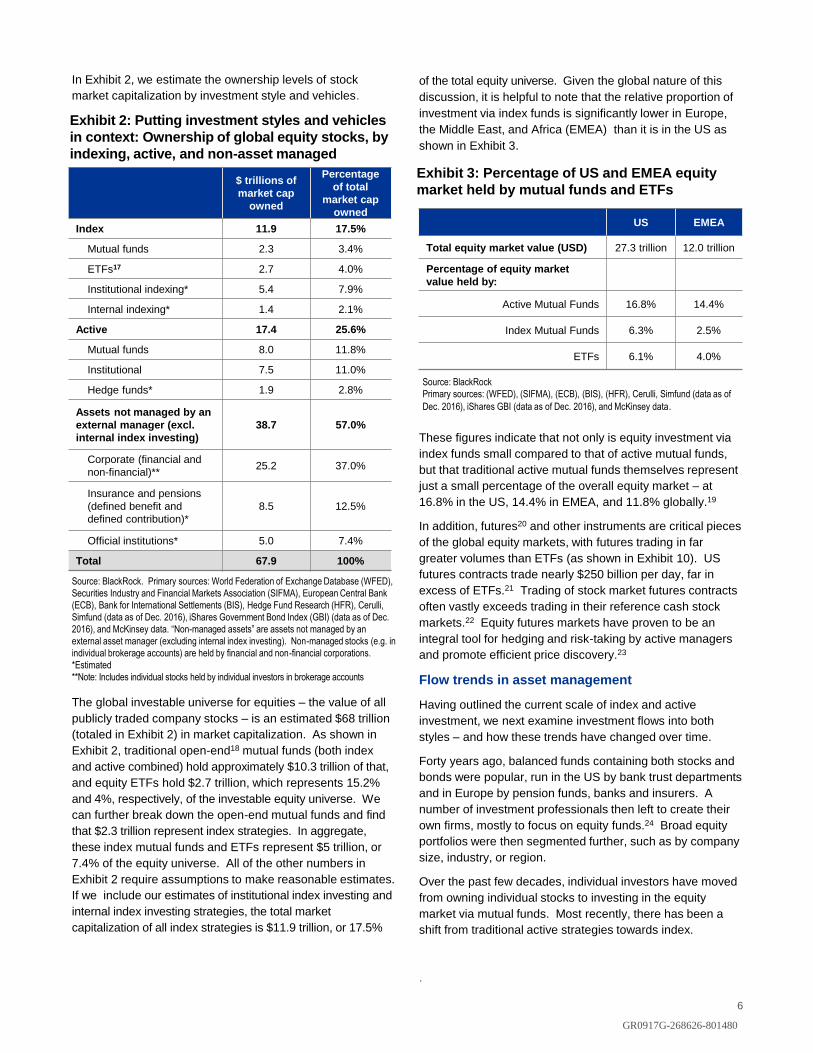
In Exhibit 2, we estimate the ownership levels of stock
market capitalization by investment style and vehicles.
The global investable universe for equities – the value of all
publicly traded company stocks – is an estimated $68 trillion
(totaled in Exhibit 2) in market capitalization. As shown in
Exhibit 2, traditional open-end18 mutual funds (both index
and active combined) hold approximately $10.3 trillion of that,
and equity ETFs hold $2.7 trillion, which represents 15.2%
and 4%, respectively, of the investable equity universe. We
can further break down the open-end mutual funds and find
that $2.3 trillion represent index strategies. In aggregate,
these index mutual funds and ETFs represent $5 trillion, or
7.4% of the equity universe. All of the other numbers in
Exhibit 2 require assumptions to make reasonable estimates.
If we include our estimates of institutional index investing and
internal index investing strategies, the total market
capitalization of all index strategies is $11.9 trillion, or 17.5%
of the total equity universe. Given the global nature of this
discussion, it is helpful to note that the relative proportion of
investment via index funds is significantly lower in Europe,
the Middle East, and Africa (EMEA) than it is in the US as
shown in Exhibit 3.
These figures indicate that not only is equity investment via
index funds small compared to that of active mutual funds,
but that traditional active mutual funds themselves represent
just a small percentage of the overall equity market – at
16.8% in the US, 14.4% in EMEA, and 11.8% globally.19
In addition, futures20 and other instruments are critical pieces
of the global equity markets, with futures trading in far
greater volumes than ETFs (as shown in Exhibit 10). US
futures contracts trade nearly $250 billion per day, far in
excess of ETFs.21 Trading of stock market futures contracts
often vastly exceeds trading in their reference cash stock
markets.22 Equity futures markets have proven to be an
integral tool for hedging and risk-taking by active managers
and promote efficient price discovery.23
Flow trends in asset management
Having outlined the current scale of index and active
investment, we next examine investment flows into both
styles – and how these trends have changed over time.
Forty years ago, balanced funds containing both stocks and
bonds were popular, run in the US by bank trust departments
and in Europe by pension funds, banks and insurers. A
number of investment professionals then left to create their
own firms, mostly to focus on equity funds.24 Broad equity
portfolios were then segmented further, such as by company
size, industry, or region.
Over the past few decades, individual investors have moved
from owning individual stocks to investing in the equity
market via mutual funds. Most recently, there has been a
shift from traditional active strategies towards index.
.
6
$ trillions of
market cap
owned
Percentage
of total
market cap
owned
Index 11.9 17.5%
Mutual funds 2.3 3.4%
ETFs17 2.7 4.0%
Institutional indexing* 5.4 7.9%
Internal indexing* 1.4 2.1%
Active 17.4 25.6%
Mutual funds 8.0 11.8%
Institutional 7.5 11.0%
Hedge funds* 1.9 2.8%
Assets not managed by an
external manager (excl.
internal index investing)
38.7 57.0%
Corporate (financial and
non-financial)**25.2 37.0%
Insurance and pensions
(defined benefit and
defined contribution)*
8.5 12.5%
Official institutions* 5.0 7.4%
Total 67.9 100%
Exhibit 2: Putting investment styles and vehicles
in context: Ownership of global equity stocks, by
indexing, active, and non-asset managed
Source: BlackRock. Primary sources: World Federation of Exchange Database (WFED),
Securities Industry and Financial Markets Association (SIFMA), European Central Bank
(ECB), Bank for International Settlements (BIS), Hedge Fund Research (HFR), Cerulli,
Simfund (data as of Dec. 2016), iShares Government Bond Index (GBI) (data as of Dec.
2016), and McKinsey data. “Non-managed assets” are assets not managed by an
external asset manager (excluding internal index investing). Non-managed stocks (e.g. in
individual brokerage accounts) are held by financial and non-financial corporations.
*Estimated
**Note: Includes individual stocks held by individual investors in brokerage accounts
US EMEA
Total equity market value (USD) 27.3 trillion 12.0 trillion
Percentage of equity market
value held by:
Active Mutual Funds 16.8% 14.4%
Index Mutual Funds 6.3% 2.5%
ETFs 6.1% 4.0%
Source: BlackRock
Primary sources: (WFED), (SIFMA), (ECB), (BIS), (HFR), Cerulli, Simfund (data as of
Dec. 2016), iShares GBI (data as of Dec. 2016), and McKinsey data.
Exhibit 3: Percentage of US and EMEA equity
market held by mutual funds and ETFs
GR0917G-268626-801480
Value proposition of index investment strategies
Numerous studies have examined the performance of
various active strategies. While different mutual funds and
different sectors of the market have each had different
experiences, quite a few active investment products have
failed to beat their benchmarks, especially when fees are
taken into consideration. In recent years, many hedge funds
have similarly disappointed their investors. Not surprisingly,
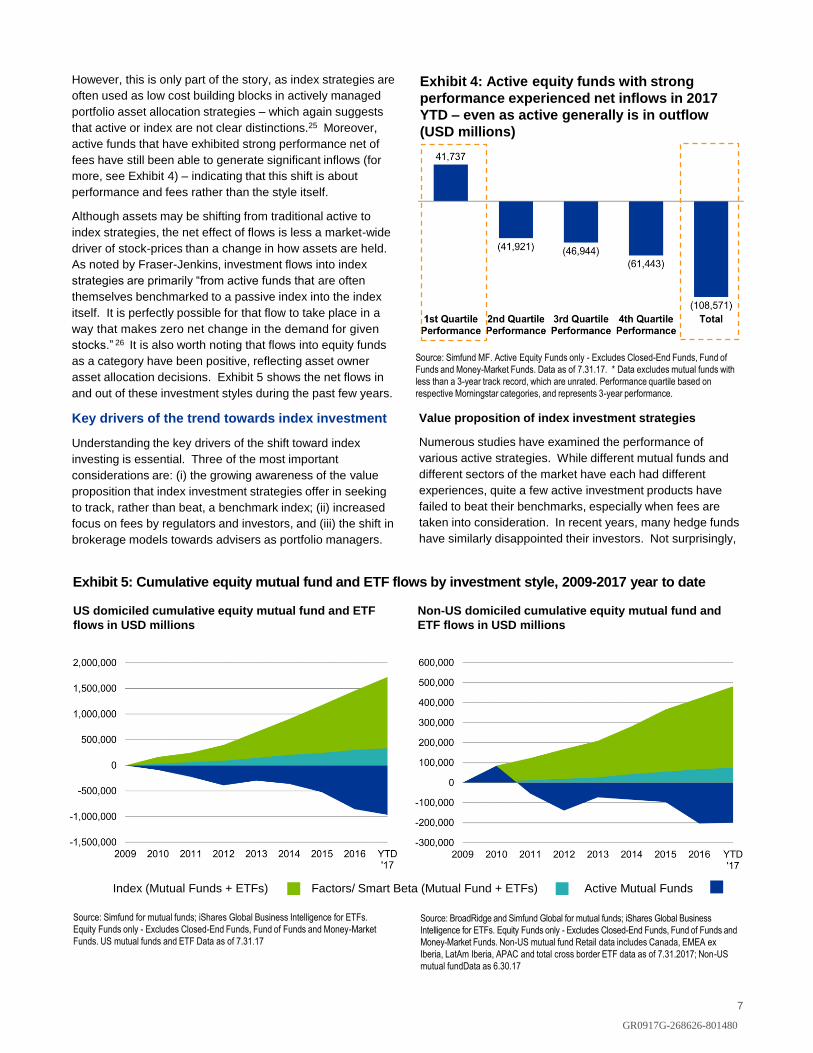
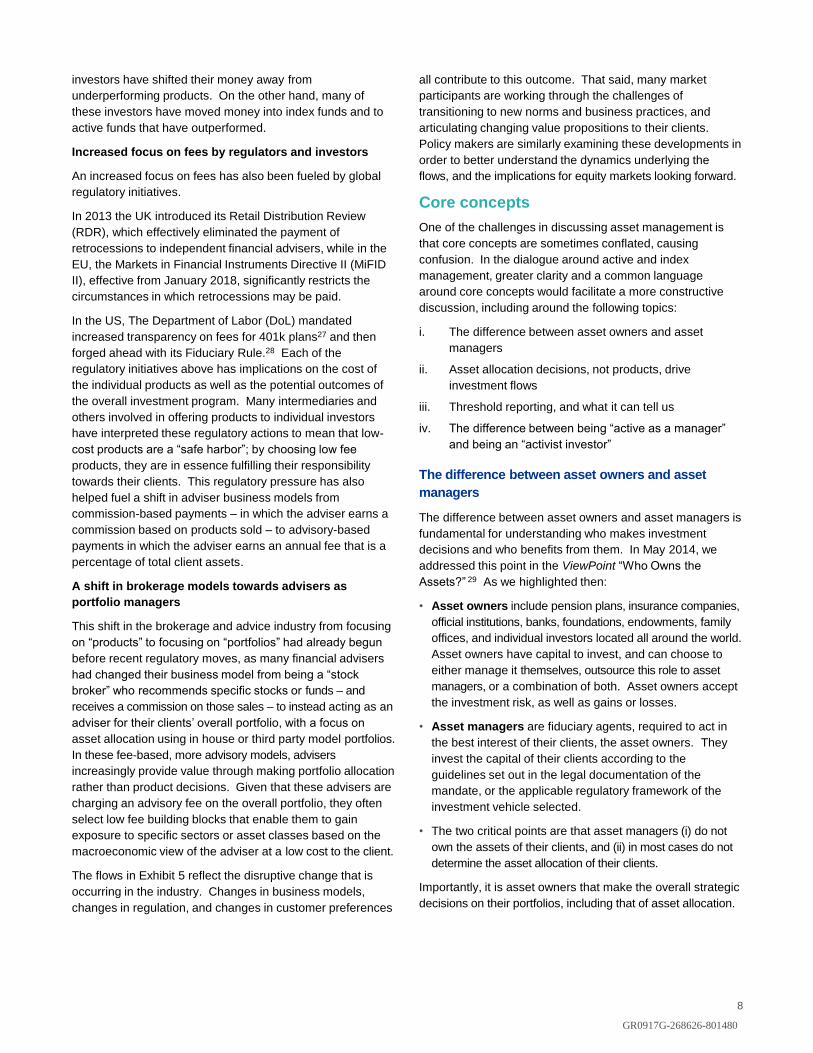
However, this is only part of the story, as index strategies are
often used as low cost building blocks in actively managed
portfolio asset allocation strategies – which again suggests
that active or index are not clear distinctions.25 Moreover,
active funds that have exhibited strong performance net of
fees have still been able to generate significant inflows (for
more, see Exhibit 4) – indicating that this shift is about
performance and fees rather than the style itself.
Although assets may be shifting from traditional active to
index strategies, the net effect of flows is less a market-wide
driver of stock-prices than a change in how assets are held.
As noted by Fraser-Jenkins, investment flows into index
strategies are primarily “from active funds that are often
themselves benchmarked to a passive index into the index
itself. It is perfectly possible for that flow to take place in a
way that makes zero net change in the demand for given
stocks.” 26 It is also worth noting that flows into equity funds
as a category have been positive, reflecting asset owner
asset allocation decisions. Exhibit 5 shows the net flows in
and out of these investment styles during the past few years.
Key drivers of the trend towards index investment
Understanding the key drivers of the shift toward index
investing is essential. Three of the most important
considerations are: (i) the growing awareness of the value
proposition that index investment strategies offer in seeking
to track, rather than beat, a benchmark index; (ii) increased
focus on fees by regulators and investors, and (iii) the shift in
brokerage models towards advisers as portfolio managers.
7
Source: Simfund for mutual funds; iShares Global Business Intelligence for ETFs.
Equity Funds only - Excludes Closed-End Funds, Fund of Funds and Money-Market
Funds. US mutual funds and ETF Data as of 7.31.17
Source: BroadRidge and Simfund Global for mutual funds; iShares Global Business
Intelligence for ETFs. Equity Funds only - Excludes Closed-End Funds, Fund of Funds and
Money-Market Funds. Non-US mutual fund Retail data includes Canada, EMEA ex
Iberia, LatAm Iberia, APAC and total cross border ETF data as of 7.31.2017; Non-US
mutual fundData as 6.30.17
Exhibit 5: Cumulative equity mutual fund and ETF flows by investment style, 2009-2017 year to date
US domiciled cumulative equity mutual fund and ETF
flows in USD millions
Non-US domiciled cumulative equity mutual fund and
ETF flows in USD millions
Index (Mutual Funds + ETFs) Factors/ Smart Beta (Mutual Fund + ETFs) Active Mutual Funds
Source: Simfund MF. Active Equity Funds only - Excludes Closed-End Funds, Fund of
Funds and Money-Market Funds. Data as of 7.31.17. * Data excludes mutual funds with
less than a 3-year track record, which are unrated. Performance quartile based on
respective Morningstar categories, and represents 3-year performance.
Exhibit 4: Active equity funds with strong
performance experienced net inflows in 2017
YTD – even as active generally is in outflow
(USD millions)
GR0917G-268626-801480
investors have shifted their money away from
underperforming products. On the other hand, many of
these investors have moved money into index funds and to
active funds that have outperformed.
Increased focus on fees by regulators and investors
An increased focus on fees has also been fueled by global
regulatory initiatives.
In 2013 the UK introduced its Retail Distribution Review
(RDR), which effectively eliminated the payment of
retrocessions to independent financial advisers, while in the
EU, the Markets in Financial Instruments Directive II (MiFID
II), effective from January 2018, significantly restricts the
circumstances in which retrocessions may be paid.
In the US, The Department of Labor (DoL) mandated
increased transparency on fees for 401k plans27 and then
forged ahead with its Fiduciary Rule.28 Each of the
regulatory initiatives above has implications on the cost of
the individual products as well as the potential outcomes of
the overall investment program. Many intermediaries and
others involved in offering products to individual investors
have interpreted these regulatory actions to mean that low-
cost products are a “safe harbor”; by choosing low fee
products, they are in essence fulfilling their responsibility
towards their clients. This regulatory pressure has also
helped fuel a shift in adviser business models from
commission-based payments – in which the adviser earns a
commission based on products sold – to advisory-based
payments in which the adviser earns an annual fee that is a
percentage of total client assets.
A shift in brokerage models towards advisers as
portfolio managers
This shift in the brokerage and advice industry from focusing
on “products” to focusing on “portfolios” had already begun
before recent regulatory moves, as many financial advisers
had changed their business model from being a “stock
broker” who recommends specific stocks or funds – and
receives a commission on those sales – to instead acting as an
adviser for their clients’ overall portfolio, with a focus on
asset allocation using in house or third party model portfolios.
In these fee-based, more advisory models, advisers
increasingly provide value through making portfolio allocation
rather than product decisions. Given that these advisers are
charging an advisory fee on the overall portfolio, they often
select low fee building blocks that enable them to gain
exposure to specific sectors or asset classes based on the
macroeconomic view of the adviser at a low cost to the client.
The flows in Exhibit 5 reflect the disruptive change that is
occurring in the industry. Changes in business models,
changes in regulation, and changes in customer preferences
all contribute to this outcome. That said, many market
participants are working through the challenges of
transitioning to new norms and business practices, and
articulating changing value propositions to their clients.
Policy makers are similarly examining these developments in
order to better understand the dynamics underlying the
flows, and the implications for equity markets looking forward.
Core concepts
One of the challenges in discussing asset management is
that core concepts are sometimes conflated, causing
confusion. In the dialogue around active and index
management, greater clarity and a common language
around core concepts would facilitate a more constructive
discussion, including around the following topics:
i. The difference between asset owners and asset
managers
ii. Asset allocation decisions, not products, drive
investment flows
iii. Threshold reporting, and what it can tell us
iv. The difference between being “active as a manager”
and being an “activist investor”
The difference between asset owners and asset
managers
The difference between asset owners and asset managers is
fundamental for understanding who makes investment
decisions and who benefits from them. In May 2014, we
addressed this point in the ViewPoint “Who Owns the
Assets?” 29 As we highlighted then:
• Asset owners include pension plans, insurance companies,
official institutions, banks, foundations, endowments, family
offices, and individual investors located all around the world.
Asset owners have capital to invest, and can choose to
either manage it themselves, outsource this role to asset
managers, or a combination of both. Asset owners accept
the investment risk, as well as gains or losses.
• Asset managers are fiduciary agents, required to act in
the best interest of their clients, the asset owners. They
invest the capital of their clients according to the
guidelines set out in the legal documentation of the
mandate, or the applicable regulatory framework of the
investment vehicle selected.
• The two critical points are that asset managers (i) do not
own the assets of their clients, and (ii) in most cases do not
determine the asset allocation of their clients.
Importantly, it is asset owners that make the overall strategic
decisions on their portfolios, including that of asset allocation.
8
GR0917G-268626-801480
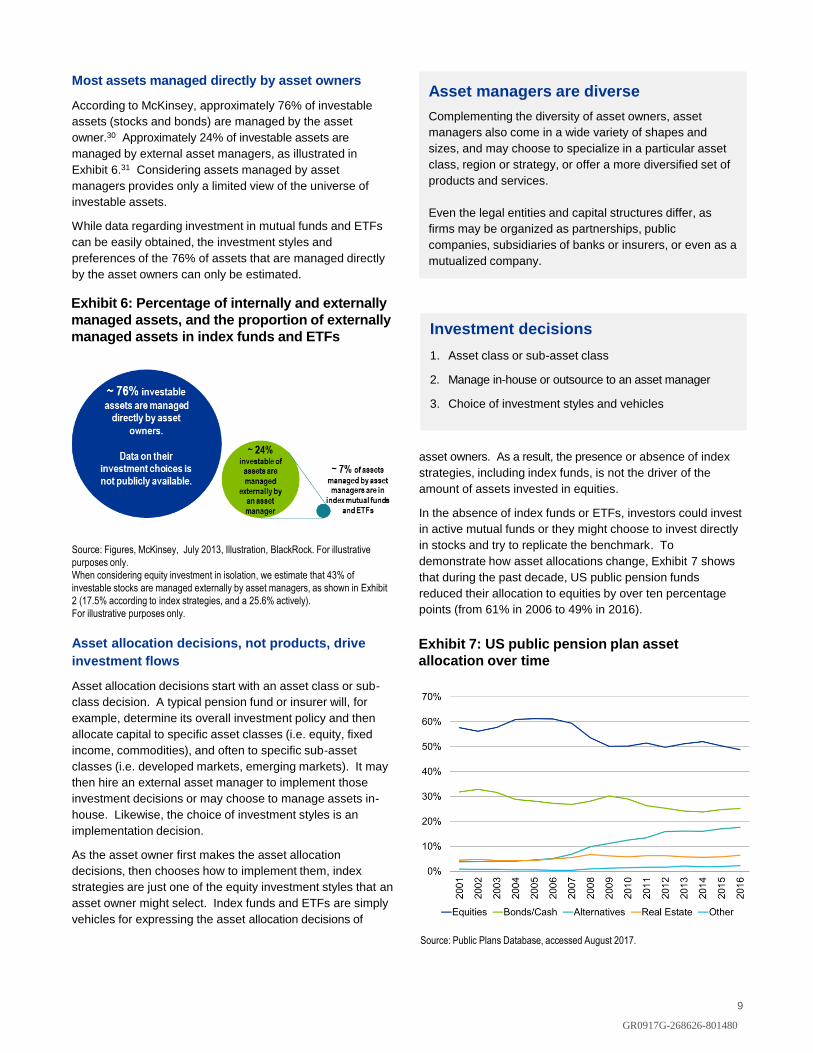
Most assets managed directly by asset owners
According to McKinsey, approximately 76% of investable
assets (stocks and bonds) are managed by the asset
owner.30 Approximately 24% of investable assets are
managed by external asset managers, as illustrated in
Exhibit 6.31 Considering assets managed by asset
managers provides only a limited view of the universe of
investable assets.
While data regarding investment in mutual funds and ETFs
can be easily obtained, the investment styles and
preferences of the 76% of assets that are managed directly
by the asset owners can only be estimated.
Asset allocation decisions, not products, drive
investment flows
Asset allocation decisions start with an asset class or sub-
class decision. A typical pension fund or insurer will, for
example, determine its overall investment policy and then
allocate capital to specific asset classes (i.e. equity, fixed
income, commodities), and often to specific sub-asset
classes (i.e. developed markets, emerging markets). It may
then hire an external asset manager to implement those
investment decisions or may choose to manage assets in-
house. Likewise, the choice of investment styles is an
implementation decision.
As the asset owner first makes the asset allocation
decisions, then chooses how to implement them, index
strategies are just one of the equity investment styles that an
asset owner might select. Index funds and ETFs are simply
vehicles for expressing the asset allocation decisions of
When institutional asset owners choose to hire an external
asset manager, this is usually executed through an
investment management agreement that sets out investment
guidelines. These guidelines specify the investment
objectives and the constraints associated with the mandate,
and typically identify a performance benchmark, the universe
of eligible investments, and possibly the target performance
and/or acceptable tracking error. For most retail clients,
investment guidelines are specified in fund documents.
asset owners. As a result, the presence or absence of index
strategies, including index funds, is not the driver of the
amount of assets invested in equities.
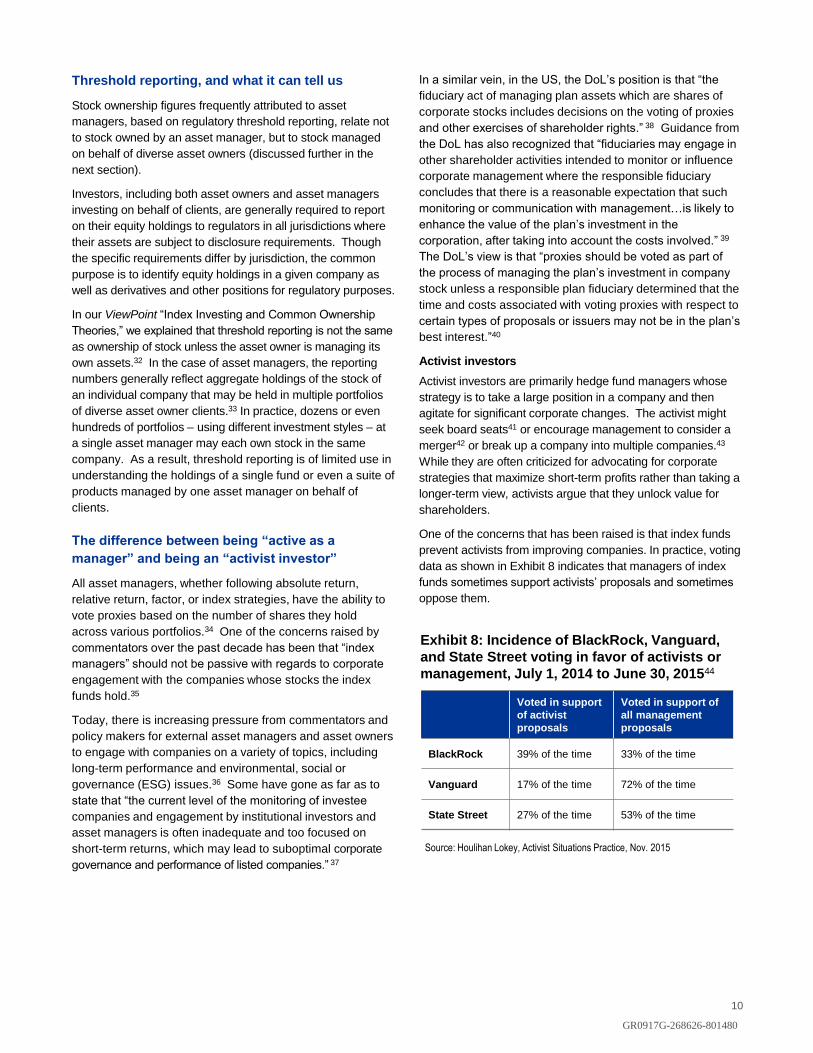
In the absence of index funds or ETFs, investors could invest
in active mutual funds or they might choose to invest directly
in stocks and try to replicate the benchmark. To
demonstrate how asset allocations change, Exhibit 7 shows
that during the past decade, US public pension funds
reduced their allocation to equities by over ten percentage
points (from 61% in 2006 to 49% in 2016).
9
Investment decisions
1. Asset class or sub-asset class
2. Manage in-house or outsource to an asset manager
3. Choice of investment styles and vehicles
Asset managers are diverse
Complementing the diversity of asset owners, asset
managers also come in a wide variety of shapes and
sizes, and may choose to specialize in a particular asset
class, region or strategy, or offer a more diversified set of
products and services.
Even the legal entities and capital structures differ, as
firms may be organized as partnerships, public
companies, subsidiaries of banks or insurers, or even as a
mutualized company.
Source: Figures, McKinsey, July 2013, Illustration, BlackRock. For illustrative
purposes only.
When considering equity investment in isolation, we estimate that 43% of
investable stocks are managed externally by asset managers, as shown in Exhibit
2 (17.5% according to index strategies, and a 25.6% actively).
For illustrative purposes only.
Exhibit 6: Percentage of internally and externally
managed assets, and the proportion of externally
managed assets in index funds and ETFs
Source: Public Plans Database, accessed August 2017.
Exhibit 7: US public pension plan asset
allocation over time
GR0917G-268626-801480
Threshold reporting, and what it can tell us
Stock ownership figures frequently attributed to asset
managers, based on regulatory threshold reporting, relate not
to stock owned by an asset manager, but to stock managed
on behalf of diverse asset owners (discussed further in the
next section).
Investors, including both asset owners and asset managers
investing on behalf of clients, are generally required to report
on their equity holdings to regulators in all jurisdictions where
their assets are subject to disclosure requirements. Though
the specific requirements differ by jurisdiction, the common
purpose is to identify equity holdings in a given company as
well as derivatives and other positions for regulatory purposes.
In our ViewPoint “Index Investing and Common Ownership
Theories,” we explained that threshold reporting is not the same
as ownership of stock unless the asset owner is managing its
own assets.32 In the case of asset managers, the reporting
numbers generally reflect aggregate holdings of the stock of
an individual company that may be held in multiple portfolios
of diverse asset owner clients.33 In practice, dozens or even
hundreds of portfolios – using different investment styles – at
a single asset manager may each own stock in the same
company. As a result, threshold reporting is of limited use in
understanding the holdings of a single fund or even a suite of
products managed by one asset manager on behalf of
clients.
The difference between being “active as a
manager” and being an “activist investor”
All asset managers, whether following absolute return,
relative return, factor, or index strategies, have the ability to
vote proxies based on the number of shares they hold
across various portfolios.34 One of the concerns raised by
commentators over the past decade has been that “index
managers” should not be passive with regards to corporate
engagement with the companies whose stocks the index
funds hold.35
Today, there is increasing pressure from commentators and
policy makers for external asset managers and asset owners
to engage with companies on a variety of topics, including
long-term performance and environmental, social or
governance (ESG) issues.36 Some have gone as far as to
state that “the current level of the monitoring of investee
companies and engagement by institutional investors and
asset managers is often inadequate and too focused on
short-term returns, which may lead to suboptimal corporate
governance and performance of listed companies.” 37
In a similar vein, in the US, the DoL’s position is that “the
fiduciary act of managing plan assets which are shares of
corporate stocks includes decisions on the voting of proxies
and other exercises of shareholder rights.” 38 Guidance from
the DoL has also recognized that “fiduciaries may engage in
other shareholder activities intended to monitor or influence
corporate management where the responsible fiduciary
concludes that there is a reasonable expectation that such
monitoring or communication with management…is likely to
enhance the value of the plan’s investment in the
corporation, after taking into account the costs involved.” 39
The DoL’s view is that “proxies should be voted as part of
the process of managing the plan’s investment in company
stock unless a responsible plan fiduciary determined that the
time and costs associated with voting proxies with respect to
certain types of proposals or issuers may not be in the plan’s
best interest.”40
Activist investors
Activist investors are primarily hedge fund managers whose
strategy is to take a large position in a company and then
agitate for significant corporate changes. The activist might
seek board seats41 or encourage management to consider a
merger42 or break up a company into multiple companies.43
While they are often criticized for advocating for corporate
strategies that maximize short-term profits rather than taking a
longer-term view, activists argue that they unlock value for
shareholders.
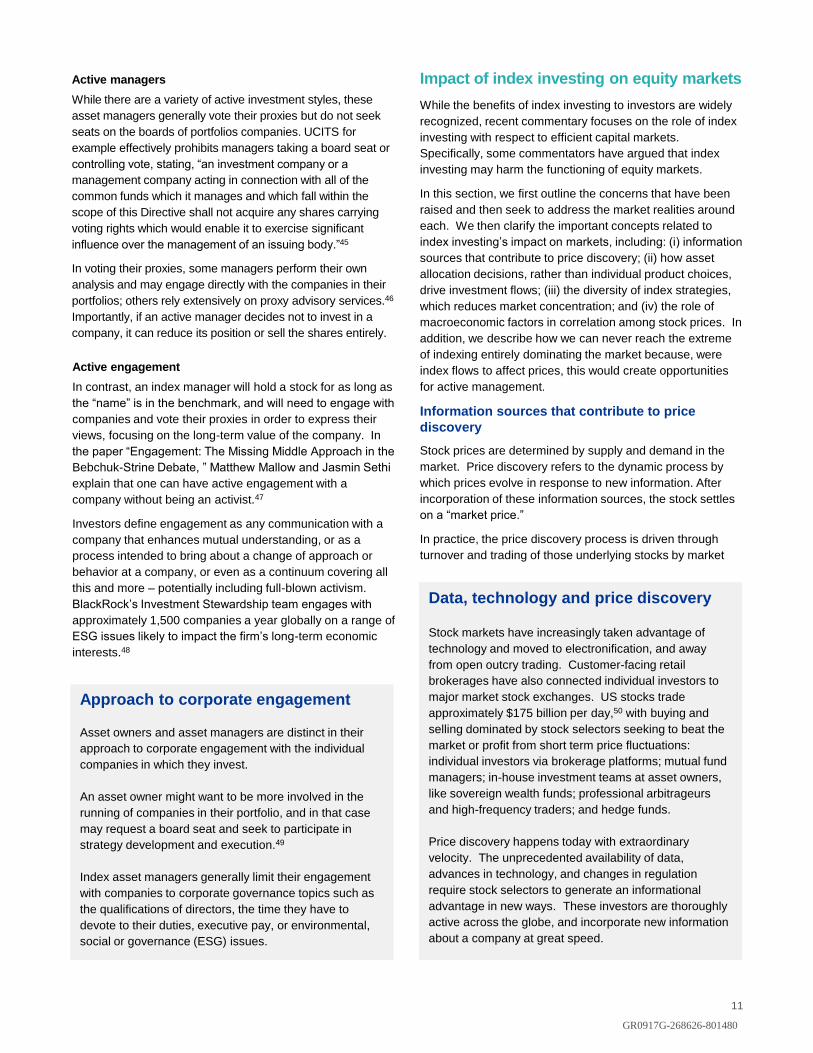
One of the concerns that has been raised is that index funds
prevent activists from improving companies. In practice, voting
data as shown in Exhibit 8 indicates that managers of index
funds sometimes support activists’ proposals and sometimes
oppose them.
10
Source: Houlihan Lokey, Activist Situations Practice, Nov. 2015
Exhibit 8: Incidence of BlackRock, Vanguard,
and State Street voting in favor of activists or
management, July 1, 2014 to June 30, 201544
Voted in support
of activist
proposals
Voted in support of
all management
proposals
BlackRock 39% of the time 33% of the time
Vanguard 17% of the time 72% of the time
State Street 27% of the time 53% of the time
GR0917G-268626-801480
11
Active managers
While there are a variety of active investment styles, these
asset managers generally vote their proxies but do not seek
seats on the boards of portfolios companies. UCITS for
example effectively prohibits managers taking a board seat or
controlling vote, stating, “an investment company or a
management company acting in connection with all of the
common funds which it manages and which fall within the
scope of this Directive shall not acquire any shares carrying
voting rights which would enable it to exercise significant
influence over the management of an issuing body.”45
In voting their proxies, some managers perform their own
analysis and may engage directly with the companies in their
portfolios; others rely extensively on proxy advisory services.46
Importantly, if an active manager decides not to invest in a
company, it can reduce its position or sell the shares entirely.
Active engagement
In contrast, an index manager will hold a stock for as long as
the “name” is in the benchmark, and will need to engage with
companies and vote their proxies in order to express their
views, focusing on the long-term value of the company. In
the paper “Engagement: The Missing Middle Approach in the
Bebchuk-Strine Debate, ” Matthew Mallow and Jasmin Sethi
explain that one can have active engagement with a
company without being an activist.47
Investors define engagement as any communication with a
company that enhances mutual understanding, or as a
process intended to bring about a change of approach or
behavior at a company, or even as a continuum covering all
this and more – potentially including full-blown activism.
BlackRock’s Investment Stewardship team engages with
approximately 1,500 companies a year globally on a range of
ESG issues likely to impact the firm’s long-term economic
interests.48
Approach to corporate engagement
Asset owners and asset managers are distinct in their
approach to corporate engagement with the individual
companies in which they invest.
An asset owner might want to be more involved in the
running of companies in their portfolio, and in that case
may request a board seat and seek to participate in
strategy development and execution.49
Index asset managers generally limit their engagement
with companies to corporate governance topics such as
the qualifications of directors, the time they have to
devote to their duties, executive pay, or environmental,
social or governance (ESG) issues.
Impact of index investing on equity markets
While the benefits of index investing to investors are widely
recognized, recent commentary focuses on the role of index
investing with respect to efficient capital markets.
Specifically, some commentators have argued that index
investing may harm the functioning of equity markets.
In this section, we first outline the concerns that have been
raised and then seek to address the market realities around
each. We then clarify the important concepts related to
index investing’s impact on markets, including: (i) information
sources that contribute to price discovery; (ii) how asset
allocation decisions, rather than individual product choices,
drive investment flows; (iii) the diversity of index strategies,
which reduces market concentration; and (iv) the role of
macroeconomic factors in correlation among stock prices. In
addition, we describe how we can never reach the extreme
of indexing entirely dominating the market because, were
index flows to affect prices, this would create opportunities
for active management.
Information sources that contribute to price
discovery
Stock prices are determined by supply and demand in the
market. Price discovery refers to the dynamic process by
which prices evolve in response to new information. After
incorporation of these information sources, the stock settles
on a “market price.”
In practice, the price discovery process is driven through
turnover and trading of those underlying stocks by market
Data, technology and price discovery
Stock markets have increasingly taken advantage of
technology and moved to electronification, and away
from open outcry trading. Customer-facing retail
brokerages have also connected individual investors to
major market stock exchanges. US stocks trade
approximately $175 billion per day,50 with buying and
selling dominated by stock selectors seeking to beat the
market or profit from short term price fluctuations:
individual investors via brokerage platforms; mutual fund
managers; in-house investment teams at asset owners,
like sovereign wealth funds; professional arbitrageurs
and high-frequency traders; and hedge funds.
Price discovery happens today with extraordinary
velocity. The unprecedented availability of data,
advances in technology, and changes in regulation
require stock selectors to generate an informational
advantage in new ways. These investors are thoroughly
active across the globe, and incorporate new information
about a company at great speed.
GR0917G-268626-801480
12
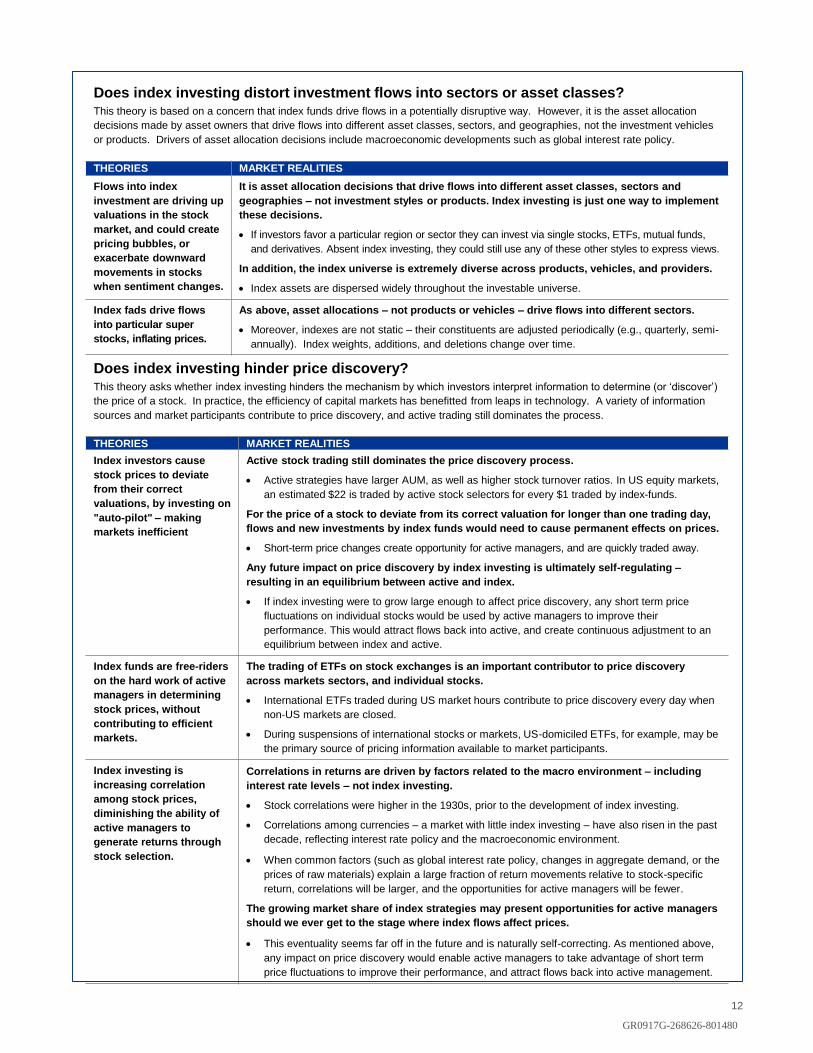
Does index investing distort investment flows into sectors or asset classes?This theory is based on a concern that index funds drive flows in a potentially disruptive way. However, it is the asset allocation
decisions made by asset owners that drive flows into different asset classes, sectors, and geographies, not the investment vehicles
or products. Drivers of asset allocation decisions include macroeconomic developments such as global interest rate policy.
THEORIES MARKET REALITIES
Flows into index
investment are driving up
valuations in the stock
market, and could create
pricing bubbles, or
exacerbate downward
movements in stocks
when sentiment changes.
It is asset allocation decisions that drive flows into different asset classes, sectors and
geographies – not investment styles or products. Index investing is just one way to implement
these decisions.
If investors favor a particular region or sector they can invest via single stocks, ETFs, mutual funds,
and derivatives. Absent index investing, they could still use any of these other styles to express views.
In addition, the index universe is extremely diverse across products, vehicles, and providers.
Index assets are dispersed widely throughout the investable universe.
Index fads drive flows
into particular super
stocks, inflating prices.
As above, asset allocations – not products or vehicles – drive flows into different sectors.
Moreover, indexes are not static – their constituents are adjusted periodically (e.g., quarterly, semi-
annually). Index weights, additions, and deletions change over time.
Does index investing hinder price discovery?This theory asks whether index investing hinders the mechanism by which investors interpret information to determine (or ‘discover’)
the price of a stock. In practice, the efficiency of capital markets has benefitted from leaps in technology. A variety of information
sources and market participants contribute to price discovery, and active trading still dominates the process.
THEORIES MARKET REALITIES
Index investors cause
stock prices to deviate
from their correct
valuations, by investing on
"auto-pilot" – making
markets inefficient
Active stock trading still dominates the price discovery process.
Active strategies have larger AUM, as well as higher stock turnover ratios. In US equity markets,
an estimated $22 is traded by active stock selectors for every $1 traded by index-funds.
For the price of a stock to deviate from its correct valuation for longer than one trading day,
flows and new investments by index funds would need to cause permanent effects on prices.
Short-term price changes create opportunity for active managers, and are quickly traded away.
Any future impact on price discovery by index investing is ultimately self-regulating –
resulting in an equilibrium between active and index.
If index investing were to grow large enough to affect price discovery, any short term price
fluctuations on individual stocks would be used by active managers to improve their
performance. This would attract flows back into active, and create continuous adjustment to an
equilibrium between index and active.
Index funds are free-riders
on the hard work of active
managers in determining
stock prices, without
contributing to efficient
markets.
The trading of ETFs on stock exchanges is an important contributor to price discovery
across markets sectors, and individual stocks.
International ETFs traded during US market hours contribute to price discovery every day when
non-US markets are closed.
During suspensions of international stocks or markets, US-domiciled ETFs, for example, may be
the primary source of pricing information available to market participants.
Index investing is
increasing correlation
among stock prices,
diminishing the ability of
active managers to
generate returns through
stock selection.
Correlations in returns are driven by factors related to the macro environment – including
interest rate levels – not index investing.
Stock correlations were higher in the 1930s, prior to the development of index investing.
Correlations among currencies – a market with little index investing – have also risen in the past
decade, reflecting interest rate policy and the macroeconomic environment.
When common factors (such as global interest rate policy, changes in aggregate demand, or the
prices of raw materials) explain a large fraction of return movements relative to stock-specific
return, correlations will be larger, and the opportunities for active managers will be fewer.
The growing market share of index strategies may present opportunities for active managers
should we ever get to the stage where index flows affect prices.
This eventuality seems far off in the future and is naturally self-correcting. As mentioned above,
any impact on price discovery would enable active managers to take advantage of short term
price fluctuations to improve their performance, and attract flows back into active management.
GR0917G-268626-801480
participants. While some commentators have referred to the
size of assets managed according to index or active
strategies, the most important input to market prices is the
trades of individual stocks, whether by active funds, index
strategies, or individual holders.
Index investing and price discovery in context
Despite its popularity, index investing still plays a relatively
small role in the price discovery process. To put the impact
of index investing on price discovery in context, index funds
represent 7.4%51 of the global equity market, while all index
strategies combined (including institutional index investing
and internal index investing) represent 17.5% of the global
equity market. Moreover, active managers have significantly
higher portfolio turnover ratios than index funds. In Exhibit 9,
we estimate the total amount of stock turned over by active
and index strategies in US equities per year, calculated by
multiplying relative AUM size by their respective turnover
ratios of underlying stocks. When multiplying respective
turnover rates by AUM size, we find that roughly $22 is
traded by active stock selectors for every $1 traded by index
managers.52 Given that trades placed by active stock
selection represent the vast majority of trading activity, active
management is the critical driver of price discovery.
In addition to turnover in individual stocks, several other
equity related transactions contribute important information
to price discovery. These include equity futures, share
issuances, repurchases, individual stock options, and other
relevant market valuations such as private equity.
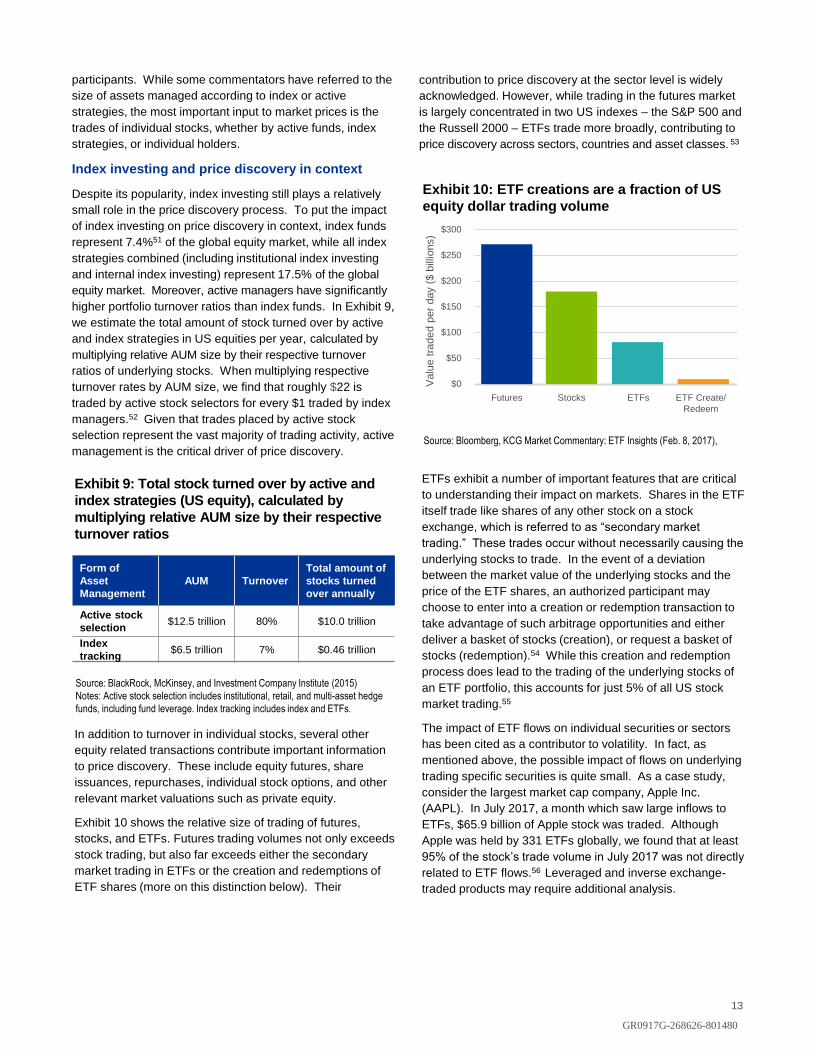
Exhibit 10 shows the relative size of trading of futures,
stocks, and ETFs. Futures trading volumes not only exceeds
stock trading, but also far exceeds either the secondary
market trading in ETFs or the creation and redemptions of
ETF shares (more on this distinction below). Their
13
Source: BlackRock, McKinsey, and Investment Company Institute (2015)
Notes: Active stock selection includes institutional, retail, and multi-asset hedge
funds, including fund leverage. Index tracking includes index and ETFs.
Exhibit 9: Total stock turned over by active and
index strategies (US equity), calculated by
multiplying relative AUM size by their respective
turnover ratios
Form of
Asset
Management
AUM Turnover
Total amount of
stocks turned
over annually
Active stock
selection$12.5 trillion 80% $10.0 trillion
Index
tracking$6.5 trillion 7% $0.46 trillion
Source: Bloomberg, KCG Market Commentary: ETF Insights (Feb. 8, 2017),
Exhibit 10: ETF creations are a fraction of US
equity dollar trading volume
$300
$250
$200
$150
$100
$50
$0Valu
e t
raded p
er
day (
$ b
illio
ns)
Futures Stocks ETFs ETF Create/
Redeem
contribution to price discovery at the sector level is widely
acknowledged. However, while trading in the futures market
is largely concentrated in two US indexes – the S&P 500 and
the Russell 2000 – ETFs trade more broadly, contributing to
price discovery across sectors, countries and asset classes. 53
ETFs exhibit a number of important features that are critical
to understanding their impact on markets. Shares in the ETF
itself trade like shares of any other stock on a stock
exchange, which is referred to as “secondary market
trading.” These trades occur without necessarily causing the
underlying stocks to trade. In the event of a deviation
between the market value of the underlying stocks and the
price of the ETF shares, an authorized participant may
choose to enter into a creation or redemption transaction to
take advantage of such arbitrage opportunities and either
deliver a basket of stocks (creation), or request a basket of
stocks (redemption).54 While this creation and redemption
process does lead to the trading of the underlying stocks of
an ETF portfolio, this accounts for just 5% of all US stock
market trading.55
The impact of ETF flows on individual securities or sectors
has been cited as a contributor to volatility. In fact, as
mentioned above, the possible impact of flows on underlying
trading specific securities is quite small. As a case study,
consider the largest market cap company, Apple Inc.
(AAPL). In July 2017, a month which saw large inflows to
ETFs, $65.9 billion of Apple stock was traded. Although
Apple was held by 331 ETFs globally, we found that at least
95% of the stock’s trade volume in July 2017 was not directly
related to ETF flows.56 Leveraged and inverse exchange-
traded products may require additional analysis.
GR0917G-268626-801480

& Poor’s (S&P). The index providers establish index
inclusion rules and rebalance these indexes periodically
according to the construction rules to reflect changes in the
markets. Indexes are therefore dynamic, not static, and the
stocks included change over time, reflecting the competitive
landscapes that they track. Further, each of these providers
offers a wide range of indexes covering various segments of
the investable universe of stocks. This includes indexes with
a broad market focus, others with a geographic focus, and
still others with a sector-specific focus. Investors can select
the index that best meets their investment needs. The
diversity of index strategies reflects the diversity of the
universe of benchmarks and, more importantly, investor
demand. Exhibit 11 highlights this diversity while focusing
on the most popular regional indexes.
14
Even though ETF trading contributes comparatively little to
the trading of underlying individual stocks, ETFs do
contribute to price discovery in two important ways.57
• International ETFs hold securities that trade in non-US
trading hours: International ETFs traded during US
market hours offer an example of efficient price discovery
of underlying markets everyday when non-US markets are
closed.
• Price discovery at the region, sector or asset class
level: Increasingly, trading of ETFs based on broad
indexes, sectors, styles, countries, and regions has
contributed to price discovery across asset classes. For
example, hedge funds may use ETFs to express views on
the valuation of sectors, i.e. by selling technology and
buying energy. Similarly, were an individual investor to
rebalance from an exposure to US large cap index to the
German DAX index, these ETF trades, which express the
change in allocation by asset owners, would contribute to
regional or country valuations.
Asset allocation decisions – rather than individual
product choices – drive investment flows
The theory that index investing may accelerate investment
flows into or out of certain market segments or specific
stocks misinterprets the nature of investment decisions, the
diversity of asset owners and their objectives, and the
diversity of investable indexes.
Asset allocation comes first
First, as discussed on page 8 in “The difference between
asset owners and asset managers,” the asset allocation
decision starts with an asset class or sub-class decision.
The decision to manage in-house versus outsource, or use a
combination of these approaches, is about the
implementation of the allocation decision. Likewise, the
decision to choose an index strategy versus an active
strategy is an implementation decision. In the absence of
index funds, these asset allocation decisions would still
simply be executed via an alternative means – and we would
see the same result through essentially the same flows into
or out of different asset classes, regions, or sectors.
Index strategies are extremely diverse
Second, the argument that index investing distorts
investment flows or stock prices implicitly assumes that only
a small number of indexes are available and that these
indexes are not sufficiently broad-based. In practice, index
strategies are extremely diverse along multiple dimensions.
There are numerous index providers, including Morgan
Stanley Capital International (MSCI), Russell, and Standard
GR0917G-268626-801480
Exhibit 11: Most popular single country/regional
indexes (by amount of index assets benchmarked to it)
Region Index
EMEA
SIX Swiss Performance Index
Financial Times Stock Exchange (FTSE) All-Share
Morgan Stanley Capital International (MSCI) Europe
Financial Times Stock Exchange (FTSE) 350
Morgan Stanley Capital International (MSCI) EMU
Euro STOXX 50
US
Standard & Poor's (S&P) 500
Center for Research in Security Prices (CRSP) US
Total Market
Standard & Poor's (S&P) MidCap 400
CRSP US Mid Cap
CRSP US Small Cap
MSCI US REIT
APAC
Nihon Keizai Shimbun (Nikkei) 225
Tokyo Stock Price (TOPIX) Index
Hang Seng (HSI)
CSI 300
S&P/ASX 300
KRX KOSPI 200 Korea
Source: Morningstar, as at end of December 2016. The popularity of the equity
index is calculated on the basis of the index fund (index funds) assets tracking
those indexes in each of the three selected regions, in USD.
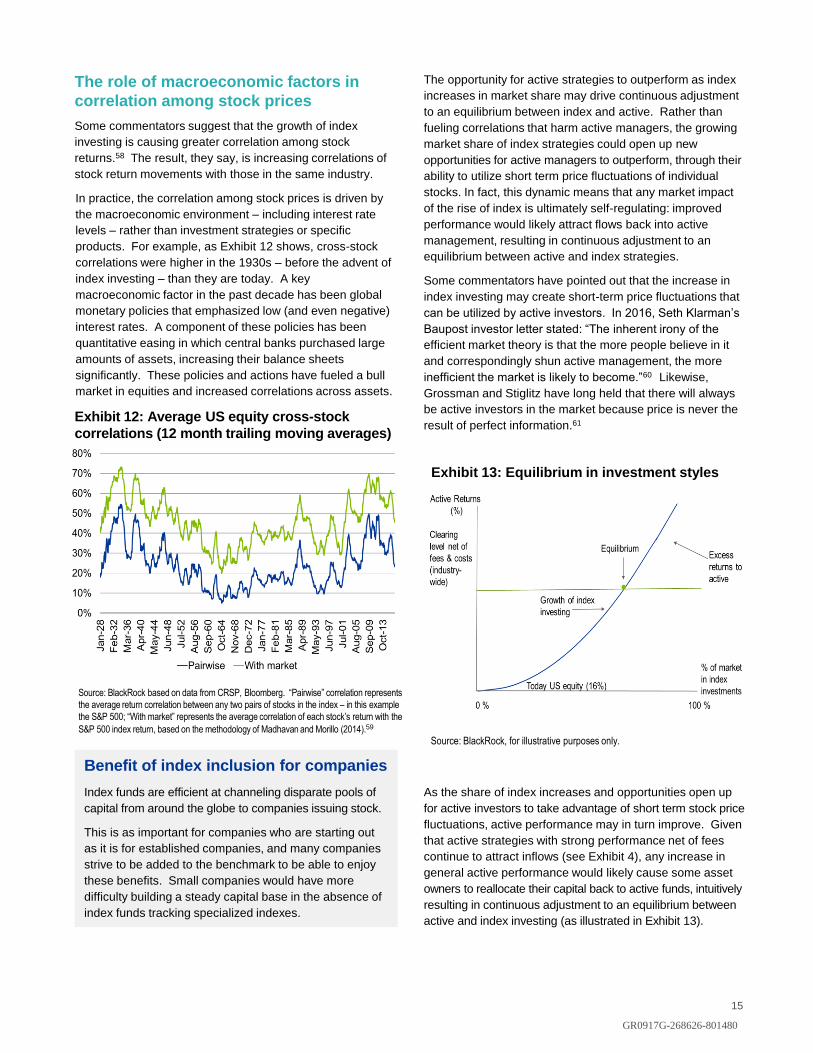
The role of macroeconomic factors in
correlation among stock prices
Some commentators suggest that the growth of index
investing is causing greater correlation among stock
returns.58 The result, they say, is increasing correlations of
stock return movements with those in the same industry.
In practice, the correlation among stock prices is driven by
the macroeconomic environment – including interest rate
levels – rather than investment strategies or specific
products. For example, as Exhibit 12 shows, cross-stock
correlations were higher in the 1930s – before the advent of
index investing – than they are today. A key
macroeconomic factor in the past decade has been global
monetary policies that emphasized low (and even negative)
interest rates. A component of these policies has been
quantitative easing in which central banks purchased large
amounts of assets, increasing their balance sheets
significantly. These policies and actions have fueled a bull
market in equities and increased correlations across assets.
15
Source: BlackRock based on data from CRSP, Bloomberg. “Pairwise” correlation represents
the average return correlation between any two pairs of stocks in the index – in this example
the S&P 500; “With market” represents the average correlation of each stock’s return with the
S&P 500 index return, based on the methodology of Madhavan and Morillo (2014).59
Exhibit 12: Average US equity cross-stock
correlations (12 month trailing moving averages)
Benefit of index inclusion for companies
Index funds are efficient at channeling disparate pools of
capital from around the globe to companies issuing stock.
This is as important for companies who are starting out
as it is for established companies, and many companies
strive to be added to the benchmark to be able to enjoy
these benefits. Small companies would have more
difficulty building a steady capital base in the absence of
index funds tracking specialized indexes.
The opportunity for active strategies to outperform as index
increases in market share may drive continuous adjustment
to an equilibrium between index and active. Rather than
fueling correlations that harm active managers, the growing
market share of index strategies could open up new
opportunities for active managers to outperform, through their
ability to utilize short term price fluctuations of individual
stocks. In fact, this dynamic means that any market impact
of the rise of index is ultimately self-regulating: improved
performance would likely attract flows back into active
management, resulting in continuous adjustment to an
equilibrium between active and index strategies.
Some commentators have pointed out that the increase in
index investing may create short-term price fluctuations that
can be utilized by active investors. In 2016, Seth Klarman’s
Baupost investor letter stated: “The inherent irony of the
efficient market theory is that the more people believe in it
and correspondingly shun active management, the more
inefficient the market is likely to become.”60 Likewise,
Grossman and Stiglitz have long held that there will always
be active investors in the market because price is never the
result of perfect information.61
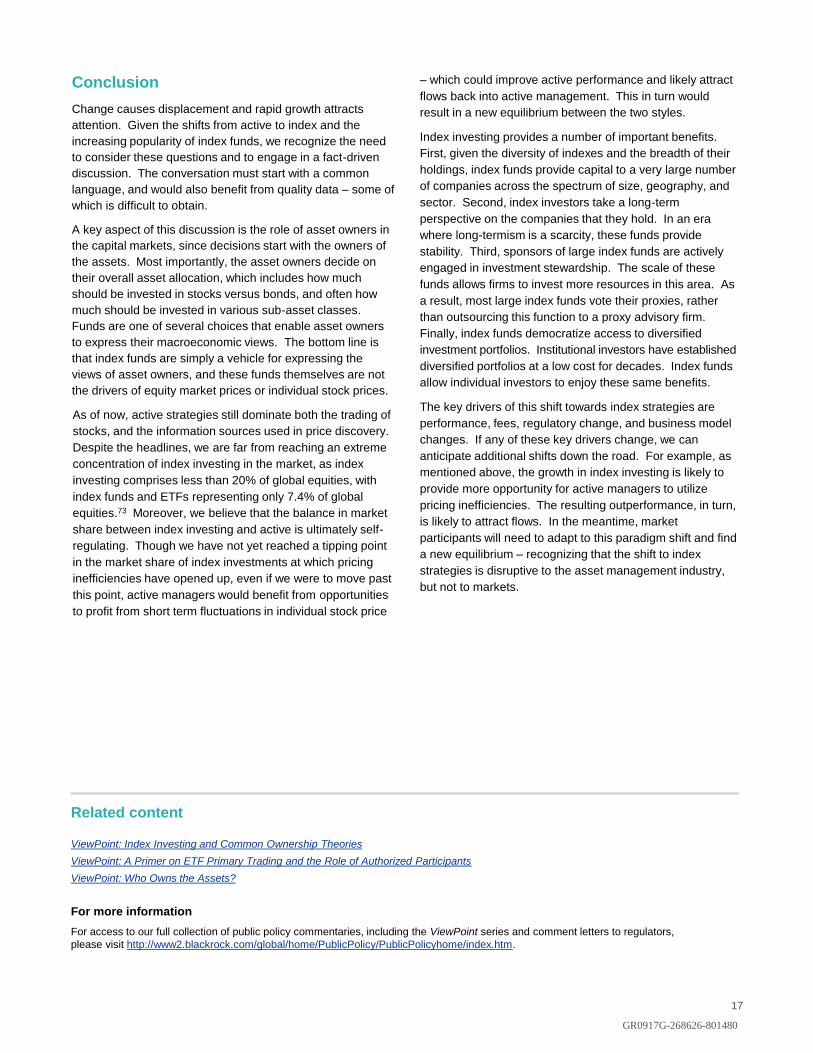
As the share of index increases and opportunities open up
for active investors to take advantage of short term stock price
fluctuations, active performance may in turn improve. Given
that active strategies with strong performance net of fees
continue to attract inflows (see Exhibit 4), any increase in
general active performance would likely cause some asset
owners to reallocate their capital back to active funds, intuitively
resulting in continuous adjustment to an equilibrium between
active and index investing (as illustrated in Exhibit 13).
GR0917G-268626-801480
Source: BlackRock, for illustrative purposes only.
Exhibit 13: Equilibrium in investment styles

16
Academic theories around common
ownership
Having explored theories related to the impact of index
investing on equity markets, we now turn to those attributing
competition effects – from higher consumer prices,
escalating executive compensation, and other economic
effects – to the growth of index investment products and
index managers.62 This academic discourse is often referred
to as the literature on ‘common ownership’, and is addressed
in further detail in our March 2017 ViewPoint “Index Investing
and Common Ownership Theories.”
Academic discourse
Those who suggest that index investing has negative effects
on competition argue that ownership of individual companies
across an industry by a large manager means that these
companies have an incentive not to compete, and thereby
keep aggregate industry profits high. Some authors claim to
find evidence of such incentives; an academic debate has
ensued regarding the validity of these results and what
policy remedies, if any, should address such claimed
findings. This ‘common ownership’ debate drew significant
attention with a working paper called “Anti-Competitive
Effects of Common Ownership” on the airline industry in April
2015.63 The paper asserts that increases in common
ownership coincided with airline seat ticket prices rising
anywhere between three and seven percent during the 2001
to 2013 period.
This paper was followed by another working paper in July
2016 on bank competition entitled “Ultimate Ownership and
Bank Competition,” which claimed to find that greater
common ownership, as proxied by inclusion of a stock in an
index, led to higher fees and lower interest rates for
individual deposit accounts between 2004 and 2013.64
A third working paper entitled “Common Ownership,
Competition, and Top Management Incentives” put out in
November 2016 postulates that common ownership deters
company managers from competing aggressively with rivals
as evidenced by executive compensation practices.65 In
these papers, the authors found correlations in the data;
however, more current research casts doubt on their ability
to demonstrate causation. Moreover, as we stated in
“Index Investing and Common Ownership Theories,” these
theories fail to account for the realities of the asset
management business, which must cater to the needs and
interests of a variety of clients. These clients have a range of
investment mandates, making such an interest in higher
consumer prices (which would ultimately hurt the returns of
other companies in the asset manager’s portfolio)
implausible.
These initial academic papers have been followed by a
growing number of academic papers that challenge the
assumptions, methodology and conclusions of the original
academic work. “Executive Compensation under Common
Ownership” comes to the opposite conclusion regarding
executive compensation, finding instead that common
ownership increases the incentives to compete by sensitizing
executives to their performance relative to rivals.66
Likewise, “Testing for Competitive Effects of Common
Ownership” by Federal Reserve staffers finds that the results
of the earlier paper on the banking industry are not robust
and that statistical evidence of common ownership impacting
competition is mixed.67
As we discussed in “Index Investing and Common
Ownership Theories,” 68 these papers led to a series of policy
proposals ranging from limiting index funds to hold one
company per sector to denying index funds the right to vote
their proxies. Quite a few papers responded to these
proposals by questioning these solutions and suggesting that
the remedy might be worse than the alleged problem,
assuming that there is even a problem at all.
Recent developments
Most recently, papers authored by other economists have
further weakened the arguments by those claiming that
common ownership is a source of anti-competitive
behavior.69
In “The Competitive Effects of Common Ownership:
Economic Foundations and Empirical Evidence,” O’Brien et
al., focusing exclusively on the airline industry, conclude that
there is no evidence that common ownership has raised
airline prices. The paper uses two different empirical
approaches to estimate the effects of common ownership on
airline prices. Both approaches serve as checks on each
other and past research on this subject, and notably both
methods produce no evidence that common ownership has
raised prices.70
Further, in “Proposal to Remedy Horizontal Shareholding Is
Flawed,” Buckberg et al. argue that the remedies that have
been proposed offer a costly and disruptive way to change
asset manager behavior that would impair households’ ability
to accomplish their long-term financial goals. This paper
then claims that more research on whether institutional
holdings are related to reduced competition is needed before
any solution related to mitigating anti-competitive behavior is
formulated. 71
Despite broader concerns about increasing concentration in
the economy, there is no clear evidence that index funds are
a source of anti-competitive behavior. Academics have offered
hypotheses based on correlations. Other academics have
tested these hypotheses and responded. Given the preliminary
stage of this work and the conflicting conclusions of various
academics, it is premature to consider any policy
measures.72
GR0917G-268626-801480
Conclusion
Change causes displacement and rapid growth attracts
attention. Given the shifts from active to index and the
increasing popularity of index funds, we recognize the need
to consider these questions and to engage in a fact-driven
discussion. The conversation must start with a common
language, and would also benefit from quality data – some of
which is difficult to obtain.
A key aspect of this discussion is the role of asset owners in
the capital markets, since decisions start with the owners of
the assets. Most importantly, the asset owners decide on
their overall asset allocation, which includes how much
should be invested in stocks versus bonds, and often how
much should be invested in various sub-asset classes.
Funds are one of several choices that enable asset owners
to express their macroeconomic views. The bottom line is
that index funds are simply a vehicle for expressing the
views of asset owners, and these funds themselves are not
the drivers of equity market prices or individual stock prices.
As of now, active strategies still dominate both the trading of
stocks, and the information sources used in price discovery.
Despite the headlines, we are far from reaching an extreme
concentration of index investing in the market, as index
investing comprises less than 20% of global equities, with
index funds and ETFs representing only 7.4% of global
equities.73 Moreover, we believe that the balance in market
share between index investing and active is ultimately self-
regulating. Though we have not yet reached a tipping point
in the market share of index investments at which pricing
inefficiencies have opened up, even if we were to move past
this point, active managers would benefit from opportunities
to profit from short term fluctuations in individual stock price
– which could improve active performance and likely attract
flows back into active management. This in turn would
result in a new equilibrium between the two styles.
Index investing provides a number of important benefits.
First, given the diversity of indexes and the breadth of their
holdings, index funds provide capital to a very large number
of companies across the spectrum of size, geography, and
sector. Second, index investors take a long-term
perspective on the companies that they hold. In an era
where long-termism is a scarcity, these funds provide
stability. Third, sponsors of large index funds are actively
engaged in investment stewardship. The scale of these
funds allows firms to invest more resources in this area. As
a result, most large index funds vote their proxies, rather
than outsourcing this function to a proxy advisory firm.
Finally, index funds democratize access to diversified
investment portfolios. Institutional investors have established
diversified portfolios at a low cost for decades. Index funds
allow individual investors to enjoy these same benefits.
The key drivers of this shift towards index strategies are
performance, fees, regulatory change, and business model
changes. If any of these key drivers change, we can
anticipate additional shifts down the road. For example, as
mentioned above, the growth in index investing is likely to
provide more opportunity for active managers to utilize
pricing inefficiencies. The resulting outperformance, in turn,
is likely to attract flows. In the meantime, market
participants will need to adapt to this paradigm shift and find
a new equilibrium – recognizing that the shift to index
strategies is disruptive to the asset management industry,
but not to markets.
17
GR0917G-268626-801480
Related content
ViewPoint: Index Investing and Common Ownership Theories
ViewPoint: A Primer on ETF Primary Trading and the Role of Authorized Participants
ViewPoint: Who Owns the Assets?
For more information
For access to our full collection of public policy commentaries, including the ViewPoint series and comment letters to regulators,
please visit http://www2.blackrock.com/global/home/PublicPolicy/PublicPolicyhome/index.htm.
18
Endnotes
1. See BlackRock, Index Investing and Common Ownership Theories, BlackRock Public Policy (Mar. 2017), available at
https://www.blackrock.com/corporate/en-de/literature/whitepaper/viewpoint-index-investing-and-common-ownership-theories-eng-
march.pdf at 3 (Common Ownership ViewPoint).
2. See, e.g., Frank Partnoy, Are Index Funds Evil?, The Atlantic (August 2017), available at
https://www.theatlantic.com/magazine/archive/2017/09/are-index-funds-evil/534183/; Simone Foxman, Paul Singer Says Passive
Investing Is ‘Devouring Capitalism.’, Bloomberg (August 2017), available at https://www.bloomberg.com/news/articles/2017-08-
03/singer-s-elliott-hedge-fund-returns-3-5-in-the-first-half; Matt Levine, Are Index Funds Communist?, Bloomberg (August 2016),
available at https://www.bloomberg.com/view/articles/2016-08-24/are-index-funds-communist.
3. See, e.g., Chris Flood, Record ETF Inflows Fuel Price Bubble Fears, Financial Times (Aug. 2017), available at
https://www.ft.com/content/8720939e-7e82-11e7-9108-edda0bcbc928; Natasha Doff, Traders Fear Hard Landing in Emerging Markets,
Bloomberg (July 2017), available at https://www.bloomberg.com/news/articles/2017-07-24/traders-fear-hard-landing-in-emerging-
markets-as-bond-etf-swells; Robin Wigglesworth and Adam Samson, EM worries over swelling influence of ETF flows, Financial Times
(Aug. 2017), available at https://www.ft.com/content/6f0350be-8295-11e7-a4ce-15b2513cb3ff.
4. See, e.g., Einer Elhauge, Horizontal Shareholding, 129 Harvard Law Review 1268 (Mar. 10, 2016), available at
http://cdn.harvardlawreview.org/wp-content/uploads/2016/03/1267-1317-Online.pdf (Horizontal Shareholding).
5. We focus on stock markets because (1) ownership percentages of debt markets by index funds are still de minimis (~5%); (2) debt
owners do not customarily have the same governance rights as stock owners; and (3) debt markets trade over-the-counter and not on
exchanges, with various levels of pricing transparency ranging from the Trade Reporting and Compliance Engine (TRACE) reporting to
“by appointment” or even without report.
6. Common Ownership ViewPoint.
7. Index investing represents less than 20% of global equities (inclusive of assumptions around institutional indexing outside of mutual
funds and ETFs), with index funds and ETFs (where no estimates are required as this data is publicly available) representing just over
7% and 12% of the global and US equity universes, respectively.
8. The Business Times, Citi Says Emerging Markets Increasingly Reliant on ETF Flows, The Business Times (Aug. 2017), available at
http://www.businesstimes.com.sg/banking-finance/citi-says-emerging-markets-increasingly-reliant-on-etf-flows; Robin Wigglesworth and
Adam Samson, EM worries over swelling influence of ETF flows, Financial Times (Aug. 2017), available at
https://www.ft.com/content/6f0350be-8295-11e7-a4ce-15b2513cb3ff; Chris Flood, Record ETF inflows fuel price bubble fears, Financial
Times (Aug. 2017) available at https://www.ft.com/content/8720939e-7e82-11e7-9108-edda0bcbc928.
9. As shown in Exhibit 9 in this paper, we estimate the total amount of US equity stocks turned over by active mutual funds and index
funds, calculated by multiplying relative AUM size by their respective turnover ratios. We estimate that active funds drive greater
turnover of US equities than index funds do, showing that active funds clearly dominate stock trading flows.
10. Phil MacKintosh, 5 Reasons ETFs Impact Stocks Less Than You Think, Virtu Financial (formerly known as KCG) Market Commentary:
ETF Insights (Feb. 8, 2017), available at
https://ptportal.kcg.com/kresearch/do/research/getDownload?attachmentId=4728&username=8FEW5ecT13JTdHAY7Qm0TA (ETF
Insights Report). Create/Redeem flow is an average of $8.9 billion per day. This is 11% of all ETF trading but only about 5% of all US
stock trading. US stocks traded $190 billion in 2016.
11. Investment practices that increase or decrease tracking error to a market capitalization benchmark could include, for example, dynamic
market; factor and sector timing; tactical asset allocation (TAA); stock selection and acquisition of off-benchmark positions; and hedging
and market risk management techniques.
12. See BlackRock, A Matter of Style: The Long and the Short of Style Factor Investing (Sept.2016), available at
https://www.blackrock.com/institutions/en-gb/literature/whitepaper/a-matter-of-style-en.pdf at 4 (Matter of Style).
13. See generally Ang, Andrew, Asset Management: A Systematic Approach to Factor Investing, Oxford University Press (2014) (Factor
Investing Book); See Matter of Style at 4.
14. While some active ETFs have been developed recently, the vast majority are index-based.
15. See generally Factor Investing Book.
16. Following multiple years of steady 10-12% organic asset growth rates, index funds’ growth rates have increased to over 20%.
17. Equity ETF data includes both index and active ETFs. However, active ETFs constitute a very small portion of this data and do not
materially impact this estimation.
18. An open-end fund is a type of mutual fund that does not have restrictions on the amount of shares the fund can issue.
19. The number 11.8% was computed by BlackRock using data from Simfund and Broadridge.
20. Futures are derivative securities because they are side bets on the value of the underlying security prices. Since ETFs are portfolios of
stocks, they are not derivatives.
21. ETF Insights Report.
22. CME Group, Stock Index Futures vs. Exchange Traded Funds (ETFs): TEXPERs 2015 San Antonio Educational Conference (2015),
available at http://www.texpers.org/files/Lerman_CME_ETFs(1).pdf.
23. William L. Silber, The Economic Role of Financial Futures, American Enterprise Institute for Public Policy Research (1985), available at
http://www.farmdoc.illinois.edu/irwin/archive/books/Futures-Economic/Futures-Economic_chapter2.pdf.
24. In the early 1970s, John A. McQuown and William L. Fouse of Wells Fargo, developed the principles and techniques leading to index
investing. This led to the construction of a $6 million index account for the pension fund of Samsonite Corporation. See John C. Bogle,
The First Index Mutual Fund: A History of Vanguard Index Trust and the Vanguard Index Strategy, Vanguard: Bogle Financial Markets
Research Center (2006), available at https://www.vanguard.com/bogle_site/lib/sp19970401.html. In 1981, David Booth and Rex
Sinquefield started Dimensional Fund Advisors (DFA), and McQuown joined its Board of Directors many years later. DFA then
developed indexed based investment strategies. See Della Bradshaw, Chicago gets $300m naming gift, Financial Times (Nov. 7, 2008),
available at https://www.ft.com/content/ceb1907a-acbb-11dd-971e-000077b07658. In 1989, with a group of investors and partners,
Gary P. Brinson bought out his firm from First Chicago Bank and established Brinson Partners focused on passive management. The
firm grew to control $36 billion in AUM in five years. See Joel Chernoff, How market’s shift dislodged Gary Brinson (Mar. 11, 2000),
available at http://www.chicagobusiness.com/article/20000311/ISSUE01/100013446/how-markets-shift-dislodged-gary-brinson.
GR0917G-268626-801480

19
25. Institutional investors also benefited from the development in the early to mid-1980s of equity index derivatives, including futures,
options and swaps.
26. Inigo Fraser-Jenkins, Fund Management Strategy: Nearing the 50% passive milestone, Alliance-Bernstein Report (April 25, 2017) at 3.
27. Department of Labor, Fiduciary Requirements for Disclosure in Participant-Directed Individual Accounts Plans - Timing of Annual
Disclosure (29 C.F.R. 2550.404a-5) (Mar. 29, 2015), available at
http://webapps.dol.gov/federalregister/HtmlDisplay.aspx?DocId=28129&AgencyId=8&DocumentType=2.
28. Department of Labor, Definition of the Term “Fiduciary”; Conflict of Interest Rule—Retirement Investment Advice (29 C.F.R. 2510.3-21)
(April 2016), available at https://webapps.dol.gov/federalregister/PdfDisplay.aspx?DocId=28806.
29. BlackRock, Who Owns the Assets? Developing a Better Understanding of the Flow of Assets and the Implications for Financial
Regulation (May 2014), available at http://www.blackrock.com/corporate/en-us/literature/whitepaper/viewpoint-who-owns-the-assets-
may-2014.pdf (Who Owns the Assets ViewPoint).
30. McKinsey & Company, Strong Performance but Health Still Fragile: Global Asset Management in 2013. Will the Goose Keep Laying
Golden Eggs? (July 2013), available at http://www.asset-management-summit-
2015.com/pdf/2013_Asset_management_brochure_20130723.pdf (McKinsey Report).
31. McKinsey Report. Note that the percent of externally managed assets is lower than the IMF’s calculation since the IMF’s calculation
includes loans in total global financial assets. See also Who Owns the Assets ViewPoint.
32. McKinsey Report.
33. Common Ownership ViewPoint at 7-8.
34. To the extent that no external manager is involved and the asset owner is conducting the regulatory reporting, the regulatory data
reflects the asset owner’s holding. Given that asset owners may use a combination of internal and external sources, the threshold
reporting is not useful for identifying the ultimate asset owners.
35. In certain markets, proxy voting involves logistical issues which can affect BlackRock’s ability to vote such proxies, as well as the
desirability of voting such proxies. These issues include but are not limited to: (1) untimely notice of shareholder meetings; (2)
restrictions on a foreigner’s ability to exercise votes; (3) requirements to vote proxies in person; (4) “share-blocking” (requirements that
investors who exercise their voting rights surrender the right to dispose of their holdings for some specified period in proximity to the
shareholder meeting); (5) potential difficulties in translating the proxy; (6) regulatory constraints; and (7) requirements to provide local
agents with unrestricted powers of attorney to facilitate voting instructions.
36. “If a large slice of institutional investor money is passive, this could mean that few of them have any interest in holding boards to
account. The concern is that if boards do not feel accountable to shareholders, incentives for good governance could wither away.
Recently we have been engaging more with companies and asset managers about the implications of this. Basically, we want to
encourage all asset managers to focus on how companies are governed and how they manage risks, and to get involved where
necessary. Just over a year ago, we introduced a new stewardship code, which we call the Principles of Responsible Ownership. The
principles aim to encourage investors to constructively engage with companies and to establish clear voting policies.” See Ashley Alder,
Keynote Speech at Companies Registry Corporate Governance Roundtable, Hong Kong Securities and Futures Commission (March 13,
2017), available at http://www.sfc.hk/web/EN/files/ER/PDF/Speeches/AIA_20170313.pdf at 5.
37. Shareholder Rights Directive.
38. DoL Guidelines at 95880.
39. DoL Guidelines at 95880.
40. DoL Guidelines at 95880.
41. Elliott/Hess and Jana Partners have been known to take or negotiate for board seats on the boards of companies in which they invest
(e.g. Elliott/Hess on Arconic and Jana Partners on Agrium).
42. Pershing Square and Valeant formed a co-bidder entity with the intent to make an investment in Allergan and assist Valeant’s merger
with Allergan. Ultimately that effort fell apart and Allergen merged with Actavis.
43. Recent engagement by Carl Icahn’s fund has included pushing for spin-offs at target companies and then lobbying for the adoption of
shareholder-friendly corporate governance provisions at those targets. Settlements will often provide for Board representation at both
parent and the spin-off, as in the cases of eBay and Manitowoc.
44. BlackRock withheld its vote 28% of the time, Vanguard withheld its vote 11% of the time, and State Street withheld its vote 20% of the
time. Houlihan Lokey, Activist Situations Practice (Nov. 2015), available at http://www.hl.com/email/pdf/2015/HL-Activist-Shareholder-
Update-Nov-15_v2.pdf. Some commentators even find that the growth of passive managers facilitates activism when activists practices
are consistent with promoting long term value. Appel et al., Standing on the Shoulders of Giants: The effect of passive investors on
activism (Sept. 26, 2016), available at https://finance.eller.arizona.edu/sites/finance/files/gormley_4.28.17.pdf.
45. European Parliament and Counsel, Directive 2009/65/EC of the European Parliament and of the Council, Article 56 (July 13, 2009),
available at http://ec.europa.eu/internal_market/investment/docs/ucits-directive/directive_2009_65_ec_en.pdf.
46. See United States Government Accountability Office, Proxy Advisory Firms’ Role in Voting and Corporate Governance Practices (Nov.
2016), available at http://gao.gov/assets/690/681050.pdf.
47. Matthew J. Mallow and Jasmin Sethi, Engagement: The Missing Middle Approach in the Bebchuk–Strine Debate, 12 NYU JLB 385
(2016), available at https://www.blackrock.com/corporate/en-is/literature/publication/mallow-sethi-engagement-missing-middle-approach-
may-2016.pdf. At the time of the writing of this paper, Matthew J. Mallow was the Chief Legal Officer at BlackRock and is currently Vice
Chairman at BlackRock. Jasmin Sethi is a Vice President in the Legal & Compliance Department at BlackRock.
48. BlackRock, Investment Stewardship Protecting our clients' assets for the long-term (July 2017), available at
https://www.blackrock.com/corporate/en-gb/literature/publication/blk-profile-of-blackrock-investment-stewardship-team-work.pdf at 6.
49. For instance, Berkshire Hathaway is a division of an American multi-national conglomerate that oversees and manages a number of
subsidiary companies. Tied together with Berkshire Hathaway’s investment in Coca-Cola Company is the presence of Warren Buffet’s
son on the Coca-Cola Company board. In June 2016, we published a ViewPoint entitled “Exploring ESG: A Practitioner’s Perspective”
which sets out BlackRock’s views on ESG issues from the perspective of a fiduciary investor acting on behalf of asset owners.
BlackRock, Exploring ESG: A Practitioner’s Perspective (July 2016), available at https://www.blackrock.com/corporate/en-
us/literature/whitepaper/viewpoint-exploring-esg-a-practitioners-perspective-june-2016.pdf. More recently, the FSB’s recommendations
GR0917G-268626-801480
1. of the Task Force on Climate-related Financial Disclosures went even further recommending specific reporting by companies. Task
Force on Climate-Related Financial Disclosures, Recommendations of the Task Force on Climate-related Financial Disclosures (June
2017), available at https://www.fsb-tcfd.org/wp-content/uploads/2017/06/FINAL-TCFD-Report-062817.pdf. See also Department of
Labor, Interpretive Bulletin Relating to the Exercise of Shareholder Rights and Written Statements of Investment Policy, Including Proxy
Voting Policies or Guidelines, 81 Fed. Reg. 95880 (Dec. 29, 2016), available at https://www.gpo.gov/fdsys/pkg/FR-2016-12-29/pdf/2016-
31515.pdf (DoL Guidelines); Council of the European Union, Directive of the European Parliament and of the Council Amending
Directive 2007/36/EC as Regards the Encouragement of Long-Term Shareholder Engagement (Dec. 13, 2016), available at
http://data.consilium.europa.eu/doc/document/ST-15248-2016-INIT/en/pdf (Shareholder Rights Directive).
50. ETF Insights Report at 1.
51. ETF Insights Report.
52. As shown in Exhibit 8 in this paper, we estimate the total amount of US equity stocks turned over by active mutual funds and index
funds, calculated by multiplying relative AUM size by their respective turnover ratios. We estimate that active funds drive greater
turnover of US equities than index funds do, showing that active funds clearly dominate stock trading flows.
53. See ETF Insights Report at 2; Credit Suisse, US Chartbook: Market Structure Review 2016/2017 (January 9, 2017).
54. For a more detailed explanation of this process, see BlackRock, A Primer on ETF Primary Trading and the Role of Authorized
Participants (Mar. 2017), available at https://www.blackrock.com/corporate/en-us/literature/whitepaper/viewpoint-etf-primary-trading-role-
of-authorized-participants-march-2017.pdf (A Primer on ETF).
55. ETF Insights Report. Create/Redeem flow is an average of $8.9 billion per day. This is 11% of all ETF trading but only about 5% of all
US stock trading. US stocks traded $190 billion in 2016.
56. Specifically, we reckoned the imputed impact of daily flows into all 331 ETFs over the month of July 2017, with the conservative
assumption that the underlying stock (AAPL) was traded in proportion to its weight in each ETF that included it as a constituent. If AAPL
was 3% of a fund that saw total flow of $100 million (defined the sum of absolute daily flows over the 22 trading days in July), we would
impute $3 million of associated create/redeem activity. This estimate is an upper bound on the amount of primary market activity induced
by flows because in reality, market makers will typically wait more than a day or so to net out buys and sells before trading the
underlying. We estimate the maximum primary market create/redeem activity as 5.11% of AAPL’s ADV in July 2017 using the approach
outlined by Madhavan. See Ananth N. Madhavan, Exchange Traded Funds and the New Dynamics of Investing, Oxford University Press
(2016) at Chapter 15 (discussing the approach utilized for this analysis). The top five contributing ETFs are: QQQ, with contribution of
2.52%; SPY, with contribution of 0.88%; IVV, with contribution of 0.27%; XLK, with contribution of 0.24%; and DIA, with contribution if
0.13%. The remaining 326 ETPs contribute around 1.06% to Apple’s ADV. (Data from this analysis is from Bloomberg and Morningstar,
as of August 1, 2017).
57. See David Perlman, Passive Investing: Rise of the Machines, UBS (Sept. 2017), at Figure 6: “Passive strategies’ growth hasn’t affected
price discovery.”
58. See Doron Israeli, Charles M. C. Lee, and Suhas A. Sridharan, Is there a Dark Side to Exchange Traded Funds? An Information
Perspective, Review of Accounting Studies (Jan. 13, 2017), available at
https://papers.ssrn.com/sol3/papers.cfm?abstract_id=2625975&download=yes.
59. Ananth N. Madhavan and Daniel Morillo, The Impact of Flows into Exchange-Traded Funds: Volumes and Correlations (Jan. 23, 2014);
ETFs and New Dynamics at Chapter 15.
60. This quote has been widely attributed by media sources to Seth Klarman, Chief Executive of Baupost Group, 2016 Investor Letter.
61. Sanford Grossmann and Joseph Stiglitz, On the Impossibility of Informationally Efficient Markets (June 1980), available at
http://people.hss.caltech.edu/~pbs/expfinance/Readings/GrossmanStiglitz.pdf at 393.
62. Horizontal Shareholding.
63. José Azar, Martin C. Schmalz, and Isabel Tecu, Anti-Competitive Effects of Common Ownership (Mar. 15, 2017), available at
https://papers.ssrn.com/sol3/papers.cfm?abstract_id=2427345 (Azar et al. Airline Paper); José Azar, Sahil Raina, and Martin C.
Schmalz, Ultimate Ownership and Bank Competition (July 23, 2016), available at
https://papers.ssrn.com/sol3/papers.cfm?abstract_id=2427345.
64. José Azar, Sahil Raina, and Martin C. Schmalz, Ultimate Ownership and Bank Competition (July 23, 2016), available at
https://papers.ssrn.com/sol3/papers.cfm?abstract_id=2710252.
65. Miguel Antón, Florian Ederer, Mireia Giné, and Martin C. Schmalz, Common Ownership, Competition, and Top Management Incentives
(Nov. 15, 2016), available at https://papers.ssrn.com/sol3/papers.cfm?abstract_id=280233.
66. Heung Jin Kwon, Executive Compensation under Common Ownership (Jan. 30, 2017), available at
http://fmaconferences.org/Boston/ExecutiveCompensationunderCommonOwnership.pdf.
67. Jacob Gramlich and Serafin Grundl, Testing for Competitive Effects of Common Ownership (Feb. 19, 2017), available at
https://www.federalreserve.gov/econres/feds/files/2017029pap.pdf.
68. Common Ownership ViewPoint.
69. Daniel P. O’Brien et. al, The Competitive Effects of Common Ownership: Economic Foundations and Empirical Evidence (July 2017),
available at https://papers.ssrn.com/sol3/papers.cfm?abstract_id=3008331 (O’Brien et al. Paper); Elaine Buckberg et al., Proposal To
Remedy Horizontal Shareholding Is Flawed, (July 2017), available at
http://www.brattle.com/system/publications/pdfs/000/005/470/original/Proposal_To_Remedy_Horizontal_Shareholding_Is_Flawed.pdf?1
500409920 (Buckberg et al. Paper).
70. O’Brien et al. Paper at 1, 22-23.
71. Buckberg et al. Paper.
72. Even the authors of Azar et al. Airline Paper acknowledge that “the empirical literature on the anti-competitive effects of common
ownership is still in its infancy.” José Azar, Martin Schmalz, and Isabel Tecu, Why Common Ownership Creates Antitrust Risks, Antitrust
Chronical Volume 3 (June 2017), available at https://www.competitionpolicyinternational.com/category/antitrust-chronicle/antitrust-
chronicle-2017/spring-2017-volume-1-number-3/?submit=View at 17.
73. ETF Insights Report.
20
GR0917G-268626-801480

This publication represents the regulatory and public policy views of BlackRock. The opinions expressed herein are as of October 2017 and are subject
to change at any time due to changes in the market, the economic or regulatory environment or for other reasons. The information in this publication
should not be construed as research or relied upon in making investment decisions with respect to a specific company or security or be used as legal
advice. Any reference to a specific company or security is for illustrative purposes and does not constitute a recommendation to buy, sell, hold or directly
invest in the company or its securities, or an offer or invitation to anyone to invest in any BlackRock funds and has not been prepared in connection with
any such offer.
This material may contain ‘forward-looking’ information that is not purely historical in nature. Such information may include, among other things,
projections and forecasts. There is no guarantee that any forecasts made will come to pass. The information and opinions contained herein are derived
from proprietary and non-proprietary sources deemed by BlackRock to be reliable, but are not necessarily all inclusive and are not guaranteed as to
accuracy or completeness. No part of this material may be reproduced, stored in any retrieval system or transmitted in any form or by any means,
electronic, mechanical, recording or otherwise, without the prior written consent of BlackRock.
This publication is not intended for distribution to, or use by any person or entity in any jurisdiction or country where such distribution or use would be
contrary to local law or regulation.
In the EU issued by BlackRock Investment Management (UK) Limited (authorised and regulated by the Financial Conduct Authority). Registered office
12 Throgmorton Avenue, London, EC2N 2DL. Registered in England No. 2020394. Tel: 020 7743 3000. For your protection, telephone calls are usually
recorded. BlackRock is a trading name of BlackRock Investment Management (UK) Limited.
In Hong Kong, this material is issued by BlackRock Asset Management North Asia Limited and has not been reviewed by the Securities and Futures
Commission of Hong Kong. This material is for distribution to "Professional Investors" (as defined in the Securities and Futures Ordinance (Cap.571 of
the laws of Hong Kong) and any rules made under that ordinance) and should not be relied upon by any other persons or redistributed to retail clients in
Hong Kong. In Singapore, this is issued by BlackRock (Singapore) Limited (Co. registration no. 200010143N) for use only with institutional investors as
defined in Section 4A of the Securities and Futures Act, Chapter 289 of Singapore. In Korea, this material is for Qualified Professional Investors. In
Japan, this is issued by BlackRock Japan. Co., Ltd. (Financial Instruments Business Operator: The Kanto Regional Financial Bureau. License No375
Association Memberships: Japan Investment Advisers Association, The Investment Trusts Association, Japan, Japan Securities Dealers Association,
Type II Financial Instruments Firms Association.) for Professional Investors only (Professional Investor is defined in Financial Instruments and Exchange
Act) and for information or educational purposes only, and does not constitute investment advice or an offer or solicitation to purchase or sells in any
securities or any investment strategies. In Taiwan, independently operated by BlackRock Investment Management (Taiwan) Limited. Address: 28/F, No.
95, Tun Hwa South Road, Section 2, Taipei 106, Taiwan. Tel: (02)23261600.
In Canada, this material is intended for permitted clients only, is for educational purposes only, does not constitute investment advice and should not be
construed as a solicitation or offering of units of any fund or other security in any jurisdiction.
Issued by BlackRock Investment Management (Australia) Limited ABN 13 006 165 975, AFSL 230 523 (BIMAL) for the exclusive use of the recipient,
who warrants by receipt of this material that they are a wholesale client as defined under the Australian Corporations Act 2001 (Cth). This material
provides general information only and does not take into account your individual objectives, financial situation, needs or circumstances. Before making
any investment decision, you should therefore assess whether the material is appropriate for you and obtain financial advice tailored to you having
regard to your individual objectives, financial situation, needs and circumstances. This material is not a securities recommendation or an offer or
solicitation with respect to the purchase or sale of any securities in any jurisdiction. This material is not intended for distribution to, or use by any person
or entity in any jurisdiction or country where such distribution or use would be contrary to local law or regulation. BIMAL is the responsible entity and
issuer of units in Australian domiciled managed investment schemes including Australian domiciled iShares ETFs. Any potential investor should consider
the latest product disclosure statement, prospectus or other offer document (Offer Documents) before deciding whether to acquire, or continue to hold,
an investment in any BlackRock fund. Offer Documents can be obtained by contacting the BIMAL Client Services Centre on 1300 366 100. In some
instances Offer Documents are also available on the BIMAL website at www.blackrock.com.au. BIMAL is also the local agent and intermediary for non-
Australian domiciled iShares ETFs that are quoted on ASX and are issued by iShares, Inc. ARBN 125632 279 formed in Maryland, USA; and iShares
Trust ARBN 125 632 411 organised in Delaware, USA (International iShares ETFs). BlackRock Fund Advisors (BFA) serves as an advisor to the
International iShares ETFs, which are registered with the United States Securities and Exchange Commission under the Investment Company Act
of1940. BFA is a subsidiary of BlackRock Institutional Trust Company, N.A. (BTC). BTC is a wholly-owned subsidiary of BlackRock, Inc.® An iShares
ETF is not sponsored, endorsed, issued, sold or promoted by the provider of the index which a particular iShares ETF seeks to track. No index provider
makes any representation regarding the advisability of investing in the iShares ETFs. Further information on the index providers can be found in the
BIMAL website terms and conditions at www.blackrock.com.au. This material has not been prepared specifically for Australian investors. It may contain
references to dollar amounts which are not Australian dollars and may contain financial information which is not prepared in accordance with Australian
law or practices. BIMAL, its officers, employees and agents believe that the information in this material and the sources on which it is based (which may
be sourced from third parties) are correct as at the date of publication. While every care has been taken in the preparation of this material, no warranty
of accuracy or reliability is given and no responsibility for the information is accepted by BIMAL, its officers, employees or agents. Any investment is
subject to investment risk, including delays on the payment of withdrawal proceeds and the loss of income or the principal invested. While any forecasts,
estimates and opinions in this material are made on a reasonable basis, actual future results and operations may differ materially from the forecasts,
estimates and opinions set out in this material. No guarantee as to the repayment of capital or the performance of any product or rate of return referred
to in this material is made by BIMAL or any entity in the BlackRock group of companies.
In Latin America and Iberia: this material is for educational purposes only and does not constitute investment advice nor an offer or solicitation to sell or
a solicitation of an offer to buy any shares of any Fund (nor shall any such shares be offered or sold to any person) in any jurisdiction in which an offer,
solicitation, purchase or sale would be unlawful under the securities law of that jurisdiction. If any funds are mentioned or inferred to in this material, it is
possible that some or all of the funds have not been registered with the securities regulator of Brazil, Chile, Colombia, Mexico, Panama, Peru, Portugal,
Spain, Uruguay or any other securities regulator in any Latin American country and thus might not be publicly offered within any such country. The
securities regulators of such countries have not confirmed the accuracy of any information contained herein.
©2017 BlackRock. All rights reserved. iSHARES and BLACKROCK are registered trademarks of BlackRock.
All other marks are property of their respective owners.
GR0917G-268626-801480