Embed Size (px)
DESCRIPTION
,,
Citation preview

International Chamber of Commerce38 cours Albert 1er 75008 Paris, FranceTel: +33 (0)1 49 53 28 28 Fax: +33 (0)1 49 53 28 59Website: www.iccwbo.org
INTERNATIONAL CHAMBER OF COMMERCE
OPEN MARKETSINDEX
2011

This report was prepared for ICC by K. Michael Finger, international economist and 30-year veteran of the GATT/WTO research division. Mr Finger is currently an independent consultant and author. A research grant for the project was provided by the ICC Research Foundation.
ICC RESEARCHF O U N D A T I O N

Foreword .........................................................................................................................................4
Introduction ..................................................................................................................................6
Methodology and date sources .................................................................................. 8
Review of existing indices ....................................................................................................... 8
The four components of the ICC Open Markets Index ................................................ 9
Indicator 1: Observed openness to trade .................................................................10
Indicator 2: Trade policy .................................................................................................. 11
Indicator 3: International capital inflows .................................................................. 13
Indicator 4: Infrastructure for trade ...........................................................................14
Methodological issues .............................................................................................................14
Data availability ................................................................................................................... 15
Scoring ................................................................................................................................... 15
Aggregation ......................................................................................................................... 16
Key findings from the OMI .............................................................................................17
The OMI - aggregate score and ranking ...........................................................................17
Category 1: Most open economies ..............................................................................18
Category 2: Above average openness ......................................................................18
Category 3: Average openness ....................................................................................18
Category 4: Below average openness .......................................................................19
Category 5: Very weak .................................................................................................. 20
The OMI and G20 country performance ........................................................................ 20
Summary and conclusions ............................................................................................ 22
Annex 1: Bibliography ....................................................................................................... 23
Annex 2: Country Scores ..............................................................................................24
Annex 3: Detailed Weights Used ...........................................................................26
CONTENTS ICC OPEN MARKETS INDEX 2011

4 ICC Open Markets Index 2011
Trade is the lifeblood of the global economy. Since the end of the Second World War, the effort to open borders and bring down trade barriers has delivered tremendous benefits in terms of economic growth, job creation and social and political development. So far, the governments of the G20 in their public statements have recognized this truth and have committed to supporting the multilateral trading system and encouraging more open trade. They are to be commended for having largely avoided the temptation of protectionism since the start of the economic crisis in 2008, but this common resolve is being tested by the length and breadth of the abiding crisis:
In November 2010, the Peterson Institute for International Economics found that every single G20 government has implemented protectionist trade measures since 2008. Countries applied discriminatory measures worth US$1.6 trillion, or 10% of all world trade, in 2008 alone. The study also noted that G20 governments are accumulating an arsenal of protectionist measures, many of which are already in the pipeline for implementation.
In May 2011, a report by WTO-OECD-UNCTAD revealed that G20 governments implemented more new trade-restrictive measures over the previous six months than in any other previously reported period.
In October 2011, the European Commission’s report on Trade Restrictive Measures found that G20 governments implemented 424 restrictive measures since October 2008. In the past 12 months alone, 131 new restrictions have been introduced; only 40 have been removed.
These trends point to a rising tide of protectionism that runs against G20 pledges for open trade. Moreover, these actions undermine policies for economic recovery and job creation, at a time when the world economy remains at risk. The purpose of the ICC Open Markets Index (OMI) is to generate a balanced and reliable measurement of a country’s openness to trade. It uniquely combines indicators of actual, de facto, openness of markets with those reflecting government measures considered barriers to market entry. Consequently, the results of the OMI serve two purposes:
Foreword
1Commissioned by the ICC Research Foundation in 2010

5ICC Open Markets Index 2011
1. The ranking of national market performance on openness to trade from most to least open is an effective way to concentrate attention on the need for improvements and to monitor progress year-on-year.
2. The evaluation of a country’s performance across four indicators of openness to trade constitutes a tool for policymakers and authorities to identify deficiencies that deserve greater attention, thereby generating a roadmap of sorts for action and improvement.
Government authorities with better information on how their market performs — on key indicators and relative to other countries — are better able to honor commitments to open trade, implement necessary changes and resist regressive measures to “protect” domestic industries and jobs. We hope governments find the OMI to be a useful guide for concentrating on what needs to be improved as well as gauging their own progress over time.
The G20 has a key role in ensuring that governments around the world work collectively to lower trade barriers and unlock jobs and growth. ICC now calls on the G20 to lead the world by example, back its rhetoric with action, honor its commitments to the multilateral trading system and refrain from raising new barriers to trade and investment. At stake is $4-$7 trillion of growth and tens of millions of jobs if G20 nations were to just halve their current trade barriers.
Jean-Guy CarrierSecretary GeneralInternational Chamber of Commerce

6 ICC Open Markets Index 2011
Over the past 60 years, trade liberalization has contributed to improving the standard of living of billions of people across the world by creating new economic opportunities and providing greater choice and lower prices to consumers. An open international trade and investment environment is fundamental to foster economic growth, job creation, and prosperity.
The global recession and financial crisis did not alter this fundamental reality. And further measures to open trade will be a vital part of economic recovery. Businesses have the resources to invest, creating growth and jobs.2 This is recognized by all credible economic commentators, including the OECD, the IMF, the WTO and the World Bank. The OECD, for example, estimates that global GDP could increase by between US$4 and $7 trillion if countries were to halve their trade barriers.3
However, and especially in times of crisis, governments come under pressure to adopt measures to “protect” national industries and jobs. G20 leaders, for example, have recognized this and have stated publicly that they support the multilateral trading system and encourage more open trade, even as the financial crisis began contaminating the larger global economy. At the 2008 Washington Summit, heads of state announced their commitment to refrain from raising new barriers to trade and investment and extended the fight against new trade barriers to the end of 2013. The G20 Seoul Summit declaration acknowledged that uneven growth and widening imbalances fuel the temptation to diverge from global solutions into uncoordinated actions, but that such uncoordinated policy actions only lead to worse outcomes for all.
To further understand the extent to which governments are following through on their commitments to create genuinely open economies, the ICC commissioned this research to develop an Open Markets Index to measure the openness of key economies. It is anticipated that this index will be updated on a regular basis in order to track changes in openness over time, and that it may be further refined and developed.
Introduction
2 UNCTAD, World Investment Report 2011, indicates that cash holdings of multinational corporations are at a record high, yet most are not investing due to unpredictability of global economic governance.
3 OECD (2011), The Impact of Trade Liberalisation on Jobs and Growth: Technical Note, OECD Trade Policy Working Papers, No. 107, OECD Publishing.

7ICC Open Markets Index 2011
Open markets are characterized by the absence of man-made barriers against the cross-border flows of productive factors such as goods, services, capital and labor. An index, based on the combination of various indicators, should provide the ranking of countries in accordance to their degree of openness. The most open economies will rank at the top.
In contrast to other existing globalization indices, the focus of this research is on the ease of access to an economy, concentrating on actual barriers and market access barriers attributed to government policies. As such, the report has not considered either:
Restrictive private business practices; and Behind-the-border measures (e.g. subsidies)
The Open Markets Index (OMI) set out in this report is comprised of four key components:
Observed trade openness Trade policy Openness to capital flows Trade-enabling infrastructure
The 75 economies explored in this study are about evenly split between developed and developing countries and comprise all members of the G20, all the six newly industrialized economies in Asia (NIEs) and all the EU member countries.
The remainder of this paper is structured as follows:
Section 2 provides a review of the methodology used to develop the index
Section 3 provides the key findings from the OMI and discusses the interpretation for key countries
Section 4 provides some conclusions
8 ICC Open Markets Index 2011
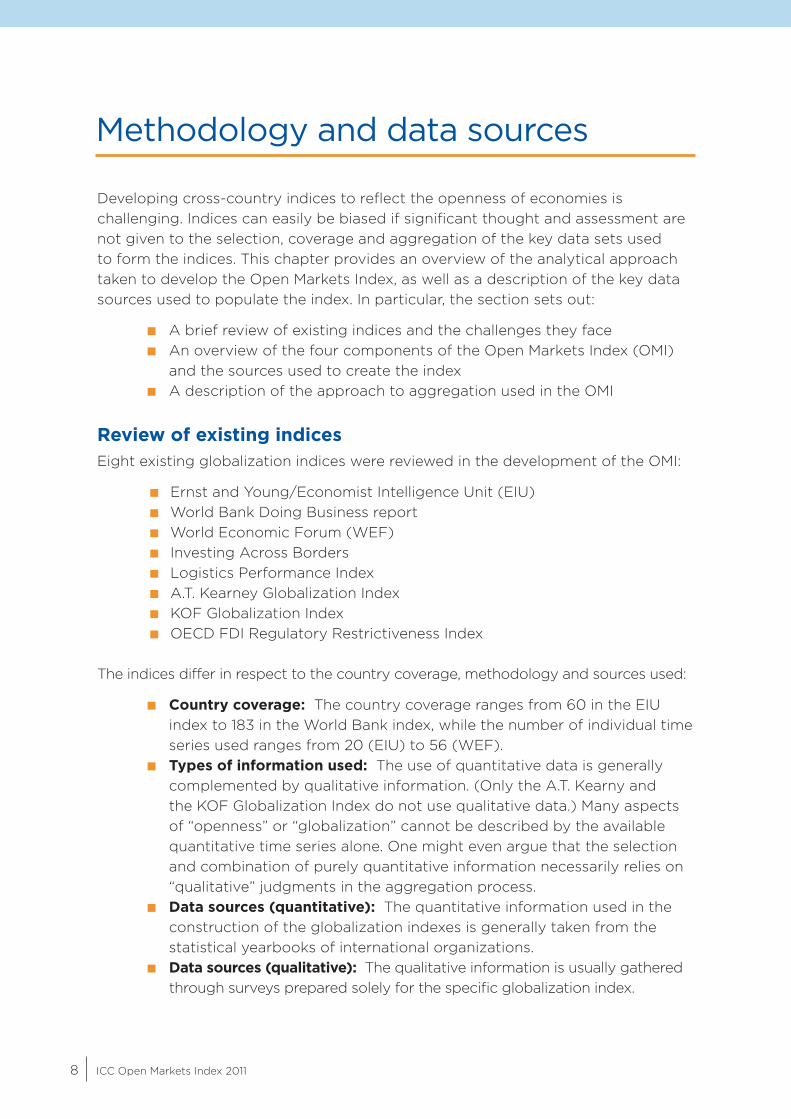
Developing cross-country indices to reflect the openness of economies is challenging. Indices can easily be biased if significant thought and assessment are not given to the selection, coverage and aggregation of the key data sets used to form the indices. This chapter provides an overview of the analytical approach taken to develop the Open Markets Index, as well as a description of the key data sources used to populate the index. In particular, the section sets out:
A brief review of existing indices and the challenges they face An overview of the four components of the Open Markets Index (OMI)
and the sources used to create the index A description of the approach to aggregation used in the OMI
Review of existing indicesEight existing globalization indices were reviewed in the development of the OMI:
Ernst and Young/Economist Intelligence Unit (EIU) World Bank Doing Business report World Economic Forum (WEF) Investing Across Borders Logistics Performance Index A.T. Kearney Globalization Index KOF Globalization Index OECD FDI Regulatory Restrictiveness Index
The indices differ in respect to the country coverage, methodology and sources used:
Country coverage: The country coverage ranges from 60 in the EIU index to 183 in the World Bank index, while the number of individual time series used ranges from 20 (EIU) to 56 (WEF).
Types of information used: The use of quantitative data is generally complemented by qualitative information. (Only the A.T. Kearny and the KOF Globalization Index do not use qualitative data.) Many aspects of “openness” or “globalization” cannot be described by the available quantitative time series alone. One might even argue that the selection and combination of purely quantitative information necessarily relies on “qualitative” judgments in the aggregation process.
Data sources (quantitative): The quantitative information used in the construction of the globalization indexes is generally taken from the statistical yearbooks of international organizations.
Data sources (qualitative): The qualitative information is usually gathered through surveys prepared solely for the specific globalization index.
Methodology and data sources
9ICC Open Markets Index 2011
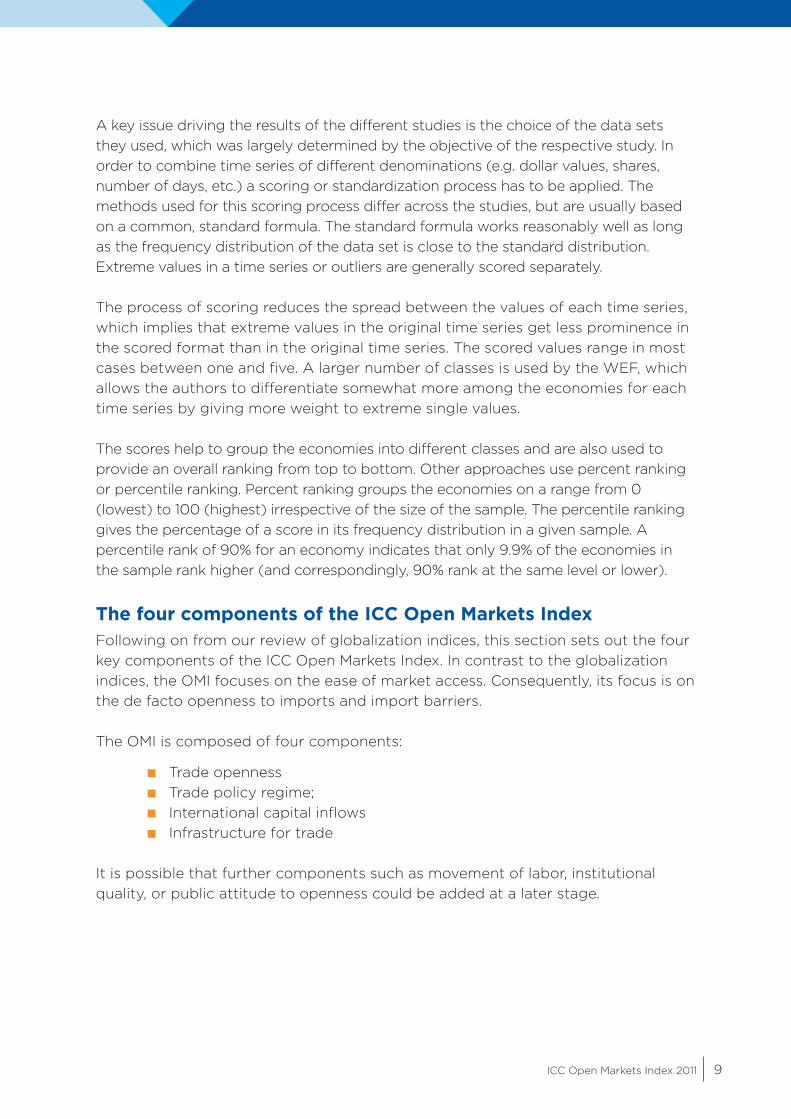
A key issue driving the results of the different studies is the choice of the data sets they used, which was largely determined by the objective of the respective study. In order to combine time series of different denominations (e.g. dollar values, shares, number of days, etc.) a scoring or standardization process has to be applied. The methods used for this scoring process differ across the studies, but are usually based on a common, standard formula. The standard formula works reasonably well as long as the frequency distribution of the data set is close to the standard distribution. Extreme values in a time series or outliers are generally scored separately.
The process of scoring reduces the spread between the values of each time series, which implies that extreme values in the original time series get less prominence in the scored format than in the original time series. The scored values range in most cases between one and five. A larger number of classes is used by the WEF, which allows the authors to differentiate somewhat more among the economies for each time series by giving more weight to extreme single values.
The scores help to group the economies into different classes and are also used to provide an overall ranking from top to bottom. Other approaches use percent ranking or percentile ranking. Percent ranking groups the economies on a range from 0 (lowest) to 100 (highest) irrespective of the size of the sample. The percentile ranking gives the percentage of a score in its frequency distribution in a given sample. A percentile rank of 90% for an economy indicates that only 9.9% of the economies in the sample rank higher (and correspondingly, 90% rank at the same level or lower).
The four components of the ICC Open Markets IndexFollowing on from our review of globalization indices, this section sets out the four key components of the ICC Open Markets Index. In contrast to the globalization indices, the OMI focuses on the ease of market access. Consequently, its focus is on the de facto openness to imports and import barriers.
The OMI is composed of four components:
Trade openness Trade policy regime; International capital inflows Infrastructure for trade
It is possible that further components such as movement of labor, institutional quality, or public attitude to openness could be added at a later stage.

10 ICC Open Markets Index 2011
For the construction of the four basic components, more than 30 time series have been considered of which 28 have been retained. Some time series had to be dropped because the information is available for only a small group of economies or overlaps with indicators already retained. Annex 2 sets out the indicators included in the analysis and their relative weights.
The statistical sources used are all taken from publicly available data. They include the general databases of international organizations, three studies (surveys) of the World Bank and a direct communication from the International Trade Centre. The data are typically for the years 2008 and 2009. In a number of cases it was preferred to use period averages rather than data from the latest year. All the time series retained for the OMI are produced regularly on an annual basis and are publicly available, making it possible to update the index regularly and track country performance with respect to trade openness over time on the basis of a consistent and transparent body of data.
A detailed description of each of the four component parts of the OMI is provided below.
Indicator 1: Observed openness to trade
Table 1 sets out the key indicators used to measure the observed openness to trade. Table 1 also provides a short commentary on each indicator, setting out the issues that should be taken into consideration when interpreting the findings.

11ICC Open Markets Index 2011
Indicator Description
Trade-to-GDP ratio
This is a key indicator of openness. The (nominal) value of exports and imports of goods and services is compared to the (gross) value added of domestic output. This ratio reflects broadly the relative importance of international trade to an economy. In terms of interpretation, small economies typically depend more on international trade than large economies (with the same level of import barriers). In addition, economies that have acquired a role as a trade hub record very large trade-to-GDP ratios due to the importance of transit trade.
Finally, this ratio may be biased in favor of low-income countries, due to the undervaluation of their currencies. For this reason the GDP of low- and middle-income countries valued at international prices (or at purchasing power parities) is generally two to three times larger than that valued at current market exchange rates. Comparing imports and GDP valued at current prices and market exchange rates tends to overstate the relative importance of trade to output in many developing countries.
Merchandise imports per capita ratio
This ratio relates imports to population size. Economies with a large population (and a correspondingly large market size at a given per capita income level) tend to have a lower import per capita ratio than those with a smaller population. In addition, wealthier countries typically record a larger trade per capita ratio than poorer countries. At a given income level the ratio of imports per capita for an economy will depend mainly on the level of import barriers but also on the size of its population.
Real merchandise import growth
This indicator captures the dynamics of the integration process of an economy. Imports expand faster in open economies than in more protected economies. In order to limit the impact of cyclical differences and (temporary) terms of trade gains, real merchandise import growth is considered over a longer period.
Trade per capita ratio
This ratio has a correlation with income and may therefore favor wealthier countries while the trade-to-GDP ratio might be considered to be biased in favor of poorer countries.
TABLE 1: KEY INDICATORS OF OBSERVED OPENNESS TO TRADE
Indicator 2: Trade policy
Table 2 on the following page sets out the key indicators used to measure the observed openness to trade. Table 2 also provides a short commentary on each indicator setting out the issues that should be taken into consideration when interpreting the findings. As the 27 EU members have one common tariff schedule and a single antidumping (AD) legislation and administration, there is no information available by individual EU members. It is therefore postulated that the EU tariff and AD actions are representing 1 to 1 the individual EU member country’s trade policy.

12 ICC Open Markets Index 2011
Indicator Description
Average applied tariff levels
This indicator uses an adjusted form of the arithmetic average of applied MFN tariffs. In most tariff schedules the share of tariff lines for agricultural products is larger than in actual trade flows. In order to correct for this “overrepresentation“ national applied agricultural and non-agricultural tariff averages are weighted according to the share of these product groups in world trade. This reduces the weight of agricultural tariffs by (on average) 15% to 10%. From this adjustment results a significantly lower average tariff rate for those countries that protect agricultural products far more than industrial products. However, the difference between the adjusted and arithmetic average is small and rarely exceeds 1 percentage point, with a maximum of 1.7% in the case of Norway.
We also use the International Trade Centre‘s (ITC) unpublished calculations for applied tariffs including preferential rates.
We use two indicators of average applied tariff levels because the latter may overstate the benefits of preferences as they can be subject to severe rules of origin. Therefore the average of the adjusted applied MFN rate and the applied rates including preferences are retained for the calculation of the tariff level indicator.
Complexity of tariff profile
The structure and complexity of a tariff can also have an impact on the overall protection level. Tariff binding levels: High tariff binding levels tend to increase the stability and predictability of a tariff and have always been a major objective of the multilateral trading system.
Share of duty free tariffs in total tariff lines: A high share of duty free tariff lines is often considered a liberal feature of tariff policy, especially in an already low tariff environment. Very low tariffs are often described as “nuisance tariffs”. Their protective effect is arguably less in the low tariff level per se but higher in administrative costs compared to those of duty free tariff lines.
Share of tariff peaks: Very high tariffs can become prohibitive to imports. In the tariff literature the tariffs exceeding 15% ad-valorem are described as “international tariff peaks”. An important share of tariff peaks in a tariff schedule usually reflects a higher protection level compared to a second schedule with the same average tariff but uniform rates.
Efficiency of import procedures
This indicator is based on three time series estimated by the World Bank experts: The number of days required to comply with all import procedures, the number of documents required for the imports of goods and the cost (US $ per container) associated with all the procedures required to import goods.
Number of AD actions
As regards non-tariff trade barriers, WTO-consistent contingent protections such as anti-dumping (AD), countervailing (CV) and safeguards are generally considered, often to contain a protectionist element. Countries with a high level of these contingent protection measures are considered to be more protectionist than those with a low level of AD, CV and safeguard actions. It is therefore useful to include the combination of AD initiations and AD measures as an indicator for restrictive trade policy. CV and safeguard actions are not retained as they are used by a small number of countries and far less frequently applied than AD measures.
TABLE 2: INDICATORS OF TRADE POLICY

13ICC Open Markets Index 2011
Indicator 3: International capital inflows
Global foreign direct investment (FDI) flows play an important role not only in technology transfer and for the integration of an economy into global production networks. Through foreign-owned local distribution networks, they also facilitate market access for imported goods. FDI inflows often contribute to an increased level of imports both directly and indirectly. In many cases FDI inflows take the form of machinery imports. FDI inflows into processing zones contribute to an increase in imports of merchandise for processing. Foreign subsidiaries are likely to import more than a domestic firm in the same industry even if both supply only the domestic market, as the foreign-owned firm is often better informed of the potential to source inputs from abroad.
Table 3 below sets out the key indicators used to measure international capital inflows. Table 3 also provides a short commentary on each indicator setting out the issues that should be taken into consideration when interpreting the findings. As annual FDI inflows show a large year-to-year variation (mainly due to the business cycle), a multi-year period average was considered to be more appropriate than single-year observations.
Indicator Description
FDI inflows to GDP
This indicator reflects both a country’s policy towards inward investment and its attractiveness to foreign investors due to market size or resource endowments. Up to the mid-eighties, widely spread government owner-ship in many sectors, and FDI-unfriendly legislation and administration limited the expansion of FDI in many countries. Thereafter, privatization and de-regulation provided a major stimulus to FDI growth over the last 25 years.
FDI inflows to Gross fixed capital formation (GFCF)
This indicator provides insight into the relative importance of FDI to domestic investment. For countries with a low saving/investment level the FDI inflows have a relatively larger impact on growth prospects than in countries with a high domestic saving/investment level.
FDI welcome index
The FDI welcome index (renamed from WB’s “Starting a foreign business indicator”) catches the administrative hurdles to establishing a business start up overseas. This indicator comprises three time series: the number of procedures needed for a business start up, the number of days needed to obtain authorization and the ease of establishing a foreign subsidiary.
FDI inward stock to GDP
FDI stock data lowers the impact of short-term fluctuations in FDI inflows. Stock data reflect the long-standing presence of foreign investment, which continues to contribute to the current international integration of an economy. FDI stock data may show pronounced year-to-year variations (e.g. due to exchange rate variations) and therefore multi-year periods have been used in this report.
TABLE 3: INDICATORS OF GLOBAL CAPITAL INFLOWS

14 ICC Open Markets Index 2011
Indicator 4: Infrastructure for trade
An enabling infrastructure for exports and imports is needed for a country to participate in the global economy and to provide meaningful access to its market. Consequently, the fourth component of the OMI seeks to capture the quality of trade-enabling infrastructure across countries. Table 4 below sets out the key indicators used to measure the trade-enabling infrastructure and provides a short commentary on each indicator setting out the issues that should be taken into consideration when interpreting the findings.
Indicator Description
Logistics performance index
This index covers six areas: efficiency of customs clearance, quality of trade and transport-related infrastructure, ease of arranging competitively priced shipments, competence and quality of logistics services, ability to track and trace consignments and timeliness of shipment to consignee within scheduled time. The index is based on the evaluation of logistics experts living in the region.
Communication infrastructure
The access, quality and affordability of telecommunication services in an economy are critical factors for integration and market access. Two time series identify access and spread of modern communications: fixed line plus mobile subscriptions per capita and internet use per 100 people.
TABLE 4: INDICATORS OF TRADE-ENABLING INFRASTRUCTURE
Methodological issues The final element in creating the OMI is bringing together the indicators described above into a cohesive and coherent single index that appropriately measures the relative openness of different economies.
In this regard three key methodological issues are critical:
Data availability Scoring Aggregation

15ICC Open Markets Index 2011
Data availability
The objective of this report is to synthesize information on market access to major markets worldwide. The 75 countries covered by this study accounted for 95% of world imports of goods and services in 2009. There is also a broad geographical coverage with 35 developed countries, 37 developing economies and three successor states of the former USSR (Russian Federation, Ukraine and Kazakhstan).
In a number of cases the standard source for a specific time series did not provide the information for the entire set of 75 markets. The missing information could sometimes be found by using national statistics but in general it is estimated. The number of estimates is very limited except for two indicators: Anti-dumping actions and efficiency of import procedures. All the time series used are published on a regular annual basis by international organizations, the only exception being the information communicated directly by the International Trade Centre on applied tariffs (including preferential rates).
Scoring
The objective of the scoring process is to make comparable those time series that are measured in different dimensions. At the same time, scoring is used to establish country groupings according to different degrees of openness. There are different approaches used in the scoring of data in the various globalization indices.
Following the WEF index, this report has taken a formula approach to scoring. Under the WEF methodology the maximum and the minimum value are attributed the highest and lowest score, respectively. The span between the two extreme values is split evenly into a number of categories that allow grouping of the individual country scores. If, for example, the scores range from 1 (minimum) to 6 (maximum) then the following formula applies: 5*((country value x less minimum value)/ (sample maximum less sample minimum)) + 1. In those cases where the higher values indicate less openness, then the order has to be inversed for scoring with the following formula: -5*((country value x less sample minimum)/ (sample maximum less sample minimum))+6.
The results of this approach are strongly influenced by the presence of extreme values. Assuming one extreme upper value and the rest of the sample values with a normal standard distribution around the average, then the results of the scoring would be highly uneven, with most values squeezed in the bottom groups. To correct for this, the WEF authors explain, “in some instances, adjustments were made to account for extreme outliers in the data”.

16 ICC Open Markets Index 2011
Building on the WEF’s adjustment strategy, the OMI modifies the formula approach by defining as “extreme value” all values exceeding three times the median value of the sample. The outliers are attributed the top score value.
Another challenge for the formula approach is posed by those samples in which data are rather concentrated around the average value. The formula approach will automatically split the sample into five groups even if an analyst of the data would conclude that there is materially no or only a negligible difference among the country data. For example the ratio of “collected duties to imports” among the developed countries ranges from 0.8% to 1.1% and reflects quite similar openness. The formula approach, however, will establish 5 degrees/groups of openness.
In determining the number of degrees of openness to include, we decided that an uneven number of groups has the advantage that a “middle group” is established in which most countries would be found in a sample with a standard distribution. More groups result in more differentiation. Adding more detail offsets to some extent the “concentration effect” in and around the middle group, which occurs when many indicators are averaged.
In this report scores range from 1 to 6 and compose five groups:
Category 1: Most open, excellent (score of 5-6) Category 2: Above average openness (Score 4-4.99) Category 3: Average openness (Score 3-3.99) Category 4: Below average openness (Score 2-2.99) Category 5: Very weak (Score 1-1.99)
Aggregation
The aggregation of time series scored in a standard way (e.g. from 1 to 6) can be done with the arithmetic average or with specific weights for each time series, indicator and each basic component. The scores of each time series are first weighted to obtain an indicator, the indicators are weighted to obtain one of the four basic components and eventually the four basic components are aggregated to form the Open Markets Index.
The arithmetic average could be used if the indicators are considered to be of similar importance or if there is no information on their relative importance. In all other cases relative weights assigned by a researcher’s own judgment or an expert panel result in a “better informed” overall index. Of course expert opinions will differ about the precise relative weights to be given but in general the “average expert opinion” improves the analytical value of the summary index. Annex 3 reports the weights which have been assigned to each time series/indicator and each basic component.

17ICC Open Markets Index 2011
Key findings from the OMI
This section of the report sets out the results and interpretation of the OMI. Firstly, the overall findings from the index are examined, followed by a focus in greater detail on the findings for the G20. More detailed information on the results obtained is available on request.
The OMI — aggregate score and rankingTable 5 below sets out the key findings from the OMI. It presents, for the 75 countries considered as part of the analysis, both their aggregate score and ranking (Annex 2 provides the full scoring for each country on each component of the index).
*Hong Kong is one of two special administrative regions (SARs) of the People’s Republic of China
Rank Score Rank Score
Hong Kong* 1 5.4 United States 39 3.6Singapore 2 5.3 Spain 40 3.6Luxembourg 3 4.8 Portugal 41 3.5United Arab Emirates 4 4.7 Italy 42 3.5Belgium 5 4.7 Japan 43 3.5The Netherlands 6 4.6 Thailand 44 3.4Ireland 7 4.5 Ukraine 45 3.4Switzerland 8 4.4 Korea, Rep. of 46 3.4Estonia 9 4.4 Greece 47 3.3Denmark 10 4.3 Jordan 48 3.3Sweden 11 4.3 Philippines 49 3.2Slovak Republic 12 4.3 Vietnam 50 3.1Iceland 13 4.3 Turkey 51 3.1Bulgaria 14 4.3 South Africa 52 3.1Hungary 15 4.3 Peru 53 3.1Austria 16 4.2 Indonesia 54 2.9Czech Republic 17 4.2 Uruguay 55 2.9Cyprus 18 4.1 Nigeria 56 2.8Germany 19 4.0 China 57 2.8Finland 20 4.0 Mexico 58 2.8Latvia 21 4.0 Colombia 59 2.7Malta 22 4.0 Morocco 60 2.7Norway 23 4.0 Egypt, Arab Rep. 61 2.6Slovenia 24 4.0 Russian Federation 62 2.6Lithuania 25 4.0 Tunisia 63 2.6United Kingdom 26 3.9 Kenya 64 2.6Saudi Arabia 27 3.9 Argentina 65 2.5France 28 3.9 India 66 2.4Australia 29 3.8 Uganda 67 2.3Canada 30 3.8 Brazil 68 2.3Malaysia 31 3.8 Venezuela, B.R. 69 2.2Taiwan 32 3.8 Pakistan 70 2.2Poland 33 3.8 Algeria 71 2.2Romania 34 3.7 Sri Lanka 72 2.2Kazakhstan 35 3.7 Sudan 73 2.2New Zealand 36 3.7 Ethiopia 74 2.1Chile 37 3.7 Bangladesh 75 2.1Israel 38 3.7
TABLE 5: COUNTRY SCORES AND RANKINGS

18 ICC Open Markets Index 2011
In understanding the scoring, it is important to bear in mind the interpretation of scoring presented in the previous section:
Category 1: Most open, excellent (score of 5-6) Category 2: Above average openness (Score 4-4.99) Category 3: Average openness (Score 3-3.99) Category 4: Below average openness (Score 2-2.99) Category 5: Very weak (Score 1-1.99)
The key findings in relation to each band of the index are discussed below.
Category 1: Most open economies
As can be seen from Table 5 above only two economies, Hong Kong and Singapore, receive a score of excellent in terms of their openness to trade. These two economies are always among the top five in all four components of the OMI and obtain in three components a score above 5. For the component trade openness they score 4.9.
Category 2: Above average openness
There are 23 countries which receive a score of between 4 and 5 indicating that they are above average openness. This group is made up predominantly of European countries who form part of the EU or the EFTA. The only other country in this group is the United Arab Emirates, which is ranked as number 4 of the most open markets.
The European countries in this group have in general a relatively small population size (below 15 million). The only exception is Germany, with the largest population in Western Europe and which ranks overall as number 19 and records a strong summary score of 4 (notably, the highest of the G20 countries, see below). Germany obtains the second best score of all economies for infrastructure (behind Sweden) but ranks rather low for FDI inflows (number 52) and records an average score for trade openness. Category 3: Average openness
Twenty-eight countries score average openness. Interestingly, included in this category are the bulk of large EU Member States (UK, France, Spain Italy), and large developed economies such as the United States, Canada, Australia and Japan. While these countries all fall within this average openness category, this masks important differences in their scores:
The large European markets (with consumers in excess of 40 million and excluding Germany) obtain average scores ranging from 3.5 (Italy) to 3.9 (United Kingdom). With these scores they rank from 26 (United Kingdom) to 42 (Italy).

19ICC Open Markets Index 2011
The United States has an average score of 3.6 and ranks as number 39 (roughly in the middle of the sample). The US market obtains its best scores (and ranking) for trade policy (rank 7; score 4.8) and trade-enabling infrastructure (rank 13; score 4.9). In measured trade openness, however, it ranks very low (rank 71; score 1.7). Obviously, being a large market, import values are relatively small compared to GDP and population size, even though in absolute terms (dollar values) the US continues to be the world’s largest importer.
The position of Japan in the overall ranking is somewhat lower than that of the United States. However, the differences in ranking are far more pronounced than between the scores (a meagre 0.1 points). Japan has an excellent score for its trade policy and the trade-enabling infrastructure (5.0) but records below average openness scores for FDI inflows and especially for trade openness. The poor score for trade openness could be attributed to the relative sluggish import growth and a low trade-to-GDP ratio.
The Republic of Korea and Taiwan are ranked in overall openness as numbers 46 and 32. More importantly they obtain overall only average scores in openness (3.4 and 3.8). Korea’s scores are particularly weak in trade and FDI openness while its infrastructure obtains an above average score (4.5). Taiwan reveals a similar pattern for the basic components but exceeds the respective Korean scores in each basic component.
Among the 10 African countries retained in this report South Africa is ranked first with a summary score of 3.1 (average). South Africa records a good score for its trade policy (4.1, above average) but a below average score in trade openness (2.1).
Chile is ranked first among the eight Latin American countries in this report. Chile’s strength is revealed in good scores for FDI openness (4.7) and trade policy (4.5). In respect of FDI, Chile ranks as the 13th most open economy among the 75 included in this study.
Category 4: Below average openness
22 countries are considered to have below average openness. These include:
Six of the G20 countries — China, Mexico, Russia, Argentina India and Brazil:• Mexico’s average score is identical to that of China. In trade policy
and FDI openness the scores of Mexico are superior to those of China while the opposite is the case for trade openness and infrastructure.
• Perhaps it is surprising that the scores for Argentina and Brazil are hardly superior to those of Venezuela. Brazil’s overall ranking is just one position above Venezuela. Poor Brazilian scores in trade and FDI openness (1.7 and 1.9) are only partly compensated by an average score for trade-enabling infrastructure.

20 ICC Open Markets Index 2011
• India’s position in the summary ranking of the Open Markets Index is at rank 66, nine ranks below that of China and two ranks above Brazil. In all four basic components India’s scores are relatively weak (ranging from 2.2 to 2.6). India’s scores are better than those of China only in FDI openness. In comparison to Brazil the Indian scores are higher for FDI and trade openness.
• Russia is ranked 62nd in the index. The Russian Federation records its best results for FDI openness (score 3.6) and its lowest score for infrastructure.
With the exception of South Africa, the other African countries record below average scores ranging from 2.8 for Nigeria to 2.1 for Ethiopia. Nigeria’s relative strong position among African countries is partly due to its strength in FDI inflows in recent years. In the case of Ethiopia the scores are poor for infrastructure and trade policy (scores 1.3 and 1.6 respectively).
Category 5: Very weak
No country recorded an aggregate score low enough to be included in this category. However, 26 cases of very weak performances are observed at the level of the four individual components.
The OMI and G20 country performanceTable 6 below provides a more detailed analysis of the G20 members. It shows, for each G20 country, both its overall score and ranking and its score and ranking for each of the four components of the index.
In terms of aggregate performance, the average score for the G20 economies is 3.2, suggesting that G20 economies have average trade openness, but that they are not providing global leadership in this regard. The highest scoring country is Germany, which, with a score of 4, is the only G20 country to be ranked above average in terms of openness. Seven countries were considered to be below average — the four BRICs plus Indonesia, Mexico and Argentina.
Looking in greater detail at the components of the index, the following is found:
Trade openness: The G20 countries performed poorest on average on this component of the index. While this is partly due to the fact that these are large countries (and so the ratio of imports to GDP might be expected to be lower) it is still of considerable concern. Only two countries, Saudi Arabia and Germany, managed to score even an average rating for this component. The remaining countries were considered to be either below average or very weak. The average score for the G20 was 2.2. The three lowest scoring countries were Japan, Brazil and the USA.

21ICC Open Markets Index 2011
Trade policy: By contrast, the G20 scored best in terms of trade policy, with a score of 4 suggesting that they are above average. One country, Japan, was rated as excellent in terms of trade policy, while a further 10 were rated as above average. However, a few countries had trade policies that were considered to be below average — Russia, Argentina, India and Brazil.
FDI openness: The G20 scored average performance on this component (average score, 3.3). Four countries were rated above average — UK, France, Saudi Arabia and Canada. However, seven countries were rated below average or very weak, with two countries, China and Brazil, falling into the lowest category. This might be surprising to many observers in the case of China but can be partly explained by the exceptionally high level of domestic investment which depresses the relative weight of FDI inflows.
Trade-enabling infrastructure: Unsurprisingly, G20 countries performed well on this component, recording an average openness score of 3.9, which is close to being in the above average category. Three countries, the UK, Germany, and Japan, were rated as excellent in terms of infrastructure, while a further five countries are above average. Only two countries were scored below average — India and Indonesia — and only one, Russia, received a score of very weak for infrastructure.
TABLE 6: G20 SCORES ON THE OPEN MARKETS INDEX
Trade Trade FDI Trade-enabling Aggregate openness policy openness infrastructure Rank score score score score score
Germany 19 4.0 3.0 4.7 3.3 5.5
United Kingdom 26 3.9 2.3 4.7 4.3 5.3
Saudi Arabia 27 3.9 3.1 4.5 4.8 3.6
France 28 3.9 2.5 4.8 4.1 4.9
Australia 29 3.8 2.4 4.9 3.8 4.9
Canada 30 3.8 2.4 4.9 4.5 3.8
United States 39 3.6 1.7 4.8 3.7 4.9
Italy 42 3.5 2.0 4.7 3.3 4.4
Japan 43 3.5 1.6 5.0 2.9 5.0
Korea, Rep. of 46 3.4 2.7 3.7 3.1 4.5
Turkey 51 3.1 2.0 3.8 3.8 3.4
South Africa 52 3.1 2.1 4.1 2.8 3.3
Indonesia 54 2.9 1.9 4.5 2.2 2.2
China 57 2.8 2.7 3.1 1.9 3.4
Mexico 58 2.8 1.7 3.4 3.6 3.0
Russian Federation 62 2.6 2.8 2.5 3.6 1.7
Argentina 65 2.5 1.8 2.7 2.6 3.3
India 66 2.4 2.3 2.2 2.6 2.4
Brazil 68 2.3 1.7 2.4 1.9 3.7
22 ICC Open Markets Index 2011
Summary and conclusions
Increasing trade flows will stimulate economic recovery, lead growth and spur job creation. Numerous international organizations (including the World Bank, the IMF, the OECD and the WTO) have analyzed the positive impact that further trade liberalization measures would have on jobs and growth, while there are many other reputable studies which provide robust evidence of the benefits of trade liberalization over the past 60 years.
In this report an index was developed to measure the performance of 75 economies in terms of their openness to trade. The current findings of the study are that, across the board, and despite the past progress made, countries still have much work to do to improve the openness of their economies. In this regard the findings are consistent with those of recent WTO-OECD reports which suggest that protectionism may be on the increase.
The G20 has a key role in ensuring that governments around the world work collectively to lower trade barriers and unlock jobs and growth. However, findings indicate that, rather than providing global leadership in developing open economies, the G20 achieve only average scores for openness. In particular, the high-growth BRIC economies tend to perform below average on most measures of openness.

23ICC Open Markets Index 2011
Annex 1: Bibliography
Eidgenössische Technische Hochschule Zürich, KOF, Index of GlobalizationAvailable at: http://globalization.kof.ethz.ch/
Ernst & Young and the Economist Intelligence Unit(EIU), Redrawing the map: globalization and the changing world of business. Featuring insights from the Economist Intelligence Unit, The Globalization Index 2009Available at: http://www.ey.com/Publication/vwLUAssets/Redrawing_the_map/ $FILE/Redrawing %20the%20map.pdf
Djankov, Simeon, Darshini Manraj, Caralee McLiesh and Rita Ramalho. 2005. Doing Business Indicators: Why Aggregate, and How to Do It. World Bank, Washington, DC
OECD, Working Papers on International Investment Number 2006/4. OECD’s FDI Regulatory Restrictiveness Index: Revision and extension to more Economies, Paris, Dec 2006
OECD (2011), The Impact of Trade Liberalisation on Jobs and Growth: Technical Note, OECD Trade Policy Working Papers, No. 107, OECD Publishing. Available at: http://dx.doi.org/10.1787/5kgj4jfj1nq2-en
UNCTAD, UnctadSTAT statistical data base,Available at: http://unctadstat.unctad.org/TableViewer/tableView.aspx?ReportId=88
World Bank, Doing Business Report 2010.Available at: http://www.doingbusiness.org/documents/fullreport/2010/DB10-full-report.pdf
World Bank, Doing Business, Economy Rankings;Available at: http://www.doingbusiness.org/economyrankings/
World Bank Group, Investment Advisory Services, Investing across borders 2010. Indicators of foreign direct investment regulation in 87 economies;Available at: http://iab.worldbank.org/~/media/FPDKM/IAB/Documents/IAB-report.pdf
World Bank, Connecting to Compete, Trade Logistics in the Global Economy. 2010,Available at: http://siteresources.worldbank.org/INTTLF/Resources/LPI2010_for_web.pdf
World Bank, World Development Indicators 2010,Available at: http://data.worldbank.org/indicator
World Economic Forum, The Global Enabling Trade Report 2010,Available at: http://www.weforum.org/pdf/GETR10/Global-Enabling-Trade-Report-2010.pdfWTO, Antidumping data base. Available at: http://www.wto.org/english/tratop_e/adp_e/adp_e.htm
WTO, Trade Profiles 2010.Available at: http://www.wto.org/english/res_e/statis_e/statis_e.htm
WTO, World Tariff Profiles 2009.Available at http://www.wto.org/english/res_e/statis_e/statis_e.htm

24 ICC Open Markets Index 2011
Annex 2: Country Scores
TOTAL I II III IV Trade Trade FDI Trade-Enabling Openness Policy Openness Infrastructure
Weight 100 35 35 15 15
Algeria 2.2 2.5 1.6 3.3 1.9
Argentina 2.5 1.8 2.7 2.6 3.3
Australia 3.8 2.4 4.9 3.8 4.9
Austria 4.2 3.6 4.7 3.8 4.9
Bangladesh 2.1 1.6 1.9 2.5 3.4
Belgium 4.7 4.5 4.7 5.4 4.3
Brazil 2.3 1.7 2.4 1.9 3.7
Bulgaria 4.3 3.7 4.6 5.6 3.5
Canada 3.8 2.4 4.9 4.5 3.8
Chile 3.7 2.7 4.5 4.7 3.2
China 2.8 2.7 3.1 1.9 3.4
China, Hong Kong SAR 5.4 4.9 5.7 5.9 5.3
China, Taiwan 3.8 2.8 4.5 3.7 4.7
Colombia 2.7 2.1 2.8 3.5 2.8
Cyprus 4.1 3.3 4.7 5.4 3.6
Czech Republic 4.2 3.8 4.7 4.0 4.3
Denmark 4.3 3.7 4.8 3.8 5.2
Egypt, Arab Rep. 2.6 2.1 2.6 4.7 2.1
Estonia 4.4 3.7 4.8 5.1 4.3
Ethiopia 2.1 2.7 1.6 3.0 1.3
Finland 4.0 3.0 4.8 3.5 5.2
France 3.9 2.5 4.8 4.1 4.9
Germany 4.0 3.0 4.7 3.3 5.5
Greece 3.3 2.0 4.7 2.8 3.5
Hungary 4.3 3.6 4.7 5.4 3.6
Iceland 4.3 3.4 4.7 5.2 4.4
India 2.4 2.3 2.2 2.6 2.4
Indonesia 2.9 1.9 4.5 2.2 2.2
Ireland 4.5 4.0 4.7 4.7 5.0
Israel 3.7 2.3 4.7 4.1 4.1
Italy 3.5 2.0 4.7 3.3 4.4
Japan 3.5 1.6 5.0 2.9 5.0
Jordan 3.3 2.8 3.5 5.0 2.0
Kazakhstan 3.7 3.4 3.7 4.6 3.6
Kenya 2.6 2.0 2.7 3.2 3.0
Korea, Rep. of 3.4 2.7 3.7 3.1 4.5
Latvia 4.0 3.1 4.7 3.8 4.5
Lithuania 4.0 3.5 4.7 3.8 3.5
Luxembourg 4.8 4.8 4.7 4.9 4.7
Malaysia 3.8 3.5 4.1 3.8 4.1
Malta 4.0 3.4 4.7 5.1 2.6
Mexico 2.8 1.7 3.4 3.6 3.0
Morocco 2.7 2.4 2.1 3.7 3.6

25ICC Open Markets Index 2011
TOTAL I II III IV Trade Trade FDI Trade-Enabling Openness Policy Openness Infrastructure
Weight 100 35 35 15 15
Malaysia 3.8 3.5 4.1 3.8 4.1
Malta 4.0 3.4 4.7 5.1 2.6
Mexico 2.8 1.7 3.4 3.6 3.0
Morocco 2.7 2.4 2.1 3.7 3.6
Netherlands, The 4.6 4.2 4.8 4.7 5.2
New Zealand 3.7 2.4 5.5 3.2 3.3
Nigeria 2.8 2.4 2.4 4.2 3.4
Norway 4.0 3.4 5.0 3.4 3.7
Pakistan 2.2 1.7 2.4 3.0 2.2
Peru 3.1 1.9 4.7 2.7 2.3
Philippines 3.2 1.7 4.4 3.2 3.6
Poland 3.8 2.7 4.7 3.9 4.1
Portugal 3.5 2.1 4.7 3.9 3.6
Romania 3.7 2.9 4.7 4.1 3.2
Russian Federation 2.6 2.8 2.5 3.6 1.7
Saudi Arabia 3.9 3.1 4.5 4.8 3.6
Singapore 5.3 4.9 5.5 5.9 5.3
Slovak Republic 4.3 4.3 4.6 3.9 3.9
Slovenia 4.0 3.7 4.7 3.5 3.4
South Africa 3.1 2.1 4.1 2.8 3.3
Spain 3.6 2.3 4.7 2.8 4.4
Sri Lanka 2.2 1.6 2.9 2.5 1.6
Sudan 2.2 2.8 1.6 3.1 1.3
Sweden 4.3 3.2 4.8 4.5 5.6
Switzerland 4.4 3.7 4.8 4.6 5.3
Thailand 3.4 3.0 3.9 3.5 3.3
Tunisia 2.6 2.5 1.9 4.2 2.7
Turkey 3.1 2.0 3.8 3.8 3.4
Uganda 2.3 1.9 2.6 3.2 2.1
Ukraine 3.4 2.4 4.6 3.9 2.4
United Arab Emirates 4.7 5.2 4.5 3.6 5.0
United Kingdom 3.9 2.3 4.7 4.3 5.3
United States 3.6 1.7 4.8 3.7 4.9
Uruguay 2.9 1.9 3.5 3.7 3.0
Venezuela, B.R. 2.2 2.2 2.6 1.2 2.6
Vietnam 3.1 3.5 2.7 3.3 2.9
26 ICC Open Markets Index 2011
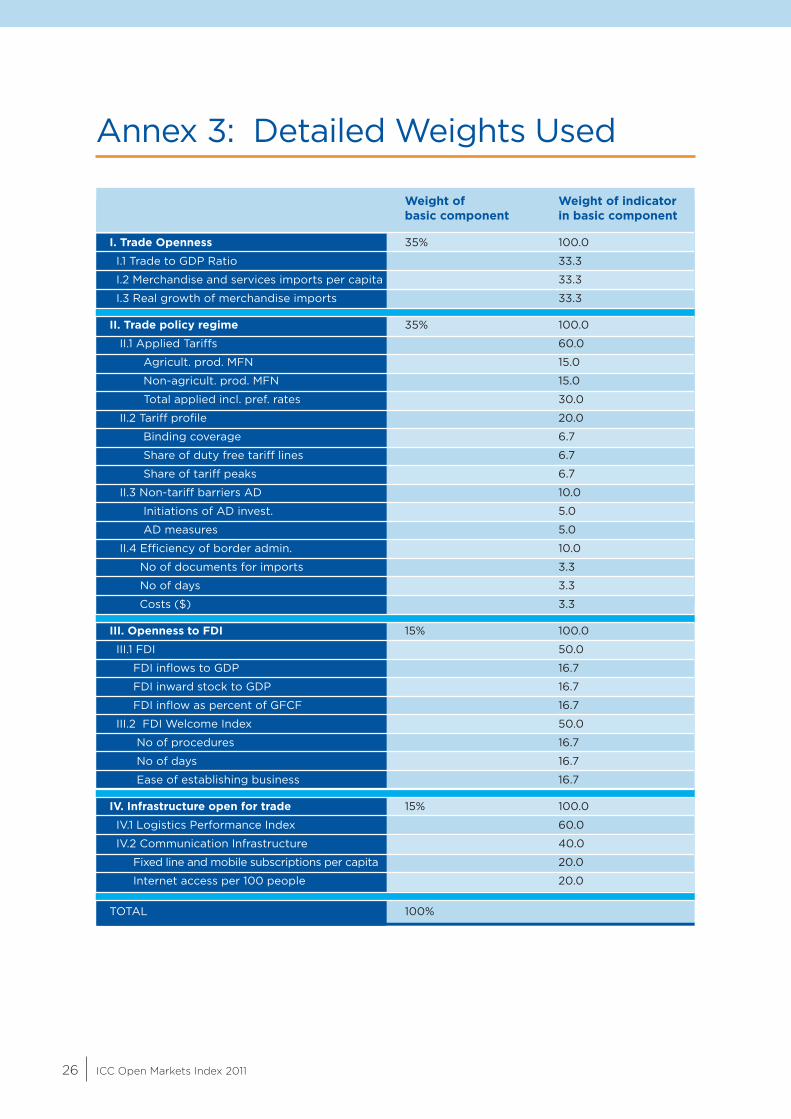
Annex 3: Detailed Weights Used
Weight of Weight of indicator basic component in basic component
I. Trade Openness 35% 100.0
I.1 Trade to GDP Ratio 33.3
I.2 Merchandise and services imports per capita 33.3
I.3 Real growth of merchandise imports 33.3
II. Trade policy regime 35% 100.0
II.1 Applied Tariffs 60.0
Agricult. prod. MFN 15.0
Non-agricult. prod. MFN 15.0
Total applied incl. pref. rates 30.0
II.2 Tariff profile 20.0
Binding coverage 6.7
Share of duty free tariff lines 6.7
Share of tariff peaks 6.7
II.3 Non-tariff barriers AD 10.0
Initiations of AD invest. 5.0
AD measures 5.0
II.4 Efficiency of border admin. 10.0
No of documents for imports 3.3
No of days 3.3
Costs ($) 3.3
III. Openness to FDI 15% 100.0
III.1 FDI 50.0
FDI inflows to GDP 16.7
FDI inward stock to GDP 16.7
FDI inflow as percent of GFCF 16.7
III.2 FDI Welcome Index 50.0
No of procedures 16.7
No of days 16.7
Ease of establishing business 16.7
IV. Infrastructure open for trade 15% 100.0
IV.1 Logistics Performance Index 60.0
IV.2 Communication Infrastructure 40.0
Fixed line and mobile subscriptions per capita 20.0
Internet access per 100 people 20.0
TOTAL 100%

27ICC Open Markets Index 2011
The International Chamber of Commerce
ICC is the world business organization, a representative body that speaks with authority on behalf of enterprises from all sectors in every part of the world.
The fundamental mission of ICC is to promote trade and investment across frontiers and help business corporations meet the challenges and opportunities of globalization. Its conviction that trade is a powerful force for peace and prosperity dates from the organization’s origins early in the last century. The small group of far-sighted business leaders who founded ICC called themselves “the merchants of peace”.
ICC has three main activities: rules-setting, dispute resolution and policy. Because its member companies and associations are themselves engaged in international business, ICC has unrivalled authority in making rules that govern the conduct of business across borders. Although these rules are voluntary, they are observed in countless thousands of transactions every day and have become part of the fabric of international trade.
ICC also provides essential services, foremost among them the ICC International Court of Arbitration, the world’s leading arbitral institution. Another service is the World Chambers Federation, ICC’s worldwide network of chambers of commerce, fostering interaction and exchange of chamber best practice.
Business leaders and experts drawn from the ICC membership establish the business stance on broad issues of trade and investment policy as well as on vital technical and sectoral subjects. These include financial services, information technologies, telecommunications, marketing ethics, the environment, transportation, competition law and intellectual property, among others.
ICC enjoys a close working relationship with the United Nations and other intergovernmental organizations, including the World Trade Organization, the G20 and the G8.
ICC was founded in 1919. Today it groups hundreds of thousands of member companies and associations from over 120 countries. National committees work with their members to address the concerns of business in their countries and convey to their governments the business views formulated by ICC.
For information on how to join ICC, visit the ICC website (iccwbo.org) or contact the ICC Membership Department in Paris.
38 cours Albert 1er, 75008 Paris, FranceTel: +33 (0)1 49 53 28 28 Fax: +33 (0)1 49 53 28 59E-mail [email protected] Website www.iccwbo.org

International Chamber of Commerce38 cours Albert 1er 75008 Paris, FranceTel: +33 (0)1 49 53 28 28 Fax: +33 (0)1 49 53 28 59Website: www.iccwbo.org
INTERNATIONAL CHAMBER OF COMMERCE
OPEN MARKETSINDEX
2011