Embed Size (px)
Citation preview
(Multinational Finance Journal, 2001, vol. 5, no. 3, pp. 155–173)
©Multinational Finance Society , a nonprofit corporation. All rights reserved.
Emerging Markets: Investing with Political Risk
Ephraim Clark Middlesex University, U.K.
Radu TunaruMiddlesex University, U.K.
This paper presents a model tha t measures the impact of political risk on
portfolio investment when the political risks are multivariate and correlated
across countries. The multivariate approach generalizes the single country
model but retains most of its characteristics in terms of its ability to price
political risk based on the stochastic process of exposure to loss and the
expected frequency of loss causing events. The methodology is compatible with
modern portfolio theory, straightforward to apply and can accommodate the
traditional techniques in political risk assessment for the estimation of the
relevant parameters (JEL D81, F23, G22, G31).
Keywords: geometric Brownian motion, insurance policy, Poisson arrival
process, portfolio investment, political risk.
I. Introduction
The diversification benefits of portfolio investment in emerging marketshas become a prominent feature of the financial globalization sweepingthe world over the last decade. Besides market risk, however,investments in emerging markets are also exposed to politicalphenomena that are not generally present in the more developedeconomies. The Russian default, the Mexican peso crisis and the Asianeconomic meltdown are three of the more spectacular examples. Thisproblem is well known to banks and multinational companies by thename of country or political risk and assessment techniques in thesedomains are relatively well developed. They are, however, generally

Multinational Finance Journal156
1. One exception is Clark (1991).
2. The problem of integrating political risk into foreign investment theory was discussed
by Brewer (1991) and general issues related to the measurement of a firm’s exposure to
political risk were emphasized by Sethi and Luther (1986).
unadapted to portfolio investment in that they tend to ignore thediversification aspect associated with cross country correlations and aredifficult to translate into practical decisions.1, 2
Political risk for portfolio investment shares many of thecharacteristics of political risk for foreign direct investment (FDI). Forexample, portfolio investment values and cash flows are affected whenpolitical change causes unanticipated discontinuities in the businessenvironment. This is the Robock and Simmonds (1973) definition ofpolitical risk. They are also affected by the risks pointed out by Root(1973) that include potential restrictions on the transfer of funds,products, technology and people, uncertainty about policies, regulations,governmental administrative procedures, and, finally, risks on controlof capital such as discrimination against foreign firms, expropriation,forced local shareholding, etc. Wars, revolutions, social upheavals,strikes, economic growth, inflation and exchange rates all figure in thepolitical risk literature and, obviously, are capable of affecting portfolioinvestment as well as direct investment.
Assessment techniques for political risk are as wide-ranging as thesources that generate it. Traditional methods for assessing political riskrange from the comparative techniques of rating and mapping systemsto the analytical techniques of special reports, dynamic segmentation,expert systems, and probability determination to the econometrictechniques of model building and discriminant and logit analysis. Thesetechniques are very useful for identifying and analysing individualsources of political risk but can handle neither cross relationships(correlations) nor accurate measurements of loss levels generated by therisks in question. For this reason it is difficult to translate the analysisinto a practical decision making tool.
Traditional methods for incorporating political risk in the capitalbudgeting process are based on the work of Stonehill and Nathanson(1968) and Shapiro (1978) and Robock (1971). The first approachinvolves an ad hoc adjustment of the project's expected future cashflows to account for losses due to political risk while the secondapproach involves an ad hoc adjustment of the discount rate. Neitherapproach is consistent with the diversification principle of modernportfolio theory.
157Investing with Political Risk
3. See Hull (2000, pp. 498-505) for a clear exposition of the theoretical framework
linking systematic risk and the pricing of options.
More modern but less known methods for the evaluation of politicalrisk and its incorporation in the capital budgeting process apply optionpricing techniques that are consistent with modern portfolio theory andthat can produce accurate measurements of the loss levels generated bythe risks in question.3 Mahajan (1990) considers a single source of risk,expropriation, and measures its cost as the value of a European style calloption held by the government on a non-dividend paying investment.Clark (1997 and 1998) extends Mahajan to consider various types ofpolitical risk, including expropriation. He uses an American style optionframework that includes dividends and measures the cost of politicalrisk as the value of an insurance policy that pays off all losses resultingfrom political events, which follow a Poisson process. Because thepricing mechanism is consistent with the diversification principle ofmodern portfolio theory, incorporating the political risk in the capitalbudgeting process involves estimating the project’s NPV in the absenceof political risk and then subtracting the cost of political risk reflectedin the price of the option (Mahajan, [1990]) or the insurance policy(Clark, [1997] and [1998]). The same approach can be applied toportfolio investment.
This paper develops the theoretical framework for such an approachregarding the portfolio’s exposure to political risk, which isconceptualised as an evolutionary process incorporating a continuousstochastic element and the discrete arrival of events that generate losses.It also proposes a major innovation. The foregoing “real option”approach assumes that individual political risks are uncorrelated witheach other. Recent experience with “contagion” (for example, Mexicoin 1994 and Asia in 1997) and the political fallout it engenders suggeststhat this assumption is unrealistic. Thus, this paper generalizes Clark(1997 and 1998) and considers (for the first time to our knowledge) thecase of multiple sources of risk that are correlated across countries. Thismultivariate approach explicitly integrates the cross-country correlationsin the estimation of the exposures to loss.
The rest of the paper is organised as follows. In section II wedevelop a general model for political risk in several countries where therisk is correlated across countries. Section III describes themathematical properties of the model and proposes a solution for the
Multinational Finance Journal158
4. The assumption here is that the level of political risk is constant. If this were not the
case, losses could occur if something happened to increase the level of political risk.
two country case. Section IV uses the two country solution to show howthe model can be implemented in practice and to analyse the effect ofthe key parameters, country volatility and correlations on the cost ofpolitical risk. Section V summarizes the conclusions.
II. Modelling Political Risk with Correlated Random Errors
Let xi(t) be a geometric Brownian motion representing the exposure ofa portfolio to loss in the case of an explicit political event in country imeasured in a common numeraire currency such as the US dollar.Taking a portfolio consisting of n countries, the model is described by:
, (1)
where i = 1, ..., n and where "i is the rate of growth of exposure to lossin country i; this depends on the rate of growth of the value of theinvestment determined by the investment’s growth rate; dzi(t) is aWiener process with zero mean and variance equal to dt; and Fi
2 is thevariance of dx/xi .The Wiener processes are correlated with E(dzi dzj) =Di,j dt, and when I = j , Dii=1.
The parameter Fi can be interpreted as the level of political risk incountry i. It refers to ongoing change and measures the volatility ofexposure to loss due to the ebbs and flows of the economic, social andpolitical climate in the country. Volatility in the country’s economic,social and political climate causes fluctuations in the amounts that canbe lost if a loss causing political event actually occurs. The higher thevolatility, the larger the fluctuations. The parameter Di,j dt captures theextent to which the economic, social and political climate in one countryis correlated with the economic, social and political climate in anothercountry.
A volatile economic, social and political climate does not in itselfcause actual losses. For a loss to occur an explicit political event, suchas legislation or decrees involving taxes, surcharges, tariffs ordevaluation, strikes, boycotts, terrorist acts, etc., must take place.4
Suppose that loss causing political events occur at random times
159Investing with Political Risk
5. Risk neutrality holds in the risky world if we recognize that the drift parameter a in
the risk neutral world is equal to "* – B(Rm – r), the risk adjusted growth rate minus the risk
premium where B(Rm – r) represents the CAPM’s risk premium. See, for example, Hull
(2000, pp 498-522) and Neftci (2000, pp 122-124 and 312-344). Relaxing the assumption
of a constant riskless rate for a more realistic representation of the world economy is a
promising avenue of research in the area.
6. The numeraire currency will usually be the base country of the investor. For the
example described in section IV the investor is a US fund manager so the riskless rate is the
one corresponding to the dollar.
according to a Poisson arrival process with intensity parameter 8i andthat each time a Poisson event occurs, there is a jump of magnitudeequal to 1. Although Poisson events may occur more frequently inemerging markets, they are still rare events by definition with mean andstandard deviation equal to the parameter 8. The arrival rates can varyfrom country to country, where a higher rate represents a higher risk.The risk environment is also captured in the geometric Brownian motionthat models the amount at risk. Thus, if the potential loss is xi(t) whena Poisson event occurs in country i, the expected loss per time intervalin country i is then equal to 8i xi(t) dt. Therefore 8i can be called thecurrent political risk probability parameter for country i.
Following Clark (1997), the tool proposed for measuring the cost ofpolitical risk is the value V of a hypothetical insurance policy that paysoff any and all losses up to the value of the investment arising frompolitical events. Since stocks typically have no fixed maturity date, it isassumed that the insurance policy associated with the stocks has nofixed maturity date either and can be viewed as a perpetual claim. Thismeans that V does not depend directly on time and, therefore, is afunction of only the exposures to political losses from the group ofcountries where the investments are made, V = V(x1 (t), ..., xn (t)).
The expected total return on the insurance policy is equal to thecapital gain E(dV) plus the expected cash flows:
,
generated by the explicit events in all countries over the time interval dt.With no loss of generality, assume risk neutrality and a constant riskfree interest rate on the numeraire currency r.5 Hence, the insurancepolicy will yield the riskless rate6 so that:
Multinational Finance Journal160
. (2)
Applying a multivariate version of Ito’s lemma, see Wilmott (1998), forV = V(x1 (t), ..., xn (t)) and taking expectations, gives the followingpartial differential equation:
(3)
III. Mathematical Solution
A general class of solutions to equation 3 is given by:
, (4)
where the exponents in the second summation are determined fromboundary conditions. One suitable set of boundary conditions (but notthe only set) is based on the argument often applied in the insuranceindustry that the exposure to loss in any country can never be greaterthan the cost of the investment. If Si represents the cost of theinvestment in country i, this gives:
,
, (5)
...
.
The particular solution to equation 3 for n countries depends on itsclassification as parabolic, hyperbolic or elliptical, which must bedetermined from the discriminant matrix. For the purposes oftractability and comprehension, we solve for the particular case of onlytwo countries and then use this solution for the example given in section
161Investing with Political Risk
IV. The mathematical solution, even for n = 2, is quite complicated andthere are many possibilities depending on the coefficients of the partialdifferential equation. This, however, does not weaken the practicalpertinence of the model since numerical methods can easily provide afeasible solution for any number of countries greater than 2 at theexpense of power computation.
This section contains a summary of the mathematical solutions forthe case of n = 2. The partial differential equation to be solved is then:
(6)
,
where the last term denotes the total losses given by the arrival ofPoisson events, that is, 7=281 x1 +282 x2. This is a partial differentialequation of second order and it has been the subject of intensiveresearch in the literature, especially in mathematical physics. Themathematical techniques used for solving this equation and the finalsolutions depend on the relationships between the coefficients. Adiscussion of this equation is provided in textbooks such as O’Neil(1999). The domain of interest for our economic problem is:
that is, only the first quadrant of the plane.The first step is to calculate the discriminant of this equation, which isequal to:
. (7)
This simply means that the equation for the covering policy can beeither parabolic, when D12 = ±1, that is when the Wiener processes areperfectly linearly correlated (positive or negative); or elliptic, when
. Since a perfect correlation between the error terms given by
the Wiener processes is unlikely in practical applications, only theelliptic class of the partial differential equations is considered. Withoutreducing the generality of the problem, the calculus for the derivation

Multinational Finance Journal162
of the solution can be simplified by assuming that F1 > F2.The general method of solving elliptic, second order partial
differential equations is based on transforming the equation to acanonical form (O’Neil, [1999], pp 39). There are an infinite numberof solutions and extra conditions are required in order to identify aunique solution. A second order ordinary differential equation has aunique solution when the value of the solution at a point and the valueof its derivative at that point are specified. In a similar context with theone described here, this argument has been emphasized in Clark (1997).Since the equation is a second order partial differential equation, asimilar methodology can be implemented to get a unique solution. Theidea is to specify the values of the solution under some known extraconditions. A rationale for these extra conditions in the general case isprovided by O’Neil (1999).
After a cumbersome sequence of transformations following themethodology described in Kevorkian (1990) and O’Neil (1999), it waspossible to identify a class of solutions for the PDE (6). This class ofanalytical solutions (an infinite number) is given by:
, (8)
where w and h have the formulae presented in appendix 2. The effectsof country correlation represented by D enter the solution via theexponents of the first term that makes the solution nonlinear. It isexactly this term that accounts for the difference in the quantitativesolution from a simple additive solution of the cost of political risk forsingle countries.
The boundary conditions described below identify a single solutionfrom the whole class of solutions that gives the exact cost of politicalrisk for the entire portfolio.
The boundary conditions
In order to have a unique solution, the boundary conditions must bespecified. For partial differential equations of second order it is notsufficient to give just the values in a fixed point of the solution’sdomain. The values of the solution along a given curve ', like any ofthe axes V(x1,0), are usually given. However, this cannot be done forthe problem at hand because of the restricted domain.
163Investing with Political Risk
From the many possibilities that are mathematically feasible,equation 5 defines a set of boundary conditions that are economicallycoherent and often applied in the insurance industry: the exposure toloss in any country can never be greater than the cost of the investment.Let VClark(x) be the solution of the covering policy in only one countryand S1 and S2 be the investment outlay for countries 1 and 2respectively. The boundary conditions are then given as:
, (9a)
and
, (9b)
for any x1 > 0, x2 > 0. The exit values act as absorbing barriers in thesense that once the risk exposure in one country reaches this value, itstays there forever and the value of coverage is equal to the cost of theinvestment. Consequently, the covering policy V varies only in the othercountry and therefore, a unidimensional solution can be employed.
One last remark in this section. From the boundary conditionsproposed above, in order to have economic sense, it follows thatr–"1–81 and r–"2–82 should both be greater than zero. In addition, thefeasible domain changes to:
.
IV. Application and Analysis
This section shows how to implement this tool in the portfolio riskanalysis involving two countries and then analyzes the effects of the keyparameters on the cost of political risk.
Consider the case of a US fund manager contemplating a $200million investment in Polish equities and a $300 million investment inHungarian equities. The riskless rate on the US dollar is 6.5% and theexpected rate of capital appreciation on the Polish equities is 2% and onthe Hungarian equities it is 1% so that "1=0.02, "2=0.01. Total dividendpayments are forecasted as $35 million per year for the Polish equitiesand $50 million per year for the Hungarian equities. Based on historicaldata, loss causing events are expected to arrive at a rate of 81=0.02 for
Multinational Finance Journal164
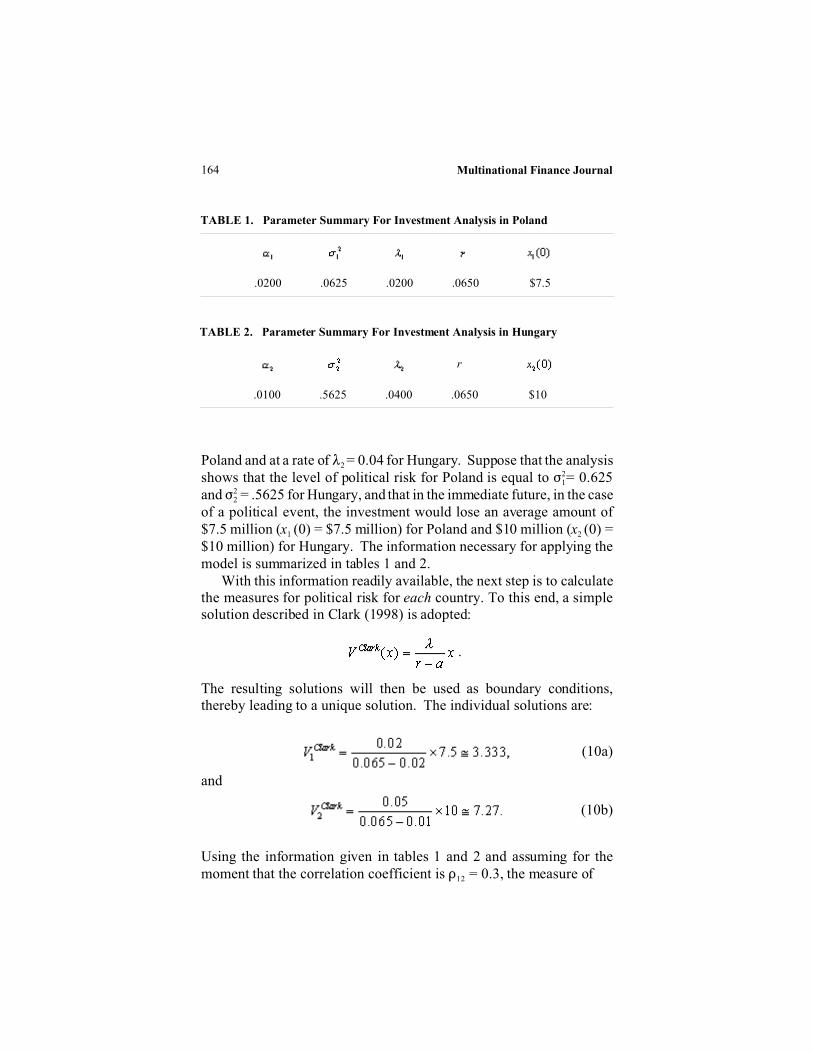
Poland and at a rate of 82 = 0.04 for Hungary. Suppose that the analysisshows that the level of political risk for Poland is equal to F1
2= 0.625and F2
2 = .5625 for Hungary, and that in the immediate future, in the caseof a political event, the investment would lose an average amount of$7.5 million (x1 (0) = $7.5 million) for Poland and $10 million (x2 (0) =$10 million) for Hungary. The information necessary for applying themodel is summarized in tables 1 and 2.
With this information readily available, the next step is to calculatethe measures for political risk for each country. To this end, a simplesolution described in Clark (1998) is adopted:
.
The resulting solutions will then be used as boundary conditions,thereby leading to a unique solution. The individual solutions are:
(10a)
and
(10b)
Using the information given in tables 1 and 2 and assuming for themoment that the correlation coefficient is D12 = 0.3, the measure of
TABLE 1. Parameter Summary For Investment Analysis in Poland
.0200 .0625 .0200 .0650 $7.5
TABLE 2. Parameter Summary For Investment Analysis in Hungary
r
.0100 .5625 .0400 .0650 $10
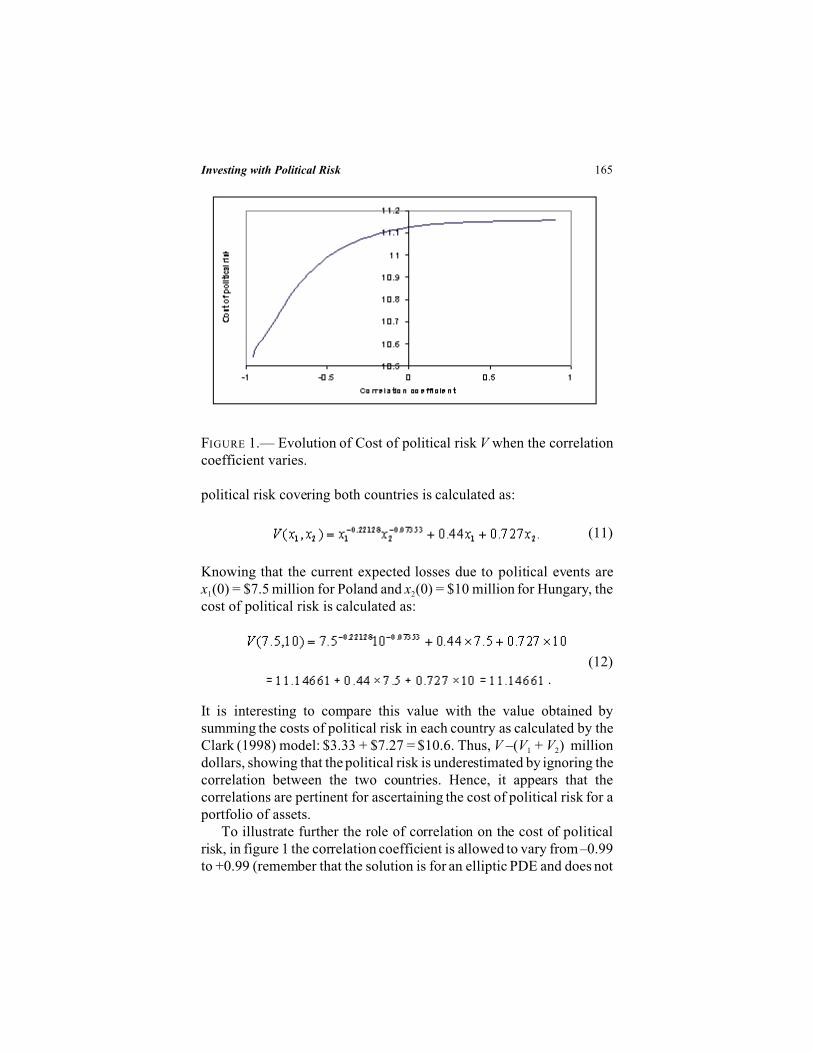
165Investing with Political Risk
FIGURE 1.— Evolution of Cost of political risk V when the correlationcoefficient varies.
political risk covering both countries is calculated as:
(11)
Knowing that the current expected losses due to political events arex1(0) = $7.5 million for Poland and x2(0) = $10 million for Hungary, thecost of political risk is calculated as:
(12).
It is interesting to compare this value with the value obtained bysumming the costs of political risk in each country as calculated by theClark (1998) model: $3.33 + $7.27 = $10.6. Thus, V –(V1 + V2) milliondollars, showing that the political risk is underestimated by ignoring thecorrelation between the two countries. Hence, it appears that thecorrelations are pertinent for ascertaining the cost of political risk for aportfolio of assets.
To illustrate further the role of correlation on the cost of politicalrisk, in figure 1 the correlation coefficient is allowed to vary from –0.99to +0.99 (remember that the solution is for an elliptic PDE and does not
Multinational Finance Journal166
hold for D = ±1). Notice that lower levels of D are associated with lowerlevels of political risk. This result has intuitive appeal in that itcorresponds to well established results in financial theory.
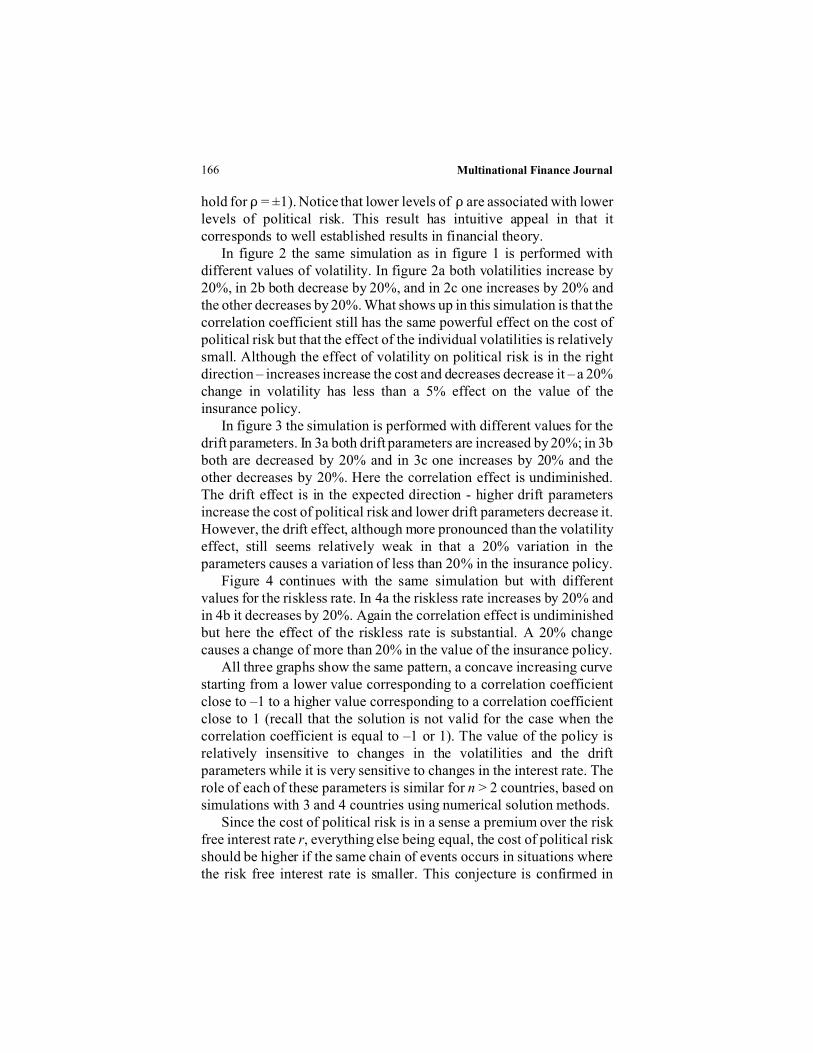
In figure 2 the same simulation as in figure 1 is performed withdifferent values of volatility. In figure 2a both volatilities increase by20%, in 2b both decrease by 20%, and in 2c one increases by 20% andthe other decreases by 20%. What shows up in this simulation is that thecorrelation coefficient still has the same powerful effect on the cost ofpolitical risk but that the effect of the individual volatilities is relativelysmall. Although the effect of volatility on political risk is in the rightdirection – increases increase the cost and decreases decrease it – a 20%change in volatility has less than a 5% effect on the value of theinsurance policy.
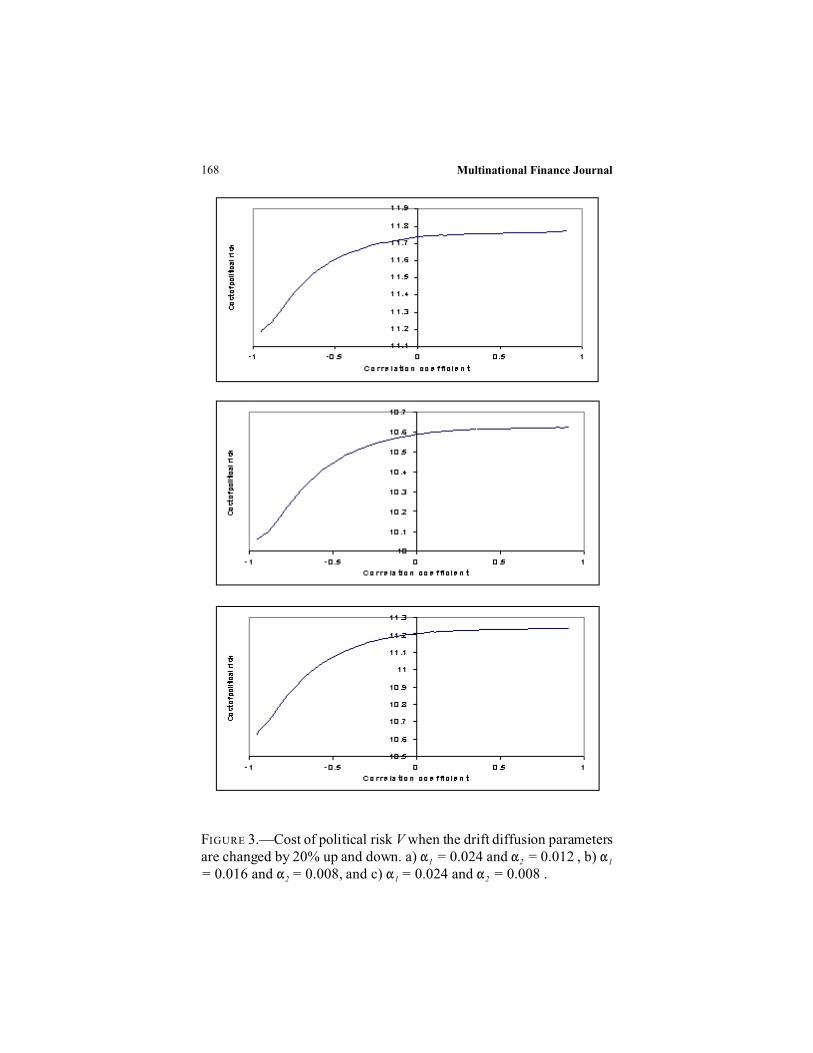
In figure 3 the simulation is performed with different values for thedrift parameters. In 3a both drift parameters are increased by 20%; in 3bboth are decreased by 20% and in 3c one increases by 20% and theother decreases by 20%. Here the correlation effect is undiminished.The drift effect is in the expected direction - higher drift parametersincrease the cost of political risk and lower drift parameters decrease it.However, the drift effect, although more pronounced than the volatilityeffect, still seems relatively weak in that a 20% variation in theparameters causes a variation of less than 20% in the insurance policy.
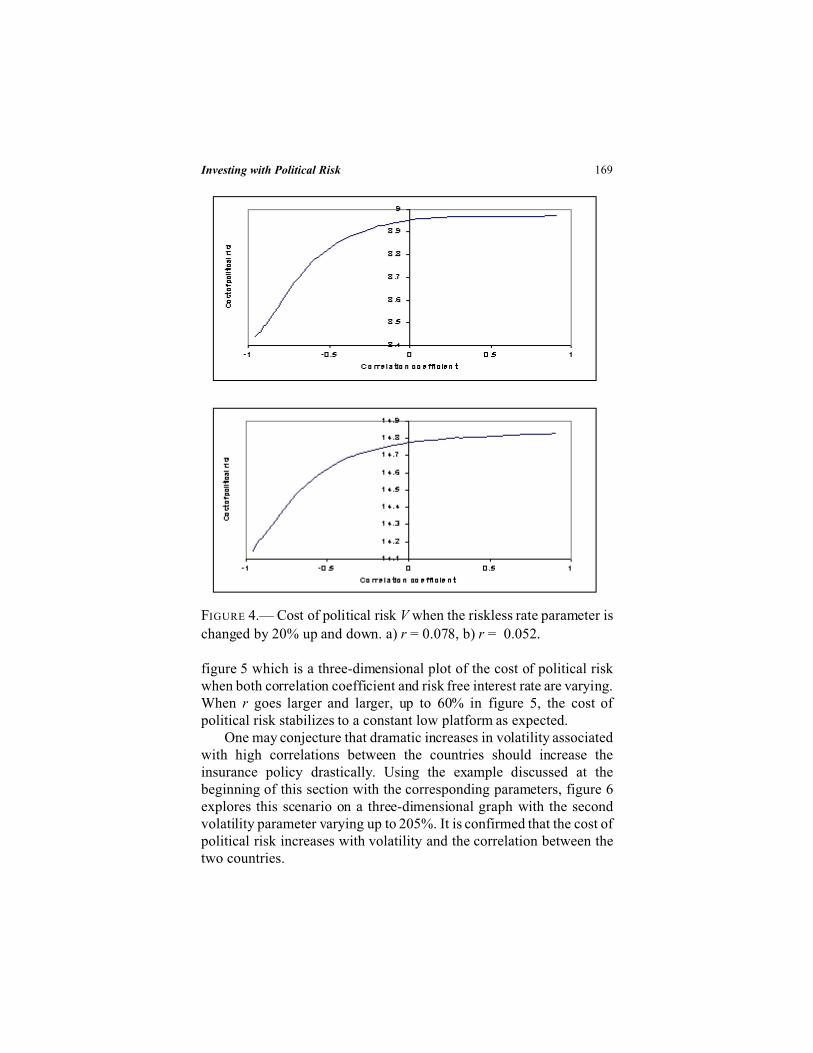
Figure 4 continues with the same simulation but with differentvalues for the riskless rate. In 4a the riskless rate increases by 20% andin 4b it decreases by 20%. Again the correlation effect is undiminishedbut here the effect of the riskless rate is substantial. A 20% changecauses a change of more than 20% in the value of the insurance policy.
All three graphs show the same pattern, a concave increasing curvestarting from a lower value corresponding to a correlation coefficientclose to –1 to a higher value corresponding to a correlation coefficientclose to 1 (recall that the solution is not valid for the case when thecorrelation coefficient is equal to –1 or 1). The value of the policy isrelatively insensitive to changes in the volatilities and the driftparameters while it is very sensitive to changes in the interest rate. Therole of each of these parameters is similar for n > 2 countries, based onsimulations with 3 and 4 countries using numerical solution methods.
Since the cost of political risk is in a sense a premium over the riskfree interest rate r, everything else being equal, the cost of political riskshould be higher if the same chain of events occurs in situations wherethe risk free interest rate is smaller. This conjecture is confirmed in
167Investing with Political Risk
FIGURE 2.— Cost of political risk V when the volatility parameters arechanged by 20% up and down. a) F1 = 0.3 and F2 = 0.9 , b) F1 = 0.2 and
F2 = 0.6, and c) F1 = 0.3 and F2 = 0.6.
Multinational Finance Journal168
FIGURE 3.—Cost of political risk V when the drift diffusion parametersare changed by 20% up and down. a) "1 = 0.024 and "2 = 0.012 , b) "1
= 0.016 and "2 = 0.008, and c) "1 = 0.024 and "2 = 0.008 .
169Investing with Political Risk
FIGURE 4.— Cost of political risk V when the riskless rate parameter is
changed by 20% up and down. a) r = 0.078, b) r = 0.052.
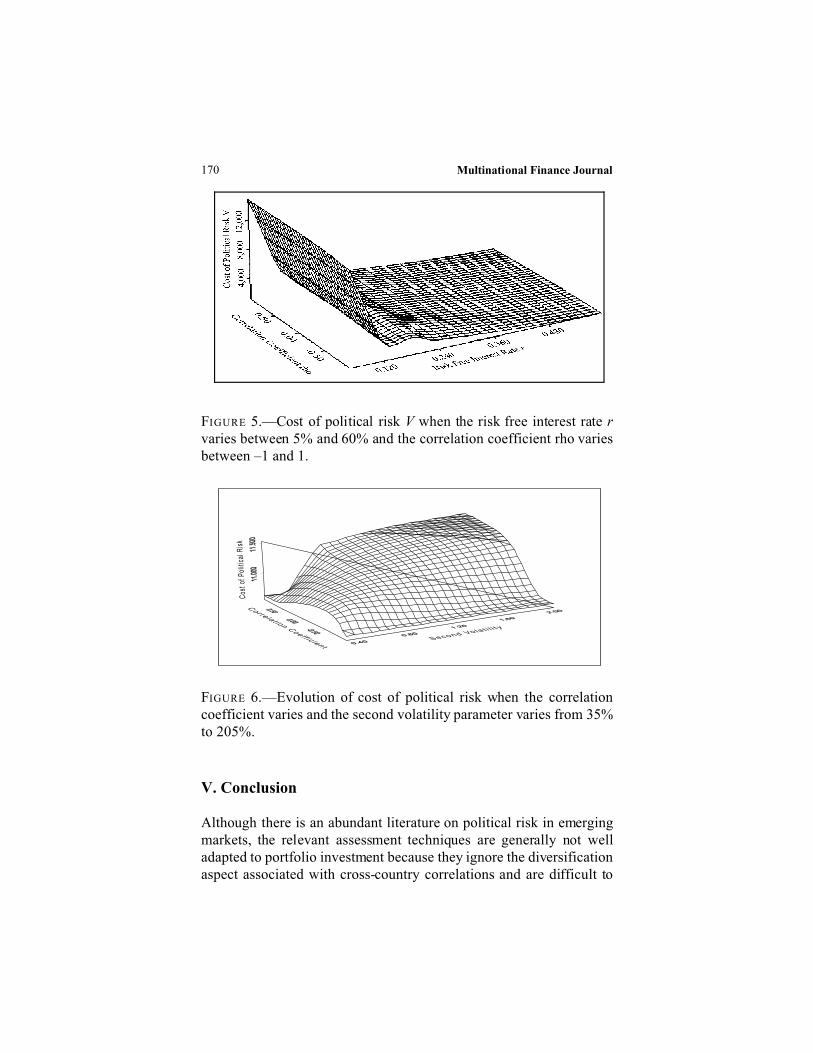
figure 5 which is a three-dimensional plot of the cost of political riskwhen both correlation coefficient and risk free interest rate are varying.When r goes larger and larger, up to 60% in figure 5, the cost ofpolitical risk stabilizes to a constant low platform as expected.
One may conjecture that dramatic increases in volatility associatedwith high correlations between the countries should increase theinsurance policy drastically. Using the example discussed at thebeginning of this section with the corresponding parameters, figure 6explores this scenario on a three-dimensional graph with the secondvolatility parameter varying up to 205%. It is confirmed that the cost ofpolitical risk increases with volatility and the correlation between thetwo countries.
Multinational Finance Journal170
FIGURE 5.—Cost of political risk V when the risk free interest rate rvaries between 5% and 60% and the correlation coefficient rho variesbetween –1 and 1.
FIGURE 6.—Evolution of cost of political risk when the correlationcoefficient varies and the second volatility parameter varies from 35%to 205%.
V. Conclusion
Although there is an abundant literature on political risk in emergingmarkets, the relevant assessment techniques are generally not welladapted to portfolio investment because they ignore the diversificationaspect associated with cross-country correlations and are difficult to
171Investing with Political Risk
translate into practical decisions. This paper developed a framework forovercoming these problems and extended the methodology proposed inClark (1997 and 1998) to international portfolio investment. Usingeconomic intuition to determine the boundary conditions, it also showedhow to derive an analytical solution for the case of two countries. Thesame kind of economic intuition can be used along with numericalmethods to derive solutions for any number of countries. Finally, in thesimulation of the two-country case, it showed how the methodology canbe applied in practice to estimate the political risk of an internationalinvestment portfolio and that cross-country correlations have a crucialimpact on its actual riskiness.
The methodology is tractable and compatible with modern portfoliotheory. It is also relatively straightforward to apply in practice. A majorfeature of the methodology is that it can accommodate the traditionaltechniques in political risk assessment for the estimation of the relevantparameters. Thus, as a complementary tool, it enhances their value andmakes it possible for them to be effectively applied in the domain ofportfolio investment.
Further research involves a case study of a portfolio consisting of alarge number of countries and the development of tools for testing themethodology using an endogenous Bayesian updating process.
Appendix 1 - The Derivation of Equation
Using a multivariate version of Ito lemma, see Wilmott (1998), gives:
. (1A)
Recalling that V does not depend on time and replacing dxi gives:
. (2A)
Taking the expectation and using the properties of Wiener processes, gives
, (3A)
and therefore equation 2 becomes:
Multinational Finance Journal172
. (4A)
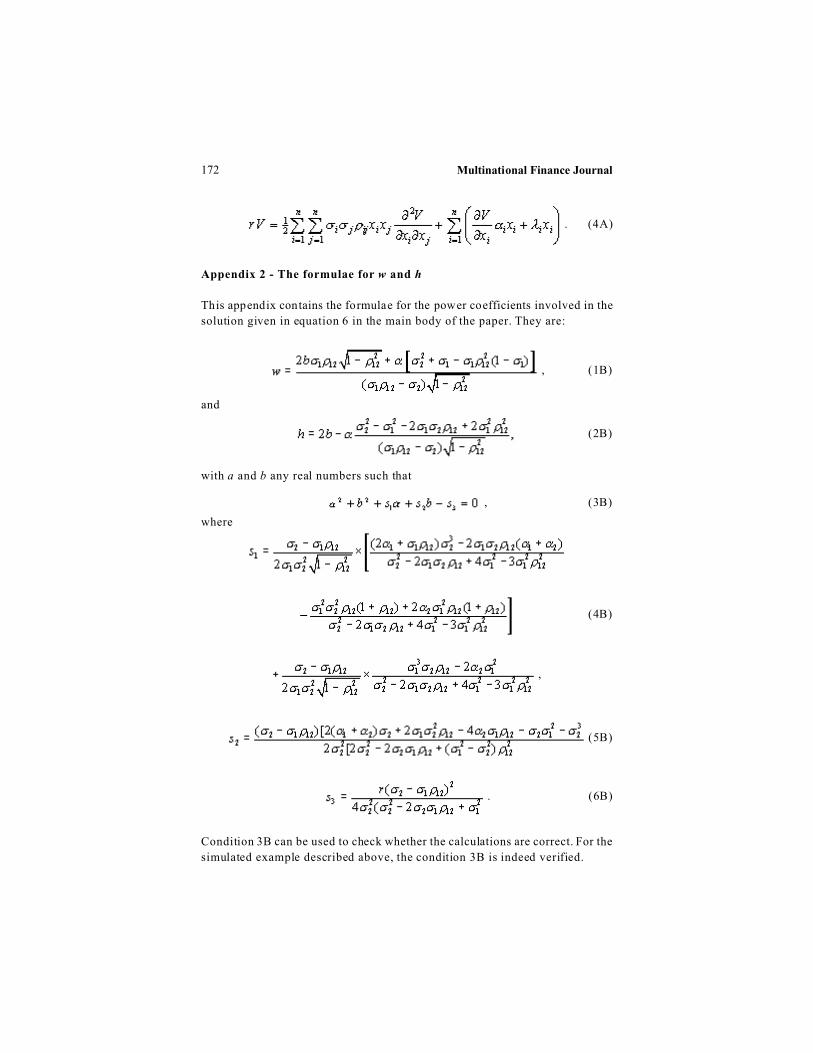
Appendix 2 - The formulae for w and h
This appendix contains the formulae for the power coefficients involved in the
solution given in equation 6 in the main body of the paper. They are:
, (1B)
and
(2B)
with a and b any real numbers such that
, (3B)
where
(4B)
,
(5B)
. (6B)
Condition 3B can be used to check whether the calculations are correct. For the
simulated example described above, the condition 3B is indeed verified.
173Investing with Political Risk
References
Brewer, T.L. 1991. Integrating political variables into foreign investment
theory: An analytical framework. Paper presented at the 1991 AIB meeting
in Miami.
Clark, E. 1991. Cross border investment risk. London: Euromoney Publications.
Clark, E. 1997. Valuing political risk. Journal of International Money and
Finance 16: 477-490.
Clark, E. 1998. Political risk in Hong Kong and Taiwan: Pricing the China
factor, Journal of Economic Integration 13 (2): 276-291.
Hull, J.C. 1999. Options, futures, & other derivatives. 4th edition, London:
Prentice Hall International.
Kevorkian, J. 1990. Partial differential equations. Analytical solution
Techniques. New York: Chapman & Hall.
Mahajan, A. 1990. Pricing expropriation risk, Financial Management
(Winter): 77-86.
O’Neil , P.V. 1999 . Beginning partial differential equations. New York: John
Wiley & Sons.
Robock, S. H. and Simmonds, K. 1973. International business and multinational
enterprise. Homewood: R. Irwin.
Root, F. 1973. Analysing political risks in international business. In A. Kapoor
and Ph. D. Grub (eds). Multinational Enterprise in Transition. Princeton:
Darwin Press.
Sethi, P.S., and Luther, K.N. 1986. Political risk analyses and direct foreign
investment: Some problems of definition and measurement, California
Management Review 28: 57-68.
Shapiro, A. C. 1978. Capital budgeting for the multinational corporation,
Financial Management 7 (Spring): 7-16.
Stonehill, A., and Nathanson, L. 1968. Capital budgeting and the multinational
corporation, California Management Review 4 (Summer): 39-54.
Wilmott, P. 1998. Derivatives: The theory and practice of financial engineering.
London: John Wiley & Sons.