Embed Size (px)
Citation preview
Ocean Rig UDW Inc.
NASDAQ: “ORIG” September, 2015
Pareto Oil Conference
Company Presentation
Forward Looking Statements
Matters discussed in this presentation may constitute forward-looking statements within the meaning of the Private Securities Litigation Reform Act of 1995. The Private Securities Litigation Reform Act of 1995 provides safe harbor protections for forward-looking statements in order to encourage companies to provide prospective information about their business. The Company desires to take advantage of the safe harbor provisions of the Private Securities Litigation Reform Act of 1995 and is including this cautionary statement in connection with such safe harbor legislation.
Forward-looking statements relate to Ocean Rig’s expectations, beliefs, intentions or strategies regarding the future. These statements may be identified by the use of words like “anticipate,” “believe,” “estimate,” “expect,” “intend,” “may,” “plan,” “project,” “should,” “seek,” and similar expressions. Forward-looking statements reflect Ocean Rig’s current views and assumptions with respect to future events and are subject to risks and uncertainties.
The forward-looking statements in this presentation are based upon various assumptions, many of which are based, in turn, upon further assumptions, including without limitation, management’s examination of historical operating trends, data contained in Ocean Rig’s records and other data available from third parties. Although Ocean Rig believes that these assumptions were reasonable when made, because these assumptions are inherently subject to significant uncertainties and contingencies which are difficult or impossible to predict and are beyond Ocean Rig’s control, Ocean Rig cannot assure you that it will achieve or accomplish these expectations, beliefs or projections described in the forward- looking statements contained herein. Actual and future results and trends could differ materially from those set forth in such statements.
Important factors that, in Ocean Rig’s view, could cause actual results to differ materially from those discussed in the forward-looking statements include factors related to (i) the offshore drilling market, including supply and demand, utilization, day rates and customer drilling programs, commodity prices, effects of new rigs and drillships on the market and effects of declines in commodity process and downturns in the global economy on the market outlook for our various geographical operating sectors and classes of rigs and drillships; (ii) hazards inherent in the drilling industry and marine operations causing personal injury or loss of life, severe damage to or destruction of property and equipment, pollution or environmental damage, claims by third parties or customers and suspension of operations; (iii) newbuildings, upgrades, and shipyard and other capital projects; (iv) changes in laws and governmental regulations, particularly with respect to environmental matters; (v) the availability of competing offshore drilling vessels; (vi) political and other uncertainties, including risks of terrorist acts, war and civil disturbances; piracy; significant governmental influence over many aspects of local economies, seizure; nationalization or expropriation of property or equipment; repudiation, nullification, modification or renegotiation of contracts; limitations on insurance coverage, such as war risk coverage, in certain areas; political unrest; foreign and U.S. monetary policy and foreign currency fluctuations and devaluations; the inability to repatriate income or capital; complications associated with repairing and replacing equipment in remote locations; import-export quotas, wage and price controls imposition of trade barriers; regulatory or financial requirements to comply with foreign bureaucratic actions; changing taxation policies; and other forms of government regulation and economic conditions that are beyond our control; (vii) the performance of our rigs; (viii) our ability to procure or have access to financing and our ability comply with our loan covenants; (ix) our substantial leverage, including our ability to generate sufficient cash flow to service our existing debt and the incurrence of substantial indebtedness in the future (x) our ability to successfully employ our drilling units; (xi) our capital expenditures, including the timing and cost of completion of capital projects; (xii) our revenues and expenses; (xiii) complications associated with repairing and replacing equipment in remote locations; and (xiv) regulatory or financial requirements to comply with foreign bureaucratic actions, including potential limitations on drilling activities. Due to such uncertainties and risks, investors are cautioned not to place undue reliance upon such forward-looking statements.
Risks and uncertainties are further described in reports filed by Ocean Rig UDW Inc. with the U.S. Securities and Exchange Commission, including the Company’s most recently filed Annual Report on Form 20-F.
2
Highlights
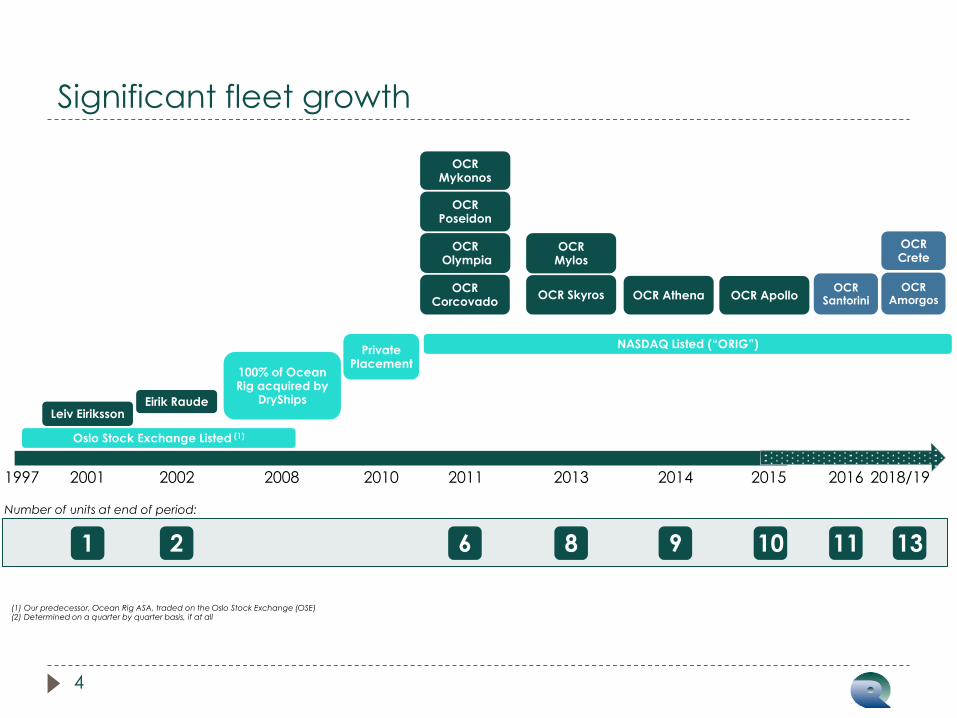
(1) Our predecessor, Ocean Rig ASA, traded on the Oslo Stock Exchange (OSE) (2) Determined on a quarter by quarter basis, if at all
2001 2002 2008 2013
100% of Ocean Rig acquired by
DryShips
2010
Private Placement
2011
OCR Corcovado
OCR Olympia
OCR Poseidon
OCR Mykonos
Leiv Eiriksson Eirik Raude
OCR Athena OCR Skyros
OCR Mylos
NASDAQ Listed (“ORIG”)
1997
Oslo Stock Exchange Listed (1)
2015
OCR Apollo OCR
Santorini
2014
Number of units at end of period:
1 2 6 8 9 10
2016 2018/19
13
OCR Amorgos
OCR Crete
11
Significant fleet growth
4
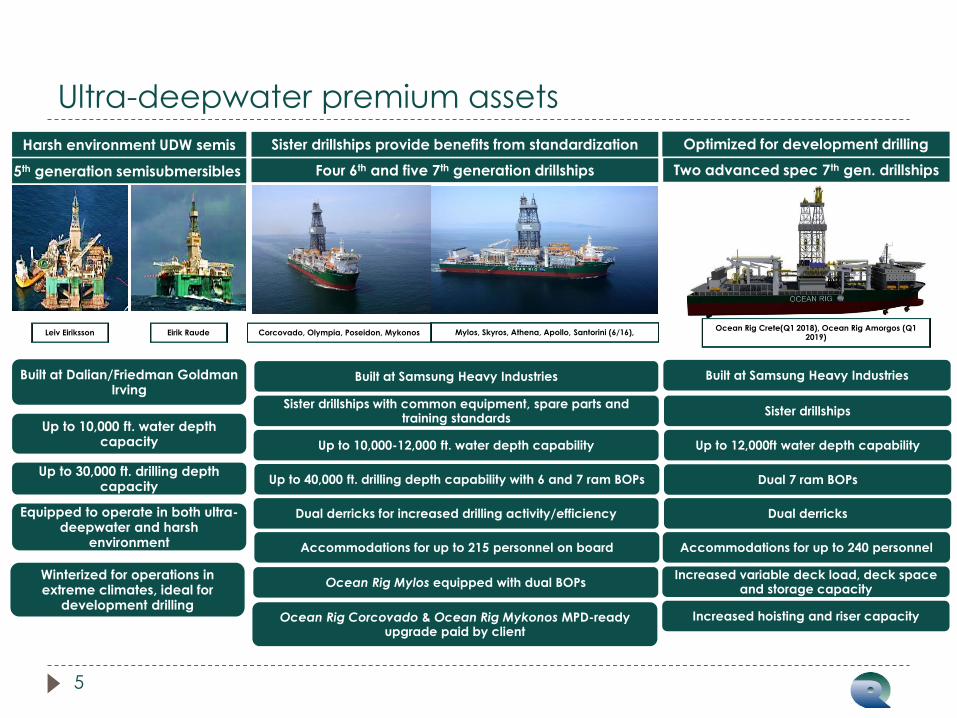
Ultra-deepwater premium assets
5
Sister drillships with common equipment, spare parts and training standards
5th generation semisubmersibles Four 6th and five 7th generation drillships
Leiv Eiriksson Eirik Raude Corcovado, Olympia, Poseidon, Mykonos
Sister drillships provide benefits from standardization Harsh environment UDW semis
Up to 40,000 ft. drilling depth capability with 6 and 7 ram BOPs
Up to 10,000-12,000 ft. water depth capability
Built at Samsung Heavy Industries
Accommodations for up to 215 personnel on board
Dual derricks for increased drilling activity/efficiency
Built at Dalian/Friedman Goldman Irving
Up to 10,000 ft. water depth capacity
Up to 30,000 ft. drilling depth capacity
Equipped to operate in both ultra-deepwater and harsh
environment
Winterized for operations in extreme climates, ideal for
development drilling
Mylos, Skyros, Athena, Apollo, Santorini (6/16),
Optimized for development drilling
Two advanced spec 7th gen. drillships
Ocean Rig Crete(Q1 2018), Ocean Rig Amorgos (Q1 2019)
Built at Samsung Heavy Industries
Sister drillships
Up to 12,000ft water depth capability
Dual 7 ram BOPs
Dual derricks
Accommodations for up to 240 personnel
Increased variable deck load, deck space and storage capacity
Increased hoisting and riser capacity
Ocean Rig Mylos equipped with dual BOPs
Ocean Rig Corcovado & Ocean Rig Mykonos MPD-ready upgrade paid by client
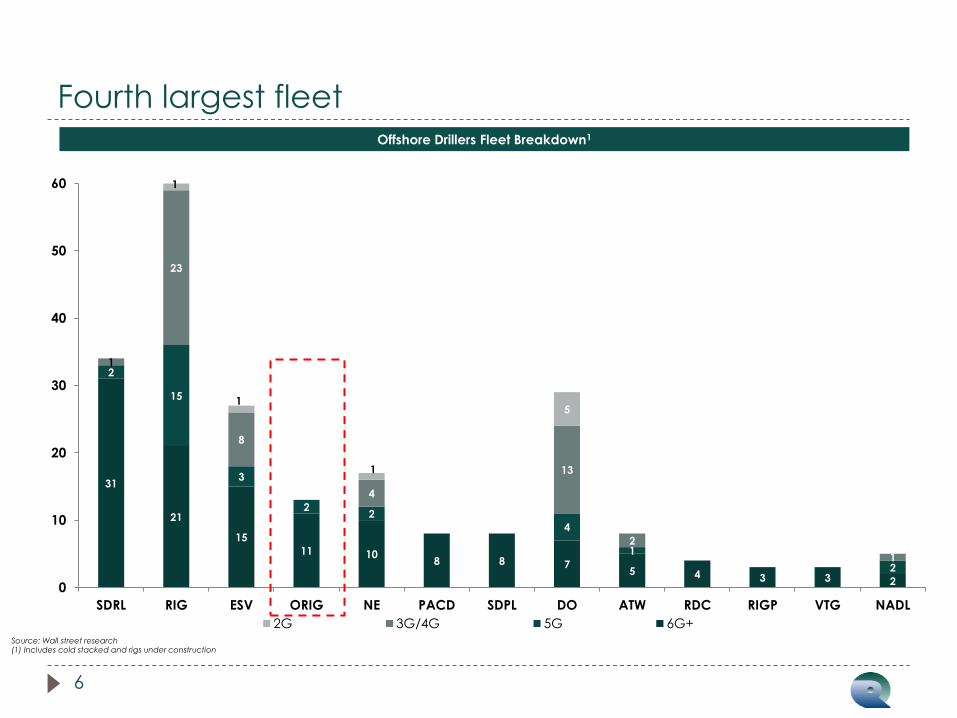
Source: Wall street research (1) Includes cold stacked and rigs under construction
6
31
21
15
11 10 8 8 7
5 4 3 3 2
2
15
3
2 2
4
1
2
1
23
8
4
13
2
1
1
1
1
5
0
10
20
30
40
50
60
SDRL RIG ESV ORIG NE PACD SDPL DO ATW RDC RIGP VTG NADL
2G 3G/4G 5G 6G+
Offshore Drillers Fleet Breakdown1
Fourth largest fleet
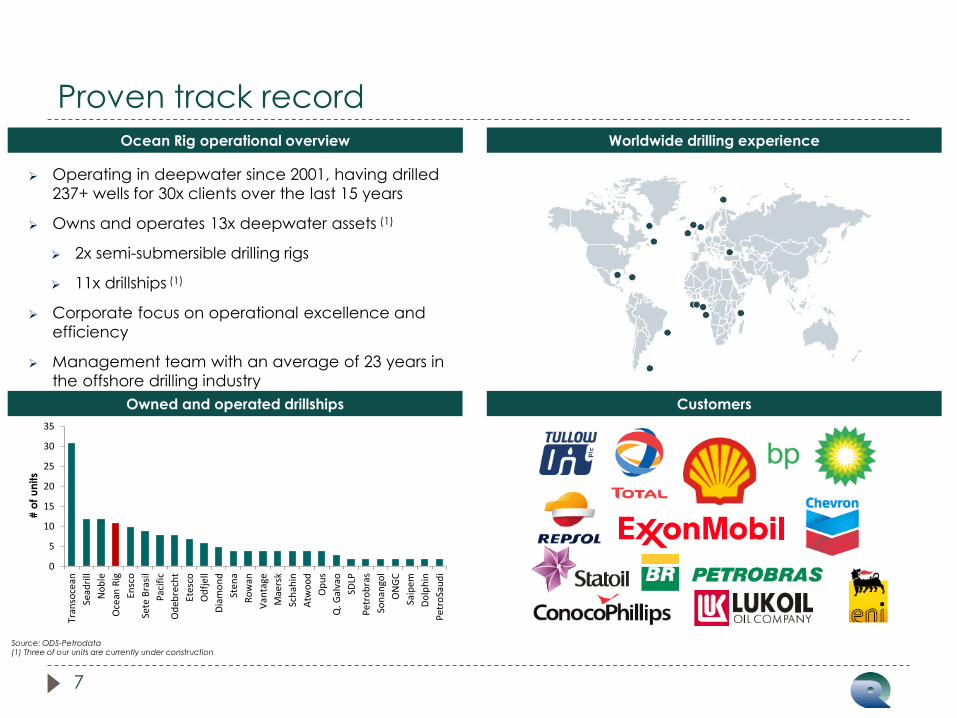
Ocean Rig operational overview
Owned and operated drillships
Worldwide drilling experience
Customers
Operating in deepwater since 2001, having drilled
237+ wells for 30x clients over the last 15 years
Owns and operates 13x deepwater assets (1)
2x semi-submersible drilling rigs
11x drillships (1)
Corporate focus on operational excellence and
efficiency
Management team with an average of 23 years in
the offshore drilling industry
0
5
10
15
20
25
30
35
Tran
soce
an
Sead
rill
No
ble
Oce
an R
ig
Ensc
o
Sete
Bra
sil
Pac
ific
Od
ebre
cht
Etes
co
Od
fje
ll
Dia
mo
nd
Sten
a
Ro
wan
Van
tage
Mae
rsk
Sch
ahin
Atw
oo
d
Op
us
Q. G
alva
o
SDLP
Pe
tro
bra
s
Son
ango
l
ON
GC
Saip
em
Do
lph
in
Pe
tro
Sau
di
# o
f u
nits
Source: ODS-Petrodata (1) Three of our units are currently under construction
7
Proven track record
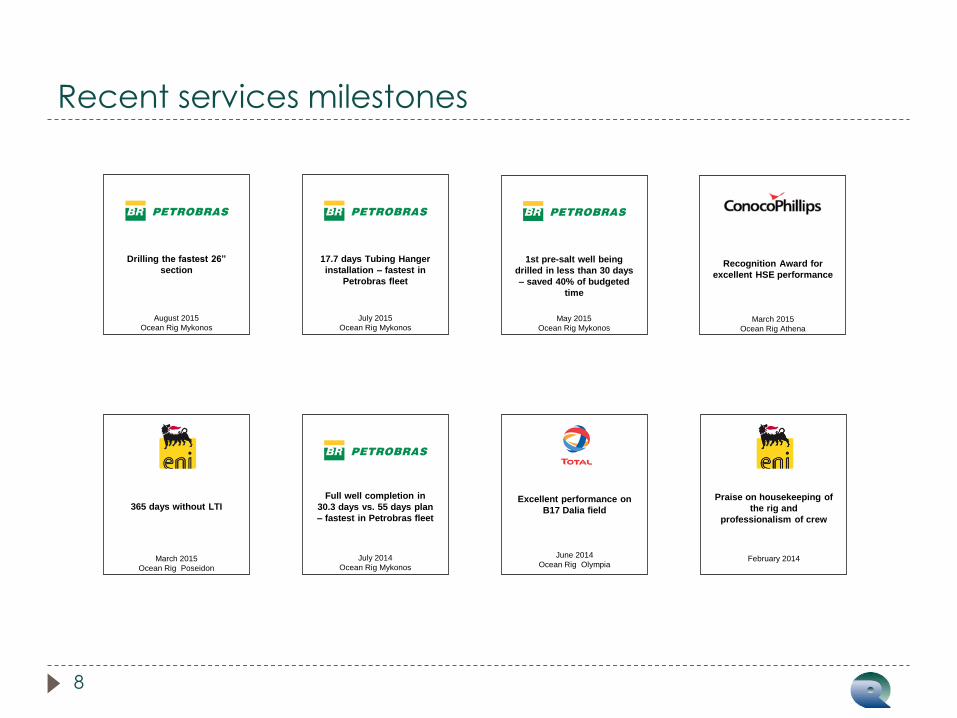
Recent services milestones
8
February 2014
Praise on housekeeping of
the rig and
professionalism of crew
July 2014
Ocean Rig Mykonos
Full well completion in
30.3 days vs. 55 days plan
– fastest in Petrobras fleet
June 2014
Ocean Rig Olympia
Excellent performance on
B17 Dalia field
March 2015
Ocean Rig Poseidon
365 days without LTI
March 2015
Ocean Rig Athena
Recognition Award for
excellent HSE performance
May 2015
Ocean Rig Mykonos
1st pre-salt well being
drilled in less than 30 days
– saved 40% of budgeted
time
July 2015
Ocean Rig Mykonos
17.7 days Tubing Hanger
installation – fastest in
Petrobras fleet
August 2015
Ocean Rig Mykonos
Drilling the fastest 26”
section
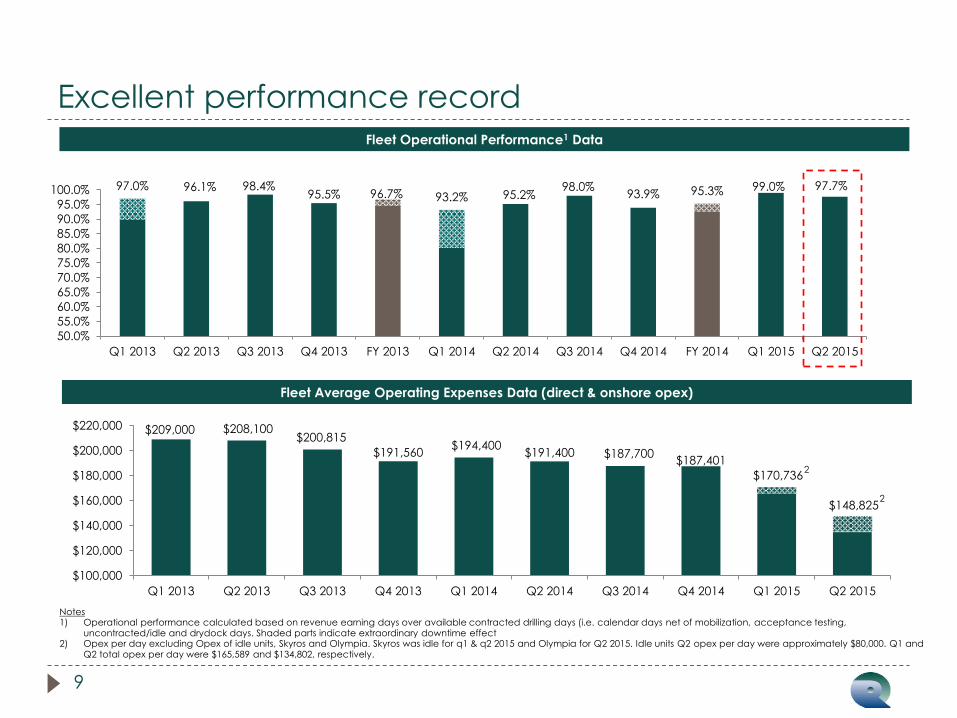
96.7% 97.0% 96.1% 98.4%
95.5% 93.2% 95.2% 98.0%
93.9% 95.3% 99.0% 97.7%
50.0%
55.0%
60.0%
65.0%
70.0%
75.0%
80.0%
85.0%
90.0%
95.0%
100.0%
Q1 2013 Q2 2013 Q3 2013 Q4 2013 FY 2013 Q1 2014 Q2 2014 Q3 2014 Q4 2014 FY 2014 Q1 2015 Q2 2015
Excellent performance record
9
Fleet Operational Performance1 Data
Fleet Average Operating Expenses Data (direct & onshore opex)
$209,000 $208,100 $200,815
$191,560 $194,400
$191,400 $187,700 $187,401
$170,736
$148,825
$100,000
$120,000
$140,000
$160,000
$180,000
$200,000
$220,000
Q1 2013 Q2 2013 Q3 2013 Q4 2013 Q1 2014 Q2 2014 Q3 2014 Q4 2014 Q1 2015 Q2 2015
Notes 1) Operational performance calculated based on revenue earning days over available contracted drilling days (i.e. calendar days net of mobilization, acceptance testing,
uncontracted/idle and drydock days. Shaded parts indicate extraordinary downtime effect 2) Opex per day excluding Opex of idle units, Skyros and Olympia. Skyros was idle for q1 & q2 2015 and Olympia for Q2 2015. Idle units Q2 opex per day were approximately $80,000. Q1 and
Q2 total opex per day were $165,589 and $134,802, respectively.
2
2
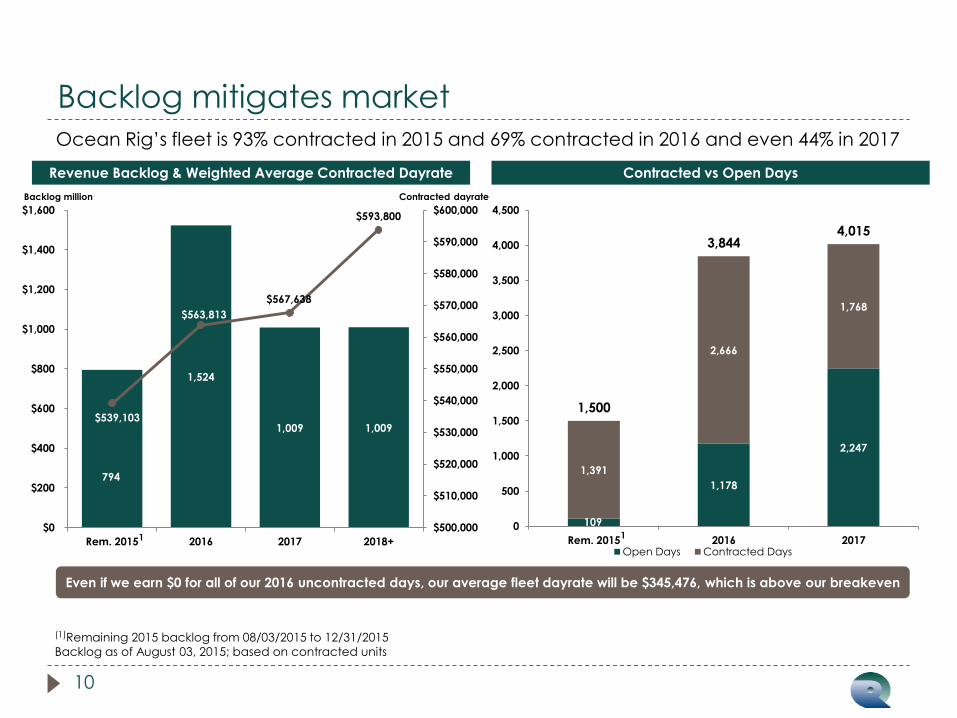
Backlog mitigates market
10
Ocean Rig’s fleet is 93% contracted in 2015 and 69% contracted in 2016 and even 44% in 2017
Revenue Backlog & Weighted Average Contracted Dayrate
Backlog million
794
1,524
1,009 1,009 $539,103
$563,813
$567,638
$593,800
$500,000
$510,000
$520,000
$530,000
$540,000
$550,000
$560,000
$570,000
$580,000
$590,000
$600,000
$0
$200
$400
$600
$800
$1,000
$1,200
$1,400
$1,600
Rem. 2015 2016 2017 2018+
Even if we earn $0 for all of our 2016 uncontracted days, our average fleet dayrate will be $345,476, which is above our breakeven
(1)Remaining 2015 backlog from 08/03/2015 to 12/31/2015
Backlog as of August 03, 2015; based on contracted units
Contracted dayrate
Contracted vs Open Days
109
1,178
2,247
1,391
2,666
1,768
1,500
3,844 4,015
0
500
1,000
1,500
2,000
2,500
3,000
3,500
4,000
4,500
Rem. 2015 2016 2017Open Days Contracted Days
1 1
Multi-year employment profile
11
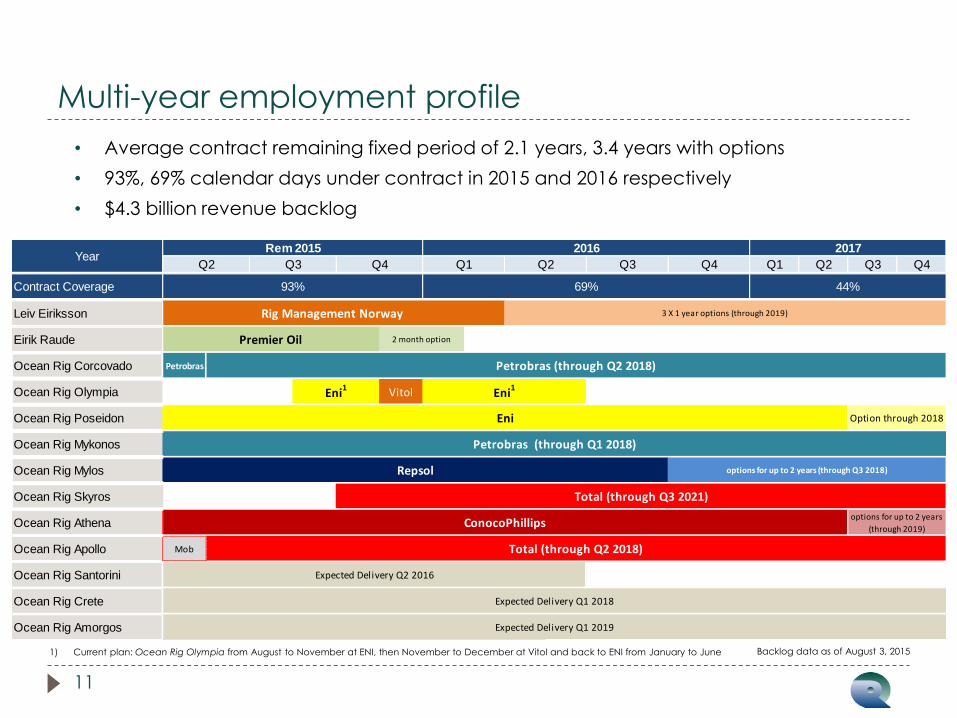
• Average contract remaining fixed period of 2.1 years, 3.4 years with options
• 93%, 69% calendar days under contract in 2015 and 2016 respectively
• $4.3 billion revenue backlog
1) Current plan: Ocean Rig Olympia from August to November at ENI, then November to December at Vitol and back to ENI from January to June Backlog data as of August 3, 2015
Q3 Q1 Q2 Q3 Q4
Contract Coverage
Leiv Eiriksson
Eirik Raude
Ocean Rig Corcovado Petrobras
Ocean Rig Olympia Vitol
Ocean Rig Poseidon
Ocean Rig Mykonos
Ocean Rig Mylos
Ocean Rig Skyros
Ocean Rig Athena
Ocean Rig Apollo Mob
Ocean Rig Santorini
Ocean Rig Crete
Ocean Rig Amorgos
Q4Q3
93%
2 month option
Option through 2018
Rig Management Norway
Eni
YearQ2 Q1
2017
options for up to 2 years (through Q3 2018)
44%
Petrobras (through Q2 2018)
3 X 1 year options (through 2019)
Q2
Eni1
Eni1
2016Rem 2015
Petrobras (through Q1 2018)
69%
Q4
Repsol
Premier Oil
options for up to 2 years
(through 2019)ConocoPhillips
Total (through Q3 2021)
Expected Delivery Q2 2016
Expected Delivery Q1 2018
Expected Delivery Q1 2019
Total (through Q2 2018)

Industry Overview
Bifurcated fleet composition
13
Floaters utilization
60%
65%
70%
75%
80%
85%
90%
95%
100%
Ja
n 2
00
8
Ap
r 200
8
Ju
l 2008
Oc
t 2
008
Ja
n 2
00
9
Ap
r 200
9
Ju
l 2009
Oc
t 2
009
Ja
n 2
01
0
Ap
r 201
0
Ju
l 2010
Oc
t 2
010
Ja
n 2
01
1
Ap
r 201
1
Ju
l 2011
Oc
t 2
011
Ja
n 2
01
2
Ap
r 201
2
Ju
l 2012
Oc
t 2
012
Ja
n 2
01
3
Ap
r 201
3
Ju
l 2013
Oc
t 2
013
Ja
n 2
01
4
Ap
r 201
4
Ju
l 2014
Oc
t 2
014
Ja
n 2
01
5
Ap
r 201
5
Ju
l 2015
2005+ built <2005 built
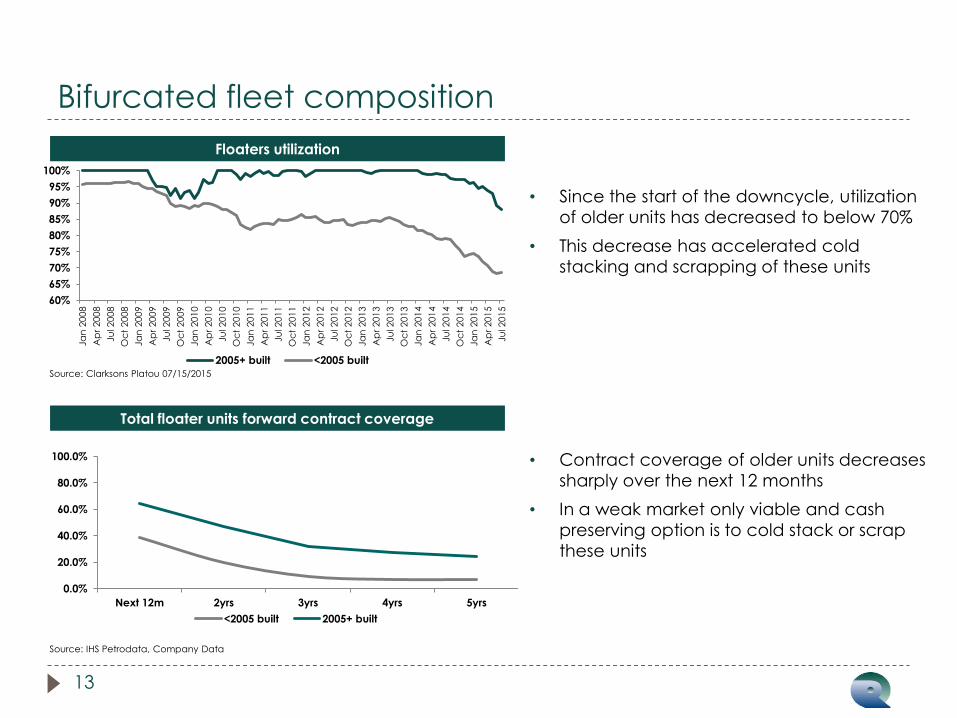
• Since the start of the downcycle, utilization
of older units has decreased to below 70%
• This decrease has accelerated cold
stacking and scrapping of these units
Source: Clarksons Platou 07/15/2015
Total floater units forward contract coverage
0.0%
20.0%
40.0%
60.0%
80.0%
100.0%
Next 12m 2yrs 3yrs 4yrs 5yrs
<2005 built 2005+ built
Source: IHS Petrodata, Company Data
• Contract coverage of older units decreases
sharply over the next 12 months
• In a weak market only viable and cash
preserving option is to cold stack or scrap
these units
Continuing fleet removal
14
Over 10% of floater fleet scrapped in last 12 months
0
16
23
16
23
0
5
10
15
20
25
30
2013 2014 2015 YTD
<2005 built 2005+ built
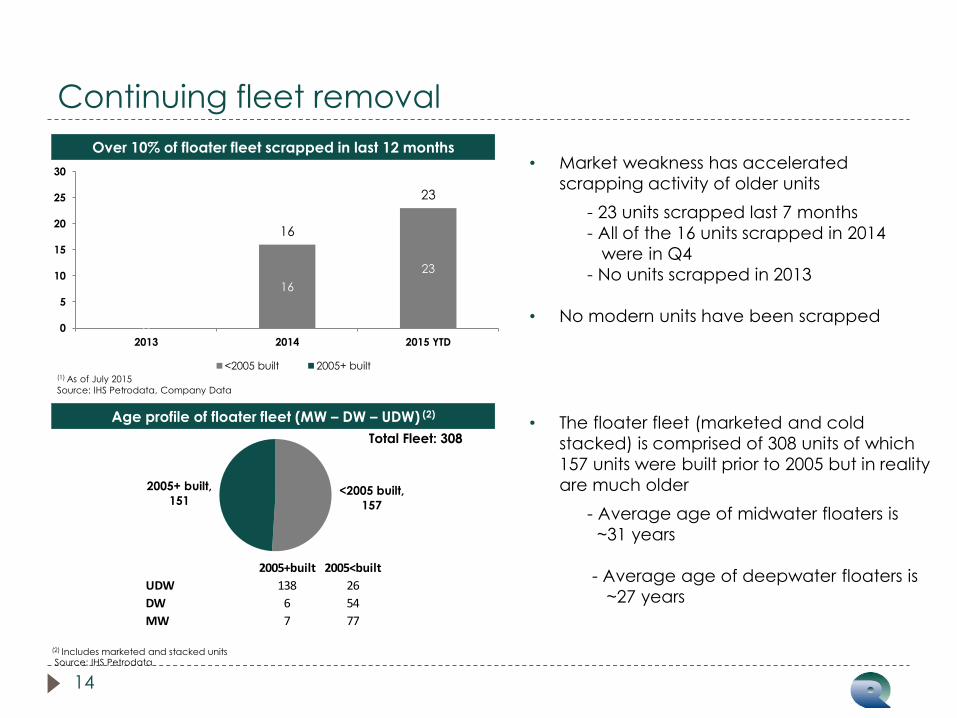
• Market weakness has accelerated
scrapping activity of older units
- 23 units scrapped last 7 months
- All of the 16 units scrapped in 2014
were in Q4
- No units scrapped in 2013
• No modern units have been scrapped
(1) As of July 2015
Source: IHS Petrodata, Company Data
Age profile of floater fleet (MW – DW – UDW) (2)
<2005 built,
157
2005+ built,
151
(2) Includes marketed and stacked units Source: IHS Petrodata
Total Fleet: 308 • The floater fleet (marketed and cold
stacked) is comprised of 308 units of which
157 units were built prior to 2005 but in reality
are much older
- Average age of midwater floaters is
~31 years
- Average age of deepwater floaters is
~27 years
2005+built 2005<built
UDW 138 26
DW 6 54
MW 7 77
Removals to accelerate
15
68 Idled/Stacked floater units
133
148
24
3
0
20
40
60
80
100
120
140
160
<2005 built 2005+ built
Contracted Floater
Warm Stacked/Idle Floater Units
Cold Stacked/Retired Floater Units
25
16
108 132
units
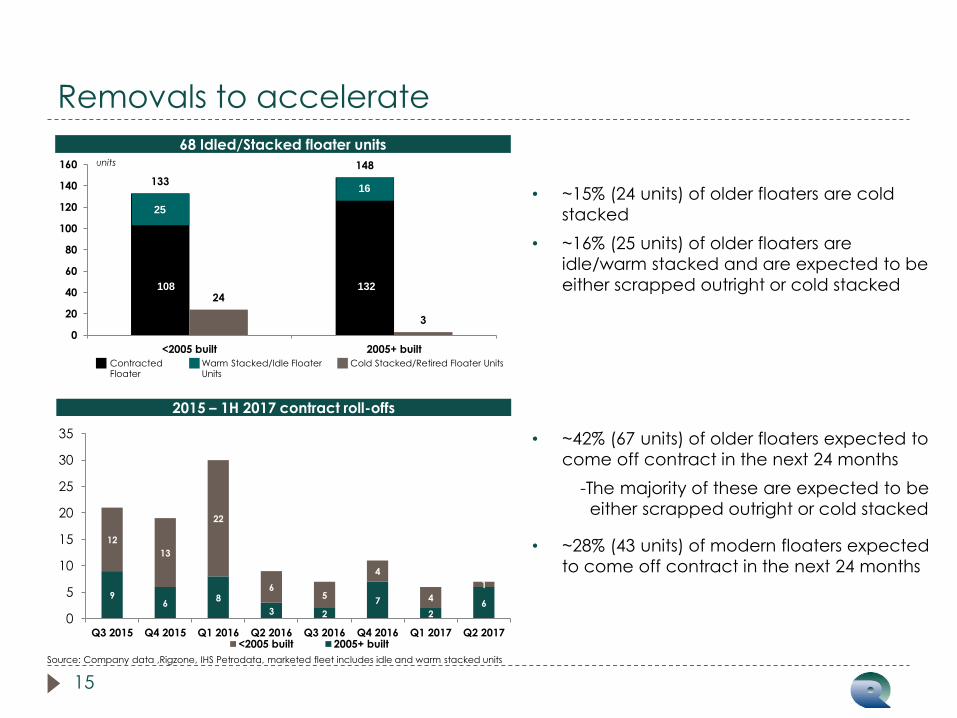
• ~15% (24 units) of older floaters are cold
stacked
• ~16% (25 units) of older floaters are
idle/warm stacked and are expected to be
either scrapped outright or cold stacked
2015 – 1H 2017 contract roll-offs
• ~42% (67 units) of older floaters expected to
come off contract in the next 24 months
-The majority of these are expected to be
either scrapped outright or cold stacked
• ~28% (43 units) of modern floaters expected
to come off contract in the next 24 months
Source: Company data ,Rigzone, IHS Petrodata, marketed fleet includes idle and warm stacked units
9 6
8
3 2
7
2 6
12
13
22
6 5
4
4
1
0
5
10
15
20
25
30
35
Q3 2015 Q4 2015 Q1 2016 Q2 2016 Q3 2016 Q4 2016 Q1 2017 Q2 2017<2005 built 2005+ built
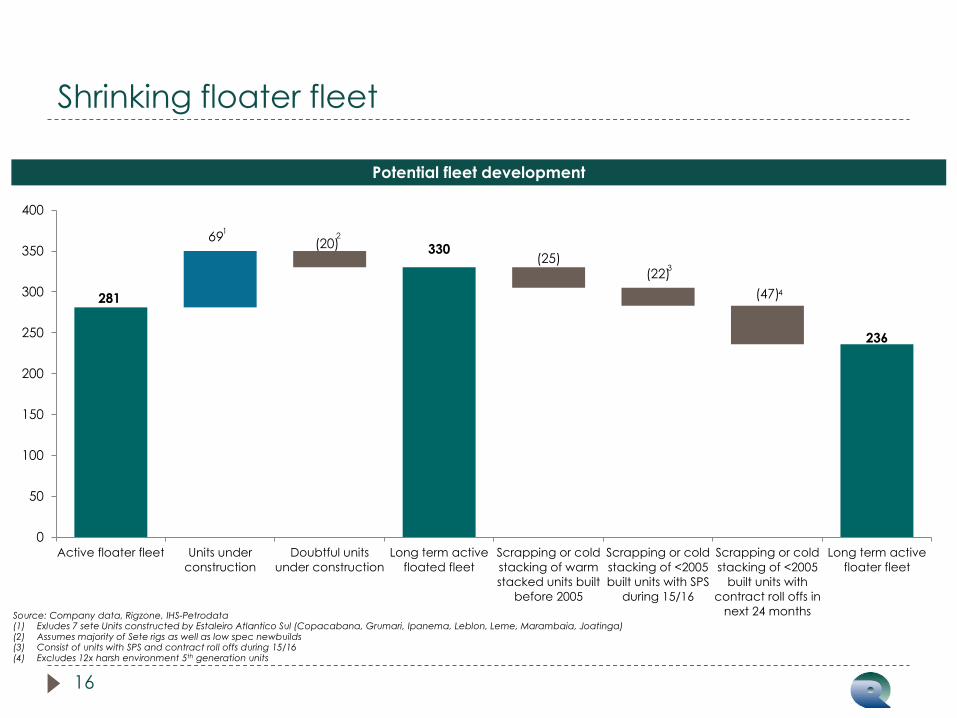
Shrinking floater fleet
16
Potential fleet development
281
330
236
69 (20)
(25) (22)
(47)
0
50
100
150
200
250
300
350
400
Active floater fleet Units under
construction
Doubtful units
under construction
Long term active
floated fleet
Scrapping or cold
stacking of warm
stacked units built
before 2005
Scrapping or cold
stacking of <2005
built units with SPS
during 15/16
Scrapping or cold
stacking of <2005
built units with
contract roll offs in
next 24 months
Long term active
floater fleet
Source: Company data, Rigzone, IHS-Petrodata (1) Exludes 7 sete Units constructed by Estaleiro Atlantico Sul (Copacabana, Grumari, Ipanema, Leblon, Leme, Marambaia, Joatinga) (2) Assumes majority of Sete rigs as well as low spec newbuilds (3) Consist of units with SPS and contract roll offs during 15/16 (4) Excludes 12x harsh environment 5th generation units
4
1 2
3

Closing Remarks
Closing remarks
18
• Attractive portfolio of modern drilling units
― Fleet of 11 modern (6th and 7th generation) UDW drillships and 2 UDW harsh environment semi-submersible rigs
― 4th Largest fleet of premium high specification standardized assets
• Value creation initiatives
― Focus on further reducing operating costs (~30% opex decrease over the last 12 months)
― Focus maintaining high operating efficiency (~98% for the first half of 2015)
― Actively pursuing distress asset opportunities as they arise
• Measured and well-timed growth plans
― Postponed delivery of two of our drillships and deferred pre-delivery payments
― Newbuild drillship deliveries in 2H 2016, Q1 2018 and Q1 2019
― Proven access to diverse and attractive funding sources (term loans, bonds, ECAs) to fund majority portion of delivery capex
• Attractive cash flow dynamics
― Significant contracted cash flow with $4.3 billion backlog(1) with high quality counterparties
(1) Backlog as of August 03, 2015