Embed Size (px)
Citation preview
OCEAN RIG UDW INC.
Ocean Rig UDW Inc. 3rd Quarter Ended September 30, 2014 Earnings Presentation
NASDAQ: “ORIG” November 6, 2014
OCEAN RIG UDW INC.
Forward Looking Statements
2
Matters discussed in this presentation may constitute forward-looking statements. Forward-looking statements reflect the Company’s current views with respect to future events and financial performance and may include statements concerning plans, objectives, goals, strategies, future events or performance, and underlying assumptions and other statements, which are not statements of historical facts.
The forward-looking statements in this presentation are based upon various assumptions, many of which are based, in turn, upon further assumptions, including without limitation, management's examination of historical operating trends, data contained in our records and other data available from third parties, which have not been independently verified by the Company. Although Ocean Rig UDW Inc. believes that these assumptions were reasonable when made, because these assumptions are inherently subject to significant uncertainties and contingencies which are difficult or impossible to predict and are beyond our control, Ocean Rig UDW Inc. cannot assure you that it will achieve or accomplish these expectations, beliefs or projections. Important factors that, in the Company’s view, could cause actual results to differ materially from those discussed in the forward-looking statements include the strength of world economies and currencies, general market conditions, including changes in charter hire rates and vessel values, changes in demand that may affect attitudes of time charterers to scheduled and unscheduled drydocking, changes in Ocean Rig UDW Inc’s operating expenses, including bunker prices, dry-docking and insurance costs, or actions taken by regulatory authorities, potential liability from pending or future litigation, domestic and international political conditions, potential disruption of shipping routes due to accidents and political events or acts by terrorists.
Risks and uncertainties that may affect our actual results are further described in reports filed by Ocean Rig UDW Inc. with the US Securities and Exchange Commission.
Information contained in this presentation (not limited to forward looking statements) speaks only as of the date of such information and the Company expressly disclaims any obligation to update or revise the information herein, except as required by law.
OCEAN RIG UDW INC.
Q3 2014 financial results
3
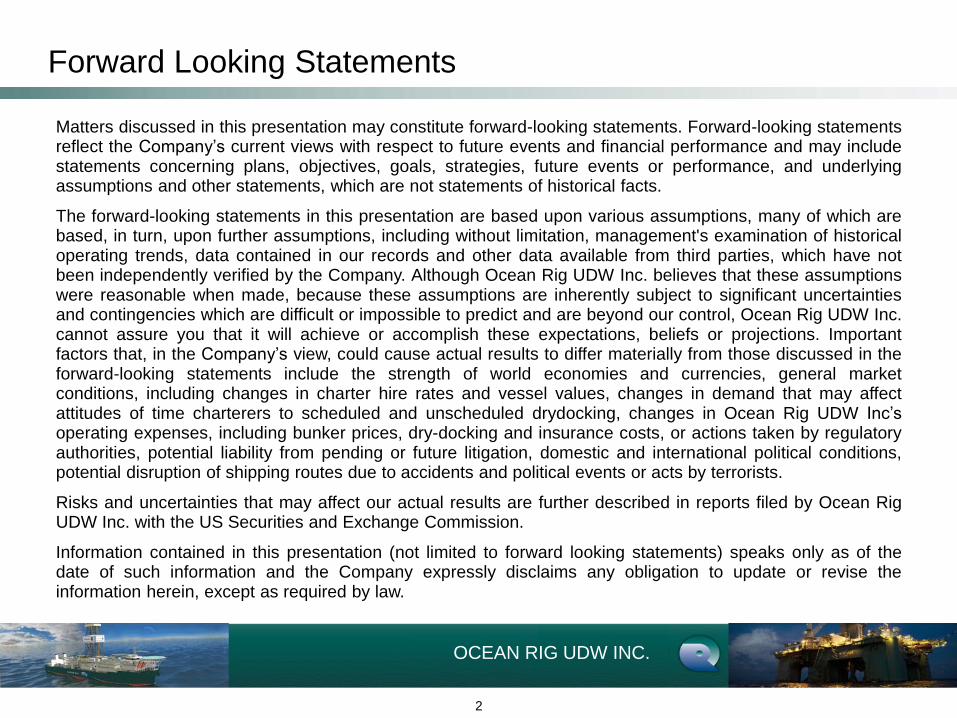
Net Revenue from drilling contracts: $515.5 million
Adjusted EBITDA: $281.8 million
Reported Net Income: $104.2 million or $0.79 per share
Plus: Non-cash write offs and breakage costs from debt refinancing: $22.0 million or $0.17 per share
Adjusted Net Income: $126.2 million or $0.96 per share
OCEAN RIG UDW INC.
Key highlights
4
Achieved 98.6% average fleet wide operating performance for the third quarter
Awarded 3-year contract extension by Petrobras for Ocean Rig Corcovado (Q2 2015 through
Q2 2018)
Awarded 3-year contract extension by Petrobras for Ocean Rig Mykonos (Q1 2015 through
Q1 2018)
Declared dividend of $0.19 per share with respect to Q3 2014 operations, to shareholders on
record as of October 31, and payable on November 11, 2014
Our MLP subsidiary, Ocean Rig Partners LP, filed a registration statement with the SEC
relating to a potential IPO of certain of its common units
OCEAN RIG UDW INC.
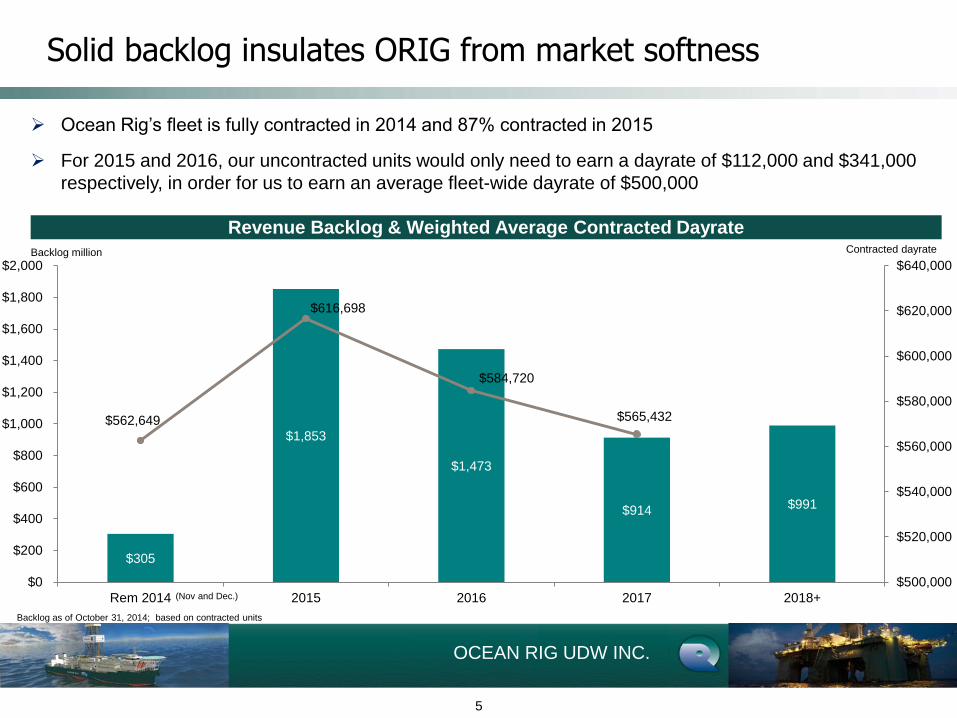
$305
$1,853
$1,473
$914 $991
$562,649
$616,698
$584,720
$565,432
$500,000
$520,000
$540,000
$560,000
$580,000
$600,000
$620,000
$640,000
$0
$200
$400
$600
$800
$1,000
$1,200
$1,400
$1,600
$1,800
$2,000
Rem 2014 2015 2016 2017 2018+
Backlog as of October 31, 2014; based on contracted units
Solid backlog insulates ORIG from market softness
5
Revenue Backlog & Weighted Average Contracted Dayrate
Backlog million Contracted dayrate
Ocean Rig’s fleet is fully contracted in 2014 and 87% contracted in 2015
For 2015 and 2016, our uncontracted units would only need to earn a dayrate of $112,000 and $341,000
respectively, in order for us to earn an average fleet-wide dayrate of $500,000
(Nov and Dec.)
OCEAN RIG UDW INC.
Operational & Financial Highlights
OCEAN RIG UDW INC.
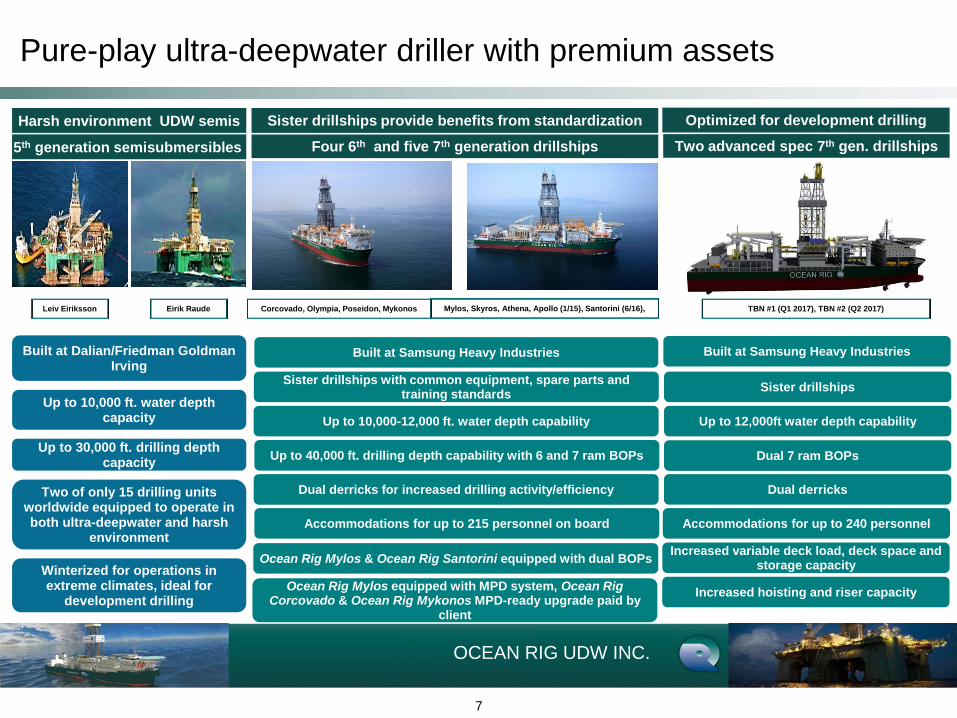
Sister drillships with common equipment, spare parts and training standards
Pure-play ultra-deepwater driller with premium assets
7
5th generation semisubmersibles Four 6th and five 7th generation drillships
Leiv Eiriksson Eirik Raude Corcovado, Olympia, Poseidon, Mykonos
Sister drillships provide benefits from standardization Harsh environment UDW semis
Up to 40,000 ft. drilling depth capability with 6 and 7 ram BOPs
Up to 10,000-12,000 ft. water depth capability
Built at Samsung Heavy Industries
Accommodations for up to 215 personnel on board
Dual derricks for increased drilling activity/efficiency
Built at Dalian/Friedman Goldman Irving
Up to 10,000 ft. water depth capacity
Up to 30,000 ft. drilling depth capacity
Two of only 15 drilling units worldwide equipped to operate in both ultra-deepwater and harsh
environment
Winterized for operations in extreme climates, ideal for
development drilling
Mylos, Skyros, Athena, Apollo (1/15), Santorini (6/16),
Optimized for development drilling
Two advanced spec 7th gen. drillships
TBN #1 (Q1 2017), TBN #2 (Q2 2017)
Built at Samsung Heavy Industries
Sister drillships
Up to 12,000ft water depth capability
Dual 7 ram BOPs
Dual derricks
Accommodations for up to 240 personnel
Increased variable deck load, deck space and storage capacity
Increased hoisting and riser capacity
Ocean Rig Mylos & Ocean Rig Santorini equipped with dual BOPs
Ocean Rig Mylos equipped with MPD system, Ocean Rig Corcovado & Ocean Rig Mykonos MPD-ready upgrade paid by
client
OCEAN RIG UDW INC.
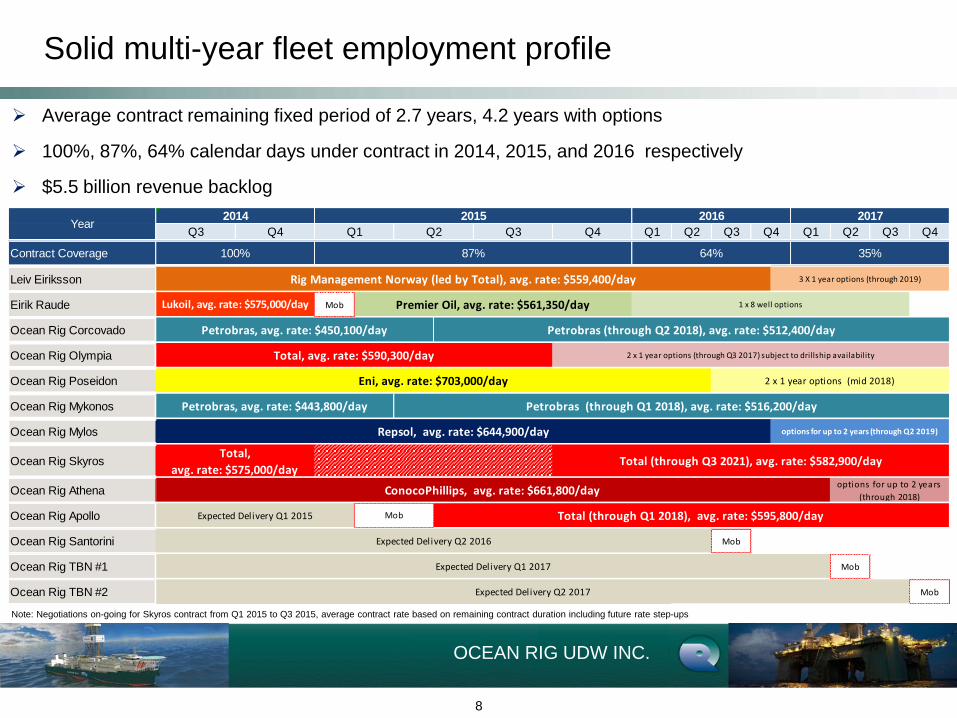
Solid multi-year fleet employment profile
8
Note: Negotiations on-going for Skyros contract from Q1 2015 to Q3 2015, average contract rate based on remaining contract duration including future rate step-ups
Average contract remaining fixed period of 2.7 years, 4.2 years with options
100%, 87%, 64% calendar days under contract in 2014, 2015, and 2016 respectively
$5.5 billion revenue backlog
Q3 Q2 Q3 Q1 Q2 Q3 Q4
Contract Coverage
Leiv Eiriksson
Eirik Raude Mob
Ocean Rig Corcovado
Ocean Rig Olympia
Ocean Rig Poseidon
Ocean Rig Mykonos
Ocean Rig Mylos
Ocean Rig Skyros
Ocean Rig Athena
Ocean Rig Apollo
Ocean Rig Santorini Mob
Ocean Rig TBN #1 Mob
Ocean Rig TBN #2 Mob
2017
Q4 Q4Q1
options for up to 2 years
(through 2018)
Expected Delivery Q1 2017
Expected Delivery Q2 2017
Total (through Q3 2021), avg. rate: $582,900/day
ConocoPhillips, avg. rate: $661,800/day
100% 87% 35%
Petrobras (through Q2 2018), avg. rate: $512,400/day
Eni, avg. rate: $703,000/day
Expected Delivery Q2 2016
64%
Expected Delivery Q1 2015
YearQ4Q3
2014
Q2 Q1
20162015
Total,
avg. rate: $575,000/day
Mob Total (through Q1 2018), avg. rate: $595,800/day
Repsol, avg. rate: $644,900/day options for up to 2 years (through Q2 2019)
Petrobras (through Q1 2018), avg. rate: $516,200/dayPetrobras, avg. rate: $443,800/day
3 X 1 year options (through 2019)Rig Management Norway (led by Total), avg. rate: $559,400/day
2 x 1 year options (through Q3 2017) subject to drillship availability
1 x 8 well options
2 x 1 year options (mid 2018)
Premier Oil, avg. rate: $561,350/dayLukoil, avg. rate: $575,000/day
Petrobras, avg. rate: $450,100/day
Total, avg. rate: $590,300/day
OCEAN RIG UDW INC.
Q3 2014- Revenue analysis
9
Notes:
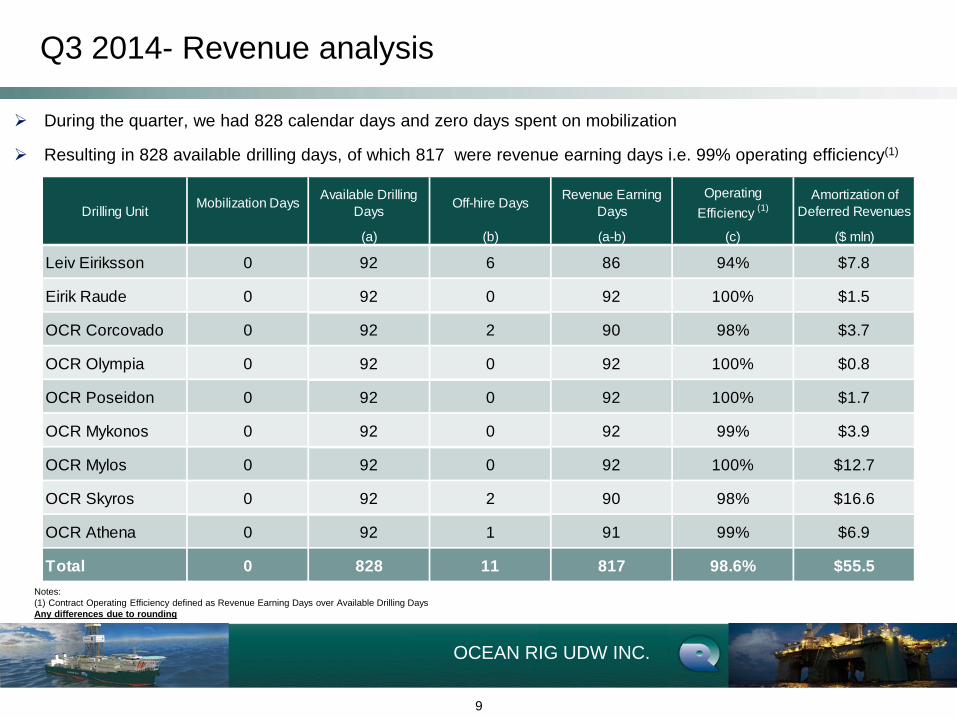
(1) Contract Operating Efficiency defined as Revenue Earning Days over Available Drilling Days
Any differences due to rounding
During the quarter, we had 828 calendar days and zero days spent on mobilization
Resulting in 828 available drilling days, of which 817 were revenue earning days i.e. 99% operating efficiency(1)
Mobilization DaysAvailable Drilling
DaysOff-hire Days
Revenue Earning
Days
Operating
Efficiency (1)
Amortization of
Deferred Revenues
(a) (b) (a-b) (c) ($ mln)
Leiv Eiriksson 0 92 6 86 94% $7.8
Eirik Raude 0 92 0 92 100% $1.5
OCR Corcovado 0 92 2 90 98% $3.7
OCR Olympia 0 92 0 92 100% $0.8
OCR Poseidon 0 92 0 92 100% $1.7
OCR Mykonos 0 92 0 92 99% $3.9
OCR Mylos 0 92 0 92 100% $12.7
OCR Skyros 0 92 2 90 98% $16.6
OCR Athena 0 92 1 91 99% $6.9
Total 0 828 11 817 98.6% $55.5
Drilling Unit
OCEAN RIG UDW INC.
Q3 2014- OPEX analysis
10
Notes:
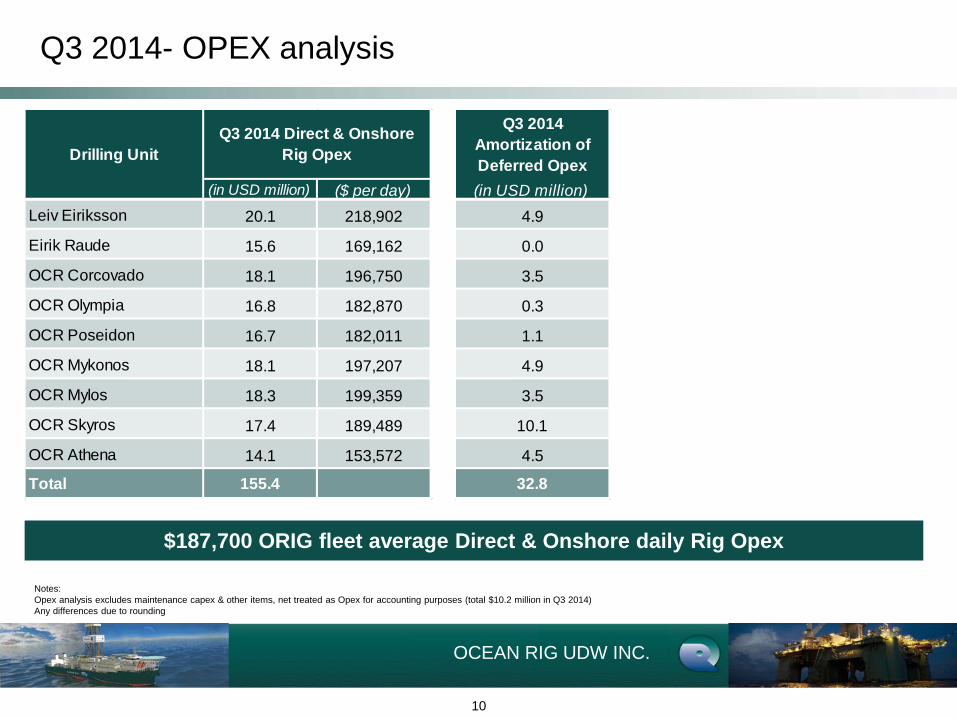
Opex analysis excludes maintenance capex & other items, net treated as Opex for accounting purposes (total $10.2 million in Q3 2014)
Any differences due to rounding
$187,700 ORIG fleet average Direct & Onshore daily Rig Opex
(in USD million) ($ per day)
Leiv Eiriksson 20.1 218,902
Eirik Raude 15.6 169,162
OCR Corcovado 18.1 196,750
OCR Olympia 16.8 182,870
OCR Poseidon 16.7 182,011
OCR Mykonos 18.1 197,207
OCR Mylos 18.3 199,359
OCR Skyros 17.4 189,489
OCR Athena 14.1 153,572
Total 155.4
Drilling Unit
Q3 2014 Direct & Onshore
Rig Opex
Q3 2014
Amortization of
Deferred Opex
(in USD million)
4.9
0.0
3.5
0.3
1.1
4.9
3.5
10.1
4.5
32.8
OCEAN RIG UDW INC.
Income Statement
11
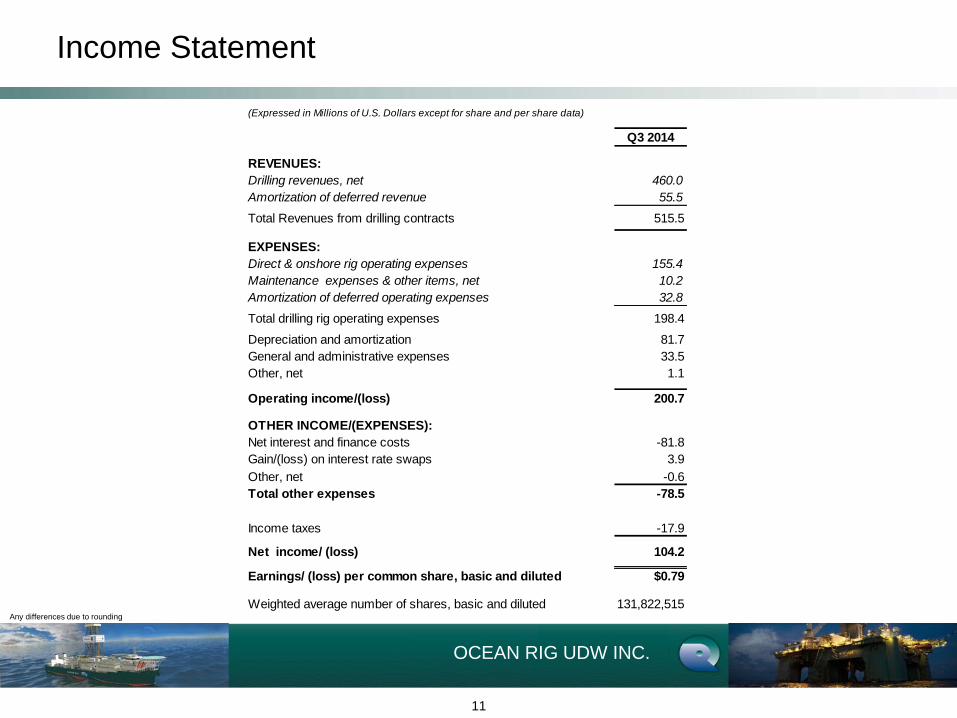
Any differences due to rounding
Q3 2014
REVENUES:
Drilling revenues, net 460.0
Amortization of deferred revenue 55.5
Total Revenues from drilling contracts 515.5
EXPENSES:
Direct & onshore rig operating expenses 155.4
Maintenance expenses & other items, net 10.2
Amortization of deferred operating expenses 32.8
Total drilling rig operating expenses 198.4
Depreciation and amortization 81.7
General and administrative expenses 33.5
Other, net 1.1
Operating income/(loss) 200.7
OTHER INCOME/(EXPENSES):
Net interest and finance costs -81.8
Gain/(loss) on interest rate swaps 3.9
Other, net -0.6
Total other expenses -78.5
Income taxes -17.9
Earnings/ (loss) per common share, basic and diluted $0.79
Weighted average number of shares, basic and diluted 131,822,515
Net income/ (loss) 104.2
(Expressed in Millions of U.S. Dollars except for share and per share data)
OCEAN RIG UDW INC.
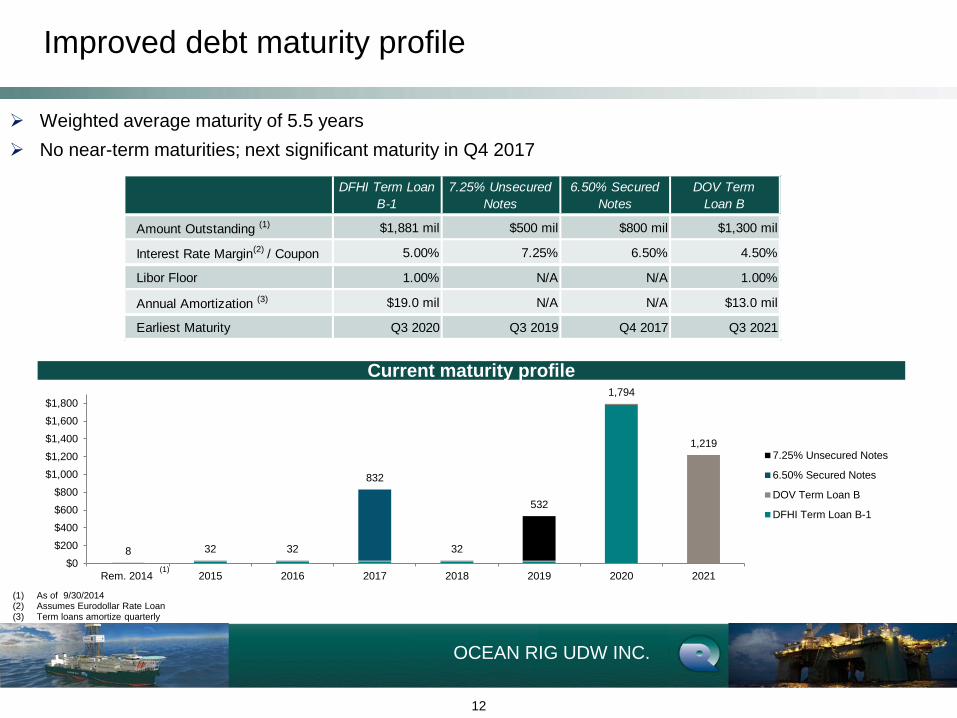
Improved debt maturity profile
12
Weighted average maturity of 5.5 years
No near-term maturities; next significant maturity in Q4 2017
(1) As of 9/30/2014 (2) Assumes Eurodollar Rate Loan (3) Term loans amortize quarterly
Current maturity profile
(1)
DFHI Term Loan
B-1
7.25% Unsecured
Notes
6.50% Secured
Notes
DOV Term
Loan B
Amount Outstanding (1) $1,881 mil $500 mil $800 mil $1,300 mil
Interest Rate Margin(2) / Coupon 5.00% 7.25% 6.50% 4.50%
Libor Floor 1.00% N/A N/A 1.00%
Annual Amortization (3) $19.0 mil N/A N/A $13.0 mil
Earliest Maturity Q3 2020 Q3 2019 Q4 2017 Q3 2021
8 32 32
832
32
532
1,794
1,219
$0
$200
$400
$600
$800
$1,000
$1,200
$1,400
$1,600
$1,800
Rem. 2014 2015 2016 2017 2018 2019 2020 2021
7.25% Unsecured Notes
6.50% Secured Notes
DOV Term Loan B
DFHI Term Loan B-1
OCEAN RIG UDW INC.
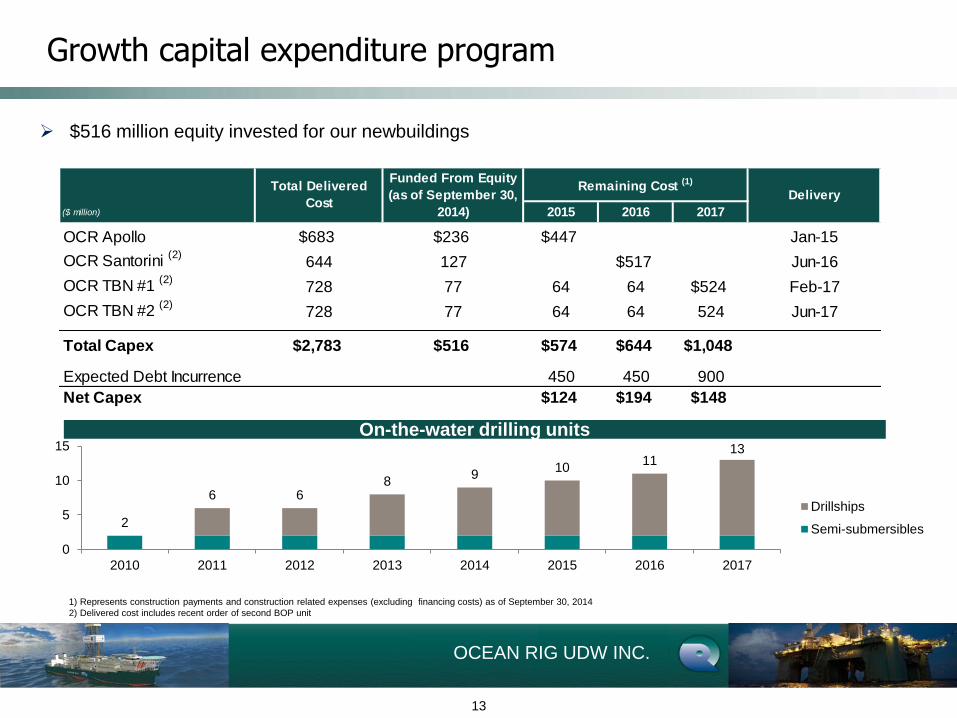
1) Represents construction payments and construction related expenses (excluding financing costs) as of September 30, 2014
2) Delivered cost includes recent order of second BOP unit
Growth capital expenditure program
13
$516 million equity invested for our newbuildings
On-the-water drilling units
2
6 6 8
9 10
11 13
0
5
10
15
2010 2011 2012 2013 2014 2015 2016 2017
Drillships
Semi-submersibles
2015 2016 2017
OCR Apollo $683 $236 $447 Jan-15
OCR Santorini (2)
644 127 $517 Jun-16
OCR TBN #1 (2)
728 77 64 64 $524 Feb-17
OCR TBN #2 (2)
728 77 64 64 524 Jun-17
Total Capex $2,783 $516 $574 $644 $1,048
Expected Debt Incurrence 450 450 900
Net Capex $124 $194 $148
Total Delivered
Cost
Funded From Equity
(as of September 30,
2014)($ million)
DeliveryRemaining Cost (1)
OCEAN RIG UDW INC.
Industry Overview
OCEAN RIG UDW INC.
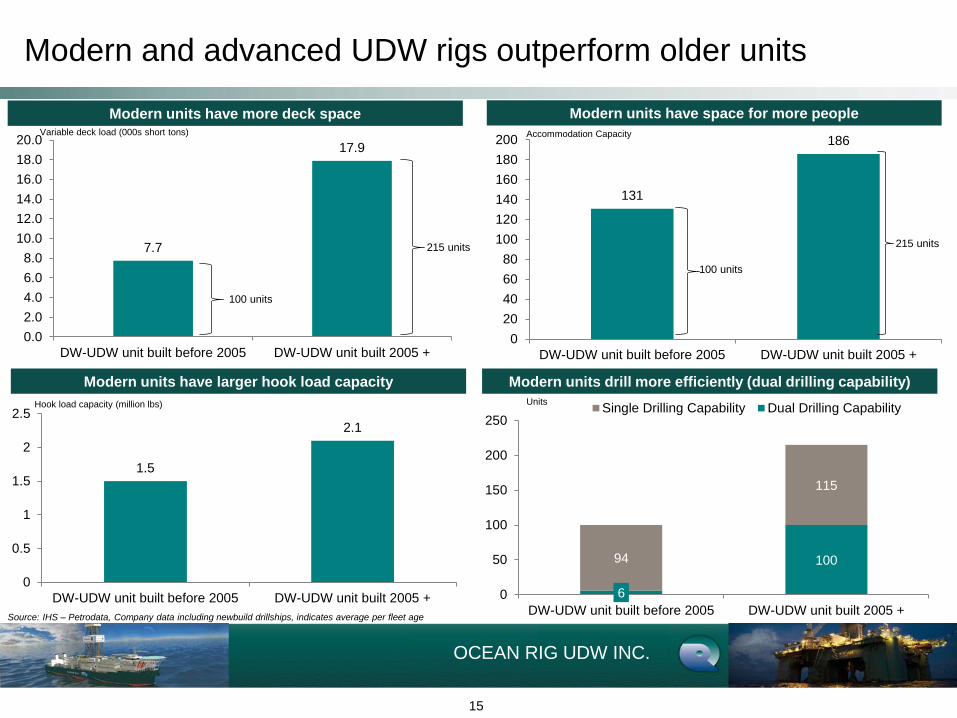
131
186
0
20
40
60
80
100
120
140
160
180
200
DW-UDW unit built before 2005 DW-UDW unit built 2005 +
7.7
17.9
0.0
2.0
4.0
6.0
8.0
10.0
12.0
14.0
16.0
18.0
20.0
DW-UDW unit built before 2005 DW-UDW unit built 2005 +
15
Modern and advanced UDW rigs outperform older units
Modern units have more deck space
Modern units have larger hook load capacity
Source: IHS – Petrodata, Company data including newbuild drillships, indicates average per fleet age
Modern units have space for more people Variable deck load (000s short tons) Accommodation Capacity
Hook load capacity (million lbs)
Modern units drill more efficiently (dual drilling capability)
100 units
215 units
100 units
215 units
1.5
2.1
0
0.5
1
1.5
2
2.5
DW-UDW unit built before 2005 DW-UDW unit built 2005 +
Units
6
100 94
115
0
50
100
150
200
250
DW-UDW unit built before 2005 DW-UDW unit built 2005 +
Single Drilling Capability Dual Drilling Capability
OCEAN RIG UDW INC.
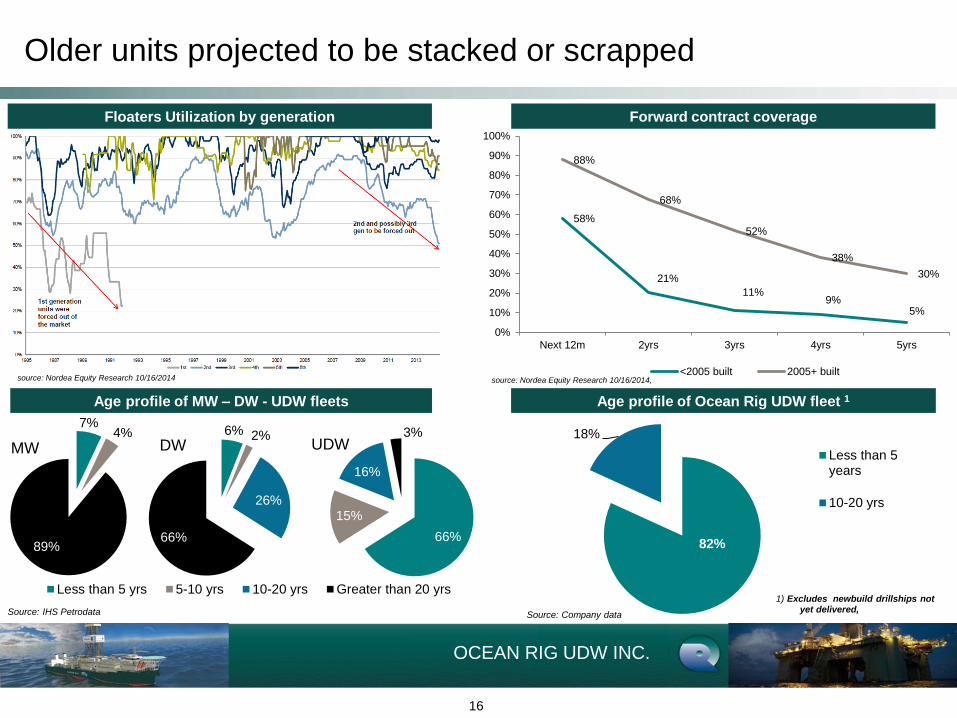
58%
21%
11% 9%
5%
88%
68%
52%
38%
30%
0%
10%
20%
30%
40%
50%
60%
70%
80%
90%
100%
Next 12m 2yrs 3yrs 4yrs 5yrs
<2005 built 2005+ built
16
Older units projected to be stacked or scrapped
Floaters Utilization by generation Forward contract coverage
Source: IHS Petrodata
source: Nordea Equity Research 10/16/2014
Age profile of Ocean Rig UDW fleet 1
66%
15%
16%
3%
Less than 5 yrs 5-10 yrs 10-20 yrs Greater than 20 yrs
7% 4%
89%
6% 2%
26%
66%
Age profile of MW – DW - UDW fleets
82%
18%
Less than 5years
10-20 yrs
1) Excludes newbuild drillships not yet delivered,
Source: Company data
MW DW UDW
source: Nordea Equity Research 10/16/2014,
OCEAN RIG UDW INC.
Closing Remarks
OCEAN RIG UDW INC.
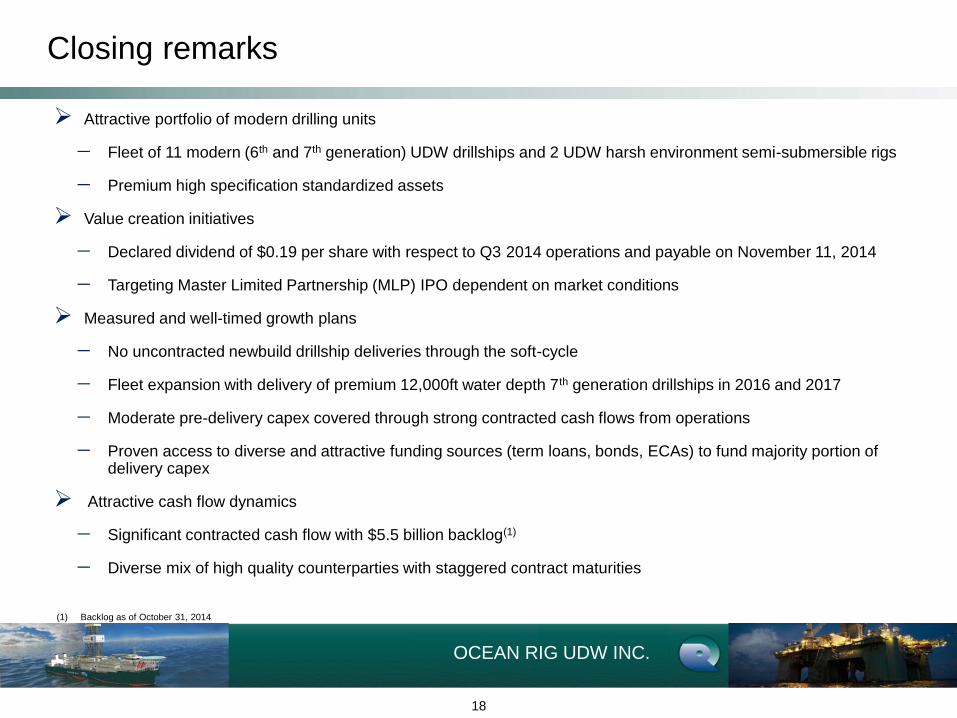
Closing remarks
18
Attractive portfolio of modern drilling units
Fleet of 11 modern (6th and 7th generation) UDW drillships and 2 UDW harsh environment semi-submersible rigs
Premium high specification standardized assets
Value creation initiatives
Declared dividend of $0.19 per share with respect to Q3 2014 operations and payable on November 11, 2014
Targeting Master Limited Partnership (MLP) IPO dependent on market conditions
Measured and well-timed growth plans
No uncontracted newbuild drillship deliveries through the soft-cycle
Fleet expansion with delivery of premium 12,000ft water depth 7th generation drillships in 2016 and 2017
Moderate pre-delivery capex covered through strong contracted cash flows from operations
Proven access to diverse and attractive funding sources (term loans, bonds, ECAs) to fund majority portion of delivery capex
Attractive cash flow dynamics
Significant contracted cash flow with $5.5 billion backlog(1)
Diverse mix of high quality counterparties with staggered contract maturities
(1) Backlog as of October 31, 2014
OCEAN RIG UDW INC.
Appendix
OCEAN RIG UDW INC.
0
5
10
15
20
25
30
35
40
Tra
nso
cean
Se
adrill
En
sco
Noble
Ocean R
ig
Odebre
cht
Dia
mo
nd
Se
te B
rasil
Q. G
alv
ao
Odfjell
Pa
cific
Ma
ers
k
Se
adrill
Part
ners
Ete
sco
Atw
ood
Row
an
Se
van
Nort
h A
tlan
tic
Schahin
Va
nta
ge
Ste
na
Pe
troserv
Sa
ipe
m
IPC
Dolp
hin
So
nangol
Frig
sta
d
Prim
epoin
t
Pe
trobra
s
# o
f flo
ate
rs
0
5
10
15
20
25
30
35
Tra
nso
cean
Se
ad
rill
Noble
Ocean R
ig
En
sco
Se
te B
rasil
Pa
cific
Odebre
cht
Ete
sco
Odfjell
Dia
mo
nd
Ste
na
Row
an
Va
nta
ge
Ma
ers
k
Schahin
Atw
ood
Opus
Q. G
alv
ao
SD
LP
Pe
trobra
s
So
nangol
ON
GC
Sa
ipe
m
Dolp
hin
Pe
troS
audi
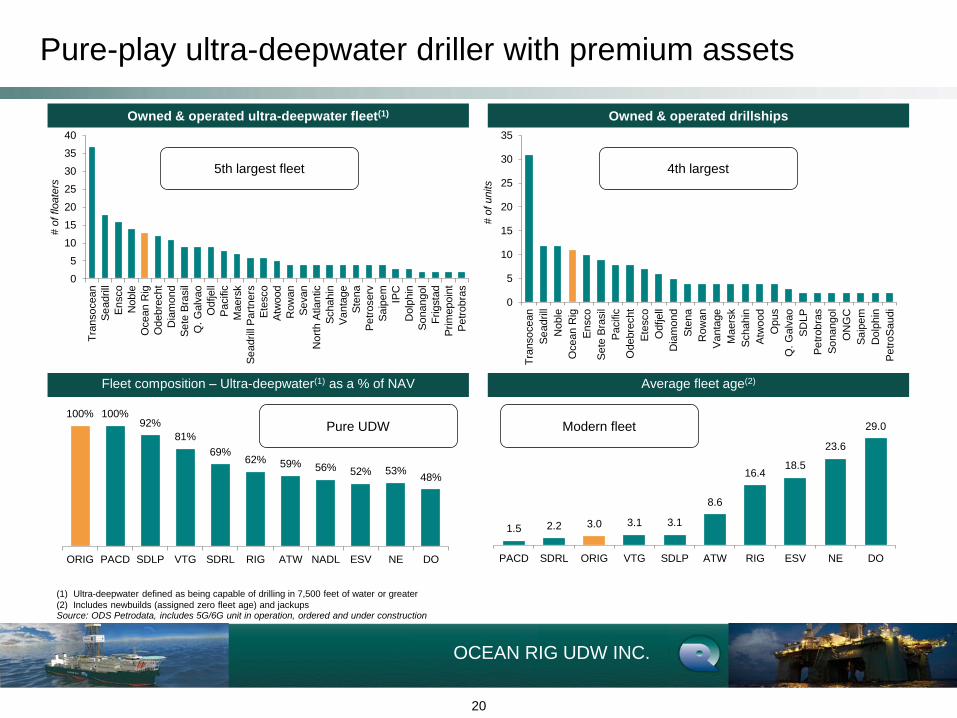
Owned & operated ultra-deepwater fleet(1) Owned & operated drillships
20
(1) Ultra-deepwater defined as being capable of drilling in 7,500 feet of water or greater
(2) Includes newbuilds (assigned zero fleet age) and jackups Source: ODS Petrodata, includes 5G/6G unit in operation, ordered and under construction
Fleet composition – Ultra-deepwater(1) as a % of NAV Average fleet age(2)
4th largest 5th largest fleet
Pure UDW Modern fleet
# o
f units
1.5 2.2 3.0 3.1 3.1
8.6
16.4 18.5
23.6
29.0
PACD SDRL ORIG VTG SDLP ATW RIG ESV NE DO
100% 100% 92%
81%
69% 62% 59% 56% 52% 53%
48%
ORIG PACD SDLP VTG SDRL RIG ATW NADL ESV NE DO
1 Pure-play ultra-deepwater driller with premium assets
OCEAN RIG UDW INC.
21
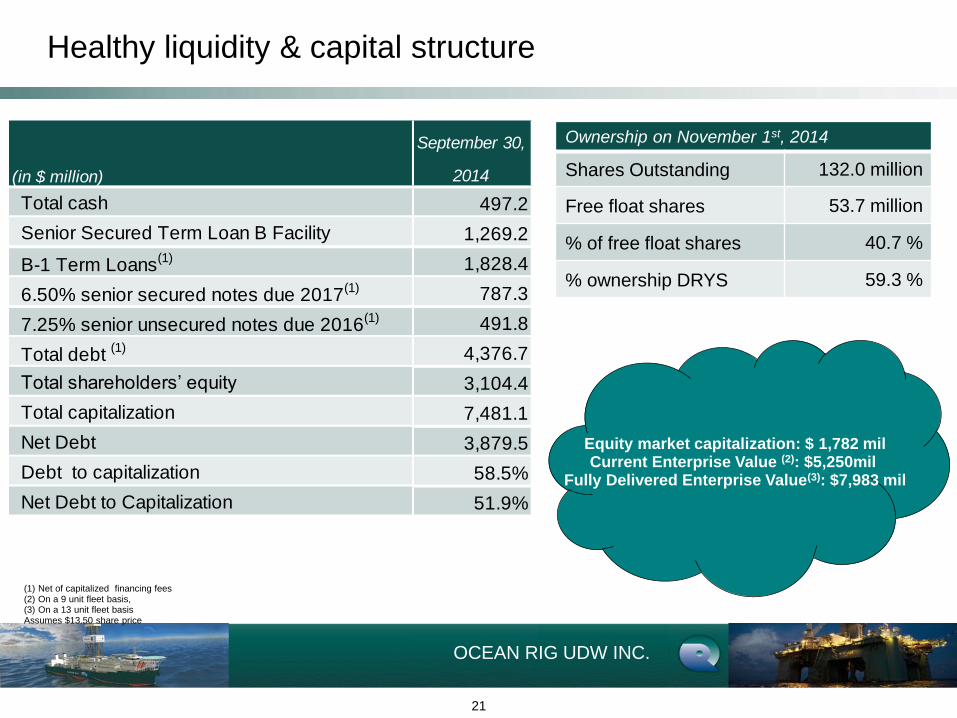
Healthy liquidity & capital structure
(1) (1) Net of capitalized financing fees (2) (2) On a 9 unit fleet basis, (3) (3) On a 13 unit fleet basis (4) Assumes $13.50 share price
Ownership on November 1st, 2014
Shares Outstanding 132.0 million
Free float shares 53.7 million
% of free float shares 40.7 %
% ownership DRYS 59.3 %
Equity market capitalization: $ 1,782 mil Current Enterprise Value (2): $5,250mil
Fully Delivered Enterprise Value(3): $7,983 mil
September 30,
2014
Total cash 497.2
Senior Secured Term Loan B Facility 1,269.2
B-1 Term Loans(1) 1,828.4
6.50% senior secured notes due 2017(1) 787.3
7.25% senior unsecured notes due 2016(1) 491.8
Total debt (1) 4,376.7
Total shareholders’ equity 3,104.4
Total capitalization 7,481.1
Net Debt 3,879.5
Debt to capitalization 58.5%
Net Debt to Capitalization 51.9%
(in $ million)
OCEAN RIG UDW INC.
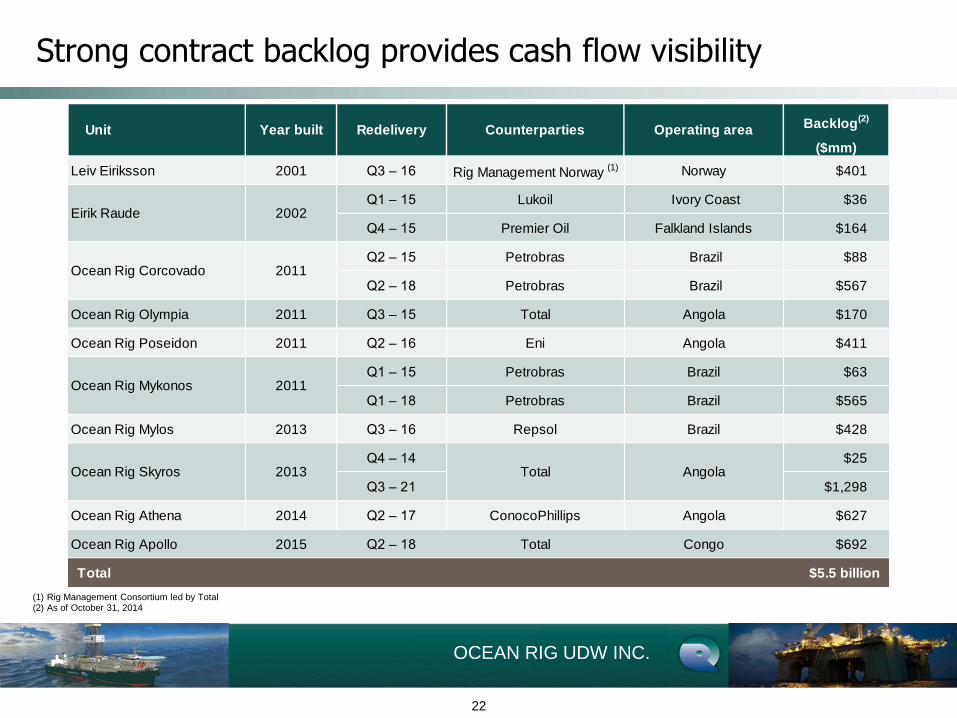
Strong contract backlog provides cash flow visibility
22
(1) (1) Rig Management Consortium led by Total (2) As of October 31, 2014
Backlog(2)
($mm)
Leiv Eiriksson 2001 Q3 – 16 Rig Management Norway (1) Norway $401
Q1 – 15 Lukoil Ivory Coast $36
Q4 – 15 Premier Oil Falkland Islands $164
Q2 – 15 Petrobras Brazil $88
Q2 – 18 Petrobras Brazil $567
Ocean Rig Olympia 2011 Q3 – 15 Total Angola $170
Ocean Rig Poseidon 2011 Q2 – 16 Eni Angola $411
Q1 – 15 Petrobras Brazil $63
Q1 – 18 Petrobras Brazil $565
Ocean Rig Mylos 2013 Q3 – 16 Repsol Brazil $428
Q4 – 14 $25
Q3 – 21 $1,298
Ocean Rig Athena 2014 Q2 – 17 ConocoPhillips Angola $627
Ocean Rig Apollo 2015 Q2 – 18 Total Congo $692
Total $5.5 billion
Counterparties Operating area
Ocean Rig Skyros 2013 Total Angola
Eirik Raude 2002
Unit Year built Redelivery
Ocean Rig Corcovado 2011
Ocean Rig Mykonos 2011
OCEAN RIG UDW INC.
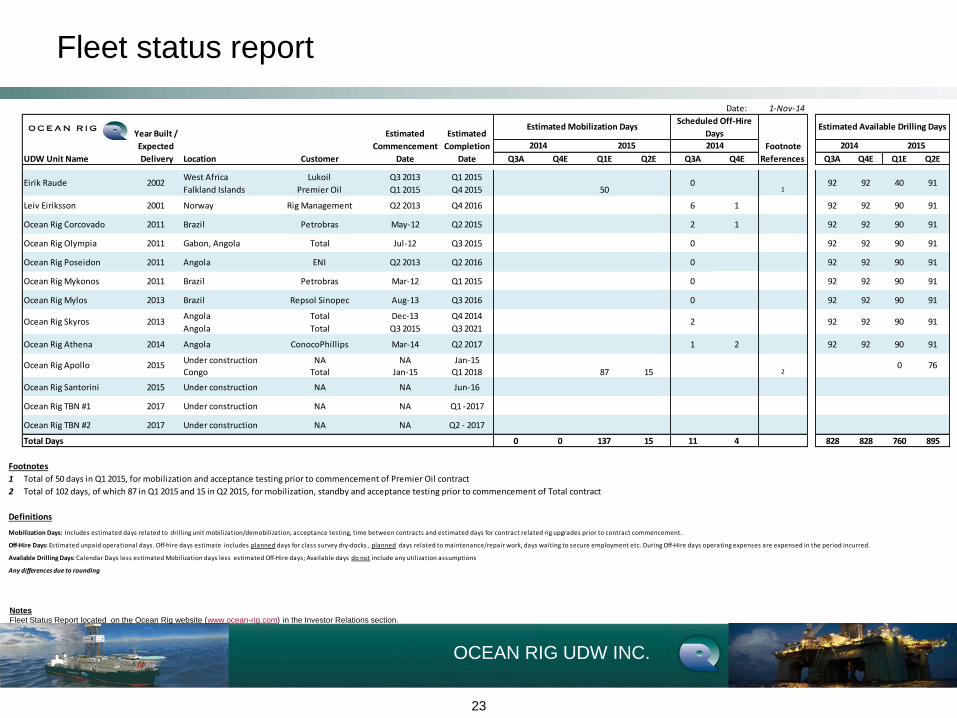
Fleet status report
23
Notes
Fleet Status Report located on the Ocean Rig website (www.ocean-rig.com) in the Investor Relations section.
Date: 1-Nov-14
Year Built / Estimated Estimated
Expected Commencement Completion Footnote
UDW Unit Name Delivery Location Customer Date Date Q3A Q4E Q1E Q2E Q3A Q4E References Q3A Q4E Q1E Q2E
West Africa Lukoil Q3 2013 Q1 2015
Falkland Islands Premier Oil Q1 2015 Q4 2015 50 1
Leiv Eiriksson 2001 Norway Rig Management Q2 2013 Q4 2016 6 1 92 92 90 91
Ocean Rig Corcovado 2011 Brazil Petrobras May-12 Q2 2015 2 1 92 92 90 91
Ocean Rig Olympia 2011 Gabon, Angola Total Jul-12 Q3 2015 0 92 92 90 91
Ocean Rig Poseidon 2011 Angola ENI Q2 2013 Q2 2016 0 92 92 90 91
Ocean Rig Mykonos 2011 Brazil Petrobras Mar-12 Q1 2015 0 92 92 90 91
Ocean Rig Mylos 2013 Brazil Repsol Sinopec Aug-13 Q3 2016 0 92 92 90 91
Angola Total Dec-13 Q4 2014
Angola Total Q3 2015 Q3 2021
Ocean Rig Athena 2014 Angola ConocoPhillips Mar-14 Q2 2017 1 2 92 92 90 91
Under construction NA NA Jan-15
Congo Total Jan-15 Q1 2018 87 15 2
Ocean Rig Santorini 2015 Under construction NA NA Jun-16
Ocean Rig TBN #1 2017 Under construction NA NA Q1 -2017
Ocean Rig TBN #2 2017 Under construction NA NA Q2 - 2017
Total Days 0 0 137 15 11 4 828 828 760 895
Footnotes
1 Total of 50 days in Q1 2015, for mobilization and acceptance testing prior to commencement of Premier Oil contract
2 Total of 102 days, of which 87 in Q1 2015 and 15 in Q2 2015, for mobilization, standby and acceptance testing prior to commencement of Total contract
Definitions
Mobilization Days: Includes estimated days related to drilling unit mobilization/demobilization, acceptance testing, time between contracts and estimated days for contract related rig upgrades prior to contract commencement.
Available Drilling Days: Calendar Days less estimated Mobilization days less estimated Off-Hire days; Available days do not include any utilization assumptions
Any differences due to rounding
2002
Estimated Available Drilling Days
2014
76
Estimated Mobilization DaysScheduled Off-Hire
Days
92 40 91
90
0
Off-Hire Days: Estimated unpaid operational days. Off-hire days estimate includes planned days for class survey dry-docks , planned days related to maintenance/repair work, days waiting to secure employment etc. During Off-Hire days operating expenses are expensed in the period incurred.
Ocean Rig Apollo 2015
92
91Ocean Rig Skyros 2013 92
Eirik Raude
92
2014 2015 2014 2015
0
2
OCEAN RIG UDW INC.
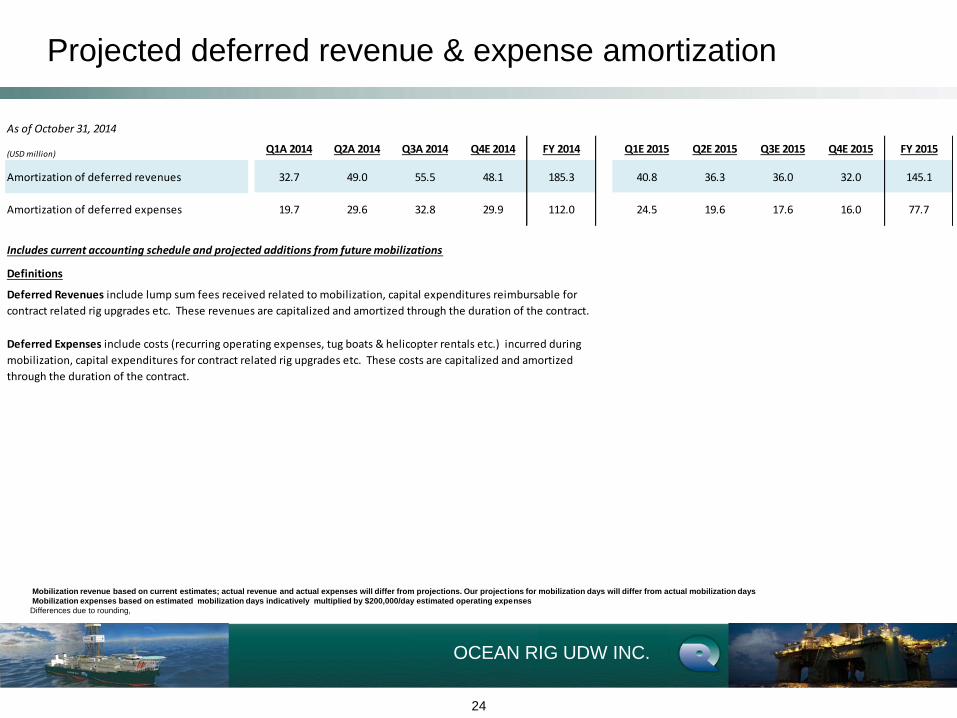
Projected deferred revenue & expense amortization
24
Mobilization revenue based on current estimates; actual revenue and actual expenses will differ from projections. Our projections for mobilization days will differ from actual mobilization days
Mobilization expenses based on estimated mobilization days indicatively multiplied by $200,000/day estimated operating expenses
Differences due to rounding,
As of October 31, 2014
(USD million) Q1A 2014 Q2A 2014 Q3A 2014 Q4E 2014 FY 2014 Q1E 2015 Q2E 2015 Q3E 2015 Q4E 2015 FY 2015
Amortization of deferred revenues 32.7 49.0 55.5 48.1 185.3 40.8 36.3 36.0 32.0 145.1
Amortization of deferred expenses 19.7 29.6 32.8 29.9 112.0 24.5 19.6 17.6 16.0 77.7
Definitions
Includes current accounting schedule and projected additions from future mobilizations
Deferred Revenues include lump sum fees received related to mobilization, capital expenditures reimbursable for
contract related rig upgrades etc. These revenues are capitalized and amortized through the duration of the contract.
Deferred Expenses include costs (recurring operating expenses, tug boats & helicopter rentals etc.) incurred during
mobilization, capital expenditures for contract related rig upgrades etc. These costs are capitalized and amortized
through the duration of the contract.
OCEAN RIG UDW INC.
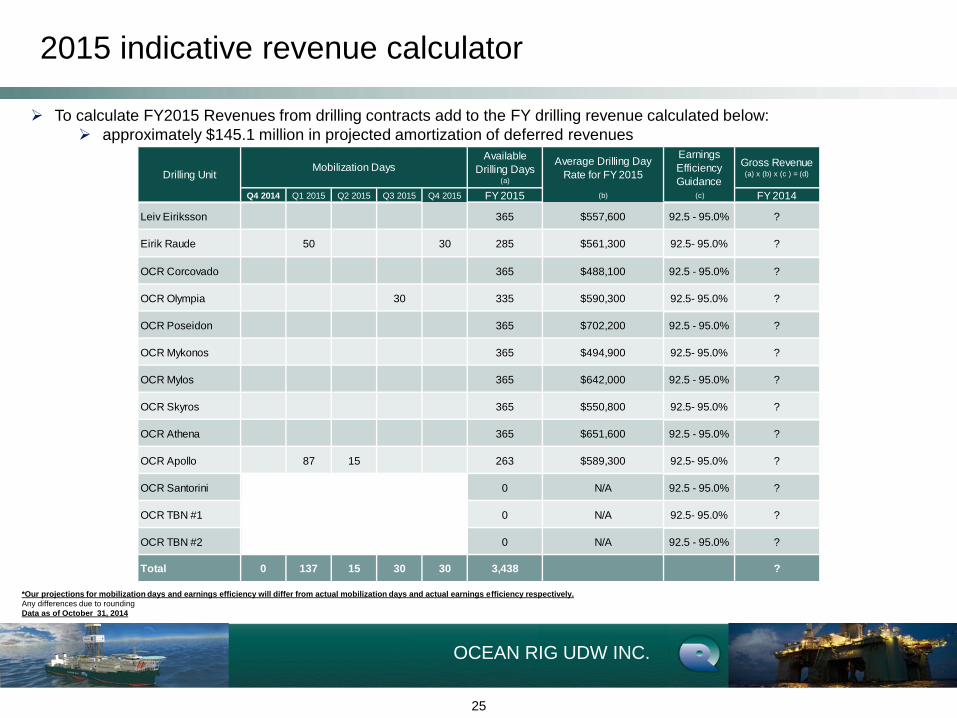
2015 indicative revenue calculator
25
*Our projections for mobilization days and earnings efficiency will differ from actual mobilization days and actual earnings efficiency respectively.
Any differences due to rounding
Data as of October 31, 2014
To calculate FY2015 Revenues from drilling contracts add to the FY drilling revenue calculated below:
approximately $145.1 million in projected amortization of deferred revenues
Available
Drilling Days (a)
Average Drilling Day
Rate for FY 2015
Earnings
Efficiency
Guidance
Gross Revenue (a) x (b) x (c ) = (d)
Q4 2014 Q1 2015 Q2 2015 Q3 2015 Q4 2015 FY 2015 (b) (c) FY 2014
Leiv Eiriksson 365 $557,600 92.5 - 95.0% ?
Eirik Raude 50 30 285 $561,300 92.5- 95.0% ?
OCR Corcovado 365 $488,100 92.5 - 95.0% ?
OCR Olympia 30 335 $590,300 92.5- 95.0% ?
OCR Poseidon 365 $702,200 92.5 - 95.0% ?
OCR Mykonos 365 $494,900 92.5- 95.0% ?
OCR Mylos 365 $642,000 92.5 - 95.0% ?
OCR Skyros 365 $550,800 92.5- 95.0% ?
OCR Athena 365 $651,600 92.5 - 95.0% ?
OCR Apollo 87 15 263 $589,300 92.5- 95.0% ?
OCR Santorini 0 N/A 92.5 - 95.0% ?
OCR TBN #1 0 N/A 92.5- 95.0% ?
OCR TBN #2 0 N/A 92.5 - 95.0% ?
Total 0 137 15 30 30 3,438 ?
Drilling UnitMobilization Days

OCEAN RIG UDW INC.
Balance Sheet
26
(Expressed in Thousands of U.S. Dollars)
December 31, 2013
September 30, 2014
ASSETS
Cash, cash equivalents and restricted cash (current and non-current) $ 659,028 $ 497,161
Other current assets 400,689 533,819
Advances for drillships under construction and related costs 662,313 592,204
Drilling rigs, drillships, machinery and equipment, net 5,777,025 6,287,005
Other non-current assets 121,395 131,124
Total assets 7,620,450 8,041,313
LIABILITIES AND STOCKHOLDERS’ EQUITY
Total debt 3,993,236 4,376,708
Total other liabilities 647,371 560,191
Total stockholders’ equity 2,979,843 3,104,414
Total liabilities and stockholders’ equity $ 7,620,450 $ 8,041,313