Embed Size (px)
Citation preview
Occlusion-Aware Interfaces Daniel Vogel1,2 and Ravin Balakrishnan1
1 Dept. of Computer Science University of Toronto, CANADA
{dvogel|ravin}@.dgp.toronto.edu
2 Dept. of Mathematics & Computer ScienceMount Allison University, CANADA
ABSTRACT We define occlusion-aware interfaces as interaction tech-niques which know what area of the display is currently occluded, and use this knowledge to counteract potential problems and/or utilize the hidden area. As a case study, we describe the Occlusion-Aware Viewer, which identifies im-portant regions hidden beneath the hand and displays them in a non-occluded area using a bubble-like callout. To de-termine what is important, we use an application agnostic image processing layer. For the occluded area, we use a user configurable, real-time version of Vogel et al.’s [21] geometric model. In an evaluation with a simultaneous monitoring task, we find the technique can successfully mitigate the effects of occlusion, although issues with am-biguity and stability suggest further refinements. Finally, we present designs for three other occlusion-aware tech-niques for pop-ups, dragging, and a hidden widget. Author Keywords: Occlusion, hand, pen, image processing
ACM Classification: H5.2 [Information interfaces and presentation]: User Interfaces - Input devices and strategies.
General Terms: Human Factors
INTRODUCTION With direct pen input, the user’s hand and forearm cover large portions of the display [21] – a phenomena referred to as occlusion – which creates problems not experienced with conventional mouse input [13]. Researchers have suggested that occlusion likely contributes to errors, increases fatigue, forces inefficient movements, and impedes performance [8,10,21]. Interaction techniques have been designed with occlusion in mind [2,15,22], but these have no awareness of what is actually being occluded by a particular user. Han-cock and Booth [10] and Brandl et al. [5] go a step further by demonstrating menu designs which automatically com-pensate for occlusion based on handedness and which menu positions are typically occluded by most users.
We extend this to a broad definition of occlusion-aware interfaces: interaction techniques which know what area of
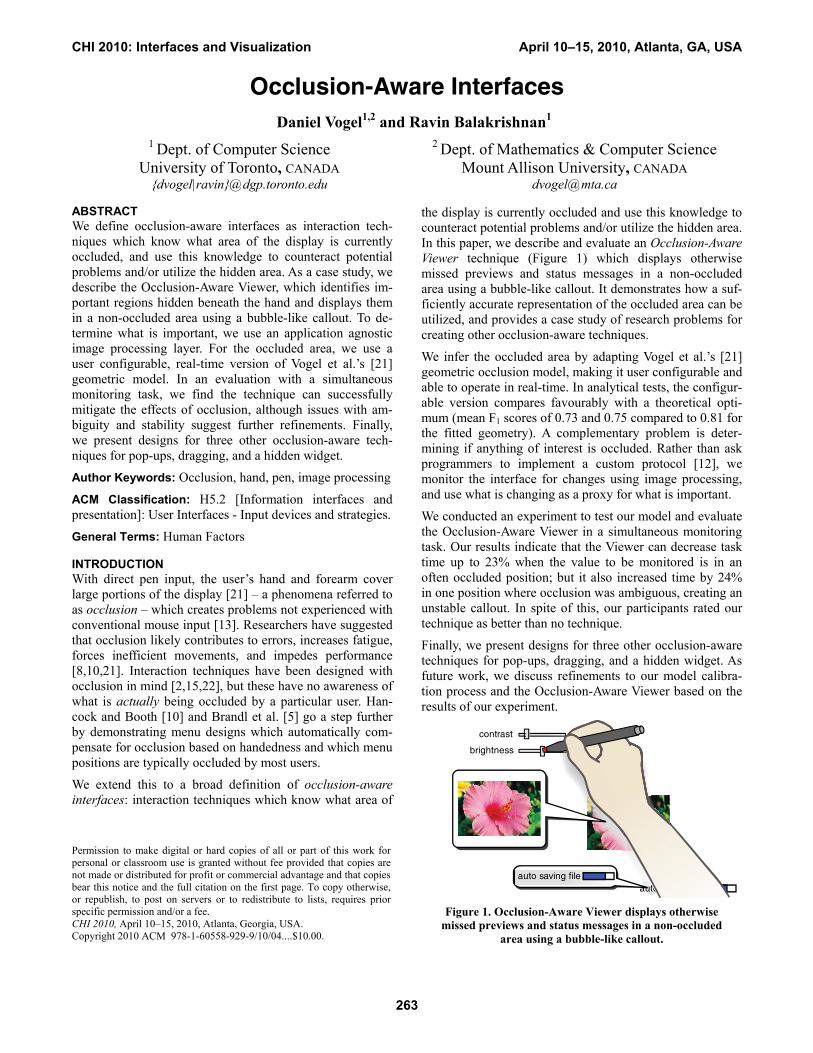
the display is currently occluded and use this knowledge to counteract potential problems and/or utilize the hidden area. In this paper, we describe and evaluate an Occlusion-Aware Viewer technique (Figure 1) which displays otherwise missed previews and status messages in a non-occluded area using a bubble-like callout. It demonstrates how a suf-ficiently accurate representation of the occluded area can be utilized, and provides a case study of research problems for creating other occlusion-aware techniques.
We infer the occluded area by adapting Vogel et al.’s [21] geometric occlusion model, making it user configurable and able to operate in real-time. In analytical tests, the configur-able version compares favourably with a theoretical opti-mum (mean F1 scores of 0.73 and 0.75 compared to 0.81 for the fitted geometry). A complementary problem is deter-mining if anything of interest is occluded. Rather than ask programmers to implement a custom protocol [12], we monitor the interface for changes using image processing, and use what is changing as a proxy for what is important.
We conducted an experiment to test our model and evaluate the Occlusion-Aware Viewer in a simultaneous monitoring task. Our results indicate that the Viewer can decrease task time up to 23% when the value to be monitored is in an often occluded position; but it also increased time by 24% in one position where occlusion was ambiguous, creating an unstable callout. In spite of this, our participants rated our technique as better than no technique.
Finally, we present designs for three other occlusion-aware techniques for pop-ups, dragging, and a hidden widget. As future work, we discuss refinements to our model calibra-tion process and the Occlusion-Aware Viewer based on the results of our experiment.
Figure 1. Occlusion-Aware Viewer displays otherwise
missed previews and status messages in a non-occluded area using a bubble-like callout.
auto saving fileauto saving file
brightness
contrast
Permission to make digital or hard copies of all or part of this work for personal or classroom use is granted without fee provided that copies are not made or distributed for profit or commercial advantage and that copies bear this notice and the full citation on the first page. To copy otherwise, or republish, to post on servers or to redistribute to lists, requires prior specific permission and/or a fee. CHI 2010, April 10–15, 2010, Atlanta, Georgia, USA. Copyright 2010 ACM 978-1-60558-929-9/10/04....$10.00.
CHI 2010: Interfaces and Visualization April 10–15, 2010, Atlanta, GA, USA
263
BACKGROUND AND RELATED WORK Usability Issues Attributed to Occlusion Hancock and Booth [10] found target selection times varied across directions of movement and inferred that this was caused by hand occlusion. Forlines and Balakrishnan [8] also attribute performance shortfalls to occlusion, but this time in one-dimensional reciprocal tapping and crossing tasks. These studies only examined raw target selection performance, making it difficult to generalize results to broader classes of interaction scenarios.
We conducted a study of Tablet PC usability with realistic tasks and common software applications [18] and found occlusion likely contributed to error and fatigue:
• Inefficient movements. When dragging, participants made movement deviations past or away from the in-tended target when it was occluded.
• Missed status messages. Participants missed occluded system status messages which can lead to errors caused by mismatched user and system states.
• Missed previews. Real time document previews were often occluded when using a formatting toolbar which led to this feature going unnoticed, or again, leading to errors from mismatched user and system states.
• Occlusion contortion. Participants arched their wrist when adjusting options so they could simultaneously monitor otherwise occluded document changes. Inkpen et al. [11] also observed left-handed participants raising their grip on the pen, or arching their hand over the screen, when using right-handed scrollbars.
The last three issues relate to cases where important content is occluded. Missed status messages and missed previews occur when the user does not know that important content is occluded and occlusion contortion is a coping mechanism when important content is known to be occluded. Interaction Techniques for Hand Occlusion Researchers have developed techniques at least partly moti-vated by occlusion. Direct pen-input techniques include Ramos and Balakrishnan’s [15] sinusoidal shaped slider which should reduce occlusion from the user’s hand; Apitz and Guimbretières’ [2] CrossY, which uses predominant right-to-left movement to counteract occlusion with right-handed users; Schilit, Golovchinsky, and Price’s pen-based XLibris ebook reader [16] places a menu bar at the bottom of the display to avoid occlusion when navigating pages. Touch screen and table top techniques focus on finger oc-clusion: examples include Shen et al.’s [17] design for vis-ual feedback which expands beyond the area typically oc-cluded by a finger; and selection techniques that shift a copy of the display area up and out of the occluded area automatically [20], or with a second hand [3].
In these examples, there is no underlying user-specific model of what is actually being occluded. Instead, simple rules-of-thumb are used, such as “avoid the area South-East
of the cursor position for right-handed users”, or the user explicitly adjusts factors themselves to address occlusion.
Hancock and Booth [10] use a more user-adaptable tech-nique for context menu positioning. After experimentally validating occlusion rules-of-thumb for left- and right-handed users, they detect handedness automatically and apply the rules for menu placement relative to the pen.
As a further refinement, Brandl et al. demonstrate an occlu-sion-aware pie menu [5] which detects handedness and user orientation on a multi-touch table. Based on experimental work classifying which pie slices are typically occluded by most users, they rotate the menu to minimize occlusion based on where the hand and pen contact the surface.
Two related techniques address other types of occlusion. Bezerianos et al.’s Mnemonic Rendering [4] buffers hidden pixel changes and re-displays them later when no longer hidden. Although physical hand occlusion is listed as one motivation, the authors’ focus and prototype implementa-tions only identify pixels hidden by overlapping windows or out of the user’s field of view. Cotting and Gross’s envi-ronment-aware display bubbles [6] distort the display to avoid physical objects and arm shadows blocking the beam of a top-projected interactive table. They capture the display area from the point-of-view of the projector using a camera. This enables accurate shadow detection, but does not con-sider the user’s point-of-view – nor is this sort of camera set-up practical in a mobile Tablet PC context. A CONFIGURABLE MODEL OF HAND OCCLUSION For occlusion-aware interfaces to work, a sufficiently accu-rate representation of the occluded area must be determined in real time. The representation can range from a very sim-ple model, such as a bounding-box [21], to a literal image of the occluded area, similar to Cotting and Gross’s projec-tor beam occlusion [6]. Capturing an image of the occluded area without being obtrusive would require a multi-touch device capable of tracking objects above the surface, but these devices are still being developed and they typically require a strong above-surface light source [7].
Brandl et al. [5] use a simple model specific to a pie menu. It describes which pie slices in a circle are typically oc-cluded by most users given a reference orientation. Since this model is not user-specific, it requires no calibration, but the user must rest their hand on the surface to track their hand position. Further, it only describes the occluded area in the immediate vicinity of the pen position, and it does not compensate for different grips used by different users.
We use a user-configurable geometric representation of the entire occluded area on the display and position it using only the cursor position and, for additional accuracy when available, stylus tilt. This works on current pen devices, works regardless of hand contact, and can accommodate a wide variance of individual pen grip styles and handedness. With a more complete representation of the occluded area at our disposal, this also enables a wider variety of occlusion-aware interaction techniques.
CHI 2010: Interfaces and Visualization April 10–15, 2010, Atlanta, GA, USA
264
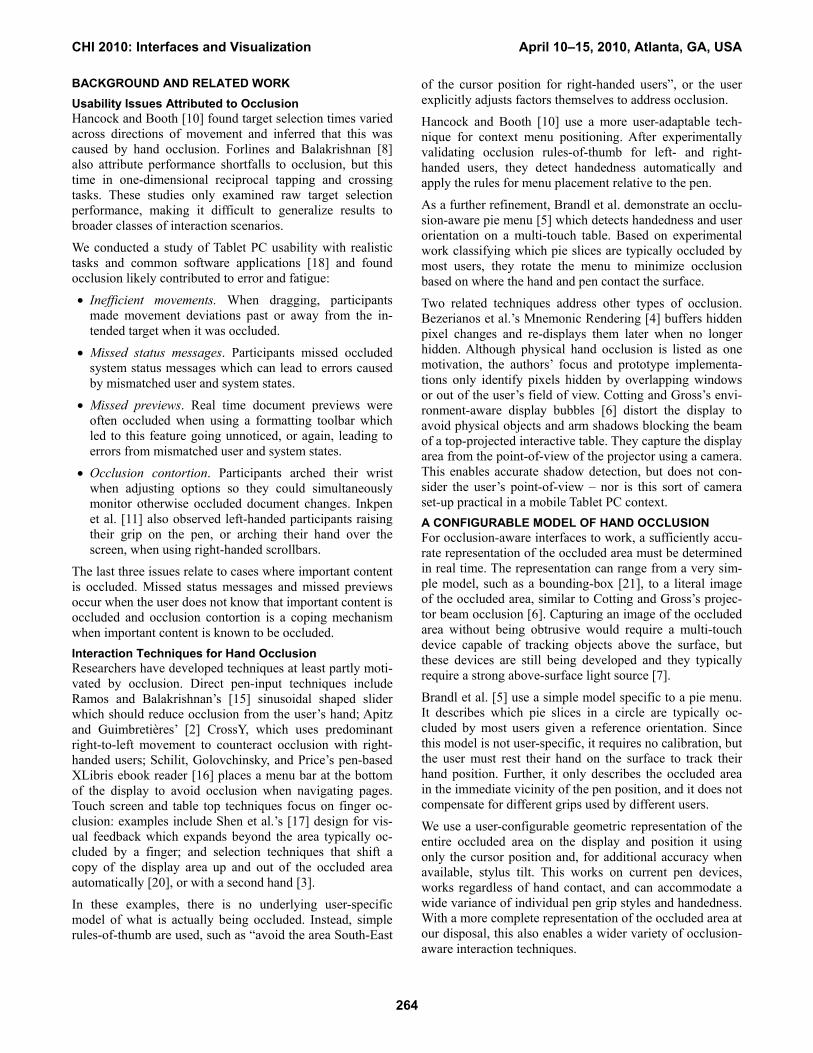
Geometric Model Our model uses Vogel et al.’s [21] five-parameter scalable circle and pivoting rectangle (Figure 3) which captures the general shape of the occluded area relative to the pen posi-tion. The shapes and parameters are based on a corpus of occlusion silhouettes, binary images of the hand and fore-arm, taken from the user’s point-of-view at 77 locations.
The five parameters are:
• q, the offset from the pen position p to the circle edge,
• r, the radius of the circle over the fist area,
• Φ, the rotation angle of the circle around p (expressed in degrees where Φ = 0° when the centre is due East, Φ = -45° for North-East, and Φ = 45° for South-East),
• Θ, the angle of rotation of the rectangle around the cen-tre of the circle (same angle configuration as Φ),
• w, the width of the rectangle representing the forearm.
For convenience, we refer to the circle centre as c. For de-vice independence, non-angular parameters are in mm.
Figure 3. Vogel et al.’s [21] geometric model of occlu-
sion: (a) sample occlusion silhouette; (b) five-parameter scalable circle and pivoting rectangle geometric model
captures essence of the silhouette.
Model Configuration Using the space of fitted model parameters Vogel et al. [21] calculated a mean configuration of the model as a rough guideline for designers. However, the authors point out that due to different user pen grip styles and hand postures, such a “mean model” may be less reliable. As an alternative, they briefly discuss an idea for a predictive version of the model which could be configured for individual users. We refine and implement their idea of a predictive model, or as we call it, a configurable model of hand occlusion.
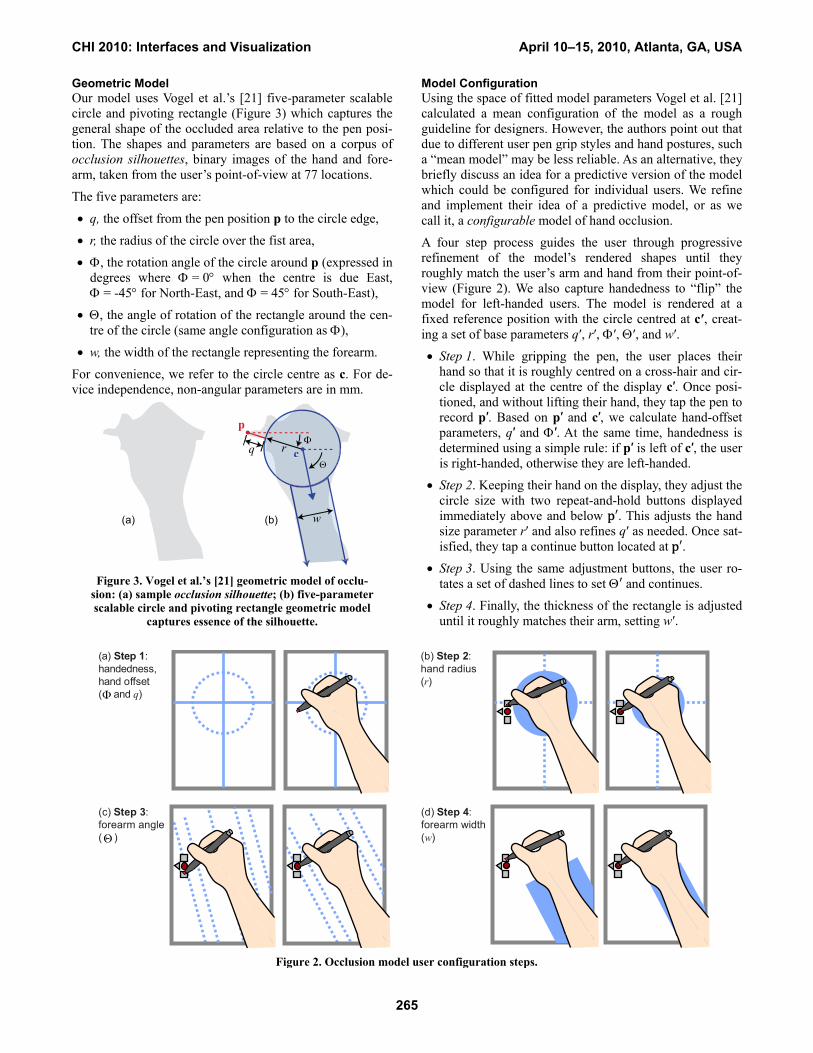
A four step process guides the user through progressive refinement of the model’s rendered shapes until they roughly match the user’s arm and hand from their point-of-view (Figure 2). We also capture handedness to “flip” the model for left-handed users. The model is rendered at a fixed reference position with the circle centred at c′, creat-ing a set of base parameters q′, r′, Φ′, Θ′, and w′.
• Step 1. While gripping the pen, the user places their hand so that it is roughly centred on a cross-hair and cir-cle displayed at the centre of the display c′. Once posi-tioned, and without lifting their hand, they tap the pen to record p′. Based on p′ and c′, we calculate hand-offset parameters, q′ and Φ′. At the same time, handedness is determined using a simple rule: if p′ is left of c′, the user is right-handed, otherwise they are left-handed.
• Step 2. Keeping their hand on the display, they adjust the circle size with two repeat-and-hold buttons displayed immediately above and below p . This adjusts the hand size parameter r′ and also refines q′ as needed. Once sat-isfied, they tap a continue button located at p .
• Step 3. Using the same adjustment buttons, the user ro-tates a set of dashed lines to set Θ and continues.
• Step 4. Finally, the thickness of the rectangle is adjusted until it roughly matches their arm, setting w′.
w
p
cq r
(b)(a)
Figure 2. Occlusion model user configuration steps.
(b) Step 2:hand radius(r)
(a) Step 1:handedness,hand offset( and q)
(d) Step 4:forearm width(w)
(c) Step 3:forearm angle( )
CHI 2010: Interfaces and Visualization April 10–15, 2010, Atlanta, GA, USA
265
Real-Time Model Positioning Using these base parameters, we can position the model at arbitrary pen positions p. Without tilt, we use all base pa-rameters directly with the exception of Θ since the forearm angle varies as the wrist is moved. We considered using a kinematic model like Vogel et al. [21] suggest, but this proved difficult to configure with Θ′ and added complexity. We also considered multiple Θ′ samples at different posi-tions, but this would lengthen the configuration process.
Instead, we use an extremely simple model of forearm an-gle which is adequate for our medium-sized display. Θ is calculated as the angle between the approximate wrist posi-tion c and a vertically sliding elbow position e. The 2D co-ordinates of e are calculated during configuration as the end point of a vector originating at c′ at angle Θ′ and 270 mm long (the mean forearm length [14]). With Stylus Tilt Some direct input pen devices detect the azimuth and alti-tude of pen tilt. With a constant grip, pen tilt should be cor-related to q and Φ, so our model uses this additional infor-mation when available. The azimuth, φ, uses the same angle configuration as Φ and Θ, and the altitude, θ, is the angle deviation away from the display surface normal. To com-pensate for somewhat noisy tilt data, we applied a dynamic recursive low pass filter [19] at 60Hz with cut-offs of 0.05 and 2 Hz interpolated between 4 and 20 degrees/s.
Base values φ′ and θ′ are sampled during configuration in step 1. Thus, q is calculated from q′ using the ratio of cur-rent altitude and base altitude:
′ cos θ/ cos θ′ (1) The parameter Φ is calculated as a fixed offset from the current and base azimuth:
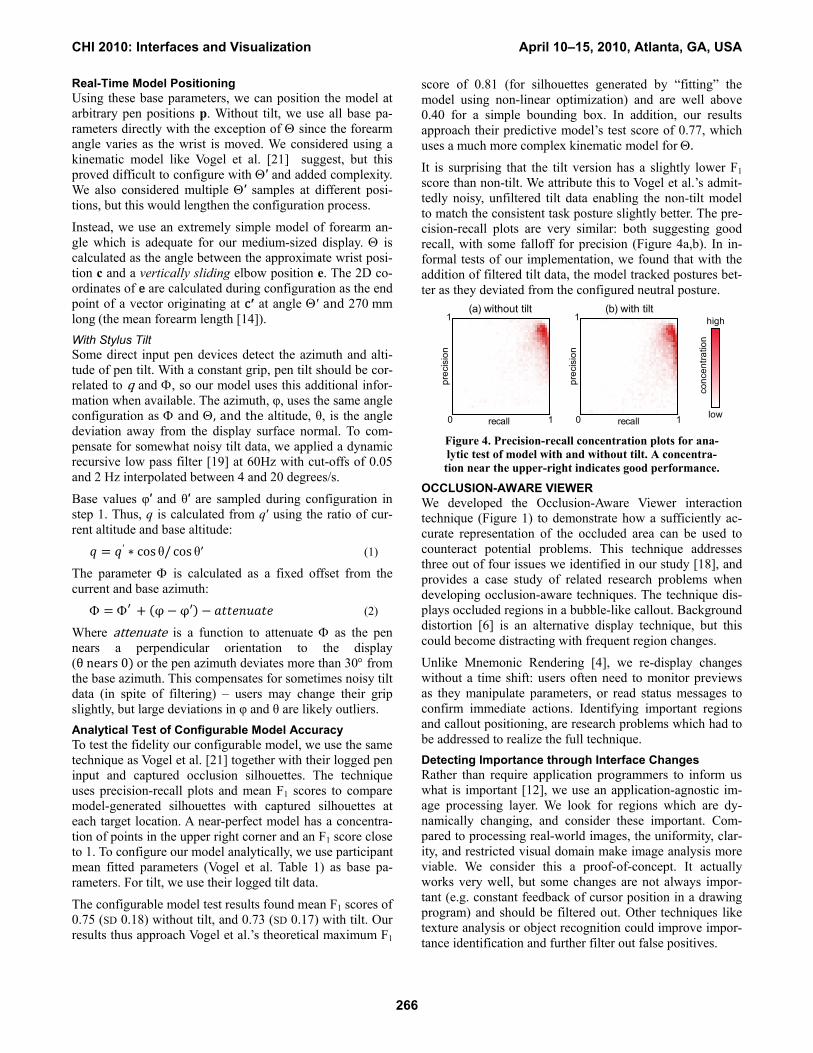
Φ Φ φ φ (2) Where attenuate is a function to attenuate Φ as the pen nears a perpendicular orientation to the display (θ nears 0 or the pen azimuth deviates more than 30° from the base azimuth. This compensates for sometimes noisy tilt data (in spite of filtering) – users may change their grip slightly, but large deviations in φ and θ are likely outliers. Analytical Test of Configurable Model Accuracy To test the fidelity our configurable model, we use the same technique as Vogel et al. [21] together with their logged pen input and captured occlusion silhouettes. The technique uses precision-recall plots and mean F1 scores to compare model-generated silhouettes with captured silhouettes at each target location. A near-perfect model has a concentra-tion of points in the upper right corner and an F1 score close to 1. To configure our model analytically, we use participant mean fitted parameters (Vogel et al. Table 1) as base pa-rameters. For tilt, we use their logged tilt data.
The configurable model test results found mean F1 scores of 0.75 (SD 0.18) without tilt, and 0.73 (SD 0.17) with tilt. Our results thus approach Vogel et al.’s theoretical maximum F1
score of 0.81 (for silhouettes generated by “fitting” the model using non-linear optimization) and are well above 0.40 for a simple bounding box. In addition, our results approach their predictive model’s test score of 0.77, which uses a much more complex kinematic model for Θ. It is surprising that the tilt version has a slightly lower F1 score than non-tilt. We attribute this to Vogel et al.’s admit-tedly noisy, unfiltered tilt data enabling the non-tilt model to match the consistent task posture slightly better. The pre-cision-recall plots are very similar: both suggesting good recall, with some falloff for precision (Figure 4a,b). In in-formal tests of our implementation, we found that with the addition of filtered tilt data, the model tracked postures bet-ter as they deviated from the configured neutral posture.
Figure 4. Precision-recall concentration plots for ana-lytic test of model with and without tilt. A concentra-tion near the upper-right indicates good performance.
OCCLUSION-AWARE VIEWER We developed the Occlusion-Aware Viewer interaction technique (Figure 1) to demonstrate how a sufficiently ac-curate representation of the occluded area can be used to counteract potential problems. This technique addresses three out of four issues we identified in our study [18], and provides a case study of related research problems when developing occlusion-aware techniques. The technique dis-plays occluded regions in a bubble-like callout. Background distortion [6] is an alternative display technique, but this could become distracting with frequent region changes.
Unlike Mnemonic Rendering [4], we re-display changes without a time shift: users often need to monitor previews as they manipulate parameters, or read status messages to confirm immediate actions. Identifying important regions and callout positioning, are research problems which had to be addressed to realize the full technique. Detecting Importance through Interface Changes Rather than require application programmers to inform us what is important [12], we use an application-agnostic im-age processing layer. We look for regions which are dy-namically changing, and consider these important. Com-pared to processing real-world images, the uniformity, clar-ity, and restricted visual domain make image analysis more viable. We consider this a proof-of-concept. It actually works very well, but some changes are not always impor-tant (e.g. constant feedback of cursor position in a drawing program) and should be filtered out. Other techniques like texture analysis or object recognition could improve impor-tance identification and further filter out false positives.
(a) without tilt
0 1
1
recall
prec
isio
n
(b) with tilt
0 1
1
recall
high
low
prec
isio
n
conc
entra
tion
CHI 2010: Interfaces and Visualization April 10–15, 2010, Atlanta, GA, USA
266
First, a binary detection image mask is created to identify which interface regions are changing (Figure 5a):
1) Capture: The entire screen captured at 5 Hz and scaled to 30% to reduce subsequent CPU load. The capture does not include the technique’s bubble callouts.
2) Accumulator: The capture is added to a running average accumulation buffer with an alpha weight of 0.5. A lower weight amplifies and prolongs changes and a higher weight filters out more short duration, subtle changes.
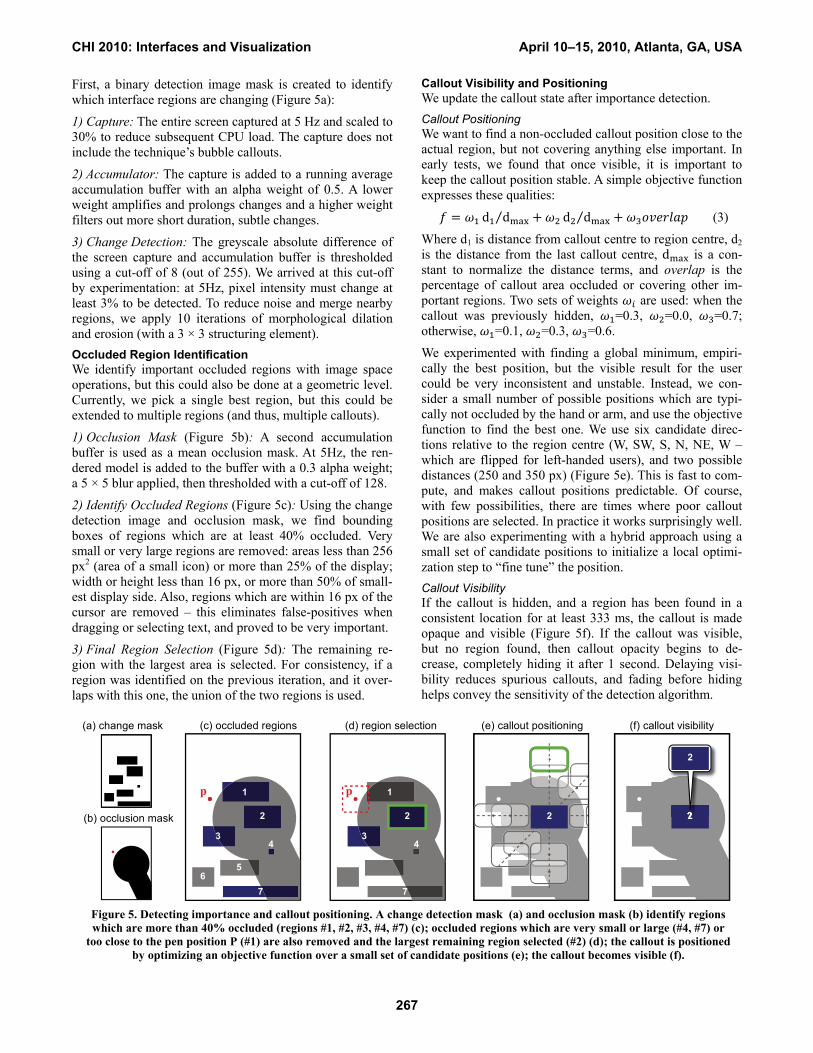
3) Change Detection: The greyscale absolute difference of the screen capture and accumulation buffer is thresholded using a cut-off of 8 (out of 255). We arrived at this cut-off by experimentation: at 5Hz, pixel intensity must change at least 3% to be detected. To reduce noise and merge nearby regions, we apply 10 iterations of morphological dilation and erosion (with a 3 × 3 structuring element). Occluded Region Identification We identify important occluded regions with image space operations, but this could also be done at a geometric level. Currently, we pick a single best region, but this could be extended to multiple regions (and thus, multiple callouts).
1) Occlusion Mask (Figure 5b): A second accumulation buffer is used as a mean occlusion mask. At 5Hz, the ren-dered model is added to the buffer with a 0.3 alpha weight; a 5 × 5 blur applied, then thresholded with a cut-off of 128.
2) Identify Occluded Regions (Figure 5c): Using the change detection image and occlusion mask, we find bounding boxes of regions which are at least 40% occluded. Very small or very large regions are removed: areas less than 256 px2 (area of a small icon) or more than 25% of the display; width or height less than 16 px, or more than 50% of small-est display side. Also, regions which are within 16 px of the cursor are removed – this eliminates false-positives when dragging or selecting text, and proved to be very important.
3) Final Region Selection (Figure 5d): The remaining re-gion with the largest area is selected. For consistency, if a region was identified on the previous iteration, and it over-laps with this one, the union of the two regions is used.
Callout Visibility and Positioning We update the callout state after importance detection. Callout Positioning We want to find a non-occluded callout position close to the actual region, but not covering anything else important. In early tests, we found that once visible, it is important to keep the callout position stable. A simple objective function expresses these qualities:
d d⁄ d d⁄ (3)
Where d1 is distance from callout centre to region centre, d2 is the distance from the last callout centre, d is a con-stant to normalize the distance terms, and overlap is the percentage of callout area occluded or covering other im-portant regions. Two sets of weights are used: when the callout was previously hidden, =0.3, =0.0, =0.7; otherwise, =0.1, =0.3, =0.6.
We experimented with finding a global minimum, empiri-cally the best position, but the visible result for the user could be very inconsistent and unstable. Instead, we con-sider a small number of possible positions which are typi-cally not occluded by the hand or arm, and use the objective function to find the best one. We use six candidate direc-tions relative to the region centre (W, SW, S, N, NE, W – which are flipped for left-handed users), and two possible distances (250 and 350 px) (Figure 5e). This is fast to com-pute, and makes callout positions predictable. Of course, with few possibilities, there are times where poor callout positions are selected. In practice it works surprisingly well. We are also experimenting with a hybrid approach using a small set of candidate positions to initialize a local optimi-zation step to “fine tune” the position. Callout Visibility If the callout is hidden, and a region has been found in a consistent location for at least 333 ms, the callout is made opaque and visible (Figure 5f). If the callout was visible, but no region found, then callout opacity begins to de-crease, completely hiding it after 1 second. Delaying visi-bility reduces spurious callouts, and fading before hiding helps convey the sensitivity of the detection algorithm.
Figure 5. Detecting importance and callout positioning. A change detection mask (a) and occlusion mask (b) identify regions which are more than 40% occluded (regions #1, #2, #3, #4, #7) (c); occluded regions which are very small or large (#4, #7) or
too close to the pen position P (#1) are also removed and the largest remaining region selected (#2) (d); the callout is positioned by optimizing an objective function over a small set of candidate positions (e); the callout becomes visible (f).
1
2
34 4
56
7
2
3
p p
(c) occluded regions (d) region selection (e) callout positioning (f) callout visibility(a) change mask
(b) occlusion mask
7
1
2 2
2
CHI 2010: Interfaces and Visualization April 10–15, 2010, Atlanta, GA, USA
267
EXPERIMENT Earlier, we discussed research [11,21] that observed users contorting their hand posture as a coping mechanism when important content is known to be occluded. This typically occurs when a user adjusts a parameter while at the same time monitoring display feedback – we call this a simulta-neous monitoring task. Our Occlusion-Aware Viewer tech-nique is designed to compensate for this when the moni-tored display feedback is occluded.
Our experiment has three main goals:
• Test the usability of occlusion model user configuration.
• Examine whether occlusion contortion affects the dura-tion and accuracy of a simultaneous monitoring task.
• Validate that our Occlusion-Aware Viewer technique mitigates occlusion contortion and its effect.
Participants 12 people (4 female, 8 male) with a mean age of 22.3 (SD 3.7) participated. All participants were right-handed and pre-screened for color blindness. Participants had little ex-perience with direct pen input, but this is acceptable since we are observing a relatively simple style of interaction. Apparatus The experiment used the same apparatus set-up as Vogel et al. [21]: a Wacom Cintiq 12UX direct input pen tablet in portrait-orientation and a small head-mounted video camera to record the entire experiment. The Cintiq tablet has a 307 mm (12.1 inch) diagonal display and a resolution of 1280 × 800 px (261 × 163 mm) creating a pixel density of 4.9 px/mm (125 DPI). It was supported at an angle close to 12 degrees off the desk, oriented towards the participant. Participants were seated in an adjustable office chair with the height adjusted so that the elbow formed a 90 degree angle when the forearm was on the desk.
The head-mounted video camera recorded the entire ex-periment at 640 × 480 px resolution and 15 frames-per-second. The camera is attached to a head harness using hook-and-loop strips making it easy to move up or down so that it can be positioned close to the center of the eyes, without interfering with the participants’ line of sight.
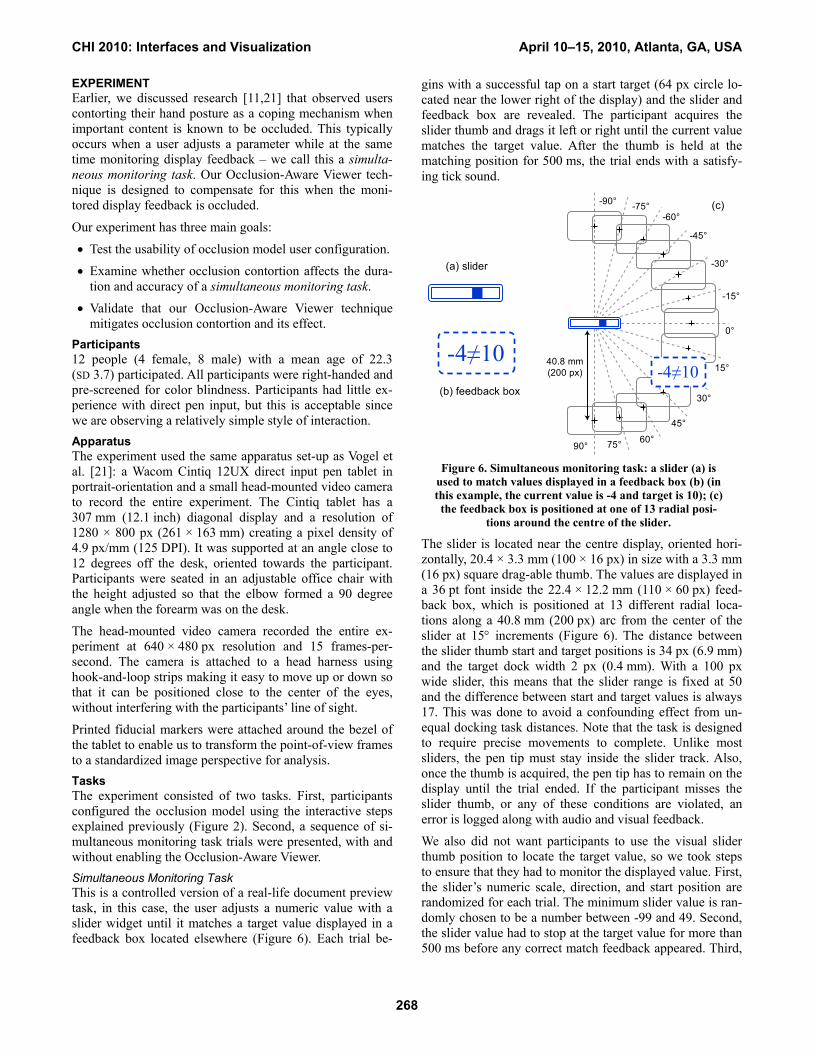
Printed fiducial markers were attached around the bezel of the tablet to enable us to transform the point-of-view frames to a standardized image perspective for analysis. Tasks The experiment consisted of two tasks. First, participants configured the occlusion model using the interactive steps explained previously (Figure 2). Second, a sequence of si-multaneous monitoring task trials were presented, with and without enabling the Occlusion-Aware Viewer. Simultaneous Monitoring Task This is a controlled version of a real-life document preview task, in this case, the user adjusts a numeric value with a slider widget until it matches a target value displayed in a feedback box located elsewhere (Figure 6). Each trial be-
gins with a successful tap on a start target (64 px circle lo-cated near the lower right of the display) and the slider and feedback box are revealed. The participant acquires the slider thumb and drags it left or right until the current value matches the target value. After the thumb is held at the matching position for 500 ms, the trial ends with a satisfy-ing tick sound.
Figure 6. Simultaneous monitoring task: a slider (a) is
used to match values displayed in a feedback box (b) (in this example, the current value is -4 and target is 10); (c) the feedback box is positioned at one of 13 radial posi-
tions around the centre of the slider.
The slider is located near the centre display, oriented hori-zontally, 20.4 × 3.3 mm (100 × 16 px) in size with a 3.3 mm (16 px) square drag-able thumb. The values are displayed in a 36 pt font inside the 22.4 × 12.2 mm (110 × 60 px) feed-back box, which is positioned at 13 different radial loca-tions along a 40.8 mm (200 px) arc from the center of the slider at 15° increments (Figure 6). The distance between the slider thumb start and target positions is 34 px (6.9 mm) and the target dock width 2 px (0.4 mm). With a 100 px wide slider, this means that the slider range is fixed at 50 and the difference between start and target values is always 17. This was done to avoid a confounding effect from un-equal docking task distances. Note that the task is designed to require precise movements to complete. Unlike most sliders, the pen tip must stay inside the slider track. Also, once the thumb is acquired, the pen tip has to remain on the display until the trial ended. If the participant misses the slider thumb, or any of these conditions are violated, an error is logged along with audio and visual feedback.
We also did not want participants to use the visual slider thumb position to locate the target value, so we took steps to ensure that they had to monitor the displayed value. First, the slider’s numeric scale, direction, and start position are randomized for each trial. The minimum slider value is ran-domly chosen to be a number between -99 and 49. Second, the slider value had to stop at the target value for more than 500 ms before any correct match feedback appeared. Third,
-90° -75°-60°
-45°
-30°
-15°
0°
15°
30°
45°
60°75°90°
-4≠1040.8 mm(200 px)
(a) slider
(b) feedback box
(c)
-4≠10
CHI 2010: Interfaces and Visualization April 10–15, 2010, Atlanta, GA, USA
268
target values were selected so they were never the minimum or maximum slider value. Finally, to hide the consistent target distances, 6 extra trials with random distances are inserted but excluded from analysis. We did not observe any “cheating” – all performed the task as intended.
Participants were asked to immediately recover from errors and continue until task completion. This prevents rushing through the experiment, but most importantly, it enables us to include error recovery time in overall task time. We re-veal the slider and target value box after the start target is selected. This way, the time used to adjust hand posture to accommodate occlusion is also included in the trial.
Our artificial monitoring task forced one concession. The dashed border of the feedback box animates as the value changes (using “marching ants”) as a hint to the Viewer’s display change algorithm to consider the whole box. Oth-erwise, the static target value would need to be memorized. Design For the simultaneous monitoring task portion of the ex-periment, a repeated measures within-participant factorial design was used with two independent variables: Tech-nique; and Angle. The two Technique conditions were: with Occlusion-Aware Viewer (Viewer) and without (Baseline). The target value display was positioned at 13 Angles from -90° to 90° in 15° increments, 40.8 mm (200 px) from the centre of the slider (Figure 6c). These were selected from a pilot study to include occluded and non-occluded positions.
Presentation of Technique was counter-balanced across par-ticipants. Each Technique consisted of four consecutive Blocks with each block presenting all 13 Angles in random order. As explained above, 6 additional special non-timed trials were inserted in each block to prevent participants from recognizing the consistent 17 pixel target value dis-tance in timed trials. At the beginning of each Technique, a short demonstration and practice block was presented. The entire experiment took 30 to 40 minutes to complete. In summary, the experimental design was:
2 Conditions (Viewer, Baseline) × 13 Angles × 4 Blocks = 104 trials per participant
Results for Occlusion Model Configuration Task All participants completed the model configuration step successfully, but they had some difficulty and required guidance. In step 1, participants found the notion of cen-tring their hand in a circle ambiguous, and often placed their hand too high or low. A related issue occurred in step 4, when the rectangle was shifted from the forearm midline due to a limitation of the simple geometric model, and they were not clear as to what constituted a good rectangle width. Participants also tended to lift their hand during con-figuration, which seems to be motivated by a desire to see what was on the entire display (which of course, was mostly occluded), or due to a seemingly natural lifting mo-tion as they tapped the adjustment buttons.
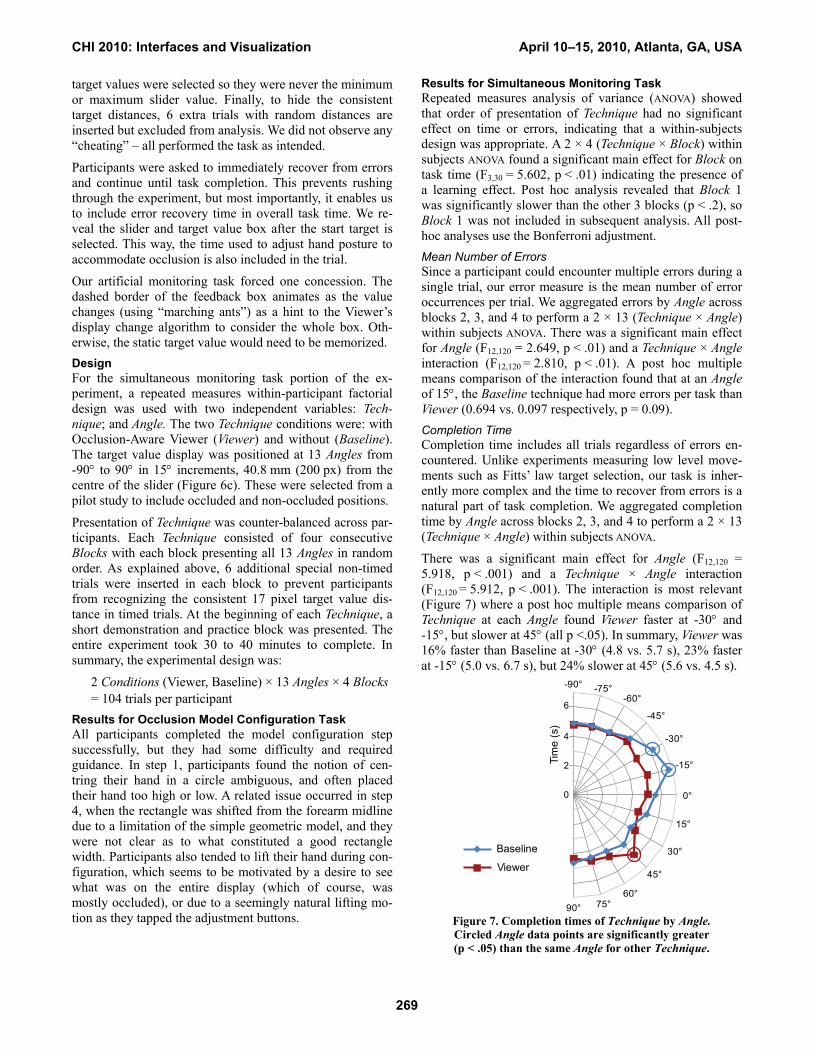
Results for Simultaneous Monitoring Task Repeated measures analysis of variance (ANOVA) showed that order of presentation of Technique had no significant effect on time or errors, indicating that a within-subjects design was appropriate. A 2 × 4 (Technique × Block) within subjects ANOVA found a significant main effect for Block on task time (F3,30 = 5.602, p < .01) indicating the presence of a learning effect. Post hoc analysis revealed that Block 1 was significantly slower than the other 3 blocks (p < .2), so Block 1 was not included in subsequent analysis. All post-hoc analyses use the Bonferroni adjustment. Mean Number of Errors Since a participant could encounter multiple errors during a single trial, our error measure is the mean number of error occurrences per trial. We aggregated errors by Angle across blocks 2, 3, and 4 to perform a 2 × 13 (Technique × Angle) within subjects ANOVA. There was a significant main effect for Angle (F12,120 = 2.649, p < .01) and a Technique × Angle interaction (F12,120 = 2.810, p < .01). A post hoc multiple means comparison of the interaction found that at an Angle of 15°, the Baseline technique had more errors per task than Viewer (0.694 vs. 0.097 respectively, p = 0.09). Completion Time Completion time includes all trials regardless of errors en-countered. Unlike experiments measuring low level move-ments such as Fitts’ law target selection, our task is inher-ently more complex and the time to recover from errors is a natural part of task completion. We aggregated completion time by Angle across blocks 2, 3, and 4 to perform a 2 × 13 (Technique × Angle) within subjects ANOVA.
There was a significant main effect for Angle (F12,120 = 5.918, p < .001) and a Technique × Angle interaction (F12,120 = 5.912, p < .001). The interaction is most relevant (Figure 7) where a post hoc multiple means comparison of Technique at each Angle found Viewer faster at -30° and -15°, but slower at 45° (all p <.05). In summary, Viewer was 16% faster than Baseline at -30° (4.8 vs. 5.7 s), 23% faster at -15° (5.0 vs. 6.7 s), but 24% slower at 45° (5.6 vs. 4.5 s).
Figure 7. Completion times of Technique by Angle. Circled Angle data points are significantly greater (p < .05) than the same Angle for other Technique.
-75°-60°
-45°
-30°
-15°
15°
0°
30°
60°75°90°
-90°
45°
0
4
2
6
Tim
e (s
)
Baseline
Viewer
CHI 2010: Interfaces and Visualization April 10–15, 2010, Atlanta, GA, USA
269
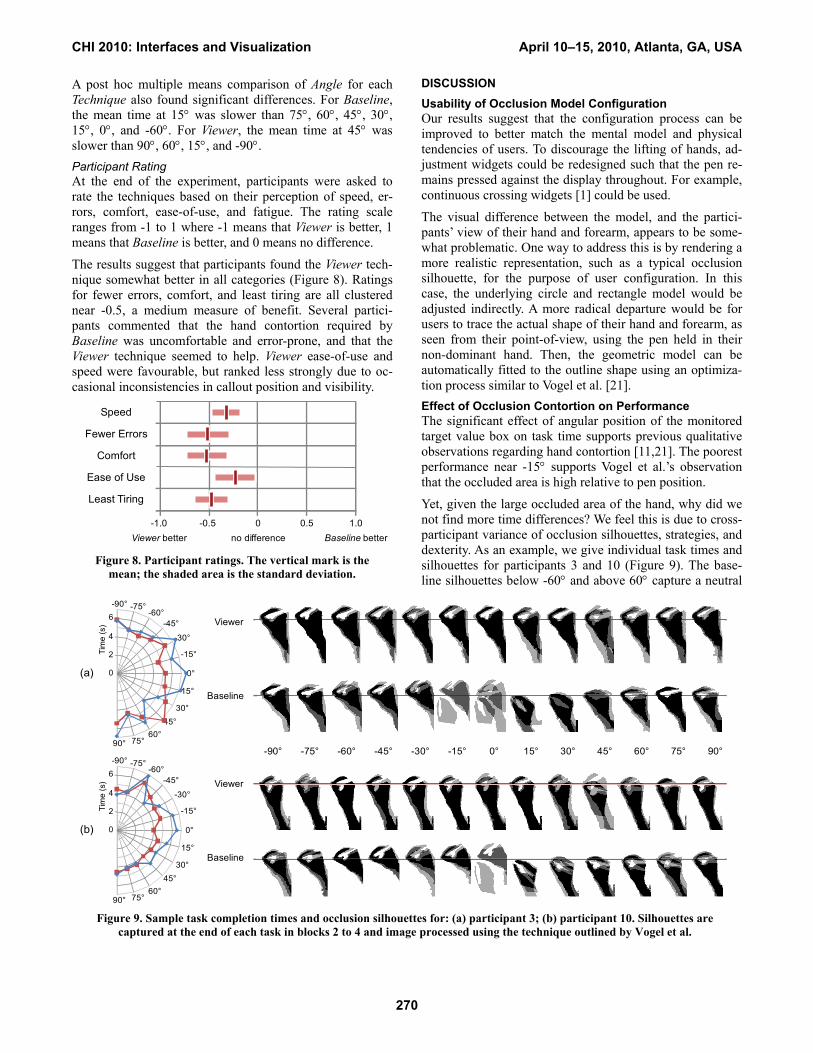
A post hoc multiple means comparison of Angle for each Technique also found significant differences. For Baseline, the mean time at 15° was slower than 75°, 60°, 45°, 30°, 15°, 0°, and -60°. For Viewer, the mean time at 45° was slower than 90°, 60°, 15°, and -90°. Participant Rating At the end of the experiment, participants were asked to rate the techniques based on their perception of speed, er-rors, comfort, ease-of-use, and fatigue. The rating scale ranges from -1 to 1 where -1 means that Viewer is better, 1 means that Baseline is better, and 0 means no difference.
The results suggest that participants found the Viewer tech-nique somewhat better in all categories (Figure 8). Ratings for fewer errors, comfort, and least tiring are all clustered near -0.5, a medium measure of benefit. Several partici-pants commented that the hand contortion required by Baseline was uncomfortable and error-prone, and that the Viewer technique seemed to help. Viewer ease-of-use and speed were favourable, but ranked less strongly due to oc-casional inconsistencies in callout position and visibility.
Figure 8. Participant ratings. The vertical mark is the
mean; the shaded area is the standard deviation.
DISCUSSION Usability of Occlusion Model Configuration Our results suggest that the configuration process can be improved to better match the mental model and physical tendencies of users. To discourage the lifting of hands, ad-justment widgets could be redesigned such that the pen re-mains pressed against the display throughout. For example, continuous crossing widgets [1] could be used.
The visual difference between the model, and the partici-pants’ view of their hand and forearm, appears to be some-what problematic. One way to address this is by rendering a more realistic representation, such as a typical occlusion silhouette, for the purpose of user configuration. In this case, the underlying circle and rectangle model would be adjusted indirectly. A more radical departure would be for users to trace the actual shape of their hand and forearm, as seen from their point-of-view, using the pen held in their non-dominant hand. Then, the geometric model can be automatically fitted to the outline shape using an optimiza-tion process similar to Vogel et al. [21]. Effect of Occlusion Contortion on Performance The significant effect of angular position of the monitored target value box on task time supports previous qualitative observations regarding hand contortion [11,21]. The poorest performance near -15° supports Vogel et al.’s observation that the occluded area is high relative to pen position.
Yet, given the large occluded area of the hand, why did we not find more time differences? We feel this is due to cross-participant variance of occlusion silhouettes, strategies, and dexterity. As an example, we give individual task times and silhouettes for participants 3 and 10 (Figure 9). The base-line silhouettes below -60° and above 60° capture a neutral
Speed
Viewer better Baseline betterno difference-1.0 1.00.5-0.5 0
Comfort
Ease of Use
Least Tiring
Fewer Errors
Figure 9. Sample task completion times and occlusion silhouettes for: (a) participant 3; (b) participant 10. Silhouettes are captured at the end of each task in blocks 2 to 4 and image processed using the technique outlined by Vogel et al.
60° 75° 90°45°30°15°-15° 0°-30°-45°-60°-75°-90°
(b)
(a)
-75°-60°
-45°
45°
-30°
-15°
15°
0°
30°
60°75°90°
-90°
0
4
2
6
Tim
e (s
)
-75°-60°
-45°
45°
-30°
-15°
15°
0°
30°
60°75°90°
-90°
0
4
2
6
Tim
e (s
)
Baseline
Viewer
Baseline
Viewer
CHI 2010: Interfaces and Visualization April 10–15, 2010, Atlanta, GA, USA
270
posture, but in between, one can see different strategies used such as arching above or twisting below.
Here, task times for participant 3 suggest broader problems (ranging from -30 to 15°) compared to participant 10 (-15 to 0°). The silhouettes suggest why: participant 3 has more posture variance and mixed contortion strategies across a broader range of angles, perhaps due their larger hand grip.
Regarding dexterity, comparing their baseline silhouettes to time profiles indicates these participants are capable of slight contortion to peer around their hand to counter-act occlusion. With a larger preview area, or in the case of missed status messages, this ability may not apply. Performance of Occlusion-Aware Viewer At first, it may seem that a technique which essentially re-positions the target value box in a non-occluded area would produce consistent task times across angular positions. Of course, this assumes the technique has no cognitive over-head and the model, importance detection, and callout posi-tioning work perfectly in all situations. With lower task times at angles 0° and -15°, we know that when the Viewer technique is working well, it can mitigate occlusion. How-ever, the 45° task time spike suggests further refinement.
To investigate this issue, we reviewed the point-of-view video logs for trials where the feedback box was near 45°. We found this was often an ambiguous zone for the occlu-sion model, creating more frequent false negatives and false positives. With false negatives, the feedback box may really be occluded, but no callout appears; or the callout appears, but may be placed in an occluded position. With false posi-tives, in spite of an un-occluded feedback box, a callout appears which can be distracting – especially in mid-task. The worst case is when ambiguity creates callout visibility and position vacillation. Note also that some participants experienced this kind of ambiguity elsewhere (e.g., partici-pant 10’s time at -60°, Figure 9).
Many participants commented on the sometimes unpredict-able position and visibility of the callout in spite of prefer-ring it to having no technique at all. We discussed earlier how we had already improved the callout layout algorithm for predictability. The layout objective function could be further tuned to increase the penalty for callout movements regardless of a slight increase in occlusion. An additional term could encourage new callouts to appear as close as possible to previous ones, especially if little time has passed. Overall, we think that users prefer callout consis-tency, even if this causes some slight occlusion.
Overall, the same high variance in participant grip and dex-terity prevented more statistical differences over a broader range of angles. As an example, participants 3 and 10 show very different task time profiles across angles for the Viewer compared to the baseline (Figure 9). What is clear is the consistent hand posture with the viewer technique. This suggests that they trusted the technique enough to simply start adjusting the slider – and expected that the callout would appear if needed.
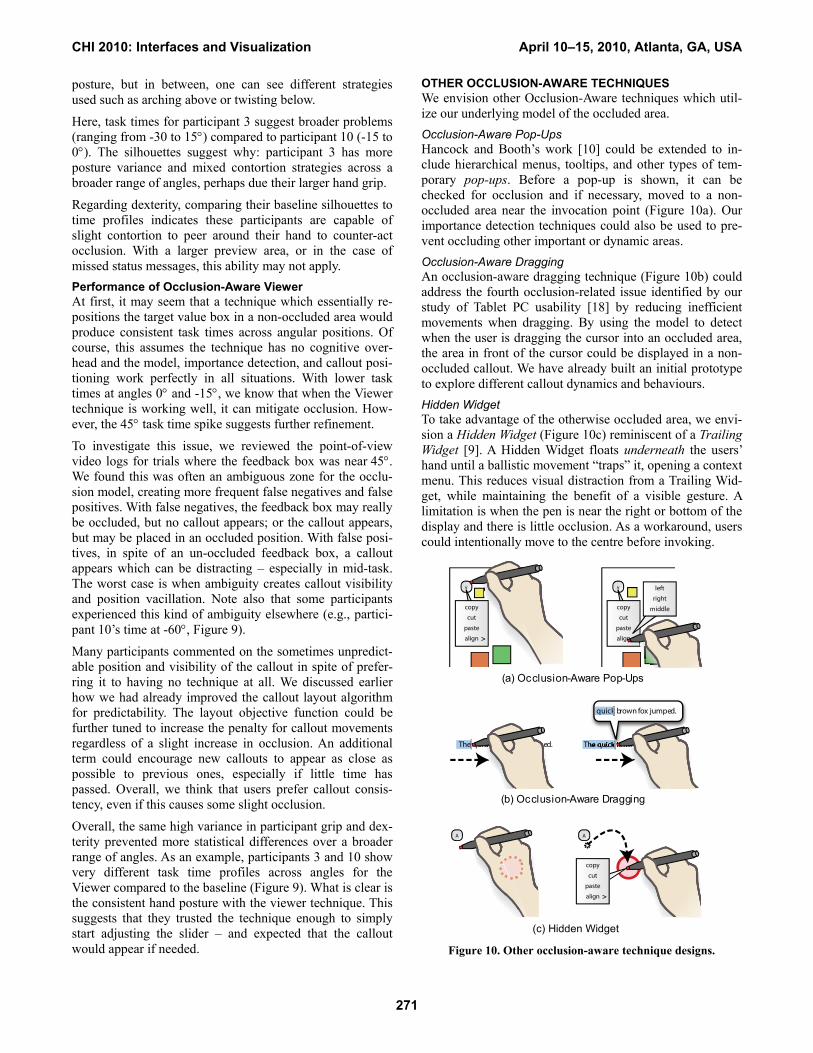
OTHER OCCLUSION-AWARE TECHNIQUES We envision other Occlusion-Aware techniques which util-ize our underlying model of the occluded area. Occlusion-Aware Pop-Ups Hancock and Booth’s work [10] could be extended to in-clude hierarchical menus, tooltips, and other types of tem-porary pop-ups. Before a pop-up is shown, it can be checked for occlusion and if necessary, moved to a non-occluded area near the invocation point (Figure 10a). Our importance detection techniques could also be used to pre-vent occluding other important or dynamic areas. Occlusion-Aware Dragging An occlusion-aware dragging technique (Figure 10b) could address the fourth occlusion-related issue identified by our study of Tablet PC usability [18] by reducing inefficient movements when dragging. By using the model to detect when the user is dragging the cursor into an occluded area, the area in front of the cursor could be displayed in a non-occluded callout. We have already built an initial prototype to explore different callout dynamics and behaviours. Hidden Widget To take advantage of the otherwise occluded area, we envi-sion a Hidden Widget (Figure 10c) reminiscent of a Trailing Widget [9]. A Hidden Widget floats underneath the users’ hand until a ballistic movement “traps” it, opening a context menu. This reduces visual distraction from a Trailing Wid-get, while maintaining the benefit of a visible gesture. A limitation is when the pen is near the right or bottom of the display and there is little occlusion. As a workaround, users could intentionally move to the centre before invoking.
Figure 10. Other occlusion-aware technique designs.
(a) Occlusion-Aware Pop-Ups
(b) Occlusion-Aware Dragging
(c) Hidden Widget
The quick brown fox jumped.The quick brown fox jumped.
quick brown fox jumped.
A A
copy
cut
paste
align >
v
copy
cut
paste
align >
v
copy
cut
paste
align >
left
right
middle
CHI 2010: Interfaces and Visualization April 10–15, 2010, Atlanta, GA, USA
271
CONCLUSION AND FUTURE WORK While previous researchers have considered occlusion in designs, and even incorporated simple rules-of-thumb to compensate for menu placement, our configurable model, user interface image processing technique for change detec-tion, simple callout layout, and experimental results demon-strate that a broader class of occlusion-aware interface techniques are plausible.
Our motivation for creating a configurable geometric model is to avoid specialized technical requirements; however, this model could also be utilized for palm-touch filtering with multi-touch displays, or assist in hand posture recognition. Extending the model to work with touch screens, different display sizes, or different orientations, remains to be inves-tigated. Our feeling is that the spirit of the configuration process can be maintained, but with additional parameters and real-time calculations refined.
We show that using image processing for real time interface analysis is feasible, but not without issues. Whether these can be eliminated entirely, or what is acceptable to users, remain to be seen. The inclusion of more layers, such as simple texture-analysis and object recognition, would create an even better estimate of what is important.
As future work, we see improvements for the Occlusion-Aware Viewer technique such as multiple simultaneous callouts (though this may be somewhat distracting) and refinements to algorithms for callout visibility and location with an emphasis on stability and consistency. Mnemonic Rending could also be used when the occluded area is not a real time preview, such as system alerts. Finally, this work needs to be evaluated in a more ecologically valid context with more open-ended tasks.
ACKNOWLEDGEMENTS Matthew Cudmore, Géry Casiez, and Liam Keliher. REFERENCES 1. Accot, J. and Zhai, S. More than dotting the i's --- foun-
dations for crossing-based interfaces. In Proc. CHI, ACM (2002), 73-80.
2. Apitz, G. and Guimbretière, F. CrossY: a crossing-based drawing application. In Proc. UIST, ACM (2004), 3-12.
3. Benko, H., Wilson, A.D., and Baudisch, P. Precise selec-tion techniques for multi-touch screens. In Proc. CHI, ACM (2006), 1263-1272.
4. Bezerianos, A., Dragicevic, P., and Balakrishnan, R. Mnemonic rendering: an image-based approach for ex-posing hidden changes in dynamic displays. In Proc.UIST, ACM (2006), 159-168.
5. Brandl, P., Leitner, J., Seifried, T., Haller, M., Doray, B., and To, P. Occlusion-aware menu design for digital ta-bletops. Ext. Abstracts CHI, ACM (2009), 3223-3228.
6. Cotting, D. and Gross, M. Interactive environment-aware display bubbles. In Proc. UIST, ACM (2006), 245-254.
7. Echtler, F., Huber, M., and Klinker, G. Shadow tracking on multi-touch tables. In Proc. Advanced visual inter-faces, ACM (2008), 388-391.
8. Forlines, C. and Balakrishnan, R. Evaluating tactile feedback and direct vs. indirect stylus input in pointing and crossing selection tasks. In Proc. CHI, ACM (2008), 1563-1572.
9. Forlines, C., Vogel, D., and Balakrishnan, R. Hybrid-Pointing: fluid switching between absolute and relative pointing with a direct input device. In Proc. UIST, ACM (2006), 211-220.
10. Hancock, M.S. and Booth, K.S. Improving menu place-ment strategies for pen input. In Proc. Graphics Inter-face, (2004), 221-230.
11. Inkpen, K., Dearman, D., Argue, R., et al. Left-Handed Scrolling for Pen-Based Devices. International Journal of Human-Computer Interaction 21, 1 (2006), 91-108.
12. Ishak, E.W. and Feiner, S.K. Interacting with hidden content using content-aware free-space transparency. In Proc. UIST, ACM (2004), 189-192.
13. Meyer, A. Pen computing: a technology overview and a vision. SIGCHI Bull 27, 3 (1995), 46-90.
14. Pheasant, S. and Hastlegrave, C. Bodyspace: Anthro-pometry, Ergonomics and the Design of the Work. CRC, 2006.
15. Ramos, G. and Balakrishnan, R. Fluid interaction tech-niques for the control and annotation of digital video. In Proc. UIST, ACM (2003), 105-114.
16. Schilit, B.N., Golovchinsky, G., and Price, M.N. Beyond paper: supporting active reading with free form digital ink annotations. In Proc. CHI, ACM (1998), 249-256.
17. Shen, C., Hancock, M.S., Forlines, C., and Vernier, F.D. CoR2Ds. Ext. Abstracts CHI, ACM (2005), 1781-1784.
18. Vogel, D. and Balakrishnan, R. Direct Pen Interaction with a Conventional Graphical User Interface. Human-Computer Interaction, (forthcoming).
19. Vogel, D. and Balakrishnan, R. Distant freehand point-ing and clicking on very large, high resolution displays. In Proc. UIST, ACM (2005), 33-42.
20. Vogel, D. and Baudisch, P. Shift: a technique for operat-ing pen-based interfaces using touch. In Proc. CHI, ACM (2007), 657-666.
21. Vogel, D., Cudmore, M., Casiez, G., Balakrishnan, R., and Keliher, L. Hand Occlusion with Tablet-sized Direct Pen Input. In Proc. CHI, ACM (2009), 557-566.
22. Zeleznik, R. and Miller, T. Fluid inking: augmenting the medium of free-form inking with gestures. In Proc. Graphics Interface, (2006), 155-162.
CHI 2010: Interfaces and Visualization April 10–15, 2010, Atlanta, GA, USA
272