Embed Size (px)
Citation preview
Observed variability of hydrography and
transport at 53°N in the Labrador Sea
Johannes Karstensen GEOMAR Helmholtz Centre for Ocean Research Kiel
With input from: Jürgen Fischer, Rainer Zantopp, Robert Kopte, Sebastian Milinski, Sunke Schmidtko
CT 2: Monitoring of North Atlantic Parameters
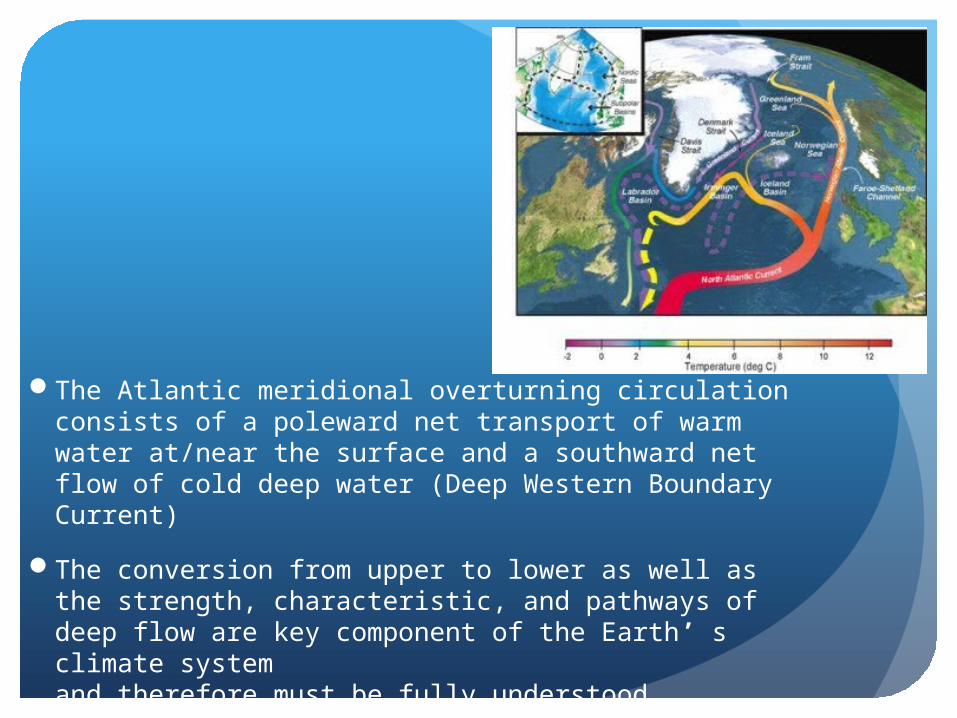
The Atlantic meridional overturning circulation consists of a poleward net transport of warm water at/near the surface and a southward net flow of cold deep water (Deep Western Boundary Current)
The conversion from upper to lower as well as the strength, characteristic, and pathways of deep flow are key component of the Earth’ s climate system and therefore must be fully understood
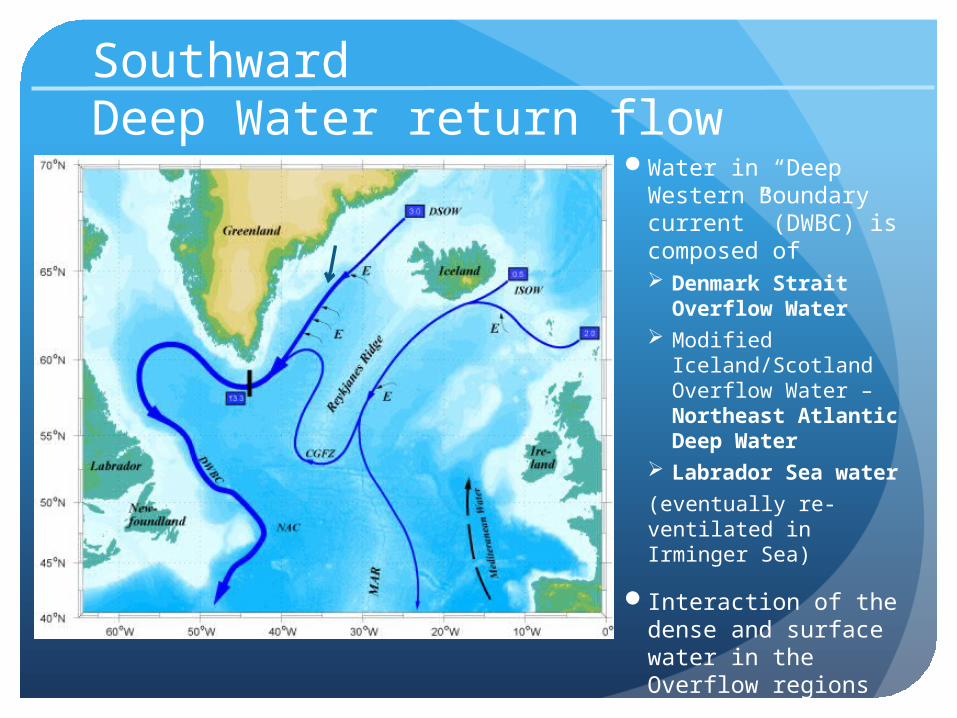
Southward Deep Water return flow
Water in “Deep Western Boundary current” (DWBC) is composed of Denmark Strait
Overflow Water Modified
Iceland/Scotland Overflow Water – Northeast Atlantic Deep Water
Labrador Sea water
(eventually re-ventilated in Irminger Sea)
Interaction of the dense and surface water in the Overflow regions
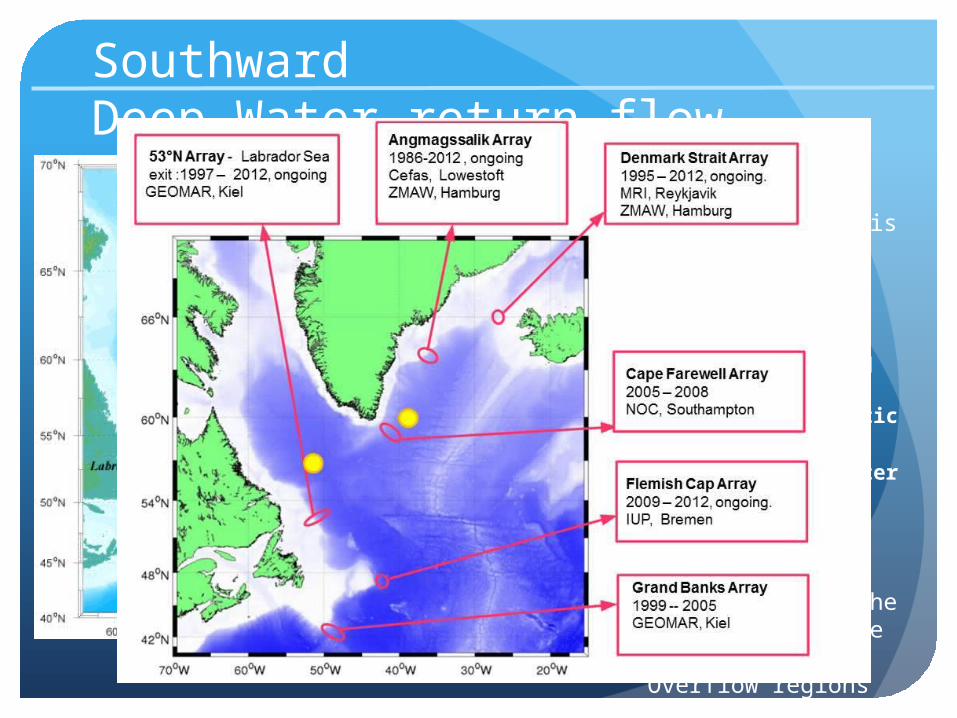
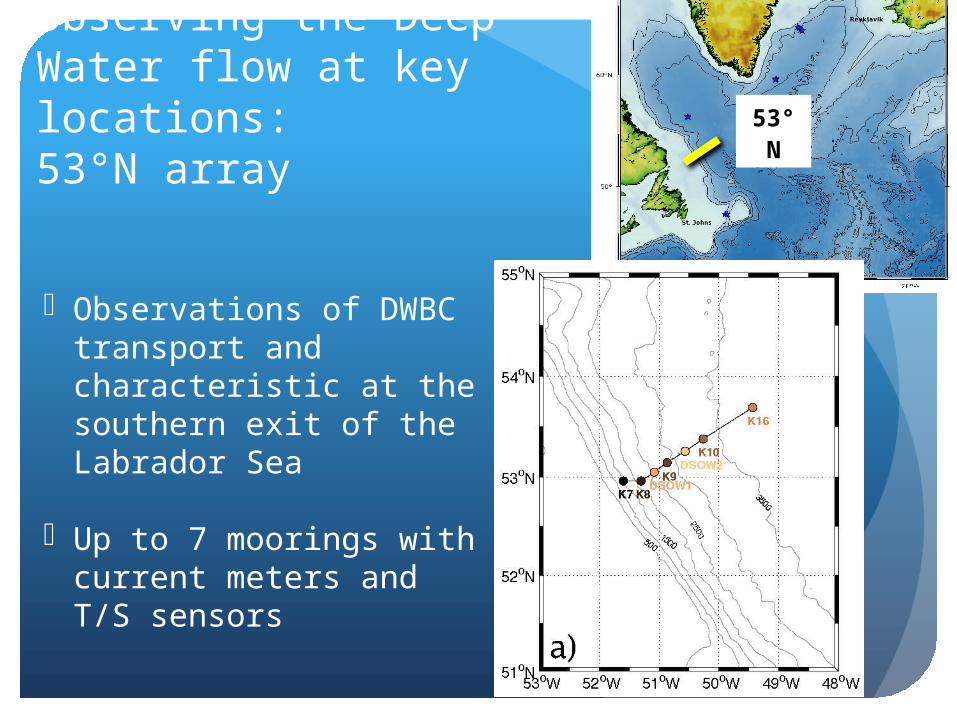
Observing the Deep Water flow at key locations: 53°N array
• Observations of DWBC transport and characteristic at the southern exit of the Labrador Sea
• Up to 7 moorings with current meters and T/S sensors
53°N
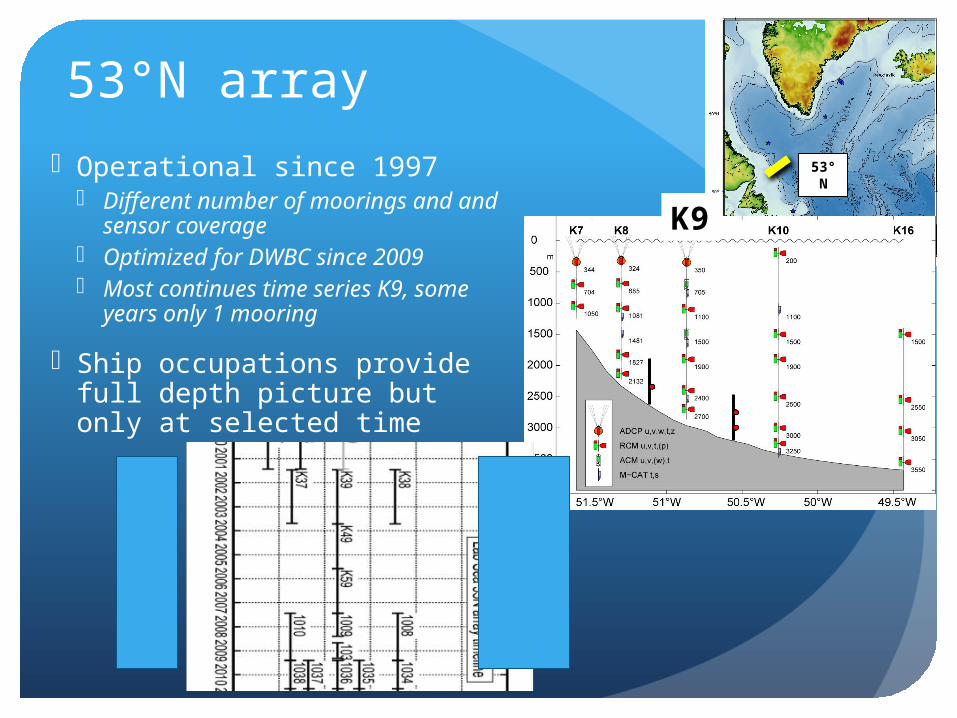
53°N array
• Operational since 1997 • Different number of moorings and
and sensor coverage• Optimized for DWBC since 2009• Most continues time series K9,
some years only 1 mooring
• Ship occupations provide full depth picture but only at selected time
53°N
K9
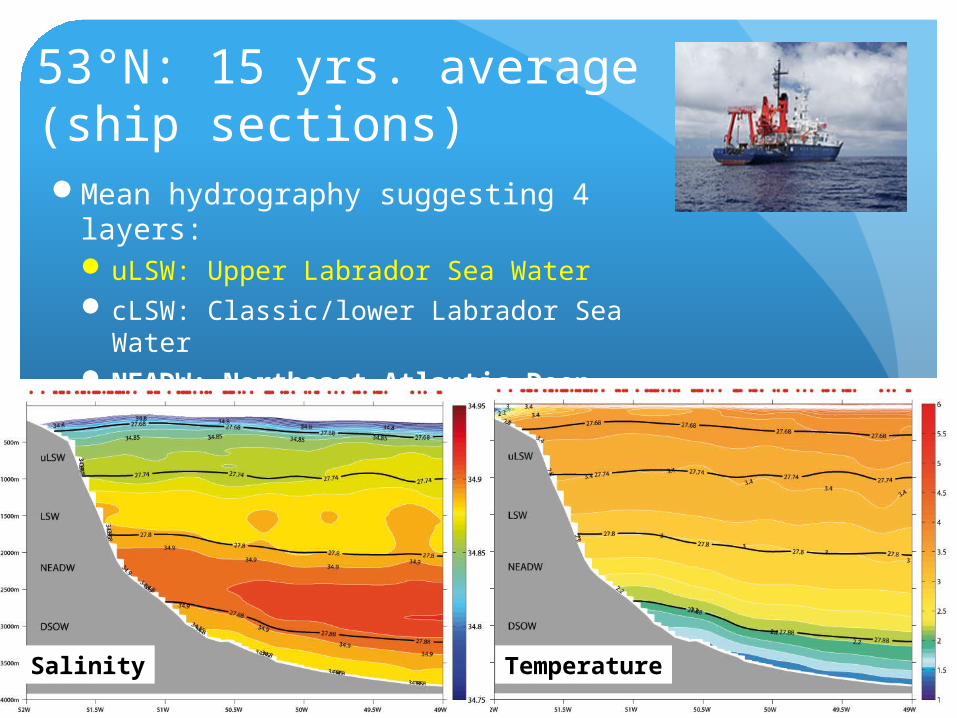
53°N: 15 yrs. average(ship sections) Mean hydrography suggesting 4
layers:uLSW: Upper Labrador Sea WatercLSW: Classic/lower Labrador Sea
Water NEADW: Northeast Atlantic Deep
WaterDSOW: Denmark Strait Overflow Water
Salinity Temperature
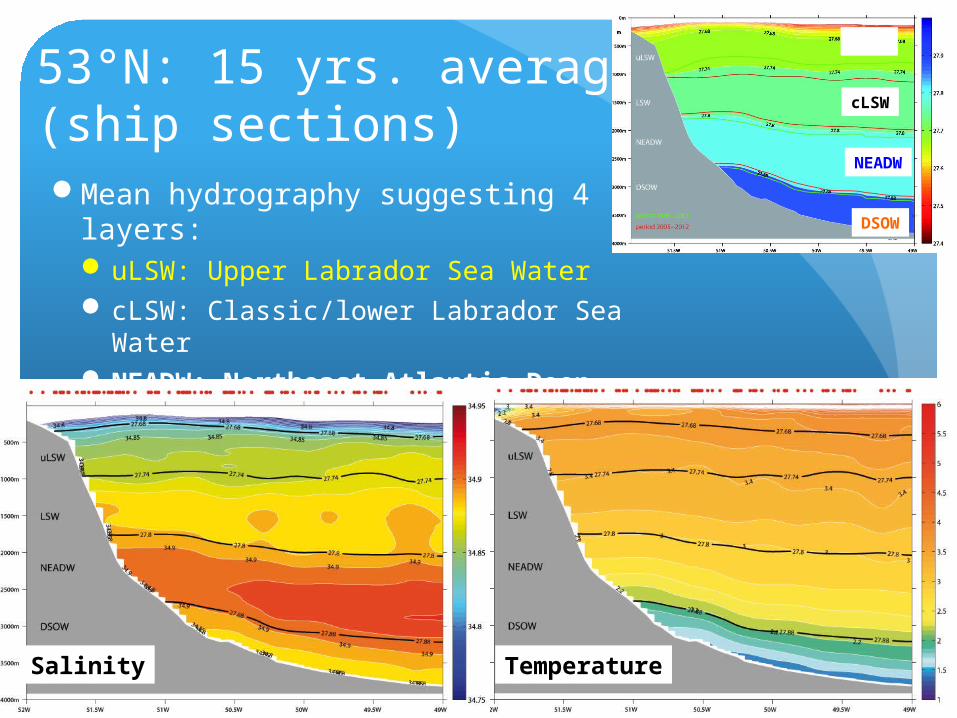
53°N: 15 yrs. average(ship sections) Mean hydrography suggesting 4
layers:uLSW: Upper Labrador Sea WatercLSW: Classic/lower Labrador Sea
Water NEADW: Northeast Atlantic Deep
WaterDSOW: Denmark Strait Overflow Water
Salinity Temperature
DSOW
NEADW
cLSW
uLSW
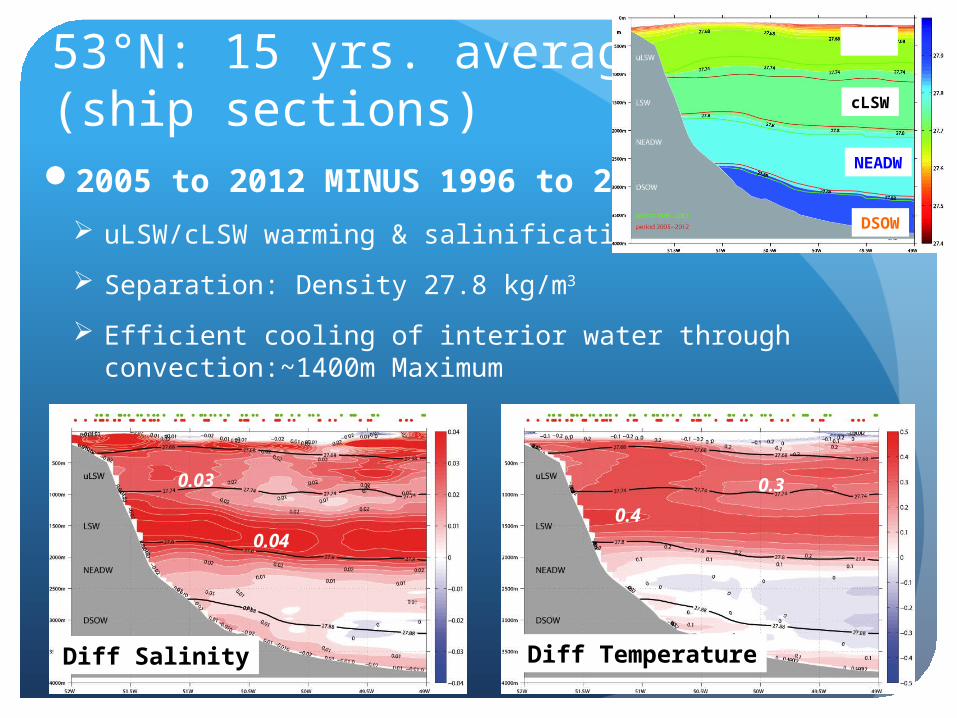
53°N: 15 yrs. average(ship sections) 2005 to 2012 MINUS 1996 to 2003
uLSW/cLSW warming & salinification
Separation: Density 27.8 kg/m3
Efficient cooling of interior water through convection:~1400m Maximum
DSOW
NEADW
cLSW
uLSW
Diff Temperature
0.4
0.3
Diff Salinity
0.04
0.03
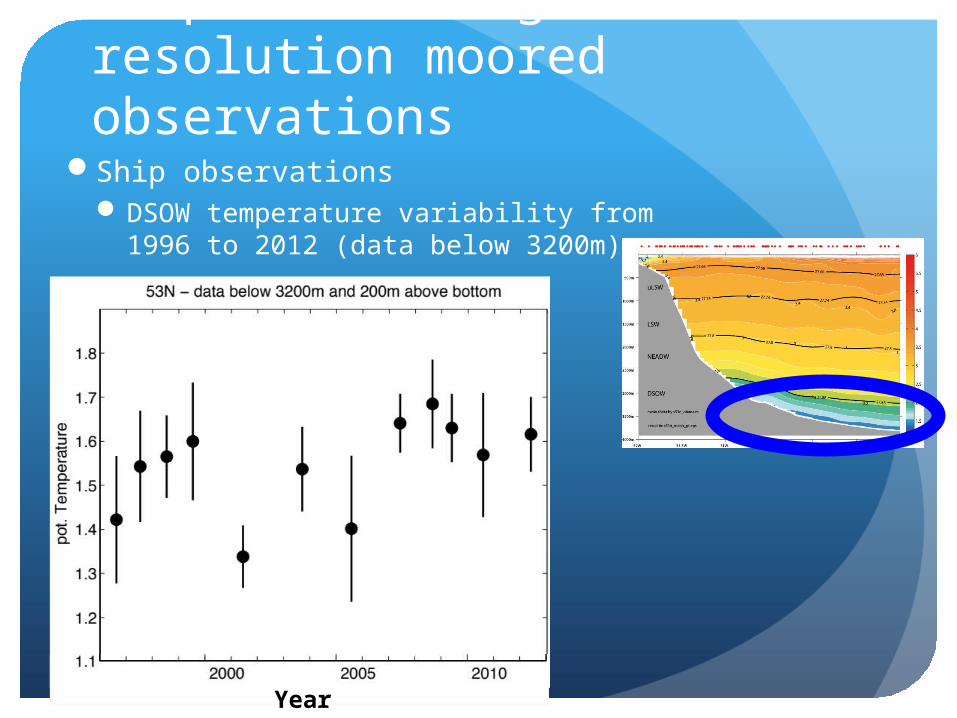
Ship versus high resolution moored observations
Ship observationsDSOW temperature variability from
1996 to 2012 (data below 3200m)
Year
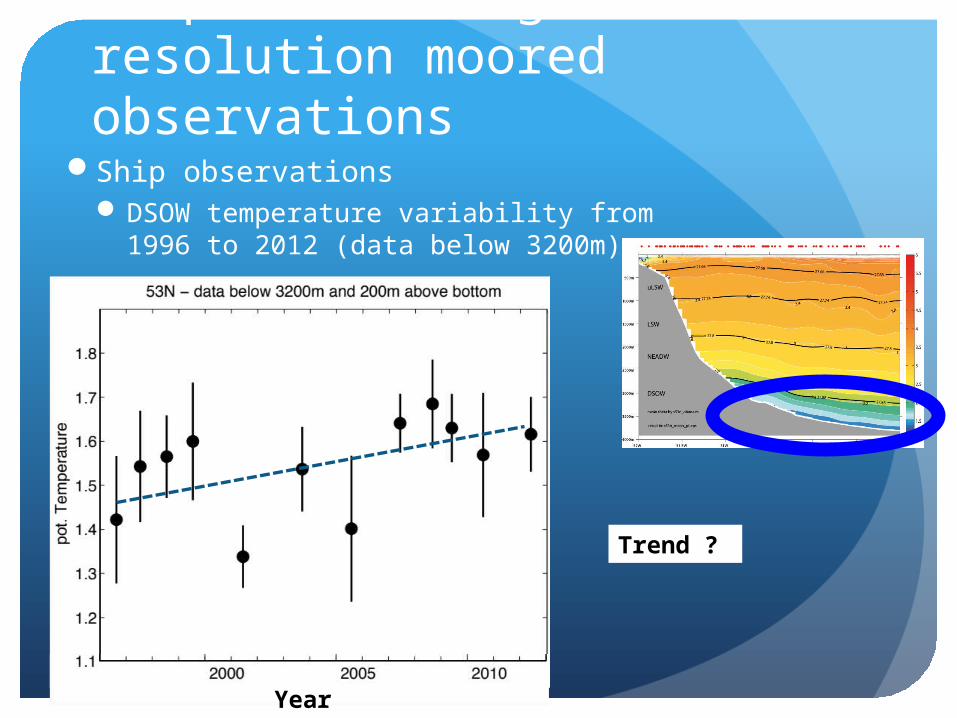
Ship versus high resolution moored observations
Trend ?
Ship observationsDSOW temperature variability from
1996 to 2012 (data below 3200m)
Year
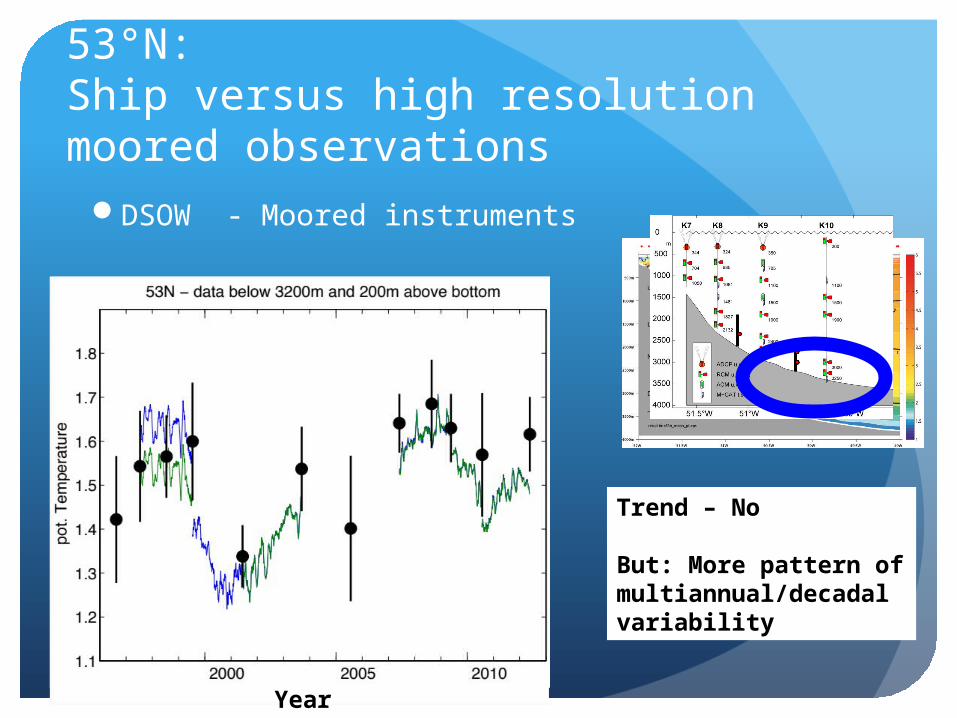
53°N:Ship versus high resolution moored observations
DSOW - Moored instruments
Trend – No
But: More pattern of multiannual/decadal variability
Year
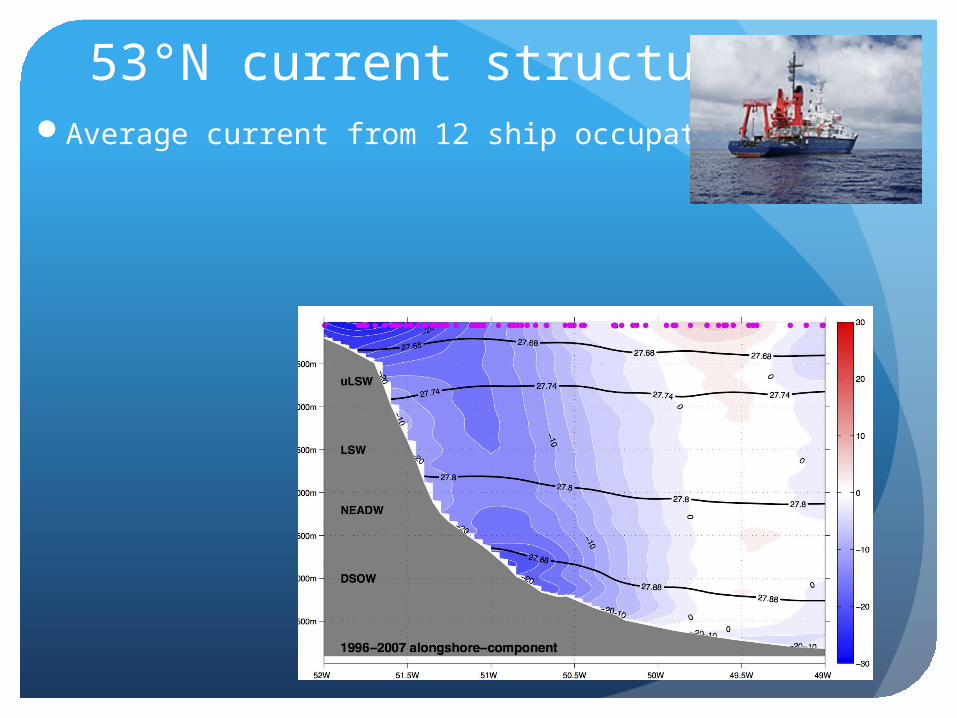
53°N current structureAverage current from 12 ship occupations
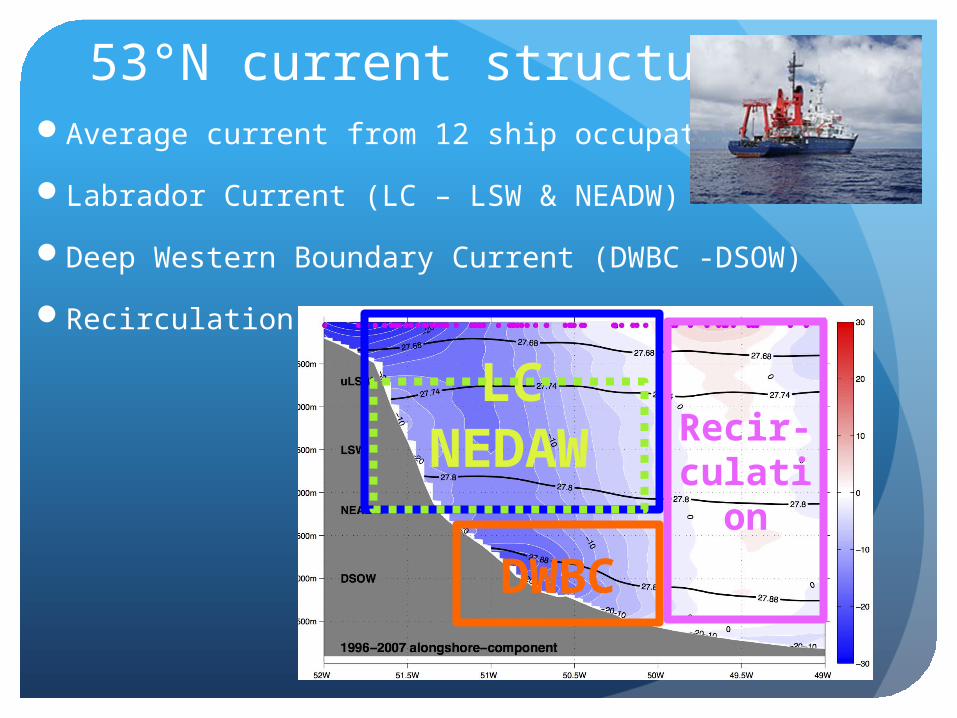
53°N current structureAverage current from 12 ship occupations
Labrador Current (LC – LSW & NEADW)
Deep Western Boundary Current (DWBC -DSOW)
Recirculation
LC
DWBC
Recir-culati
on
NEDAW
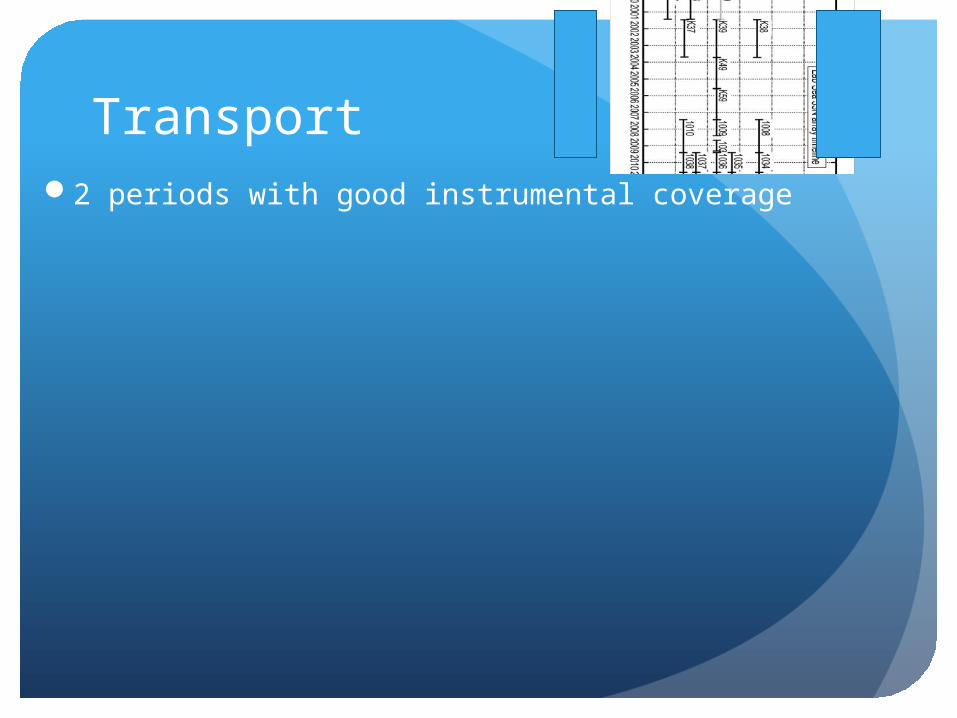
Transport2 periods with good instrumental coverage
Transport2 periods with good instrumental coverage
Strong transport variability in water mass classes, but:
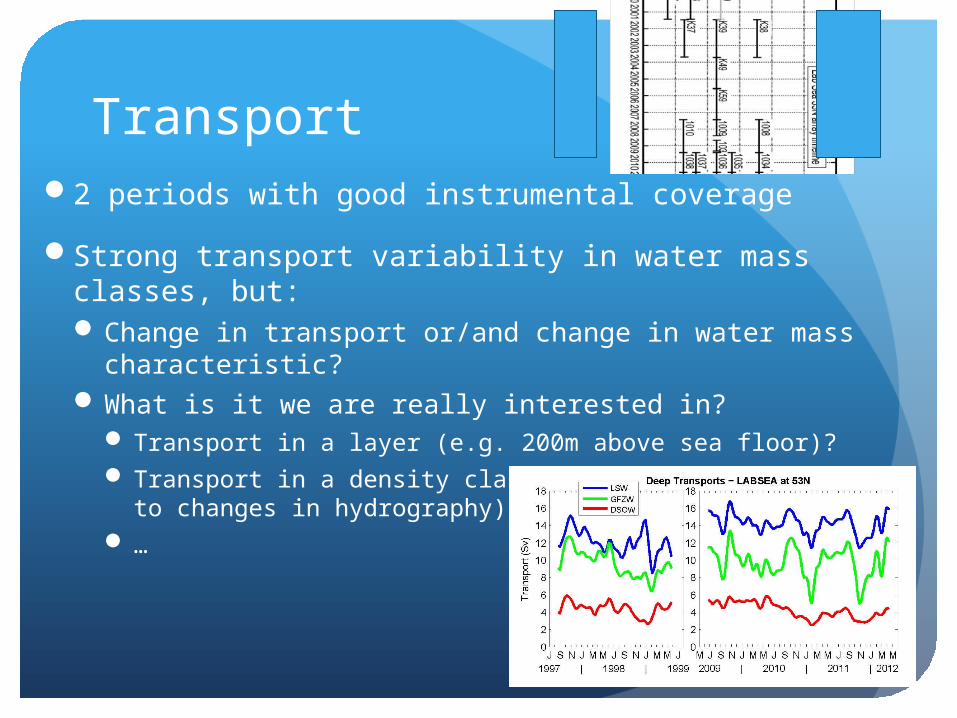
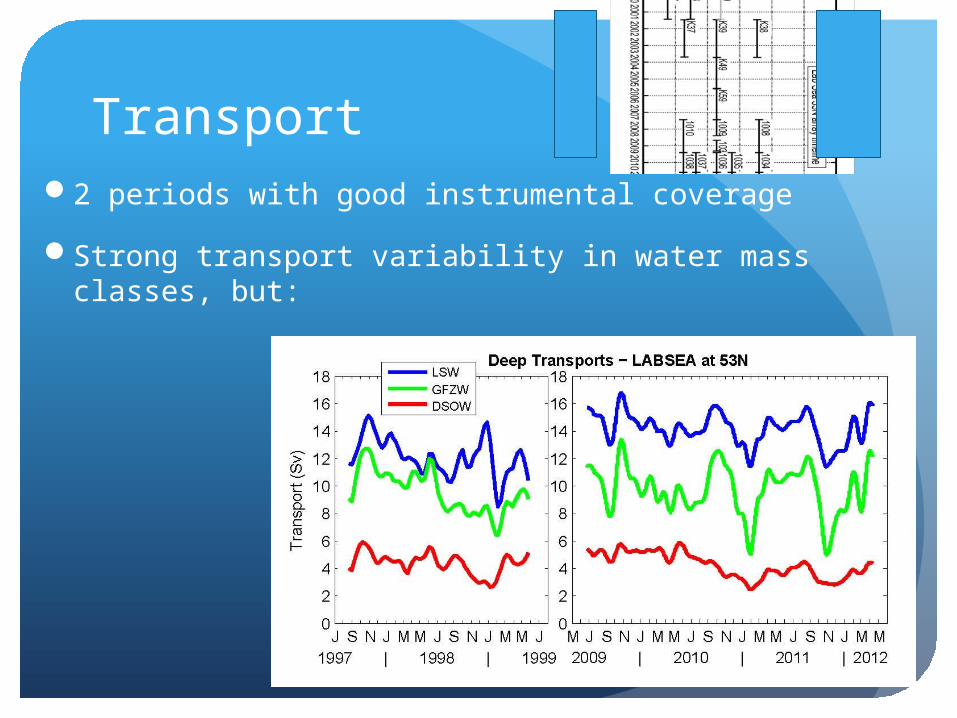
Transport2 periods with good instrumental coverage
Strong transport variability in water mass classes, but:Change in transport or/and change in water mass
characteristic?What is it we are really interested in?
Transport in a layer (e.g. 200m above sea floor)? Transport in a density class (that may change due to
changes in hydrography)? …
General question:What do we want to compare?
“Pattern match” hydrography? (implications for heat/freshwater fluxes)
Spectra of variability
Warming/cooling/freshening/… trends?
Integrated transport? In density classes? Depth ranges?
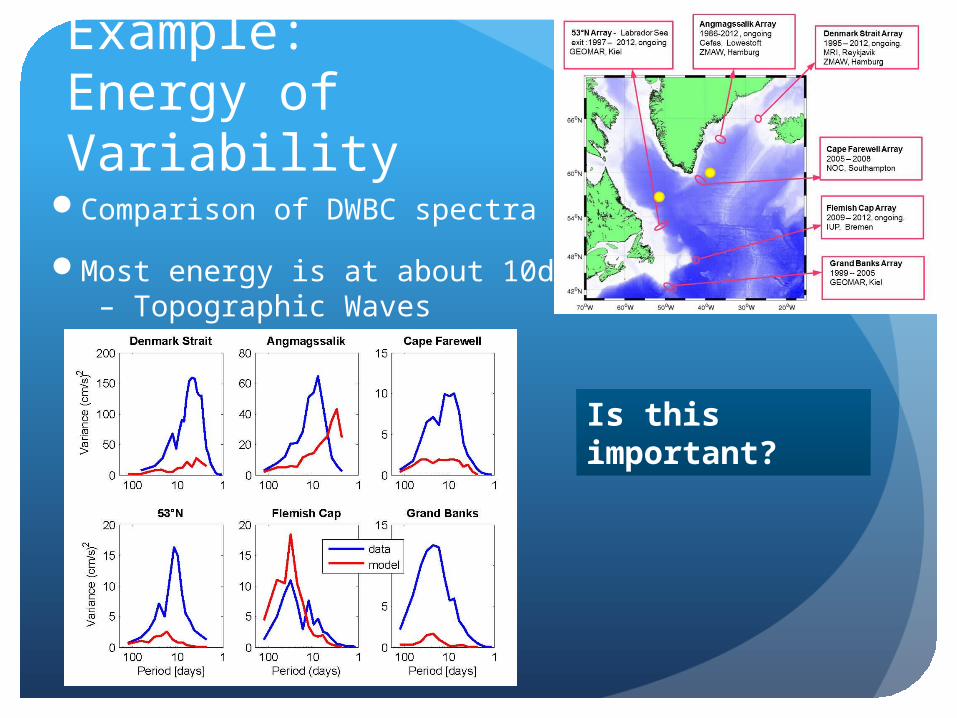
Example: Energy of Variability
Comparison of DWBC spectra
Most energy is at about 10days – Topographic Waves
Is this important?
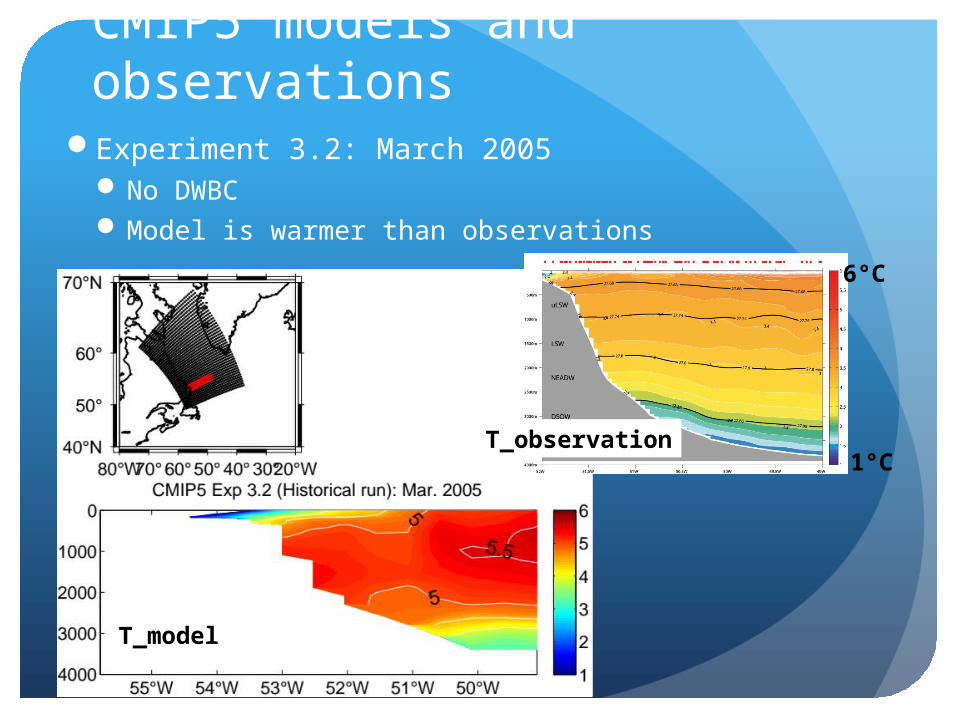
CMIP5 models and observations
Experiment 3.2: March 2005No DWBCModel is warmer than observations
6°C
1°CT_observation
T_model
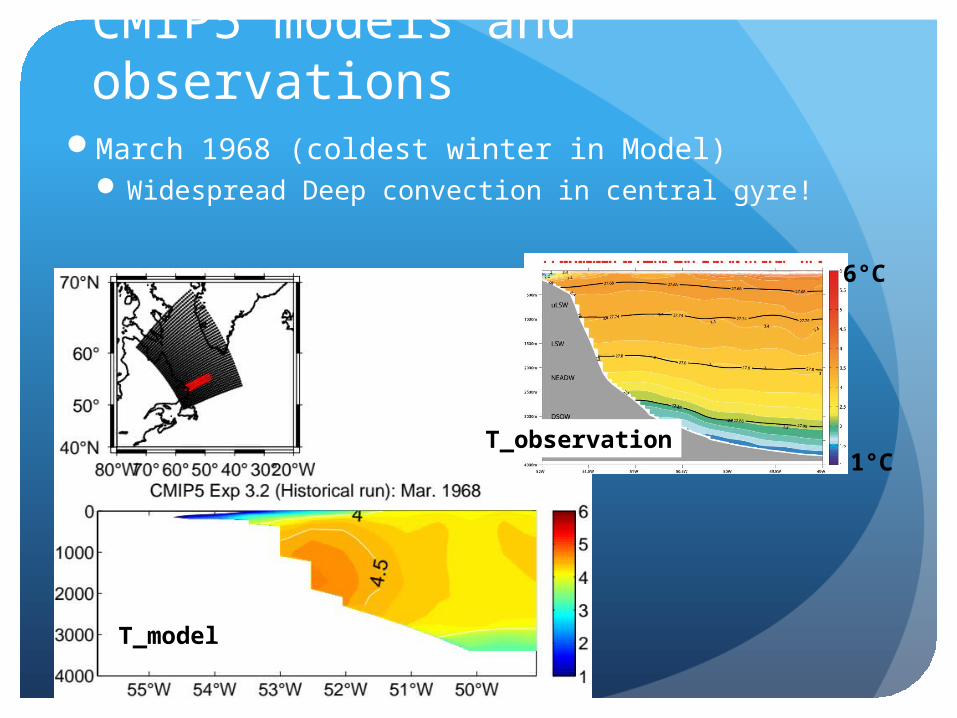
CMIP5 models and observations
March 1968 (coldest winter in Model)Widespread Deep convection in central gyre!
6°C
1°CT_observation
T_model
Summary• Moored instrumentation provide data that important for long
term monitoring as well as for process studies
• Deep Western Boundary Current variability is most intense in the core of the deep flow - with periods in the range of weeks rather than months - It is unclear if the variability has any consequences for the correct representation of the interior ocean in models - or if it is just wave like motion…
• First “pattern match” analysis of a CMIP5 model with 53°N array is encouraging – but model miss many “details” (model is too warm, no DWBC, …)
• Further discussion on suitable indices for “observation/model comparison” is required
The research leading to these results has received funding from the European Union 7th Framework Programme (FP7 2007-2013), under grant agreement n.308299
NACLIM www.naclim.eu