Embed Size (px)
Citation preview
Obesity Medicine Epidemiology & Pathophysiology
Treatment Options – Efficacy & Safety Benefits of Weight Loss Therapy
Maria Collazo-Clavell, MD W. Timothy Garvey, MD, PhD (moderator) Daniel L. Hurley, MD
Endocrine University at Mayo Clinic, Rochester, MN 24 March 2015
OBESITY MEDICINE: EPIDEMIOLOGY & PATHOPHYSIOLOGY
Dr. Maria Collazo-Clavell
Learning Objectives
• Understand public health burden and social costs of obesity
• Understand the pathophysiology that protects body weight against weight loss
• Understand the interactions among weight gain, insulin resistance, adipose distribution and inflammation and cardiovascular disease
• Understand why obesity is a disease
Prevalence of Self-Reported Obesity Among
U.S. Adults by State and Territory
Definitions
Obesity: Body Mass Index (BMI) of 30 or higher.
Body Mass Index (BMI): A measure of an adult’s weight in relation to his or her height, calculated by using the adult’s weight in kilograms divided by the square of his or her height in meters.
Prevalence of Self-Reported Obesity Among
U.S. Adults by State and Territory
Source of the Data
The data were collected through the Behavioral Risk Factor Surveillance System (BRFSS), an ongoing, state-based, telephone interview survey conducted by state health departments with assistance from CDC.
Height and weight data used in the BMI calculations were self-reported.
Prevalence of Self-Reported Obesity Among
U.S. Adults by State and Territory
BRFSS Methodological Changes Started in 2011
New sampling frame that included both landline and cell phone households.
New weighting methodology used to provide a closer match between the sample and the population.
Prevalence of Self-Reported Obesity Among U.S. Adults by State and Territory
Exclusion Criteria Used Beginning with 2011 BRFSS Data
Records with the following were excluded:
Height: <3 feet or ≥8 feet
Weight: <50 pounds or ≥650 pounds
BMI: <12 kg/m2 or ≥100 kg/m2
Pregnant women
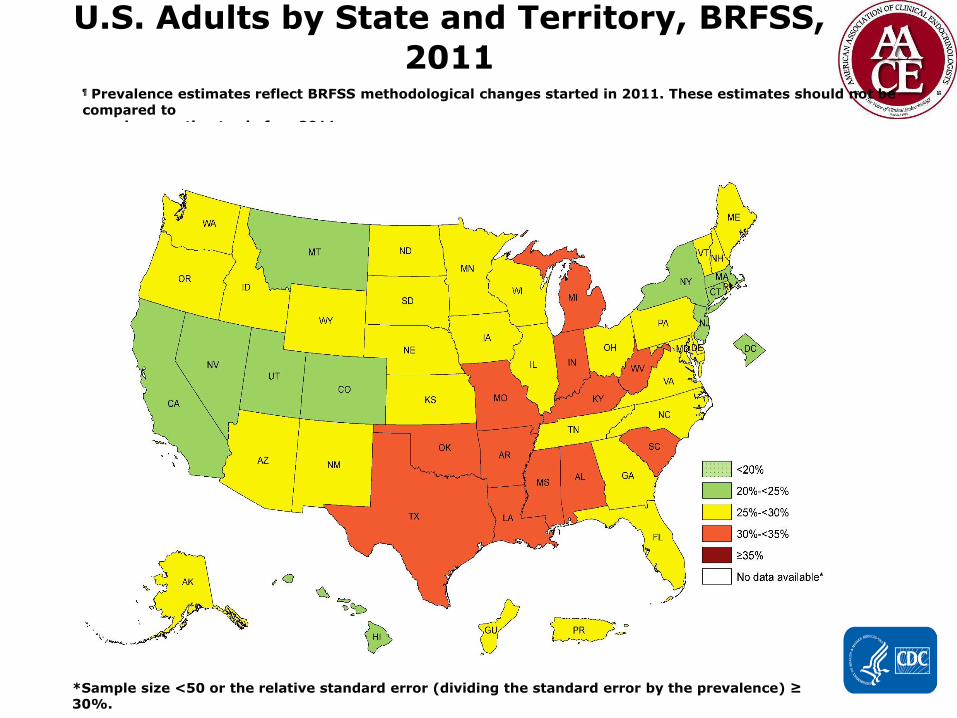
Prevalence¶ of Self-Reported Obesity Among
U.S. Adults by State and Territory, BRFSS,
2011
¶ Prevalence estimates reflect BRFSS methodological changes started in 2011. These estimates should not be
compared to prevalence estimates before 2011.
*Sample size <50 or the relative standard error (dividing the standard error by the prevalence) ≥ 30%.

Prevalence¶ of Self-Reported Obesity Among
U.S. Adults by State and Territory, BRFSS,
2014
¶ Prevalence estimates reflect BRFSS methodological changes started in 2011. These estimates should not be
compared to prevalence estimates before 2011.
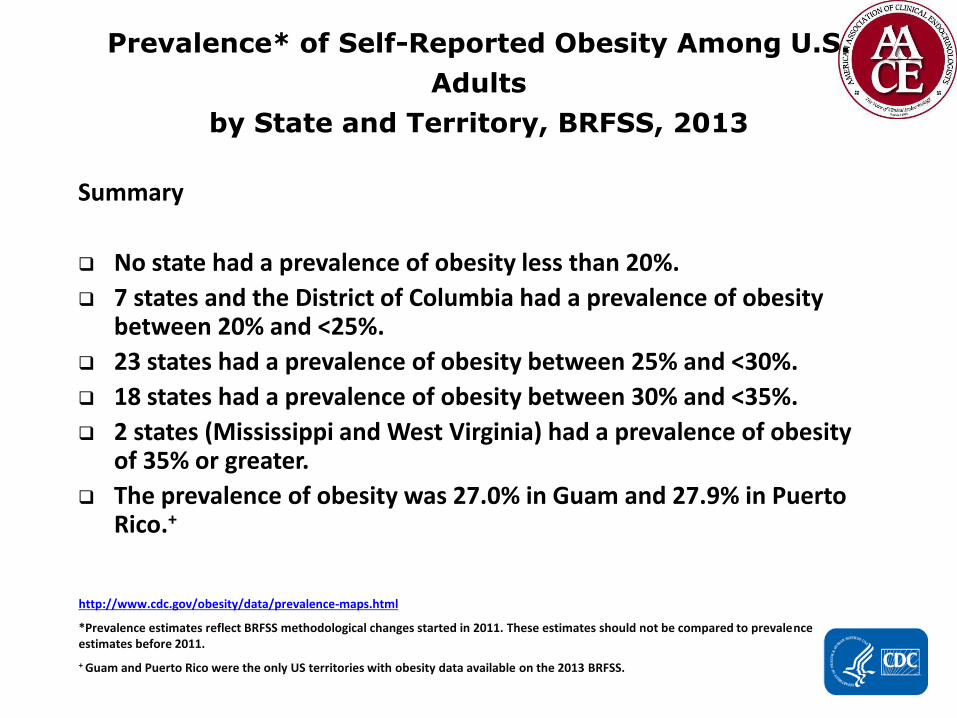
Prevalence* of Self-Reported Obesity Among U.S.
Adults
by State and Territory, BRFSS, 2013 Summary
No state had a prevalence of obesity less than 20%.
7 states and the District of Columbia had a prevalence of obesity between 20% and <25%.
23 states had a prevalence of obesity between 25% and <30%.
18 states had a prevalence of obesity between 30% and <35%.
2 states (Mississippi and West Virginia) had a prevalence of obesity of 35% or greater.
The prevalence of obesity was 27.0% in Guam and 27.9% in Puerto Rico.+
http://www.cdc.gov/obesity/data/prevalence-maps.html
*Prevalence estimates reflect BRFSS methodological changes started in 2011. These estimates should not be compared to prevalence estimates before 2011.
+ Guam and Puerto Rico were the only US territories with obesity data available on the 2013 BRFSS.
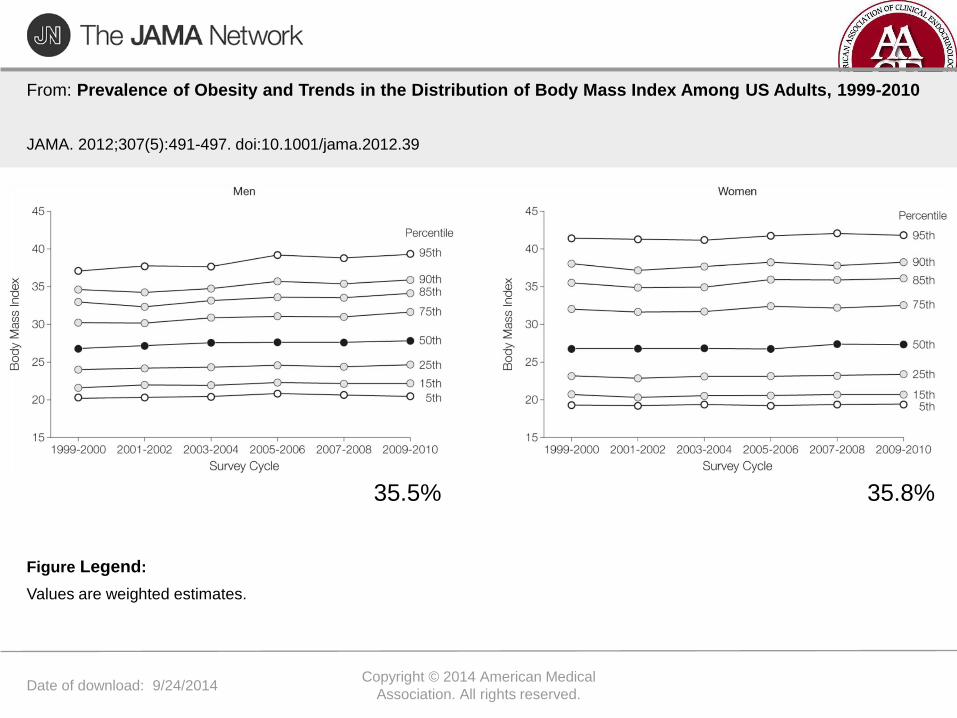
Date of download: 9/24/2014 Copyright © 2014 American Medical
Association. All rights reserved.
From: Prevalence of Obesity and Trends in the Distribution of Body Mass Index Among US Adults, 1999-2010
JAMA. 2012;307(5):491-497. doi:10.1001/jama.2012.39
Values are weighted estimates.
Figure Legend:
35.5% 35.8%

Date of download: 9/24/2014 Copyright © 2014 American Medical
Association. All rights reserved.
From: Prevalence of Obesity and Trends in the Distribution of Body Mass Index Among US Adults, 1999-2010
JAMA. 2012;307(5):491-497. doi:10.1001/jama.2012.39
Figure Legend:
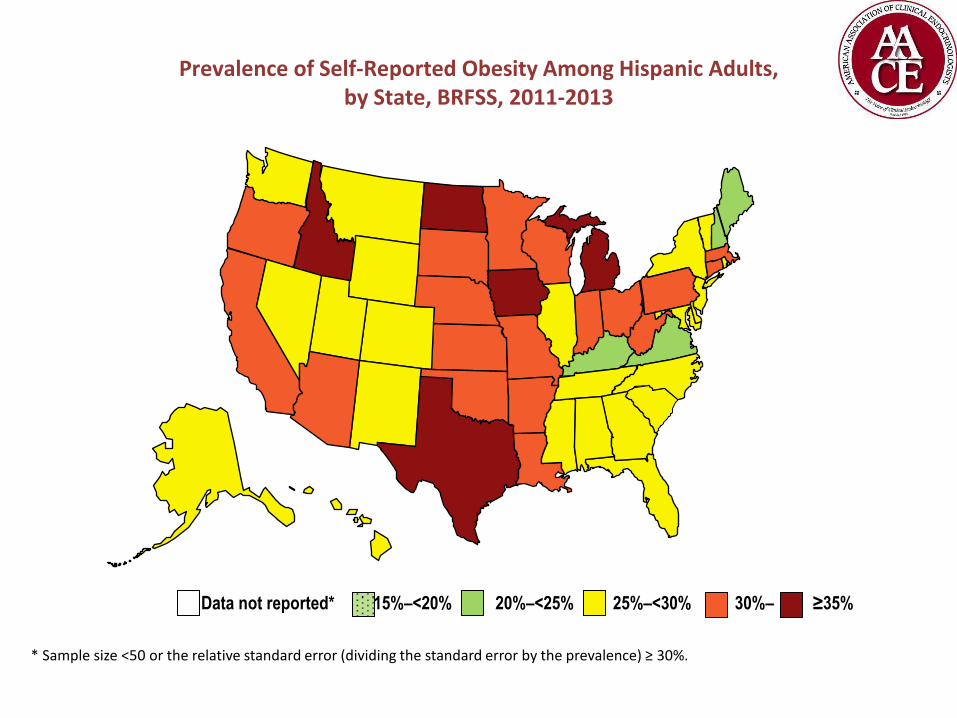
Prevalence of Self-Reported Obesity Among Hispanic Adults, by State, BRFSS, 2011-2013
Data not reported* 15%–<20% 20%–<25% 25%–<30% 30%– ≥35%
* Sample size <50 or the relative standard error (dividing the standard error by the prevalence) ≥ 30%.
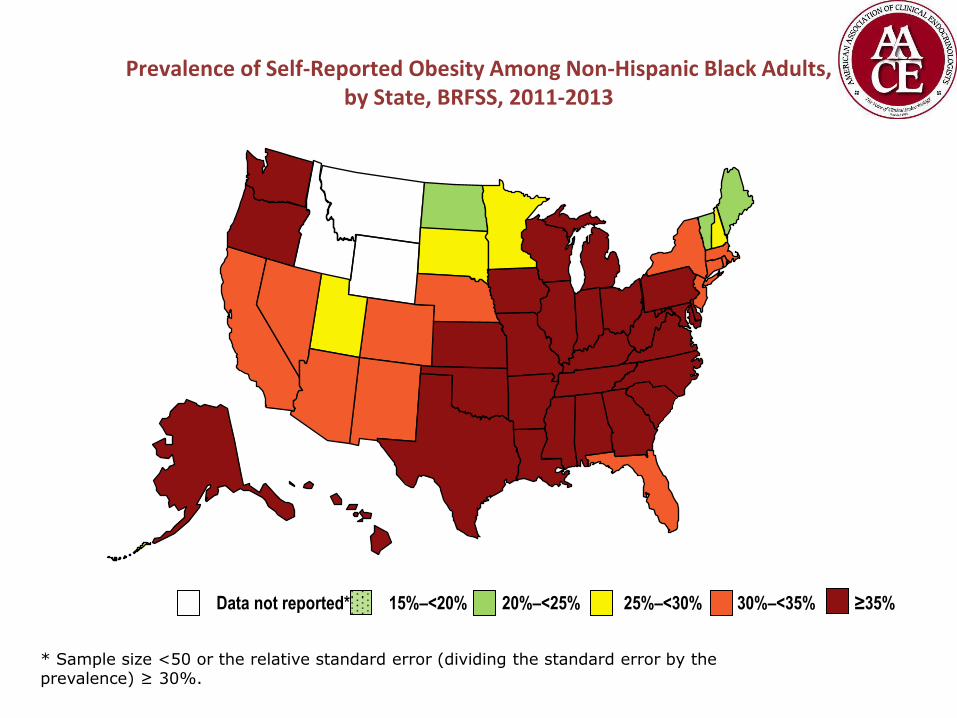
Prevalence of Self-Reported Obesity Among Non-Hispanic Black Adults, by State, BRFSS, 2011-2013
Data not reported* 15%–<20% 20%–<25% 25%–<30% 30%–<35% ≥35%
* Sample size <50 or the relative standard error (dividing the standard error by the prevalence) ≥ 30%.
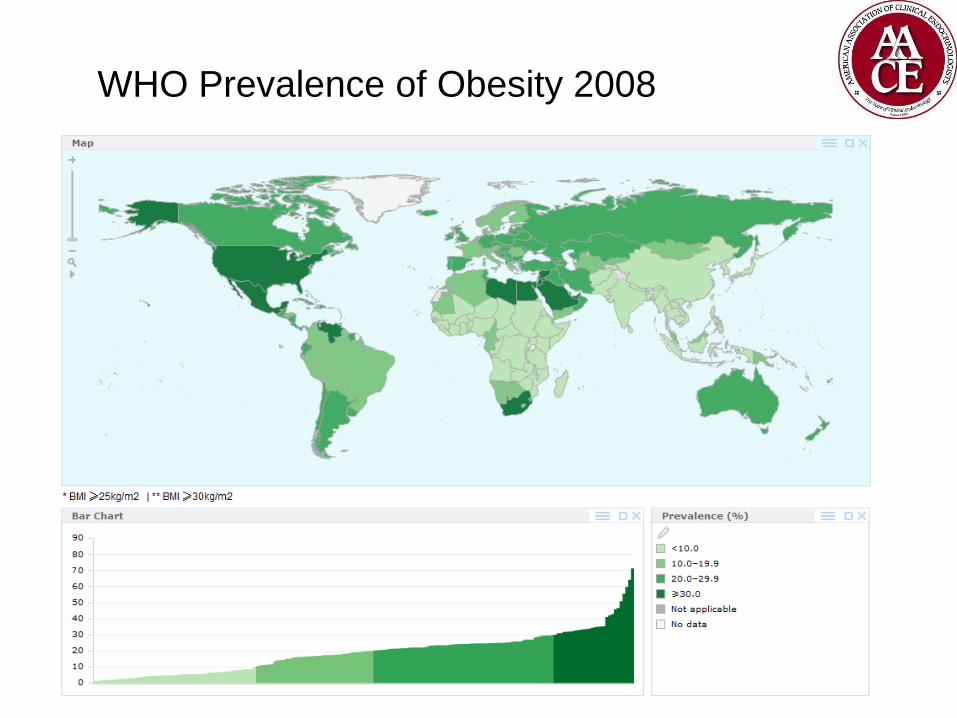
WHO Prevalence of Obesity 2008
COST OF OBESITY
Obesity Medicine
Epidemiology & Pathophysiology
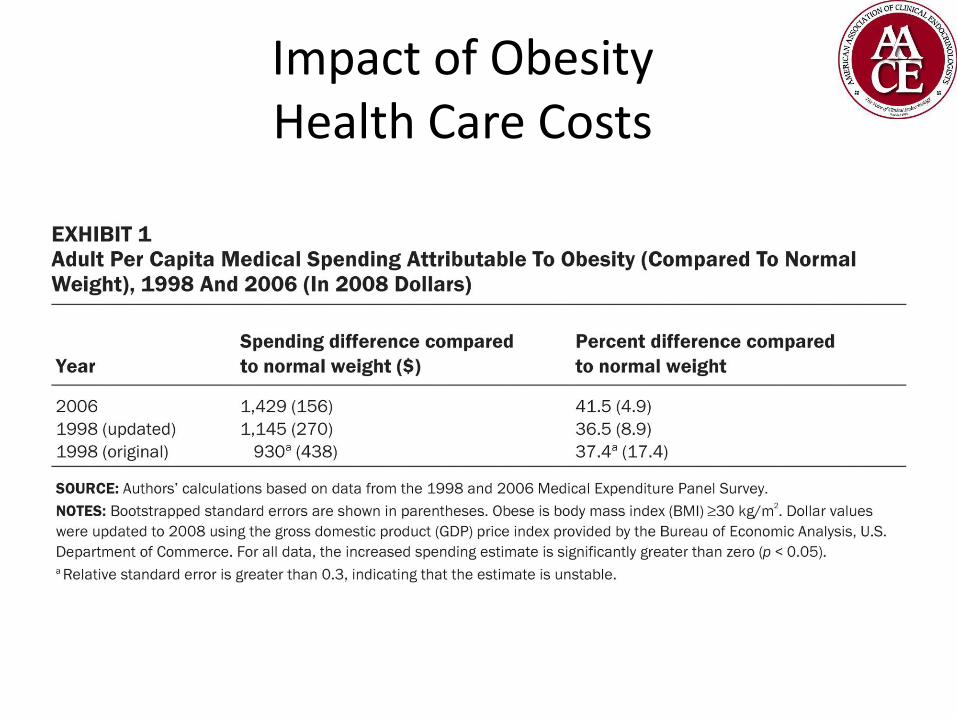
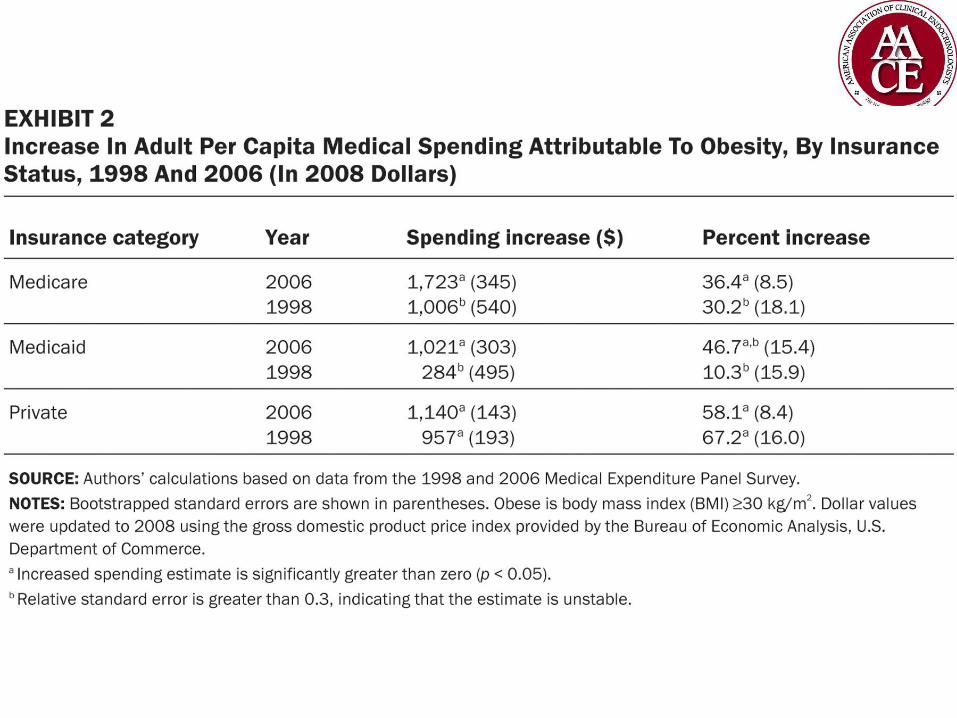
Impact of Obesity Health Care Costs
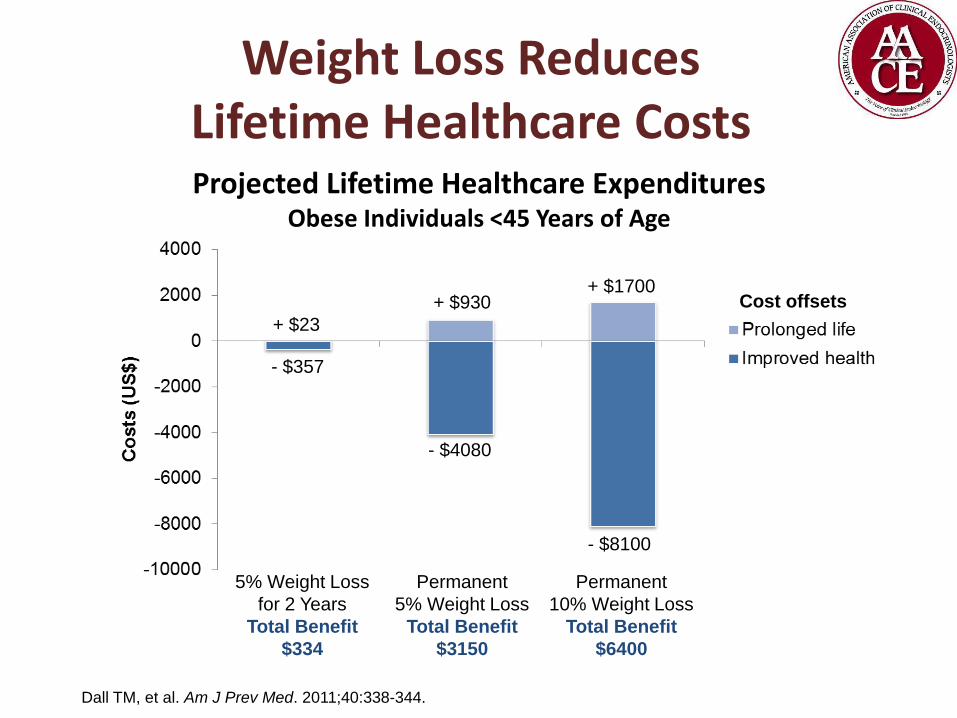
Weight Loss Reduces Lifetime Healthcare Costs
Dall TM, et al. Am J Prev Med. 2011;40:338-344.
Projected Lifetime Healthcare Expenditures Obese Individuals <45 Years of Age
Cost offsets
+ $23
+ $930 + $1700
- $357
- $4080
- $8100
5% Weight Loss
for 2 Years
Total Benefit
$334
Permanent
5% Weight Loss
Total Benefit
$3150
Permanent
10% Weight Loss
Total Benefit
$6400
HOW DOES WEIGHT GAIN AFFECT HEALTH?
Obesity Medicine
Epidemiology & Pathophysiology

0
10
20
30
40
50
60
70
Relationship Between BMI and Percent Body Fat in Men and Women
Adapted from: Gallagher et al. Am J Clin Nutr 2000;72:694.
Bo
dy F
at (%
)
Body Mass Index (kg/m2)
0 10 30 40 60 20 50
Women
Men
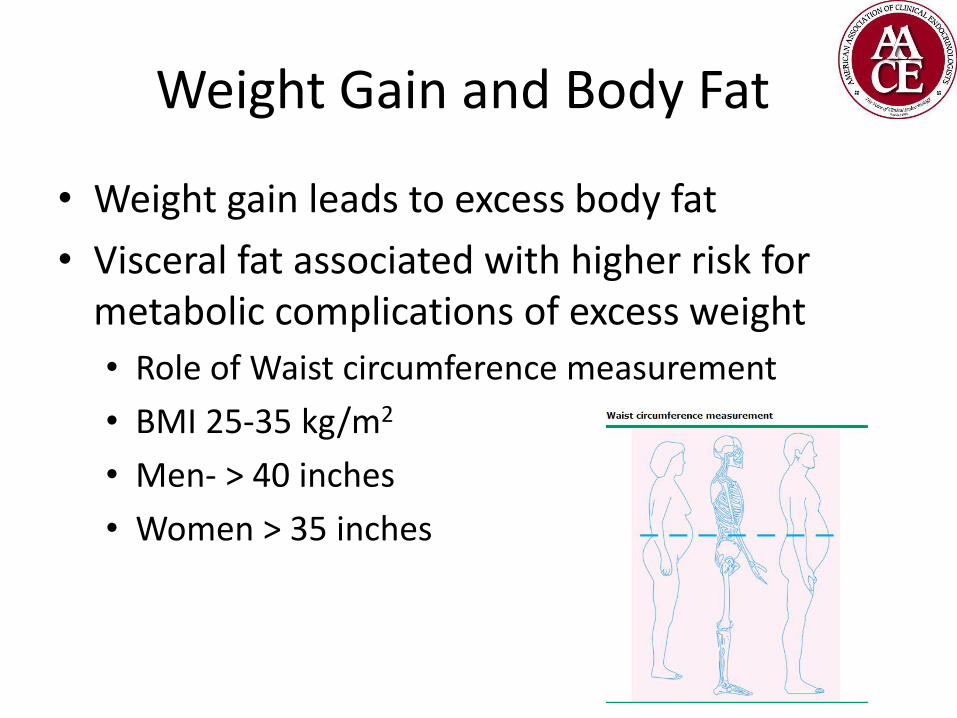
Weight Gain and Body Fat
• Weight gain leads to excess body fat
• Visceral fat associated with higher risk for metabolic complications of excess weight
• Role of Waist circumference measurement
• BMI 25-35 kg/m2
• Men- > 40 inches
• Women > 35 inches

Relationship Between Visceral Adipose Tissue and Insulin Action
Am J Physiol .1997;273(2 pt 1):E425–E432.
18
16
14
12
10
8
6
4
2
0 1000 2000 3000 4000 5000
Visceral adipose tissue volume per unit surface area (mL/m2)
Glu
cose
dis
po
sal (
mg
/kg
LBM
/min
)
Women Men
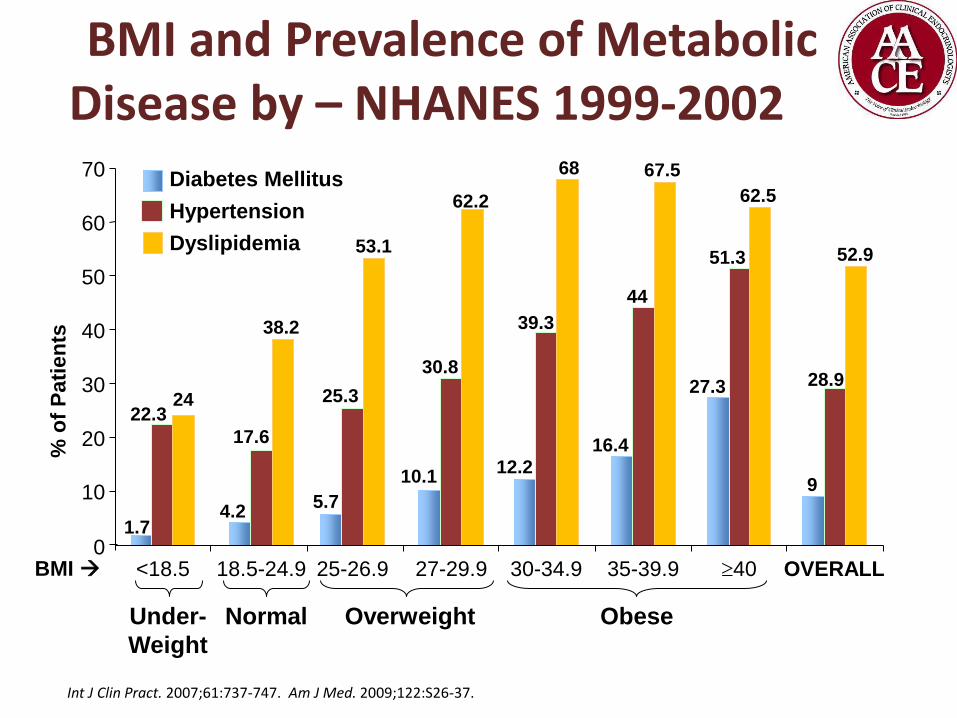
BMI and Prevalence of Metabolic Disease by – NHANES 1999-2002
Under-
Weight
18.5-24.9 25-26.9 27-29.9 30-34.9 35-39.9 40 0
10
20
30
40
50
60
70 Diabetes Mellitus
Hypertension
Dyslipidemia
OVERALL <18.5
1.7
22.3 24
4.2
17.6
38.2
5.7
25.3
53.1
10.1
30.8
62.2
12.2
39.3
68
16.4
44
67.5
27.3
51.3
62.5
9
28.9
52.9
BMI
% o
f P
ati
en
ts
Normal Overweight Obese
Int J Clin Pract. 2007;61:737-747. Am J Med. 2009;122:S26-37.
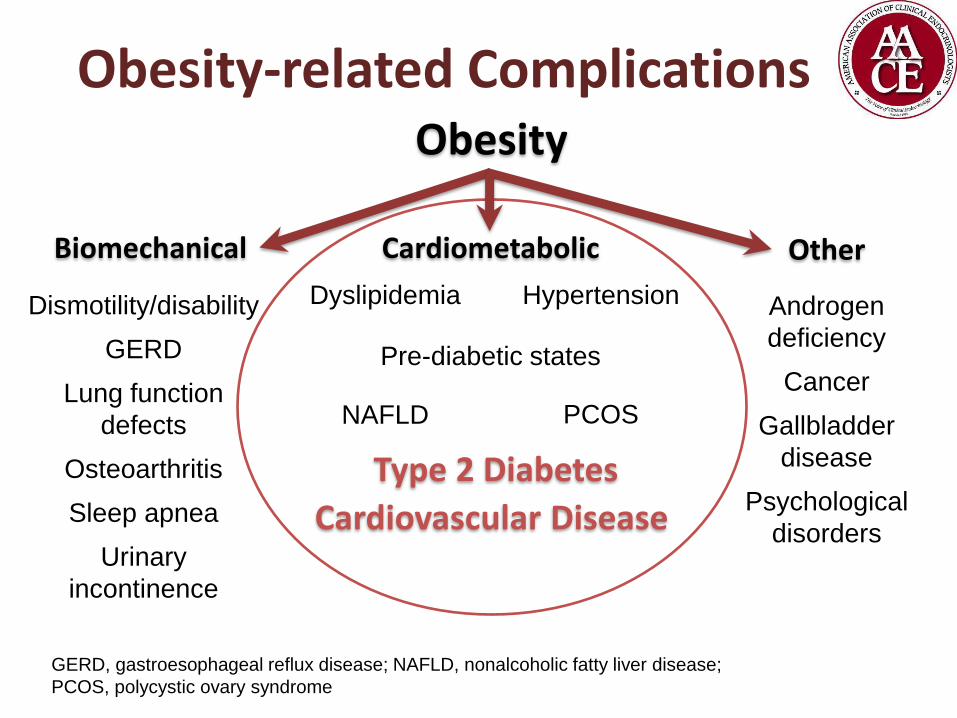
Obesity-related Complications Obesity
NAFLD
Cardiovascular Disease
Dismotility/disability
GERD
Lung function
defects
Osteoarthritis
Sleep apnea
Urinary
incontinence
Pre-diabetic states
Hypertension Dyslipidemia
PCOS
Type 2 Diabetes
Cardiometabolic Biomechanical Other
GERD, gastroesophageal reflux disease; NAFLD, nonalcoholic fatty liver disease;
PCOS, polycystic ovary syndrome
Androgen
deficiency
Cancer
Gallbladder
disease
Psychological
disorders
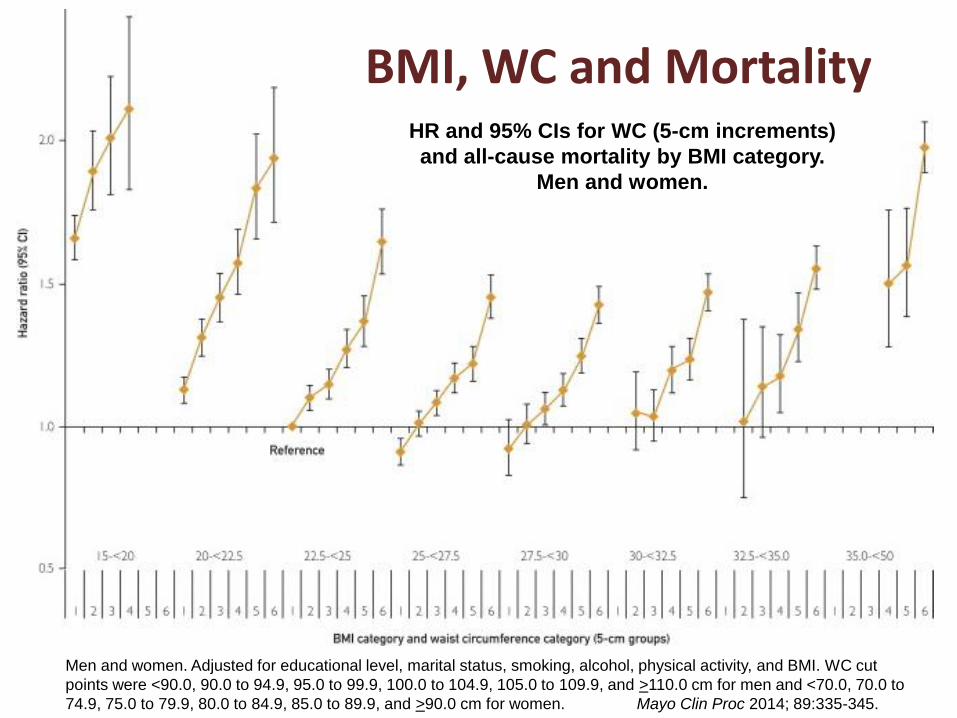
Figure 3
Men and women. Adjusted for educational level, marital status, smoking, alcohol, physical activity, and BMI. WC cut
points were <90.0, 90.0 to 94.9, 95.0 to 99.9, 100.0 to 104.9, 105.0 to 109.9, and >110.0 cm for men and <70.0, 70.0 to
74.9, 75.0 to 79.9, 80.0 to 84.9, 85.0 to 89.9, and >90.0 cm for women. Mayo Clin Proc 2014; 89:335-345.
BMI, WC and Mortality HR and 95% CIs for WC (5-cm increments)
and all-cause mortality by BMI category.
Men and women.
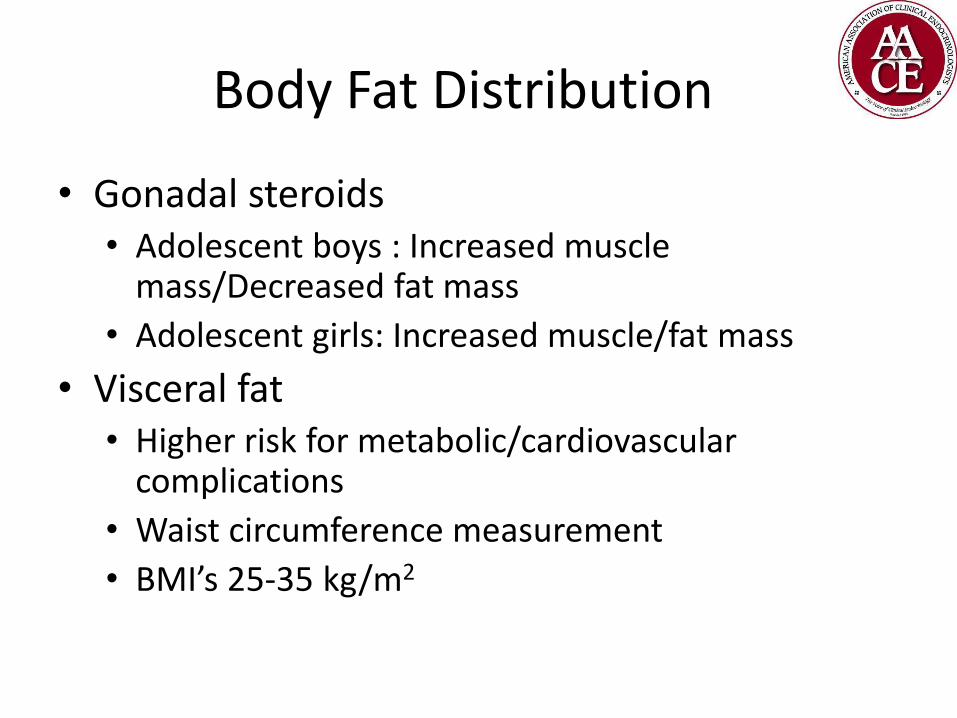
Body Fat Distribution
• Gonadal steroids • Adolescent boys : Increased muscle
mass/Decreased fat mass
• Adolescent girls: Increased muscle/fat mass
• Visceral fat • Higher risk for metabolic/cardiovascular
complications
• Waist circumference measurement
• BMI’s 25-35 kg/m2
WHY ARE WE GETTING HEAVIER?
Obesity Medicine
Epidemiology & Pathophysiology

Factors Contributing to Weight Gain
• Genetic
• Physiologic
• Environmental
• Lifestyle
• Socioeconomic
• Cultural

Hard to change your genes
but not your jean size!
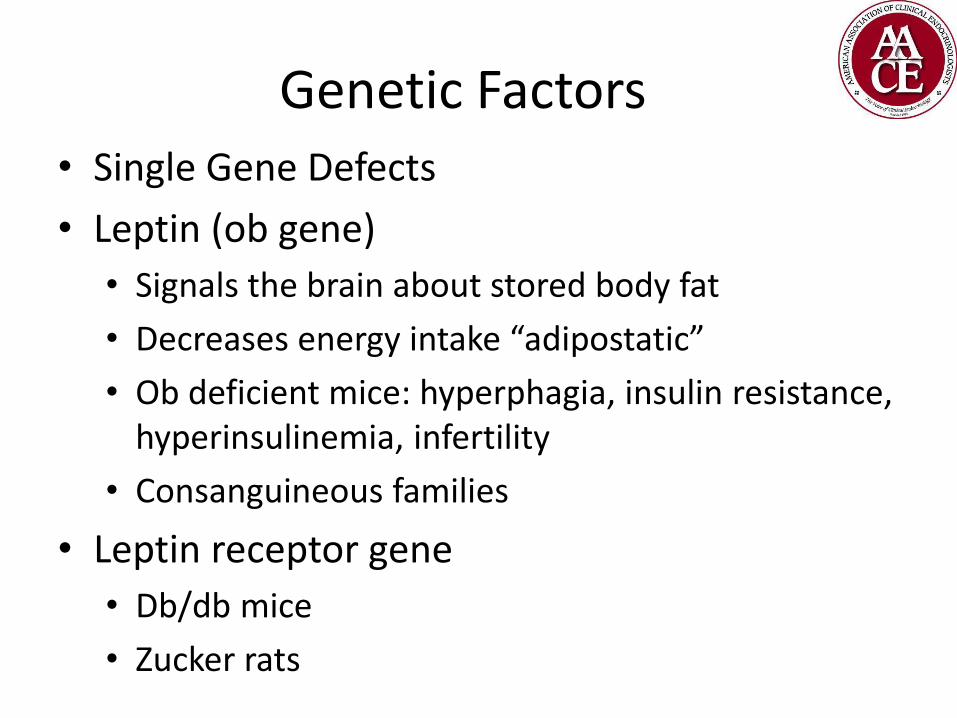
Genetic Factors • Single Gene Defects
• Leptin (ob gene)
• Signals the brain about stored body fat
• Decreases energy intake “adipostatic”
• Ob deficient mice: hyperphagia, insulin resistance, hyperinsulinemia, infertility
• Consanguineous families
• Leptin receptor gene
• Db/db mice
• Zucker rats
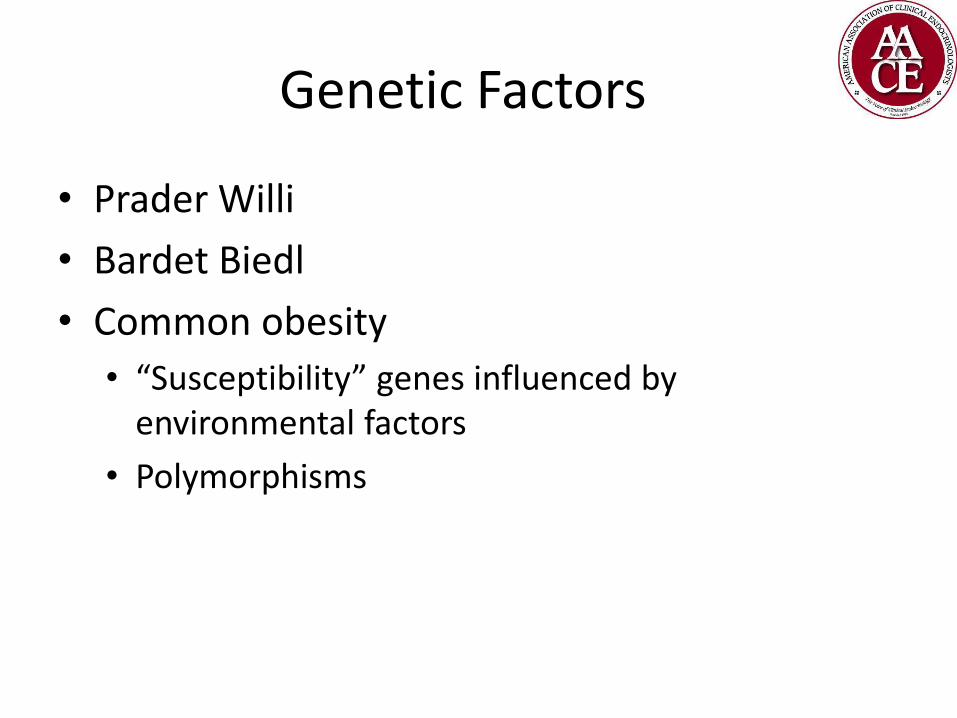
Genetic Factors
• Prader Willi
• Bardet Biedl
• Common obesity
• “Susceptibility” genes influenced by environmental factors
• Polymorphisms
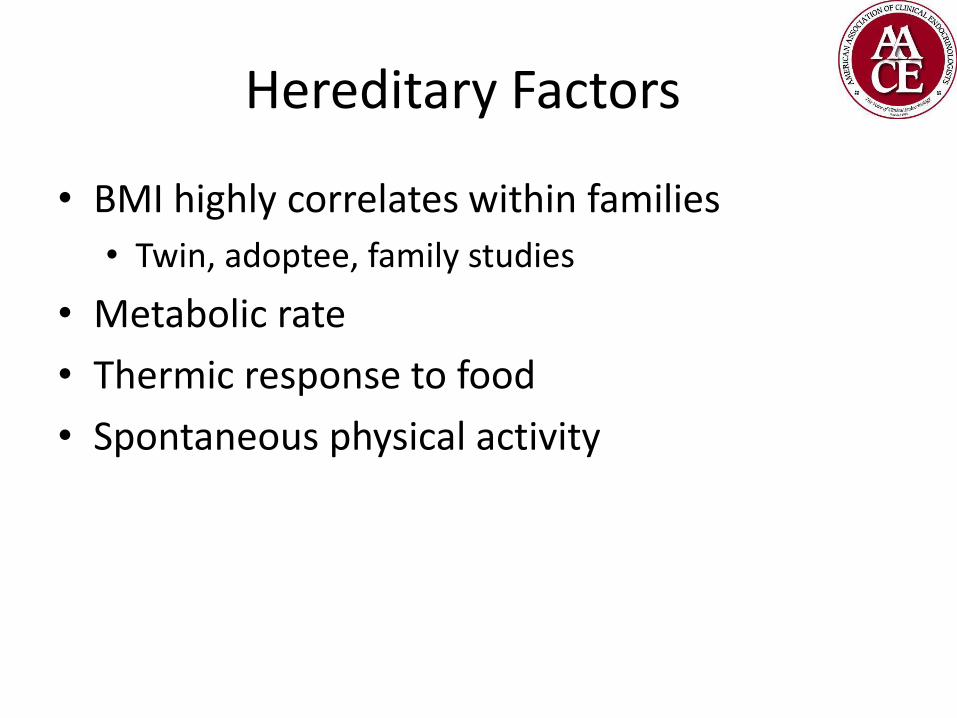
Hereditary Factors
• BMI highly correlates within families
• Twin, adoptee, family studies
• Metabolic rate
• Thermic response to food
• Spontaneous physical activity
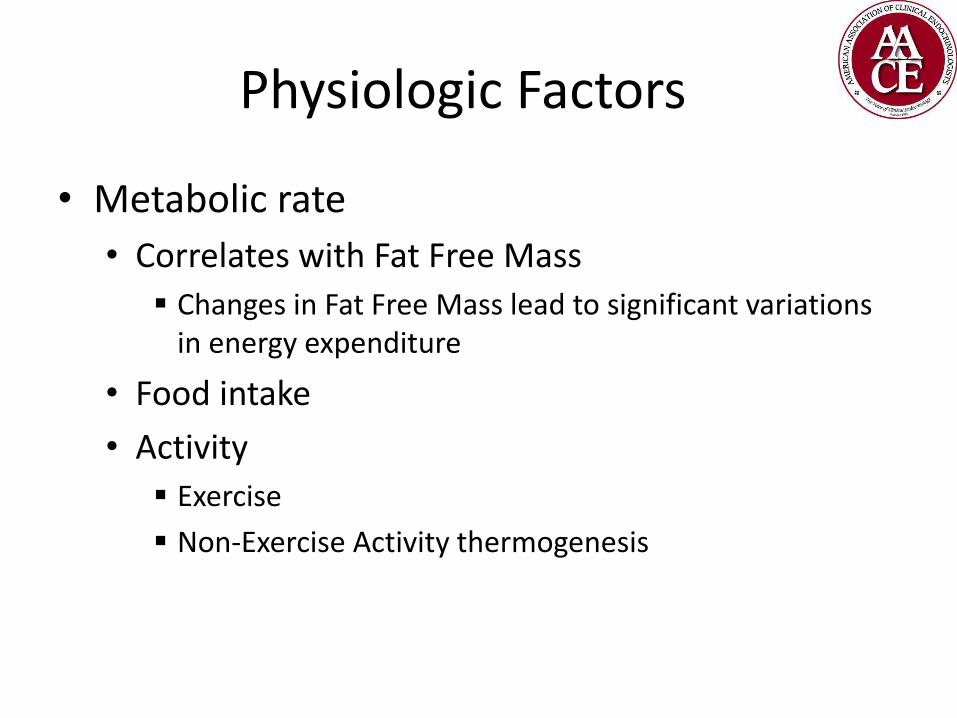
Physiologic Factors
• Metabolic rate
• Correlates with Fat Free Mass
Changes in Fat Free Mass lead to significant variations in energy expenditure
• Food intake
• Activity
Exercise
Non-Exercise Activity thermogenesis
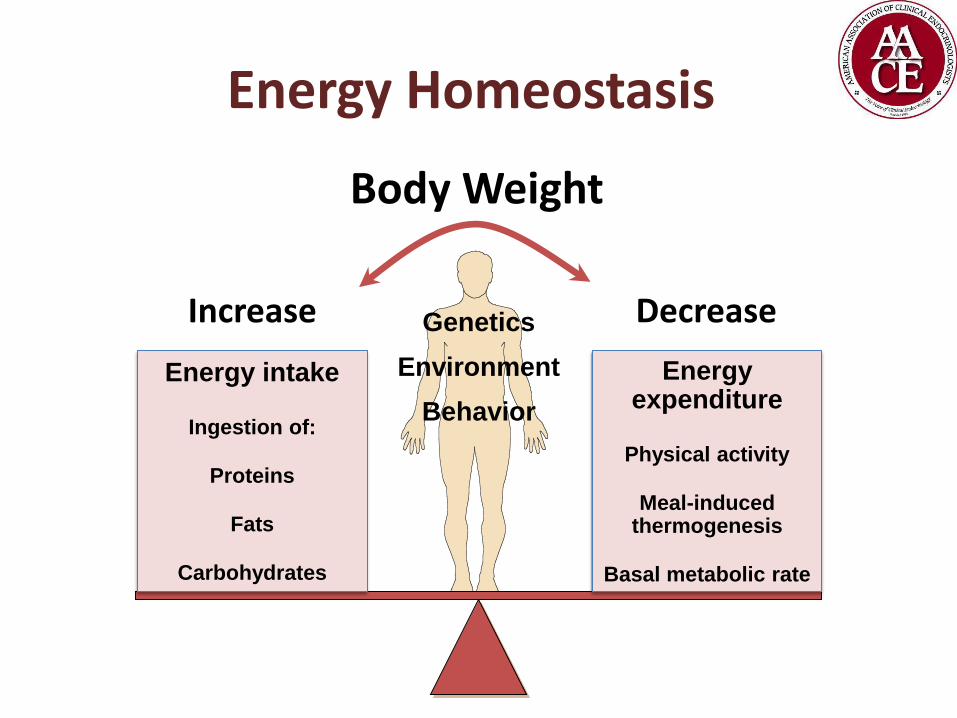
Energy intake
Ingestion of:
Proteins
Fats
Carbohydrates
Energy expenditure
Physical activity
Meal-induced thermogenesis
Basal metabolic rate
Body Weight
Increase
Energy Homeostasis
Decrease Genetics
Environment
Behavior

Here is the Title Physiology Energy requirements
• Determinants of energy requirements
• Age Drops as we age
• Sex Higher for men than women
• Height Taller you are, the higher calorie needs
• Weight Heavier you are, the higher calorie needs
• Components of energy requirements • Basal metabolic rate
• Activity Exercise
NEAT (Non-Exercise Activity Thermogenesis)
(Calorie needs)
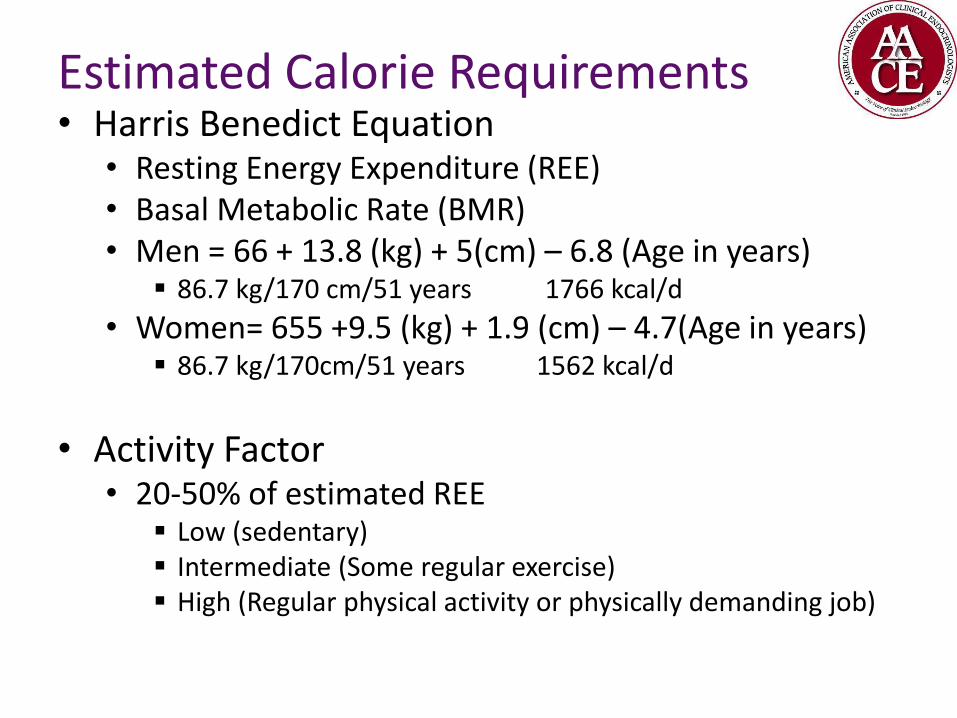
Here is the Title Estimated Calorie Requirements
• Harris Benedict Equation • Resting Energy Expenditure (REE) • Basal Metabolic Rate (BMR) • Men = 66 + 13.8 (kg) + 5(cm) – 6.8 (Age in years)
86.7 kg/170 cm/51 years 1766 kcal/d
• Women= 655 +9.5 (kg) + 1.9 (cm) – 4.7(Age in years) 86.7 kg/170cm/51 years 1562 kcal/d
• Activity Factor • 20-50% of estimated REE
Low (sedentary) Intermediate (Some regular exercise) High (Regular physical activity or physically demanding job)

Here is the Title
Estimated Calorie Requirements World Health Organization
• Estimate BMR • Men 18-30 = (0.0630 X (kg) + 2.8957) X 240 kcal/d • Men 31-60 = (0.0484 X (kg) + 3.6534 X 240 kcal/d • Women 18-30 = (0.0621 X (kg) + 2.0357) X 240 kcal/d
25 yrs/86.7 kg 1780 kcal/d
• Women 31-60 = (0.0342 X (kg) + 3.5377) X 240 kcal/d 40 yrs/86.7 kg 1560 kcal/d
• Determine Activity Factor (AF) Low 1.3 Intermediate 1.5 High 1.7
• Total energy expenditure= BMR X AF
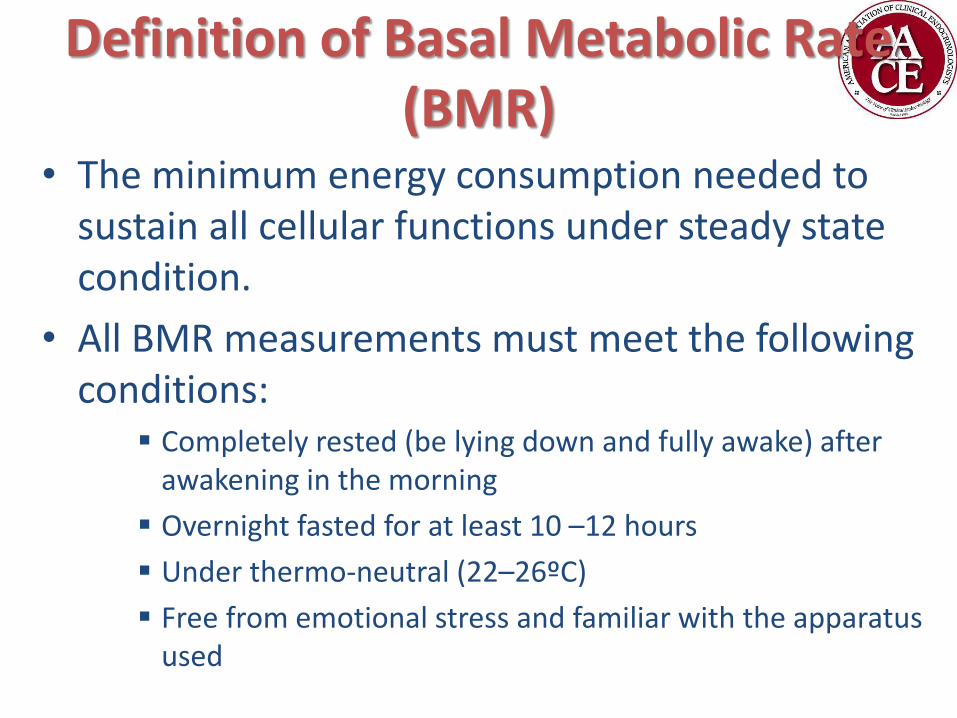
Definition of Basal Metabolic Rate (BMR)
• The minimum energy consumption needed to sustain all cellular functions under steady state condition.
• All BMR measurements must meet the following conditions:
Completely rested (be lying down and fully awake) after awakening in the morning
Overnight fasted for at least 10 –12 hours
Under thermo-neutral (22–26ºC)
Free from emotional stress and familiar with the apparatus used
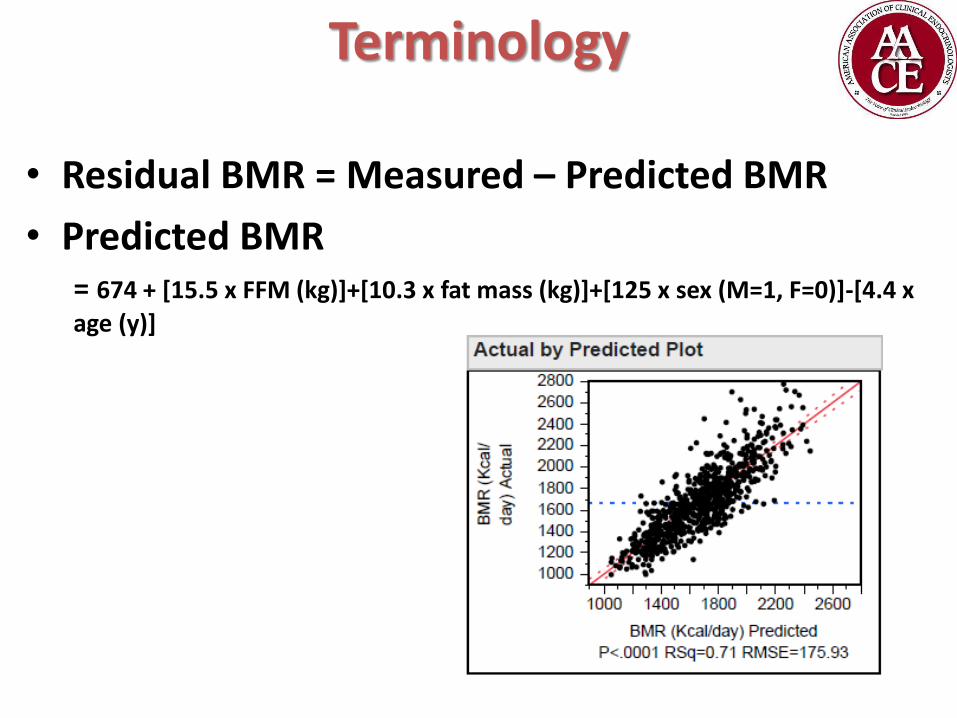
Terminology
• Residual BMR = Measured – Predicted BMR
• Predicted BMR = 674 + [15.5 x FFM (kg)]+[10.3 x fat mass (kg)]+[125 x sex (M=1, F=0)]-[4.4 x
age (y)]
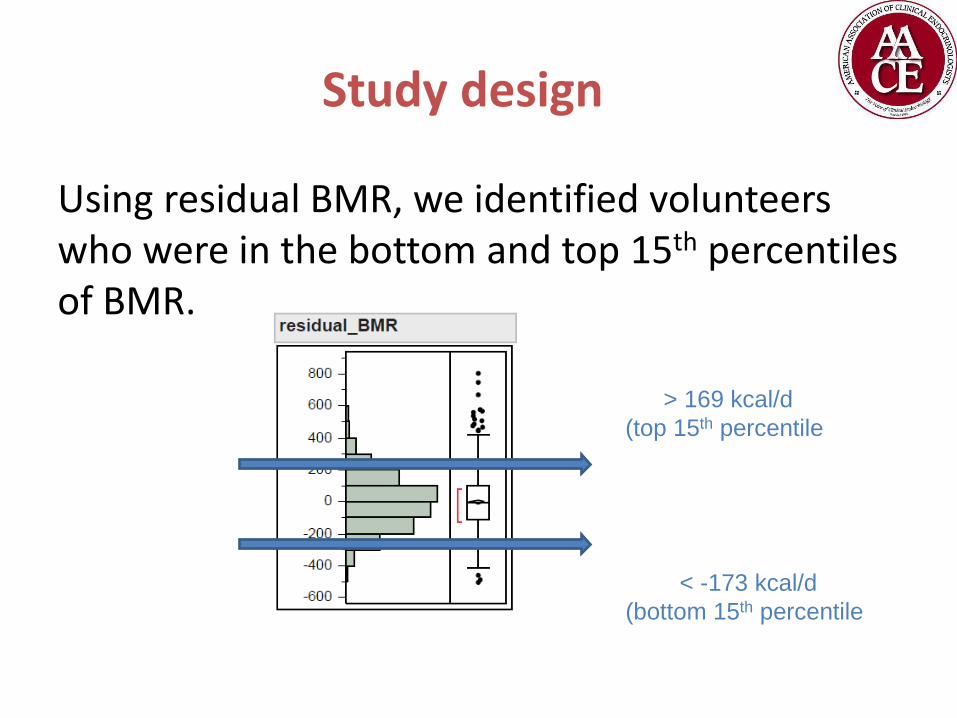
Study design
Using residual BMR, we identified volunteers who were in the bottom and top 15th percentiles of BMR.
> 169 kcal/d
(top 15th percentile)
< -173 kcal/d
(bottom 15th percentile)
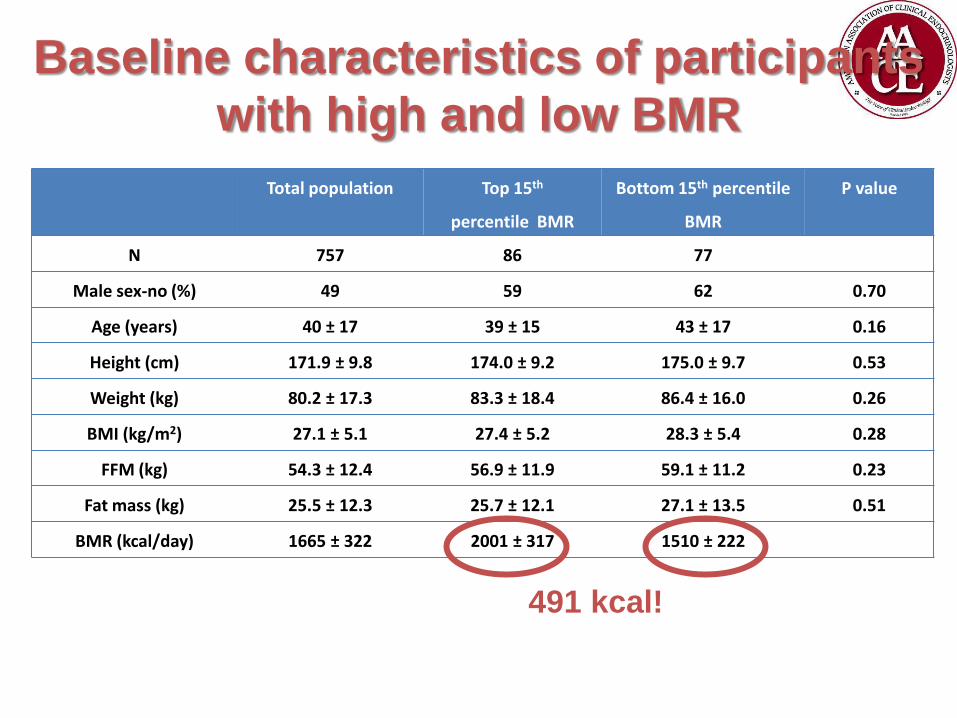
Total population Top 15th
percentile BMR
Bottom 15th percentile
BMR
P value
N 757 86 77
Male sex-no (%) 49 59 62 0.70
Age (years) 40 ± 17 39 ± 15 43 ± 17 0.16
Height (cm) 171.9 ± 9.8 174.0 ± 9.2 175.0 ± 9.7 0.53
Weight (kg) 80.2 ± 17.3 83.3 ± 18.4 86.4 ± 16.0 0.26
BMI (kg/m2) 27.1 ± 5.1 27.4 ± 5.2 28.3 ± 5.4 0.28
FFM (kg) 54.3 ± 12.4 56.9 ± 11.9 59.1 ± 11.2 0.23
Fat mass (kg) 25.5 ± 12.3 25.7 ± 12.1 27.1 ± 13.5 0.51
BMR (kcal/day) 1665 ± 322 2001 ± 317 1510 ± 222
Baseline characteristics of participants
with high and low BMR
491 kcal!
Physiologic Factors
• Obesity = Energy intake > Energy expenditure
• Not that simple
• Ignores multiple factors that modulate these two components
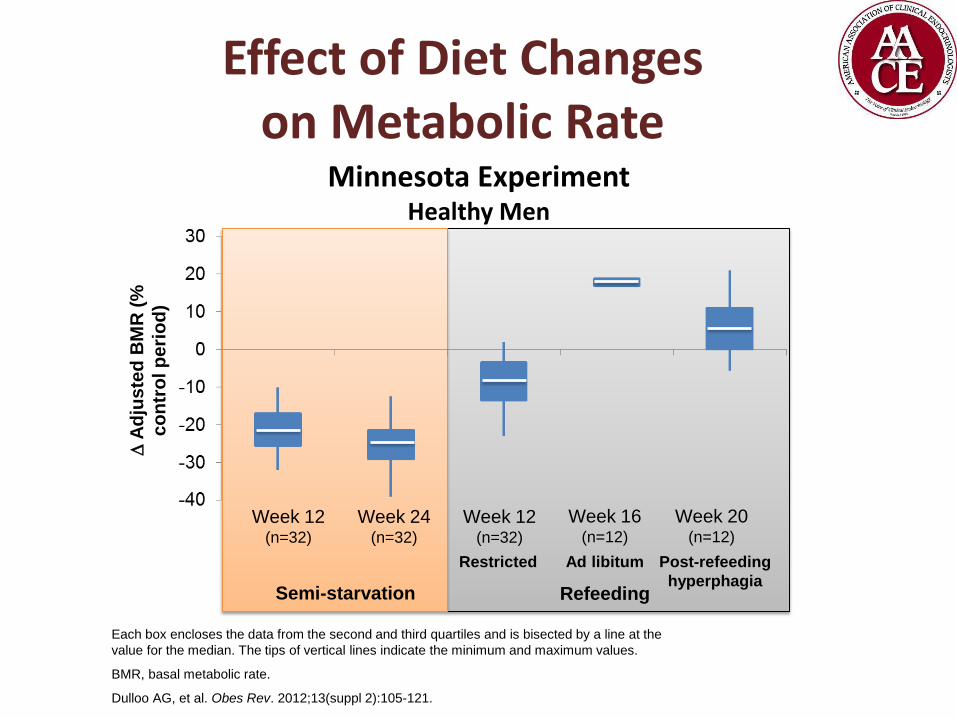
Effect of Diet Changes on Metabolic Rate
Each box encloses the data from the second and third quartiles and is bisected by a line at the
value for the median. The tips of vertical lines indicate the minimum and maximum values.
BMR, basal metabolic rate.
Dulloo AG, et al. Obes Rev. 2012;13(suppl 2):105-121.
Minnesota Experiment Healthy Men
Week 12 (n=32)
Week 24 (n=32)
Week 12 (n=32)
Week 16 (n=12)
Week 20 (n=12)
Semi-starvation Refeeding
Restricted Ad libitum Post-refeeding
hyperphagia
A
dju
ste
d B
MR
(%
co
ntr
ol p
eri
od
)

Physiologic Factors Differences in Metabolic Rates
Obese 50 y/o male, 180 cm initially at 250lbs, now at 212 lbs
• Weight loss 15%
• Decreased energy expenditure
• Decrease 15% of energy requirements
• HB equation – 15%=
• 1863 – 2235 kcal/day
Never Obese 50 y/o male , 180 cm at 212 lbs
• Stable
• Stable
• Stable
• HB equation=
• 2191-2630 kcal/day
This deficit can persist for 3-5 years

Obesity-related Impairments in Appetite Regulation & Energy Balance
Hormone Source Normal function Alteration
Cholecystokinin (CCK)
Duodenum Suppress appetite Levels decrease during dieting and weight loss
Glucose-dependent insulinotropic polypeptide (GIP)
Duodenum, jejunum
Energy storage Levels increase during dieting and weight loss
Ghrelin Gastric fundus Stimulate appetite, particularly for high-fat, high-sugar foods
Levels increase during dieting and weight loss
Glucagon-like peptide 1 (GLP-1)
Ileum Suppress appetite and increase satiety
Decreased functionality
Insulin Pancreas Regulate energy balance Signal satiety to brain
Insulin resistance in obese persons Reduced insulin levels after dieting
Leptin Adipocytes Regulate energy balance Suppress appetite
Levels decrease during weight loss
Peptide YY (PYY) Distal small intestine
Suppress appetite Levels decreased in obese persons
Sumithran P, Proietto J. Clin Sci (Lond). 2013;124:231-241.
Key Hormone Changes Associated with Weight Gain and Regain
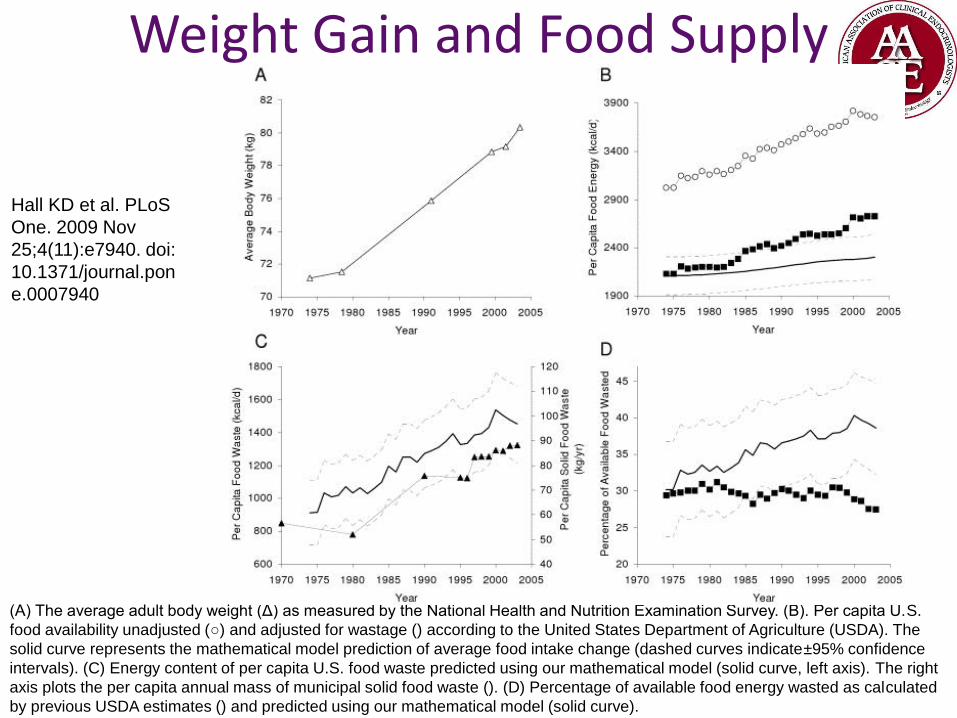
Weight Gain and Food Supply
(A) The average adult body weight (Δ) as measured by the National Health and Nutrition Examination Survey. (B). Per capita U.S.
food availability unadjusted (○) and adjusted for wastage () according to the United States Department of Agriculture (USDA). The
solid curve represents the mathematical model prediction of average food intake change (dashed curves indicate±95% confidence
intervals). (C) Energy content of per capita U.S. food waste predicted using our mathematical model (solid curve, left axis). The right
axis plots the per capita annual mass of municipal solid food waste (). (D) Percentage of available food energy wasted as calculated
by previous USDA estimates () and predicted using our mathematical model (solid curve).
Hall KD et al. PLoS
One. 2009 Nov
25;4(11):e7940. doi:
10.1371/journal.pon
e.0007940
Changes in Diet and Lifestyle and Long Term Weight Gain in Men and Women
• > 120, 000 men and women • Participants gained an average of 3.35 lb every 4
years N E Med
Volume 364(25):2392-2404 June 23, 20
Mozaffarian D, et al. N Engl J Med. 364(25):2392-404
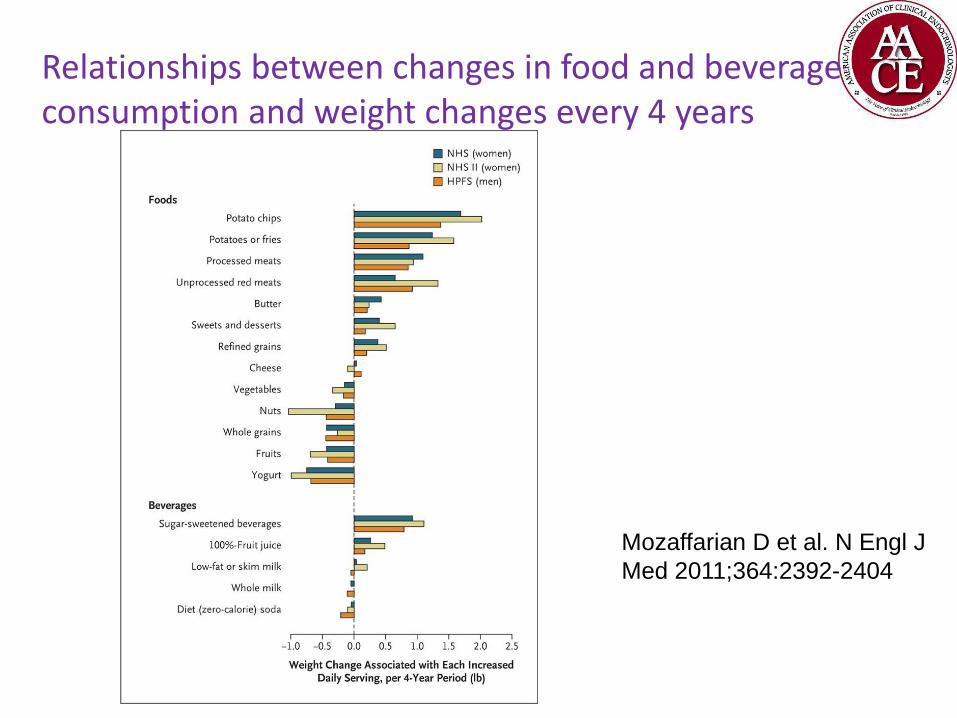
Relationships between changes in food and beverage consumption and weight changes every 4 years
Mozaffarian D et al. N Engl J
Med 2011;364:2392-2404
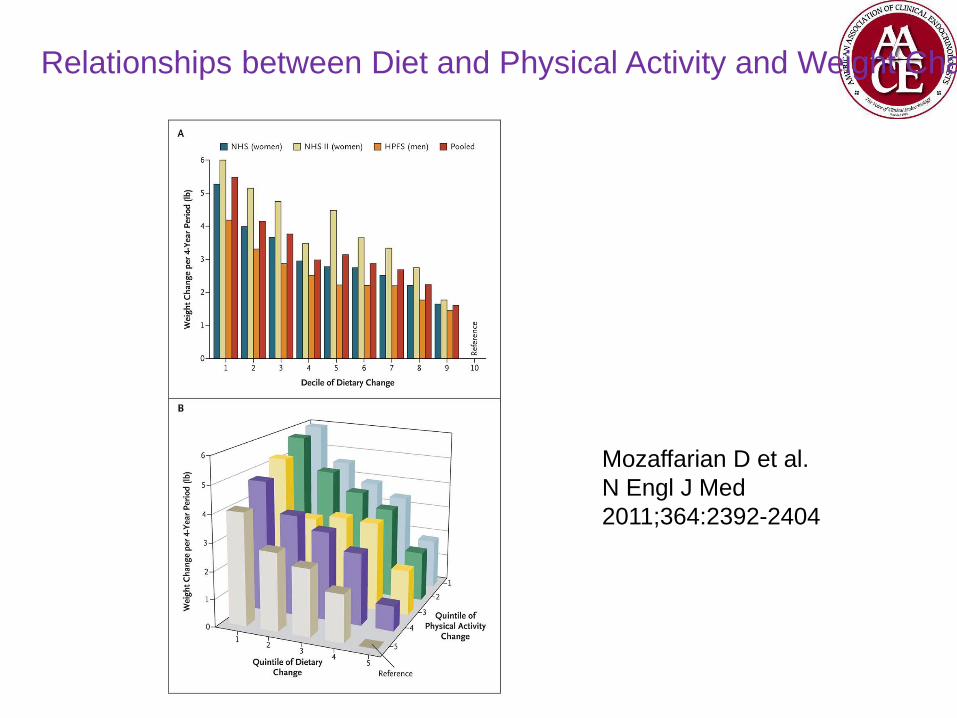
Relationships between Diet and Physical Activity and Weight Changes
Mozaffarian D et al.
N Engl J Med
2011;364:2392-2404
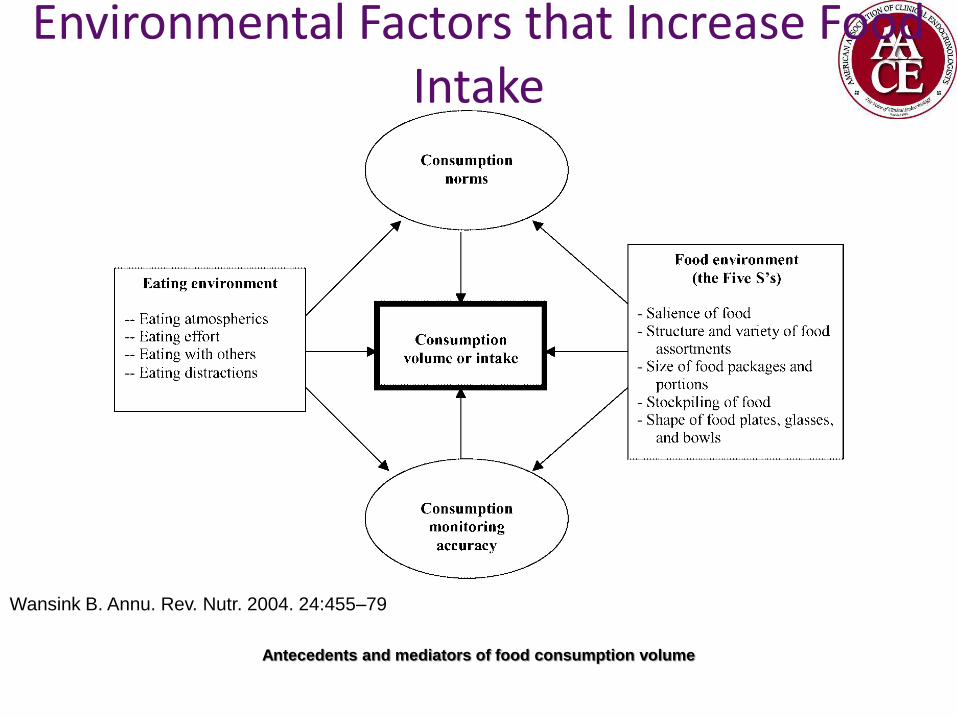
Environmental Factors that Increase Food Intake
Antecedents and mediators of food consumption volume
Wansink B. Annu. Rev. Nutr. 2004. 24:455–79
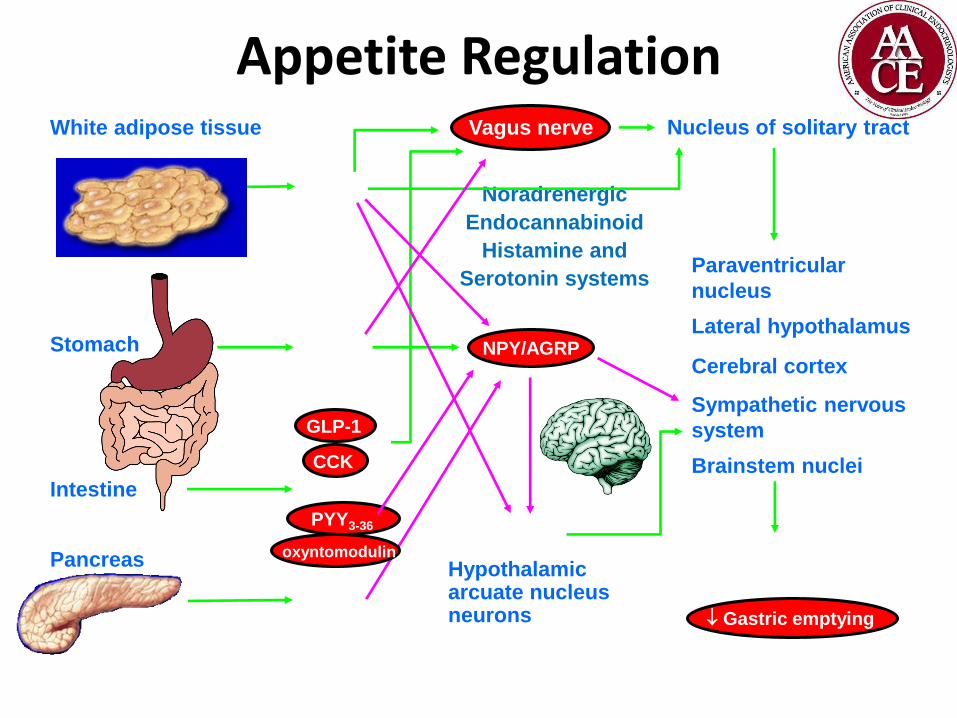
Appetite Regulation
Adapted from Neary NM, et al. Clin Endocrinol. 2004;60:153-160.
Noradrenergic
Endocannabinoid
Histamine and
Serotonin systems
White adipose tissue
Insulin
amylin
Nucleus of solitary tract
Paraventricular
nucleus
Lateral hypothalamus
Cerebral cortex
Sympathetic nervous
system
Brainstem nuclei
Hypothalamic arcuate nucleus neurons
Vagus nerve
Intestine
Stomach
PYY3-36
CCK
GLP-1
Ghrelin
obestatin
Leptin
NPY/AGRP
POMC Feeding
Gastric emptying
Metabolic rate?
Pancreas oxyntomodulin

Neural Signaling: Peripheral and Central Regulation of Energy Intake
AGRP, agouti-related peptide; CART, cocaine- and amphetamine-regulated transcript; CCK, cholecystokinin; GLP-1 glucagon-
like peptide 1; LH, lateral hypothalamus; NPY, neuropeptide Y; POMC, proopiomelanocortin; PVN, paraventricular nucleus;
PYY, peptide YY. Morton GJ, et al. Physiol Rev. 2011;91:389-411; Sumithran P, et al. Clin Sci (Lond). 2013;124:231-241.
Hypothalamus
Ghrelin
CCK PYY GLP-1
Leptin
Insulin
Amylin
Peripheral Signals
Arcuate nucleus Y1R Y5R
MC4R
MSH
AGRP
NPY
PVN, LH
Intake Higher cortical
centers
Intake
POMC/CART Neurons Anorexigenic = food intake • Stimulated by leptin and other
appetite-suppressing signals
NPY/AGRP Neurons Orexigenic = food intake • Stimulated by ghrelin • Inhibited by leptin
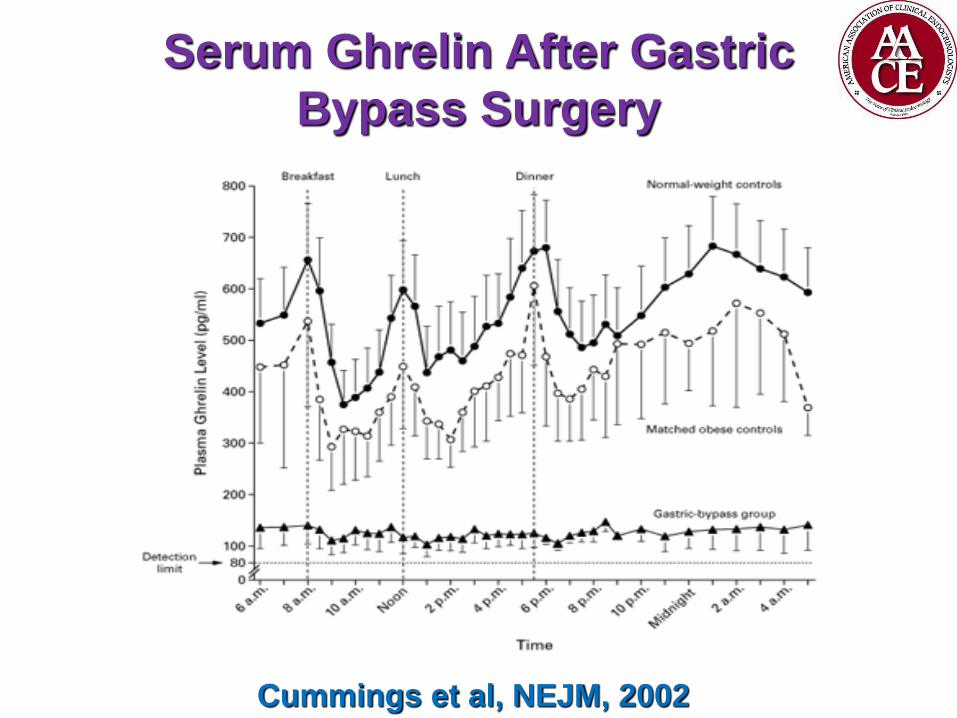
Serum Ghrelin After Gastric
Bypass Surgery
Cummings et al, NEJM, 2002
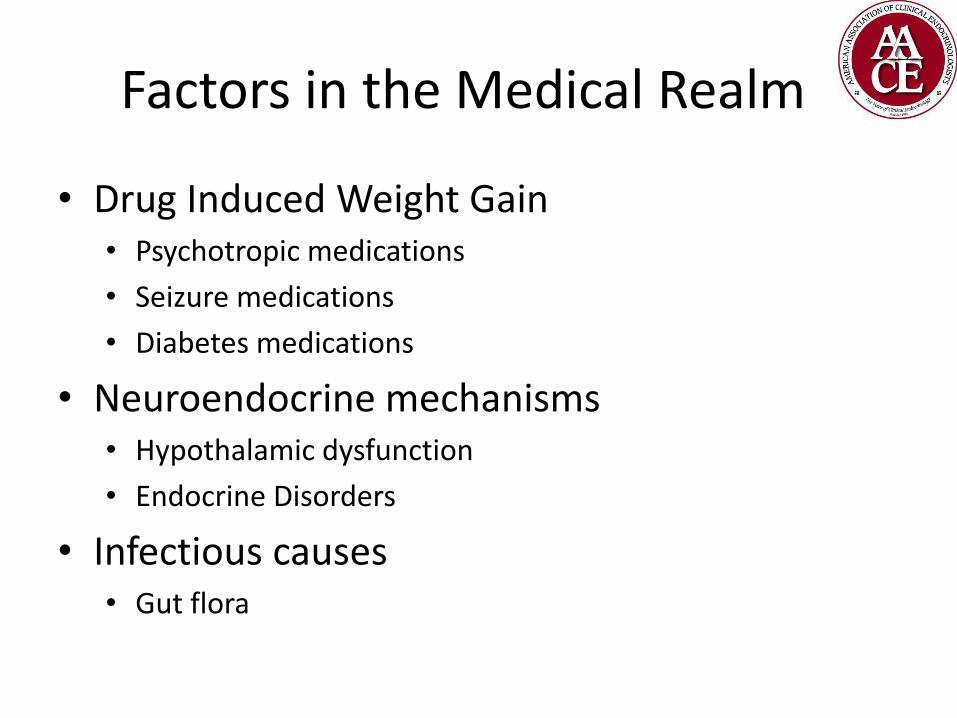
Factors in the Medical Realm
• Drug Induced Weight Gain • Psychotropic medications
• Seizure medications
• Diabetes medications
• Neuroendocrine mechanisms • Hypothalamic dysfunction
• Endocrine Disorders
• Infectious causes • Gut flora
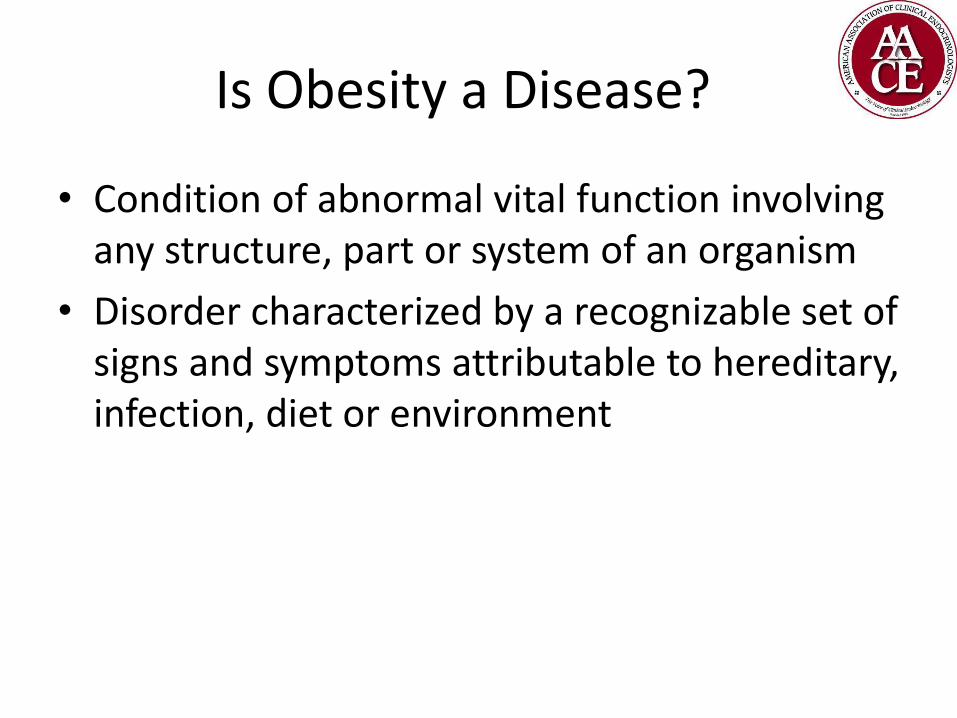
Is Obesity a Disease?
• Condition of abnormal vital function involving any structure, part or system of an organism
• Disorder characterized by a recognizable set of signs and symptoms attributable to hereditary, infection, diet or environment
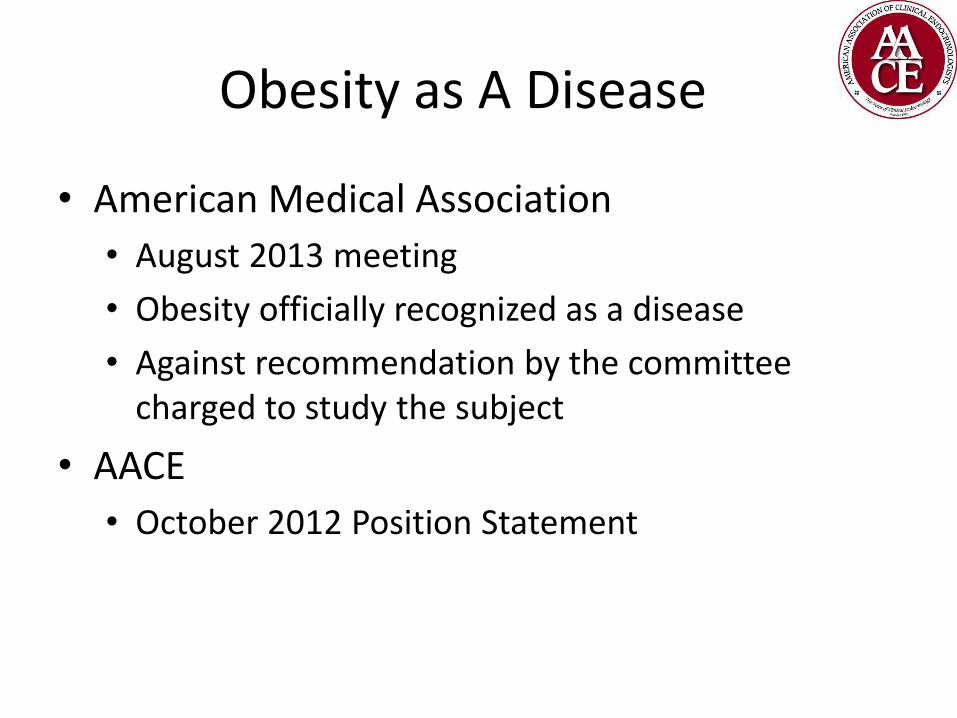
Obesity as A Disease
• American Medical Association
• August 2013 meeting
• Obesity officially recognized as a disease
• Against recommendation by the committee charged to study the subject
• AACE
• October 2012 Position Statement
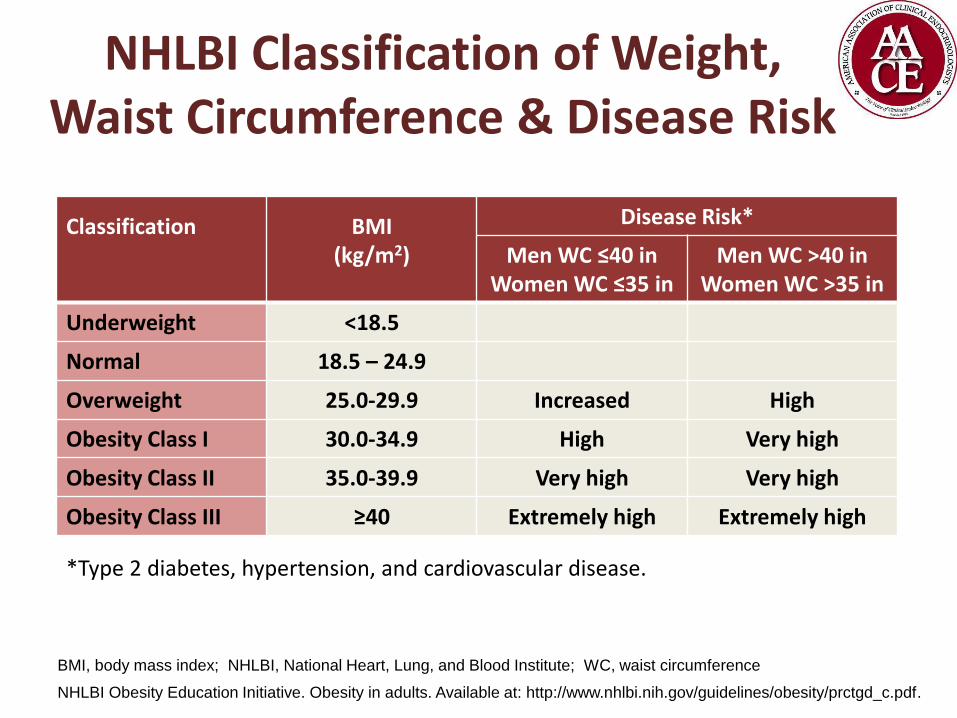
NHLBI Classification of Weight, Waist Circumference & Disease Risk
Classification
BMI (kg/m2)
Disease Risk*
Men WC ≤40 in Women WC ≤35 in
Men WC >40 in Women WC >35 in
Underweight <18.5
Normal 18.5 – 24.9
Overweight 25.0-29.9 Increased High
Obesity Class I 30.0-34.9 High Very high
Obesity Class II 35.0-39.9 Very high Very high
Obesity Class III ≥40 Extremely high Extremely high
*Type 2 diabetes, hypertension, and cardiovascular disease.
BMI, body mass index; NHLBI, National Heart, Lung, and Blood Institute; WC, waist circumference
NHLBI Obesity Education Initiative. Obesity in adults. Available at: http://www.nhlbi.nih.gov/guidelines/obesity/prctgd_c.pdf.
Summary
• Obesity as defined by BMI of 30 kg/m2 continues to be an increasing health threat • Affects minority groups to a greater extent • Worldwide problem
• Obesity is a major contributor to rising health care costs • Currently in the management of its co-morbidities • There remain biases in coverage for obesity
treatments
• Many factors have contributed to the rising prevalence of obesity • Genetic, Hereditable, Physiologic, Environmental

Summary
• These factors represent obstacles the effective management of obesity
• Obesity meets the criteria for a disease but requires a multifaceted approach to management

![THE OBESITY MEDICINE ASSOCIATION’S GUIDE TO … · j am diet assoc 2005 105:s53-62. [9] ... the obesity medicine association’s guide to obesity classification* which method is](https://img.pdfslide.us/doc/110x75/5acdc7707f8b9aad468e56ab/the-obesity-medicine-associations-guide-to-am-diet-assoc-2005-105s53-62.jpg)


![THE OBESITY MEDICINE ASSOCIATION’S GUIDE TO OBESITY … · 2016. 9. 14. · Lipidol. 2014 8:473-488. [5] Bays H: Central obesity as a clinical marker of adiposopathy; increased](https://img.pdfslide.us/doc/110x75/603be0d1f39c19159b5322e8/the-obesity-medicine-associationas-guide-to-obesity-2016-9-14-lipidol-2014.jpg)