Embed Size (px)
Citation preview

NWA Quality Analyst®
Manufacturing Intelligence for Intelligent Manufacturing
POWERFUL
FLEXIBLE
QUALITY
POWERFUL
FLEXIBLE
QUALITY

Superior real-time SPC charting, analysis, and reportingNWA Quality Analyst® is an award winning SPC charting and analysis software solution providing the best combination of power, flexibility, and ease-of-use of any SPC software available. It enables a wide range of users to graphically analyze process behavior and judge the impact of process improvement decisions with minimal training in statistical techniques. NWA QA integrates with all major manufacturing information systems and is used by leading worldwide manufacturers to analyze plant data for vendor certification, regulatory compliance, process improvement, and cost reduction.
When it comes to setting up charts for specific analytical needs, Quality Analyst offers unmatched flexibility and versatility. User preferences can be set using clear, logical, consistent dialogs. While default settings produce the most commonly accepted form, charts can be quickly customized. You can define any chart to meet internal, customer, or regulatory requirements, for example:
• Combine attribute, measurement, and descriptive information in the same data set
• Select from more than 20 process capability indices and 8 distributions
• Select from 19 pattern and run rules, or create your own
• Choose fonts, colors, aspect ratios, and annota-tions to create presentation quality graphics
POWERQuality Analyst’s operational power is available directly from the spreadsheet-like user interface, providing:
• Access to all configuration, charting, and analytical functions from a single screen
• A suite of advanced data management tools
• A robust data structure allowing all charting and analysis from a single data set
• User-defined calculated variables (including a visual equation builder), multi-key data sorting, and multi-criteria data filtering
• Pop-up windows displaying descriptive characteristics and rule violations for any point on a chart
EASE OF USENWA Quality Analyst combines comprehensive charting and analysis capabilities with interactive operation to turn your data into valuable information. Developed for ease of use, NWA QA provides:
• Fast, simple charting—from start to chart in as few as three mouse clicks
• Simple, direct data and chart setup
• Multiple chart displays and printing with drag-and-drop page layout
• Easy, wizard-guided automation
• Straightforward connection to external data-bases
FLEXIBILITY
Features
NWA Quality Analyst®
FunctionalityINTEGRATIONQuality Analyst integrates with all major manufacturing information systems to serve as the SPC analysis and charting component of an integrated quality information system. The combination of database connectivity and synchronization, Run File automation, and XML output provide the tools necessary to automatically collect, analyze, and report on data from virtually any source. Quality Analyst’s SPC analysis can be launched directly from desktop icons or from other applications. Database connection is automatic and users can be prompted to guide workflows and modify queries.
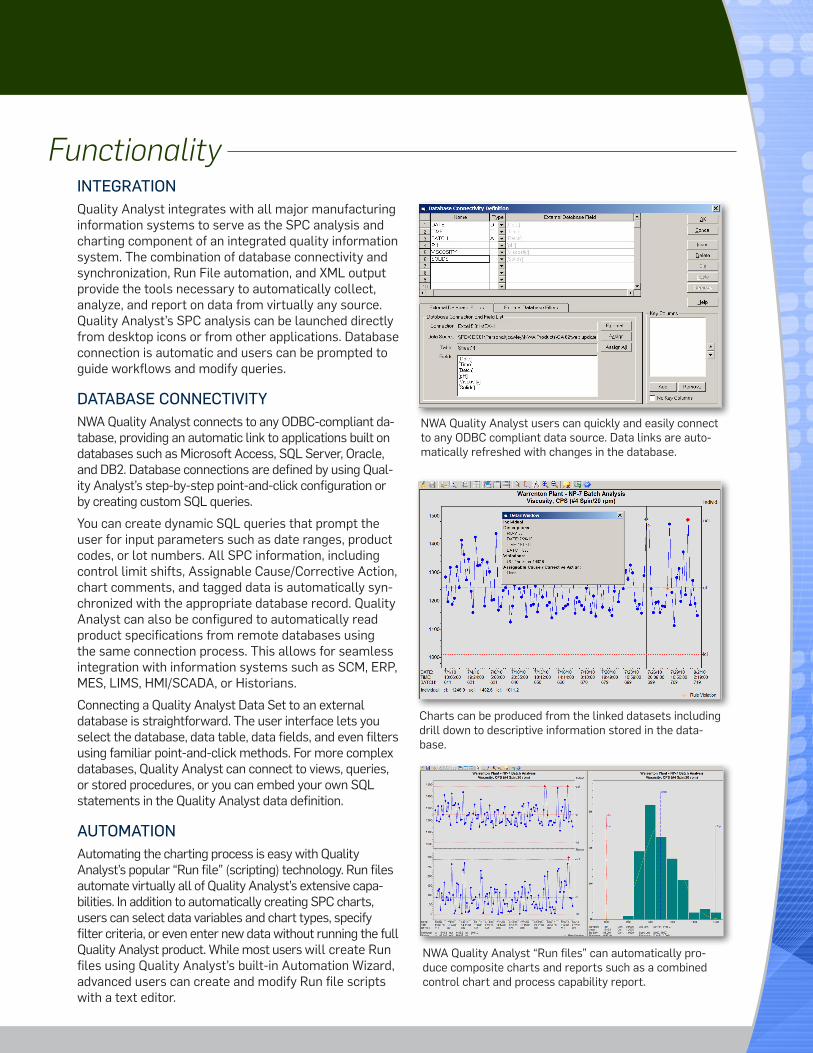
DATABASE CONNECTIVITYNWA Quality Analyst connects to any ODBC-compliant da-tabase, providing an automatic link to applications built on databases such as Microsoft Access, SQL Server, Oracle, and DB2. Database connections are defined by using Qual-ity Analyst’s step-by-step point-and-click configuration or by creating custom SQL queries.
You can create dynamic SQL queries that prompt the user for input parameters such as date ranges, product codes, or lot numbers. All SPC information, including control limit shifts, Assignable Cause/Corrective Action, chart comments, and tagged data is automatically syn-chronized with the appropriate database record. Quality Analyst can also be configured to automatically read product specifications from remote databases using the same connection process. This allows for seamless integration with information systems such as SCM, ERP, MES, LIMS, HMI/SCADA, or Historians.
Connecting a Quality Analyst Data Set to an external database is straightforward. The user interface lets you select the database, data table, data fields, and even filters using familiar point-and-click methods. For more complex databases, Quality Analyst can connect to views, queries, or stored procedures, or you can embed your own SQL statements in the Quality Analyst data definition.
AUTOMATIONAutomating the charting process is easy with Quality Analyst’s popular “Run file” (scripting) technology. Run files automate virtually all of Quality Analyst’s extensive capa-bilities. In addition to automatically creating SPC charts, users can select data variables and chart types, specify filter criteria, or even enter new data without running the full Quality Analyst product. While most users will create Run files using Quality Analyst’s built-in Automation Wizard, advanced users can create and modify Run file scripts with a text editor.
NWA Quality Analyst users can quickly and easily connect to any ODBC compliant data source. Data links are auto-matically refreshed with changes in the database.
Charts can be produced from the linked datasets including drill down to descriptive information stored in the data-base.
NWA Quality Analyst “Run files” can automatically pro-duce composite charts and reports such as a combined control chart and process capability report.
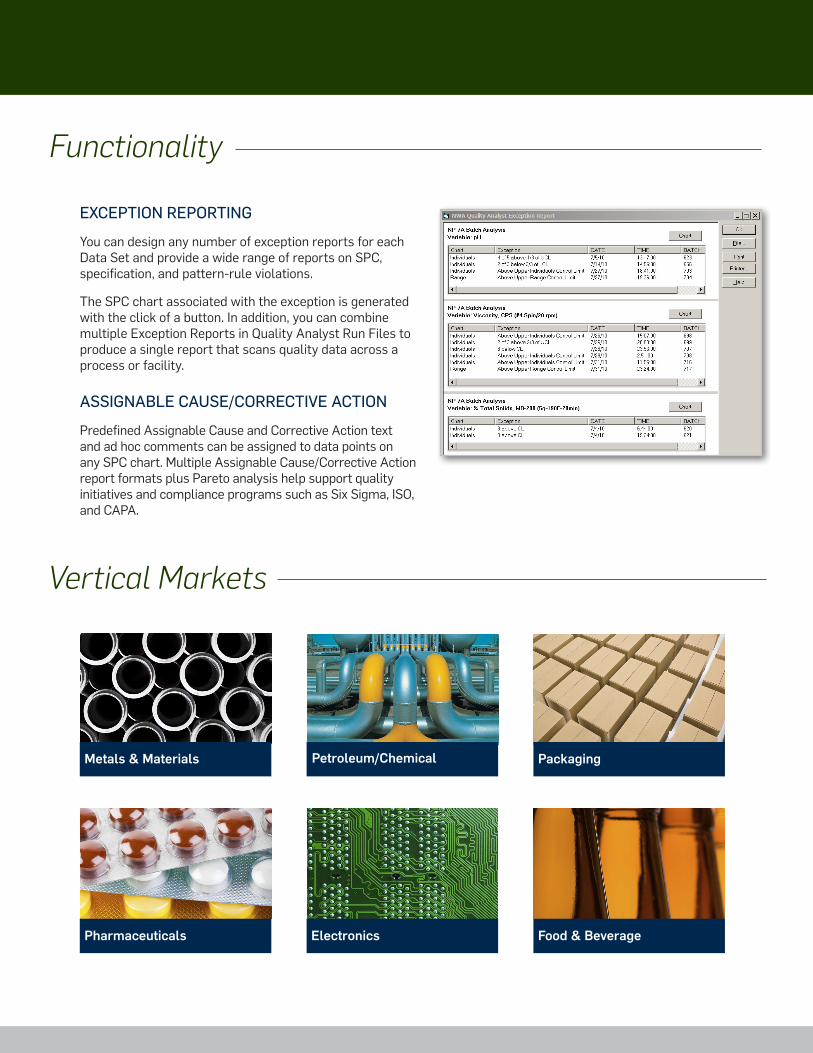
EXCEPTION REPORTING
You can design any number of exception reports for each Data Set and provide a wide range of reports on SPC, specification, and pattern-rule violations.
The SPC chart associated with the exception is generated with the click of a button. In addition, you can combine multiple Exception Reports in Quality Analyst Run Files to produce a single report that scans quality data across a process or facility.
ASSIGNABLE CAUSE/CORRECTIVE ACTION
Predefined Assignable Cause and Corrective Action text and ad hoc comments can be assigned to data points on any SPC chart. Multiple Assignable Cause/Corrective Action report formats plus Pareto analysis help support quality initiatives and compliance programs such as Six Sigma, ISO, and CAPA.
Vertical Markets
Functionality
Metals & Materials Petroleum/Chemical Packaging
Pharmaceuticals Electronics Food & Beverage

MULTIVARIATE ANALYSIS
NWA and Infometrix have partnered to create fully integrated multivariate modeling and SPC charting that overcomes many of the barriers to the adoption of multivariate process monitoring and improvement techniques. NWA Quality Analyst’s new multivari-ate SPC module, NWA MvSPC™, combines with Infometrix Pirouette® to simplify the data-collection, model-building, and deployment process for off-line and real-time applications.
• Real-time, multivariate SPC
• Fully integrated multivariate model building and SPC charting
• Easy connection to process and laboratory databases
• Simplified exchange of data and model defini-tions
• Hotelling’s T-squared and SPE charts
• One-click access to Contribution Charts, which identify important variables ranked by contribu-tion
• Full range of analysis and reporting capabilities
Optional Modules Extend the capabilities of NWA Quality Analyst with additional multivariate and stability/shelf-life analysis capabilities.
STABILITY/SHELF LIFE ANALYSIS
NWA Stability Analytics™ delivers the statistical analysis, charting, and reporting required for routine product-lot stability studies as described in the FDA/ICH guidelines.
This new module lets our Life Sciences users per-form standardized stability analysis using the same software that provides their laboratory method QA/QC charting, replacing what is typically a multi-ap-plication process, often performed by multiple staff.
• Meets FDA/ICH guidelines for stability analysis using ANCOVA
• Connects directly to LIMS and other study-man-agement systems
• Simplifies configuration and maintenance
• Standardizes workflow and reporting
• Provides comprehensive stability statistics and charting
• ANCOVA statistics
• Tests for poolability
• Predictions using:
• Pooled data
• Pooled slope
• Worst case
• Out-of-trend detection
• Residuals analysis
“I wanted software that was easy enough that the operators would be willing to use it for decision-making. NWA has all the SPC tools I want and it has exactly the easy-to-use interface I need.”
Clint Paisley, QA ManagerIams Company

For more information, call 888.NWA.SOFT or visit us at NWASOFT.COM
Copyright © Northwest Analytics, Inc. All rights reserved. Northwest Analytics, Inc. 111 SW 5th Avenue, Suite 800, Portland, OR 97204, USA. *Other names and brands may be claimed as the property of others.