Embed Size (px)
Citation preview
Connecting NWA Quality Analyst software to Agilent OpenLAB ECM Intelligent Reporter
Technical Note
AbstractStatistical Process Control (SPC) is a well-established element of ISO 9001 certified quality management systems. Northwest Analytics (NWA) Quality Analyst software offers advanced statistical functions to analyze chromatography data system (CDS) result data stored in Agilent OpenLAB ECM. This note describes how to setup an integration of NWA Quality Analyst software with OpenLAB ECM and OpenLAB ECM Intelligent Reporter.
IntroductionQuality assurance and quality improvement are important elements of ISO 9000 Quality management systems1. Statistical Process Control (SPC), Process capability and performance analysis, and regression analysis are important statistical techniques that help you achieve planned results and continually improve your production and lab processes2.
Agilent OpenLAB ECM Intelligent Reporter uses a result database that stores analytical quantitation results generated by Agilent OpenLAB CDS or Waters® Empower across multiple labs and across time ranges up to several years.
The Agilent Report Template Editor or SQL Server Report Builder allows you to generate method, instrument and/or compound specific result charts. Microsoft SQL server Reporting Services technology refreshes and publishes web-based reports in an unattended mode.
Software requirementsVisit http://www.nwasoft.com/products/nwa-quality-analyst to request a free trail copy of NWA Quality Analyst.
Data backend:Agilent OpenLAB ECM 3.4.1 with Agilent OpenLAB ECM Intelligent Reporter A.02.0x
Supported CDS systems:Agilent OpenLAB CDS rev. A.01.03 or higherWaters Empower 2 or 3
When developing new processes, or improving or troubleshooting existing processes you need to handle your data in a more interactive way and apply various statistical methods to find the most applicable one. By integrating OpenLAB ECM Intelligent Reporter with NWA Quality Analyst, you can quickly analyze data sets for meaningful insights.
This note describes how to connect NWA Quality Analyst® with Agilent OpenLAB ECM Intelligent Reporter. Some basic database administrator knowledge is required to execute these steps.
Examples reports are described in application note Statistical Process Analysis with NWA Quality Analyst software hosted by Agilent OpenLAB ECM Intelligent Reporter3
2
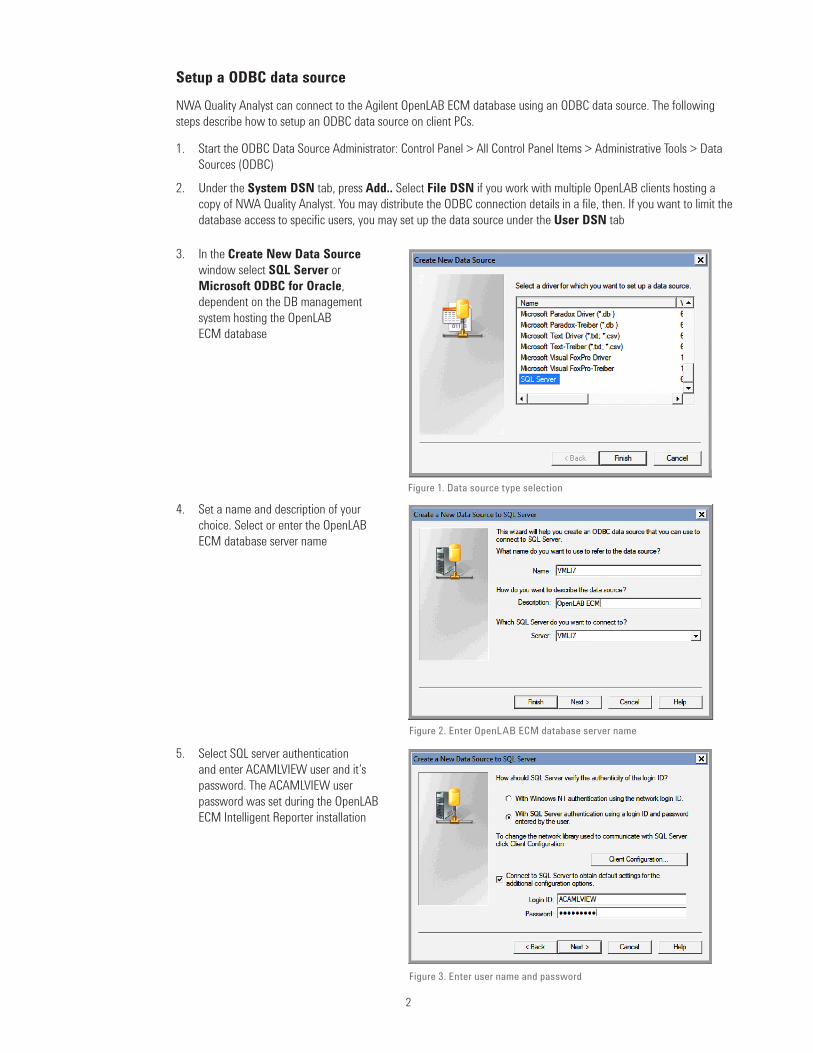
Setup a ODBC data sourceNWA Quality Analyst can connect to the Agilent OpenLAB ECM database using an ODBC data source. The following steps describe how to setup an ODBC data source on client PCs.
4. Set a name and description of your choice. Select or enter the OpenLAB ECM database server name
Figure 1. Data source type selection
Figure 3. Enter user name and password
Figure 2. Enter OpenLAB ECM database server name
5. Select SQL server authentication and enter ACAMLVIEW user and it’s password. The ACAMLVIEW user password was set during the OpenLAB ECM Intelligent Reporter installation
1. Start the ODBC Data Source Administrator: Control Panel > All Control Panel Items > Administrative Tools > Data Sources (ODBC)
2. Under the System DSN tab, press Add.. Select File DSN if you work with multiple OpenLAB clients hosting a copy of NWA Quality Analyst. You may distribute the ODBC connection details in a file, then. If you want to limit the database access to specific users, you may set up the data source under the User DSN tab
3. In the Create New Data Source window select SQL Server or Microsoft ODBC for Oracle, dependent on the DB management system hosting the OpenLAB ECM database
3
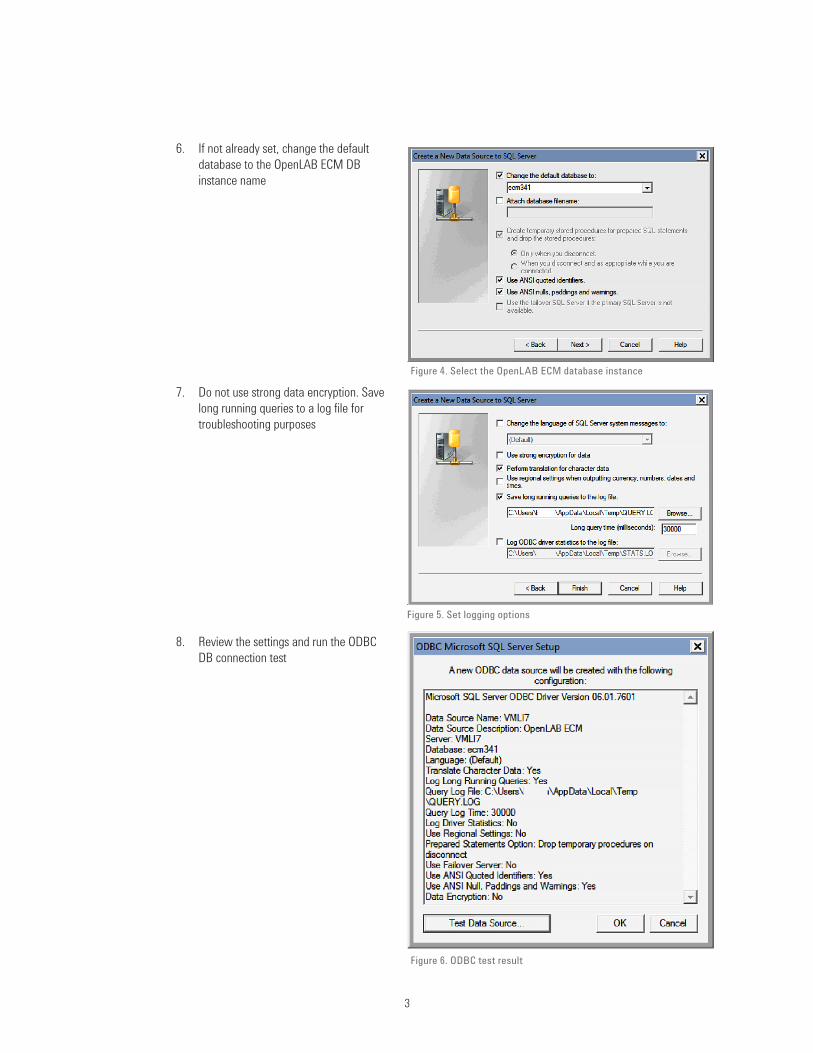
6. If not already set, change the default database to the OpenLAB ECM DB instance name
Figure 4. Select the OpenLAB ECM database instance
Figure 5. Set logging options
7. Do not use strong data encryption. Save long running queries to a log file for troubleshooting purposes
8. Review the settings and run the ODBC DB connection test
Figure 6. ODBC test result
4
Connecting Quality Analyst software to OpenLAB ECM Intelligent Reporter
The following steps require the presence of a configured ODBC data source.
Creation of a new data set Next steps need to be executed only one time. Once you have a good example query you could use it as a template for other queries.
Start Quality Analyst and select Create a new Data Set
• Select New External Database
• Choose Generic External database
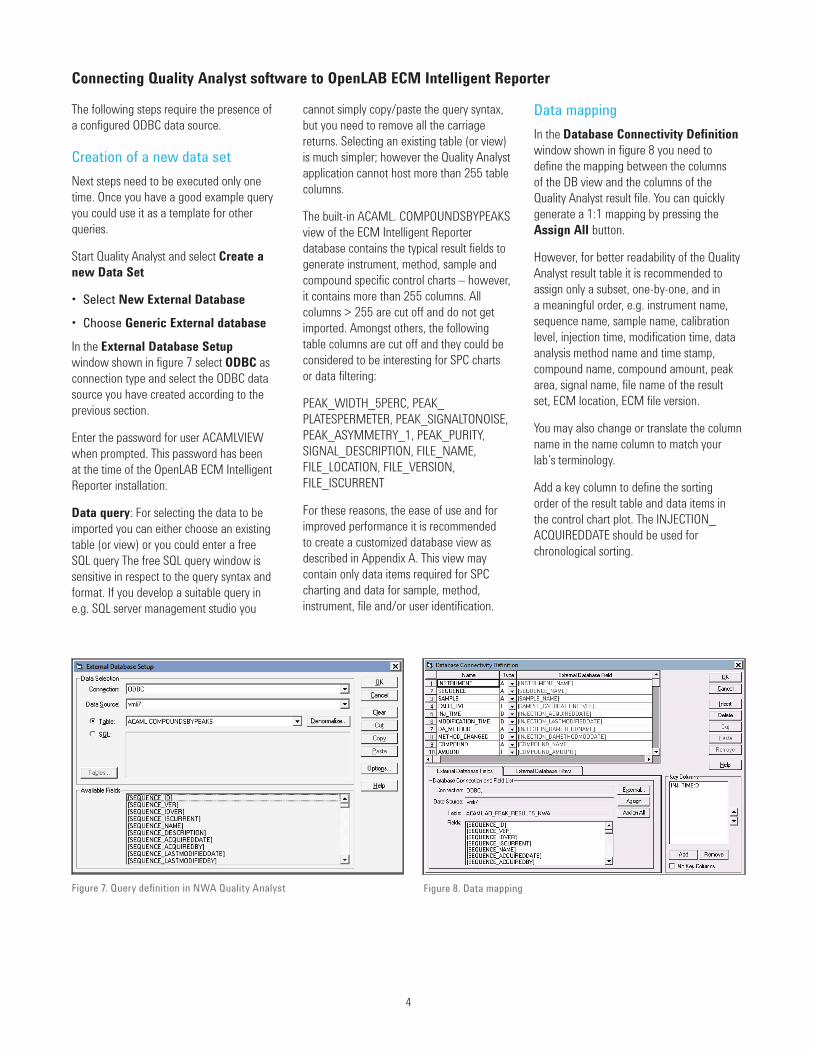
In the External Database Setup window shown in figure 7 select ODBC as connection type and select the ODBC data source you have created according to the previous section.
Enter the password for user ACAMLVIEW when prompted. This password has been at the time of the OpenLAB ECM Intelligent Reporter installation.
Data query: For selecting the data to be imported you can either choose an existing table (or view) or you could enter a free SQL query The free SQL query window is sensitive in respect to the query syntax and format. If you develop a suitable query in e.g. SQL server management studio you
cannot simply copy/paste the query syntax, but you need to remove all the carriage returns. Selecting an existing table (or view) is much simpler; however the Quality Analyst application cannot host more than 255 table columns.
The built-in ACAML. COMPOUNDSBYPEAKS view of the ECM Intelligent Reporter database contains the typical result fields to generate instrument, method, sample and compound specific control charts – however, it contains more than 255 columns. All columns > 255 are cut off and do not get imported. Amongst others, the following table columns are cut off and they could be considered to be interesting for SPC charts or data filtering:
PEAK_WIDTH_5PERC, PEAK_PLATESPERMETER, PEAK_SIGNALTONOISE, PEAK_ASYMMETRY_1, PEAK_PURITY, SIGNAL_DESCRIPTION, FILE_NAME, FILE_LOCATION, FILE_VERSION, FILE_ISCURRENT
For these reasons, the ease of use and for improved performance it is recommended to create a customized database view as described in Appendix A. This view may contain only data items required for SPC charting and data for sample, method, instrument, file and/or user identification.
Figure 7. Query definition in NWA Quality Analyst Figure 8. Data mapping
Data mappingIn the Database Connectivity Definition window shown in figure 8 you need to define the mapping between the columns of the DB view and the columns of the Quality Analyst result file. You can quickly generate a 1:1 mapping by pressing the Assign All button.
However, for better readability of the Quality Analyst result table it is recommended to assign only a subset, one-by-one, and in a meaningful order, e.g. instrument name, sequence name, sample name, calibration level, injection time, modification time, data analysis method name and time stamp, compound name, compound amount, peak area, signal name, file name of the result set, ECM location, ECM file version.
You may also change or translate the column name in the name column to match your lab’s terminology.
Add a key column to define the sorting order of the result table and data items in the control chart plot. The INJECTION_ACQUIREDDATE should be used for chronological sorting.
5
After defining the external database filter press OK to execute the query. The query returns a view similar to a sequence table of your CDS system including results the results of the compounds specified in the external database filter. Go to Edit > Database Connectivity Definition to do further fine tuning of the filter. Once you are satisfied with result selection SAVE your result in a Quality Analyst Data File (*.DAT) file.
During the save process you are asked to save the Database Connectivity Definition with the file. The connection details, query and filter are stored along with the *.DAT file in a *.NWH file. By simply double-clicking this file you can open the application, connect to the ECM database and load the most recent data of interest.
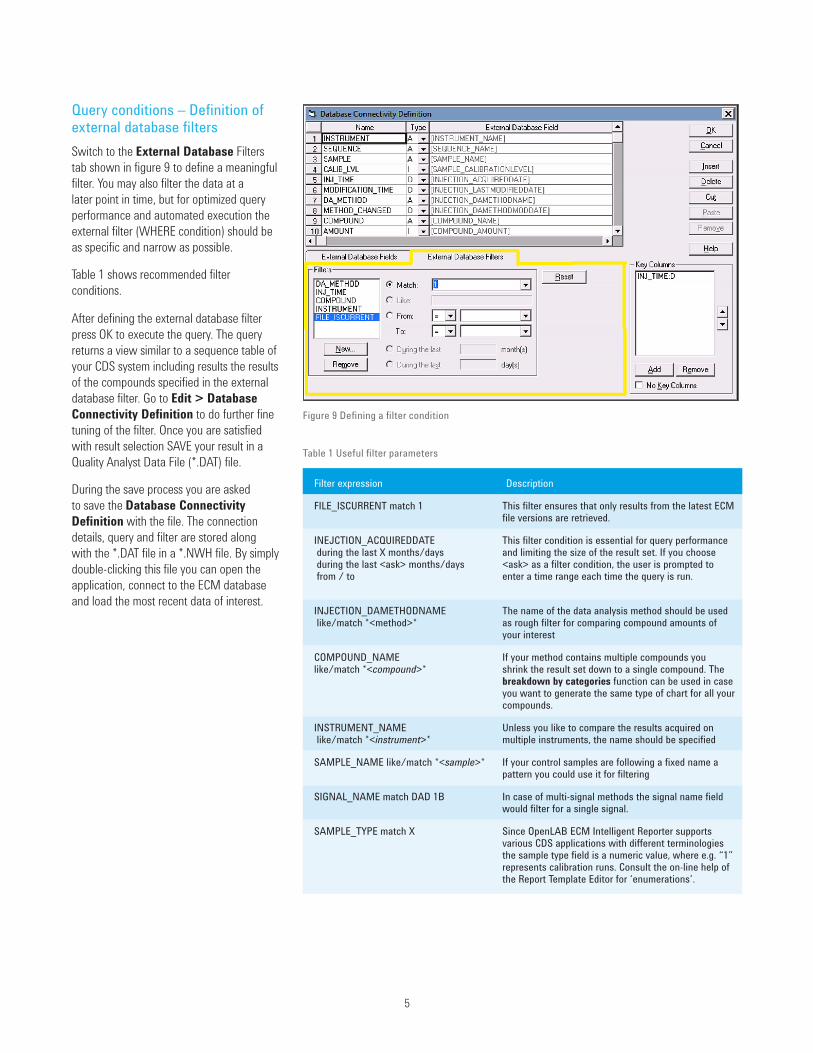
Query conditions – Definition of external database filters Switch to the External Database Filters tab shown in figure 9 to define a meaningful filter. You may also filter the data at a later point in time, but for optimized query performance and automated execution the external filter (WHERE condition) should be as specific and narrow as possible.
Table 1 shows recommended filter conditions.
Figure 9 Defining a filter condition
Table 1 Useful filter parameters
Filter expression Description
FILE_ISCURRENT match 1 This filter ensures that only results from the latest ECM file versions are retrieved.
INEJCTION_ACQUIREDDATE during the last X months/days during the last <ask> months/days from / to
This filter condition is essential for query performance and limiting the size of the result set. If you choose <ask> as a filter condition, the user is prompted to enter a time range each time the query is run.
INJECTION_DAMETHODNAME like/match *<method>*
The name of the data analysis method should be used as rough filter for comparing compound amounts of your interest
COMPOUND_NAME like/match *<compound>*
If your method contains multiple compounds you shrink the result set down to a single compound. The breakdown by categories function can be used in case you want to generate the same type of chart for all your compounds.
INSTRUMENT_NAME like/match *<instrument>*
Unless you like to compare the results acquired on multiple instruments, the name should be specified
SAMPLE_NAME like/match *<sample>* If your control samples are following a fixed name a pattern you could use it for filtering
SIGNAL_NAME match DAD 1B In case of multi-signal methods the signal name field would filter for a single signal.
SAMPLE_TYPE match X Since OpenLAB ECM Intelligent Reporter supports various CDS applications with different terminologies the sample type field is a numeric value, where e.g. “1” represents calibration runs. Consult the on-line help of the Report Template Editor for ‘enumerations’.
6
Table 2. Example script for automated result query and chart generation
Command Comment
USETEMPDIR ON USETEMPDIR is intended to be used when more than one Quality Analyst user might access the same Connectivity Data Set stored in a shared location. This command makes sure that all such users are working with their own local copies of the retrieved data.
When USETEMPDIR is ON, the CONNECT command copies the Header file from the old current directory into the new temporary directory, then retrieves data from the database into a Data file in the temporary directory. All charting commands in the Run file look in the current directory, which has been changed to the new temporary directory.
SetCurrentDir “E:\Program Files\QA” The SetCurrentDir Run file command lets you specify a file path that the Run File Interpreter will use as the current directory with file names that do not have paths specified. This local path needs to host the .NWH required for the database connection. If the .RUN file should be accessible from multiple ECM clients, this path needs to be used on all clients and it needs to host the latest versions of the .NWH files.
CONNECT XSRMDA_Tramadol.DAT The CONNECT command establishes a connection to an external database. Although the database connection is stored in the NWH file, you can use the connect command only with .DAT file extension.
XRS XSRMDA_Tramadol.DAT AMOUNT X R G $BREAKDOWN=”SAMPLE”
The XRS command creates a Graphics file containing an X-bar, X-bar and Range, or X-bar and Standard Deviation chart. For the ease-of-use this part of the script should be generated using the Run File Wizard.
CHART The CHART command displays an existing Graphics file on the screen
Using the run file wizard to automate the chart generation Quality Analyst software comes along with a Run File Wizard helping users to write scripts for automated chart generation. It offers a full series of functions to start statistical analysis and chart generation. Some basic file operations are not part of the wizard, but need be added in a text editor. The Quality Analyst User’s manual contains a list of all available command and various examples of their use.
Table 2 shows an example of a very useful and simple 5 line script.
7
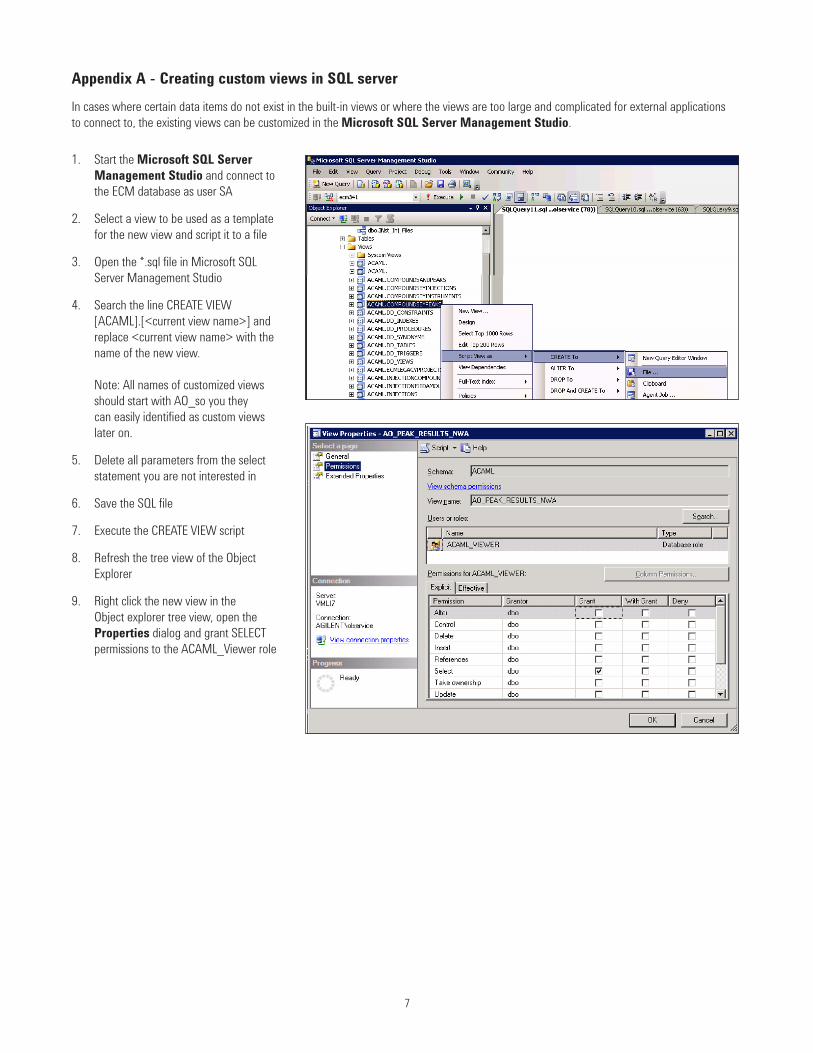
Appendix A - Creating custom views in SQL serverIn cases where certain data items do not exist in the built-in views or where the views are too large and complicated for external applications to connect to, the existing views can be customized in the Microsoft SQL Server Management Studio.
1. Start the Microsoft SQL Server Management Studio and connect to the ECM database as user SA
2. Select a view to be used as a template for the new view and script it to a file
3. Open the *.sql file in Microsoft SQL Server Management Studio
4. Search the line CREATE VIEW [ACAML].[<current view name>] and replace <current view name> with the name of the new view. Note: All names of customized views should start with AO_so you they can easily identified as custom views later on.
5. Delete all parameters from the select statement you are not interested in
6. Save the SQL file
7. Execute the CREATE VIEW script
8. Refresh the tree view of the Object Explorer
9. Right click the new view in the Object explorer tree view, open the Properties dialog and grant SELECT permissions to the ACAML_Viewer role
References1. International Organization for Standardization ISO 9000:2005: Quality management
systems - Fundamentals and vocabulary, 2. International Organization for Standardization ISO/TR 10017:2003: Guidance on statistical
techniques for ISO 9001:2000 3. Agilent Technologies, Statistical Process Analysis with NWA Quality Analyst software
hosted by Agilent OpenLAB ECM Intelligent Reporter, 2014, (P/N 5991-5440EN)
www.agilent.com/chem/openlabFor research use only. Not for use in diagnostic procedures. This information is subject to change without notice.
© Agilent Technologies, Inc., 2015Published in USA, January 23, 2015Publication Number 5991-5439EN