Embed Size (px)
Citation preview
AGENCY COSTS AND CORPORATE PERFORMANCE :
ANALYSIS OF PUBLIC LISTED COMPANIES IN
BURSA MALAYSIA
NUR SYUHADA WAHIDA BINTI OSMAN
MASTER OF SCIENCE (BANKING)
UNIVERSITI UTARA MALAYSIA
DECEMBER 2014
iii
Permission to Use
In presenting this dissertation/ project paper in partial fulfillment of the
requirements for a Post Graduate Degree from the Universiti Utara Malaysia
(UUM), I agree that the Library of this university may make it freely available for
inspection. I further agree that permission for copying this dissertation/project
paper in any manner, in whole or in part, for scholarly purposes may be granted
by my supervisor or in their absence, by the Dean of Othman Yeop Abdullah
Graduate School of Business where I did my dissertation/ project paper. It is
understood that any copying or publication or use of this dissertation/ project
paper parts of it for financial gain shall be allowed without my written
permission. It is also understood that due recognition shall be given to me and to
the UUM in any scholarly use which may be made of any materials in my
dissertation/project paper.
Request for permission to copy or to make other use of materials in this
dissertation/ project paper in whole or in part should be addressed to:
Dean of Othman Yeop Abdullah Graduate School of Business
Universiti Utara Malaysia
06010 UUM Sintok
Kedah Darul Aman
iv
Abstract
The agency theory is one of the company’s theories in a way that company is
explained as a set of contractual explicit of implicit relationships between
principal (shareholders) and agent (management). The role of second party is to
perform certain tasks and authorized to make decisions on behalf of the first
party. Meanwhile corporate performance is very crucial for market efficiency
since it will influenced the decision made by the market players and internal
investors of the Companies. This study examines the relationship of agency costs
with corporate performance. Five variables of agency costs proxies are analysed:
Debt Ratio, Firm’s size, Growth, Expense and Efficiency. While the corporate
performance is measured by Return on Assets (ROA) and Return on Equity
(ROE) . ROA gives an idea as to how efficient management is at using its assets
to generate earnings while ROE measures a corporation’s profitability by
revealing how much profit a company generates with the money shareholders
have invested. Besides, this study examined whether there are any correlation
between agency costs which is proxied by Debt Ratio, Firm’s size, Growth,
Expense and Efficiency Ratio; against Corporate Performance for the Top 50 and
Bottom 50 Public Listed Companies in Bursa Malaysia. This study used
secondary data which is the data from Public Listed Companies in Bursa
Malaysia. From the total 814 population, the 100 sample was taken from
different categories which is the Top 50 and the Bottom 50 companies covering
over period of 5 years from 2008 to 2012. It is found that for a certain extent, the
Agency costs play an important roles in relation to the Corporate
Performance.The result gathered after analyzing the data acquired from Bursa
Malaysia explained that only Firm’s size, Expense and Efficiency Ratio has the
relationship with the significant value of 0.000. Debt ratio and growth variables
was not significant with Corporate Performance.
Keywords: corporate performance, market players, agency costs, corporation’s
profitability.
v
Abstrak
Teori agensi adalah salah satu teori syarikat dengan cara syarikat dijelaskan
sebagai satu set kontrak yang jelas mengenai hubungan tersirat antara prinsipal
(pemegang saham) dan ejen (pengurusan). Peranan pihak kedua adalah untuk
melaksanakan tugas-tugas tertentu dan kuasa untuk membuat keputusan bagi
pihak yang pertama. Manakal prestasi korporat adalah sangat penting untuk
kecekapan pasaran kerana ia akan mempengaruhi keputusan yang dibuat oleh
peserta-peserta pasaran dan pelabur dalaman Syarikat. Kajian ini mengkaji
hubungan antara kos agensi dengan prestasi korporat. Lima pembolehubah proksi
bagi kos agensi dianalisis: Nisbah Hutang, saiz firma ,Pertumbuhan, Nisbah
Perbelanjaan dan Kecekapan. Manakala prestasi korporat diukur dengan Pulangan
atas Aset (ROA) dan Pulangan ke atas ekuiti (ROE). ROA memberi idea tentang
bagaimana cekap pengurusan adalah dengan menggunakan aset untuk menjana
pendapatan manakala ROE mengukur keuntungan syarikat dengan mendedahkan
berapa banyak keuntungan syarikat dapat dijana menggunakan wang yang telah
dilaburkan oleh pemegang-pemegang saham. Selain itu, kajian ini meneliti sama
ada terdapat hubungan antara kos agensi yang diproksikan oleh Nisbah Hutang,
firma saiz, Pertumbuhan, Nisbah Perbelanjaan dan Kecekapan; terhadap Prestasi
Korporat untuk syarikat awam pada kedudukan 50 tertinggi dan 50 yang terbawah
yang tersenarai di Bursa Malaysia. Kajian ini menggunakan data sekunder yang
merupakan data dari Syarikat Awam tersenarai di Bursa Malaysia. Dari jumlah
814 populasi, 100 contoh telah dipilih dari kategori yang berbeza iaitu syarikat
awam pada kedudukan 50 tertinggi dan 50 yang terbawah yang meliputi tempoh 5
tahun iaitu dari tahun 2008 hingga 2012. Ia didapati untuk tahap tertentu, Kos
Agensi memainkan peranan penting berhubung dengan prestasi Korporat. Hasil
kajian setelah menganalsis data yang yang diperolehi daripada Bursa Malaysia
menjelaskan bahawa hanya firma saiz, Nisbah Perbelanjaan dan Kecekapan
mempunyai hubungan dengan nilai signifikan 0.000. Nisbah hutang dan
pembolehubah pertumbuhan tidak ketara dengan Prestasi Korporat.
Kata kunci: Prestasi Korporat, peserta pasaran, kos agensi, keuntungan
perbadanan.

vi
Acknowledgement
I would like to thank my supervisor, Dr Ahmad Rizal Mazlan, for his tireless
support, encouragement, feedback, supervision, useful suggestion and
constructive criticism throughtout this research work. His moral support,
continuos guidance, and importantly endless patience towards me have enabled
me to complete my work succesfully.
I am also thankful to Universiti Utara Malaysia (UUM) for giving me the
opportunity to pursue Master of Science (Banking). Besides, my special
appreciation goes to all my lecturers for their guidance and encouragement to
acquire the beneficial knowledge in this field.
Finally, I would like to express my sincere thanks to my beloved parent and
family members for their support throughout my life; as well as to all my fellow
classmates and friends who assisted and encouraged me during my years of study
in UUM.
vii
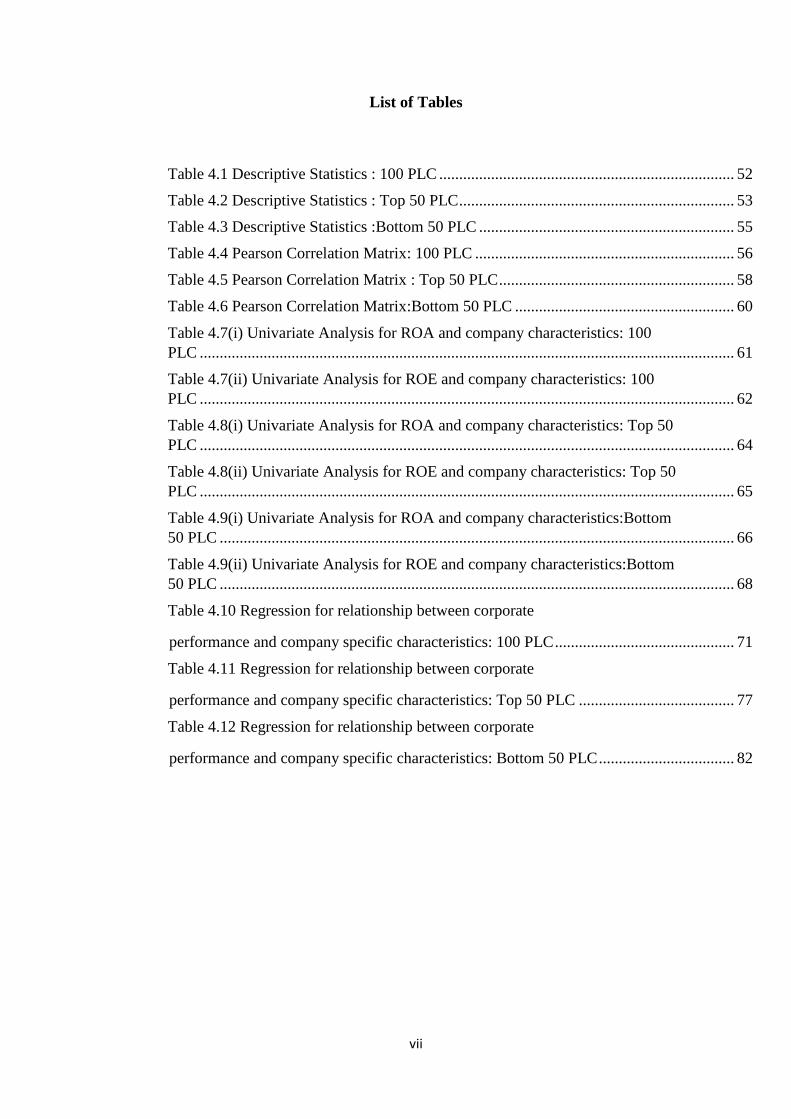
List of Tables
Table 4.1 Descriptive Statistics : 100 PLC .......................................................................... 52
Table 4.2 Descriptive Statistics : Top 50 PLC ..................................................................... 53
Table 4.3 Descriptive Statistics :Bottom 50 PLC ................................................................ 55
Table 4.4 Pearson Correlation Matrix: 100 PLC ................................................................. 56
Table 4.5 Pearson Correlation Matrix : Top 50 PLC ........................................................... 58
Table 4.6 Pearson Correlation Matrix:Bottom 50 PLC ....................................................... 60
Table 4.7(i) Univariate Analysis for ROA and company characteristics: 100
PLC ...................................................................................................................................... 61
Table 4.7(ii) Univariate Analysis for ROE and company characteristics: 100
PLC ...................................................................................................................................... 62
Table 4.8(i) Univariate Analysis for ROA and company characteristics: Top 50
PLC ...................................................................................................................................... 64
Table 4.8(ii) Univariate Analysis for ROE and company characteristics: Top 50
PLC ...................................................................................................................................... 65
Table 4.9(i) Univariate Analysis for ROA and company characteristics:Bottom
50 PLC ................................................................................................................................. 66
Table 4.9(ii) Univariate Analysis for ROE and company characteristics:Bottom
50 PLC ................................................................................................................................. 68
Table 4.10 Regression for relationship between corporate
performance and company specific characteristics: 100 PLC ............................................. 71
Table 4.11 Regression for relationship between corporate
performance and company specific characteristics: Top 50 PLC ....................................... 77
Table 4.12 Regression for relationship between corporate
performance and company specific characteristics: Bottom 50 PLC .................................. 82
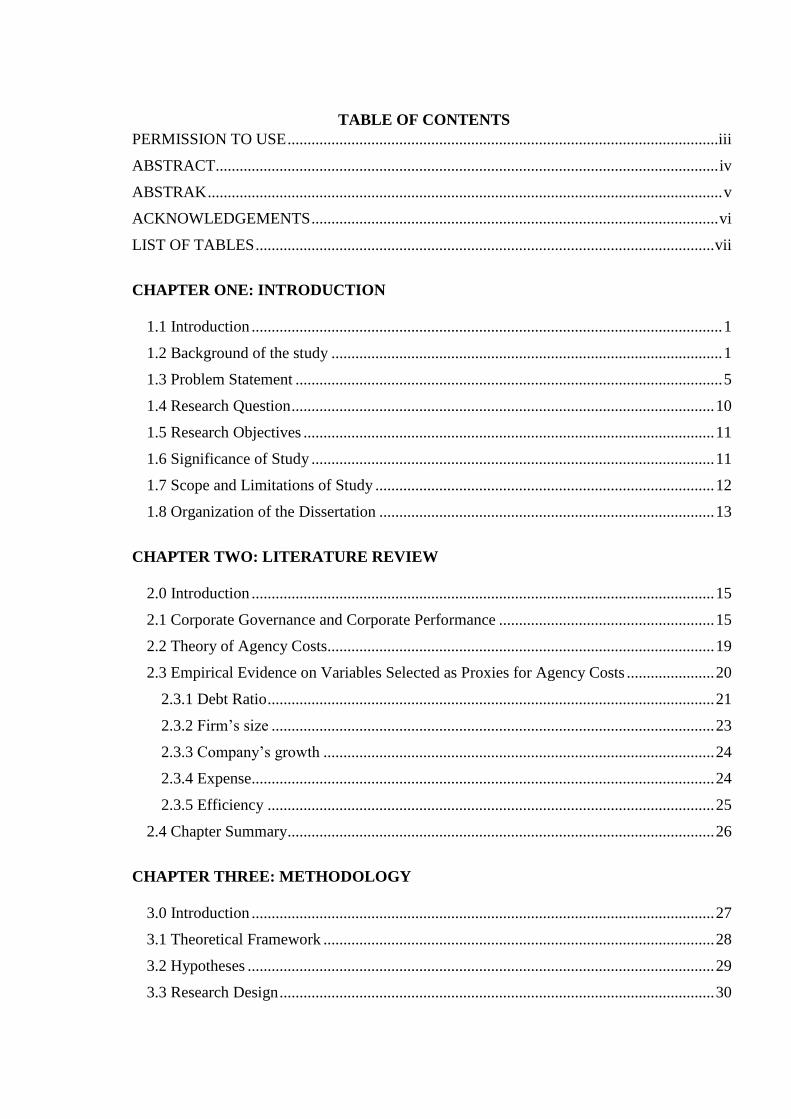
TABLE OF CONTENTS
PERMISSION TO USE ............................................................................................................iii
ABSTRACT .............................................................................................................................. iv
ABSTRAK ................................................................................................................................. v
ACKNOWLEDGEMENTS ...................................................................................................... vi
LIST OF TABLES ................................................................................................................... vii
CHAPTER ONE: INTRODUCTION
1.1 Introduction ...................................................................................................................... 1
1.2 Background of the study .................................................................................................. 1
1.3 Problem Statement ........................................................................................................... 5
1.4 Research Question .......................................................................................................... 10
1.5 Research Objectives ....................................................................................................... 11
1.6 Significance of Study ..................................................................................................... 11
1.7 Scope and Limitations of Study ..................................................................................... 12
1.8 Organization of the Dissertation .................................................................................... 13
CHAPTER TWO: LITERATURE REVIEW
2.0 Introduction .................................................................................................................... 15
2.1 Corporate Governance and Corporate Performance ...................................................... 15
2.2 Theory of Agency Costs................................................................................................. 19
2.3 Empirical Evidence on Variables Selected as Proxies for Agency Costs ...................... 20
2.3.1 Debt Ratio ................................................................................................................ 21
2.3.2 Firm’s size ............................................................................................................... 23
2.3.3 Company’s growth .................................................................................................. 24
2.3.4 Expense .................................................................................................................... 24
2.3.5 Efficiency ................................................................................................................ 25
2.4 Chapter Summary ........................................................................................................... 26
CHAPTER THREE: METHODOLOGY
3.0 Introduction .................................................................................................................... 27
3.1 Theoretical Framework .................................................................................................. 28
3.2 Hypotheses ..................................................................................................................... 29
3.3 Research Design ............................................................................................................. 30
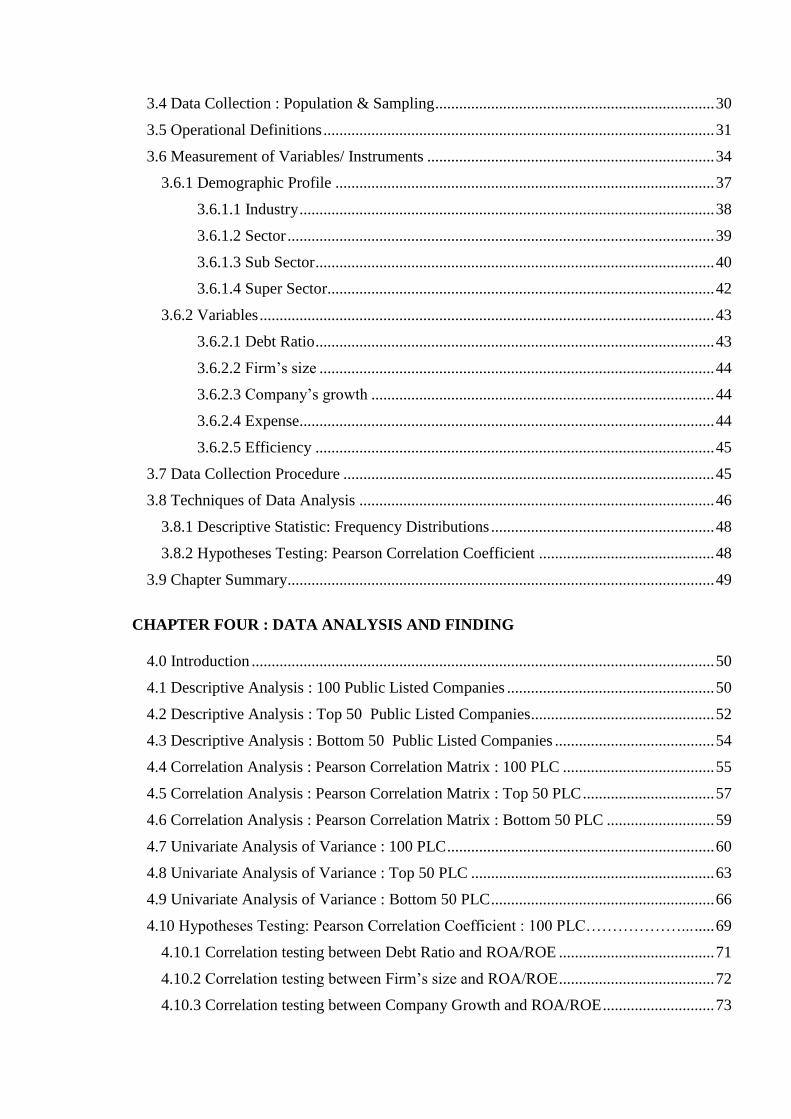
3.4 Data Collection : Population & Sampling ...................................................................... 30
3.5 Operational Definitions .................................................................................................. 31
3.6 Measurement of Variables/ Instruments ........................................................................ 34
3.6.1 Demographic Profile ............................................................................................... 37
3.6.1.1 Industry ........................................................................................................ 38
3.6.1.2 Sector ........................................................................................................... 39
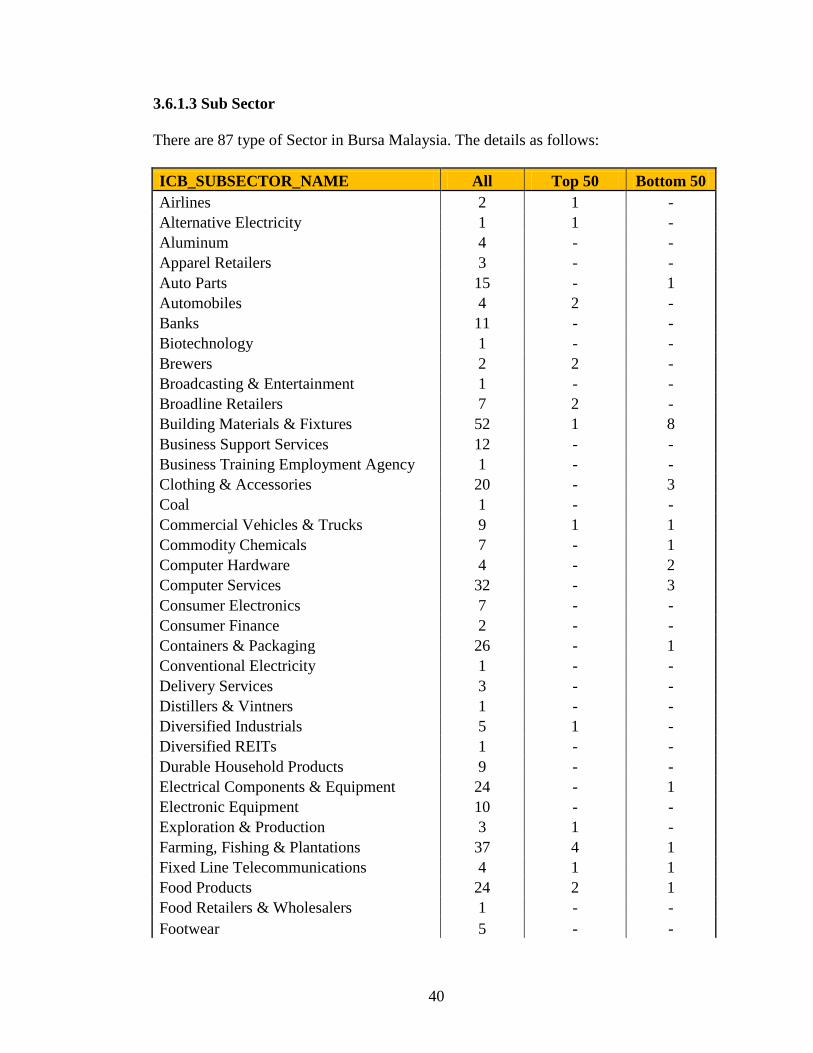
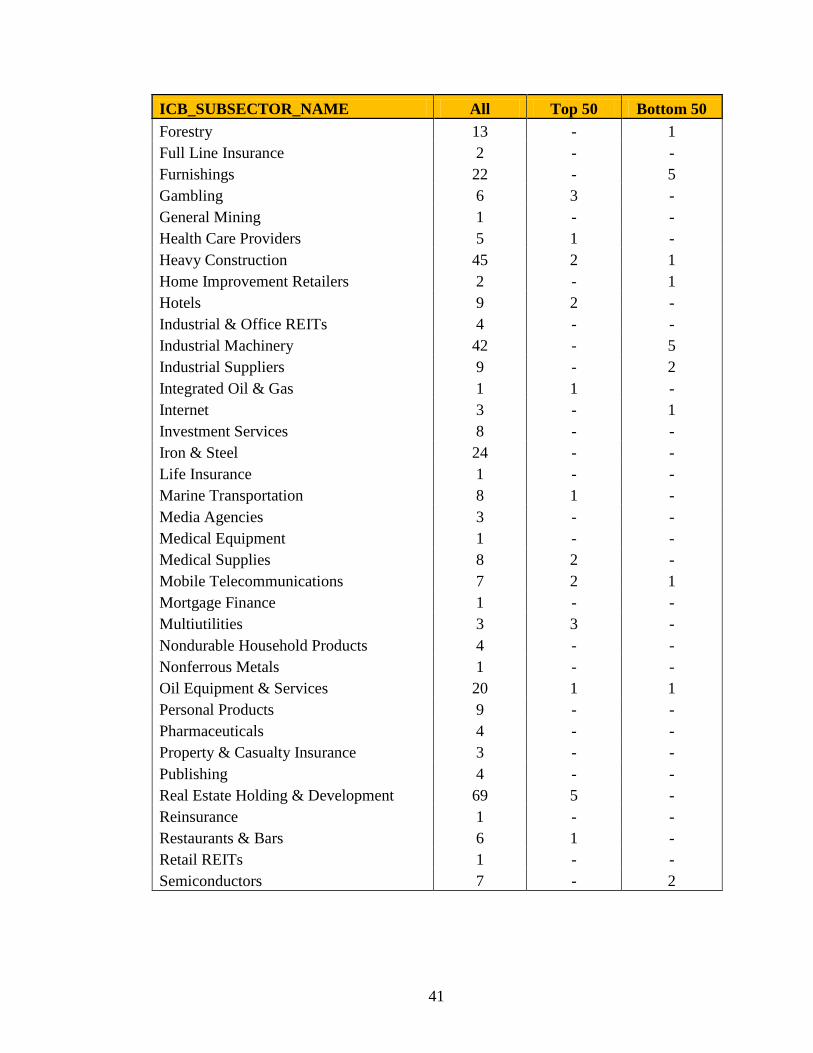
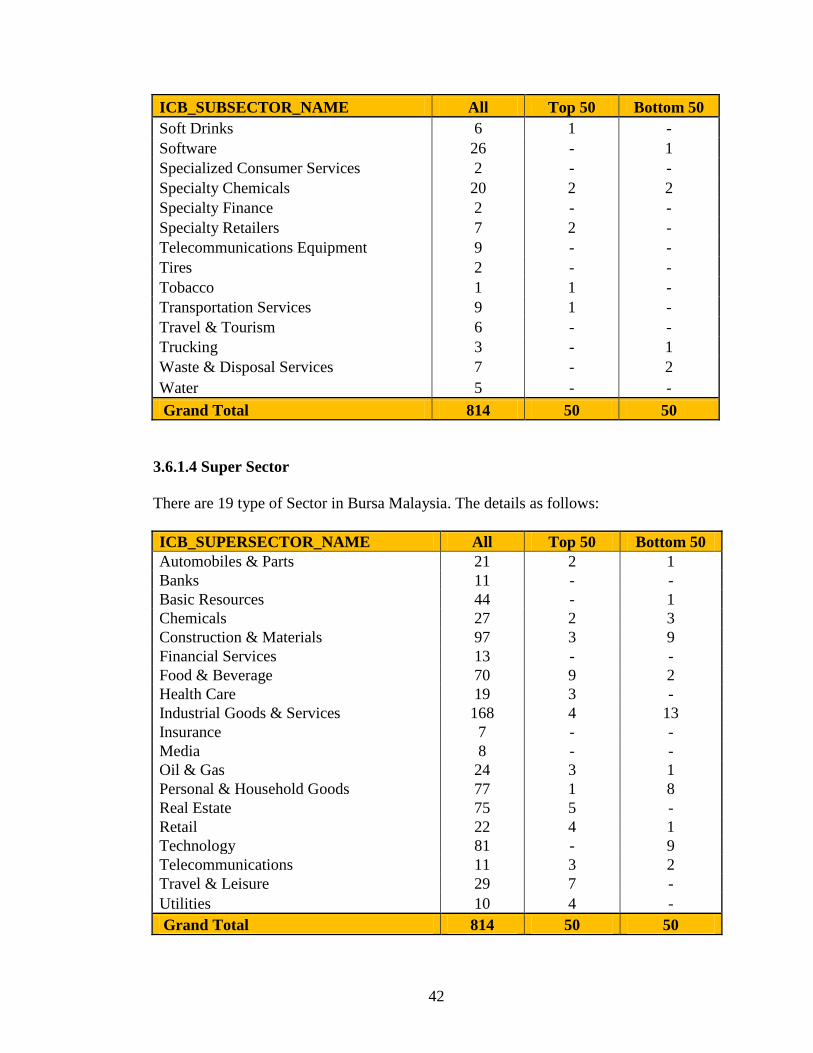
3.6.1.3 Sub Sector .................................................................................................... 40
3.6.1.4 Super Sector ................................................................................................. 42
3.6.2 Variables .................................................................................................................. 43
3.6.2.1 Debt Ratio .................................................................................................... 43
3.6.2.2 Firm’s size ................................................................................................... 44
3.6.2.3 Company’s growth ...................................................................................... 44
3.6.2.4 Expense ........................................................................................................ 44
3.6.2.5 Efficiency .................................................................................................... 45
3.7 Data Collection Procedure ............................................................................................. 45
3.8 Techniques of Data Analysis ......................................................................................... 46
3.8.1 Descriptive Statistic: Frequency Distributions ........................................................ 48
3.8.2 Hypotheses Testing: Pearson Correlation Coefficient ............................................ 48
3.9 Chapter Summary ........................................................................................................... 49
CHAPTER FOUR : DATA ANALYSIS AND FINDING
4.0 Introduction .................................................................................................................... 50
4.1 Descriptive Analysis : 100 Public Listed Companies .................................................... 50
4.2 Descriptive Analysis : Top 50 Public Listed Companies .............................................. 52
4.3 Descriptive Analysis : Bottom 50 Public Listed Companies ........................................ 54
4.4 Correlation Analysis : Pearson Correlation Matrix : 100 PLC ...................................... 55
4.5 Correlation Analysis : Pearson Correlation Matrix : Top 50 PLC ................................. 57
4.6 Correlation Analysis : Pearson Correlation Matrix : Bottom 50 PLC ........................... 59
4.7 Univariate Analysis of Variance : 100 PLC ................................................................... 60
4.8 Univariate Analysis of Variance : Top 50 PLC ............................................................. 63
4.9 Univariate Analysis of Variance : Bottom 50 PLC ........................................................ 66
4.10 Hypotheses Testing: Pearson Correlation Coefficient : 100 PLC………………... ..... 69
4.10.1 Correlation testing between Debt Ratio and ROA/ROE ....................................... 71
4.10.2 Correlation testing between Firm’s size and ROA/ROE ....................................... 72
4.10.3 Correlation testing between Company Growth and ROA/ROE ............................ 73
4.10.4 Correlation testing between Expense and ROA/ROE ........................................... 74
4.10.5 Correlation testing between Efficiency and ROA/ROE ........................................ 74
4.11 Hypotheses Testing: Pearson Correlation Coefficient : Top 50 PLC………………... 75
4.11.1 Correlation testing between Debt Ratio and ROA/ROE ....................................... 77
4.11.2 Correlation testing between Firm’s size and ROA/ROE ....................................... 78
4.11.3 Correlation testing between Company Growth and ROA/ROE ............................ 78
4.11.4 Correlation testing between Expense and ROA/ROE ........................................... 79
4.11.5 Correlation testing between Efficiency and ROA/ROE ........................................ 80
4.12 Hypotheses Testing: Pearson Correlation Coefficient : Bottom 50 PLC…………... .. 81
4.12.1 Correlation testing between Debt Ratio and ROA/ROE ....................................... 83
4.12.2 Correlation testing between Firm’s size and ROA/ROE ....................................... 83
4.12.3 Correlation testing between Company Growth and ROA/ROE ............................ 84
4.12.4 Correlation testing between Expense and ROA/ROE ........................................... 85
4.12.5 Correlation testing between Efficiency and ROA/ROE ........................................ 85
4.13 Chapter Summary ......................................................................................................... 86
CHAPTER FIVE: CONCLUSION AND RECOMMENDATIONS
5.0 Introduction .................................................................................................................... 87
5.1 Finding and Discussion .................................................................................................. 87
5.2 Summary of major findings ........................................................................................... 90
5.3 Implication of the study ................................................................................................. 90
5.4 Theoritical & Practical of the study ............................................................................... 91
5.5 Recommendation for Future Study ................................................................................ 92
5.6 Conclusion...................................................................................................................... 93
REFERENCES ........................................................................................................................ 94
LIST OF APPENDIXES ....................................................................................................... 103
1
CHAPTER ONE
INTRODUCTION
1.1 Introduction
This study examines the relationship between Agency costs and Corporate Performance
in Malaysia. Many empirical studies examining the relationship between ownership
structure and company value in the Asia, Eastern Europe and USA, have on the whole
produced inconclusive results (Claessens and Djankov, 1998; Himmelberg et al., 1999;
Morck et al., 2000; Nagar, 2000; Demsetz and Villalonga, 2001; Wiwattanakantang,
2001). One explanation offered is that ownership structure would not have any
systematic impact on company value as long as managers maximise shareholders’values
(Demsetz and Villalonga,2001). However, normally the things that often overlooked is
the pathways through which effects of corporate ownership are diffused throughout the
corporate environment.
1.2 Background of the study
The relationship of ownership structure and company value needs to be examined in
conjunction with key elements of a company’s operating environment, such as socio-
economic policies, governmental intervention, law and regulations that influence the
company’s performance. This study develops an integrated model that attempts to
explain how company performance can be affected when different ownership types
2
utilise different modes of ownership structures and ownership concentration as
governance and controlling mechanisms to safeguard their own interests. The result can
be shown directly through financial performance reports and the market position in
Bursa Malaysia (Top 50 and Bottom 50). This study will look beyond nominal
ownership concentration by showing how ownership concentration’s motivation
reflected by the company’s financial performance might differ among major ownership
types in Malaysian companies.
The agency theory is one of the company’s theories in a way that company is explained
as a set of contractual explicit of implicit relationships between principal (shareholders)
and agent (management). The role of second party is to perform certain tasks and
authorized to make decisions on behalf of the first party. There are several key
hypotheses in relation to this relationships (Kim and Nofsinger, 2007; Moldoveanu and
Martin, 2001; La Porta et al. 2000; Hill and Jones, 1992; Eisenhardt, 1989):
1) A person characterized by awareness and diligence namely “the Management”
that understand their interests, hence they seek to maximize their expected
benefits which in turn, will determine their behaviours and decisions.
2) Usually the management would like to seeks for maximization of their benefits
even if at the account of shareholders. At this point, to reduce the opportunities
of interest conflict at the minimum level, some mechanisms are needed.
3) Despite having the recognition of interest conflict between both parties, there
still have the recognition of common positive effects between them which is
focusing on ensuring the success and continuation of the company.
3
In fact, the Agency Theory investigates the behaviours and economies of the function of
both parties governed by 4 rules;
1) Analysis of economic within the Companies;
2) Analysis of behavioral of that manage the Companies;
3) Analysis of accounting for agency cost as an inevitable result of conflict between
managements and shareholders;
4) Contract’s legal analysis, that supposed to be done between all parties to solve
problems.
(Chen and Fang, 2011)
While Jensen and Meckling (1976) has demonstrate, within the framework of
management and shareholders’ behaviours, the shareholders delegate the task to the
managements to play the role of being representative to negotiate with all concerned
parties on their behalf and manage the available company’s financial resources to
reaches positive outputs exceeding the opportunity cost in which those resources could
be utilized and maximized the shareholders’ wealth.
They explained that when management is represented by the company’s only owner,
there is no conflict of interests in such a case is achieved in its most acceptable form,
where it will lead to the compatibility of interest between the shareholders and the
managements. However, when the company’s capital is fragmented over a number of
shareholders, there is a need for reliance on outside managerial expertise out of
shareholders, hence this will raise the concern of shareholders’ interests, primarily
4
when the absence of the right for management to get cash flows achieved from its
outstanding performance of the company’s resources only of the agreed upon extent.
In regards to cash flow which explained the differences between management control
rights and those of shareholders, the management may deviate from its functional
behavior from the perspective of shareholders’ wealth maximization through decision
making to increase their own benefit and spoil the shareholders’ interest, particularly
pertaining their residual claims represented by net cash flows remaining from net
liquidation, or from outcomes of performance, from one side; Subsequently it will
increase their exposure level to business risks by reason there is a gap between the
external cash flows agreed upon with management and the projected cash flows of the
available resources, on the other hand, which means the existence of interests conflict
relates to agency problem which can be enshrined by managerial opportunism practices
by exploiting the rewards and incentives system, or fostering management goodwill by
the freedom granted to choose among alternative accounting policies within the
intelligent disclosure of performance framework that ensures employment stability and
achieves direct and indirect benefits. This agency problem associated with the forego
revenues on part of shareholders and the high expenditures by managers due to
involvement in non-profitable investments by shareholders. (Jensen, 2008; Zhao-guo et
al. 2007).
In addition, Ang et. Al (2000) said that the vigilance of the non-managing shareholders
and other related third parties such as company’s bankers may determine the monitoring
5
of managers’ expenditures on perquisites and other personal consumption. The
presence of the dominant shareholders may offset both weaknesses, if any, which is the
insufficient of external market for shares and insufficient of specific operational
knowledge for non-managing shareholders. Furthermore, the banks could be given
special role in delegated monitoring on behalf of other shareholders in a situation of
heavy reliance of the non-publicly traded firms on bank financing. As such, it seems that
there is empirical issue on determination of agency cost size for these firms.
In this study we examine the underlying assumption that debt ratio changes, firm’s size
changes, growth changes, expense ratio changes, and efficiency ratio changes are
independent. A good measure of the company’s performance is Return on Assets (ROA)
and Return on Equity (ROE).
1.3 Problem Statement
When compared to publicly traded firms, small business come closest to the type of
firms depicted in the stylized theoretical model of agency costs developed by Jensen and
Meckling (1976). At one extreme of ownership and management structures are firms
whose managers own 100 percent of the firm. These firms, by their definition, have no
agency costs. At the other extreme are firms whose managers are paid employees with
no equity in the firm. In between are firms where the managers own some, but not all, of
their firm’s equity.
6
Armour, Hansmann, Kraakman, 2009 explained that corporate law performs 2 general
functions as follows:
1) It establishes corporate form structure and its supported ancillary housekeeping
rules;
2) It attempts to control interest conflicts among corporate constituencies, such as
top managers and controlling shareholders namely as ‘corporate insiders’ and the
minority shareholders or creditors namely as ‘outsiders’.
These conflicts have the criterias of what economists refer to, so called the agency
problem or principl-agent problem. For those not familiar with the economist’s jargon,
agency problems arised whenever the action taken by one party namely agent will
influence the welfare of another party namely principal, whereby the problem occurs in
motivating the agent to act according to the interest of principal rather than simply in the
interest of the agent. Generally, the agency arised in a broad contexts range that goes
beyond those that formally be classified as agency relationship.
Primarily, almost any contractual relationship is potentially subject to an agency
problem in which the agent promises performance to the principal. The information
about the relevant facts that the agent has is usually better than does the principal.
Hence, the main difficulty is to assure the performance of the agent is precisely what
was promised. Consequently, the agent has an incentive to act opportunistically, stint on
his performance’s quality, or diverting to himself some of what was promised to the
7
principal. This means that as a consequence, the value of the agent’s performance to the
principal will be dropped, either directly or because, the principal must bear monitoring
cost to ensure the agent performance’s quality. As a result, it can be concluded that the
greater the tasks complexity undertaken by the agent, the wider discretion the agent
must be given, thus higher agency costs are expected to incurred. (Ross, 1973)
Armour, Hansmann, Kraakman, 2009 also emphasized on the three generic agency
problems arise in business organizations as follows:
1) It involves the company’s owners conflict with their hired managers. In this
situation, the owners are the principals and the manager act as agents. The
problem occurs in assuring that the managers are responsive to the interest of the
owners rather than pursuing their own personal interests.
2) It involves the conflict between the owners as the majority or controlling interest
in the company, and the minority or non-controlling owners. In this case, the
controlling owners act as the agents while the non controlling owners can be
thought of as the principals, and the difficulties appears in assuring that the
former are not expropriated by the latter. This problem happen whenever
decisions affecting the class of owners as a whole can be controlled by some
subset of the company’s owner; proved that it is the most conspicuous in
tensions between the minority and majority shareholders (Luca Enriques and
8
Paolo Volpin, 2007). As such, if minority shareholders enjoy veto rights in
regards to particular decisions, it can give rise to this second agency problems.
Similar problems can arise between junior and senior creditors in bankruptcy
(when creditors are the effective owners of the company), and between
preference and ordinary shareholders.
3) It involves the conflict between the company itself including specifically the
owners and the other parties with whome the company contracts, such as the
employees, creditors and customers. The problem lies in assuring that the
company as agent does not behave opportunistically towards these various oher
principals such as by misleading consumers, expropriating creditors or
exploiting workers.
In each of the foregoing problems, there are multiple principals, particularly in which
they have different interests, or ‘heterogeneous preferences’ as economists said; will
gives the greater challenges of assuring agent’s responsiveness. The ability to engage in
collective action of the multiple principals will be inhibited as they are facing
coordination costs. Hence, in turn, these will interact with the agency problems in two
ways as per below:
1) The principals will be influenced to delegate most of their decision making to an
agents when there is coordinating difficulties between principals. (Frank and
Daniel, 1991)
9
2) The more obviously difficult to ensure the agent does the right thing in a
situation of more difficult for principals to coordinate on a single set of goals for
the agent. (Kanda, 1992 and Hansmann, 1996)
Therefore, the coordination costs between principals exacerbate agency problems.
As mentioned by Armour, Hansmann, Kraakman (2009), law can play important
function in reducing agency costs. For example, the disclosure by agents can be
enhanced by having rules and procedures or the principal can facilitate enforcement
actions towards the dishonest or negligent agents.
In addition, in order to reduce agency costs, the foreign investors, who are typically
minority shareholders have the incentive to push for divestment of unrelated businesses
in business groups. In emerging economies, the business groups have traditionally
featured unrelated diversification due to economic, cultural and political conditions in
these countries (Ghemawat and Khanna, 1998). Generally, reducing agency costs is in
the interests of all parties to a transaction, agents and principals alike.
While Sanford and Oliver (1983) in their study, to develop a method for analyzing the
principal-agent problem which avoids the difficulties of the “first-order condition”
approach. Their approach is focusing to solve the principal’s problem up into a costs
and benefits computation of the different actions of the agents. For each action, they
10
consider the incentive scheme which minimizes the anticipated cost for getting the agent
to choose that action.
Besides, a good corporate governance system have to be developed to provide effective
protection for shareholders and creditors, hence, they can assure themselves of getting
their investment return. Also, it should help to foster the condusive environment to the
efficient and sustainable growth of the corporate sector.
This study therefore addresses the question whether the corporate governance viewed as
agency costs (monitoring cost occurs) which is proxied by the debt ratio, firm size,
growth, expense and efficiency are important in determining the Corporate Performance
which can be measured by the Return on Assets (ROA) and Return on Equity (ROE);
and whether the relationship is the same for the Top 50 and the Bottom 50 of the
Companies listed in Bursa Malaysia.
1.4 Research Question
1) Is there any relationship between between the corporate performance by using
Return on Assets (ROA) and Return on Equity (ROE); and the proxy of agency
costs which is the debt ratio, firm’s size, growth, expense and efficiency?
2) Is there any differences in relationship between the proxy of agency costs for
the Top 50 Companies and the Bottom 50 Companies listed in Bursa Malaysia,
and the corporate performance?
11
1.5 Research Objectives
1.5.1 General Objective
To determine the relationship between corporate performance and the agency costs
among public listed companies in Malaysia.
1.5.2 Specific Objectives
Specifically the objectives of the research are as follows:
1) To examine the relationship between the corporate performance and the proxy of
agency costs which is the debt ratio, firm’s size, growth, expense and efficiency.
2) To examine the relationship between the proxy of agency costs for the Top 50
Companies and the Bottom 50 Companies listed in Bursa Malaysia, and the
corporate performance.
1.6 Significance of the Study
The importance of the study comes from highlighting an important subject related to
agency theory through demonstrating the agency costs concept in relation to some
variables and the impact on corporate performance. The practical importance is to
12
improve some of financial policies and reduce agency cost by focusing on evidence
presented about agency problem for guidance which having significant impact on and
upgrade the financial performance in such a way that increase the companies’s value in
Malaysia financial market, primarily the Malaysian business environment is facing
insufficient of such frameworks in addition to the emergence of managerial opportunism
phenomenon.
Despite many studies conducted in regards to the agency costs in Malaysia, it is rarely
appears of any research that differentiate the relationship between the agency costs and
the corporate performance by categorization of the Top 50 and the Bottom 50
Companies listed in Bursa Malaysia. This study will reveal that such differences as to
help investor or market players in making their investment decision, particularly during
crisis that may have different impact on certain Companies in both categories. As time
goes by, these listing also will be changed in accordance to their financial or corporate
performance. Hence, future research will be having different result to be observed and
analyzed.
1.7 Scope and Limitations of the Study
This study is basically examine on the relationship between the corporate performance
and the proxy of agency costs of only 100 selected companies listed in Bursa Malaysia
as at 31 March 2014. Due to differences in regulatory requirements, all financial and
13
unit trust companies were omitted from the study. Furthermore, the companies with
incomplete data and the companies which fail to comply with any obligations under
Practice Note such as Practice Note 4 (PN4) and Practice Note 17 (PN17) are also
excluded from the study. Hence, 100 companies have been selected as sample which
covering 5 years, from the time series of 2008 to 2012.
1.8 Organization of the Dissertation
According to Sekaran, 2005, the dissertation must be carefully organized, systematic,
data-based, critical, objective, investigate the identified problem as to find the answer or
solution. Hence, for this study, it has been organized accordingly.
For Chapter One, this study will discuss about Company’s value or performance and
how it is derived or related with company ownership or concentration through agency
cost element such as debt ratio, firm size, growth, expense and efficiency ratio. This
study specifically emphasizes corporate performance among the public listed companies
of Bursa Malaysia and the five independent variables mentioned that attached to it. It
also identifies the problem statements, research questions and research objectives, the
significance of the study, and the scope and limitation of study. In Chapter Two, it
presented the previous studies which related to the problem statement of this study, as
well as it is needed to identify broad problem area and preliminary information
gathering as to identify gaps between this study and previous study, which was done
earlier on different sets of independent variable and framework. This study explained
14
the theories of agency costs and corporate/firms’ performance, as well as the empirical
evidence on the variables selected as proxies for agency costs.
In Chapter Three, it specified the methodology used in this study. Methodology is the
process to collect information about the subjects in this study through systematic way.
This study used secondary data which comprises of 100 selected companies listed in
Bursa Malaysia as at 31 March 2014 for data collection. It also describes the research
design, followed by data analysis. In Chapter Four, this study presented the analysis and
finding on what have been discussed in Chapter Three. The Statistical Package for
Social Science (SPSS) has been used to run the data, proceed with analysis such as
descriptive analysis, univariate analysis and multivariate analysis.
In the final section (Chapter Five), this study provides the conclusion of the study and
discussion on the implication, as well as some recommendations based on the result
from Chapter Four (analysis and finding).
15
CHAPTER TWO
LITERATURE REVIEW
2.0 Introduction
This chapter present a basic areas of research on agency costs and corporate
performance. It will briefly discuss on the basic concepts and definitions of the various
proxy of agency costs and previous findings concerning the agency costs and the
corporate performance.
2.1 Corporate Governance and Coporate Performance
Shleifer and Vishny (1997) described that corporate governance deals with the ways in
which finance suppliers to corporations assure to get the return on their investment.
Likewise Denis and McConnell (2003) defined that corporate governance is the set of
mechanisms for both market based and institutional that influence the company’s
controller which is the decision maker pertaining the company’s operation and decision
making that maximize the company’s value for its capital contributor (owners).
The governance mechanism can be classified as internal and external to the company in
United States (US). Both, the companies’ ownership structure and the board of
directors are the internal mechanisms of the main interest. For external, the main
mechanisms are the external market for corporate control such as the legal system and
16
the takeover market (Cremers and Nair, 2004). As the company’s performance can be
influenced by the corporate governance mechanisms, thus, effect agency cost of the
company through the various proxies have been included. Among the corporate
governance tested are the debt ratio, size of company, growth, expense and efficiency
factors.
The board involvement in corporate affairs are significant to the influence of the board
size and composition. The board size and composition may influence the impact of
insiders and block ownership on company’s performance, hence, it should be controlled.
Both could act as either substitute or complement for the structure of ownership. Singh
and Davidson III (2003) stated that both board size and composition may reflect its
ability to be an efficient guide and they found that company performance is increased by
smaller boards, consistently with Hermalin and Weisbach (2003), Jensen (1993), as well
as Lipton and Lorsh (1992), It is also supported by Eisenberg et al. (1998) and Yermack
(1996) which stated that smaller board will lead to increase in company performance.
In several other countries, the previous studies has also found that there is negative
relationship between board size and company performance. Mak and Yuanto (2002)
examine the relationship between both factors in Malaysia and Singapore and they
found that the board size is negatively related to Tobin’s Q. Similarly in Finland, there
is evidence that shows the negative relationship between size of board and profitability,
found by Eisenberg et al (1998), for a small and medium size companies. Besides, that
size of board is inversely related to operating performance in UK companies (Carline et
al., 2002).
17
As confirmed by numerous other studies, it has been futher supported that small boards
is more effective as compared to large boards (Lipton and Lorssch, 1992), ( Gladstein,
1984), (Olson, 1982), (Shaw, 1981), (Jewel and Reitz, 1981); and (Jensen and
Meckling, 1976). This is also consistent with Mishra et al’s (2001) research on
corporate governance of family companies in Norway which they found that size of
board has negatively significant coefficient indicating that the higher q values is
achieved by the smaller board size companies.
In contrast for Pearce and Zahra (1991) and Pfeffer (1973), who suggested that by
securing a broader resource platform and network bulding with external environment in
a way to increase in board size and diversity may yield the benefits, thus fostering
identity of the corporate. Also, based on Adam and Mehran (2003) findings discovered
that there is a positive and significant relationship the board size and company
performance using Tobin’s Q measurement. While in the case of mergers and
acquisitions, there is no empirical evidence on the impact of the size of board on bid
premiums (Brewer III et al., 2000).
Based on Fama and Jensen (1983), they explained that by monitoring services and
lending experience , the outsiders of board could strengthen the value of the company.
Outside directors are supposed to be protector of the shareholders’ interests through
monitoring activities. This is further supported by Hermalin and Weishbach (1991) and
Coughlan and Schmidt (1985) that the argument pertaining the outside director are more
critical disciplining device and effective monitors for managers. Furthermore, the
18
effectiveness of board and company’s performance could improve by having outside
directors, as agreed by previous empirical findings. (Cotter et al., 1997), (Brickley et al.,
1994), (Rosenstein and Wyatt, 1990), (Weisbach, 1998), and (Coughlan and Schmidt,
1985).
This evidence further supported by McKnight and Mira (2003) in which they found that
based on Tobin’s Q measurement, there is a positive and signicant relationship between
the proportion of outsiders and company performance. Other empirical evidence in
relation to composition of board towards company performance such as Lee et
al.(1992), and Byrd and Hickman (1992) found that through the evaluation of strategic
decisions by the outside directors may increase the companies’ value. Probably, in
boosting the company’s value by outside directors, the role in the dismissal of
inefficient and poorly performing management is also emphasized. (Weisbach, 1998).
However, there is in fact negative correlation between board independence and
performance, found by the study of Klein et al (2004), Subrahmanyam et al (1997), and
Agrawal and Knoeber (1996). This evidence is further supported by Weir and Laing
(1999), and Yermack (1996) in which they found that the proportion of outside directors
is negatively correlated with company’s performance. While based on study by Haniffa
and Hudaib (2006), Klein (1998) and Mehran (1995) discovered that the outsider
proportion on the board of directors is not significant related with the performance
based on Tobin’s Q and ROA measurement.
19
2.2 The Theory of Agency Costs
Many difficulties associated with the insufficiency of the current theory of the firm
which also can be viewed as specific cases of the agency relationships theory that
leading to the growing of literature (Ross, 1973; Heckerman, 1975). Independently, this
literature has been developed despite concerning on the similar problem as the
approaches are highly complementary to each other.
The study of Jensen & Meckling (1976) stated a contract under which one or more
persons, both the principals and the agents engage one another to perform some tasks or
service on their behalf which involved delegation of some decision making authority to
the agent, namely agency relationship. There is relevant reason to believe that the agent
sometimes will not act in the best interests of the principal if both parties are utility
maximizers in this relationship. To limit the divergences from the principal’s interest,
appropriate incentives for the agent has been established; as well as by incurring
monitoring costs designated as to limit the agent’s aberrant activities. Besides, in certain
situation, there is a payment to the agent to expend resources (bonding costs) in order to
guarantee that he will not act in a way that could harm the principal; or to ensure that the
principal will be compensated if he do so. Nevertheless, generally, it is unlikely for the
principal or agent at zero cost to ensure that the agent will make optimal decisions from
the viewpoint of the principal.
In most of agency relationship, the principal and agent will have positive monitoring
and bonding costs either financial or non financial; and there will be some divergence
20
between the decisions of the agent in which would maximize the principal’s welfare.
The dollar equivalent of the welfare reduction experienced by the principal by reason of
this divergence is also considered as cost of the agency relationship; and Jensen and
Meckling (1976) refer to this latter cost as the “residual loss”.
They classify these agency costs into monitoring expenses by shareholders, bonding
expenses by the agent and residual loss. This opinion supported by the studies of Watts
and Zimmerman (1990); and Hill and Jones (1992) consider the agency costs by giving
an example of the cost incurred for monitoring by the principal as well as manager’s
bonding expenses and the residual loss. They show that the differences in actions and
interests from both principals and managers may lead to the costs appear and affect
eventually towards the benefit of the principal, and in such a way on company value.
There are other point of view from Harris and Glegg (2009) who believe that the
restriction of shareholders right may resulting to the existence and increase of agency
costs.
2.3 The empirical evidence of Agency Costs
Alford and Stangeland (2005) conducted a study that intend to explain impact of
taxation imposed on income of the managers being a kind of political cost, on the
relationship between agency costs and performance. They suggested that the importance
of agency cost and company’s efficiency is personal tax, as well as it has negative
impact on the performance of manageria. Based on their findings, the comparison for
21
the results of hypothesis testing reached 2 different samples, which is belongs to 1995
covering 1761 companies and 2002 covering 1785 companies in the same country and
sector respectively. It reveals that there is always negative impact of personal tax on the
relationship of agency cost and performance.
Whilst Wang (2010) conducted a study to investigate the relationship between agency
cost and cash flow, as well as to investigate on how such relationship could affect the
company performance. Based on the findings, this study conducted on Taiwan publicly-
listed companies were focusing on 3 main points which is there is significant effect
between free cash flows on agenct cost; the agency cost positively effect on company
performance; and no significant effect pertaining the effect of agency cost on company
performance.
The following will stated the review of the literature on the relationship between various
corporate performance characteristics which includes return on equity and return on
asset; and the proxies of agency cost, specifically debt ratio, firm size, growth, expense,
and efficiency.
2.3.1 Debt ratio
Brander and Lewis (1986) conclusions indicated that the financial decisions of the
companies are interlinked with their strategic options in relation to obtaining a particular
22
market share level. They conclude that the debt can be either positive or negative
significantly related to the market power.
The use of debts can reduce the need for outside financing through the issuance of
shares, thus, it will help diminish the manager-stockholder agency problem. In addition,
the use of debts can reduce the agency problem of over-investment by committing the
company to fixed interest payments (Jensen and Meckling, 1976).
Rehmann (2007) conclude that there is negative relationship between debt used by the
firm and its profitability. Omar et al. (2007) conclude that the debt ratio of the Big-4
affiliated audit firms has significant positive relationship with Tobin’s Q, while no
significant relationship is recorded with ROA. The debt ratio has a significantly positive
effect on board ownership with both Tobin’s Q and ROA. The study by Crutchley and
Jensen (1999) proved the hypothesis that financial leverage or debt ratio is negatively
related to agency cost. Meanwhile, Doukas et al. (2001) proposed that the measurement
of agency costs should be inversely related to the fraction of debt in the company’s
capital structure.
Hence, this study proposes the following hypothesis:
Ha1: Debt ratio is significantly related with the corporate performance
23
2.3.2 Firm’s size
Doukas et al. (2001) has stated that agency conflicts are more prominent in larger
companies where the number of managers and shareholders is greater. That means the
firm size is positively related to the agency cost.
Ramasamy et al. (2005) in their paper said that profitability (represented by Return on
Equity (ROE) and Return on Assets (ROA)) exhibit a positive relationship with firm
size (the log of firm assets as proxy). Their conclusion indicated that large firms have all
the options of small firms. Besides, the large firms enjoyed higher profit rates by having
the access to capital markets and the capability of harnessing economies of scales from
which small firms are excluded.
Moyer et al. (1989) used the market value of outstanding shares (or market
capitalization) as a proxy for company size. They reasoned that the greater the market
value of outstanding equity, the greater the aggregate potential gains to investors.
Theoretically, companies with higher potential agency costs are expected to be
monitored more closely.
Hence, this study proposes the following hypothesis:
Ha2: Firm size is significantly related with the corporate performance
24
2.3.3 Company growth
Based on Moyer et al. (1989), high growth companies require more monitoring than
established and mature companies in view of their asset-base of the company changes
quickly. In line with the rapid changes, it allow the manager to engage in risk shifting
behavior due to availability of larger amounts of assets, hence, it involves agency costs.
Therefore, a positive relationship is expected between compay growth and agency costs.
The research results showed that company growth, proxied by the growth rate of assets,
was positively and significantly related to agency costs in companies.
Hence, this study proposes the following hypothesis:
Ha3: Company growth is significantly related with the corporate performance
2.3.4 Expense
Expense ratio is defined as the ratio of operating expenses to annual sales. With
reference to Ang et al. (2000), expense ratio is considered a direct measurement of
agency costs because it measures how effectively the operating costs, including
excessive perquisite consumption, and other direct agency costs controlled by
management of the companies. Among the items considered as operating expenses are
salaries, utilities, supplies, advertising, transportation, depreciation and insurance. Most
of these items can be overstated in terms of the amount for the benfit of managers in
view of these items are subject to discretion of the management. As such, high operating
expenses raise the probability of misuse of funds by the management of the companies.
25
Therefore, the higher the expense ratio, the higher would be the agency costs in a
company.
Hence, this study proposes the following hypothesis:
Ha4: The expense is significantly related with the corporate performance
2.3.5 Efficiency
Besides using the expense ratio, the studies by Florackis & Ozkan, (2004), Singh and
Davidson III (2003), and Ang et al. (2000) used the asset utilization ratio (efficiency
ratio) as proxy for agency costs. This efficiency ratio was defined as the ratio of annual
sales to total assets in which it measure the effectiveness of the company’s management
deploys its assets.
Based on Brealey and Myers (2000), a higher efficiency ratio signals a more efficient
management team in utilizing the company’s assets to generate more sales. Particularly,
this variable is a proxy for the loss in revenue attributable to non-efficient utilization of
assets resulting from poor investment and management decisions (such as investing in
non-productive assets and mismatch in asset funding), or from negative management
behavior (such as exerting less effort to help in revenue generation). Overall, it can be
concluded that lower asset utilization ratio indicates a high agency costs. In contrast,
higher asset utilization will indicates lower agency costs.
Hence, this study proposes the following hypothesis:
Ha5: The efficiency is significantly related with the corporate performance
26
2.4 Chapter Summary
This study will integrate the results from previous studies and agency costs theory to
develop and to test a model that links to the relationship between the proxies of agency
costs to the corporate performance. Specifically, the study will examine: (1) the
relationship between debt ratio, firm’s size, growth, expense and efficiency towards
public listed companies’performance; (2) the differences in relationship between the
proxy of agency costs for the Top 50 Companies and the Bottom 50 Companies listed in
Bursa Malaysia, and the corporate performance.
27
CHAPTER THREE
METHODOLOGY
3.0 Introduction
This chapter discuss the research methodology which has been carried out in order to
test the hypothesis of this study. This study employed quantitative research method
whereby data were collected and analyzed using SPSS. This chapter primarily
investigated the relationship between debt ratio, firm’s size, growth, expense and
efficiency and public listed companies’performance. The objective is to identify the
relationship, the effect of the variables and the empirical research that has to be based on
the research question.
28
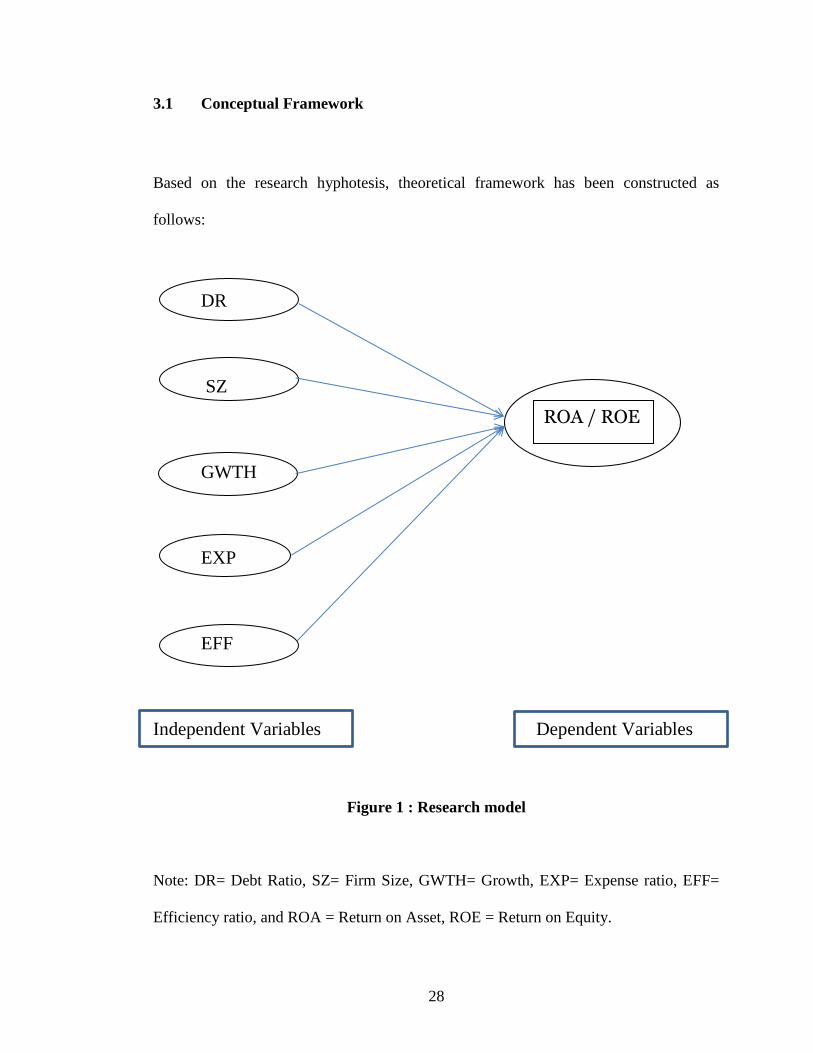
3.1 Conceptual Framework
Based on the research hyphotesis, theoretical framework has been constructed as
follows:
DR
SZ
GWTH
EXP
EFF
Independent Variables Dependent Variables
Figure 1 : Research model
Note: DR= Debt Ratio, SZ= Firm Size, GWTH= Growth, EXP= Expense ratio, EFF=
Efficiency ratio, and ROA = Return on Asset, ROE = Return on Equity.
ROA / ROE
29
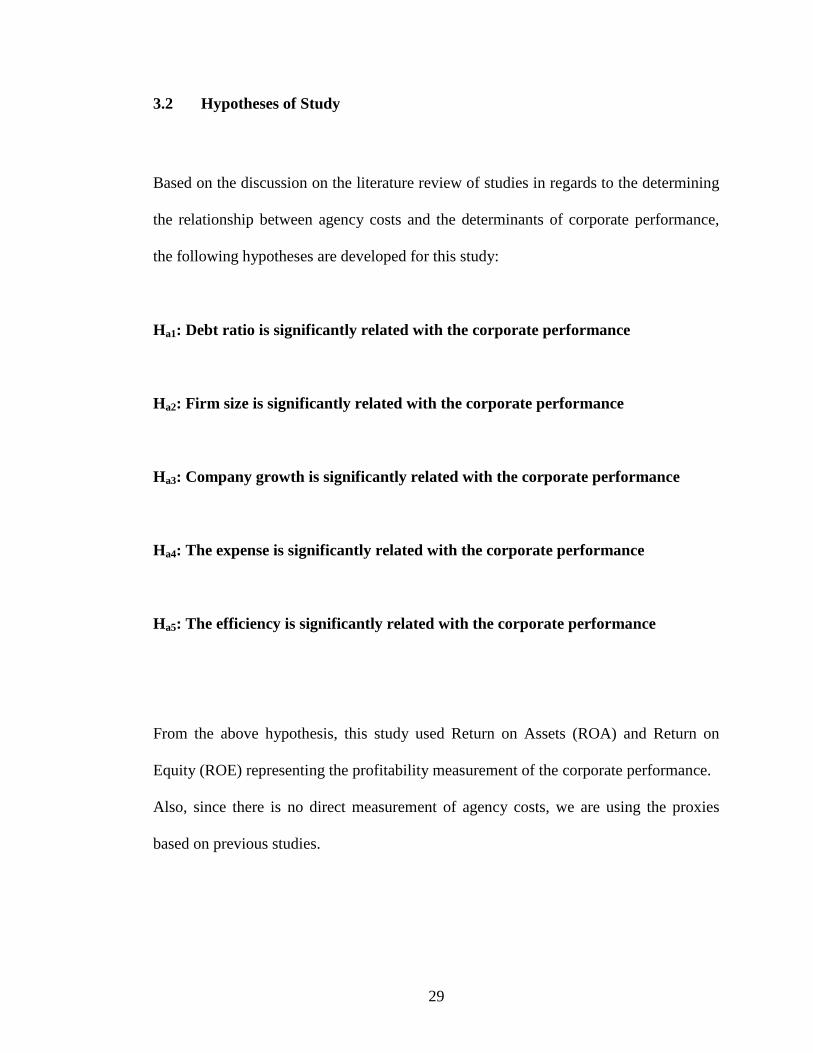
3.2 Hypotheses of Study
Based on the discussion on the literature review of studies in regards to the determining
the relationship between agency costs and the determinants of corporate performance,
the following hypotheses are developed for this study:
Ha1: Debt ratio is significantly related with the corporate performance
Ha2: Firm size is significantly related with the corporate performance
Ha3: Company growth is significantly related with the corporate performance
Ha4: The expense is significantly related with the corporate performance
Ha5: The efficiency is significantly related with the corporate performance
From the above hypothesis, this study used Return on Assets (ROA) and Return on
Equity (ROE) representing the profitability measurement of the corporate performance.
Also, since there is no direct measurement of agency costs, we are using the proxies
based on previous studies.
30
3.3 Research Design
The study adopted a quantitative research design by using secondary data. The data
collected from Bursa Malaysia which covered the time series of 2008 to 2012. This is a
correlation research because the objective of this study is to determine the relationship
between between debt ratio, firm’s size, growth, expense and efficiency and corporate
performance.
3.4 Data Collection : Population and Sampling
The population of this study are 814 Public Listed Companies in Bursa Malaysia as at
31 December 2012. There are 10 industries listed in Bursa Malaysia, namely Basic
Materials, Consumer Goods, Consumer Services, Financials, Health Care, Industrials,
Oil & Gas, Technology, Telecommunications, and Utilities. The systematic sampling
was applied in the selection of the companies, which is the Top 50 and the Bottom 50 of
the Bursa Malaysia’s ranking. According to Sowell and Casey (1982) ten percent of a
population is a number that can be managed in a study. Therefore, from 814 companies,
listed in Bursa Malaysia, a total of 100 companies was selected (twelve percent – more
are better). This is also based on Lim (1981) which have found that the ownership of
shareholding and wealth among the 100 largest firms in the 1960s to be highly
concentrated.
31
However, due to the differences in regulatory requirements and/or financial statement
presentation, the omission is applied on all financial and unit trust companies, or in
other words, the companies listed under finance sector/industry from this study.
Furthermore, the study excluded the companies with incomplete data for the period of
study (2008 – 2012); those companies that has been disposed off or taken over during
the period of study; and those companies which fail to comply with any obligations
under Practice Note such as Practice Note 4 (PN4) and Practice Note 17 (PN17).
As a result, on top of exclusion of the above-mentioned companies, the researcher
selected the top 50 and the bottom 50 companies listed on the main board of Bursa
Malaysia; across 5 years from 2008 to 2012 as sample.
3.5 Operational Definitions
3.5.1 Debt Ratio
The debt ratio is defined as the ratio of total debt to total assets, expressed in percentage,
and can be interpreted as the proportion of a company's assets that are financed by debt.
The higher this ratio, the more leveraged the company and the greater its financial risk.
3.5.2 Firm’s size
To the present date firm size remains a poorly defined concept. Where the use of size
is required by theory, empirical studies typically revert to some proxy or other, such
as the number of employees, Total Assets, Sales or Market Capitalisation. Conversely,
32
the concept of firm size has also been used to proxy for numerous theoretical constructs
ranging from risk to liquidity or even political costs (Ball and Foster, 1982).
In the accounting side, McLeay (1986) and McLeay and Fieldsend (1987) have
examined the distribution of ratios formed with accounting variables that are
summations of positive transactions (such as Sales Stocks, Creditors or Current Assets)
asserting that they should exhibit a proportionate behavior. Empirical work by
Trigueiros (1995) has extended this result, showing that lognormality is a widespread
feature of accounting data. Not only summations of positive transactions, many other
positive valued items have cross-section distributions that are lognormal.
In this study, the researcher used the natural log (ln) of the market value of outstanding
shares of a company’s common stock at particular year-end.
3.5.3 Company Growth
Significant levels of cash flow and earnings compared to other companies are used to
determine if a company falls into Growth companies or vice versa. Growth companies
typically have something whether it is an innovative product or a service that draws in
more consumers. The stock price of publicly-traded growth companies typically
increases at a rapid pace. In this study, the researcher used compound annual growth
rate in company total assets over a five-year period
33
3.5.4 Expense ratio
An expense ratio is determined through an annual calculation, where a fund's operating
expenses are divided by the average dollar value of its assets under management.
Operating expenses are taken out of a fund's assets and lower the return to a fund's
investors.
Depending on the type of fund, operating expenses vary widely. The largest component
of operating expenses is the fee paid to a fund's investment manager/advisor. Other
costs include recordkeeping, custodial services, taxes, legal expenses, marketing fee,
accounting and auditing fees. A fund's trading activity, the buying and selling of
portfolio securities, is not included in the calculation of the expense ratio.
3.5.5 Efficiency ratio
Ratios that are typically used to analyze how well a company uses its assets and
liabilities internally. Efficiency Ratios can calculate the turnover of receivables, the
repayment of liabilities, the quantity and usage of equity and the general use of
inventory and machinery.
Some common ratios are accounts receivable turnover, fixed asset turnover, sales to
inventory, sales to net working capital, accounts payable to sales and stock turnover
ratio. These ratios are meaningful when compared to peers in the same industry and can
identify business that are better managed relative to the others. Also, efficiency ratios
34
are important because an improvement in the ratios usually translate to improved
profitability.
3.5.6 Corporate Performance
Management systems today do a good job of budgeting, financial and management
reporting, and rudimentary business intelligence analysis that will connected real-world
decisions and corporate actions. Corporate performance comprise of qualitative and
quantitative achievements. In this study, the corporate performance represented by the
Return on Asset (ROA) and Return on Equity (ROE).
3.6 Measurement of Variables/ Instruments
In this study, the data has been gathered and analyzed using various different statistical
tools as follows:
We used the descriptive statistic to get the value of means and to test the differences of
means of the variables under both categories, the top 50 and the bottom 50 of listed
companies. On top of that, we used univariate analysis and the Pearson Correllation
Matrix, as well as the regression model analysis to determine the coefficient correlation
between dependent and independent variables (Favero et al. (2006); Gorriz and Fumas
(2005); and Anderson and Reeb (2003)). The statistical analysis is to testify whether
there is any significant relationship between the dependent and independent variables.
35
As such, we develop two specific models or equations to analyze the relationship
between the agency costs and corporate performance.
A multiple regression model used to explain the profitability of the companies which is
proxied by the Return on Asset (ROA) and Return on Equity (ROE). The hypothesized
relationship between ROA/ROE and its determinants is as follows:
ROA = α + β1 DEBT RATIO +β2 SIZE + β3 GROWTH + β4 EXPENSE +
β5 EFFICIENCY + е
ROE = α + β1 DEBT RATIO +β2 SIZE + β3 GROWTH + β4 EXPENSE +
β5 EFFICIENCY + е
Where,
ROA :
Return on Assets (ROA) is an indicator of how profitable a company is relative to its
total assets. ROA gives an idea as to how efficient management is at using its assets to
generate earnings. Calculated as: Net Income divided by Average Total Assets of the
company.
36
ROE :
Return on Equity (ROE) measures a corporation's profitability by revealing how much
profit a company generates with the money shareholders have invested. Calculated as:
Net Income Available for Common Shareholders divided by the Average Total
Common Equity of the company
DEBT RATIO :
Total Debt to Total Asset. Calculated as : Short term borrowings plus the long term
borrowings and subsequently divided by total assets of the company.
SIZE :
The natural log (ln) of the market value of outstanding shares of a company’s common
stock at year-end 2012. The outstanding shares is calculated as the net of treasury
shares where it is the combined number of primary common share equivalents of all
classes outstanding in millions as of Balance Sheet date for multiple share companies.
Excluded unearned shares in Employee Stock-Option Plan (ESOP) i.e shares that have
not vested. Once they vest they are no longer held by the company and are included in
Shares Outstanding. If no disclosure, assumption is that shares are vested.
GROWTH :
Compound annual growth rate in company total assets over a five-year period ending in
2012.
37
EXPENSE :
Five-year average, ending in 2012 of company operating expense divided by annual
sales. The operating expenses (OPEX) includes selling & Administrative expenses
(SG&A) and other operating expenses after cost of goods sold (COGS). If there is no
breakdown between COGS and SG&A, it includes the entire amount which represents
total OPEX. Expenses which are attributed to non operating business or one-time gains
or losses are excluded in Operating Expenses.
EFFICIENCY :
Five-year average, ending in 2012 of company annual sales divided by total assets.
Total operating revenues lessvarious adjustments to Gross Sales. Adjustments: Returns,
discounts, allowances, excise taxes, insurance charges, sales taxes, and value added
taxes (VAT). Includes revenues from financial subsidiaries in industrial companies if
the consolidation includes those subsidiaries throughout the report. Excludes inter-
company revenue and revenues from discontinued operations. Includes subsidies from
federal or local government in certain industries (i.e transportation or utilities).
3.6.1 Demographic Profile
As mentioned earlier, the population of this study are 814 Public Listed Companies in
Bursa Malaysia as at 31 March 2014. It consists of 10 industries listed in Bursa
Malaysia. Meanwhile the sample taken was the Top 50 and the Bottom 50 companies
based on the Bursa Malaysia’s ranking. All of these population and sample was
categorized under 4 classes namely Industry, Sector, Sub Sector and Super sector.
38
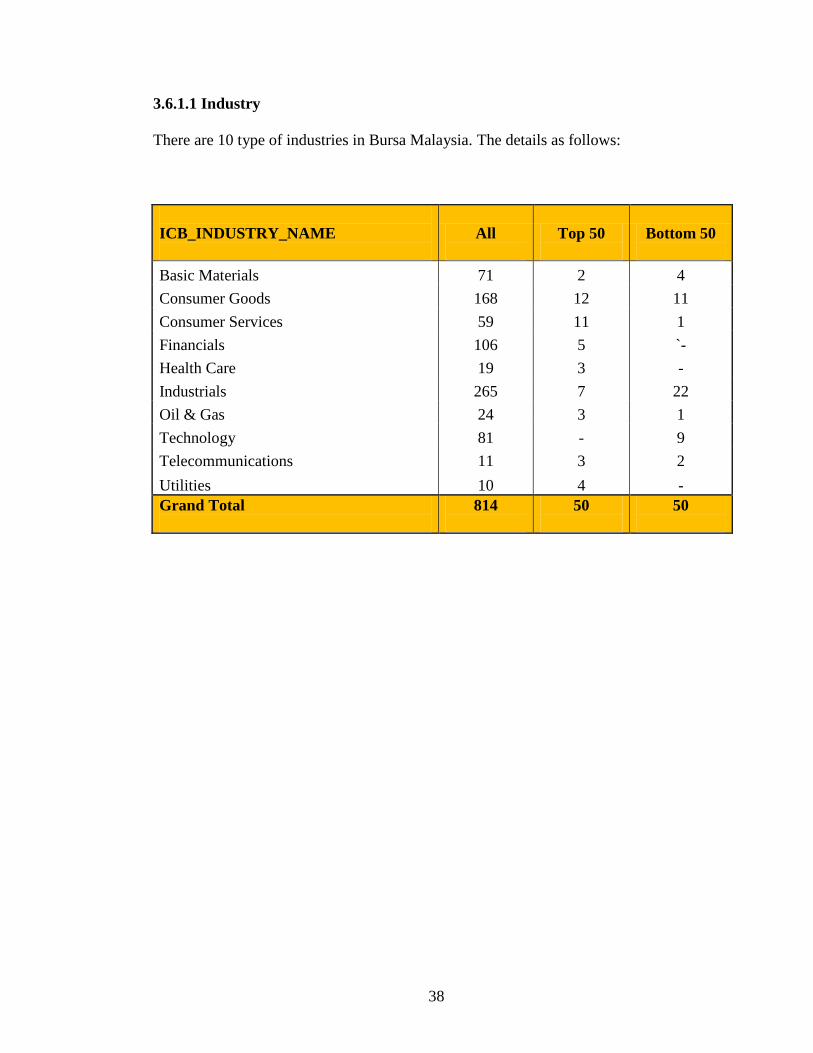
3.6.1.1 Industry
There are 10 type of industries in Bursa Malaysia. The details as follows:
ICB_INDUSTRY_NAME
All
Top 50
Bottom 50
Basic Materials 71 2 4
Consumer Goods 168 12 11
Consumer Services 59 11 1
Financials 106 5 `-
Health Care 19 3 -
Industrials 265 7 22
Oil & Gas 24 3 1
Technology 81 - 9
Telecommunications 11 3 2
Utilities 10 4 -
Grand Total
814
50
50
39
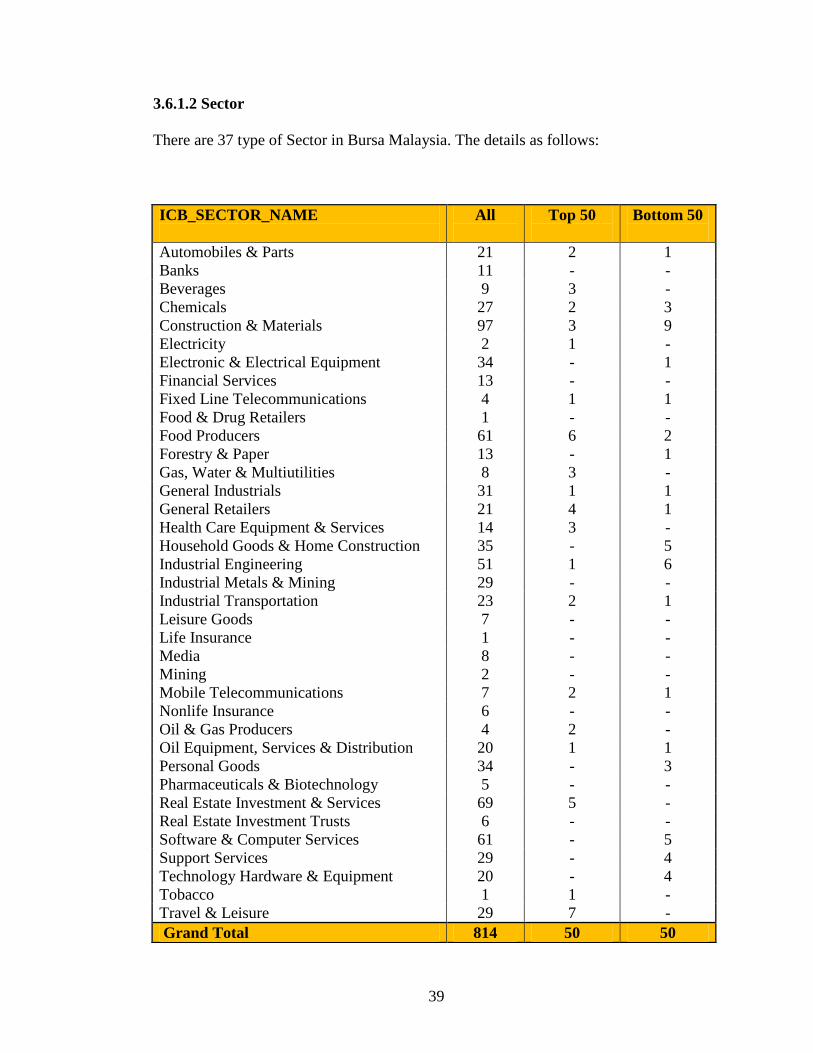
3.6.1.2 Sector
There are 37 type of Sector in Bursa Malaysia. The details as follows:
ICB_SECTOR_NAME
All
Top 50
Bottom 50
Automobiles & Parts 21 2 1
Banks 11 - -
Beverages 9 3 -
Chemicals 27 2 3
Construction & Materials 97 3 9
Electricity 2 1 -
Electronic & Electrical Equipment 34 - 1
Financial Services 13 - -
Fixed Line Telecommunications 4 1 1
Food & Drug Retailers 1 - -
Food Producers 61 6 2
Forestry & Paper 13 - 1
Gas, Water & Multiutilities 8 3 -
General Industrials 31 1 1
General Retailers 21 4 1
Health Care Equipment & Services 14 3 -
Household Goods & Home Construction 35 - 5
Industrial Engineering 51 1 6
Industrial Metals & Mining 29 - -
Industrial Transportation 23 2 1
Leisure Goods 7 - -
Life Insurance 1 - -
Media 8 - -
Mining 2 - -
Mobile Telecommunications 7 2 1
Nonlife Insurance 6 - -
Oil & Gas Producers 4 2 -
Oil Equipment, Services & Distribution 20 1 1
Personal Goods 34 - 3
Pharmaceuticals & Biotechnology 5 - -
Real Estate Investment & Services 69 5 -
Real Estate Investment Trusts 6 - -
Software & Computer Services 61 - 5
Support Services 29 - 4
Technology Hardware & Equipment 20 - 4
Tobacco 1 1 -
Travel & Leisure 29 7 -
Grand Total 814 50 50
40
3.6.1.3 Sub Sector
There are 87 type of Sector in Bursa Malaysia. The details as follows:
ICB_SUBSECTOR_NAME All Top 50 Bottom 50
Airlines 2 1 -
Alternative Electricity 1 1 -
Aluminum 4 - -
Apparel Retailers 3 - -
Auto Parts 15 - 1
Automobiles 4 2 -
Banks 11 - -
Biotechnology 1 - -
Brewers 2 2 -
Broadcasting & Entertainment 1 - -
Broadline Retailers 7 2 -
Building Materials & Fixtures 52 1 8
Business Support Services 12 - -
Business Training Employment Agency 1 - -
Clothing & Accessories 20 - 3
Coal 1 - -
Commercial Vehicles & Trucks 9 1 1
Commodity Chemicals 7 - 1
Computer Hardware 4 - 2
Computer Services 32 - 3
Consumer Electronics 7 - -
Consumer Finance 2 - -
Containers & Packaging 26 - 1
Conventional Electricity 1 - -
Delivery Services 3 - -
Distillers & Vintners 1 - -
Diversified Industrials 5 1 -
Diversified REITs 1 - -
Durable Household Products 9 - -
Electrical Components & Equipment 24 - 1
Electronic Equipment 10 - -
Exploration & Production 3 1 -
Farming, Fishing & Plantations 37 4 1
Fixed Line Telecommunications 4 1 1
Food Products 24 2 1
Food Retailers & Wholesalers 1 - -
Footwear 5 - -
41
ICB_SUBSECTOR_NAME All Top 50 Bottom 50
Forestry 13 - 1
Full Line Insurance 2 - -
Furnishings 22 - 5
Gambling 6 3 -
General Mining 1 - -
Health Care Providers 5 1 -
Heavy Construction 45 2 1
Home Improvement Retailers 2 - 1
Hotels 9 2 -
Industrial & Office REITs 4 - -
Industrial Machinery 42 - 5
Industrial Suppliers 9 - 2
Integrated Oil & Gas 1 1 -
Internet 3 - 1
Investment Services 8 - -
Iron & Steel 24 - -
Life Insurance 1 - -
Marine Transportation 8 1 -
Media Agencies 3 - -
Medical Equipment 1 - -
Medical Supplies 8 2 -
Mobile Telecommunications 7 2 1
Mortgage Finance 1 - -
Multiutilities 3 3 -
Nondurable Household Products 4 - -
Nonferrous Metals 1 - -
Oil Equipment & Services 20 1 1
Personal Products 9 - -
Pharmaceuticals 4 - -
Property & Casualty Insurance 3 - -
Publishing 4 - -
Real Estate Holding & Development 69 5 -
Reinsurance 1 - -
Restaurants & Bars 6 1 -
Retail REITs 1 - -
Semiconductors 7 - 2
42
ICB_SUBSECTOR_NAME All Top 50 Bottom 50
Soft Drinks 6 1 -
Software 26 - 1
Specialized Consumer Services 2 - -
Specialty Chemicals 20 2 2
Specialty Finance 2 - -
Specialty Retailers 7 2 -
Telecommunications Equipment 9 - -
Tires 2 - -
Tobacco 1 1 -
Transportation Services 9 1 -
Travel & Tourism 6 - -
Trucking 3 - 1
Waste & Disposal Services 7 - 2
Water 5 - -
Grand Total 814 50 50
3.6.1.4 Super Sector
There are 19 type of Sector in Bursa Malaysia. The details as follows:
ICB_SUPERSECTOR_NAME All Top 50 Bottom 50
Automobiles & Parts 21 2 1
Banks 11 - -
Basic Resources 44 - 1
Chemicals 27 2 3
Construction & Materials 97 3 9
Financial Services 13 - -
Food & Beverage 70 9 2
Health Care 19 3 -
Industrial Goods & Services 168 4 13
Insurance 7 - -
Media 8 - -
Oil & Gas 24 3 1
Personal & Household Goods 77 1 8
Real Estate 75 5 -
Retail 22 4 1
Technology 81 - 9
Telecommunications 11 3 2
Travel & Leisure 29 7 -
Utilities 10 4 -
Grand Total 814 50 50
43
3.6.2 Variables
Variables is a measurable characteristic that varies. It may change from group to group,
person to person, or even within one person over time. The purpose of all research is to
describe and explain variance in the world. Variance is simply the difference; that is,
variation that occurs naturally in the world or change that we create as a result of a
manipulation. A variable is either a result of some force or is itself the force that causes
a change in another variable. In experiments, these are called dependent and
independent variables respectively.
As mentioned earlier, in this study, the dependent variable is Corporate Performance
which is measured by Return on Assets (ROA) and Return on Equity (ROE).
Meanwhile the independent varaibles involved are Deb Ratio, Firm’s Size, Company
Growth, Expense Ratio and Efficiency Ratio.
3.6.2.1 Debt Ratio
According to Jensen and Meckling (1976), the use of debts can reduce the need for
outside financing through the issuance of shares, thus, it will help diminish the manager-
stockholder agency problem. In addition, the use of debts can reduce the agency
problem of over-investment by committing the company to fixed interest payments.
44
3.6.2.2 Firm’s Size
Doukas et al. (2001) has stated that agency conflicts are more prominent in larger
companies where the number of managers and shareholders is greater. That means the
firm size is positively related to the agency cost.
3.6.2.3 Company Growth
Based on Moyer et al. (1989), high growth companies require more monitoring than
established and mature companies in view of their asset-base of the company changes
quickly. In line with the rapid changes, it allow the manager to engage in risk shifting
behavior due to availability of larger amounts of assets, hence, it involves agency costs.
3.6.2.4 Expense Ratio
With reference to Ang et al. (2000), expense ratio is considered a direct measurement of
agency costs because it measures how effectively the operating costs, including
excessive perquisite consumption, and other direct agency costs controlled by
management of the companies.
45
3.6.2.5 Efficiency
Based on Brealey and Myers (2000), a higher efficiency ratio signals a more efficient
management team in utilizing the company’s assets to generate more sales.
3.7 Data Collection Procedure
This study used secondary data regarding the financial indicators for the period of 2008
to 2012. The data was taken from the annual reports of companies which can be
extracted from the financial database of Bursa Malaysia, namely Datastream.
Several control variables used to represent companies characteristics such as firm size,
which is the natural log of total asset (ln asset) of the company and companies debt ratio
as a firm leverage (Lev) by calculating total debt over total asset of the company. Other
than that are company growth, expense and efficiency ratio.
This study also represent the profitability as a performance measurement by using
accounting measures such as Return on Assets (ROA) and Return on Equity (ROE) .
Higher ROA shows the company uses its asset effectively in serving shareholders’
economic interests. Meanwhile, ROE indicates the expectation of something in return
from investor investment. In addition, it also measures the effectiveness of shareholder
investment.. These performance measurement have been widely used as proxies for
46
company performance (Sraer and Thesmar, 2006; Favero et al., 2006; Haniffa and
Hudaib, 2006; Anderson and Reeb, 2003; Rhoades et al., 2001; Daily and Dalton, 1998;
McConnell and Servaes, 1990).
Both has been chosen as there is no consensus regarding the dependent variable options
in measuring performance. We hope that the measurement selected can give beneficial
information and benefits. However, no doubt on the use of alternative measurements
that will help to check the robustness of the findings.
3.8 Technique of Data Analysis
The statistical testing is a step of statistical inference by using the data of study. The
statistic result is called statistically significant if it has been anticipated as unlikely to
have occurred by chance alone, based on pre-determined threshold probability, the
significance level. These tests has been used in determining the outcomes of our study
that can lead to a rejection of the null hypothesis for a pre-specified significance level
which can help in making decision whether the results have enough information to cast
doubt on conventional wisdom, given that it has been used to establish the null
hypothesis.
In general, many studies used Pearson chi-square statistical test to determine whether
their results are significants which means whether there is a relationship between two
47
categorical variables, and whether to accept or reject the proposed null hypothesis and
alternate hyphotesis. The null hypothesis states that there is no considerable
dissimilarity between the expected and observed result. Chi-square is the sum of the
squared difference between observed and the expected data, divided by the expected
data in all possible categories.
Moayad and Tawfeeq (2013) in their study used the nonparametric statistical tests and
Kendall correlation to measure the association between dependent and independent
variables; and Kolmogorov-Smirnov test to determine the differences between both
variables. Whilst Hazlindar, Fazilah and Afizar (2008) in their study used panel pooled
regression model analysis in order to determine the coefficient correlation between
dependent and independent variables; which is in line with study of Favero et al (2006),
Gorriz and Fumas (2005); and Anderson and Reeb (2003).
For this study, we used the univariate analysis and multiple regression model to explain
the relationship between the profitability of the companies which is proxied by the
Return on Assets (ROA) and Return on Equity (ROE) with the debt ratio, firm’s size,
growth, expense and efficiency as proxy of agency costs.
48
3.8.1 Descriptive Statistic : Frequency Distributions
Descriptive statistics is the discipline of quantitatively describing the main features of a
collection of information, or the quantitative description itself. Descriptive statistics are
distinguished from inferential statistics (or inductive statistics), in that descriptive
statistics aim to summarize a sample, rather than use the data to learn about the
population that the sample of data is thought to represent. This generally means that
descriptive statistics, unlike inferential statistics, are not developed on the basis of
probability theory. Even when a data analysis draws its main conclusions using
inferential statistics, descriptive statistics are generally also presented. This study has
presented the frequency distribution of the sample in the following chapter.
3.8.2 Hypotheses Testing : Pearson Correlation Coefficient
The Pearson Correlation Coefficient is a useful statistical formula that measures the
strength between variables and relationships. In the field of statistics, this formula is
often referred to as the Pearson R test. When conducting a statistical test between two
variables, the reseacher has decided to conduct a Pearson Correlation Coefficient value
to determine how strong that relationship is between those two variables.
49
3.9 Chapter Summary
In this chapter, research framework is identified to be the base for this study.
Hypotheses of this study have been constructed in order to align with the research
objective. Researcher also have identified the related research design, measurement of
variable or instruments been used.
50
CHAPTER FOUR
RESULTS AND DISCUSSION
4.0 Introduction
All of the information needed are gathered and it has been analyzed by SPSS software.
In this chapter, we use the descriptive statistic, Pearson correlation, Univariate analysis
of variance and Multiple linear regression. This chapter presents the results on the
determinants of relationship between corporate performance with debt ratio, firm size,
growth, expense, efficiency, profit margin, and board rank. In this study the
performance of the company is measured by Return on Assets (ROA) and Return on
Equity (ROE). ROA gives an idea on how efficient management is at using its assets to
generate earnings. ROE measures a corporation's profitability by revealing how
much profit a company generates with the money shareholders have invested.
4.1 Descriptive Analysis : 100 Public Listed Companies
Table 4.1 gives the descriptive analysis for the main variables used in this study. The
table shows the average debt ratio proportion is 21.91 per cent. That means on average,
the amount of debts of the sample companies is nearly to one-quarter of its total assets.
While for growth, the average is 3.7 per cent with some companies having a 89.73 per
cent and -54.90 per cent growth. The mean expense ratio for the five-year average,
51
ending 2012 recorded 70.74 per cent and the five-year average, ending 2012 efficiency
ratio was 78.50 per cent.
For profit margin, the average is -37.52 per cent with some companies enjoying 210.44
per cent profit margin while some of the other companies bearing negative margin. The
mean for board rank is 50 per cent while for ROA and ROE, it has recorded average of
2.67 per cent and 5.27 per cent respectively.
Finally, the mean size, which was proxied by the natural log (ln) of market
capitalization, was 5.75. This shows that at the end of 2012, the average market
capitalization of the companies in the sample was RM315,350,000. The average total
sales for 2012 of the sample companies stood at RM3,723,413,771, showing that the
average total sales for the companies was 11.80 times greater than the average market
capitalization.
With reference to the finding from the study by Bala and Darrly (2005), it showed that
there is positive relationship between profitability [based on Return on Equity (ROE)
and Return on Assets (ROA)] and the firm size (which is proxied by the log of firm
assets). They concluded that large firms have all the options of small firms, as well as
harnessing economies of scales capability and capital markets access from which small
firms are excluded, hence leading to higher profit rates.
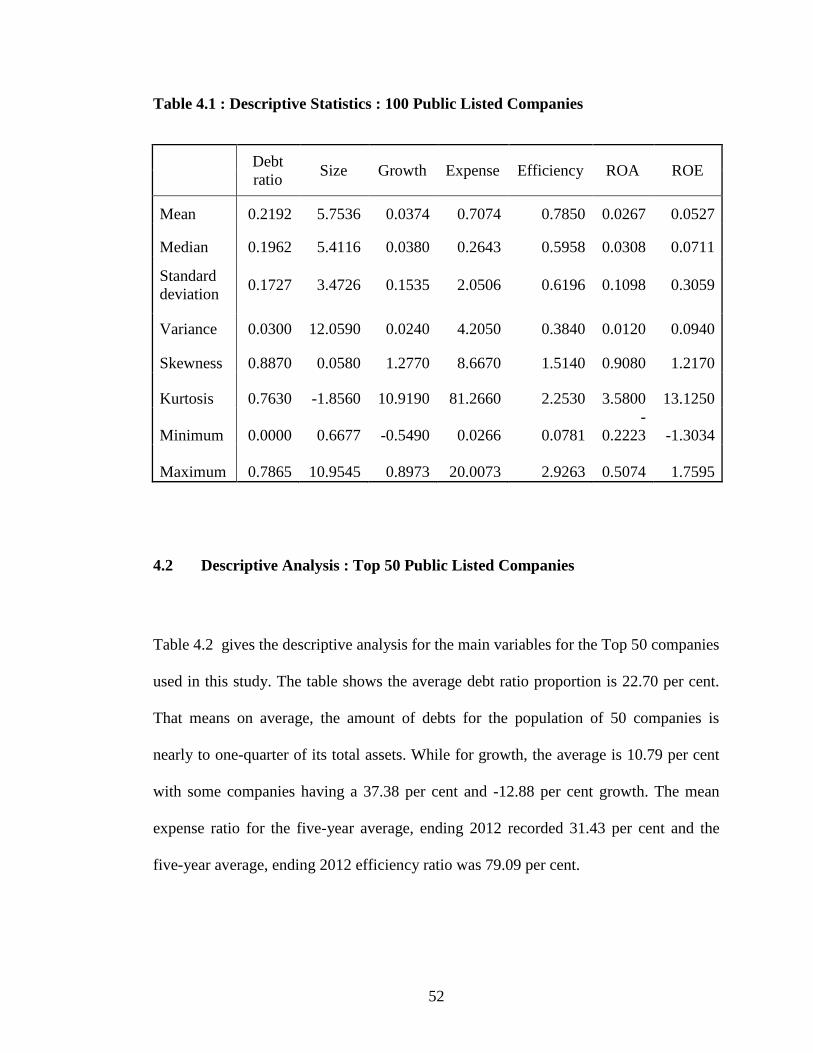
52
Table 4.1 : Descriptive Statistics : 100 Public Listed Companies
Debt
ratio Size Growth Expense Efficiency ROA ROE
Mean 0.2192 5.7536 0.0374 0.7074 0.7850 0.0267 0.0527
Median 0.1962 5.4116 0.0380 0.2643 0.5958 0.0308 0.0711
Standard
deviation 0.1727 3.4726 0.1535 2.0506 0.6196 0.1098 0.3059
Variance 0.0300 12.0590 0.0240 4.2050 0.3840 0.0120 0.0940
Skewness 0.8870 0.0580 1.2770 8.6670 1.5140 0.9080 1.2170
Kurtosis 0.7630 -1.8560 10.9190 81.2660 2.2530 3.5800 13.1250
Minimum 0.0000 0.6677 -0.5490 0.0266 0.0781
-
0.2223 -1.3034
Maximum 0.7865 10.9545 0.8973 20.0073 2.9263 0.5074 1.7595
4.2 Descriptive Analysis : Top 50 Public Listed Companies
Table 4.2 gives the descriptive analysis for the main variables for the Top 50 companies
used in this study. The table shows the average debt ratio proportion is 22.70 per cent.
That means on average, the amount of debts for the population of 50 companies is
nearly to one-quarter of its total assets. While for growth, the average is 10.79 per cent
with some companies having a 37.38 per cent and -12.88 per cent growth. The mean
expense ratio for the five-year average, ending 2012 recorded 31.43 per cent and the
five-year average, ending 2012 efficiency ratio was 79.09 per cent.
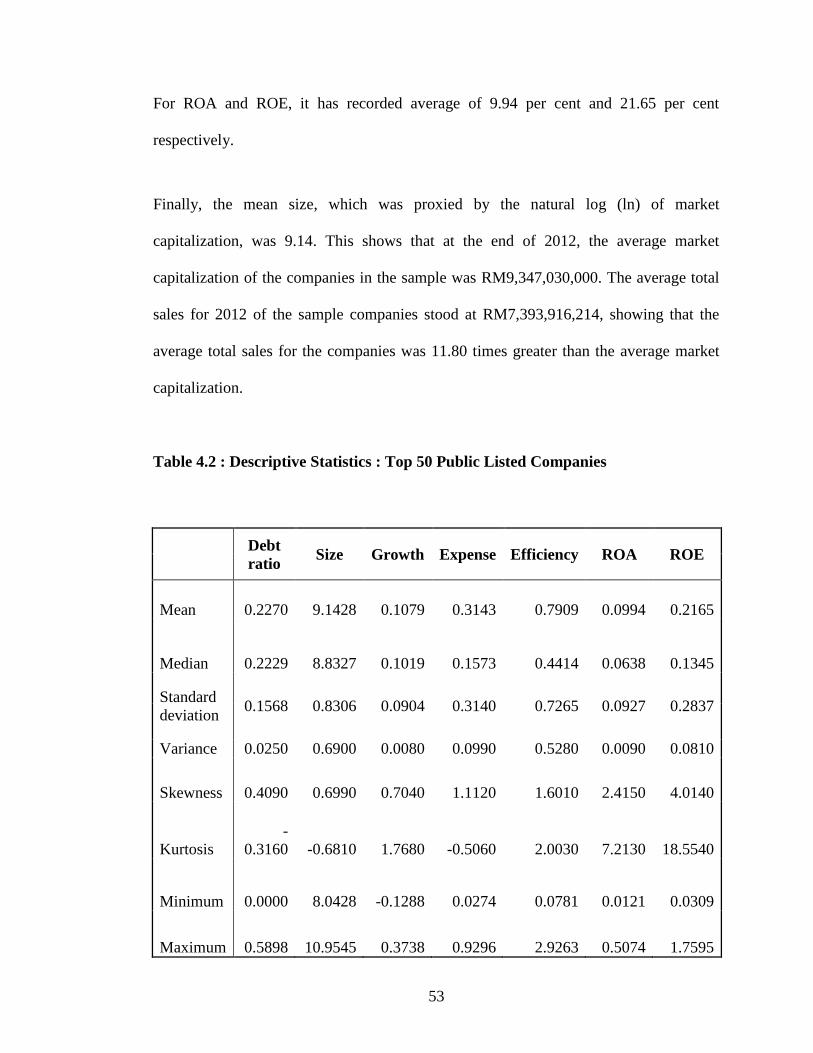
53
For ROA and ROE, it has recorded average of 9.94 per cent and 21.65 per cent
respectively.
Finally, the mean size, which was proxied by the natural log (ln) of market
capitalization, was 9.14. This shows that at the end of 2012, the average market
capitalization of the companies in the sample was RM9,347,030,000. The average total
sales for 2012 of the sample companies stood at RM7,393,916,214, showing that the
average total sales for the companies was 11.80 times greater than the average market
capitalization.
Table 4.2 : Descriptive Statistics : Top 50 Public Listed Companies
Debt
ratio Size Growth Expense Efficiency ROA ROE
Mean 0.2270 9.1428 0.1079 0.3143 0.7909 0.0994 0.2165
Median 0.2229 8.8327 0.1019 0.1573 0.4414 0.0638 0.1345
Standard
deviation 0.1568 0.8306 0.0904 0.3140 0.7265 0.0927 0.2837
Variance 0.0250 0.6900 0.0080 0.0990 0.5280 0.0090 0.0810
Skewness 0.4090 0.6990 0.7040 1.1120 1.6010 2.4150 4.0140
Kurtosis
-
0.3160 -0.6810 1.7680 -0.5060 2.0030 7.2130 18.5540
Minimum 0.0000 8.0428 -0.1288 0.0274 0.0781 0.0121 0.0309
Maximum 0.5898 10.9545 0.3738 0.9296 2.9263 0.5074 1.7595
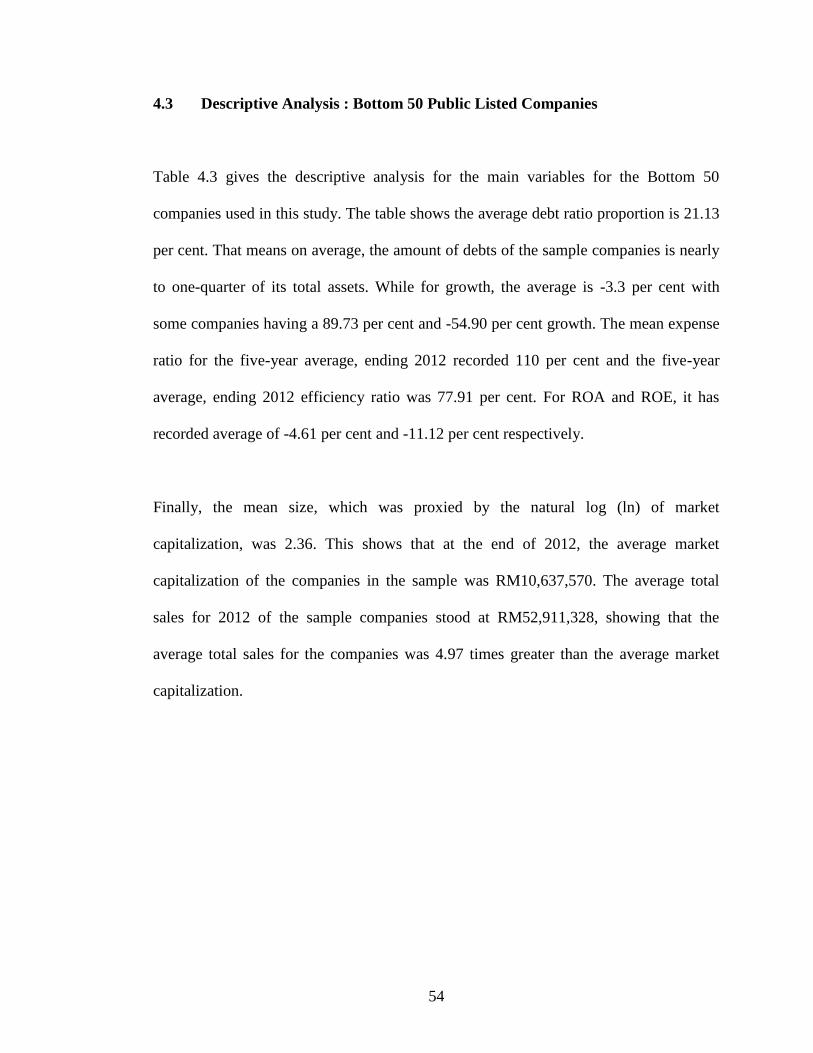
54
4.3 Descriptive Analysis : Bottom 50 Public Listed Companies
Table 4.3 gives the descriptive analysis for the main variables for the Bottom 50
companies used in this study. The table shows the average debt ratio proportion is 21.13
per cent. That means on average, the amount of debts of the sample companies is nearly
to one-quarter of its total assets. While for growth, the average is -3.3 per cent with
some companies having a 89.73 per cent and -54.90 per cent growth. The mean expense
ratio for the five-year average, ending 2012 recorded 110 per cent and the five-year
average, ending 2012 efficiency ratio was 77.91 per cent. For ROA and ROE, it has
recorded average of -4.61 per cent and -11.12 per cent respectively.
Finally, the mean size, which was proxied by the natural log (ln) of market
capitalization, was 2.36. This shows that at the end of 2012, the average market
capitalization of the companies in the sample was RM10,637,570. The average total
sales for 2012 of the sample companies stood at RM52,911,328, showing that the
average total sales for the companies was 4.97 times greater than the average market
capitalization.
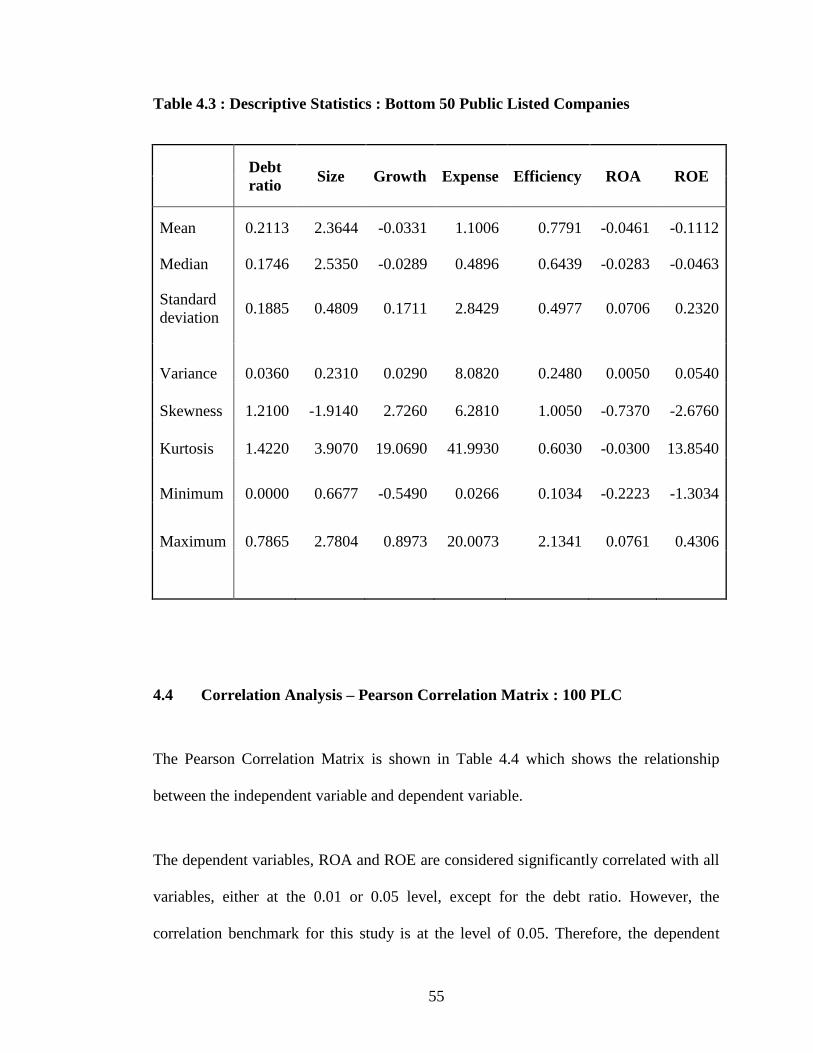
55
Table 4.3 : Descriptive Statistics : Bottom 50 Public Listed Companies
Debt
ratio Size Growth Expense Efficiency ROA ROE
Mean 0.2113 2.3644 -0.0331 1.1006 0.7791 -0.0461 -0.1112
Median 0.1746 2.5350 -0.0289 0.4896 0.6439 -0.0283 -0.0463
Standard
deviation 0.1885 0.4809 0.1711 2.8429 0.4977 0.0706 0.2320
Variance 0.0360 0.2310 0.0290 8.0820 0.2480 0.0050 0.0540
Skewness 1.2100 -1.9140 2.7260 6.2810 1.0050 -0.7370 -2.6760
Kurtosis 1.4220 3.9070 19.0690 41.9930 0.6030 -0.0300 13.8540
Minimum 0.0000 0.6677 -0.5490 0.0266 0.1034 -0.2223 -1.3034
Maximum 0.7865 2.7804 0.8973 20.0073 2.1341 0.0761 0.4306
4.4 Correlation Analysis – Pearson Correlation Matrix : 100 PLC
The Pearson Correlation Matrix is shown in Table 4.4 which shows the relationship
between the independent variable and dependent variable.
The dependent variables, ROA and ROE are considered significantly correlated with all
variables, either at the 0.01 or 0.05 level, except for the debt ratio. However, the
correlation benchmark for this study is at the level of 0.05. Therefore, the dependent
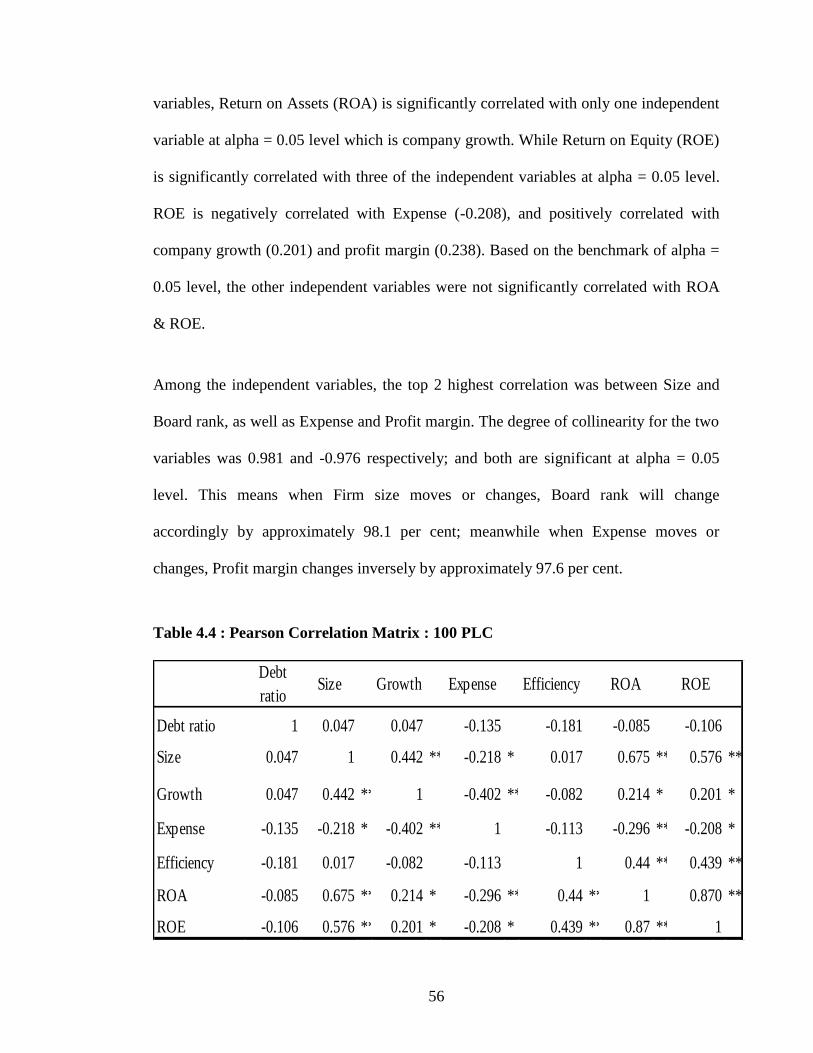
56
variables, Return on Assets (ROA) is significantly correlated with only one independent
variable at alpha = 0.05 level which is company growth. While Return on Equity (ROE)
is significantly correlated with three of the independent variables at alpha = 0.05 level.
ROE is negatively correlated with Expense (-0.208), and positively correlated with
company growth (0.201) and profit margin (0.238). Based on the benchmark of alpha =
0.05 level, the other independent variables were not significantly correlated with ROA
& ROE.
Among the independent variables, the top 2 highest correlation was between Size and
Board rank, as well as Expense and Profit margin. The degree of collinearity for the two
variables was 0.981 and -0.976 respectively; and both are significant at alpha = 0.05
level. This means when Firm size moves or changes, Board rank will change
accordingly by approximately 98.1 per cent; meanwhile when Expense moves or
changes, Profit margin changes inversely by approximately 97.6 per cent.
Table 4.4 : Pearson Correlation Matrix : 100 PLC
Debt ratio 1 0.047 0.047 -0.135 -0.181 -0.085 -0.106
Size 0.047 1 0.442 ** -0.218 * 0.017 0.675 ** 0.576 **
Growth 0.047 0.442 ** 1 -0.402 ** -0.082 0.214 * 0.201 *
Expense -0.135 -0.218 * -0.402 ** 1 -0.113 -0.296 ** -0.208 *
Efficiency -0.181 0.017 -0.082 -0.113 1 0.44 ** 0.439 **
ROA -0.085 0.675 ** 0.214 * -0.296 ** 0.44 ** 1 0.870 **
ROE -0.106 0.576 ** 0.201 * -0.208 * 0.439 ** 0.87 ** 1
ROA ROEDebt
ratioSize Growth Expense Efficiency
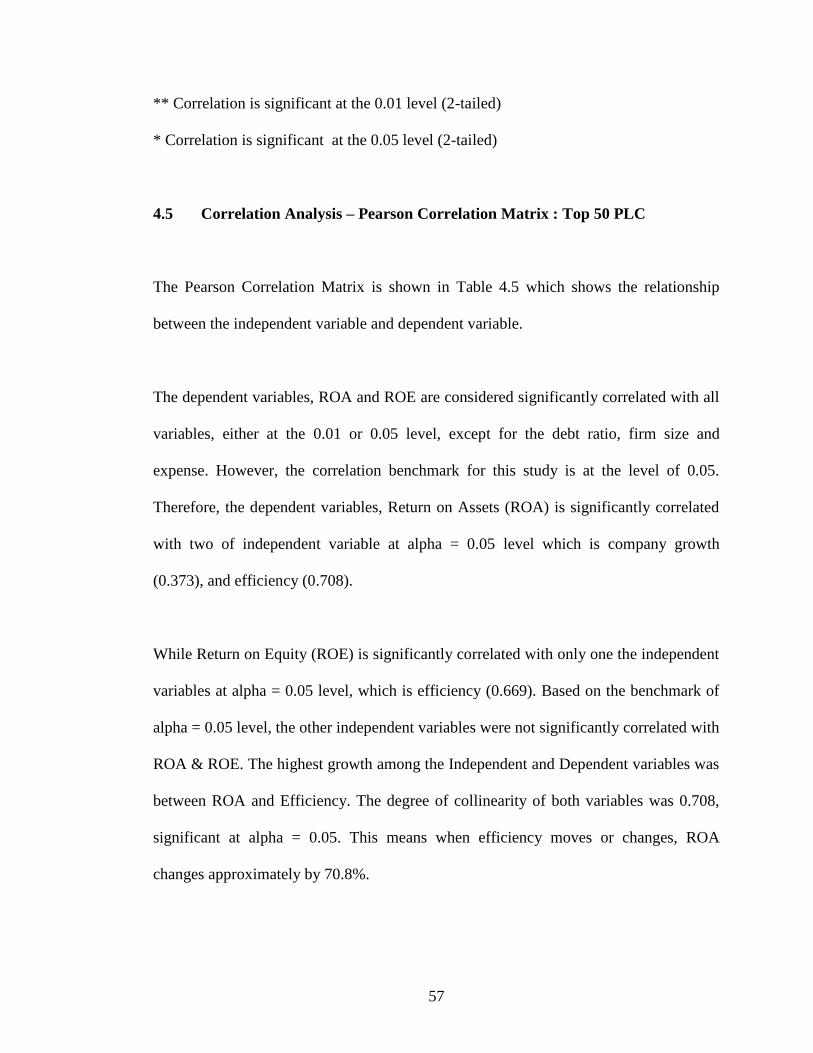
57
** Correlation is significant at the 0.01 level (2-tailed)
* Correlation is significant at the 0.05 level (2-tailed)
4.5 Correlation Analysis – Pearson Correlation Matrix : Top 50 PLC
The Pearson Correlation Matrix is shown in Table 4.5 which shows the relationship
between the independent variable and dependent variable.
The dependent variables, ROA and ROE are considered significantly correlated with all
variables, either at the 0.01 or 0.05 level, except for the debt ratio, firm size and
expense. However, the correlation benchmark for this study is at the level of 0.05.
Therefore, the dependent variables, Return on Assets (ROA) is significantly correlated
with two of independent variable at alpha = 0.05 level which is company growth
(0.373), and efficiency (0.708).
While Return on Equity (ROE) is significantly correlated with only one the independent
variables at alpha = 0.05 level, which is efficiency (0.669). Based on the benchmark of
alpha = 0.05 level, the other independent variables were not significantly correlated with
ROA & ROE. The highest growth among the Independent and Dependent variables was
between ROA and Efficiency. The degree of collinearity of both variables was 0.708,
significant at alpha = 0.05. This means when efficiency moves or changes, ROA
changes approximately by 70.8%.
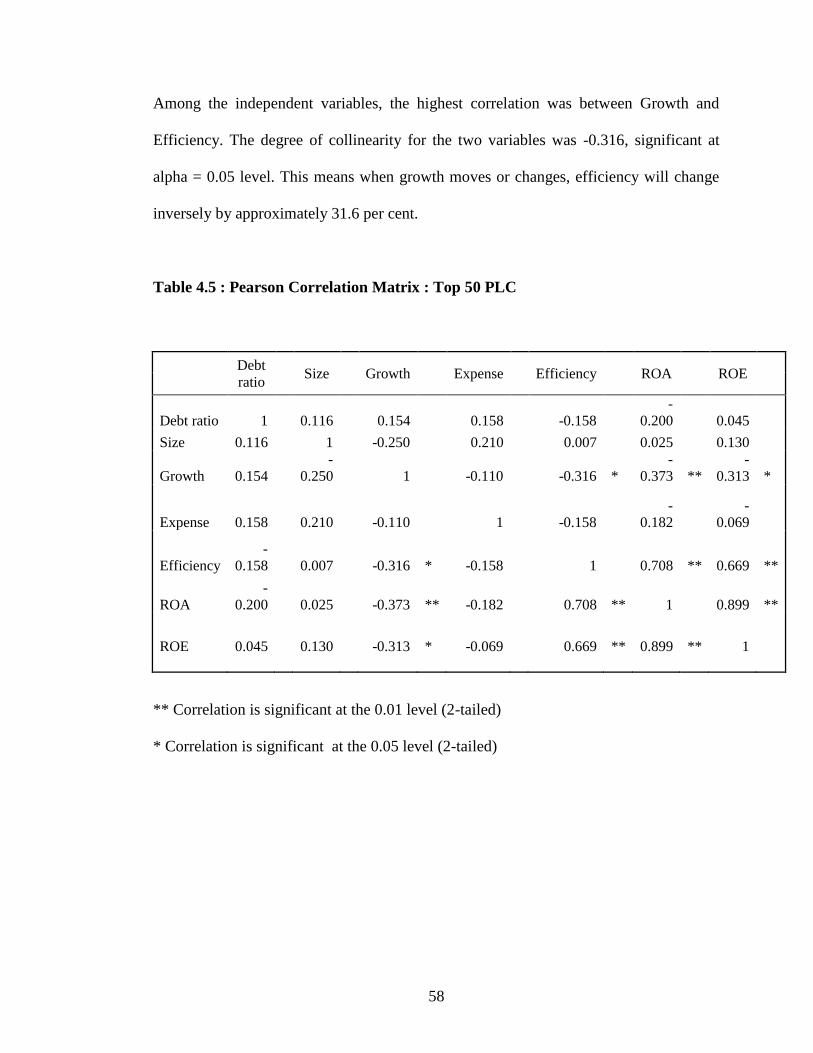
58
Among the independent variables, the highest correlation was between Growth and
Efficiency. The degree of collinearity for the two variables was -0.316, significant at
alpha = 0.05 level. This means when growth moves or changes, efficiency will change
inversely by approximately 31.6 per cent.
Table 4.5 : Pearson Correlation Matrix : Top 50 PLC
Debt
ratio
Size
Growth
Expense
Efficiency
ROA
ROE
Debt ratio 1 0.116 0.154 0.158 -0.158
-
0.200 0.045
Size 0.116 1 -0.250 0.210 0.007 0.025 0.130
Growth 0.154
-
0.250 1 -0.110 -0.316 *
-
0.373 **
-
0.313 *
Expense 0.158 0.210 -0.110 1 -0.158
-
0.182
-
0.069
Efficiency
-
0.158 0.007 -0.316 * -0.158 1 0.708 ** 0.669 **
ROA
-
0.200 0.025 -0.373 ** -0.182 0.708 ** 1 0.899 **
ROE
0.045
0.130
-0.313
*
-0.069
0.669
**
0.899
**
1
** Correlation is significant at the 0.01 level (2-tailed)
* Correlation is significant at the 0.05 level (2-tailed)
59
4.6 Correlation Analysis – Pearson Correlation Matrix : Bottom 50 PLC
The Pearson Correlation Matrix is shown in Table 4.6 which shows the relationship
between the independent variable and dependent variable.
The dependent variables, ROA and ROE are considered significantly correlated with all
variables, either at the 0.01 or 0.05 level, except for the growth. However, the
correlation benchmark for this study is at the level of 0.05. Therefore, the dependent
variables, Return on Assets (ROA) is significantly correlated with only one independent
variable at alpha = 0.05 level which is firm size. While Return on Equity (ROE) is
significantly correlated with two of the independent variables at alpha = 0.05 level. ROE
is negatively correlated with Debt ratio (-0.365), and positively correlated with firm size
(0.646). Based on the benchmark of alpha = 0.05 level, the other independent variables
were not significantly correlated with ROA & ROE.
Among the independent variables, the highest correlation was between Growth and
Expense. The degree of collinearity for the two variables was -0.402 , significant at
alpha = 0.05 level. This means when Growth moves or changes, Expense will change
inversely by approximately 40.2 per cent.
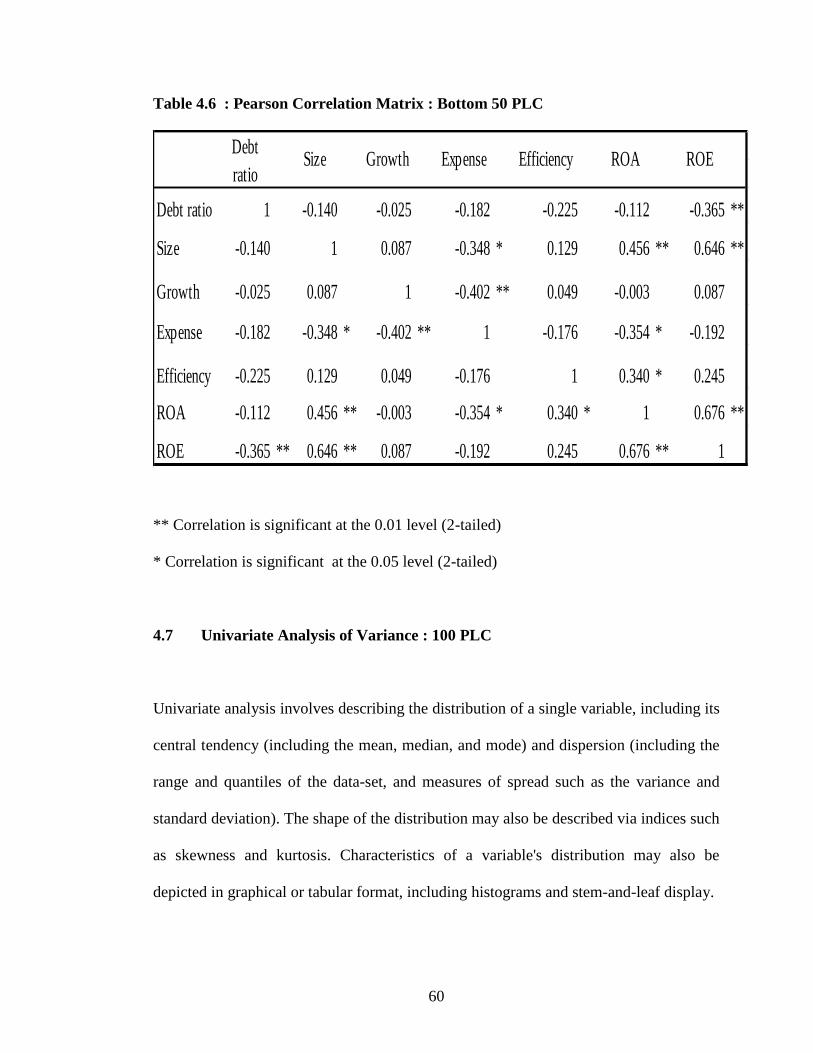
60
Table 4.6 : Pearson Correlation Matrix : Bottom 50 PLC
** Correlation is significant at the 0.01 level (2-tailed)
* Correlation is significant at the 0.05 level (2-tailed)
4.7 Univariate Analysis of Variance : 100 PLC
Univariate analysis involves describing the distribution of a single variable, including its
central tendency (including the mean, median, and mode) and dispersion (including the
range and quantiles of the data-set, and measures of spread such as the variance and
standard deviation). The shape of the distribution may also be described via indices such
as skewness and kurtosis. Characteristics of a variable's distribution may also be
depicted in graphical or tabular format, including histograms and stem-and-leaf display.
Debt ratio 1 -0.140 -0.025 -0.182 -0.225 -0.112 -0.365 **
Size -0.140 1 0.087 -0.348 * 0.129 0.456 ** 0.646 **
Growth -0.025 0.087 1 -0.402 ** 0.049 -0.003 0.087
Expense -0.182 -0.348 * -0.402 ** 1 -0.176 -0.354 * -0.192
Efficiency -0.225 0.129 0.049 -0.176 1 0.340 * 0.245
ROA -0.112 0.456 ** -0.003 -0.354 * 0.340 * 1 0.676 **
ROE -0.365 ** 0.646 ** 0.087 -0.192 0.245 0.676 ** 1
ROA ROEDebt
ratioSize Growth Expense Efficiency
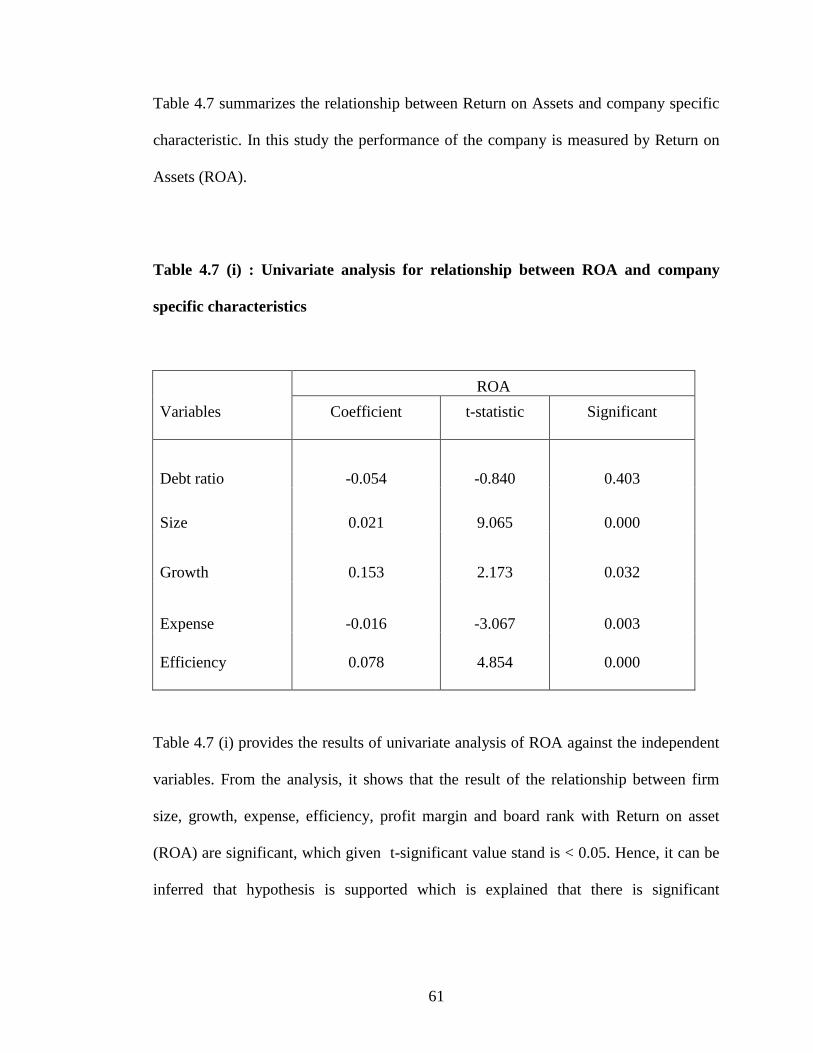
61
Table 4.7 summarizes the relationship between Return on Assets and company specific
characteristic. In this study the performance of the company is measured by Return on
Assets (ROA).
Table 4.7 (i) : Univariate analysis for relationship between ROA and company
specific characteristics
Variables
ROA
Coefficient
t-statistic
Significant
Debt ratio -0.054 -0.840 0.403
Size 0.021 9.065 0.000
Growth 0.153 2.173 0.032
Expense -0.016 -3.067 0.003
Efficiency
0.078
4.854
0.000
Table 4.7 (i) provides the results of univariate analysis of ROA against the independent
variables. From the analysis, it shows that the result of the relationship between firm
size, growth, expense, efficiency, profit margin and board rank with Return on asset
(ROA) are significant, which given t-significant value stand is < 0.05. Hence, it can be
inferred that hypothesis is supported which is explained that there is significant
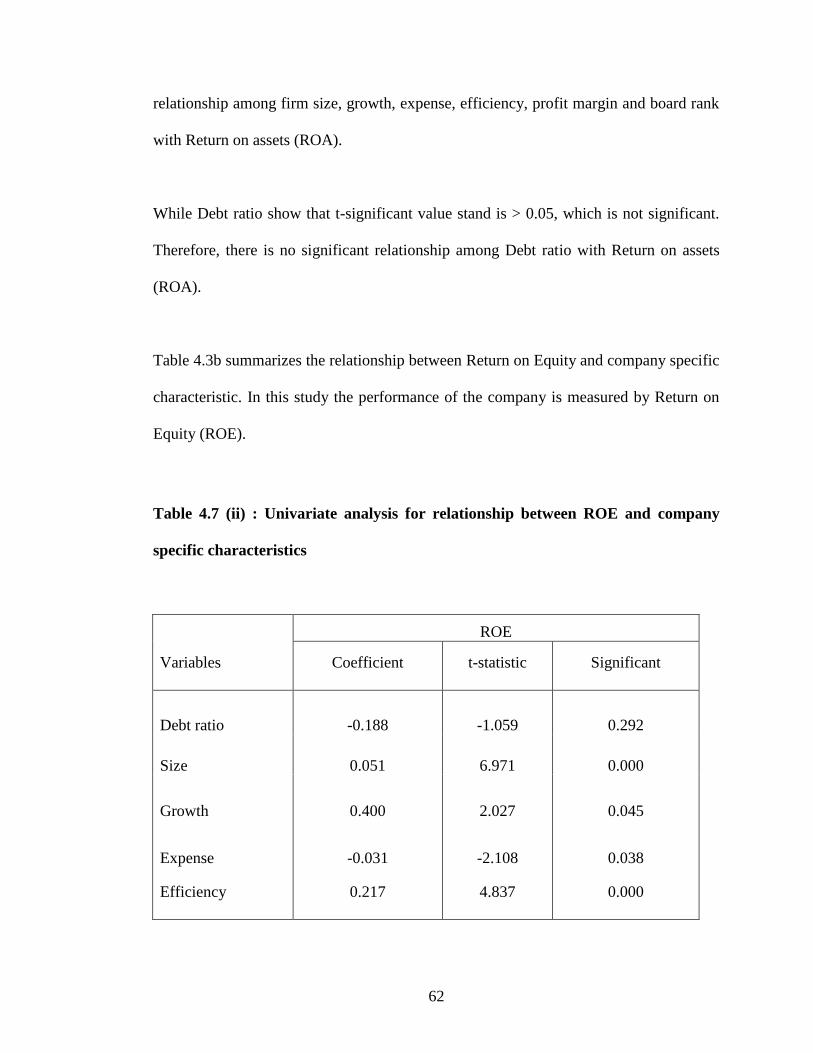
62
relationship among firm size, growth, expense, efficiency, profit margin and board rank
with Return on assets (ROA).
While Debt ratio show that t-significant value stand is > 0.05, which is not significant.
Therefore, there is no significant relationship among Debt ratio with Return on assets
(ROA).
Table 4.3b summarizes the relationship between Return on Equity and company specific
characteristic. In this study the performance of the company is measured by Return on
Equity (ROE).
Table 4.7 (ii) : Univariate analysis for relationship between ROE and company
specific characteristics
Variables
ROE
Coefficient
t-statistic
Significant
Debt ratio -0.188 -1.059 0.292
Size 0.051 6.971 0.000
Growth 0.400 2.027 0.045
Expense -0.031 -2.108 0.038
Efficiency
0.217
4.837
0.000
63
Table 4.7 (ii) provides the results of univariate analysis of ROE against the independent
variables. From the analysis between firm size, growth, expense, efficiency, profit
margin and board rank with Return on equity (ROE) shows that t-significant value stand
is < 0.05, which is significant. Hence, it can be inferred that hypothesis is supported
which is explained that there is significant relationship among firm size, growth,
expense, efficiency, profit margin and board rank with Return on equity (ROE).
While Debt ratio show that t-significant value stand is > 0.05, which is not significant.
Therefore, there is no significant relationship among Debt ratio with Return on equity
(ROE).
4.8 Univariate Analysis of Variance : Top 50 PLC
Table 4.8 (i) summarizes the relationship between Return on Assets and company
specific characteristic for the Top 50 Companies. In this study the performance of the
company is measured by Return on Assets (ROA).
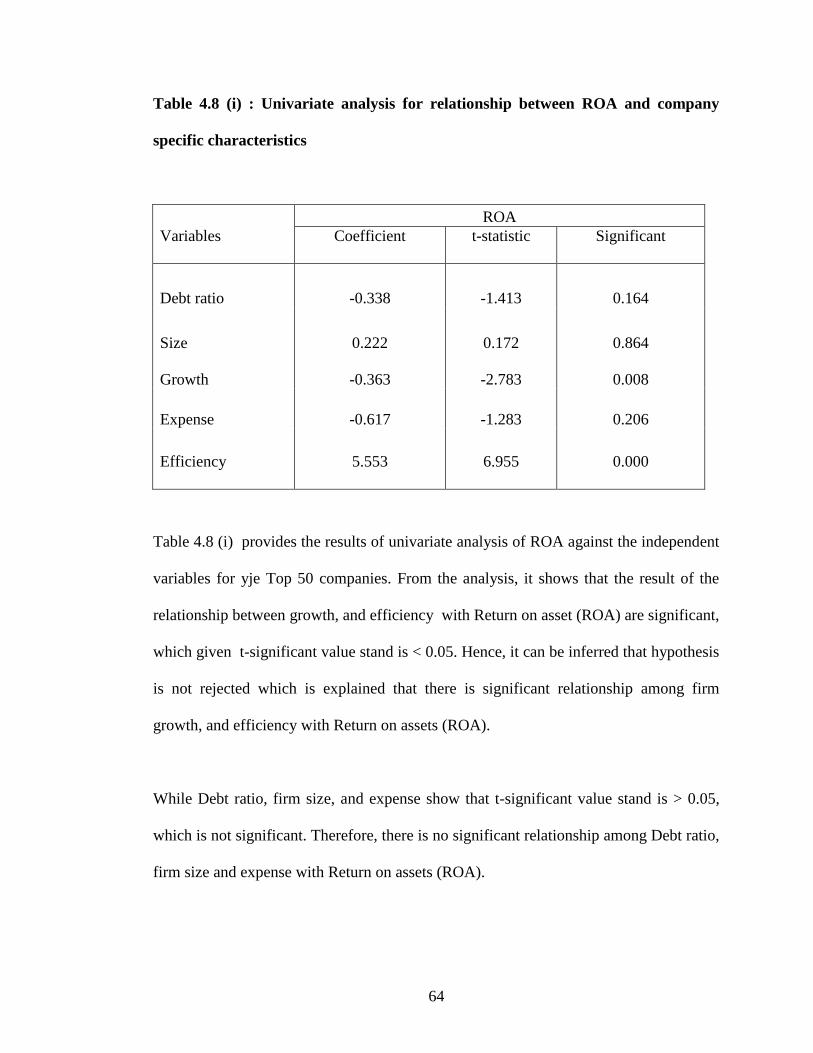
64
Table 4.8 (i) : Univariate analysis for relationship between ROA and company
specific characteristics
Variables
ROA
Coefficient
t-statistic
Significant
Debt ratio -0.338 -1.413 0.164
Size 0.222 0.172 0.864
Growth -0.363 -2.783 0.008
Expense -0.617 -1.283 0.206
Efficiency
5.553
6.955
0.000
Table 4.8 (i) provides the results of univariate analysis of ROA against the independent
variables for yje Top 50 companies. From the analysis, it shows that the result of the
relationship between growth, and efficiency with Return on asset (ROA) are significant,
which given t-significant value stand is < 0.05. Hence, it can be inferred that hypothesis
is not rejected which is explained that there is significant relationship among firm
growth, and efficiency with Return on assets (ROA).
While Debt ratio, firm size, and expense show that t-significant value stand is > 0.05,
which is not significant. Therefore, there is no significant relationship among Debt ratio,
firm size and expense with Return on assets (ROA).
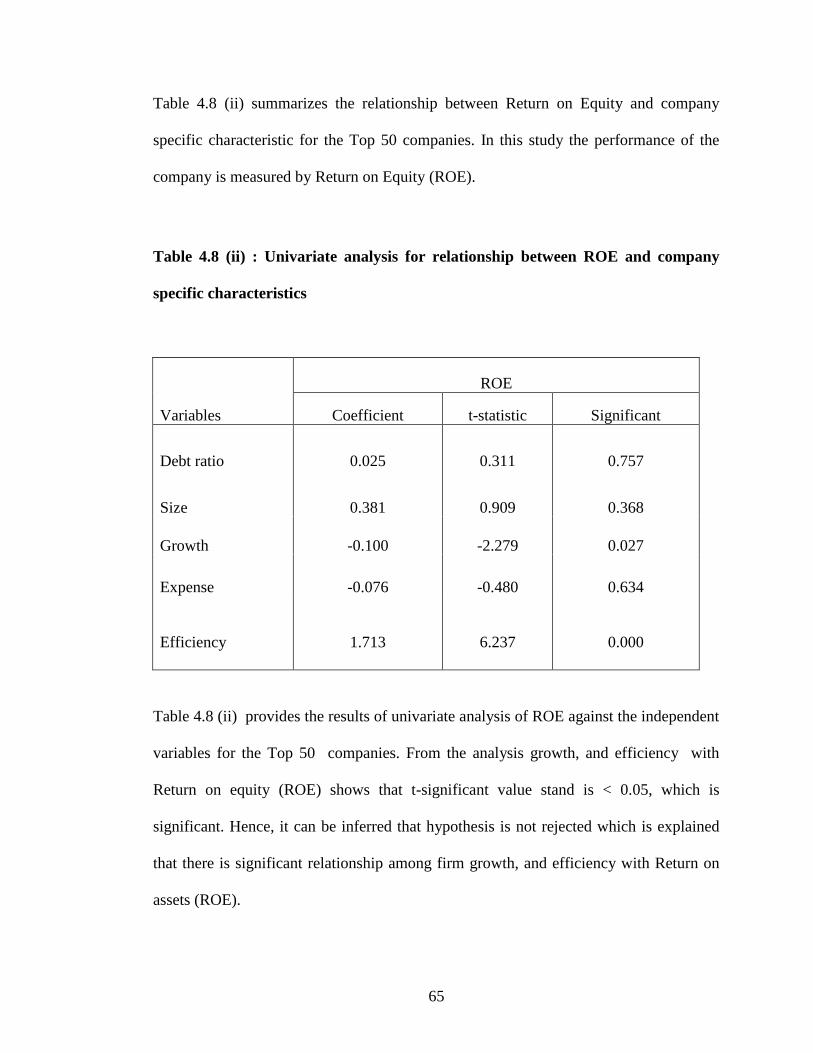
65
Table 4.8 (ii) summarizes the relationship between Return on Equity and company
specific characteristic for the Top 50 companies. In this study the performance of the
company is measured by Return on Equity (ROE).
Table 4.8 (ii) : Univariate analysis for relationship between ROE and company
specific characteristics
Variables
ROE
Coefficient t-statistic Significant
Debt ratio 0.025 0.311 0.757
Size 0.381 0.909 0.368
Growth -0.100 -2.279 0.027
Expense -0.076 -0.480 0.634
Efficiency
1.713
6.237
0.000
Table 4.8 (ii) provides the results of univariate analysis of ROE against the independent
variables for the Top 50 companies. From the analysis growth, and efficiency with
Return on equity (ROE) shows that t-significant value stand is < 0.05, which is
significant. Hence, it can be inferred that hypothesis is not rejected which is explained
that there is significant relationship among firm growth, and efficiency with Return on
assets (ROE).
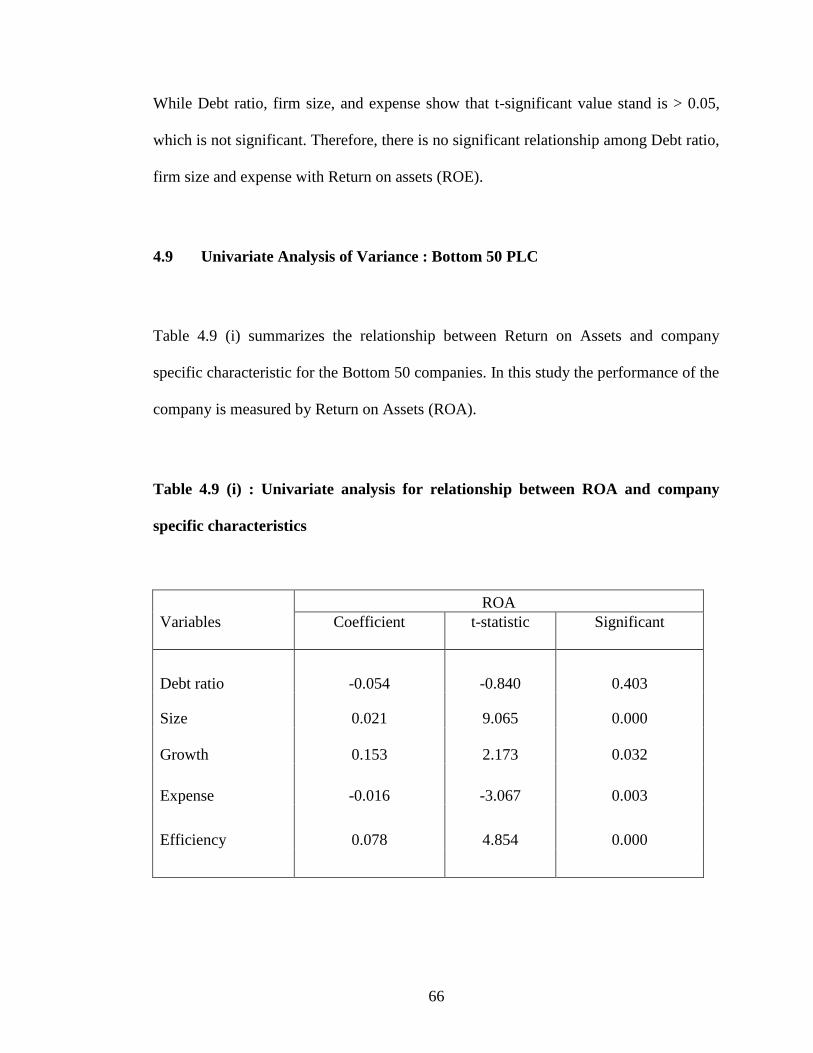
66
While Debt ratio, firm size, and expense show that t-significant value stand is > 0.05,
which is not significant. Therefore, there is no significant relationship among Debt ratio,
firm size and expense with Return on assets (ROE).
4.9 Univariate Analysis of Variance : Bottom 50 PLC
Table 4.9 (i) summarizes the relationship between Return on Assets and company
specific characteristic for the Bottom 50 companies. In this study the performance of the
company is measured by Return on Assets (ROA).
Table 4.9 (i) : Univariate analysis for relationship between ROA and company
specific characteristics
Variables
ROA
Coefficient
t-statistic
Significant
Debt ratio -0.054 -0.840 0.403
Size 0.021 9.065 0.000
Growth 0.153 2.173 0.032
Expense -0.016 -3.067 0.003
Efficiency 0.078 4.854 0.000
67
Table 4.9 (i) provides the results of univariate analysis of ROA against the independent
variables for the Bottom 50 companies. From the analysis, it shows that the result of the
relationship between firm size, growth, expense, and efficiency with Return on asset
(ROA) are significant, which given t-significant value stand is < 0.05. Hence, it can be
inferred that hypothesis is not rejected which is explained that there is significant
relationship among firm size, growth, expense, and efficiency with Return on assets
(ROA).
While Debt ratio show that t-significant value stand is > 0.05, which is not significant.
Therefore, there is no significant relationship among Debt ratio with Return on assets
(ROA).
Table 4.9 (ii) summarizes the relationship between Return on Equity and company
specific characteristic. In this study the performance of the company is measured by
Return on Equity (ROE).
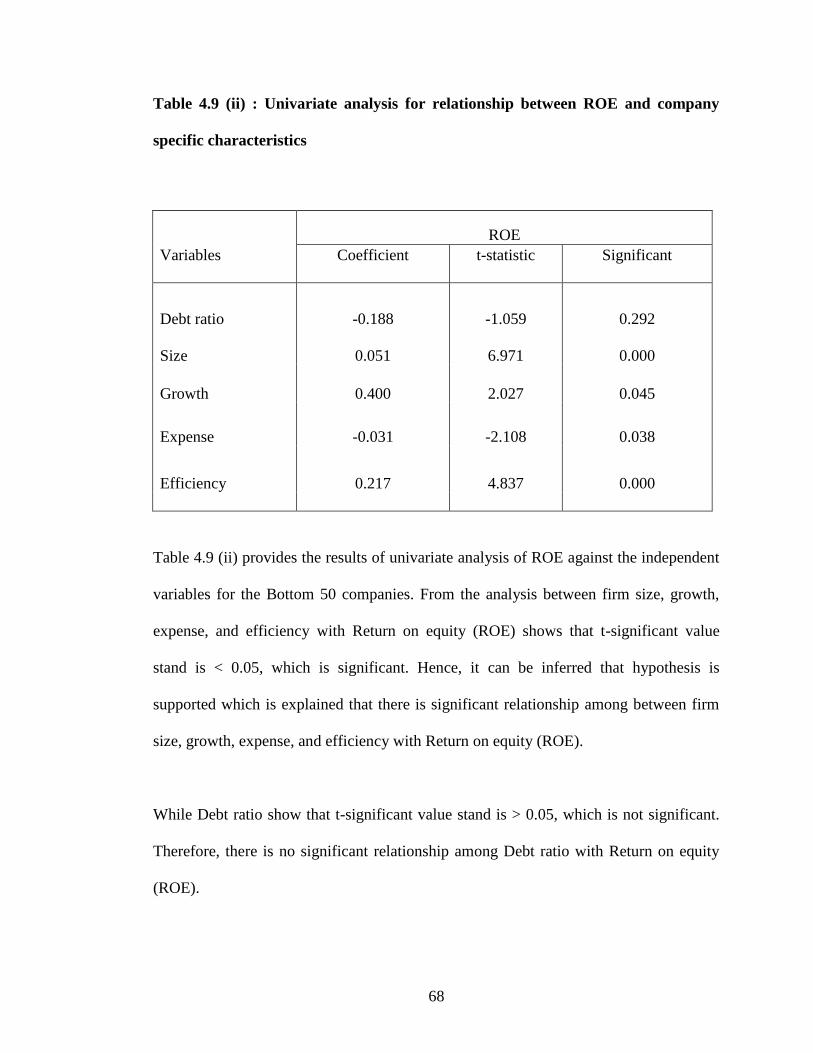
68
Table 4.9 (ii) : Univariate analysis for relationship between ROE and company
specific characteristics
Variables
ROE
Coefficient
t-statistic
Significant
Debt ratio -0.188 -1.059 0.292
Size 0.051 6.971 0.000
Growth 0.400 2.027 0.045
Expense -0.031 -2.108 0.038
Efficiency 0.217 4.837 0.000
Table 4.9 (ii) provides the results of univariate analysis of ROE against the independent
variables for the Bottom 50 companies. From the analysis between firm size, growth,
expense, and efficiency with Return on equity (ROE) shows that t-significant value
stand is < 0.05, which is significant. Hence, it can be inferred that hypothesis is
supported which is explained that there is significant relationship among between firm
size, growth, expense, and efficiency with Return on equity (ROE).
While Debt ratio show that t-significant value stand is > 0.05, which is not significant.
Therefore, there is no significant relationship among Debt ratio with Return on equity
(ROE).
69
4.10 Linear Regression Analysis :
Hypotheses Testing : Pearson Correlation Coefficient – 100 PLC
In statistics, linear regression is an approach for modeling the relationship between a
scalar dependent variable y and one or more explanatory variables denoted X. The case
of one explanatory variable is called simple linear regression. For more than one
explanatory variable, the process is called multiple linear regression
The Pearson Correlation Coefficient is a statistical formula that measures the strength
between variables and relationships. When conducting a statistical test between two
variables, a Pearson Correlation Coefficient value analysis also has been conducted in
order to determine just how strong that relationship is between those two variables.
Table 4.10 summarizes the results of multiple regression analysis of ROA & ROE
against the independent variables for 100 companies (Top 50 and Bottom 50) using the
enter procedure method, where the regression equation was built up one variable at a
time.
The results show that the independent variables in the model could explain 64.6 per
cent of the variation in ROA with an F-value of 37.093 and a probability of 0.000. This
means that collectively, the determining variables have a significant impact on ROA.
70
When each determining variable was examined individually while holding the
remaining predictors constant, Firm Size, Expense and Efficiency are found to be
statistically significant at alpha <0.05 level to explain the variation in ROA, while the
other independent variables were not statistically significant in explaining the variation
in ROA.
Meanwhile, the results also show that the independent variables in the model could
explain 49.7 per cent of the variation in ROE with an F-value of 20.544 and a
probability of 0.000. This means that collectively, the determining variables have a
significant impact on ROE.
When each determining variable was examined individually while holding the
remaining predictors constant, Firm Size and Efficiency were found to be statistically
significant at alpha <0.05 level to explain the variation in ROE, while the other
independent variables were not statistically significant in explaining the variation in
ROE.
From Table 4.10, there are two measurement of performance which is Return on Assets
(ROA) and Return on Equity (ROE). It show that for ROA, the R square resulted from
the analysis represent by 0.664 which means that only 66.4 percent of variability of data
regressed, explained the relationship between the independent and dependent variables.
Meanwhile for ROE show that R square resulted from the analysis represent by 0.522
which means that 52.2 percent of the variation in the return on Equity (ROE) by the
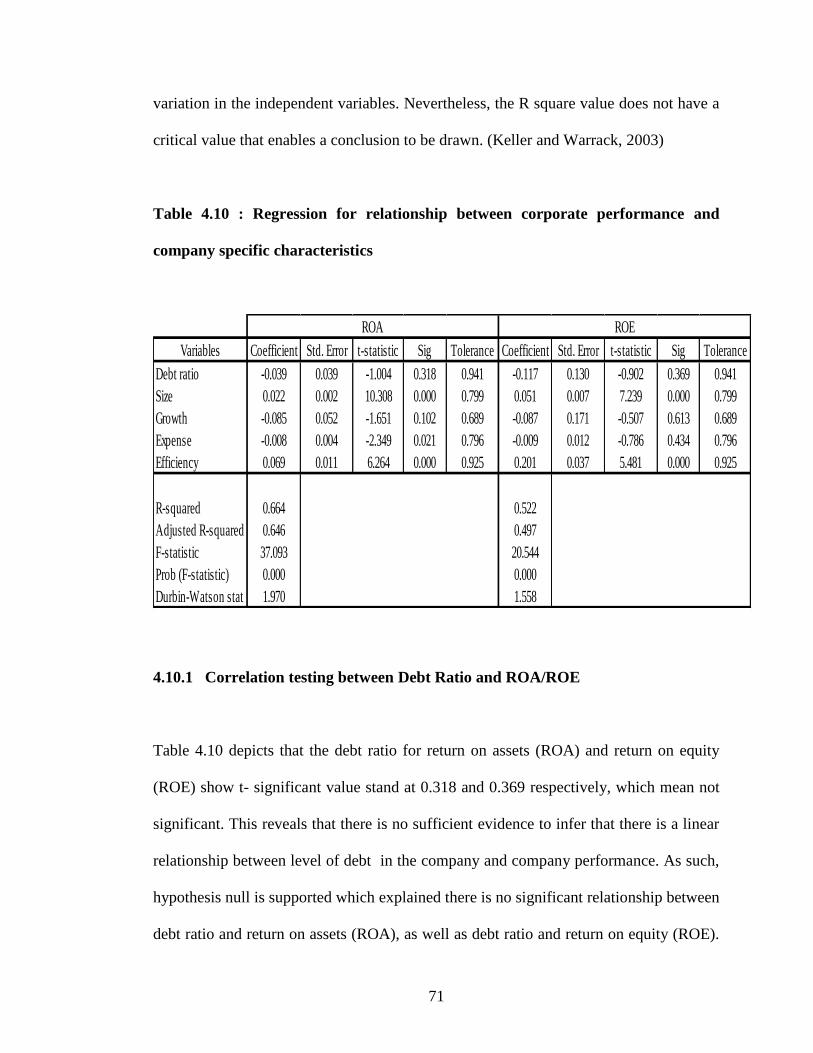
71
variation in the independent variables. Nevertheless, the R square value does not have a
critical value that enables a conclusion to be drawn. (Keller and Warrack, 2003)
Table 4.10 : Regression for relationship between corporate performance and
company specific characteristics
4.10.1 Correlation testing between Debt Ratio and ROA/ROE
Table 4.10 depicts that the debt ratio for return on assets (ROA) and return on equity
(ROE) show t- significant value stand at 0.318 and 0.369 respectively, which mean not
significant. This reveals that there is no sufficient evidence to infer that there is a linear
relationship between level of debt in the company and company performance. As such,
hypothesis null is supported which explained there is no significant relationship between
debt ratio and return on assets (ROA), as well as debt ratio and return on equity (ROE).
Variables Coefficient Std. Error t-statistic Sig Tolerance Coefficient Std. Error t-statistic Sig Tolerance
Debt ratio -0.039 0.039 -1.004 0.318 0.941 -0.117 0.130 -0.902 0.369 0.941
Size 0.022 0.002 10.308 0.000 0.799 0.051 0.007 7.239 0.000 0.799
Growth -0.085 0.052 -1.651 0.102 0.689 -0.087 0.171 -0.507 0.613 0.689
Expense -0.008 0.004 -2.349 0.021 0.796 -0.009 0.012 -0.786 0.434 0.796
Efficiency 0.069 0.011 6.264 0.000 0.925 0.201 0.037 5.481 0.000 0.925
R-squared 0.664 0.522
Adjusted R-squared 0.646 0.497
F-statistic 37.093 20.544
Prob (F-statistic) 0.000 0.000
Durbin-Watson stat 1.970 1.558
ROA ROE
72
Nevertheless, it is interesting to observe that the coefficient is negative. This result in
contrast with the study by Jensen (1999) and Doukas et. al which have proven that debt
ratio is significantly related to agency costs in a company.
4.10.2 Correlation testing between Firm’s Size and ROA/ROE
From the analysis between size and return on assets (ROA) in the table shows that t-
significant value stand at 0.429, which is not significant. Table 4.10 shows that the
coefficient for firm size (t = 0.795) which is not significant, and the coefficient is
positive at 0.008. This means that holding other explanatory variables constant, for each
additional increase in the firm size, no significant changes in return on assets (ROA),
Hence, it can be inferred that hypothesis is rejected.
From the analysis between size and return on equity (ROE) in the table shows that t-
significant value stand at 0.006, which is significant. Hence, it can be inferred that
hypothesis is supported, which explained that there is significant relationship between
size and return on equity (ROE). Table 4.10 shows that the coefficient for firm size (t =
2.824) and the coefficient is positive at 0.093. This means that holding other explanatory
variables constant, for each additional increase in the firm size, the return on equity
(ROE) increases on average by 0.093,. In other words, as the firm size increases will
lead to the increases in the return on equity (ROE).
73
4.10.3 Correlation testing between Company growth and ROA/ROE
From the analysis between growth and return on assets (ROA) in the table shows that t-
significant value stand at 0.102, which is not significant. Table 4.10 shows that the
coefficient for company growth (t = -1.651) which is not significant, and the coefficient
is negative at 0.085. It means that there is no significant difference in the return on
assets (ROA). Hence, the hypothesis is rejected.
From the analysis between growth and return on equity (ROE) in the table shows that t-
significant value stand at 0.613, which is not significant. Table 4.10 shows that the
coefficient for company growth (t = 0.171) which is not significant, and the coefficient
is negative at 0.087. This means that holding other explanatory variables constant, for
each additional increase in the growth, no significant changes in return on equity (ROE),
Hence, the hypothesis is rejected.
This result is in contrast to the study by Crutchley and Jensen (1999), company growth
which was measured by sales growth, was found to be positively and significantly
related with agency costs.
74
4.10.4 Correlation testing between Expense ratio and ROA/ROE
From the analysis between expense and return on assets (ROA) in the table shows that t-
significant value stand at 0.021, which is significant. Table 4.10 shows that the
coefficient for expense (t = 2.349) and the coefficient is negative at 0.008. Hence, the
expense is significantly related with Return on Asset (ROA) which explained that
hypothesis is supported. This means that holding other explanatory variables constant,
each additional increase in expense will lead to increases in ROA on average by 2.349.
In other words, as the expense increase, the ROA also increases.
From the analysis between expense and return on equity (ROE) in the table shows that t-
significant value stand at 0.434, which is not significant. Table 4.10 shows that the
coefficient for expense (t = -0.786) which is not significant, and the coefficient is
negative at 0.009. This means that holding other explanatory variables constant, for each
additional increase in the expense, no significant changes in return on equity (ROE),
Hence, the hypothesis is rejected.
4.10.5 Correlation testing between Efficiency ratio and ROA/ROE
From the analysis, the efficiency for return on assets (ROA) and return on equity (ROE)
in the table shows that t-significant value stand at 0.000, which is significant. Table 4.10
shows that for ROA, the coefficient for efficiency (t = 6.264), and the coefficient is
positive at 0.069. This means that holding other explanatory variables constant, for each
additional increase in the efficiency will lead to the increases in return on assets (ROA)
75
on average by 0.069, Meanwhile, for return on equity (ROE), the coefficient for
efficiency (t = 5.481) and the coefficient is positive at 0.201. . This means that holding
other explanatory variables constant, for each additional increase in the efficiency will
lead to the increases in return on equity (ROE) on average by 0.201. Hence, the
hypothesis is not rejected. In other words, as the efficiency increases, the return on
assets (ROA) and return on equity (ROE) also increases.
The results on both Expense and Efficiency variables in this study are in line with the
study by Ang et. Al. (2000), where expense and efficiency ratio ware found significantly
related to agency costs, despite positive nor negative coefficient.
4.11 Linear Regression Analysis
Hypotheses Testing : Pearson Correlation Coefficient – Top 50 PLC
Table 4.11 summarizes the results of multiple regression analysis of ROA & ROE
against the independent variables for the Top 50 companies using the enter procedure
method, where the regression equation was built up one variable at a time.
The results show that the independent variables in the model could explain 87 per cent
of the variation in ROA with an F-value of 55.676 and a probability of 0.000. This
means that collectively, the determining variables have a significant impact on ROA.
76
When each determining variable was examined individually while holding the
remaining predictors constant, Debt ratio are found to be statistically significant at alpha
<0.05 level to explain the variation in ROA, while the other independent variables were
not statistically significant in explaining the variation in ROA.
Meanwhile, the results also show that the independent variables in the model could
explain 43.5 per cent of the variation in ROE with an F-value of 8.544 and a probability
of 0.000. This means that collectively, the determining variables have a significant
impact on ROE.
When each determining variable was examined individually while holding the
remaining predictors constant, Efficiency were found to be statistically significant at
alpha <0.05 level to explain the variation in ROE, while the other independent variables
were not statistically significant in explaining the variation in ROE.
From Table 4.11, there are two measurement of performance which is Return on Assets
(ROA) and Return on Equity (ROE). It show that for ROA, the R square resulted from
the analysis represent by 0.886 which means that only 88.6 percent of variability of data
regressed, explained the relationship between the independent and dependent variables.
Meanwhile for ROE show that R square resulted from the analysis represent by 0.493
which means that 49.3 percent of the variation in the return on Equity (ROE) by the
variation in the independent variables.
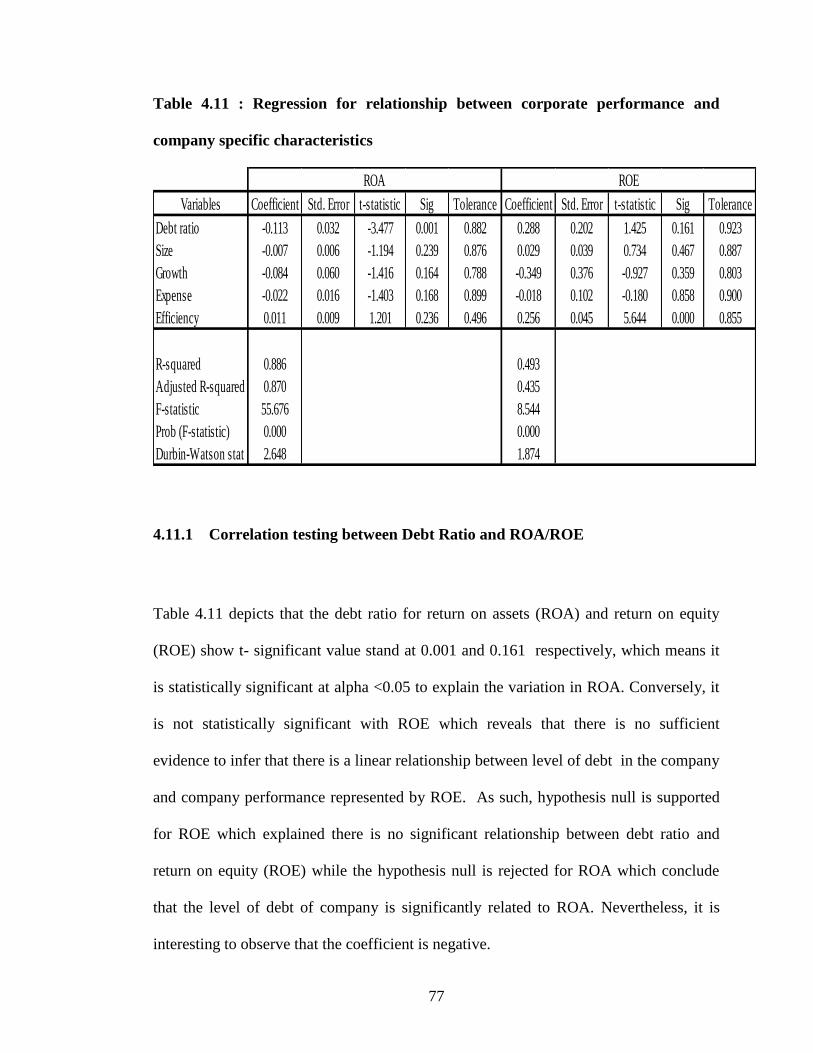
77
Table 4.11 : Regression for relationship between corporate performance and
company specific characteristics
4.11.1 Correlation testing between Debt Ratio and ROA/ROE
Table 4.11 depicts that the debt ratio for return on assets (ROA) and return on equity
(ROE) show t- significant value stand at 0.001 and 0.161 respectively, which means it
is statistically significant at alpha <0.05 to explain the variation in ROA. Conversely, it
is not statistically significant with ROE which reveals that there is no sufficient
evidence to infer that there is a linear relationship between level of debt in the company
and company performance represented by ROE. As such, hypothesis null is supported
for ROE which explained there is no significant relationship between debt ratio and
return on equity (ROE) while the hypothesis null is rejected for ROA which conclude
that the level of debt of company is significantly related to ROA. Nevertheless, it is
interesting to observe that the coefficient is negative.
Variables Coefficient Std. Error t-statistic Sig Tolerance Coefficient Std. Error t-statistic Sig Tolerance
Debt ratio -0.113 0.032 -3.477 0.001 0.882 0.288 0.202 1.425 0.161 0.923
Size -0.007 0.006 -1.194 0.239 0.876 0.029 0.039 0.734 0.467 0.887
Growth -0.084 0.060 -1.416 0.164 0.788 -0.349 0.376 -0.927 0.359 0.803
Expense -0.022 0.016 -1.403 0.168 0.899 -0.018 0.102 -0.180 0.858 0.900
Efficiency 0.011 0.009 1.201 0.236 0.496 0.256 0.045 5.644 0.000 0.855
R-squared 0.886 0.493
Adjusted R-squared 0.870 0.435
F-statistic 55.676 8.544
Prob (F-statistic) 0.000 0.000
Durbin-Watson stat 2.648 1.874
ROA ROE
78
4.11.2 Correlation testing between Firm’s Size and ROA/ROE
From the analysis between size and return on assets (ROA) in the table shows that t-
significant value stand at 0.239, which is not significant. Table 4.11 shows that the
coefficient for firm size (t = 1.194) and the coefficient is negative at 0.007. This means
that holding other explanatory variables constant , for each additional increase in the
firm size, no significant changes in return on assets (ROA),. Hence, it can be inferred
that hypothesis is rejected.
From the analysis between size and return on equity (ROE) in the table shows that t-
significant value stand at 0.467, which is not significant. Table 4.11 shows that the
coefficient for firm size (t = 0.734) and the coefficient is negative at 0.029. This means
that holding other explanatory variables constant , for each additional increase in the
firm size, no significant changes in return on assets (ROE),. Hence, it can be inferred
that hypothesis is rejected.
4.11.3 Correlation testing between Company growth and ROA/ROE
From the analysis between growth and return on assets (ROA) in the table shows that t-
significant value stand at 0.164, which is not significant. Table 4.11 shows that the
coefficient for company growth (t = -1.416) which is not significant, and the coefficient
is negative at 0.084. It means that there is no significant difference in the return on
assets (ROA). Hence, the hypothesis is rejected.
79
From the analysis between growth and return on equity (ROE) in the table shows that t-
significant value stand at 0.359, which is not significant. Table 4.11 shows that the
coefficient for company growth (t = -0.927) which is not significant, and the coefficient
is negative at 0.349. This means that holding other explanatory variables constant, for
each additional increase in the growth, no significant changes in return on equity (ROE),
Hence, the hypothesis is rejected.
4.11.4 Correlation testing between Expense ratio and ROA/ROE
From the analysis between expense and return on assets (ROA) in the table shows that t-
significant value stand at 0.168, which is not significant. Table 4.11 shows that the
coefficient for expense (t = -1.212) which is not significant, and the coefficient is
negative at 0.022. It means that there is no significant difference in the return on assets
(ROA). Hence, the hypothesis is rejected.
From the analysis between expense and return on equity (ROE) in the table shows that t-
significant value stand at 0.858, which is not significant. Table 4.11 shows that the
coefficient for expense (t = 0.102) which is not significant, and the coefficient is
negative at 0.018. This means that for each additional increase in the expense, no
significant changes in return on equity (ROE), holding other explanatory variables
constant. Hence, the hypothesis is rejected.
80
4.11.5 Correlation testing between Efficiency ratio and ROA/ROE
From the analysis between efficiency and return on assets (ROA) in the table shows that
t-significant value stand at 0.236, which is not significant. Table 4.11 shows that the
coefficient for company growth (t = 1.201) which is not significant, and the coefficient
is positive at 0.011. It means that there is no significant difference in the return on assets
(ROA). Hence, the hypothesis is rejected.
From the analysis between efficiency and return on equity (ROE) in the table shows that
t-significant value stand at 0.000, which is significant. Hence, it can be inferred that
hypothesis is supported, which explained that there is significant relationship between
efficiency and return on equity (ROE). Table 4.11 shows that the coefficient for firm
size (t = 5.644) and the coefficient is positive at 0.256. This means that holding other
explanatory variables constant, for each additional increase in the firm size, the return
on equity (ROE) increases on average by 0.256,. In other words, as the firm size
increases will lead to the increases in the return on equity (ROE).
81
4.12 Linear Regression Analysis
Hypotheses Testing : Pearson Correlation Coefficient – Bottom 50 PLC
Table 4.12 summarizes the results of multiple regression analysis of ROA & ROE
against the independent variables for the Bottom 50 Companies using the enter
procedure method, where the regression equation was built up one variable at a time.
The results show that the independent variables in the model could explain 26.3 per cent
of the variation in ROA with an F-value of 4.495 and a probability of 0.002. This means
that collectively, the determining variables have a significant impact on ROA.
When each determining variable was examined individually while holding the
remaining predictors constant, Firm size are found to be statistically significant at alpha
<0.05 level to explain the variation in ROA, while the other independent variables were
not statistically significant in explaining the variation in ROA.
Meanwhile, the results also show that the independent variables in the model could
explain 45 per cent of the variation in ROE with an F-value of 9.013 and a probability of
0.000. This means that collectively, the determining variables have a significant impact
on ROE.
When each determining variable was examined individually while holding the
remaining predictors constant, Debt ratio & Firm Size were found to be statistically
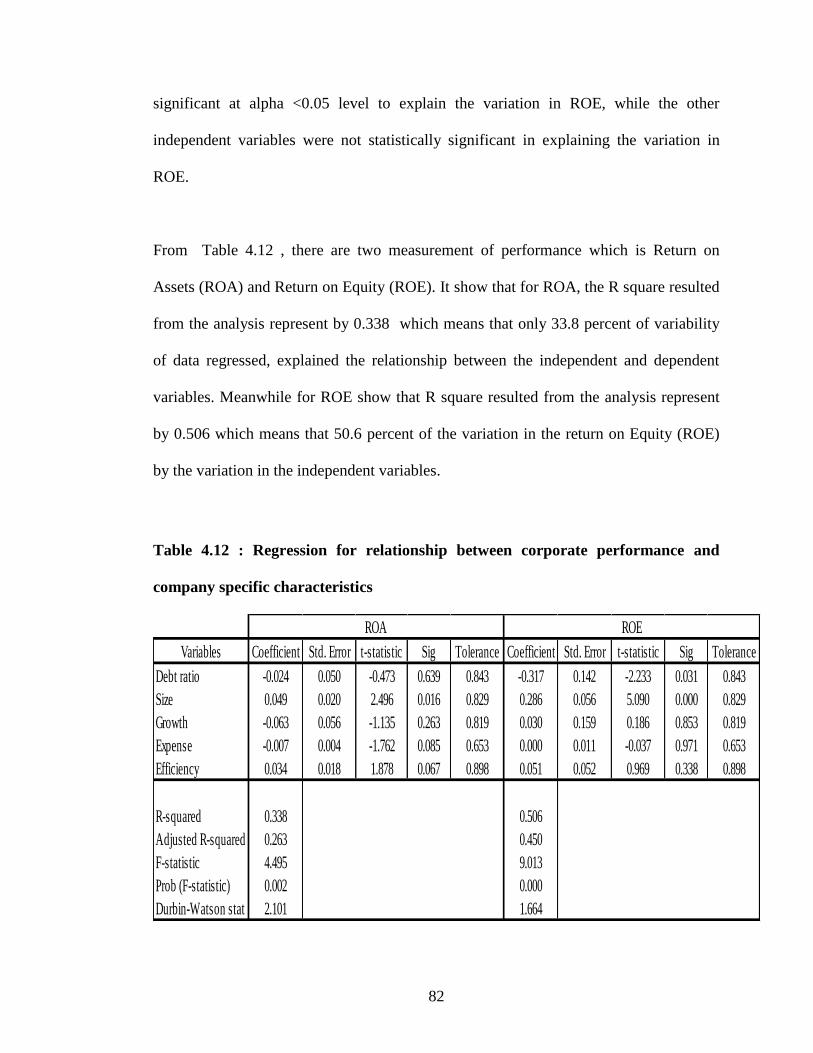
82
significant at alpha <0.05 level to explain the variation in ROE, while the other
independent variables were not statistically significant in explaining the variation in
ROE.
From Table 4.12 , there are two measurement of performance which is Return on
Assets (ROA) and Return on Equity (ROE). It show that for ROA, the R square resulted
from the analysis represent by 0.338 which means that only 33.8 percent of variability
of data regressed, explained the relationship between the independent and dependent
variables. Meanwhile for ROE show that R square resulted from the analysis represent
by 0.506 which means that 50.6 percent of the variation in the return on Equity (ROE)
by the variation in the independent variables.
Table 4.12 : Regression for relationship between corporate performance and
company specific characteristics
Variables Coefficient Std. Error t-statistic Sig Tolerance Coefficient Std. Error t-statistic Sig Tolerance
Debt ratio -0.024 0.050 -0.473 0.639 0.843 -0.317 0.142 -2.233 0.031 0.843
Size 0.049 0.020 2.496 0.016 0.829 0.286 0.056 5.090 0.000 0.829
Growth -0.063 0.056 -1.135 0.263 0.819 0.030 0.159 0.186 0.853 0.819
Expense -0.007 0.004 -1.762 0.085 0.653 0.000 0.011 -0.037 0.971 0.653
Efficiency 0.034 0.018 1.878 0.067 0.898 0.051 0.052 0.969 0.338 0.898
R-squared 0.338 0.506
Adjusted R-squared 0.263 0.450
F-statistic 4.495 9.013
Prob (F-statistic) 0.002 0.000
Durbin-Watson stat 2.101 1.664
ROA ROE
83
4.12.1 Correlation testing between Debt Ratio and ROA/ROE
Table 4.12 depicts that the debt ratio for return on assets (ROA) and return on equity
(ROE) show t- significant value stand at 0.639 and 0.031 respectively, which mean not
significant. This reveals that there is no sufficient evidence to infer that there is a linear
relationship between level of debt in the company and company performance
represented by ROA. As such, hypothesis null is supported which explained there is no
significant relationship between debt ratio and return on assets (ROA), as well as debt
ratio and return on equity (ROE). Nevertheless, it is interesting to observe that the
coefficient is negative.
4.12.2 Correlation testing between Firm’s Size and ROA/ROE
From the analysis between size and Return on Asset (ROA) in the table shows that t-
significant value stand at 0.016, which is significant. Hence, it can be inferred that
hypothesis is supported, which explained that there is significant relationship between
size and Return on Asset (ROA). Table 4.12 shows that the coefficient for firm size (t =
2.496) and the coefficient is positive at 0.049. This means that holding other explanatory
variables constant, for each additional increase in the firm size, Return on Asset (ROA)
increases on average by 0.049, In other words, as the firm size increases will lead to the
increases in the Return on Asset (ROA).
84
From the analysis between size and Return on Equity (ROE) in the table shows that t-
significant value stand at 0.000, which is significant. Hence, it can be inferred that
hypothesis is supported, which explained that there is significant relationship between
size and Return on Equity (ROE) Table 4.12 shows that the coefficient for firm size (t =
5.090) and the coefficient is positive at 0.286. This means that holding other explanatory
variables constant, for each additional increase in the firm size, Return on Equity
(ROE) increases on average by 0.286, In other words, as the firm size increases will
lead to the increases in the Return on Equity (ROE). Hence, it can be inferred that
hypothesis is not rejected.
4.12.3 Correlation testing between Company growth and ROA/ROE
From the analysis between Growth and return on assets (ROA) in the table shows that t-
significant value stand at 0.263, which is not significant. Table 4.12 shows that the
coefficient for Growth (t = -1.135) which is not significant, and the coefficient is
negative at 0.063. It means that there is no significant difference in the return on assets
(ROA). Hence, the hypothesis is rejected.
From the analysis between Growth and return on equity (ROE) in the table shows that t-
significant value stand at 0.853, which is not significant. Table 4.12 shows that the
coefficient for Growth (t = 0.186) which is not significant, and the coefficient is positive
at 0.030. This means that for each additional increase in the Growth, no significant
85
changes in return on equity (ROE), holding other explanatory variables constant. Hence,
the hypothesis is rejected.
4.12.4 Correlation testing between Expense ratio and ROA/ROE
From the analysis between Expense and return on assets (ROA) in the table shows that
t-significant value stand at 0.085, which is not significant. Table 4.12 shows that the
coefficient for Expense (t = -1.762) which is not significant, and the coefficient is
positive at 0.007. It means that there is no significant difference in the return on assets
(ROA). Hence, the hypothesis is rejected.
From the analysis between Expense and return on equity (ROE) in the table shows that
t-significant value stand at 0.971, which is not significant. Table 4.12 shows that the
coefficient for Expense (t = -0.037) which is not significant, and the coefficient is
positive at 0.000. This means that holding other explanatory variables constant, for each
additional increase in the Expense, no significant changes in return on equity (ROE).
Hence, the hypothesis is rejected.
4.12.5 Correlation testing between Efficiency ratio and ROA/ROE
From the analysis between Efficiency and return on assets (ROA) in the table shows that
t-significant value stand at 0.085, which is not significant. Table 4.12 shows that the
coefficient for Efficiency (t = -1.762) which is not significant, and the coefficient is

86
positive at 0.007. It means that there is no significant difference in the return on assets
(ROA). Hence, the hypothesis is rejected.
From the analysis between Efficiency and return on equity (ROE) in the table shows
that t-significant value stand at 0.971, which is not significant. Table 4.12 shows that the
coefficient for Efficiency (t = -0.037) which is not significant, and the coefficient is
positive at 0.000. This means that holding other explanatory variables constant, for each
additional increase in the Efficiency, no significant changes in return on equity (ROE).
Hence, the hypothesis is rejected.
4.13 Chapter Summary
In this chapter, researcher use SPSS to process and tabulate the data. Based on this data,
analysis of descriptive statistic, univariate analysis, pearson and correlation coefficient
test have been used. These test can give us the result on hypotheses developed earlier.
87
CHAPTER FIVE
CONCLUSION AND RECOMMENDATION
5.0 Introduction
This chapter discusses the conclusion of the study that has been carried out and the
implications of the results for the benefit of future study. This study is intended to
determine the relationship between the five independent variables namely debt ratio,
firm’s size, company growth, expense ratio, efficiency ratio; and a dependent variable,
corporate performance. This chapter also presented the implications and further
recommendations for future research.
5.1 Findings & Discussions
By using 100 companies listed as Top 50 and Bottom 50 of the Bursa Malaysia in the
year 2008 to 2012, seven determining variables were regressed against the ROA and
ROE.
The Firm size, Growth, Expense, and Efficiency was found to have significant effect in
explaining the performance of the company which is ROA and ROE. Based on ROA,
the variable could explain 64.6 per cent of the variation in ROA with an F-value of
37.093 and a probability of 0.000. This means that collectively, the determining
88
variables have a significant impact on ROA. The other independent variables were
found to have no significant effect in explaining the variation of ROA for the
regressions.
Based on the result, it can be inferred that, when each determining variable was
examined individually while holding the remaining predictors constant, Firm size,
Growth, Expense, and Efficiency are found to be statistically significant at alpha <0.05
level to explain the variation in ROA, while the other independent variables were not
statistically significant in explaining the variation in ROA.
Meanwhile, the Firm size, Growth, Expense, and Efficiency also were found to have a
significant effect in explaining the variation of ROE. These variables could explain 49.7
per cent of the variation in ROE with an F-value of 20.544 and a probability of 0.000.
This means that collectively, the determining variables have a significant impact on
ROE. The other independent variables were found to have no significant effect in
explaining the variation of ROE for the regressions.
Based on the result, it can be inferred that, when each determining variable was
examined individually while holding the remaining predictors constant, Firm size,
Growth, Expense, and Efficiency were found to be statistically significant at alpha
<0.05 level to explain the variation in ROE, while the other independent variables were
not statistically significant in explaining the variation in ROE.
89
From the Multiple linear regression analysis, the result shows that the coefficient for
firm size (t = 10.308), Expense (t = -2.349) and Efficiency (t= 6.464), are significant.
While the coefficient are 0.022, -0.008, and 0.069 respectively. This means that .
holding other explanatory variables constant, for each additional increase in the firm
size, expense, and Efficiency, the Return on Asset (ROA) increases on average by
0.022, decreases by -0.008, and increases by 0.069 respectively. In other words, as the
firm size, Expense and Efficiency increases, the return on equity (ROA) also increases.
Meanwhile in regards to Return on Equity (ROE), the result also shows that the
coefficient for firm size (t = 7.239), and Efficiency (t= 5.481), are significant. While the
coefficient are positive at 0.051 and 0.201 respectively. This means that . holding other
explanatory variables constant, for each additional increase in the firm size and
Efficiency, the Return on Equity (ROE)) increases on average by 0.051 and 0.201
respectively. In other words, as the firm size and Efficiency increases, Return on Equity
(ROE) also increases.
Besides, this research use the Pearson Correlation Matrix. From the result, the
dependent variables, ROA and ROE are considered significantly correlated with all
variables, either at the 0.01 or 0.05 level, except for the debt ratio. However, the
correlation benchmark for this study is at the level of 0.05. Therefore, the dependent
variables, Return on Assets (ROA) is significantly correlated with only one independent
variable at alpha = 0.05 level which is company growth. While Return on Equity (ROE)
is significantly correlated with three of the independent variables at alpha = 0.05 level.
ROE is negatively correlated with Expense (-0.208), and positively correlated with
90
company growth (0.201) and profit margin (0.238). Based on the benchmark of alpha =
0.05 level, the other independent variables were not significantly correlated with ROA
& ROE.
5.2 Summary of major findings
Among the independent variables, the top 2 highest correlation was between Size and
Board rank, as well as Expense and Profit margin. The degree of collinearity for the two
variables was 0.981 and -0.976 respectively; and both are significant at alpha = 0.05
level. This means when Firm size moves or changes, Board rank will change
accordingly by approximately 98.1 per cent; meanwhile when Expense moves or
changes, Profit margin changes inversely by approximately 97.6 per cent.
5.3 Implication of the Study
This study found the relationship between agency cost and corporate performance,
where performance of the company is measured by Return on Assets (ROA) and Return
on Equity (ROE). The agency theory in modern corporate finance suggests the presence
of a conflict of interest between managers and shareholders in firms. Hence, this
research has identified the important mechanism that is likely to mitigate these agency
costs.
91
5.4 Theoritical & Practical of the Study
Several implications can be formulated based on the findings that have been obtained.
The implications are as follows:
Theory contribution
1. It is n additional empirical prove in explaining the relationship of the agency
cost towards the corporate performance.
2. It provides some information for the future research and it can be such an
indicator and reference for future research especially in Malaysian context.
3. Explaining the contribution factors towards corporate performance through the
proxy of agenct costs.
Practical contribution
1. It gives more understanding to the shareholder on how to handle and align with
their management as well as to reduce agency cost and increase corporate
performance.
2. It gives an opportunities to the organizations in Malaysia industry in improving
their systems and policy in managing agency relationship issues.
3. Determination of the contribution factor through data analysis
92
5.5 Recommendation for future study
The research could be well developed and better interpreted in a different ways in
consideration of the followings:
(1) A repeat of the study, which takes all listed companies in Bursa Malaysia and PN 17
companies in Malaysia as sample and examines the relationship between agency cost
and corporate performance. There was no more “main board” and “second board” of
companies in KLSE. Companies that triggered any of the criteria pursuant to Practice
Note 17 of the Main Market Listing Requirements of Bursa Malaysia Securities Berhad
which came into effect on 3 August 2009. In view of this, there should be a
comprehensive study on characteristics of all listed companies in Bursa Malaysia. The
results might be different as compared to the current study as this study only focusing
on the Top 50 and the Bottom 50 listed companies which is assuming the similar
categorization as before, i.e Main Board & Second Board; therefore limited in its
coverage.
(2) The direct measurements of company performance in this study are Return on
Assets (ROA) and Return on Equity (ROE). For future research, take the Tobin Q as
measured based on performance of the company. During the research as well as the
analysis processes several other ideas turned up that could be of interest and worthwhile
to investigate more thoroughly.
93
(3) For future research, it could be the same method of data collection such as relies on
secondary data that obtained from published report in time series. In this study, it took
time series data from the year of 2008 to 2012 as available are used for estimation. A
repeat of research, proposed to take time series data from the year of 2013 onwards.
These annually data were obtained from Bursa Malaysia, and other else.
5.6 Conclusion
The study can give us indicator on the affecting factors and can be used to predict the
corporate performance among public listed companies in Malaysia.
The result gathered after analyzing the data acquired from Bursa Malaysia before
explained that only Firm’s size, Expense and Efficiency has the relationship with the
significant value of 0.000. Debt ratio and growth variables was not significant with
Corporate Performance.
In summary, by this result, it may help the organisation to re-form and re-design its
management and monitoring system as to be able to maximize shareholder wealth and
reduce the agency costs.
94
REFERENCE
Adams, R. and Mehran, H.(2003). Is Corporate Governance Different for
Bank Holding Companies?. Working paper. Federal Reserve Bank of New York
Agrawal, A. and Knoeber, C.R. (1996). Firm Performance and Mechanisms to
Control Agency Problems Between Managers and Shareholders.
Journal of Financial and Qualitative Analysis. Vol 31, 377-397
Anderson, Ronald C., and David M. Reeb, (2003). Founding-family ownership and firm
performance: Evidence from the S&P 500, Journal of Finance 58, 1301–1328
Ang, J.S., Cole, R.A., Lin, J.W. (2000). Agency Cost and Ownership Structure,
Journal of Finance 55, 81-106.
Ang, J.S., R.A. Cole and J.W.Lin. (2000). Agency costs and ownership structure.
Journal of Finance 55(1): 81-106
Ball, R. &Foster, G. (1982). “Corporate Financial Reporting : a Methodological Review
of Empirical Research” . Journal of Accounting Research, Vol. 20, pp. 161-248.
Bala Ramasamy, Darryl Ong and Matthew C. H. Yeung, (2005). “Firm Size,
Ownership and Performance in the Malaysian Palm Oil Industry”,
Asian Academy of Management Journal of Accounting and
Finance, Vol. 1, 81–104, 2005
Becker, C.L., M.L.Defond, J.Jiambalvo and K.R.Subramanyam. (1998).
The effect of audit quality on earnings management.
Contemporary Accounting Research 15:1-24
Berle, A. & Means, G., (1932). The Modern Corporation and Private Property,
MacMillan, New York
Booth, J.R. and Deli, D.N. (1996). Factors Affecting the Member of
Outsider Directorships by CEO’s. Journal of Financial Economics.
Vol 40 No 55. 81-104
Brealey, R.A. and S.C.Myers. (2000). Principles of Corporate Finance. New York:
McGraw Hill.
Brander, James and Lewis, (1986) “Oligopoly and Financial Structure.”. American
Economic Review, 76(5), pp 956-70
Brewer III, E.Jackson III, W. and Jagliani, J.(2000). Impact of Independent Directors
and the Regulatory Environment on Bank Merger Prices:
95
Evidence from Takeover Activity in 1990s, Working Paper 2000-31,
Federal Reservc Bank of Chicago
Brickley, J.A., Coles, J.L., and Terry, R.L. (1994). Outside Directors and the Adoption
of Poison Pills. Journal of Financial Economics. Vol 34, 371-390
Bryd, J.W. and Hickman, K.A. (1992). Do Outside Directors Monitor Managers?
Journal of Financial Economics. Vol 32, 195-221
.
Cadbury Committee, (1992). Report Of The Committee On The Financial
Aspects Of Corporate Governance, London: Gee.
Carline, N.F., Linn, S.C. and Yadav, P.K. (2002). The Influence of Managerial
Ownership on the Real Gains in Corporate Mergers and Market Revaluation of
Mergers Partners: Empirical Evidence. Working Paper, Univ. of Oklahoma
Cho, M. H., (1998). Ownership Structure, Investment and the Corporate
Value: An Empirical Analysis, Journal of Financial Economics 47,103-121.
Chung, R., M. Firth and J.B.Kim. (2002). Institutional monitoring and
opportunistic earnings management. Journal of Corporate Finance 8:29-48
Crutchley, C.E. and M.R.H.Jensen.(1999). Agency problems and the simultaneity
of financial decision making. International Review of Financial Analysis
8(2):177-198
Cotter, J., Shivdasani, A., and Zenner, M. (1997). “Do Independent Directors Enhance
Target Shareholders Wealth During Tender Offers?”
Journal of Financial Economics. Vol 43, 195-218
Coughlan, A. and Schmidt, R. (1985). Executive Compensation, Management Turnover,
and Firm Performance: An Empirical Investigation.
Journal of Accounting and Economics, Vol 7, 43-66
Cremers, K.J. and Nair, V.B. (2004). Governance Mechanisms and Equity Prices.
Working paper, Yale International Center for Finance, No. 03-15
Chen, P.C., & Fang, S.C. (2011). Can agency theory disclose organizational
commitment? Exploring employees and agency workers.
Paper presented at the Technology Management Conference (ITMC),
International Conference on (100-102). IEEE.
Claessens, S. and Djankov, S.(1998). Ownership Concentration and Corporate
Performance in the Czech Republic, Journal of Comparative Economics,
27, 498–514.
Daily, C.M. and Dalton, D.R. (1998). “Does Board Composition Affect Corporate
96
Performance? No!”. Directorship, Vol 24, pp.7-9.
Dennis, D. and McConnell, J.J.(2003). International Corporate Governance.
Journal of Financial and Quantitative Analysis Vol 38, 1-36
DeFond, M.L. and C.W.Park.(1997). Smoothing income in anticipation of future
earnings. Journal of Accounting and Economics 23:115-139
Doukas, J., C.F.Kim and C.Pantzalis. (2001). Security analysis, agency costs and firm
characteristics. Financial Analysts Journal 56(6):54-63.
Demsetz, H. and B. Villalonga, (2001). Ownership structure and corporate
performance, Journal of Corporate Finance 7, 209-233.
Demsetz, H. and K. Lehn, (1985), The Structure of Corporate Ownership:
Causes and Consequences, Journal of Political Economy 93, 1155-1177.
Eisenberg, T., Sundgren, S., and Wells, M. (1998). Larger Board Size and Decreasing
Firm Value in Small Firms. Journal of Financial Economics. Vol 48, 35-54
Eisenhardt, K.M. (1989). Agency theory: An assessment and review.
Academy of management review, 57-74.
Emmons, W.R. and Schmid F.A. (1999). Corporate Governance and Corporate
Performance, Working Paper 99-018, Federal Reserve Bank of St.
Louis, Research Division.
Evelyn J.Sowell, Rita J.Casey (1982). Research Method in Education.
Fama, E.F.and M.C.Jensen.(1983). Separation of ownership and control.
Journal of Law and Economics 26:301-325
Fama, Eugene F., and Michael C. Jensen, (1983a). Separation of ownership and
control,
Journal of Law and Economics 26,301-325.
Fama, Eugene F., and Michael C. Jensen, (1983b). Agency problems and residual
claims,
Journal of Law and Economics 26, 327-49.
Fama, E., (1980). Agency problems and the theory of the firm.
Journal of Political Economy 88, 288-307.
Favero, C.A., Giglio, S.W., Honorati, M., and Panunzi, F. (2006).
The Performance of Italian Family Firms.
ECGI Working Paper No. 127
97
Fleming, G., R. Heaney and R. McCosker, (2005). Agency costs andownership structure
in Australia, Pacific-Basin Finance Journal 13, 29-52
Florackis, C. & Ozkan A., (2004). Agency Costs And Corporate Governance
Mechanisms: Evidence For UK Firms. Working Paper, University of York,UK.
Gladstein, D.J. (1984). Groups in Context: A Model of Task Group Effectiveness.
Administrative Science Quarterly, Vol 29, 499-517
Ghemawat, P.,&Khanna, T. (1998). The nature of diversified business groups: A
Research design and two case studies. Journal of Industrial Economics, 46: 35
61.
Gorriz, C.G. and Fumas, V.S (2005). Family Ownership and Performance: The Net
Effect
of Production Efficiency and Growth Constraint, ECGI Working paper No.
66/2005.
Haslindar Ibrahim, M. Fazilah Abdul Samad, and Afizar Amir. (2008). Board Structure
and Corporate Performance: Evidence from Public-Listed Family-Ownership in
Malaysia.
Haniffa, R. and Hudaib, M. (2006). Corporate Governance Structure and Performance
of
Malaysian Listed Companies. Journal of Business Finance and Accounting.
Vol 33 No 7-8, 1034-1062
Hermalin, B.E. and Weisbach, M.S. (1988). The Determinants of Board Composition.
Rand Journal of Economics, Vol 19 No 4, 589-606
Hermalin, B.E. and Weisbach, M.S. (1991). The Effects of Board Composition and
Direct Incentives on Firm Performance. Financial Management, 101-112
Hermalin, B.E. & Weisbach, M.S. (2003). Boards of Directors as an Endogenously
Determined Institution: A Survey of the Economic Literature.
Economic Policy Review, Vol April, 7-25
Harris, O., & Glegg, C. (2009). Governance quality and privately negotiated stock
repurchases: Evidence of agency conflict. Journal of Banking & Finance, 33(2),
317-325.
Hill, C.W.L., & Jones, T.M. (1992). Stakeholder‐agency theory.
Journal of management studies, 29(2), 131-154 .
Himmelberg, C. P., Hubbard, R. G. and Palia, D.(1999). Understanding the
Determinants
Of Managerial Ownership and the Link Between Ownership and Performance,
Journal of Financial Economics, 53, 353–384.
98
Hideki Kanda, Debtholders and Equityholders. (1992)
JOURNAL OF LEGAL STUDIES 431, 440–1, 444–5
Henry Hansmann. (1996). THE OWNERSHIP OF ENTERPRISE, 39–44
Heckerman, D.G. (1975) “Motivating Managers to make investment decisions”.
Journal of Financial Economics 2, No. 3, 273-292.
Jensen, M., & Meckling, W. (1995). Specific and general knowledge and organizational
structure. Harvard University Press.
Jensen, M.C. (2008). Agency costs of overvalued equity.
Financial Management,34(1), 5-19.
Jensen, M.C. (1988). Takeover, their causes and consequences.
Journal of Economic Perspectives 2:21-48
Jensen, M.C. and W.H.Meckling. (1976). Theory of the firm:
managerial behavior, agency costs, and ownership structure.
Journal of Financial Economics 3:305-360
.
Jensen, M.C. (1986). Agency Cost of Free Cash Flow, Corporate Finance, and
Takeovers. America Economic Review, Vol 76 No 2, 323-329
Jensen, M.C., (1993), The Modern Industrial Revolution, Exit, And The Failure Of
Internal Control Systems, Journal of Finance, Vol 43 No 3, 831-880.
Jensen, M.C. and Meckling, W.H. (1976). Theory of the Firm: Managerial Behavior,
Agency Costs, and Ownership Structure. Journal of Financial Economics.
Vol 3 No 4, 305-360
Jewell, L.N. and Reitz, H.J. (1981). Group Effectiveness in Organisations, Scott
Foresman, Glenview, IL
John, K.(1987).Risk-shifting incentives and signaling through corporate capital
structure.
Journal of Finance 42:623-644
John Armour, Henry Hansmann, Reinier Kraakman. (2009). AGENCY PROBLEMS,
LEGAL STRAGEGIES AND ENFORCEMENT. Discussion Paper 7. No. 644
Kim K.A. & Nofsinger J.R., (2007). Corporate Governance – Second Edition, Pearson
Education, Inc., Upper Saddle River, New Jersey.
Kalay, A.(1982). Stockholder-bondholder conflict and dividend constraints.
Journal of Financial Economics 10:211-233
99
Klein, A. (1998). Affiliated Directors: Puppets Of Management Of Effective Directors?,
Working Paper, New York University.
Klein, P., Shapiro, D.M. and Young, J. (2004). Board Independence and the Family
Owned Firm, Canadian Investment Review, 17(3), 8-13
La Porta, R., Lopez-de-Silanes, F., & Shleifer, A., and R.VISHNY, (2000). Agency
Problems and Dividend Policies around the world, Journal of Finance, 55(1), pp.
1-33.
Lee, C., Rosenstein, S., Rangan, N., and Davidson, W.N. (1992). “Board Composition
and Shareholder Wealth : The Case of Management Buyouts”, Financial
Management, Vol 21, pp. 58-72.
Lipton, M. and Lorsch, J. 1992. A Modest Proposal for Improved Corporate
Governance. Business Lawyer, Vol 48, 59-77
Luca Enriques and Paolo Volpin. 2007. Corporate Governance Reforms in Continental
Europe, 21 JOURNAL OF ECONOMIC PERSPECTIVES 117, 122–5.
Loderer, C. and K. Martin, 1997, “Executive Stock Ownership and Performance:
Tracking Faint Traces”, Journal of Financial Economics 45, 223-255.
Lim, M. H. 1981. Ownership and Control of the One Hundred Largest Corporations in
Malaysia. Kuala Lumpur: Oxford University Press.
Moyer, R.C., R.E. Chatfield and P.M.Sisneros. 1989. Security analyst monitoring
activity: agency costs and Information demands.
Journal of Financial and Quantitative Analysis 24(4): 503-512.
Myers, S.C.2000. Outside equity. Journal of Finance 4(3): 1005-1037
Mak, Y.T. and Yuanto, K. 2002. Size Really Matters: Further Evidence on the Negative
Relationship between Board Size and Firm Value, Working Paper, National
Univ. of Singapore
McKnight, P.J. and Mira, S. 2003. Corporate Governance Mechanisms, Agency Costs
and Firm Performance in UK Firms.
McLeay, S. 1986. “The Ratio of Means, the Mean of Ratios and Other Benchmarks”.
Finance, Journal of the French Finance Society, Vol 7, No. 1, pp. 75-93.
McLeay, S. & Fieldsend, S.1987. “Sector and Size Effects in Ratio Analysis : An
Indirect Test of Ratio Proportionality”. Accounting and Business Research, Vol
17, No 66. Pp 133 – 140
McConnell, J.and Servaes, H. (1990). “Additional Evidence on Equity Ownership and
Corporate Value”. Journal of Financial Economics, Vol 27, pp. 595-612.
100
Mehran, H. 1995. Executive Compensation Structure, Ownership, and Firm
Performance. Journal of Financial Economics, Vol 38, 163-185
Mishra, C.S., Randoy, T. and Jenssen, J.I. 2001. The Effect of Founding Family
Influence on Firm Value and Corporate Governance.
Journal of International Financial Management and Accounting,
Vol 12 No 3, 235-259
Moldoveanu, M., & Martin, R. 2001. Agency theory and the design of efficient
governance mechanisms. document de travail, Joseph L. Rotman School of
Management, Université de Toronto, 2.
Michael C. Jensen, 1986. Agency Costs of Free Cash Flow, Corporate
Finance, and Takeovers. American Economic Review, May 1986,
Vol. 76, No. 2, pp. 323-329.
Morck, R., Nakamura, M. and Shivdasani, A. 2000 Banks, Ownership Structure, and
Firm Value in Japan, The Journal of Business, 73, 539–567.
Nagar, V., Petroni, K. and Wolfenzon, D. 2000. Ownership Structure and Firm
Performance in Closely-Held Corporations
Olson, M. 1982. The Rise and Decline of Nations: Economic Growth, Stagflation, and
Social Rigidities, Yale University Press, New Haven, CT
Omar Al Farooque,Tony van Zijl,Keitha Dunstanc and AKM Waresul
Karimd, 2007. Ownership Structure and Corporate Performance:
Evidence From Bangladesh. Journal of Accounting & Economics
14 (2007) 127–150
Pearce, J.A. and Zahra, S.A. 1991. The Relative Power of CEOs and Boards of
Directors: Association with Corporate Governance.
Strategic Management Journal, Vol 12, 135-188
Pfeffer, J. 1973. Size Composition and Functions of Hospital Boards of Directors: A
Study of Organization-Environment Linkage.
Administrative Science Quarterly, Vol 18, 349-364
Rosenstein, S., and Wyatt, J.G. 1990. Outside Directors, Board Independence, and
Shareholder Wealth. Journal of Financial Economics, Vol 26, 175-192
Shaw, M.E. 1981. Group Dynamics: The Psychology of Small Group Behavior,
McGraw-Hill, New York
Singh, M. and Davidson III, W.N. 2003. Agency Costs, Ownership Structure and
Corporate Governance Mechanisms.
Journal of Banking and Finance, Vol 27, 793-816
101
Subrahmanyam, V.N., Rangan N., and Rosenstein, S. 1997. The Role of Outside
Directors In Bank Acquisitions. Financial Management, Vol 26, 23-36.
Shleifer, A. and .R.W.Vishny. 1986. Large shareholders and corporate control.
Journal of Political Economy 94:461-488
Steven Ross, The Economic Theory of Agency: The Principal’s Problem. 1973. 63
AMERICAN ECONOMIC REVIEW 134; PRINCIPALS AND AGENTS: THE
STRUCTURE OF BUSINESS
Stephen C Alford, and David A. Stangeland (2005). “Personal Taxation, Corporate
Agency Costs and Firm Performance.”
Sanford J. Grossman and Oliver Hart (1983). "An Analysis of the Principal-Agent
Problem". Econometrica ,Vol. 5.
Sraer, D. and Thesmar, D. (2006). Performance and Behaviour of Family Firms:
Evidence from the French Stock Market, ECGI Working Paper No 130/2006.
Trigueiros, D. 1995. “Accounting Identities and the Distribution of Ratios”. British
Accounting Review, Vol 27, No. 2, pp 109 -126.
Uma Sekaran (2003). Research method for business: A skill building approach,
4th edition, John Wiley & Sons.
Williams, J.1987. Perquisites, risk, and capital structure. Journal of Finance 42(1):29-
44
Williams, J.R., K.G. Stanga and W.W.Holder. 1992. Intermediate Accounting.
Florida: Dryden Press
Weir, C. and Laing, D. 1999. Governance Structure, Size and Corporate Performance in
UK Firms. Management Decision, Vol 37 No 5&6, 457-464
Weisbach, M.S. 1988. Outside Directors and CEO Turnover.
Journal of Financial Economics, Vol 20 No 1, 431-460
Wang, G.Y. 2010. The Impacts of Free Cash Flows and Agency Costs on Firm
Performance. Journal of Service Science and Management, 3(4), 408-418.
Watts, R.L., & Zimmerman, J.L. 1990. Positive accounting theory: a ten year
perspective. Accounting review, 131-156.
Wiwattanakantang, Y. 2001. Controlling Shareholders and Corporate Value: evidence
from Thailand, Pacific-Basin Finance Journal, 9, 323–362.
Weir, C., Laing, D., & McKnight, P.J., 2002, ‘Internal and External
Government Mechanisms: Their Impact on the Performance of
Large UK Public Companies’, Journal of Business Finance and
102
Accounting, vol. 19, no. 5&6, 579-611.
Yermack, D. 1996. Higher Market Values of Companies with a Small Board of Director
Journal of Financial Economics, Vol 40 No 2, 185-211
Yunguang Mike Yang, 2005. Corporate Governance, Agency Conflicts, and Equity
Returns along Business Cycles. Journal of Business Administration, 7-47.
Yermack, D 1996, “Higher market value of companies with a small board
of directors”, Journal of Financial Economics, Vol 40, 185-212
Zhang Zhao-guo; He Wei-feng; Zhu Sha-sha.2007. Capital Structure and Agency Costs.
Management Science and Engineering