Embed Size (px)
Citation preview

1241
Combustion D20. Combustion Diagnostics
Combustion processes consist of a complex multi-dimensional interaction between fluid mechanicsand chemical kinetics. A comprehensive exper-imental analysis needs therefore measurementsof flow and scalar fields. These measurementsneed to be performed in-situ with high tempo-ral and spatial resolution as well as high accuracyand precision. In addition, any disturbances dur-ing the measurement should be avoided. Theserequirements are fulfilled best by laser-opticaltechniques. Whereas flow fields are commonlymeasured by methods like laser Doppler or par-ticle imaging velocimetry discussed elsewhere, thefocus of this chapter is on scalar measurementsbased on spectroscopy. Scalars of interest are tem-peratures, chemical species concentrations, or rateof mixing between fuel and oxidant. Following anintroduction, Sect. 20.3 presents the interconnec-tion between experimental analysis and numericalsimulation of combustion processes. In Sect. 20.4,various spectroscopic techniques are described ex-emplary in their application to different fields ofcombustion research. The chapter concludes
20.1 Basics .................................................. 1242
20.2 Laser-Based Combustion Diagnostics ...... 1243
20.3 Experimental Data Devoted to Validationof Numerical Simulations and Modeling . 124420.3.1 General Remarks .......................... 124420.3.2 Submodels and Their Specific
Demands for Validation ................ 124520.3.3 Example: Generic Turbulent Flame . 1246
20.4 Application of Laser-Based Techniques ... 124720.4.1 Detection Sensitivity, Selectivity
and Resolution ............................ 124720.4.2 Laminar Flames ........................... 124920.4.3 Turbulent Combustion .................. 125120.4.4Engine Combustion ...................... 126520.4.5Diagnostics for Stationary,
Large-Scale Combustion Processes.. 1284
20.5 Conclusions .......................................... 1299
References .................................................. 1300
with aspects on future developments in combus-tion diagnostics.
Abbreviations and Acronyms
AM amplitude modulationAS absorption spectroscopyCA crank angleCARS coherent anti-Stokes Raman scatteringCCD charge-coupled deviceCFD computational fluid dynamicsCL chemiluminescenceCLD chemiluminescence detectorCMD count median diameterCRDLAS cavity-ring-down laser-absorption spec-
troscopyDFB-DL distributed feedback diode lasersDFG difference-frequency generationDFWM degenerate four-wave mixingDNS direct numerical simulationEGR exhaust gas recirculation
ELIF excimer-laser-induced fragmentation flu-orescence
FARLIF fuel/air ratio LIFFWHM full width at half maximumFIR far IRFMS frequency-modulation spectroscopyFTIR Fourier transform infraredHCCI homogeneous charge compression igni-
tionIC internal combustionICCD intensified CCDICLAS intra-cavity laser-absorption spectroscopyIR infra redLAS laser-absorption spectroscopyLES large-eddy simulationLDV laser Doppler velocimetryLIF laser-induced fluorescenceLII laser-induced incandescence
PartC
20

1242 Part C Specific Experimental Environments and Techniques
MS mass spectrometryMIR mid IRNDIR nondispersive infrared photometerNIR near IRNIR-DL near-IR diode laserOD optical densityOPO optical parametric oscillatorPAH polycyclic aromatic hydrocarbonsPDA phase Doppler anemometryPDF probability density functionPIV particle image velocimetryPS polarization spectroscopyQCL quantum cascade laserRANS Reynolds-averaged Navier–Stokes equa-
tions
REMPI Resonance-enhanced multiphoton ioniza-tion
RMS root mean squareSFG sum frequency generationSHG second harmonic generationTEM transmission electron microscopyTDC top dead centerTDL tunable diode laserTDLAS tunable diode laser absorption spec-
troscopyTHz terahertzTiRe-LII time-resolved LIIUV ultravioletVCSEL vertical cavity surface emitting laserWMS wavelength-modulation spectroscopy
20.1 Basics
Combustion is the oldest and one of the most successfultechnologies of mankind. An early important spectro-scopic observation in a combustion process was madein 1859 by Robert Wilhelm Bunsen and Gustav RobertKirchhoff [20.1], who recognized the origin of some ofthe famous dark lines in the solar spectrum first seenby Wollaston and indexed in 1814 by Josef Fraunhofer.Bunsen and Kirchhoff realized that it could not happenby chance that 60 of the Fraunhofer lines coincided with60 iron emission lines measured in the hot nonluminousflame gases of the Bunsen burner. Their experimentalsuccess, however, was based on Isaac Newton, who in-troduced the word spectrum into physics. After Bunsenand Kirchhoff, spectroscopy in flames became a rapidlygrowing field. However, the meaning of all the observedlines was not known until 1913 when Niels Bohr formu-lated his model of the atom. A few years later, AlbertEinstein [20.2] published his famous paper Zur Quan-tentheorie der Strahlung in which he derived Planck’slaw and Bohr’s rule by discussing the possible ele-mentary process of energy and momentum exchangethrough radiation. Despite Einstein’s clear descriptionof the stimulated emission, the practical applicationof this principle was achieved only many years laterin 1955, first in the microwave region with the maser(an acronym for microwave amplification by stimu-lated emission of radiation) [20.3] and in 1960, in thevisible spectral region with the laser (an acronym forlight amplification by stimulated emission of radiationlaser) [20.4]. The principle of stimulated emission hasnow been realized in all states of the matter: solids,liquids, gases and free electrons. This allows the gen-
eration of coherent radiation from the far-infrared tothe X-ray region. Compared to flame spectroscopy withconventional light sources [20.5] the introduction of tun-able lasers and the development of nonlinear opticaltechniques [20.6] greatly expanded the possibilities ofcombustion spectroscopy. Now the spectroscopic statesof atoms and molecules in combustion process can be ob-served non-intrusively with high temporal, spectral andspatial resolution. An excellent overview can be foundin the book by Eckbreth [20.7] and Kohse-Höinghausand Jeffries [20.8].
Combustion processes consist of a complex multi-dimensional and time-dependent interaction of a largenumber of elementary chemical reactions with differenttransport processes for mass, momentum and energy.To increase the rate of chemical conversion in practi-cal applications, turbulent flow conditions are mostlyapplied. Similar to the laminar case, turbulent reactiveflows can be described by solving the conservation equa-tions for total species mass, momentum (Navier–Stokesequations) and enthalpy [20.9]. However, solving theconservation equations by direct numerical simulation(DNS) is, even in the days of modern parallel com-puting, a very demanding task. For a realistic systemof liquid hydrocarbon oxidation in an internal combus-tion engine one would need more than 1021 computingsteps. Therefore, at present and for the near future directnumerical simulation of three-dimensional turbulent re-active flows in technical combustion systems will not bepossible. Instead, turbulence has to be modeled either bythe use of Reynolds-averaged Navier–Stokes (RANS)or spatially filtered conservation equations (large-eddy
PartC
20.1

Combustion Diagnostics 20.2 Laser-Based Combustion Diagnostics 1243
simulation, LES). Reaction rates can be evaluated withthe help of probability density functions (PDF). Thesemodels can then be validated by multidimensional non-intrusive laser measurements. Quantities of interest aremultifarious and include temperature, chemical speciesconcentration, flow velocities, or their turbulent fluctu-
ations. In addition, such laser techniques can be applieddirectly in practical combustion systems to study de-tails of the complex interaction of chemical kinetics andtransport processes and act as sensors in active con-trol loops to improve fuel efficiency and reduce theenvironmental effects of combustion.
20.2 Laser-Based Combustion Diagnostics
Laser-based combustion diagnostics as well as other op-tical diagnostic methods extensively exploit the directinteraction of light and matter, providing an importanttool to observe the spectroscopic states of moleculesand atoms with high spectral and spatial resolution intime regimes from hours to the femtosecond (10−15 s)scale, using optical power densities from picowatts(10−12 W) to multi-terawatts (1012 W) per square cen-timeter. A main feature of optical techniques is thenon-intrusive in-situ investigation of the sample with-out significant interference between the sample and themeasuring device itself. This is especially important forreactive and aggressive environments such as combus-tion processes where probe sampling techniques are ofquestionable value. In all cases light with a certain inten-sity and temporal and spectral distribution is sent ontoor through a sample. The energy re-emitted (in mostcases in the form of light) from the interaction region ofthe irradiated sample is observed and used to character-ize the composition and/or structure of the sample. Thisis done by a detailed analysis of the intensity, spectralcomposition or angular and temporal distribution of there-emitted light. Only absorption techniques determinethe losses of the incoming light along the line of sight.
Excellent reviews about the advancement of laser-based combustion diagnostics are presented in [20.10]and [20.8]. In general, laser combustion diagnostics canbe classified into flow field measurements, scalar fieldmeasurements and combined flow–scalar diagnostics.Flow field measurements rely either on Doppler shift(laser Doppler velocimetry, LDV), Doppler broadening(filtered Rayleigh scattering), tracking of particles (par-ticle imaging velocimetry, PIV) or spatial structures ofmolecular tracers (molecular tagging velocimetry andgaseous image velocimetry). As these flow field di-agnostics are discussed in detail in Chap. 5 here thefocus is on measurement of scalars such as tempera-ture and chemical species concentrations. However, itneeds to be pointed out that high-temperature environ-ments in flames demand for an adaptation of these aforementioned flow diagnostics. For example, oil droplets
commonly used as seed material tracking the turbulentflow in cold PIV or LDV applications are not feasiblein flames due to their evaporation. Instead, solid metal-oxide particles with high melting points are used. Thesematerials are more difficult to seed into the turbulentflow. It must be checked that the presence of the seed par-ticles does not impart on the thermokinetic state of theflame. Otherwise, chemical kinetics might be affectedby the seed material and the technique is not anymorenon-intrusive. For this reason, seeding densities mustbe fairly low. In consequence, spatial resolution such asin PIV applications or data rates in LDV especially inhot parts of the flame are often lower than in cold flowapplications.
Laser-induced fluorescence (LIF) with excitation inthe ultraviolet (UV) is frequently used for the detectionof minor combustion-related species such as NO, OH,CH, C2, HCHO. Fluorescing organic molecules havefound interest as fluorescent tracers that allow the quan-titative observation of fluid mixing processes as wellas fuel concentration in combustion devices [20.11,12].Further techniques using laser radiation include: opti-cal absorption [20.13, 14] and cavity ring-down [20.15]of CH3, and two-photon LIF of atoms [20.16]. Ramanscattering is frequently used to simultaneously measurethe concentration of major combustion species and tem-perature [20.17]. Nonlinear techniques such as coherentanti-Stokes Raman scattering (CARS) [20.18], degener-ate four-wave mixing (DFWM) [20.19] and polarizationspectroscopy (PS) [20.20] have been applied for com-bustion diagnostics. Elastic scattering off droplets isfrequently used for observing the droplet distributionin spray systems and Rayleigh scattering from the gasphase is used to measure gas density, and hence, tem-perature [20.21]. Particle sizes and concentrations areobserved by laser-heating the particles and detection ofthe subsequent incandescence in a process called laser-induced incandescence (LII) [20.22]. The variety ofspecies and techniques that can be probed with laser-based techniques offers the option for simultaneousmeasurements of several species with similar experi-
PartC
20.2
1244 Part C Specific Experimental Environments and Techniques
mental apparatus, but this in turn can cause reducedselectivity due to interfering signal contributions.
The advantage of laser-based techniques is that theydo not intrude into the observed object and that in mostcases, information is gained from a well-defined vol-ume element. Whereas absorption techniques typicallyaccumulate information over the line of sight, severaltechniques generate a signal from a well-defined pointin space. Furthermore, the use of pulsed lasers and fastdetectors allows time-specific data acquisition.
Several techniques can be expanded to measurecombustion-relevant quantities not only in single pointsin space and time but also to investigate concentrationsalong the laser beam (one-dimensional spatial resolu-tion), across planes that are defined by laser beams thatare expanded to a so-called light sheet (two-dimensionalspatial resolution). In few cases these techniques arealso applied to three-dimensional measurements bycombining several two-dimensional images into infor-mation that covers a restricted three-dimensional volumeelement.
Time-dependent measurements are often carriedout for point and line-of-sight measurements. Withthe advent of high-repetition-rate solid-state lasers andfast multi-frame cameras techniques with one- and
two-dimensional spatial resolution can also be car-ried out in a time-resolved way as high-repetition-rateimaging.
Another way to increase the dimensionality of thetechnique is the simultaneous application of multipletechniques (i. e., multiple species concentrations) or thedetermination of multiple characteristics of one quan-tity (i. e., determination of concentration, temperatureand/or pressure from the analysis of line-shapes, inte-gral and time-resolved measurements). This was doneby wavelength multiplexing or fast wavelength tuningof absorption measurements. Raman scattering per sehas the potential to observe multiple species and tem-perature at the same time. Other experiments require thecombination of multiple lasers and/or multiple detectorsto gain simultaneous information about multiple speciesand properties.
In the following sections examples of these variousdiagnostics approaches for combustion will be pre-sented. The chapter will be structured according to thetypes of combustion systems rather than the differenttechniques. Clearly, many techniques can be applied todifferent combustion systems. This will be mentionedin the corresponding subsections and backed by givingappropriate references.
20.3 Experimental Data Devoted to Validationof Numerical Simulations and Modeling
20.3.1 General Remarks
Combustion technology reached a level of developmentwhere further improvements rely on complementarymethods. The classical trial-and-error approach basedon experimental experience was enhanced by numericalsimulation of turbulent combustion processes. A com-
��������������
��������
��������������������
���������������������������������
������������������
�������������������������
����
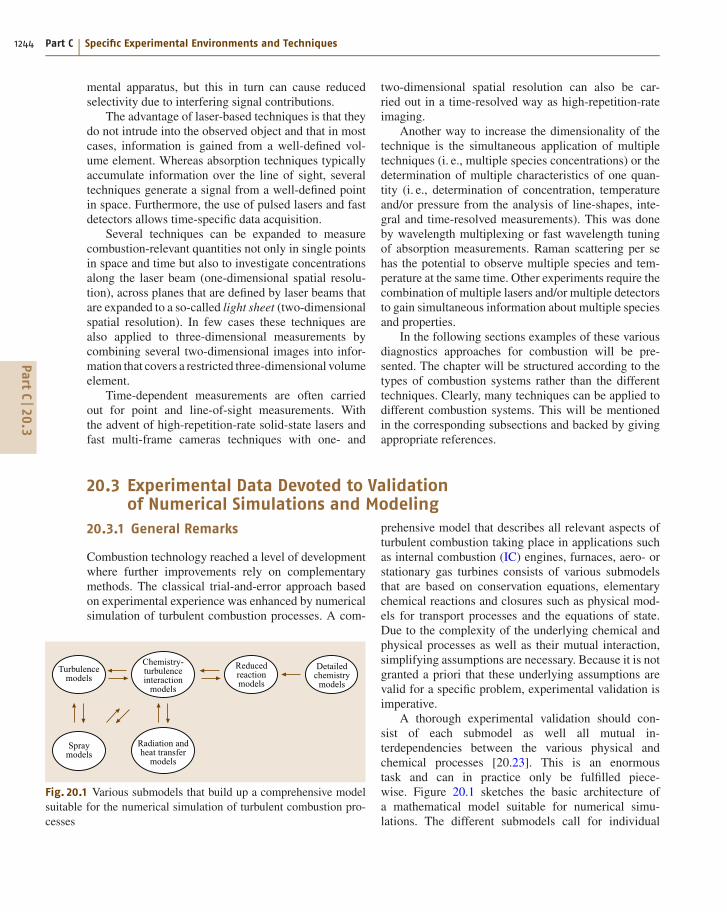
Fig. 20.1 Various submodels that build up a comprehensive modelsuitable for the numerical simulation of turbulent combustion pro-cesses
prehensive model that describes all relevant aspects ofturbulent combustion taking place in applications suchas internal combustion (IC) engines, furnaces, aero- orstationary gas turbines consists of various submodelsthat are based on conservation equations, elementarychemical reactions and closures such as physical mod-els for transport processes and the equations of state.Due to the complexity of the underlying chemical andphysical processes as well as their mutual interaction,simplifying assumptions are necessary. Because it is notgranted a priori that these underlying assumptions arevalid for a specific problem, experimental validation isimperative.
A thorough experimental validation should con-sist of each submodel as well all mutual in-terdependencies between the various physical andchemical processes [20.23]. This is an enormoustask and can in practice only be fulfilled piece-wise. Figure 20.1 sketches the basic architecture ofa mathematical model suitable for numerical simu-lations. The different submodels call for individual
PartC
20.3
Combustion Diagnostics 20.3 Experimental Data Devoted to Validation of Numerical Simulations and Modeling 1245
test rigs and specific diagnostic methods as outlinedbelow.
Laser-based optical diagnostics have emerged inthe past two decades as superior methods for study-ing combustion processes due to their low intrusivenesscompared to probe techniques, their high temporal andrelatively high spatial resolution. However, their appli-cation requires optical access that is not always easy torealize. Especially environments that mimic industrialprocesses such as internal combustion (IC) engines, gasturbines or furnaces, high pressure, dusty conditions,thermal radiation, and rapid contamination of opticalaccesses pose a challenge to these methods. Therefore,experiments devoted to the validation of numerical sim-ulations are usually performed under somehow idealizedconditions and are briefly discussed in the subsequentparagraphs. Furthermore, inlet and boundary conditionsthat have a significant impact on any process down-stream of a mixing device (nozzle, intake port, etc.)in a burning chamber can be more easily controlled ormeasured with sufficient precision in test rigs that havebeen especially designed for validation purposes.
20.3.2 Submodels and Their SpecificDemands for Validation
Figure 20.1 shows the modules (submodels) that com-prise a comprehensive model describing turbulentcombustion processes. Herein, the model for detailedchemistry describes combustion on the basis of ele-mentary reactions. For the combustion of hydrocarbons,detailed chemical reaction mechanisms encompass hun-dreds of elementary reactions and species [20.9] andare therefore far too large to be used directly incomputational fluid dynamics (CFD). Consequently,reduced reaction models are derived from detailed re-action mechanisms that contain a few reactive scalarsonly [20.24–26]. For the development and validationof chemistry models, a large and reliable experimen-tal database is required. To circumvent problems linkedto turbulence, chemical kinetics experiments are carriedout for well-characterized boundary conditions such aslaminar low-pressure flames [20.27, 28], flow reactors,shock-tube experiments [20.29] or rapid compressionmachines [20.30]. A survey of experimental methods tomeasure the chemical rate coefficients of single elemen-tary reactions necessary for a detailed chemical reactionmechanism can be found in [20.31].
Turbulence models describe the properties of theflow field. The state of the art is to use the Reynolds-averaged Navier–Stokes equations (RANS) is used
in most CFD models [20.32]. Within this approach,averaged conservation equations are solved for the statis-tical moments, assuming isotropic conditions. Unclosedterms are modeled on the basis of one- or two-equationmodels [20.33]. As a result, the CFD model predictsmean values and fluctuations in a pointwise manner. Nospatially -correlated information is obtained. For thisreason, experimental validation of RANS-based mod-els can be restricted to quantitative, single-pulse, andpointwise measurements of species concentrations, tem-perature, and velocities. Of special importance are theexperimental determination of well-characterized inletconditions and the dissipation rate of turbulent kineticenergy based on two-point correlations.
Large-eddy simulation (LES) is an approach that hasrecently been extended to describe turbulent combus-tion. The conservation equations are spatially filteredbefore they are numerically solved on a spatial grid.Phenomena occurring on a scale smaller than the filterwidth are accounted for by subgrid-scale models [20.34].The implicit LES combustion approach has variousadvantages. With increasing computational power, anincreasing fraction of turbulent structures will be re-solved, and the importance of an elaborated subgridmodel will decrease. Unsteady effects can be describedowing to the temporal resolution of the LES approach,and spatially correlated information is available. Asa consequence, the requirements for the experimentalvalidation increase. In addition to quantitative point-wise measurements, spatially correlated information isneeded for validation purposes, such as turbulent lengthscales in different spatial directions [20.35] or gradientsof scalar quantities such as temperature [20.36] or mix-ture fraction [20.37,38]. It is worth noting, however, thatdirect numerical simulation (DNS) of the conservationequations is of growing importance for submodel de-velopment and validation [20.39]. Within this approachthe grid resolution resolves all turbulent structures but– at least for three-dimensional (3-D) applications – itstill relies on reduced chemical reaction models. DNS isa tool that ideally supplements experimental approaches.
In turbulent flames, a strong mutual influence ofchemical reactions and the turbulent flow [20.40] isevident. Various chemistry–turbulence interaction mod-els [20.41–43] exist. The state of the art is the commonlyused flamelet and presumed probability density function(PDF) approach. However, a more comprehensive ap-proach is to derive a PDF transport equation that may besolved by Monte Carlo methods or by unsteady flameletmodeling [20.44]. This approach shows great potentialto describe, for example, flame extinction but is compu-
PartC
20.3
1246 Part C Specific Experimental Environments and Techniques
tationally expensive. To develop and validate submodelsfor the chemistry–turbulence interaction, quantitativeexperimental information for various simultaneouslymeasured quantities is necessary, such as the mainspecies, temperature, velocity, and reactive (radical)species. This requires sophisticated optical techniques,especially the combination of reliable velocity meas-urements simultaneous to main species concentrationmeasurements. Although the combination of Raman,Rayleigh, and laser-induced fluorescence (LIF) [20.45]has already been developed to a high degree, the ad-ditional simultaneous measurement of gas velocities isat an early stage. Early approaches are discussed, forexample, in [20.46–49] and show great potential.
In the case of liquid fuels, a submodel is requiredthat describes breakup and the formation of a densethin spray, as well as the evaporation and turbulencemodulation [20.50]. The numerical and experimentalinvestigation of this complex phenomenon is an ongo-ing task. Laser-based techniques such as spontaneousRaman scattering suffer on the one hand from opti-cal density (multiple scattering in dense sprays, strongextinction, liquid core) as well as large local varia-tions in number density at the interface between theliquid and gas phases, which necessitate a large dynamicrange of the detector. However, for the developmentand validation of spray submodels, quantitative infor-mation regarding the liquid and gas phase is required.For the liquid phase, droplet diameters, droplet veloci-ties and droplet size distribution need to be measured.For the gas phase, the local fuel–air ratio, tempera-ture distribution, and gas velocities must be recorded.While for stationary conditions pointwise measurementssuch as phase Doppler anemometry (PDA) [20.51] areappropriate to characterize the liquid phase, the levelof complexity rises if the spray characteristics for un-steady conditions (e.g., pressure oscillations that giverise to time-dependent spatial droplet distributions) areinvestigated. For this purpose, at least two-dimensionaltechniques, such as the interferometric particle imagingtechnique [20.52], are required. In addition, laser-induced fluorescence (LIF) schemes have been used incombination with Mie scattering to determine Sautermean diameters [20.53, 54].
In many practical applications, it is necessary toaccount for radiation effects, particularly to predict ther-mal stress in walls correctly. The state of the art is totreat radiation either by integral methods [20.55–57] orby differential techniques. To account for the spectralcharacteristics of radiation, gray gas models [20.58] orspectral line models [20.59] are used. In open flames
thermal radiation can be measured directly by pyrom-eters. Convective heat transfer to walls in the case ofenclosed combustion can be measured spectroscopi-cally as well, using a combination of thermographicphosphors and filtered Rayleigh scattering [20.60] orLIF [20.61].
20.3.3 Example: Generic Turbulent Flame
To ensure that a comprehensive model is valid for a cer-tain range of operational conditions and capable ofpredicting trends correctly, a series of flames must be in-vestigated where general parameters such as Reynoldsnumber and fuel composition are varied. The burner con-figuration should exhibit some important aspects that
��������
��
���
����� ��
!"
��
#"�!"
�$"
����
�%
���
&���
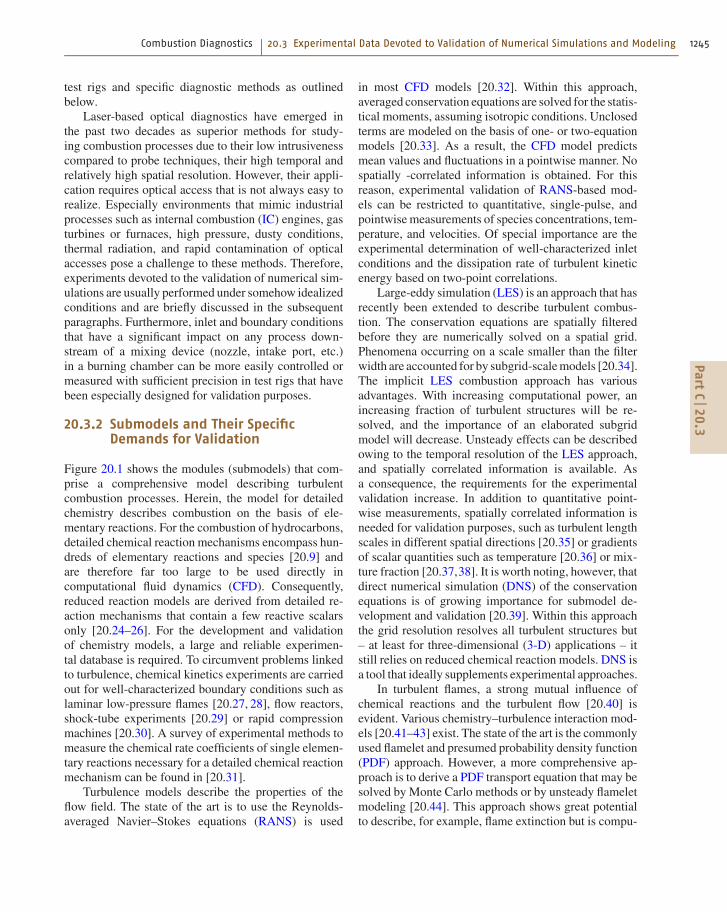
Fig. 20.2 Sketch of a turbulent opposed-jet burner. TG: per-forated plates. The laser beam exciting Raman/Rayleighscattering was directed along the symmetry axis of theburner. Laser radiation for LDV, PIV and LIF diagnosticsentered the region of interest from the side
PartC
20.3

Combustion Diagnostics 20.4 Application of Laser-Based Techniques 1247
may arise in a similar manner within a practical real-ization. To demonstrate some of these special needs ofexperiments devoted to validation of numerical simula-tions, some recent measurements on a turbulent opposedjet burner are briefly outlined.
Opposing jets are a generic configuration in manyindustrial applications where fuel and oxidizing air im-pinge on each other, mix on a molecular level, and finallyburn. The progress of chemical reactions in this tur-bulent mixing layer, however, depends on the mixingtime, which can be quantified by the scalar dissipationrate [20.44]. If the residence time compared to typicalfinite-rate chemical time scales is too short, chemicalreactions may even be extinguished. Flame extinctionis indeed a problem in various practical combustionprocesses such as lean, low-NOx gas turbines or direct-injection IC engines. The advantage of a generic setupsuch as the turbulent opposed jet burner is that the flowconditions leading to extinction can be well controlled.The location where extinction most probably starts islimited to a rather small volume. Therefore, data record-ing can be concentrated to the most important region,cutting down experimental effort enormously.
Figure 20.2 shows the cross section of a burnerthat allows to study these effects by detailed laserdiagnostics. Details can be found in [20.37, 62]. Airemanating from the upper nozzle impinges on a richmethane/air mixture outside the flammability limitsfrom the lower nozzle. The momentum of both streamsis equal. Turbulence is enhanced by perforated plateslocated downstream of the contraction of each nozzle.A stagnation plane is formed which is located at the halfnozzle distance (15 mm). The nozzles (30 mm diameter)are surrounded by a 60 mm-wide nitrogen co-flow to pre-vent mixing with ambient air. Optical access is possiblealong the burner center line through the central holes ofthe perforated plates and from the side perpendicular to
the burner axis. The Reynolds number of the flows canbe varied from stable towards extinguishing conditionsand the equivalence ratio of the fuel can be varied.
To characterize the inflow conditions, the flow fieldbetween the two nozzles and the scalar field, the follow-ing diagnostics have been applied:
• Hot wire anemometry: nozzle exit velocity profilesand turbulent time scales [20.62].• Two-dimensional laser Doppler velocimetry (LDV):radial and axial profiles of mean velocity, turbu-lent kinetic energy and Reynolds stress compo-nents [20.63].• Planar LIF and particle imaging velocimetry(PIV), in part simultaneously: OH radical distri-bution during stable and extinguishing conditions,flame orientation, flow field conditioned on flamefront [20.64, 65].• Picosecond time-resolved LIF: absolute mean OHprofiles, OH time series to characterize OH statis-tics [20.66].• One-dimensional Raman/Rayleigh scattering: meanand fluctuations of major chemical species concen-trations, temperature and mixture fraction, scalardissipation rate [20.37, 63].
This database allows detailed comparisons with resultsfrom numerical simulations. Control and knowledgeof the inlet boundary conditions as well as flow andscalar field are essential. Of special interest in this con-figuration are finite-rate chemistry effects due to theturbulence–chemistry interaction and turbulent mixing.The data have been used for comparison with MonteCarlo PDF models in combination with a RANS ap-proach [20.63] and combustion LES [20.67]. Some ofthe results are discussed in Sect. 20.4.3 and in [20.37,63].
20.4 Application of Laser-Based Techniques
20.4.1 Detection Sensitivity, Selectivityand Resolution
The detection sensitivity attainable in combustion envi-ronments is an essential parameter for the applicationof the various laser-based techniques. These limits can-not be stated generally since they depend on the linestrength of the species to be detected, system pa-rameters such as absorption length, response time or
optical output power [20.68], while especially for in-situ measurements temperature and pressure in the proberegion and disturbing effects of the in-situ beam path(dust, background emission) are most important fac-tors for system-specific detection limits. A figure ofmerit for absorption spectrometers is the minimumdetectable absorption change (MDA = ∆I/I0). In a pre-cisely controlled absorption cell 10−3 is achievable withnon-coherent light sources on a routine basis, while the
PartC
20.4
1248 Part C Specific Experimental Environments and Techniques
Method Species Transition Energy of p T Environment Detection Detection Ref.
transition (total) (K) limit (abs.) limit
(cm−1) (bar) (cm−3) (ppm)
LAS HO2 2ν1-band 6625.8 6.7 (−3) 295 photolysis cell 3 (13)b 16.8 [20.69]
NO (3, 0)-band 5524 1 1040 H2/air flame 2.7 (15) 100 [20.70]
CH4 2ν3-band 6048 1 300 absorption cell 1.8 (14) 7 [20.71]
NH A3Π−X3Σ(0, 0), 29762 1 2100 NH3/N2/O2 3.0 (13) 7.9 [20.72]
R2(8) flat flame, φ =1.28
CRDLAS OH A2Σ−X2Π(0, 0) 32500 0.04 1800 CH4/air flame 2.0 (10) 0.12 [20.73]
CH3rR(6, 6) 3224.42 0.05 1400 CH4/air flame 1.5 (13) 57.6 [20.74]
ICLAS HCO A−X(0900)− 16260 0.047 1800 CH4/O2/N2- 1.4 (11) 0.57 [20.75]
(0010) flame
LIF OH A2Σ−X2Π(0, 0) 32500 1 2000 25.6 (11) 0.07 [20.76]
A2Σ−X2Π(0, 0) 32500 9.2 1700 C2H6/O2/N2-flame
1 (14) 2.5 [20.77]
NO A2Σ−X2Π(0, 0) 44247.8 1 2000 8 (11) 0.22 [20.7]
DFWM OH A2Σ−X2Π(0, 0) 32500 1 1700 premixedCH4/air flame
2.0 (13) 4.66 [20.78]
OH A2Σ−X2Π(0, 0) 32500 1 2200 premixedCH4/air flame
7.0 (13) 21.1 [20.79]
NH A3Π−X3Σ(0, 0) 29762 1 2100 NH3/O2/N2 =2.1/1.5/1.0
[20.80]
CH4 ν3, Q(5)(1, 0) 3017.5 1 (−6) 300 CH4/N2 1.5 (11) 6174 [20.81]
HF ν1, R(5)(1, 0) 4000 1 (−3) 300 HF/He 1.0 (10) 0.41 [20.82]
CH3 3s2A′1 −2p2A′′
2 46185 1 1600 CH4/N2/O2flame,Φ = 1.25
3.0 (14) 65 [20.83]
C2 d3Πg − a3Πu 19354 1 3000 C2H2/O2 flame(welding torch)
5 (11) 0.19 [20.84]
CARS C2 Q(10)(1, 0) 1611.7 1 2500 C2H2/O2 flame(welding torch)
1.0 (10) 0.003 [20.85]
OH O1(7.5)(1, 0) 3065.3 1 ≈ 1800 H2/air flame(premixed)
1.0 (13) 2.5 [20.86]
CO Q(10)(1, 0) 2143 1 2000 flame 4.8 (16) 13000 [20.87]
CO Q(10)(1, 0) 2143 1 2000 flame 7.3 (16) 20000 [20.88]
OH Q1(7.5)(1, 0) 3560 0.0106 300 HNO3/He 1.4 (15) 5400 [20.89]
NH2 ν1, /2ν4, (1, 0) 3210 0.0005 300 NH3 1.2 (12) 99 [20.90]
REMPI 1, 1−DCE p−3d(1+1) 33863.9 – 5 molecularbeam
6 ppbva [20.91]
C6H6 S0 −S1(1+1) 38610 – 5 molecularbeam
0.09 ppbva [20.91]
C2H4 3+1 68181 – 5 molecularbeam
10 ppbva [20.92]
PS C2 d3Πg − a3Πu(0, 0) 19357 1 1800 C2H2/O2-flame
1.0 (12) 0.19 [20.93]
OH A2Σ−X2Π(0, 0) 32500 1 2100 propane/airflame
1.0 (13) 2.9 [20.94]
a Mass-spectrometric inlet system with molecular-beam sampling; the detection limits are referred to the concentration levels in theoriginal sample mixtureb 1(11) = 1 × 10¹¹
c Mostly estimated temperatures
PartC
20.4

Combustion Diagnostics 20.4 Application of Laser-Based Techniques 1249
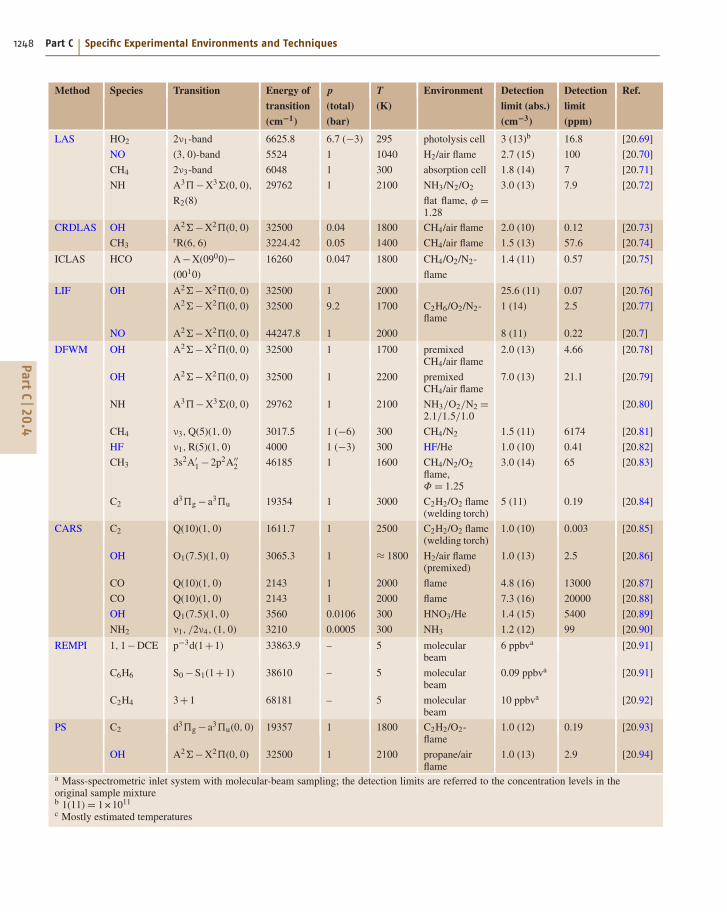
Table 20.1 Detection limits for minor, combustion-relevantspecies of various linear and nonlinear laser-spectroscopictechniques discussed in this review. The spectroscopic tran-sitions probed for each species, their transition frequency(in cm−1), total pressure p, an estimate of the temperatureT , and the sample environment are given. The detectionlimits are approximate values, either determined directly orextrapolated from the respective experimental data �
best laser-based spectrometers provide MDAs in the10−8 range, resulting in a dynamic range of 102 –107.Table 20.1 is a (far from complete) collection of exper-imental work in the literature that stated the detectionlimits of combustion-relevant minor species for the var-ious techniques introduced here at different pressuresand environments to give a general impression of theirpractical applicability.
Species selectivity is another feature that has im-proved greatly through the introduction of lasers, sincehigh radiance and small source linewidth are availablesimultaneously. For the case of continuous-wave (CW)lasers (diode and dye lasers) the laser line width can be ofthe order of 10 MHz, compared to molecular linewidthsin the gas phase of several 100 MHz under low-pressureconditions and several GHz at atmospheric pressure.Ultimate selectivity can be ensured, if a spectral regionor so-called spectral window, can be found where thespecies under investigation is the only (or at least thedominant) absorber.
Spatial and temporal resolution is another attributethat was improved significantly by the advent of lasersin diagnostics. Using the extremely short pulses of Q-switched or mode-locked lasers, the shortest turbulenttime scales such as Kolmogorov time scales (in the µsregime) can be resolved even for very high turbulencelevels. In contrast, the spatial resolution of laser diag-nostics is in general insufficient to resolve the smallestfluid flow structures (Kolmogorov scales) or the smallestscalar structures (Batchelor scales) in turbulent flames.The latter is even worse for high-Schmidt-number flows.The spatial resolution is limited by the extension of thelaser beam profile in the probe volume. Laser opera-tion in the TEM00 transversal mode using short focallengths and large beam diameters through the last con-vex lens are typical measures taken to reduce the probevolume size. Constraints resulting from the high flametemperatures, flame enclosure, optical damage of win-dows used for optical access or gas breakdown, pulsedlaser operation etc. typically limit the attainable spa-tial resolution to 100 µm at best in each direction ofspace. For high Reynolds numbers this is much larger
than the smallest flow and scalar scales. Thereforeunder-resolving probe volumes act as spatial filters. De-pending on the quantity, this under-resolution can causea bias [20.95].
20.4.2 Laminar Flames
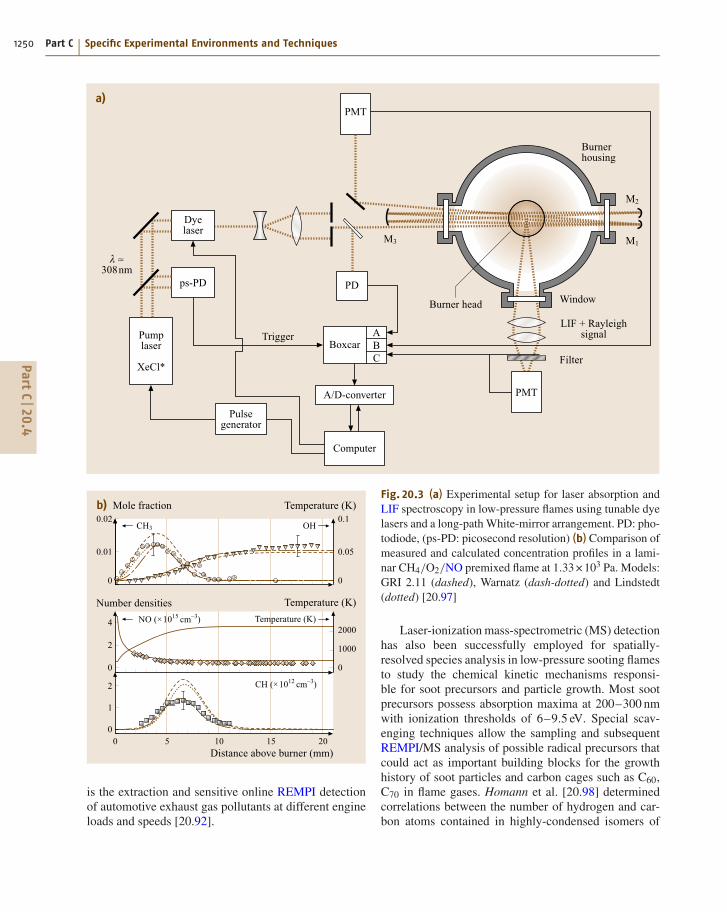
Low-Pressure FlamesLaminar premixed flames at low pressures on a flat-flameburner constitute an ideal experimental arrangement tostudy the interaction of elementary chemical combustionreactions. Experimental data on temperature as well ason concentration profiles for stable and unstable speciesare used to validate and further develop mathematicalmodels that predict these profiles by numerical solu-tion of the underlying conservation equations, includingconvection and molecular transport processes.
Figure 20.3a shows such an arrangement usedfor a low-pressure CH4/O2/NO flame. Absolute con-centration profiles of methyl and hydroxyl radicals aswell as nitric oxide are measured by laser absorptionspectroscopy. CH radicals are detected by LIF. In thisexample (Fig. 20.3b) the shape and absolute values of theconcentration profiles for OH and CH3 radicals as wellas the initial reduction of nitric oxide are predicted wellby the models. Further improvements in sensitive ab-sorption spectroscopy in flames can be obtained by usinglong-path absorption techniques such as cavity-ring-down laser-absorption spectroscopy CRDLAS [20.96]and intracavity absorption.
Resonance-enhanced multiphoton ionization(REMPI) – combined with molecular-beam samplingmass spectrometry – is a highly selective and sensitivetechnique for combustion diagnostics and environmentalchemical analysis [20.91]. Detection sensitivities in thelower ppb to ppt (per volume) range for chloroethylenes,toluene and p-chlorphenol have been obtained in a he-lium carrier gas, whereas – due to cross sensitivitiesand nonresonant multiple-species ionization – this limitincreases into the percent range in sample mixturesdrawn directly from real-world industrial devices. Toincrease selectivity with an appropriate choice of ex-citation wavelengths various electronic transitions inlarge molecules can be accessed in one- or multipho-ton transitions from which ionization is accomplishedin a second step at the same or different laser frequency.Portable instruments have been designed that offer suf-ficient flexibility in switching between different laserwavelengths for the excitation of numerous unsaturatedhydrocarbons, radicals and polycyclic aromatic hydro-carbons (PAH) for monitoring in real time. An example
PartC
20.4
1250 Part C Specific Experimental Environments and Techniques
'(�
)����������*
���!"+�
��������
���'�
(!
���**��
)���������� ,���-
�.&�/�������*���*���
&�����
(�
(0
'�������
1���2
'(�
'�
������
34����5�����
)����3)�
��
'����*�������
�����������5���������67
�����������687�� (����������
"
���690"0#��:!7
"# 0" 0# �"
��!
���690"0���:!7
��
�����������687
�
0
"
;
�
"
"<"�
"<"0
"
"<0
"<"#
�"""
0"""
"
�����������687���������������
is the extraction and sensitive online REMPI detectionof automotive exhaust gas pollutants at different engineloads and speeds [20.92].
Fig. 20.3 (a) Experimental setup for laser absorption andLIF spectroscopy in low-pressure flames using tunable dyelasers and a long-path White-mirror arrangement. PD: pho-todiode, (ps-PD: picosecond resolution) (b) Comparison ofmeasured and calculated concentration profiles in a lami-nar CH4/O2/NO premixed flame at 1.33 × 10³ Pa. Models:GRI 2.11 (dashed), Warnatz (dash-dotted) and Lindstedt(dotted) [20.97]
Laser-ionization mass-spectrometric (MS) detectionhas also been successfully employed for spatially-resolved species analysis in low-pressure sooting flamesto study the chemical kinetic mechanisms responsi-ble for soot precursors and particle growth. Most sootprecursors possess absorption maxima at 200–300 nmwith ionization thresholds of 6–9.5 eV. Special scav-enging techniques allow the sampling and subsequentREMPI/MS analysis of possible radical precursors thatcould act as important building blocks for the growthhistory of soot particles and carbon cages such as C60,C70 in flame gases. Homann et al. [20.98] determinedcorrelations between the number of hydrogen and car-bon atoms contained in highly-condensed isomers of
PartC
20.4

Combustion Diagnostics 20.4 Application of Laser-Based Techniques 1251
polycyclic aromatic hydrocarbons (PAHs) as precursorsof C60 and their formation and destruction in low-pressure sooting flames. These authors claim the C60cage is the final product in the chain of hydrogen ab-straction, folding, condensation and isomerization ofsmaller fragments of five- and six-membered aromatic-ring condensates [20.99]. The detailed study of thefragmentation behavior, ionization efficiencies and ab-solute calibration of a variety of PAHs is essential forquantitative comparisons with numerical modeling ofsoot in flames [20.100].
Higher Pressure FlamesIn laminar flames spatially-resolved temperature meas-urements using coherent anti-Stokes Raman scattering(CARS) are possible with high precision. Figure 20.4shows a comparison of the temperature readings de-duced from the pure rotational spontaneous Ramanspectrum (squares) and the Q-branch vibrational CARSspectrum of molecular nitrogen (triangles) acquired atthe same location and under the same operating condi-tions of a stable high-pressure premixed methane/airflame. Both data sets agree within the 3% limitof precision estimated from the spontaneous Ramandata [20.101]. The pure rotational spontaneous Ramanspectra exhibit well-resolved lines even at the high-est pressures investigated. The spectrally dense CARS
"
�"""
'��������6���7
�����������687
�����6=!>7
�3�
;"0" �" !"
��""/�!>
:�!>
Fig. 20.4 Comparison of measured temperatures (deducedfrom fitting spectral shapes) in a methane/air flame atvarious pressures. Spectra were obtained from either spon-taneous pure rotational Raman scattering (squares) orQ-branch vibrational CARS (triangles) measurements ofmolecular nitrogen at the same location in the post flamegases [20.101]. Shown as dashed lines are the ±3% tem-perature measurement accuracies inherent in fitting resultsfrom the spontaneous Raman data
Q-branch of N2 suffers from partial collisional collapseof its rotational structure at the band origin, which usu-ally degrades the temperature measurement accuracy atlow temperatures (300–700 K) and even higher pres-sures [20.102]. Temperature measurements using purerotational CARS have also been carried out in laminarflames and are often an alternative if higher preci-sion is required in the low-temperature (300–870 K)higher-pressure (1–15 bar) regime [20.103].
For the detection of minor species fully resonantnonlinear techniques, such as DFWM, polarizationspectroscopy (PS) and resonance-enhanced CARSare necessary to achieve sufficient detection sensi-tivity. DFWM spectra of electronic transitions havebeen recorded and gas temperatures determinedin flames from OH, NH [20.80], NO [20.104],CN [20.105], CH [20.106], and in cell experimentsfrom NO2 [20.107], HCO [20.108]. Using polarizationspectroscopy, important radicals in flames such as OHand NO were analyzed by Nyholm et al. [20.109] andLöfstedt et al. [20.110], respectively. The potential ofpolarization spectroscopy for two-dimensional imagingof these species and for single-shot temperature meas-urements was also shown [20.94,109]. Because the totalangular momentum of the photon–molecule system isconserved during the interaction process, a proper choiceof beam polarizations can be exploited to excite P-, Q-or R-branch transitions selectively. Careful modeling ofthe PS spectral structure for OH and NH is essentialfor in-situ temperature measurements in atmospheric-pressure flames [20.20]. The intensity and collisionfrequency dependence of PS signal intensities has beenmodeled using the rigorous approach of direct numeri-cal integration (DNI) of the Liouville equation for thedensity operator [20.111], which promises to addressthese effects more closely in practical measurement sit-uations. To increase the Raman resonant susceptibilityin a CARS interaction process, Stokes, pump and thegenerated anti-Stokes signal frequency should be tunedclose to single-photon-allowed electronic transitions inthe studied molecule. This makes the experimental ap-proach rather complicated, since up to three narrow-bandtunable laser systems must be employed. Nevertheless,spatially-resolved measurements of C2 and OH distri-butions in pressurized flames have been performed byAttal et al. with high detection sensitivities [20.85, 86].
20.4.3 Turbulent Combustion
Fundamental studies of flames are based on various ex-perimental setups tailored to select certain aspects of
PartC
20.4

1252 Part C Specific Experimental Environments and Techniques
combustion. Practical combustion processes tradition-ally rely on non-premixed, turbulent combustion forreasons of efficiency and safety. However, demandsfor low NOx emissions require the use of lean pre-mixed combustion such as in stationary gas turbines.Detailed information about chemistry–turbulence inter-action and complex recirculating flows is necessaryto invent models suitable for simulating practicallyrelevant flames. The understanding of the underlyingprocesses is best verified through direct comparison ofnumerical simulation results with experimental meas-urements of properties such as temperature and speciesconcentrations. Furthermore, detailed knowledge of theunderlying flow field patterns is essential.
Laser-based techniques are ideal for studying tur-bulent processes since they do not disturb the flowand, using pulsed lasers, they are fast enough toresolve the smallest relevant timescales. Statistical in-vestigations of correlations between temperature andthe concentrations of different reactive species havebeen investigated using point measurements basedon Rayleigh and Raman scattering and LIF diagnos-tics. Quantitative comparisons of the thermokineticstates in turbulent flames with idealized representa-tions, such as steady strained laminar flames, perfectlystirred reactors, or adiabatic equilibrium are thus pos-sible. Comparisons with direct numerical simulation(DNS) calculations on the other hand give insightinto the validity of some of the basic assumptionsupon which turbulent combustion models are builtand allow the evaluation of the predictive accuracy,strengths and limitations of a wide variety of combustionmodels.
Revealing the structure of turbulent flames has at-tracted increasing interest and has been addressed usinglaser imaging for temperature, mixture fraction and reac-tive species such as OH and CH [20.113]. Simultaneousmeasurements of multi-scalars, yielding scalar dissipa-tion rates, are critical for the validation of turbulentcombustion models describing molecular mixing and ex-tinction processes [20.37]. Simultaneous measurementsof Rayleigh scattering and fuel Raman imaging provideinformation about temperature distribution and mixing.Both can be used to further quantify OH-LIF data bycorrecting for temperature and collisional quenching ef-fects. These measurements (see Fig. 20.5) showed thecorrelation between the reaction zone width and jetReynolds numbers and addressed the influence of localdissipation rate on flame extinction [20.112]. A reviewarticle that covers this topic in detail is given by Masriet al. [20.114].
With careful spectral filtering Raman measurementsare possible even in dense media involving strong Miescattering from small droplets. By forming a thin lightsheet from the output beam of a XeF excimer laserat 351 nm Decker et al. [20.115] were able to im-age the Raman-scattered light from a dense cryogenicjet of liquid nitrogen onto a charge-coupled device(CCD) camera to study the evaporation and breakupof the fluid nitrogen exiting through a small (1.9 mmdiameter) nozzle as employed in rocket engines, andperformed temperature and density measurements fromthe Stokes/anti-Stokes intensity ratio and the Rayleighintensity, respectively.
There are numerous applications of CARS asa temperature measurement technique in turbulent com-bustion processes. From the Q-branch spectrum ofnitrogen, temperature measurement accuracies of 2%or better within a single laser pulse have been ob-tained [20.116], and applications have spread intodiverse fields of technical combustion systems suchas liquid-fuel combustors and swirl burners, IC enginecombustion [20.117], gas turbines and jet propulsiondevices [20.118–120] etc. High-resolution line-shapemeasurements of combustion-relevant species such asN2 [20.121], O2 [20.122], H2 [20.123], CO [20.124],CO2 [20.125], and NO [20.126] have improved mod-eling of CARS spectra – an important prerequisite for
0<0?����������������""4�?����������������������#""8?�����������@<+�9�0"0A��������4�!�B��C6!�9��������7
�
�
��687
��
"
�������������������
Fig. 20.5 Images of mixture fractions (ξ), scalar dissipa-tion rates (χ), temperatures (T ) and OH concentrations inturbulent CH4/air diffusion flames obtained by 2-D Raman,Rayleigh and LIF spectroscopy [20.112]
PartC
20.4

Combustion Diagnostics 20.4 Application of Laser-Based Techniques 1253
precise temperature measurements through spectral sim-ulation. Figure 20.6 shows temperature profiles fromsingle-shot broadband N2-CARS thermometry acrossthe shear layer region of a supersonic air-fed combus-tor fueled with hydrogen [20.119]. The left-hand side ofthe graph depicts the mean temperature across the shearlayer that is formed after injection of the fuel hydrogeninto the supersonic air flow; it slowly decreases as themeasurement point moves upstream. The necessity todo single-pulse measurements is clearly demonstrated.In the temperature histograms on the right-hand side ofthe picture the fluctuation in this parameter is illustratedas a function of position, which gives a more-detailedpicture of the mixing properties and burning behavior ofthe combustor.
Multidimensional DiagnosticsWhile two-dimensional images yield a wealth of struc-tural information [20.127, 128] and provide insight intothe combustion process (Fig. 20.7), in many cases moreinformation is desirable.
Multispecies measurements are of major interestto fully describe the thermochemical state of the ob-served volume element and to understand correlationsbetween different species concentrations and potentiallytheir local variations. In some cases linear combina-tions of different scalars correlate well with quantitiessuch as heat-release rate that are otherwise difficult tomeasure [20.128]. For multispecies point measurementsRaman scattering has been applied especially for the in-vestigation of turbulent flames [20.17]. These techniqueshave been expanded for line measurements [20.37,95, 129, 130] and allow – under special conditions –spatial multidimensional detection with limited res-olution [20.131]. For two-dimensional imaging withhigh resolution, however, laser-induced fluorescence hasbeen used to observe either different species at the sametime in the same volume element [20.128, 132, 133],or to use the photophysical properties of fluorescentmolecules to obtain information about more than onequantity (i. e., the concentration and the ambient condi-tions) [20.134,135]. This will be shown in the followingsections for organic tracers that allow not only con-centration measurements but also the observation oftemperature and local oxygen concentrations.
Turbulence is a three-dimensional process and there-fore, three-dimensional measurements are desirable.Furthermore, the temporal behavior of concentrationsand temperatures is of interest to understand turbulentphenomena, ignition, combustion instabilities, and tran-sient phenomena. Imaging with high repetition rates
�""##
�����������687
���<�$+�8 <�<�0!@8��<�A;
0;"";"" A"" +"" 0""" 0�""
���*�����5���-���-����67
A"
A#
@"
@#
+"
+#
$"
$#
"�;A+
0"0�0;
�"" ;"" A"" +"" 0""" 0�"" 0;""�����������687
������������
���<�@#�8 <�<�0+�8��<�@$
"�;A+
0"0�0;
�"" ;"" A"" +"" 0""" 0�"" 0;""�����������687
������������
���<�;!$8 <�<��0"8��<�+$
"
0�
�"" ;"" A"" +"" 0""" 0�"" 0;""�����������687
������������
�;A+
0"
Fig. 20.6 Temperature distribution deduced from H2 Q-branchCARS spectra across the shear layer of a supersonic hydrogen-fueledcombustor [20.119]
that allows movie-like observation of two-dimensionalscalar fields has been developed [20.136–138]. Thesetechniques have become especially interesting sincecombustion modeling moved beyond the calculationof temporally-averaged quantities. For comparison withthe results of large-eddy simulations (LES) and directnumerical simulations (DNS) both structural infor-mation and the temporal variation of structures isrequired.
Simultaneous Multispecies Detectionin Turbulent Flames
Multi-Scalar 1-D Raman/Rayleigh Measurements inTurbulent Opposed Jet Flames. Simultaneous Ra-man/Rayleigh measurements allow the measurementof all main species (concentrations >≈ 0.5–1%) andtemperature. In hydrocarbon-fueled combustion, inter-
PartC
20.4
1254 Part C Specific Experimental Environments and Techniques
Fig. 20.7 OH-LIF distribution in a turbulent 150 kW flame.Size of the visualized field: 150 mm2 × 110 mm2 [20.140]
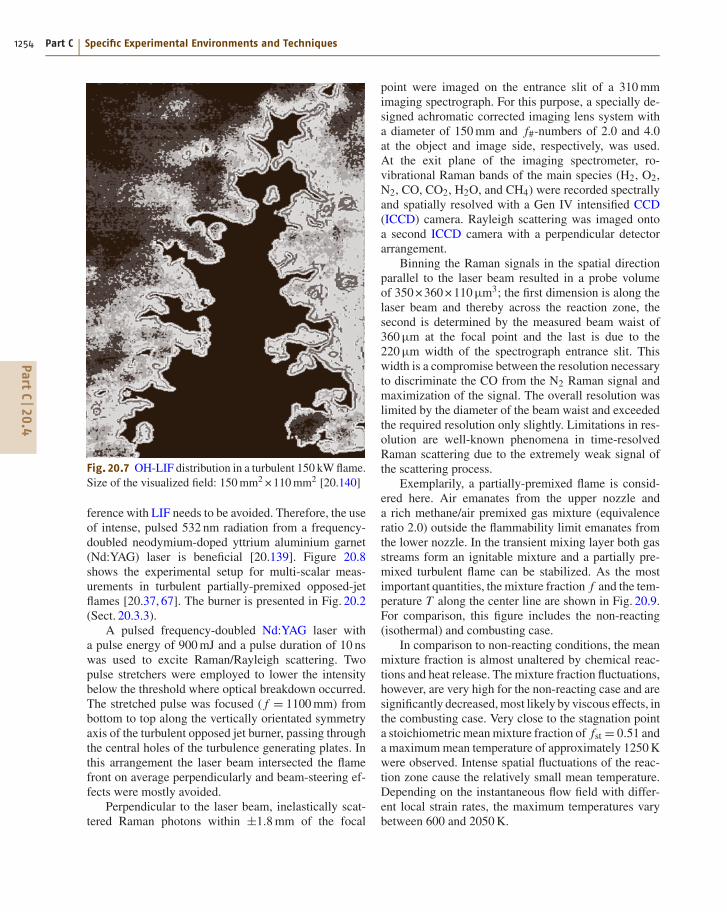
ference with LIF needs to be avoided. Therefore, the useof intense, pulsed 532 nm radiation from a frequency-doubled neodymium-doped yttrium aluminium garnet(Nd:YAG) laser is beneficial [20.139]. Figure 20.8shows the experimental setup for multi-scalar meas-urements in turbulent partially-premixed opposed-jetflames [20.37, 67]. The burner is presented in Fig. 20.2(Sect. 20.3.3).
A pulsed frequency-doubled Nd:YAG laser witha pulse energy of 900 mJ and a pulse duration of 10 nswas used to excite Raman/Rayleigh scattering. Twopulse stretchers were employed to lower the intensitybelow the threshold where optical breakdown occurred.The stretched pulse was focused ( f = 1100 mm) frombottom to top along the vertically orientated symmetryaxis of the turbulent opposed jet burner, passing throughthe central holes of the turbulence generating plates. Inthis arrangement the laser beam intersected the flamefront on average perpendicularly and beam-steering ef-fects were mostly avoided.
Perpendicular to the laser beam, inelastically scat-tered Raman photons within ±1.8 mm of the focal
point were imaged on the entrance slit of a 310 mmimaging spectrograph. For this purpose, a specially de-signed achromatic corrected imaging lens system witha diameter of 150 mm and f#-numbers of 2.0 and 4.0at the object and image side, respectively, was used.At the exit plane of the imaging spectrometer, ro-vibrational Raman bands of the main species (H2, O2,N2, CO, CO2, H2O, and CH4) were recorded spectrallyand spatially resolved with a Gen IV intensified CCD(ICCD) camera. Rayleigh scattering was imaged ontoa second ICCD camera with a perpendicular detectorarrangement.
Binning the Raman signals in the spatial directionparallel to the laser beam resulted in a probe volumeof 350 × 360 × 110 µm3; the first dimension is along thelaser beam and thereby across the reaction zone, thesecond is determined by the measured beam waist of360 µm at the focal point and the last is due to the220 µm width of the spectrograph entrance slit. Thiswidth is a compromise between the resolution necessaryto discriminate the CO from the N2 Raman signal andmaximization of the signal. The overall resolution waslimited by the diameter of the beam waist and exceededthe required resolution only slightly. Limitations in res-olution are well-known phenomena in time-resolvedRaman scattering due to the extremely weak signal ofthe scattering process.
Exemplarily, a partially-premixed flame is consid-ered here. Air emanates from the upper nozzle anda rich methane/air premixed gas mixture (equivalenceratio 2.0) outside the flammability limit emanates fromthe lower nozzle. In the transient mixing layer both gasstreams form an ignitable mixture and a partially pre-mixed turbulent flame can be stabilized. As the mostimportant quantities, the mixture fraction f and the tem-perature T along the center line are shown in Fig. 20.9.For comparison, this figure includes the non-reacting(isothermal) and combusting case.
In comparison to non-reacting conditions, the meanmixture fraction is almost unaltered by chemical reac-tions and heat release. The mixture fraction fluctuations,however, are very high for the non-reacting case and aresignificantly decreased, most likely by viscous effects, inthe combusting case. Very close to the stagnation pointa stoichiometric mean mixture fraction of fst = 0.51 anda maximum mean temperature of approximately 1250 Kwere observed. Intense spatial fluctuations of the reac-tion zone cause the relatively small mean temperature.Depending on the instantaneous flow field with differ-ent local strain rates, the maximum temperatures varybetween 600 and 2050 K.
PartC
20.4

Combustion Diagnostics 20.4 Application of Laser-Based Techniques 1255
#!��?�00��
��DE3%������
������������������
(����
(
(
(
(
�
%&
���
����
�����*����.���
( (
�
�
�&�
�������F��
�(
(
((
)
(
((
(( (
(
)
)
(
������*�
.���
)'�������
(��������0+"����!<#
���
)�
G
%&
'
Fig. 20.8 Sketch of the Raman/Rayleigh setup. M: mirror, L: lens, BS: beam splitter, E: energy monitor, BP: band pass
Figure 20.10 shows mole concentrations and the cor-responding fluctuations conditioned on mixture fractionfor all main species except N2. In general, the flameshows the typical features of non-premixed combustionas obvious from comparison to flamelet calculations em-ploying a strain rate of 200 s−1. It is clear from the figurethat, on the lean side, laminar flamelet calculations arevery similar to the results measured in the partially-premixed turbulent flame. At the rich side, however,deviations between the flamelet calculations and the tur-bulent flame data are apparent, especially for CO, H2,and H2O. Note that even small concentrations of COand H2 are detectable using the advanced techniqueapplied.
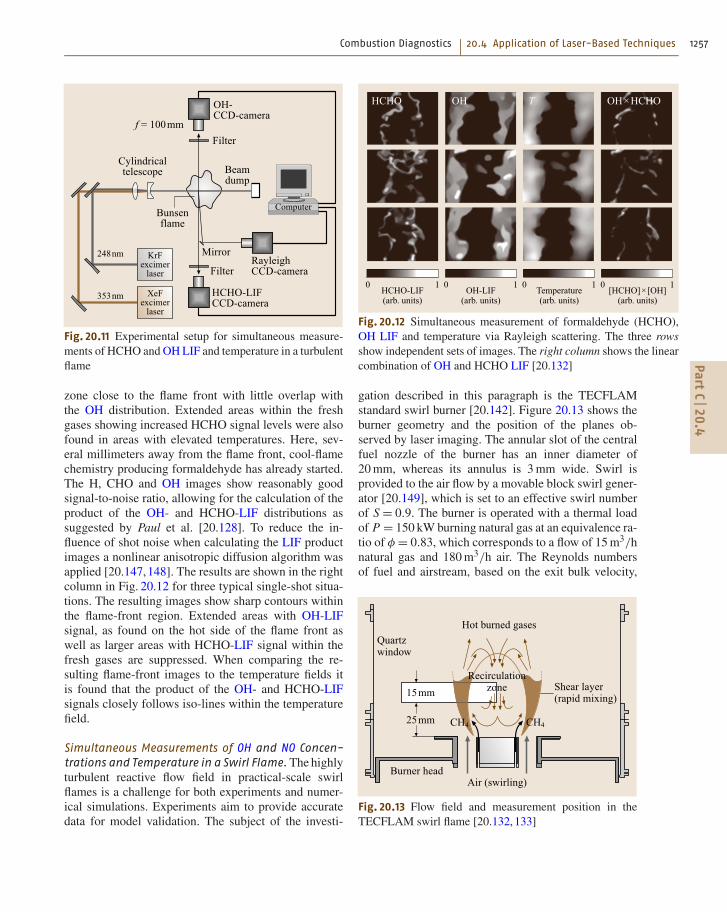
Simultaneous Measurement of OH, HCHO and Tem-perature in Turbulent Flames. In the past decade muchwork has been aimed at the visualization of flame-frontpositions and structures in turbulent flames. Most of thiseffort has concentrated on measurements of the distri-bution of OH because of its high abundance in flamesand the coincidence of OH transitions with high-powerexcimer laser wavelengths [20.127]. Measurements offlame front positions using OH, however, can give littleinformation about important chemical reaction paths andfuel consumption rates. Recent investigations indicatedthat the distribution of HCO correlates well with peakheat-release rates for premixed flames of a certain rangeof equivalence ratios φ = 1.0–1.2 [20.128,141]. Due to
PartC
20.4

1256 Part C Specific Experimental Environments and Techniques
:"<;"
6�:����*746�4�7
&�������� �
":"<� " "<� "<;
"<;
"<� "<;
"<+
"
&�������� �
������������*�
0�#"
#""
@#"
0"""
"<#
0
��4�
��687
Fig. 20.9 Mean and fluctuation of the mixture fraction fand temperature T along the center line. Temperature fluc-tuations are normalized by the maximum temperature T =1250 K
its low abundance, measurements of the HCO distribu-tion via LIF have to apply phase sampling in acousticallyforced unsteady flows to increase signal-to-noise ratios.Single-shot LIF measurements of HCO distributions inturbulent flows, however, do not seem to be feasible. In-stead, Paul et al. [20.128] showed that the product ofOH and HCHO concentrations is directly proportionalto the reaction rate of HCHO+OH → H2O+HCOand therefore yields an estimate for the productionrate of HCO. The established link between HCO molefraction and heat release therefore makes the prod-uct ILIF(OH) × ILIF(HCHO) a good choice for flamefront determination. Due to the high abundance ofHCHO and OH in the flame-front region and theirlarge fluorescence cross-sections, this approach enablessingle-shot measurements in highly turbulent reactiveflows.
Whereas OH-LIF is frequently applied for measure-ments in different combustion media [20.142], efficientHCHO imaging have suffered from the lack of suit-
""
(����������������
(����������"<�#
"<"#
"<0
"<0#
"<�
0"<� "<; "<A "<+
���
��
��
��
������
Fig. 20.10 Mole fraction conditioned on mixture fraction.Symbols represent experimental values obtained by Ra-man/Rayleigh spectroscopy in the turbulent opposed-jetburner, lines represent laminar flamelet calculations usinga strain rate of 200 s−1
able high-power laser sources. As well as dye lasersystems [20.143], broadband XeF and frequency-tripledNd:YAG lasers have been used, which, however, ac-cess only weak transitions [20.144]. We took advantageof a coincidence of the side band of the XeF excimerlaser at 353 nm with the strong 41
0 vibronic transition offormaldehyde [20.145,146]. By combining two tunableexcimer lasers (KrF and XeF), simultaneous measure-ments of OH and HCHO distributions by LIF are feasibleon a single-shot basis. Rayleigh-scattered light providesinformation about the temperature distribution, whichwill be useful when addressing the quantification of LIFsignal intensities.
Figure 20.11 shows an experiment in which a fieldmeasuring 20 × 16 mm2 a distance of 2 mm above theburner exit in a turbulent natural gas/air Bunsen flamewas investigated. A plane centered along the axis of theBunsen flame is illuminated with the light of two tunableexcimer lasers operated with KrF (248 nm) and XeF(353 nm). The LIF and scattering signal were detectedwith three ICCD cameras.
The results (Fig. 20.12) show strong OH LIF inten-sities throughout the burned gases within the observedarea. Separate regions of burned gases are found withinthe fresh-gas zone, which might be separated from theflame front by the turbulent flow. The HCHO-LIF sig-nal on the other hand is found within the fresh-gas
PartC
20.4
Combustion Diagnostics 20.4 Application of Laser-Based Techniques 1257
������������������� )��
���
)���������
������*����������
������.&���������
&�����
(����
��H�0""
&�����
������������
������
�;+�
!#!�
8�&�����������
1�&�����������
Fig. 20.11 Experimental setup for simultaneous measure-ments of HCHO and OH LIF and temperature in a turbulentflame
zone close to the flame front with little overlap withthe OH distribution. Extended areas within the freshgases showing increased HCHO signal levels were alsofound in areas with elevated temperatures. Here, sev-eral millimeters away from the flame front, cool-flamechemistry producing formaldehyde has already started.The H, CHO and OH images show reasonably goodsignal-to-noise ratio, allowing for the calculation of theproduct of the OH- and HCHO-LIF distributions assuggested by Paul et al. [20.128]. To reduce the in-fluence of shot noise when calculating the LIF productimages a nonlinear anisotropic diffusion algorithm wasapplied [20.147,148]. The results are shown in the rightcolumn in Fig. 20.12 for three typical single-shot situa-tions. The resulting images show sharp contours withinthe flame-front region. Extended areas with OH-LIFsignal, as found on the hot side of the flame front aswell as larger areas with HCHO-LIF signal within thefresh gases are suppressed. When comparing the re-sulting flame-front images to the temperature fields itis found that the product of the OH- and HCHO-LIFsignals closely follows iso-lines within the temperaturefield.
Simultaneous Measurements of OH and NO Concen-trations and Temperature in a Swirl Flame. The highlyturbulent reactive flow field in practical-scale swirlflames is a challenge for both experiments and numer-ical simulations. Experiments aim to provide accuratedata for model validation. The subject of the investi-
"������.&6���<������7
0 "����.&
6���<������7
0 "����������6���<������7
0 "B����C9B��C
6���<������7
0
���� �� � ��9����
Fig. 20.12 Simultaneous measurement of formaldehyde (HCHO),OH LIF and temperature via Rayleigh scattering. The three rowsshow independent sets of images. The right column shows the linearcombination of OH and HCHO LIF [20.132]
gation described in this paragraph is the TECFLAMstandard swirl burner [20.142]. Figure 20.13 shows theburner geometry and the position of the planes ob-served by laser imaging. The annular slot of the centralfuel nozzle of the burner has an inner diameter of20 mm, whereas its annulus is 3 mm wide. Swirl isprovided to the air flow by a movable block swirl gener-ator [20.149], which is set to an effective swirl numberof S = 0.9. The burner is operated with a thermal loadof P = 150 kW burning natural gas at an equivalence ra-tio of φ = 0.83, which corresponds to a flow of 15 m3/hnatural gas and 180 m3/h air. The Reynolds numbersof fuel and airstream, based on the exit bulk velocity,
��;
I���� -���-
����������*����
������������ ��
��;
3���6�-�����*7)����������
�#
0# ����������6����������*7
Fig. 20.13 Flow field and measurement position in theTECFLAM swirl flame [20.132, 133]
PartC
20.4

1258 Part C Specific Experimental Environments and Techniques
�����������687!"" �"""
�����������687!"" ��""
35���*��
+"
���6��7" ;#
���6��7" +"
�����5���*��
&�5����5���*��
���60"""��7" ;<@
���60"""��7" 0�
Fig. 20.14 Simultaneous measure-ments of temperature and NO and OHconcentration in the reactive flow fieldof the TECFLAM swirl burner. Upperframes: instantaneous measurements,lower frames: averages [20.133]
are Regas = 8000 and Reair = 42 900, respectively. Thecombustion chamber is confined by a water-cooled hous-ing (72–88 ◦C) to ensure constant boundary conditions.Optical access to the chamber is realized by four quartzwindows (100 × 100 mm2).
In the swirl flame a similar setup as in Fig. 20.11was used to assess OH and NO concentration andthe temperature distribution. One of the laser beamsis frequency-converted in a hydrogen Raman shiftcell [20.150] to provide 225.25 nm radiation for the ex-citation of the NO A-X(0,0) band at energy densities of2 × 106 W/cm2. The NO-LIF signal is separated via a re-flection band-pass filter (transmission: 248±10 nm) todetect light emitted from the A-X(0,1), (0,2) and (0,3)transitions. The second laser is triggered with a shortdelay (200 ns) to prevent crosstalk between the NO-LIFand Rayleigh signals. Rayleigh-scattered light is sepa-rated via a dielectric mirror (high reflectance at 248 nm at45◦). Achromatic UV lenses are used to focus the sig-nal onto the chips of ICCD cameras. For simultaneousmeasurements of OH concentration and temperature thelaser used for Rayleigh scattering was tuned to the OHtransition (P2(8) within the OH A-X(3,0) band, laserenergy density: 5 × 10⁷ W/cm2) and the OH-LIF signalwas detected using reflection band-pass filters centeredat 295 nm. Since OH is a strongly diagonal moleculethe strongest emission occurs from the (3,3) vibrationalband (and after vibrational relaxation from the (2,2),(1,1), and (0,0) bands). The fluorescence contributionof OH LIF detected at 248 nm together with Rayleigh-scattered light is generally negligible compared to theRayleigh signal [20.151]. However, in peak temperaturezones where total number densities and hence Rayleighsignal are low OH LIF contributes to the overall sig-nal, resulting in additional uncertainties of −5% in thetemperature images.
The measurements presented here were carried out25–40 mm (Fig. 20.13) above the burner exit. For cali-bration of the LIF signal intensities a McKenna burnerwas installed in the burner housing and investigatedwith an identical optical setup. The burner was op-erated on stoichiometric methane/air mixtures whereresulting OH concentrations and temperatures are docu-mented [20.152]. Additional calibration measurementshave been carried out in lean flames (φ = 0.83) dop-ing known quantities of NO (300–800 ppm) into thefresh gases. The increase in signal intensities providedthe necessary data for calibrating the NO-LIF measure-ments [20.153] in the swirl burner measurements.
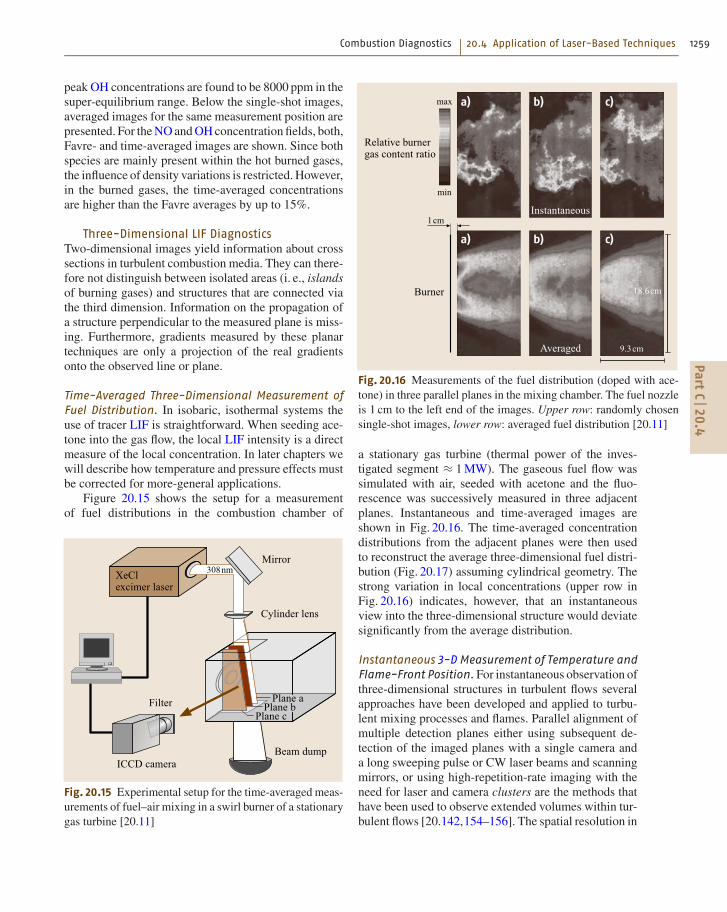
Simultaneous measurements of temperature, OH andNO concentration allow one to quantify the LIF signalintensities by correcting for the temperature dependenceof the ground-state population and collisional energy-transfer processes on a single-shot basis. Furthermore,by correcting for local total number densities, local con-centrations can be calculated from number densities,allowing the computation of time-averaged concentra-tion fields. In Fig. 20.14, three sets of simultaneouslyrecorded temperature, NO and OH distribution fieldsare shown. The position of the observed area is depictedin Fig. 20.13. It can be seen that NO is present through-out the whole burned gas area. NO is formed withinthe hot burned gases on both sides of the fresh-gasintake and accumulated by recirculation. In the outerrecirculation zone (the left part of the figure) peak NOconcentrations are around 35 ppm, whereas in the innerrecirculation zone peak NO concentrations in the rangeof 70–80 ppm are reached due to the higher tempera-tures. OH on the other hand is mainly found on the innerside of the fresh-gas intake. Due to the lean air–fuel mix-ture and the strong turbulence, OH is distributed acrossa relatively broad zone behind the flame front. Local
PartC
20.4
Combustion Diagnostics 20.4 Application of Laser-Based Techniques 1259
peak OH concentrations are found to be 8000 ppm in thesuper-equilibrium range. Below the single-shot images,averaged images for the same measurement position arepresented. For the NO and OH concentration fields, both,Favre- and time-averaged images are shown. Since bothspecies are mainly present within the hot burned gases,the influence of density variations is restricted. However,in the burned gases, the time-averaged concentrationsare higher than the Favre averages by up to 15%.
Three-Dimensional LIF DiagnosticsTwo-dimensional images yield information about crosssections in turbulent combustion media. They can there-fore not distinguish between isolated areas (i. e., islandsof burning gases) and structures that are connected viathe third dimension. Information on the propagation ofa structure perpendicular to the measured plane is miss-ing. Furthermore, gradients measured by these planartechniques are only a projection of the real gradientsonto the observed line or plane.
Time-Averaged Three-Dimensional Measurement ofFuel Distribution. In isobaric, isothermal systems theuse of tracer LIF is straightforward. When seeding ace-tone into the gas flow, the local LIF intensity is a directmeasure of the local concentration. In later chapters wewill describe how temperature and pressure effects mustbe corrected for more-general applications.
Figure 20.15 shows the setup for a measurementof fuel distributions in the combustion chamber of
.���������
&�����
)������
�������������
(����1���������������
'������'������
'������
!"+�
Fig. 20.15 Experimental setup for the time-averaged meas-urements of fuel–air mixing in a swirl burner of a stationarygas turbine [20.11]
��
��
0+<A�
.�����������
35���*�� $<!�
������5��������*��������������
)�����
��
��
0�
��
��
��
��
Fig. 20.16 Measurements of the fuel distribution (doped with ace-tone) in three parallel planes in the mixing chamber. The fuel nozzleis 1 cm to the left end of the images. Upper row: randomly chosensingle-shot images, lower row: averaged fuel distribution [20.11]
a stationary gas turbine (thermal power of the inves-tigated segment ≈ 1 MW). The gaseous fuel flow wassimulated with air, seeded with acetone and the fluo-rescence was successively measured in three adjacentplanes. Instantaneous and time-averaged images areshown in Fig. 20.16. The time-averaged concentrationdistributions from the adjacent planes were then usedto reconstruct the average three-dimensional fuel distri-bution (Fig. 20.17) assuming cylindrical geometry. Thestrong variation in local concentrations (upper row inFig. 20.16) indicates, however, that an instantaneousview into the three-dimensional structure would deviatesignificantly from the average distribution.
Instantaneous 3-D Measurement of Temperature andFlame-Front Position. For instantaneous observation ofthree-dimensional structures in turbulent flows severalapproaches have been developed and applied to turbu-lent mixing processes and flames. Parallel alignment ofmultiple detection planes either using subsequent de-tection of the imaged planes with a single camera anda long sweeping pulse or CW laser beams and scanningmirrors, or using high-repetition-rate imaging with theneed for laser and camera clusters are the methods thathave been used to observe extended volumes within tur-bulent flows [20.142,154–156]. The spatial resolution in
PartC
20.4

1260 Part C Specific Experimental Environments and Techniques
Fig. 20.17 Visualization of the averaged three-dimensionalfuel distribution in the nonreactive swirl flow [20.157]
the z-dimension (perpendicular to the observed planes),however, is restricted. Figure 20.18 shows the setup forinstantaneous measurements of OH-LIF and tempera-ture in three parallel planes within the reactive flow fieldof the TECFLAM swirl flame (Fig. 20.13).
The beams of two tunable excimer (tuned to an OHA-X(0,3) transition at 248.45 nm) are directed throughthe flame. Via a beam splitter a third beam is generated
0
)������
������������������������5����.&
������������5��6������*�����������*7
�������������
��*��������������
.���������
8�&�����������
������������
�
0
&�����8�&
�����������
.���������
�
!
0 !
Fig. 20.18 Experimental setup of instantaneous 3-D meas-urements of OH LIF and temperature in a turbulent flame
�����������687&��������0;#"
0#�
��
0#�
�"""+""
Fig. 20.19 Three-dimensional visualization of the temper-ature field and the flame front position (gray surface markedwith arrows) in the reactive flow of a technical scale swirlflame at a swirl number of S0 = 0.9 and an equivalenceratio of 0.83 [20.142]
from one of the lasers, optically delayed and used to illu-minate the third plane. Three cameras are aimed to detectthe Rayleigh signal with dielectric mirrors as bandpassfilters ((248±10) nm). Three additional cameras recordthe OH-LIF signal, which is spectrally separated fromscattered light by WG280 long-pass filters.
Figure 20.19 presents a three-dimensional visual-ization of the flame front embedded in the turbulenttemperature field of size 15 × 15 mm2 at x/D = 1.5 andr/D = 0.5. The visualization is based on ray-tracing al-gorithms (in collaboration with IWR, Heidelberg). Theflame-front position is evaluated for each individuallymeasured OH concentration field by determining theposition with the steepest gradient in OH concentration.Between the three adjacent planes the flame-front posi-tions and temperatures are interpolated to obtain a 3-Drepresentation.
Instantaneous 3-D Measurement of OH LIF withCrossed Light Sheets. An alternative attempt to im-age three-dimensional volume elements is the useof crossed detection planes (Fig. 20.20) [20.158–160].A quasi-instantaneous detection is provided with twocameras [20.157]. In special mirror arrangements detec-tion is possible with a single laser and camera [20.161].One of the benefits of this method is the increas-ing resolution towards the crossing line and a smallcylindrical volume of several hundred micrometers toapproximately 1 mm around it. This geometry is ideal
PartC
20.4

Combustion Diagnostics 20.4 Application of Laser-Based Techniques 1261
�����5��
'������������������������������
)�����������
'����5���
Fig. 20.20 Arrangement of the crossed light sheets forinstantaneous three-dimensional observation of OH LIFaround the crossing line
for the combination with one-dimensional (1-D) Ra-man line measurements which can provide temperatureprofiles and multispecies distributions in a limited partof the crossing line [20.162]. The resulting three-dimensional data matrix can also be visualized usinga 3-D visualization tool that assigns not only colorbut also transparency values to the given intensity val-ues [20.163]. The results for OH-LIF measurement ina lean Bunsen flame are presented in Fig. 20.21. Tothe left of the reactive zone is the unburned fresh gasin the center of the burner above the nozzle, whilethe right side shows the surrounding air around theflame cone. The depth of the visualized 3-D volumeis 2 mm.
Fig. 20.21 Volume visualization of OH LIF intensity ina lean Bunsen flame [20.129, 161]
������������
I���� ������
&�����
��������
�����������DE3%��������
I���� ������
��*������������
����������
Fig. 20.22 Experimental setup for high-repetition-rate OH PLIF inthe turbulent combustion cell
Multiple-Timestep ImagingTracking of Flame Kernel Development After SparkIgnition. Many practical combustion processes rely onelectrical spark ignition in their initial phase. Duringthe breakdown, arc and glow phases of an electricaldischarge, a plasma is formed. At the interface of theplasma kernel and the ambient fuel–air mixture transferof heat and radicals causes the formation of an initialflame kernel. Depending on the local fuel–air ratio andthe turbulence levels the flame kernel may either growin time, leading to a successful ignition, or be extin-guished. To understand and predict the fate of an initialflame kernel requires the flame kernel development to betracked temporally. This can be achieved by sequentialOH LIF imaging.
A multiple laser and detector system [20.136] wasused to record time sequences of OH-LIF images fromsingle combustion events in a closed vessel using pre-mixed methane/air mixtures [20.164]. The laser sourceof the high-repetition-rate imaging system is a cluster offour Nd:YAG lasers (BMI/CSF-Thomson) that are firedin series with a short time delay to generate a burst offour laser pulses. The separation between pulses was var-ied between 250 µs and 3 ms, depending on the fuel andturbulence intensity used in the experiment. The outputfrom the four Nd:YAG lasers are combined to a singlebeam and frequency doubled to 532 nm. The pulse en-ergy from each of the lasers was around 500 mJ. TheNd:YAG lasers pumped a dye laser (Continuum ND60)operating near 566 nm on rhodamine 590 dye. The out-put from the dye laser was frequency doubled to 283 nmand tuned to excite OH at the Q1(8) transition in the(1,0) band of the A2Σ+ ← X2Π system. The laser en-ergy at 283 nm was around 2 mJ/pulse for a pump pulse
PartC
20.4

1262 Part C Specific Experimental Environments and Techniques
�� #""��� 0<A��
�.&
A<@��!<!�� #��
G�����
�� 0"""��� 0<A��
�.&
A<@��!<!�� #��
G�����
�� �"""��� 0<A��
�.&
#<$��!<0�� ;<#��
G�����
�� !"""��� 0<A��
�.&
#���<+�� !<$��
G�����
�� #"""��� 0<A��
�.&
;<A���<A�� !<A��
G�����
Fig. 20.23 Flame propagation forindividual events measured by OHPLIF and flame emission for variousrotor speeds as indicated in each rowand stoichiometric methane/air mix-tures. Times in each image denote thetime after ignition. Turbulence inten-sities associated with the increasingrpm as stated in the figures are 0.31,0.62, 1.3, 2.01, and 3.31 m/s
PartC
20.4

Combustion Diagnostics 20.4 Application of Laser-Based Techniques 1263
separation of 2 ms. The laser light was formed to a sheet,50 mm in height and 0.2 mm in width, using a cylindri-cal telescope, and passed through the cell 1 mm in frontof the electrodes (Fig. 20.22).
A high-speed camera consisting of eight individualintensified CCD units coupled to a single optical input(Imacon 468, DRS Hadland) was used to detect the flu-orescence. An additional image intensifier was fitted tothe optical input to achieve UV sensitivity. The first fourCCD units were triggered by the individual lasers, andused to capture the four OH LIF images. The remainingfour CCD units were used to capture flame chemilu-minescence shortly after each LIF exposure. The delaybetween the LIF and chemiluminescence exposures was2 µs, which can be considered simultaneous on the timescale of the studied process. An achromatic quartz lens( f = 100 mm, f# = 2) was fitted to the camera. A UG11filter was used in combination with a long-pass filter,transmitting above 295 nm, was used to reject scatteredlaser light and transmitting fluorescence in the (1,1) and(1,0) bands of OH.
An external pulse generator synchronized the ig-nition system to the laser and detector system, whileallowing the laser system to operate continuously at10 Hz, to maintain stable operation. The ignition systemconsists of two units: the first unit produces an electri-cal breakdown between two electrodes (1 mm diameterTungsten wire, conically shaped, 1 mm gap) and therebyan electrically conducting plasma channel. The energyof the breakdown was kept as low as possible and thereleased energy in this phase is below the minimum igni-tion energy. The second unit is a constant-current powersupply giving rise to currents and voltages of approx-imately 1 A and 100 V, respectively, typical for an arcphase. In this study, an arc-phase duration of 200 µs ischosen. To achieve a constant current, the voltage is ad-justed adaptively, leading to a reproducibility in energydeposition of better than 2%. Therefore, conditions forinitially spherical flame kernels generated by the ignitionsystem are highly reproducible as proven in [20.165] forinitially quiescent gas mixtures.
The cylindrical constant-volume combustion vesselhas a diameter of 39 cm and a height of 51 cm, resultingin a volume of approximately 55 l. Three optical accessports allow for LIF measurements. Four high-speed ro-tors of 144 mm in diameter are situated 200 mm from theelectrode gap. Rotor axes are perpendicular to their re-spective neighbors. Rotor speeds are synchronized andcan be varied between 0 and 5000 rpm. In the vicinityof the electrode gap a homogeneous isotropic turbulentflow field of variable intensity is generated.
Figure 20.23 shows data corresponding to sin-gle ignition events in stoichiometric CH4/air mixturessubjected to different degrees of turbulence. The se-quences were obtained using four consecutive lasershots fired in rapid succession with stated timingsreferring to time after ignition. The top rows of pic-tures are two-dimensional (2-D) LIF images of OH;the bottom rows are OH chemiluminescence images.Figure 20.23a corresponds to moderate levels of turbu-lence (u′ = 0.62 m/s). It can be seen that first wrinkling(deviations from a spherical kernel) appears around1.6 ms, which is a consequence of turbulence chemistryinteraction although essentially the flame retains its near-laminar character. On the regime diagram [20.44] thiscorresponds to the laminar wrinkled flame front region.On the emission images a shadow appears indicatingthe position of the electrodes. Increasing turbulencelevels to u′ = 2.01 m/s (3000 rpm) results in a largechange of flame shape. The flame now shows signif-icant internal structure due to distortion by vortices.Here, the advantage of a planar light-scattering tech-nique to assess flame structure is clearly seen: whereasemission images may still be interpreted as compactand connected flames the LIF images on the otherhand show formation of cusps and handles or possiblyislands.
From OH sequences, as shown in Fig. 20.23, a va-riety of parameters can be deduced to characterize thetemporal evolution of the flame kernel. Here only thedegree of wrinkling as a consequence of the turbulence–
""<�
�����������*������6J�7
���������
�""" ;""" A""" +""" 0""""
"<!
"<;
"<#
"<A
"<@
"<+
"<$
0
������ 4�����.&"<A�4� 4�����.&0<!4� 4�����.&�<"04� 4�����.&������ 4�&G"<A�4� 4�&G0<!4� 4�&G�<"04� 4�&G"<A�4� 4�����.&�6A<!>7"<A�4� 4�&G�6A<!>7
$<A>���;
Fig. 20.24 Temporal evolution of compactness for stoichiometricmethane–air mixtures subjected to various degrees of turbulence.FE: flame emission
PartC
20.4

1264 Part C Specific Experimental Environments and Techniques
chemistry interaction is briefly discussed. The degreeof wrinkling and its effect on flame propagation can bequantified using the flame compactness factor K , whichis defined as
K = 4π At
C2t
= C2s
C2t
, (20.1)
where At is the area. OH LIF is detected within the ob-served cross section, and Ct is its circumference. Cs isthe circumference of a spherical laminar flame of thesame area At as the turbulent kernel. In this definition,spherical flame kernels have a compactness factor ofK = 1 whereas wrinkled flames have K < 1. For ex-ample K = 0.5 would increase the circumference of theflame by a factor of 1.41. Figure 20.24 shows the tempo-ral evolution of K for stoichiometric CH4/air mixturesat various degrees of turbulence where K is calcu-lated both from emission and from PLIF measurements.It is evident that line-of-sight-averaged chemilumines-cence measurement is not a suitable tool to assess flamewrinkling: taking the v′ = 2.01 m/s case as an example(3000 rpm rotor speed), large discrepancies between thetwo measurement techniques are visible. The LIF dataindicate how strongly K is affected by turbulence and isespecially strongly influenced if the mixture is lean. Incontrast, in the laminar case (black line) both the emis-sion data and the LIF data yield essentially the sameresults as expected. Note that the apparent increase inK for the laminar case is due to the decreasing effectof heat conduction to the electrodes as the flame kernelgrows in size. The standard deviations of 30 individual
�����������������
&�-��������
�������������DE3%�����
(�������'�
��������60D�7
(����
��A��
.��������
��DE3%������
��**��*������
&������*�����
&�����
&�-��������
!##�� (����
Fig. 20.25 Optical setup for the laser-based investigationsin the flow channel
measurements per point is indicated for the v′ = 0 andv′ = 1.3 m/s cases.
Flow Diagnostics Close to the Wall with Two-Time-Step Imaging. Flow-field imaging is most frequentlycarried out via particle imaging velocimetry (PIV) orlaser Doppler velocimetry where particles are added tothe flow. Close to surfaces, these techniques, however,fail due to the interaction of the particles with the surface.Different flow-tagging techniques have been proposedto overcome these problems. They are based either onDoppler shifts of molecular tracers [20.166] or on thelaser-induced generation of a molecular tracer withinthe flow that can be observed for a certain time af-ter its generation (tagging). This tagging is based onphotodissociation of vibrationally hot H2O [20.167], vi-brationally excited O2 [20.168, 169], NO formed fromphotodissociation of tert-butyl nitrate [20.170] or fromphotolytically generated oxygen atoms with subsequentreaction with nitrogen [20.171]. We discuss here pho-todissociation of NO2 with subsequent LIF imaging ofnitric oxide and expand this technique to allow the in-vestigation of the temporal development of the turbulentflows by either photolytically tagging in two subse-quent time steps with a single detection of both markedvolumes or with one tagging and subsequent detec-tion of each individual flow situation after two variabledelays.
In an optically accessible flow channel (60 × 5 mm2
cross-section, mean flow velocities of v = 74 m/s as-sociated with a Reynolds number of Re = 24 500 atroom temperature, the flow seeded with 1200 ppm NO2)a frequency-tripled Nd:YAG laser is focused to a linewhere the NO tag is generated. The resulting line of NOis then observed at two time steps with various delays(up to 300 µs) with LIF imaging. The frequency-tripledlaser light of a double-cavity Nd:YAG laser is used topump a midband optical parametric oscillator (OPO).It is tuned to generate a signal wavelength at 450 nmwhich is then extra-cavity frequency-doubled in a betabarium borate (BBO) crystal. The resulting UV beamhas a pulse energy of approximately 1 mJ and a spectralwidth of ≈ 4 cm−1. It therefore excites a large portionof the NO A−X(0, 0) band head. NO-LIF signals arediscriminated against scattered light by a UG5 filter andfocused onto the chip of an CCD-intensified interlinecamera. The image intensifier ensures short detectiongate times for both frames. The maximum repetitionrate of 200 ns of the double-frame camera is no restric-tion for our experiments. The optical setup is shown inFig. 20.25.
PartC
20.4

Combustion Diagnostics 20.4 Application of Laser-Based Techniques 1265
���������-����*��������������K�������L�����������������������
0""J�
#"J� #
&�-���������
Fig. 20.26 Observation of a photolytically generated struc-ture at two time steps after generation. Delay betweengeneration and first detection: 50–100 µs, delay to the sec-ond detection: 75 µs. The flow is from right to left, thehorizontal lines mark the position of the channel walls
Figure 20.26 shows the result of the double-frameimaging for NO lines generated at the right side of theframes (the flow is towards the left). The interaction ofthe flow with the boundary layer at the walls (horizontallines) and with turbulence elements in the main flow isclearly seen.
Multiple-Timestep Imaging in Spray Diagnostics.Techniques using simultaneous detection of Mie scat-tering and LIF signals have been used successfullyfor two-dimensional drop-size imaging in practicalspray configurations. The fluorescence tracers com-monly used, however, prevent the application in realisticfuels like gasoline and diesel because of strong in-terference with fluorescing compounds of the fuels.Therefore, the use of a fluorescent tracer is proposedthat can be excited in the red spectral range, where theabsorption by commercial fuels is minimized. We usea frequency-doubled diode-pumped Nd:YAlO3 laser-oscillator power-amplifier system to generate pulsebursts at 671 nm with 30 ns pulses (≈ 1 mJ each) anda 30 kHz repetition rate. At this wavelength an organictracer (rhodamine 800) with high fluorescence quantumyield is excited. Fluorescence and elastically scatteredlight is separated via dielectric filters and detected ontwo slow streak cameras. The fluorescence emitted ataround 700 nm originates from the liquid phase onlyand the LIF/Mie signal ratio is a measure of the localSauter mean diameter.
�"
�"�/�AAJ�
�"�/�0!�J�
�.& (��
Fig. 20.27 LIF and Mie signal distributions in the spray ofa nebulizer. Three images with a temporal separation of66 µs are shown
Figure 20.27 shows a time series of Mie and LIFsignal in the spray field of a medical nebulizer. Thehigh-repetition-rate pulse bursts of the laser allow theobservation of the spray development and evaporation.Further experiments will be carried out in diesel sprays.First measurements show that the tracer system withexcitation in the red can be used in commercial dieselfuel without any significant fluorescent background fromthe fuel [20.172].
20.4.4 Engine Combustion
In-cylinder laser-based combustion diagnostics in in-ternal combustion (IC) engines focus on three mainfields:
1. the observation of the mixture preparation beforeignition, which includes fuel injection and evapo-ration, fuel–air mixing, pre-combustion temperaturedistributions, and the distribution of residual inertgases from the previous engine cycle and intention-ally recirculated exhaust gas
2. the observation of the ignition and combustion pro-cess including flame propagation and potential flame
PartC
20.4

1266 Part C Specific Experimental Environments and Techniques
quenching, also considering post-flame tempera-tures
3. the observation of pollutant formation, namely ni-trogen oxides (NOx) and soot
In the following paragraphs these different topics aretreated separately.
Different strategies for optically accessible IC en-gines have been used over the last years. The designof optical engines requires compromises between theneeds of the diagnostics and the level of comparabil-ity to production-line engines. Best optical accessibilityis obtained with transparent cylinders and extendedwindows that are inserted into the piston (Fig. 20.28).The thickness of pressure-resistant quartz windows,however, usually prevents the operation of the neigh-boring cylinder and changes in-cylinder heat transferconsiderably due to the extended quartz surfaces. More-advanced concepts sacrifice optical access by usingsmaller optical sapphire windows that can be thinenough to fit into a multi-cylinder engine block with mi-nor modifications (Fig. 20.29). Recently, micro-opticallaser-based probes using endoscope optics and fibershave been developed for in-cylinder investigation in ICengines [20.175–177].
8�&������
.�F���� ���M����*
'�����-���-
I���� ���*
��������-���-
��������
'����
(����
��*�������
Fig. 20.28 Basic setup of an optical engine with accessto the combustion chamber through a quartz cylinder anda piston window [20.173]
Analysis of Mixture FormationThere are a number of quantities that would be desirableto measure with non-intrusive in-situ techniques to char-acterize the mixing process in the fresh gas completely.These quantities include:
• Fuel concentration• Fuel–air ratio• Temperature• Fuel composition (i. e., the concentration of individ-ual components)• Residual gas concentration
To visualize the mixing process and to facilitate theinterpretation of the results these quantities should beimaged in at least two dimensions with temporal reso-lution faster than the time scale of mixing and chemicalreaction. A recent review summarizes the state of theart [20.11].
Mixing processes of interest can be categorized ac-cording to the level of difficulty in terms of quantitativeimaging measurements. They are listed here in order ofincreasing complexity.
• Constant pressure versus temporally fluctuatingpressure• Constant temperature versus temporally fluctuating(spatially homogeneous) temperature• Homogeneous temperature versus spatially varyingtemperature• Temperature approaches the stability limit of thetracer
Fig. 20.29 Advanced concept for an optical engine withnarrow sapphire ring that allows the operation of full quasi-production-line four-cylinder engines [20.174]
PartC
20.4

Combustion Diagnostics 20.4 Application of Laser-Based Techniques 1267
• Homogeneous versus inhomogeneous bath gas com-position (mainly oxygen concentration is relevant)• Single-component fuel versus multicomponent fuel• Non-fluorescing versus fluorescing fuel• Homogeneous (gas phase) versus heterogeneous(two-phase flows)
The ideal tracer should behave exactly like the fluid itis added to (i. e., the fuel or the desired component ofa multicomponent fuel) in terms of droplet formation,evaporation, convection, diffusion, reactivity, and reac-tion rate. It is obvious that these requirements can notbe met in full. However, practical tracers are often verysimilar to the fuel or are components that are present incommercial fuels. Therefore, in some situations, trac-ers must not be understood as being added to the fuel.Rather, the other fluorescing substances are replacedby non-fluorescing compounds. The modification of thesystem must be kept to a minimum and the influenceof the tracers on a given experimental situation must becritically reviewed.
Ideally, the tracer should yield LIF signal intensitiesthat are directly proportional to the desired quantity andshould not be influenced by the ambient conditions. Un-fortunately, signals from all fluorescent tracers show atleast some dependence on local temperature, pressureand bath gas variation. Therefore, in experiments whereambient conditions change in time or space, the under-lying interdependencies with the tracer signal must beunderstood in order to obtain quantitative results.
Tracers for Homogeneous Gas-Phase Systems. Tracer-based LIF techniques have been used for experimentalstudies in fluid mechanics and combustion for sev-eral years. Tracers are single components (molecules oratoms) with highly defined spectral behavior that repre-sents the local concentration of the fluid of interest or thatallow to remotely measure a quantity of interest (i. e.,temperature or pressure). Typically, compounds are cho-sen that yield strong enough LIF signal intensities toallow two- (or even three-)dimensional visualization ofthe desired quantity with sufficient temporal resolutionto freeze the motion.
There are two opposite cases that require the appli-cation of tracers for the measurement in fluids. First,the components of the fluid do not (or only weakly)fluoresce. This is the case for air and typical exhaustgases (H2O [20.178], CO2 [20.179]). At room tempera-ture these species are only excited in the vacuum-UVregion and only at high temperatures do their spec-tra extend into the spectral range that is of practical
use for combustion diagnostics. The resulting signal inO2 [20.180] and CO2 [20.179] is then strongly temper-ature dependent and the practical use for concentrationmeasurements is limited. In the second case the fuelcontains too many fluorescing compounds. This is truefor commercial fuels. Their fluorescence has been usedto obtain qualitative and semiquantitative measurementsof fuel vapor concentrations [20.181]. However, becauseall these compounds have different physical propertiesin terms of volatility and transport as well as in termsof their spectral response on variations in ambient con-ditions, the overall signal cannot be quantified. In bothsituations it is desirable to add a single tracer that canbe selectively observed within the fluid. In the case offuels (gasoline or Diesel-type fuels) this often meansreplacing the fluorescing compounds of the fuel by non-fluorescing compounds leaving only one, or adding anadditional compound that was not part of the originalmixture.
Different classes of molecules have been used astracers. The choice of potential tracers is driven bythe desire to add a minimum concentration of foreignmaterial that yields a maximum LIF signal intensitywhile not perturbing the system under study. To providehigh enough seeding concentrations especially at lowtemperatures (room temperature) the tracer must havea sufficient vapor pressure. While the main part of thefollowing section focuses on the fuel-like hydrocarbon-based tracers, we include other concepts in the followingoverview.
Atoms have large absorption cross sections and arecandidates that emit strong fluorescence upon excita-tion in the UV and the visible. The atomization ofthe material, however, requires the high temperaturesthat are present in flames. Some metal salts (such asthallium or indium chloride) can be dissolved in thefuel. In the flame front metal atoms are then gener-ated that can be used to measure temperature in theburned gas [20.182,183]. The strong transition momentsin atoms allow the use of extremely low (and thereforenon-perturbing) seeding levels. The strong transitions,in turn, are easily saturated. Excitation laser intensitiesare therefore limited and signals are weak, despite theirfavorable spectroscopic properties. For the observationof fuel distributions prior to combustion this class offluorescing species is not suitable.
Small Inorganic Molecules. Di- and triatomic inorganicmolecules are frequently used in combustion diagnos-tics. While unstable radicals such as OH, CH, C2 thatappear during the combustion process can be used
PartC
20.4

1268 Part C Specific Experimental Environments and Techniques
for flame-front localization and combustion diagnos-tics [20.10], they are not suitable for observations inthe mixing process prior to ignition. Strongly fluoresc-ing stable species, however, are potentially interesting astracers for the airflow. NO has been used despite its toxic-ity for studies in gaseous mixing processes [20.184,185]and its spectroscopy is well understood for a wide rangeof possible applications [20.186]. OH and NO can alsobe photolytically generated in flow systems. While notsuited for studying mixing on a large scale, these flow-tagging techniques give detailed insight into the fluidmotion within the lifetime of the generated species. OHhas been generated following photodissociation of vi-brationally hot water [20.167], NO has been producedfrom NO2 photolysis [20.187] and from O2 photolysisin air [20.188].
Molecular oxygen has been used to trace the airflow [20.189] and to measure temperatures during mix-ture formation in a Diesel engine [20.180]. It wasalso used for flow tagging following the excitation ofhigher vibrational states by stimulated Raman scat-tering [known as Raman excitation plus laser-inducedelectronic fluorescence (RELIEF) [20.169]].
Iodine was applied as a fluorescing tracer thatcan be excited and detected in the visible spectralrange [20.190]. Its toxicity, corrosiveness and the dif-ficulty of seeding iodine at constant rates limits itspractical applicability. SO2 can be excited at variouswavelengths below 390 nm and subsequently emits flu-orescence from the UV to the violet [20.191–193]. The(corrosive and toxic) gas (boiling point: −10 ◦C) caneither be doped into the flow or generated in a flamefrom sulfur-containing precursors [20.194]. The lat-ter application was suggested to mark residual burnedgases in internal engine combustion and to visualizetheir mixing with fresh air and fuel. SO2 fluorescenceis strongly quenched by many molecules, includingN2 [20.192, 195–198]. Its applicability in high-pressureenvironments is therefore restricted. The LIF proper-ties of high-temperature CO2 upon excitation in theUV [20.179] offer the potential for new diagnostics forthe observation of mixing of hot burned gases with airand fuel.
Organic Molecules. In contrast to the excitation of atomsand di- and several triatomic molecules, polyatomicorganic molecules have a high density of states andtherefore show broadband absorption spectra with ex-citation possible at various wavelengths that are oftenaccessible with standard laser sources. The organic trac-ers are chemically close relatives of hydrocarbon fuels.
Some of the molecules that are attractive tracers arepresent in commercial fuels at the few percent level.Therefore, relatively high tracer concentrations can beapplied without significantly disturbing the combustionprocess.
The chemical similarity between tracer and fuelhas the additional advantage that the tracer disappears(burns) together with the fuel close to the flame front. Inmeasurements with limited spatial resolution (≈ 1 mm)this is a good match to identify and visualize the positionof reactive zones. However, since the reaction kineticsof the tracer is not perfectly identical to that of the fuel,tracers are not in general suitable for high-resolutionmeasurements close to the flame front, because theirconcentration may not represent the fuel concentrationaccurately in this zone.
Fluorescing organic tracers come in different sizesand structures with different volatilities. According totheir boiling points as a first criterion they can be usedto represent different volatility classes of multicompo-nent fuels [20.199]. At the same time, care must betaken to avoid distillation processes that separate fueland tracer due to non-ideal boiling behavior during thefuel evaporation [20.200–202].
Aromatic hydrocarbons are typical components ofcommercial fuels. These species are responsible for thestrong absorption in the UV and the subsequently emit-ted fluorescence [20.203]. Single-ring aromatics suchas benzene, toluene and xylene are part of gasoline fu-els on the percent level while two-ring aromatics suchas naphthalene and its derivatives are present in Dieselfuels. They typically have high fluorescence quantumyields (toluene: φ = 0.17, benzene: φ = 0.22, fluorene:φ = 0.66, dimethyl anthracene: φ = 0.82) and their ab-sorption and emission spectra shift towards the red withincreasing size of the aromatic system. The wide va-riety of molecular sizes (and therefore boiling points)makes this class of molecules attractive as tracers thatcan be adjusted to the boiling behavior of the fuel orthat are representative for boiling classes in multicom-ponent fuels. For seeding room-temperature gas flowscompounds larger than benzene and toluene have toolow vapor pressures.
A major drawback of aromatic tracers is the strongquenching by oxygen. The signal intensities therefore donot only depend on the tracer but also (inversely) on theoxygen concentration. This effect was taken advantageof by interpreting the signal as proportional to fuel–airratios, which are of major practical interest.
The aromatic compounds in commercial fuelshave been used for qualitative and semiquantitative
PartC
20.4

Combustion Diagnostics 20.4 Application of Laser-Based Techniques 1269
measurements, both in the vapor [20.204] and liquidphase [20.205,206]. Benzene as a fuel tracer is typicallyavoided because of its carcinogenic effects. Tolueneis less toxic and not considered carcinogenic. There-fore, it has been most frequently chosen as a fueltracer [20.207] and recent publications have shed morelight on the dependence of its fluorescence on p, Tand nO2 [20.208, 209]; α-methyl naphthalene was in-vestigated by LIF, see e.g. [20.210], because it is partof a model two-component fuel that is used in experi-mental and numerical studies as a substitute for dieselor JP8 fuel. Like naphthalene, it is used in combina-tion with N,N,N’,N’-tetra-methyl-p-phenylenediamine(TMPD) in exciplex studies to visualize liquid and vaporphases simultaneously [20.211].
Aliphatic Compounds. Typical saturated aliphatic hy-drocarbons such as alkanes and saturated alcohols donot fluoresce. They have their first absorption bands inthe vacuum-UV region and excitation typically leadsto photodissociation. Nonsaturated hydrocarbons withextended conjugated systems that would have usefulspectroscopic properties are unstable and tend to poly-merize.
Fluorescing aliphatic candidates contain chro-mophores that allow excitation into stable states thatsubsequently fluoresce. This class of molecules includesketones (R2CO), aldehydes (R−CHO) and amines(R3N, where R is a saturated aliphatic hydrocarbonchain). The (conjugated) combination of chromophores(as in diketones R−CO−CO−R) typically shifts theabsorption and fluorescence spectra to the red.
Ketones are the most frequently used class of fluo-rescent tracers. Their properties have been extensivelystudied [20.212–218] and they have been applied tovarious practical situations [20.219–222]. The highvapor pressure makes acetone (bp: 56 ◦C) an idealtracer for gaseous flows [20.223,224]. 3-pentanone (bp:100 ◦C) [20.213, 225, 226] or mixtures of 3-pentanoneand 3-hexanone [20.200] have been suggested as trac-ers that mimic the boiling and transport properties ofgasoline. In most of those cases, iso-octane was substi-tuting gasoline. This has the advantage that iso-octaneis non-fluorescent and as a single component is moreamenable to detailed modeling studies. For Diesel fuels,the use of even larger ketones was suggested, althoughthey turned out to have limited stability at high tempera-tures. The larger aliphatic chains enhance the reactivityof the carbonyl group.
The smallest aldehyde, formaldehyde (HCHO),tends to polymerize and is therefore difficult to han-
dle as a dopant. The next largest homologous molecule,acetaldehyde (CH3CHO), has been used as a tracer in in-ternal combustion engines [20.227]. Its low boiling point(21 ◦C) allows high seeding concentrations. Its spectralproperties are comparable to those of acetone. Be-cause acetone is considered less harmful, acetaldehydeis not frequently used as a tracer substance. Aldehy-des with different molecular weight have been usedto trace different boiling fractions in multicomponentfuels [20.228].
The fluorescence quantum yields (φ = 0.0008−0.0018 for acetaldehyde depending on the excitationwavelength and φ = 0.002 for acetone [20.229, 230])are small compared to those of aromatic compoundsin the absence of oxygen. In realistic situations wherefuel is mixed with air, however, the resulting signalsare comparable. Hexafluoroacetone has been suggestedas an alternative that has fluorescence quantum yieldsabout an order of magnitude stronger than in ace-tone [20.231,232]. Because of its toxicity, however, thissubstance has not been further considered as a tracer forpractical applications.
Biacetyl (CH3 −CO−CO−CH3) is frequentlyused as a fluorescent tracer. With a boiling point of88 ◦C the room-temperature vapor pressure is too lowfor many applications. On the other hand, the boilingpoint is significantly below that of typical fuels. Thisintermediate position, its stability and its strong odormight be the reasons why biacetyl, despite its attrac-tive spectroscopic properties and its extensively studiedphotophysics [20.233–235], is less popular than ketones.For seeding oxygen-free flows, biacetyl is especially at-tractive because of its high phosphorescence quantumyield (15%, but strongly quenched by O2).
Amines do fluoresce upon UV excitation. Somestudies have covered ethylamine [20.236], and N,N-dimethylaniline [20.237]. Strong quenching by oxygenoften hinders practical applications and an unpleasant(fish-like) smell and toxicity may deter people fromusing this class of tracers. Amines have found some at-tention as part of exciplex systems TMPD [20.211,238],triethylamine (TEA) [20.239], and diethylmethylamine(DEMA) [20.240]. TEA and DEMA do not contributesignificantly to the overall gas-phase signal but play animportant role in forming the excited complex that isresponsible for a shift of the liquid-phase fluorescencerelative to that of the monomers.
Analysis of Air–Fuel Ratio. Depending on the sys-tem under study various approaches have been usedfor determining the local fuel–air equivalence ratio
PartC
20.4
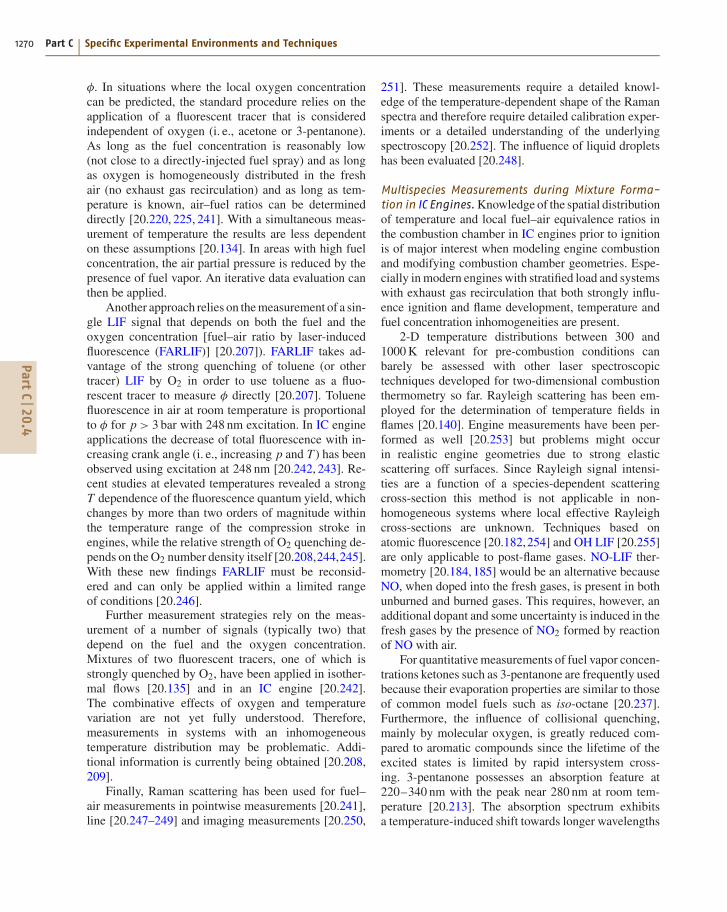
1270 Part C Specific Experimental Environments and Techniques
φ. In situations where the local oxygen concentrationcan be predicted, the standard procedure relies on theapplication of a fluorescent tracer that is consideredindependent of oxygen (i. e., acetone or 3-pentanone).As long as the fuel concentration is reasonably low(not close to a directly-injected fuel spray) and as longas oxygen is homogeneously distributed in the freshair (no exhaust gas recirculation) and as long as tem-perature is known, air–fuel ratios can be determineddirectly [20.220, 225, 241]. With a simultaneous meas-urement of temperature the results are less dependenton these assumptions [20.134]. In areas with high fuelconcentration, the air partial pressure is reduced by thepresence of fuel vapor. An iterative data evaluation canthen be applied.
Another approach relies on the measurement of a sin-gle LIF signal that depends on both the fuel and theoxygen concentration [fuel–air ratio by laser-inducedfluorescence (FARLIF)] [20.207]). FARLIF takes ad-vantage of the strong quenching of toluene (or othertracer) LIF by O2 in order to use toluene as a fluo-rescent tracer to measure φ directly [20.207]. Toluenefluorescence in air at room temperature is proportionalto φ for p > 3 bar with 248 nm excitation. In IC engineapplications the decrease of total fluorescence with in-creasing crank angle (i. e., increasing p and T ) has beenobserved using excitation at 248 nm [20.242, 243]. Re-cent studies at elevated temperatures revealed a strongT dependence of the fluorescence quantum yield, whichchanges by more than two orders of magnitude withinthe temperature range of the compression stroke inengines, while the relative strength of O2 quenching de-pends on the O2 number density itself [20.208,244,245].With these new findings FARLIF must be reconsid-ered and can only be applied within a limited rangeof conditions [20.246].
Further measurement strategies rely on the meas-urement of a number of signals (typically two) thatdepend on the fuel and the oxygen concentration.Mixtures of two fluorescent tracers, one of which isstrongly quenched by O2, have been applied in isother-mal flows [20.135] and in an IC engine [20.242].The combinative effects of oxygen and temperaturevariation are not yet fully understood. Therefore,measurements in systems with an inhomogeneoustemperature distribution may be problematic. Addi-tional information is currently being obtained [20.208,209].
Finally, Raman scattering has been used for fuel–air measurements in pointwise measurements [20.241],line [20.247–249] and imaging measurements [20.250,
251]. These measurements require a detailed knowl-edge of the temperature-dependent shape of the Ramanspectra and therefore require detailed calibration exper-iments or a detailed understanding of the underlyingspectroscopy [20.252]. The influence of liquid dropletshas been evaluated [20.248].
Multispecies Measurements during Mixture Forma-tion in IC Engines. Knowledge of the spatial distributionof temperature and local fuel–air equivalence ratios inthe combustion chamber in IC engines prior to ignitionis of major interest when modeling engine combustionand modifying combustion chamber geometries. Espe-cially in modern engines with stratified load and systemswith exhaust gas recirculation that both strongly influ-ence ignition and flame development, temperature andfuel concentration inhomogeneities are present.
2-D temperature distributions between 300 and1000 K relevant for pre-combustion conditions canbarely be assessed with other laser spectroscopictechniques developed for two-dimensional combustionthermometry so far. Rayleigh scattering has been em-ployed for the determination of temperature fields inflames [20.140]. Engine measurements have been per-formed as well [20.253] but problems might occurin realistic engine geometries due to strong elasticscattering off surfaces. Since Rayleigh signal intensi-ties are a function of a species-dependent scatteringcross-section this method is not applicable in non-homogeneous systems where local effective Rayleighcross-sections are unknown. Techniques based onatomic fluorescence [20.182,254] and OH LIF [20.255]are only applicable to post-flame gases. NO-LIF ther-mometry [20.184, 185] would be an alternative becauseNO, when doped into the fresh gases, is present in bothunburned and burned gases. This requires, however, anadditional dopant and some uncertainty is induced in thefresh gases by the presence of NO2 formed by reactionof NO with air.
For quantitative measurements of fuel vapor concen-trations ketones such as 3-pentanone are frequently usedbecause their evaporation properties are similar to thoseof common model fuels such as iso-octane [20.237].Furthermore, the influence of collisional quenching,mainly by molecular oxygen, is greatly reduced com-pared to aromatic compounds since the lifetime of theexcited states is limited by rapid intersystem cross-ing. 3-pentanone possesses an absorption feature at220–340 nm with the peak near 280 nm at room tem-perature [20.213]. The absorption spectrum exhibitsa temperature-induced shift towards longer wavelengths
PartC
20.4

Combustion Diagnostics 20.4 Application of Laser-Based Techniques 1271
of about 10 nm per increase of 100 K (Fig. 20.30). Uponexcitation in this region, fluorescence is emitted be-tween 330 and 550 nm, with a spectral distributionthat is almost independent of the absorbed wave-length. This spectral shift of the absorption, albeitundesired for concentration measurements with single-wavelength excitation, can be used for measuringtemperature, e.g., when 3-pentanone is seeded to non-fluorescing model fuels, as the fluorescence intensityis a function of the absorption coefficient for a givenexcitation wavelength, and thus, of temperature. Af-ter excitation at two different wavelengths the ratioof the fluorescence signal intensities reflects the lo-cal temperature. This was first described by Großmannet al. [20.213] and later applied to temperature meas-urements using acetone as a tracer [20.256]. Sincethis temperature measurement is based on the ratioof signal intensities it is independent of local tracerconcentrations and therefore allows measurementsof 2-D temperature distributions in nonhomogeneoussystems.
For the organic tracers the fluorescence signal S forweak laser excitation is given by the following equation:
Sfl(λ, p, c, T ) = cILaser(λ)VNσ(λ, p, x, T )
×φ(λ, p, x, T ) , (20.2)
where ILaser is the local laser pulse energy in the de-tection volume V , N is the number density and σ themolecular absorption cross section of the marker, and
!@!�8
�#"
0
,�5����*���6�7
3�������
���H��@A�
;@!�8#�!�8
!""
�!�H�!"+��0�H��;+�
Fig. 20.30 Temperature dependence of the absorptionspectra of 3-pentanone. The spectra are normalized, andthe total integral increases with temperature [20.213]
φ its fluorescence quantum yield. σ and φ depend onthe excitation wavelength λ, the pressure p, the mix-ture composition x, and the temperature T . The factorc captures geometrical arrangements and detection op-tics properties. If the same volume V is excited by twolaser pulses of different wavelengths (with a short tem-poral delay to ensure separate detection of the inducedfluorescence), the ratio
S1 (λ1, p, T )
S2 (λ2, p, T )= ILaser1 (λ1)
ILaser2 (λ2)
σ1 (λ1, p, x, T )
σ2 (λ2, p, x, T )
×φ1 (λ1, p, x, T )
φ2 (λ2, p, x, T )(20.3)
depends on the pressure- and temperature-induced vari-ation in absorption cross-sections and fluorescencequantum yields whereas it is independent of the ob-served volume V , the number density N of the detectedspecies and the detection efficiency c. Pressure and pos-sible composition effects can be corrected for using dataprovided by Großmann [20.213] and Ossler [20.215]by including a pressure-dependent ratio π1/π2 that in-cludes effects on σ and φ. Then, the remaining ratio ofboth signals normalized to the respective laser energy isa function F(T ) of temperature only.
S1 (λ1, p, T ) /ILaser1 (λ1)
S2 (λ2, p, T ) /ILaser2 (λ2)
π2
π1
= σ1 (λ1, T )
σ2 (λ2, T )
φ1 (λ1, T )
φ2 (λ2, T )= F(T ) . (20.4)
A strong temperature dependence of the ratio, and hencehigh accuracy, can be expected when λ1 and λ2 are se-lected on opposite sides of the absorption maximum. Weapply a combination of 248 and 308 nm excitation. Thetemperature dependence of the ratio F(T ) for these con-ditions is shown in Fig. 20.31 [20.257]. With the local
!"""
�����������687
�.&�����������������!"+�4 ��;+�
0
�
!
;
#
;"" #"" A"" @""
Fig. 20.31Temperaturedependence ofthe ratio ofLIF intensitiesin 3-pentanonewith 308 and248 nm excita-tion [20.134]
PartC
20.4
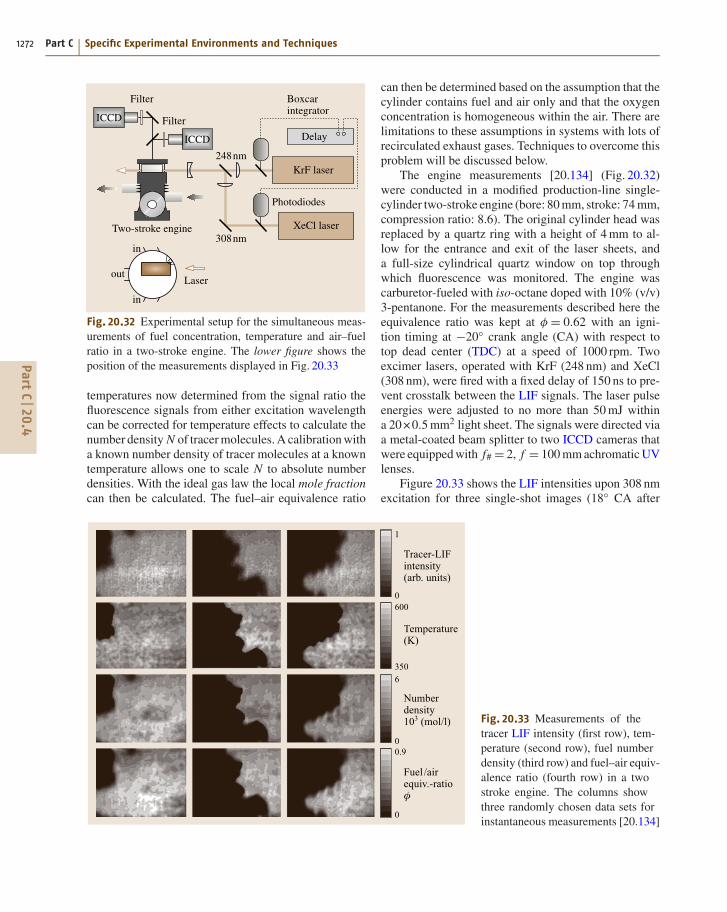
1272 Part C Specific Experimental Environments and Techniques
������������
���
�����
�����
����
�
�
���
����
����
����������
����
�� !����������
"�������
#�������
���
Fig. 20.32 Experimental setup for the simultaneous meas-urements of fuel concentration, temperature and air–fuelratio in a two-stroke engine. The lower figure shows theposition of the measurements displayed in Fig. 20.33
temperatures now determined from the signal ratio thefluorescence signals from either excitation wavelengthcan be corrected for temperature effects to calculate thenumber density N of tracer molecules. A calibration witha known number density of tracer molecules at a knowntemperature allows one to scale N to absolute numberdensities. With the ideal gas law the local mole fractioncan then be calculated. The fuel–air equivalence ratio
��������.&���������6���<������7
0
"
����������687
A""
!#"
������������0"!�6�4�7
A
"
&��� 4����N��5<������
"<$
"
Fig. 20.33 Measurements of thetracer LIF intensity (first row), tem-perature (second row), fuel numberdensity (third row) and fuel–air equiv-alence ratio (fourth row) in a twostroke engine. The columns showthree randomly chosen data sets forinstantaneous measurements [20.134]
can then be determined based on the assumption that thecylinder contains fuel and air only and that the oxygenconcentration is homogeneous within the air. There arelimitations to these assumptions in systems with lots ofrecirculated exhaust gases. Techniques to overcome thisproblem will be discussed below.
The engine measurements [20.134] (Fig. 20.32)were conducted in a modified production-line single-cylinder two-stroke engine (bore: 80 mm, stroke: 74 mm,compression ratio: 8.6). The original cylinder head wasreplaced by a quartz ring with a height of 4 mm to al-low for the entrance and exit of the laser sheets, anda full-size cylindrical quartz window on top throughwhich fluorescence was monitored. The engine wascarburetor-fueled with iso-octane doped with 10% (v/v)3-pentanone. For the measurements described here theequivalence ratio was kept at φ = 0.62 with an igni-tion timing at −20◦ crank angle (CA) with respect totop dead center (TDC) at a speed of 1000 rpm. Twoexcimer lasers, operated with KrF (248 nm) and XeCl(308 nm), were fired with a fixed delay of 150 ns to pre-vent crosstalk between the LIF signals. The laser pulseenergies were adjusted to no more than 50 mJ withina 20 ×0.5 mm2 light sheet. The signals were directed viaa metal-coated beam splitter to two ICCD cameras thatwere equipped with f# = 2, f = 100 mm achromatic UVlenses.
Figure 20.33 shows the LIF intensities upon 308 nmexcitation for three single-shot images (18◦ CA after
PartC
20.4

Combustion Diagnostics 20.4 Application of Laser-Based Techniques 1273
TDC). The correction for temperature effects was per-formed on a per-pixel basis. The temperature-correctedLIF images were then calibrated to absolute numberdensities using the measurements under perfectly mixedconditions where the fuel concentration was calculatedfrom the ratio of measured air flow and fuel consump-tion. The resulting images give absolute fuel numberdensities (third row). Since pressure gradients withinthe cylinder can be safely neglected temperature imagesallow the calculation of total number densities, whichenable the calculation of fuel–air equivalence ratio dis-tributions (fourth row). This series of images shows howthe actual equivalence ratio corresponds to the measuredLIF intensity.
Simultaneous Measurement of Fuel and OxygenConcentration. In future highly energy-efficient com-bustion systems such as stratified-charge engines orhomogeneous-charge compression-ignition (HCCI) en-gines, high concentrations of recycled exhaust gasesstrongly dilute the fuel–air mixture. In these situations,ignitability, flame speed, and auto-ignition susceptibilityare governed by fuel and oxygen concentrations (num-ber densities) rather than equivalence ratios. Whereasseveral techniques for measuring fuel concentrationsand equivalence ratios are available (measurementsfor example based on the assumption that for tracersthat are strongly quenched by oxygen – within a lim-ited range [20.258] – the LIF signal is proportionalto the equivalence ratio [20.207]. For the limitationsof this assumptions under combustion-engine condi-
�#""
,�5����*���6�7
&���������������������6���<������7
;
+
0�
0A
##"!"" !#" ;"" ;#" #""
������
!�'��������690#""7
Fig. 20.34 Emission spectra of toluene and 3-pentanonewith excitation at 248 nm. The signal of both species can beseparated with appropriate filters. In pure nitrogen (shownhere) the toluene signal dominates by far (3-pentanonesignal enhanced by a factor of 1500) [20.135]
tions see [20.246, 259]), we report here a techniquethat allows the simultaneous measurement of oxygenconcentrations with a suitable tracer combination ofaromatic and ketonic tracers. Aromatic molecules areefficiently quenched by molecular oxygen [20.260]. Theinfluence of O2 quenching on aliphatic ketones on theother hand is greatly reduced [20.213]. Aromatic andketonic compounds have different LIF emission spectraupon excitation in the UV. Whereas single-ring aromaticcompounds such as toluene display a narrow emissionband peaking around 280 nm, the emission of ketoneslike 3-pentanone appears between 320 and 450 nm witha broad maximum at around 370 nm (Fig. 20.34). Thisdifference has been used previously for the detection ofthe two different tracers when simultaneously observingthe distribution of different volatility classes of multi-component fuels [20.199]. Here, we use this two-tracerapproach for measuring oxygen concentrations.
For weak excitation the LIF signal intensity Sfl isgiven above. Molecular oxygen is regarded as the onlyrelevant species quenching toluene fluorescence, while3-pentanone fluorescence is considered independent ofoxygen concentration. For a mixture of 3-pentanone (3P)and toluene (tol) the ratio of signal intensities SR
fl (20.5)is a function of the oxygen concentration only [ f (nO2 )]since all the other factors are either constant (like ab-sorption cross sections due to constant pressure andtemperature) or cancel (like the local laser intensity anddetection volume):
SRfl = S3P
fl
Stolfl
= const ×φ3P
fl
φtolfl
= f (nO2 ) . (20.5)
The fluorescence quantum yield φifl for species i is
φifl = ki
fl
kitot + k̃i
qnq(20.6)
with the rate coefficient for spontaneous emission kifl and
the sum rate of all collision-independent de-excitationprocesses ki
tot. k̃iq is the rate coefficient for collisional
quenching with the quencher (i. e., O2) number den-sity nq.
For atmospheric pressure in 3-pentanone, as in allaliphatic ketones, quenching by O2 can be neglected(because k̃3P
q nq � k3Ptot). With the Stern–Volmer coeffi-
cient for toluene quenched by O2 (ktol,O2SV = k̃tol,O2
q /ktoltot)
the above equation can be rewritten [20.135]:
SRfl = const
k3Pfl (ktol
tot + k̃tolq nq)
k3Ptotk
tolfl
= c1
(1+ ktol,O2
SV nq
).
(20.7)
PartC
20.4

1274 Part C Specific Experimental Environments and Techniques
���*��������������������6���7
��<���*����������4"�
0
�
!
;
" #" 0"" 0#" �""
Fig. 20.35 Signal ratio of 3-pentanone and toluene LIFnormalized to the ratio measured in pure nitrogen [20.135]
The signal ratio of 3-pentanone versus toluene LIF there-fore increases linearly with the oxygen number density.The offset, given by c1, can be obtained from a single-point calibration. An experimental validation is shownin Fig. 20.35. This simple approach assumes that thetoluene and 3-pentanone signals are detected indepen-dently without any spectral overlap and that oxygen isthe only quenching species. Further corrections may beadded in order to reduce the systematic errors caused bythese assumptions [20.135].
The Stern–Volmer coefficients and absorption andfluorescence spectra have been measured in a static cellwhere evaporated tracers were combined with variouspressures of air and nitrogen. The imaging experi-ments were carried out in an optically accessible quartzcell with square cross section (40 mm2 × 40 mm2). Two
�� �� ��
���� ��������� ������ ��*���F��
��6������7
3��6������7
��6������7
3��6������7
3��6������7
������<�6>7" �"0"
���������������6>7" �"
��3 3
)
!�'��.&
�������.&
)
Fig. 20.36 Results of the O2 imagingmeasurements in the mixing cham-ber [20.135]. For details see thetext
metal tubes (exit diameter 1 mm) were inserted 5 mmapart with the gas streams mixing at an angle of ap-proximately 30◦. The tubes were supplied with variousmixtures of nitrogen and oxygen controlled by mass-flow controllers. The gas mixtures were bubbled througha blend of the liquid tracers (3-pentanone and toluene,50 : 50 per volume), which were kept at a constanttemperature of 293 K. The gaseous tracer concentra-tion was therefore constant in both gas streams witha fixed ratio of both tracer compounds determined bythe vapor pressure of the binary mixture. The volumeof the liquid mixture was large enough to ensure neg-ligible changes in its composition over time. For theexperiments presented here one stream was suppliedwith pure nitrogen and the other contained variable oxy-gen concentrations. The gas exit velocities were set to5–15 m/s. The mixing cell was purged with an addi-tional nitrogen flow that was quiescent compared tothe velocities of the other two gas streams. For cal-ibration of the LIF signal ratio, a single gas streamwith identical tracer concentrations but at various well-known oxygen concentrations was used. For imaging,the 248 nm laser beam was expanded to a light sheet0.4 mm thick and 30 mm high and directed through thequartz cell 2 mm below the tube exits. The LIF signalwas detected simultaneously with two ICCD camerasequipped with appropriate filters for observing eachtracer separately.
Results of the two-tracer imaging technique in anarrangement of interacting N2 and air gas jets withina quiescent N2 atmosphere are shown in Fig. 20.36. Thefirst box Fig. 20.36a shows the individual pictures takenin the toluene and 3-pentanone spectral region in the
PartC
20.4

Combustion Diagnostics 20.4 Application of Laser-Based Techniques 1275
two interacting turbulent gas jets. The 3P-LIF imageshows increased signal intensities in the nitrogen jet dueto some spectral overlap from the strong toluene signal.This error is corrected for by quantifying the relativecontribution of toluene LIF to the 3-pentanone detec-tion channel in additional experiments where the flow isseeded with toluene only. The second image shows thatthe ratio of signal intensities is not directly a functionof oxygen number density [according to (20.7)] sincethe left jet (containing no O2) yields higher signal inten-sities compared to the mixing region. After correctingfor energy transfer processes [20.135], this artifact dis-appears (right image in Fig. 20.36a) and the resultingsignal is calibrated using a measurement in pure air.Figure 20.36b shows the oxygen distribution in sim-ilar flows at a slower exit velocity at which the twolaminar gas flows stay mostly separated. Figure 20.36cshows the O2 distribution in an air jet injected intoa quiescent N2 atmosphere where the dilution of O2by entrainment of N2 is clearly visible. The line plotshows the oxygen concentration along the line in the2-D image including error bars to demonstrate the sen-sitivity of the technique. Since only the incoming jetswere seeded by tracers, the outer region does not yieldany information in these measurements and is shown inblack.
Quantitative Nitric Oxide Diagnosticsin High-Pressure Combustion
Detection of nitric oxide using LIF is of particularinterest because NO is one of the most importantcombustion-generated pollutants. Oxides of nitrogen inthe atmosphere contribute to photochemical smog andare precursors to acid rain. Exhaust from aircraft en-gines can add to the destruction of stratospheric ozonewhile automobile exhaust adds NO/NO2 to our urbanatmosphere. A significant amount of this nitrogen oxideis directly caused by combustion of biomass and fos-sil fuels [20.262]. As regulations for the restriction ofNO become more stringent, much effort and researchis underway to develop new and improved combustionsystems that meet these standards. To optimize the com-bustion processes involved, a coupled understanding ofphysical and chemical processes and empirical diagnos-tic methods to map out the formation of the pollutantsare required.
Choice of NO Detection Schemes for High-PressureFlames. Two-dimensional LIF measurements of tracespecies require the coincidence of strong electronic tran-sitions with the emitted wavelength of intense light
��# �#" �@#
6"?"7
6"?076"?�7
6"?!7
6"?;7
,�5����*���6�7
������
0<G��������D ���3�1�6"?"7������A���������D �����������G��������D ���3�1�6"?07�����!A���������D �������������������G��������D ���3�1�6"?�7�����;+���������D �������������������
�<
!<
Fig. 20.37 Different options for NO LIF detection with excitationin the A−X band
sources; therefore, excimer lasers are a convenientsource for NO excitation, but the limited wavelengthtuning enables only a few excitation schemes. The NOD-X(0,1) system can be probed with 193 nm radiation,e.g., from an ArF excimer laser [20.263], the A-X(0,0)
0$!��:1�6"?07
O��5� ���M����*
'����
������5������������������0"<#"
������5������������������0"<#"
90"0A�����������4�!A!"
@<#�
��#�3:1�6"?"7
�;+�3:1�6"?�7
�����
Fig. 20.38 Attenuation of laser light at different wavelengths dur-ing NO imaging with 193, 225 and 248 nm excitation. All threeframes show the engine under identical operating conditions. Onlywith the longest wavelength (248 nm) was the expected symmetri-cal distribution of NO in the cylinder observed (φ = 1 propane/airflame, actual pressure: 13 bar) [20.253, 261]
PartC
20.4

1276 Part C Specific Experimental Environments and Techniques
band at 225 nm with a H2 Raman-shifted KrF excimerlaser [20.150], or the A-X(0,2) band at 248 nm witha tunable KrF excimer laser [20.264]. Other measure-ments have been carried out with dye lasers and OPOsystems in the (0,0) [20.265,266] and (0,1) [20.267,268]bands.
The NO D-X(0,1) system at 193 nm works for com-bustion processes where strongly absorbing species arepresent at low number densities only. In high-pressurecombustion systems drastic attenuation of laser andsignal light by hot CO2, H2O and O2 limits their appli-cability [20.261,270]. Therefore, we focus here on threeNO detection schemes with A-X excitation, as depictedin Fig. 20.37.
In lean and stoichiometric high-pressure flames theselectivity of NO detection is perturbed by interferinghot-bands of O2 that overlap the NO excitations. Atpressures of a few bar, the quantum yield of O2 LIFis dominated by predissociation, and the NO quantumyield decreases with increasing pressure due to col-lisional quenching while the O2-LIF quantum yieldsremains constant. It is therefore crucial to choose NOexcitation schemes that minimize the simultaneous ex-citation of O2.
The NO A-X(0,0) system at 225 nm hasbeen successfully used for measurements in high-pressure methane/air flames [20.271] and in en-gines fueled with propane under conditions up to20 bar [20.272]. Three different strategies have beenstudied and applied to combustion diagnostics. WhereasDiRosa et al. [20.265] uses the combined P1(23.5),Q1 +R12(14.5), Q2 +R12(20.5) feature at 226.03 nm,
�""
,�5����*���6�7
�60":0$��4������7
"
�
;
A
!""��# �#" �@#
����������687
0"""
!"""
0#""�"""�#""
Fig. 20.39 Wavelength and temperature dependence of the CO2 ab-sorption cross sections [20.269]. A parameter fit to this data for thecalculation of temperature- and wavelength-dependent absorptioncross sections can be found in [20.261]
Laurendeau et al. [20.266] prefer the Q2(26.5) tran-sition at 225.58 nm. Within the tuning range of theRaman-shifted KrF excimer Sick [20.272] chooses theR1 +Q1(21.5) line at 225.25 nm. We use measurementsin a methane/air flames at 1–60 bar to compare the O2LIF interference and signal intensities of these threeapproaches.
Optical absorption in high-pressure combustionenvironments increases strongly at short wave-lengths [20.261, 270] as a result of the transmissionproperties of hot CO2 and H2O [20.269, 273]. In high-pressure media, where the number density of absorbersis high, it is therefore desirable to use the longest possiblewavelengths for excitation and detection. Excitation ofthe NO A−X(0, 2) near 248 nm [20.264, 274] exploitsthe strong KrF laser sources and has significantly lessoptical absorption in the engine; the feasibility of thisapproach is demonstrated with detailed spectroscopicstudies [20.153, 274] and in-cylinder engine measure-ments (Fig. 20.38) [20.253, 275, 276]. In addition, thisstrategy allows the detection of NO fluorescence in theA−X(0, 1) band, which is blue of the excitation light.This is a significant advantage as it suppresses LIF in-terference from intermediate hydrocarbon compounds.Unfortunately, the thermal population of the v′′ = 2 levelat post-flame temperatures is small, leading to a ratherweak LIF signal intensity.
The availability of optical parametric oscillator sys-tems (OPOs) which provide high laser pulse energiesthroughout the UV (up to 30 mJ/pulse) allows conve-nient excitation of the NO A−X(0, 1) transition, andJamette et al. applied this scheme to measurements inan spark ignition (SI) engine [20.267].
A detailed analysis of the properties of the differentexcitation/emission schemes in the NO A−X has beenperformed based on spectroscopic measurements in lam-inar high-pressure flames [20.153, 186, 277–280]. Theresults were used to develop the LIFSim spectral simu-lation code that allows the simulation of absorption andemission spectra as well as the pressure and temperatureinfluence in user-specified gas mixtures [20.174, 281].
Influence of Attenuation by Hot CO2. Experimentsin engines and high-pressure flames showed that hotexhaust gases strongly attenuate UV laser and signallight [20.261]. Figure 20.39 shows the strong wave-length dependence of the transmission of laser lightin hot combustion gases. It was shown that this effectis mainly due to the shift of vacuum-UV absorp-tion features of CO2 towards longer wavelengths withincreasing temperature [20.269]. For H2O a similar
PartC
20.4

Combustion Diagnostics 20.4 Application of Laser-Based Techniques 1277
Table 20.2a,b Transmission at NO excitation wavelengthsin two typical high-pressure combustion situations due tohot CO2 (CO2 and H2O) absorption: (a) high-pressureflame: diameter 8 mm, 40 bar, 2300 K and (b) engine cylin-der: diameter 7 cm, 13 bar, 2400 K [20.261]
High-pressure flame, Engine cylinder,diameter: 8 mm diameter: 7 cm
193 nm 13.7% (0.4%) 0.02% (10−6%)
226 nm 62.4% (58.1%) 11.5% (9.1%)
237 nm 75.4% (73.8%) 26.6% (24.8%)
248 nm 84.4% (83.9%) 44.3% (43.4%)
behavior can be found at short wavelengths. It is,however, negligible at λ > 230 nm [20.269]. Transmis-sion in typical high-pressure combustion situations iscalculated (based on an empirical fit to the data inFig. 20.40 [20.261]) for the different NO excitationwavelengths and summarized in Table 20.2. These datashow that in many practical applications the longest pos-sible wavelengths must be used for NO excitation despitethe relatively weak fluorescence intensity that can be
0""""
�����������687
�.&���*��������������6���<������7
�"
;"
A"
+"
0""
!"""0#"" �""" �#""0""""
�����������687
�.&���*��������������6���<������7
�"
;"
A"
+"
0""
!"""0#"" �""" �#""0""""
�����������687
�.&���*��������������6���<������7
�"
;"
A"
+"
0""
!"""0#"" �""" �#""�����������687
0""""
�����������687
�.&���*��������������6���<������7
�"
;"
A"
+"
0""
!"""0#"" �""" �#""0""""
�����������687
�.&���*��������������6���<������7
�"
;"
A"
+"
0""
!"""0#"" �""" �#""0""""
�����������687
�.&���*��������������6���<������7
�"
;"
A"
+"
0""
!"""0#"" �""" �#""�����������687
���� ����������������� ��
���� �������������� ��
��������� �� �� ��������� �� ����������� �� ��
Fig. 20.40 Simulated variation of NO LIF signal with temperature for three excitation strategies. Rotational transitionswith minimal O2 LIF interference have been chosen [20.186]. p = 10 bar
expected upon excitation from the excited vibrationallevels.
Temperature Dependence of the Different NO Excita-tion Strategies. LIF diagnostics of practical systems aregreatly simplified if the signal is relatively insensitiveto the local gas temperature. The Boltzmann popula-tion of each of the vibrational manifolds produces quitedifferent temperature sensitivities. In the temperaturerange relevant to post-flame gases (1500–2500 K) thesignal intensity after excitation in the (0,0) band de-creases with increasing temperature whereas in the (0,1)and (0,2) bands signals are strongly increasing. Minimalvariation of the ro-vibrational population with tempera-ture is found for the intermediate rotational levels in the(0,0) band. The (0,1) band has minimal pressure depen-dence since the chosen excitation line is within a verydense part of the spectrum where at elevated pressuresneighboring lines contribute significantly to the over-all signal. The simulated temperature dependence of theNO-LIF signal is shown in Fig. 20.40 for p = 10 barfor the candidates with minimal O2 LIF interference for
PartC
20.4

1278 Part C Specific Experimental Environments and Techniques
each vibrational band. The data in Fig. 20.40 includethe temperature dependence of Boltzmann population,spectral overlap of laser and NO transition, and col-lisional quenching. Note this temperature dependencecan be mitigated with the judicious choice of measur-ing either number density or mole fraction. Excitationin the (0,0) band has weak temperature dependenceof number density; however, excitation of the (0,1) or(0,2) bands can provide mole fraction measurementsthat are weakly temperature dependent at combustiontemperatures.
There are three practical schemes for NO A−XLIF, which involve exciting transitions in the (0,0),(0,1) and (0,2) bands. In systems where excitationin the NO A−X(0, 0) band is not hindered by laserand signal absorption an NO absorption feature at226.03 nm was found to be the best choice in termsof spectral purity and signal intensity. A−X(0, 1) exci-tation with (0,0) detection provides strong signal, smallvariation of signal with gas temperature when evalu-ating mole fraction, and good suppression of O2-LIFinterference. Any scheme exciting or detecting (0,0)in high-pressure hydrocarbon combustion, however, isplagued by attenuation of the excitation or fluorescencelight. Excitation of A−X(0, 1) with (0,2) detectionprovides significantly stronger signals with less tem-perature variation than strategies using (0,2) excitation,and the interference from O2 LIF is comparable for(0,1) and (0,2) excitation. However, practical engine di-
��#<$#"
G���������-�5����*���6�7
�.&���*����6���<������7
"
�""
;""
A""
+""
0"""
��A<0��A ��A<"#
G�������� �������
�0""8;""8
Fig. 20.41 Schematic of multi-line 2-D temperature measurementstrategy based on a single point. NO A−X(0, 0) excitation at 5 bar.The images show an area of 11 mm2 × 13 mm2 above the burnerexit [20.185]
agnostics have hydrocarbon fluorescence interferencered of the excitation light. The strategy of excitingNO A−X(0, 2) and detection of (0,1) provides LIFsignal blue-shifted compared to the excitation light.This advantage may outweigh the lower signal andgreater temperature sensitivity for practical diagnosticsapplications.
Quantitative Multi-Line Temperature Imaging. Tem-perature imaging is often performed as a two-linetechnique that probes the relative population of tworo-vibrational ground states in molecules such asNO [20.282, 283] or OH [20.255, 284]. This techniquetypically requires a calibration with measurements inan environment with known temperature and is affectedby background signal. With simultaneous application oftwo excitation wavelengths, instantaneous temperatureimaging is possible. Alternatively, scanning techniqueshave been applied that record the fluorescence exci-tation spectrum over an extended range of excitationwavelengths and evaluates absolute temperatures – in-dependent of signal background – from the shape of thespectra [20.271]. We use the latter approach to meas-ure temperature fields in stationary flames [20.185].For the multi-line temperature imaging, 2-D LIF ex-citation scans were performed over a broad spectralrange in the NO A−X(0, 0) band. For each individualpixel, LIF intensities were extracted versus excitationwavelengths, yielding experimental excitation spec-tra (Fig. 20.41).
The LIFSim spectral simulation code [20.281, 285]was then used to fit simulated spectra to the experimen-tal data for each pixel. This yields absolute temperatureswithout the requirement for calibration. Simultane-ous fit of background signal and LIF strength makesthis technique robust against both broadband interfer-ence and laser and signal attenuation. This evaluationtherefore yields temperature and semiquantitative NOconcentrations that then can be calibrated by addingknown amounts of NO to the fresh gases accordingto [20.153]. The broadband background that was re-cently attributed to CO2 LIF [20.179] is measured atthe same time yielding spatial distributions of CO2 LIFintensities [20.179, 286]. The temperature informationin turn can be used to calculate the local laser and sig-nal attenuation due to hot CO2 based on the data shownin Fig. 20.39 assuming a homogeneous concentration ofCO2 in the burned gases. These corrections have beenapplied for the measurement of quantitative NO con-centration distributions in the (unseeded) methane/airhigh-pressure flame.
PartC
20.4

Combustion Diagnostics 20.4 Application of Laser-Based Techniques 1279
����
�
��<6���<�����7
��<�H�0<#90"0;
�
�
�
�
�
�0""
;""
687
;"
"
6>7
!�"
"
6��7
��<
"
6�:!7
"
��<6���<�����7
"
��� ����� ����� !���� "����
��<�H�@90"0; ��<�H�!<#90"0# ��<�H�0<#90"0A ��<�H�!<#90"0A ��<�H�@90"0A
Fig. 20.42a–f Imaging results from a methane/air flame (φ = 0.95, without seeding). (a) Raw NO-LIF images (notcorrected for laser sheet inhomogeneities) (b) Raw off-resonant images (c) Absolute temperatures (d) Total attenuationdue to laser and signal absorption by CO2 and H2O (e) Quantitative NO mole fractions (calibrated by NO-addition)(f) Quantitative NO number densities (calibrated by NO-addition method)
Figure 20.42 shows raw NO-LIF images, cor-rections performed for quantification, and evaluatedNO concentrations. For maximum selectivity (i. e.,minimum O2 LIF interference), excitation was per-formed at 226.03 nm as discussed in the introductionsection (Fig. 20.42a). Remaining interference was as-sessed by tuning the laser off-resonance to 224.78 nm(Fig. 20.42b). The temperature-sensitivity of the LIF sig-nal was accounted for by using LIFSim. In many cases,temperature insensitivity is advantageous when con-ducting concentration imaging because of fluctuationof temperature within the view of the image. The tem-perature fields that were acquired using the multi-linetechnique are shown in Fig. 20.42c. A correction for col-lisional quenching was applied. Collisional quenching
scales linearly with pressure when the gas compositionis unchanged; however, due to the fact that gas compo-sition and collisional cross-section are all temperaturedependent, correction for this temperature effect is re-quired. Figure 20.42d shows the corrections applied forsignal and laser beam attenuation. Recent experimentshave shown that in high-pressure and high-temperaturecombustion environments, the UV transmission is re-duced by absorption from major species such as CO2 andH2O. The attenuation of both the laser beam and the LIFsignal due to CO2 and H2O require calibration and havebeen accounted for in the imaging processing stage. Thecorrected and calibrated NO concentrations are shownin Fig. 20.42e (mole fractions) and f (number densities).Recent measurements report the application of multi-
PartC
20.4

1280 Part C Specific Experimental Environments and Techniques
line NO-LIF thermometry also to sooting high-pressureflames and spray flames [20.276, 287–289].
Quantitative NO Diagnostics in Engines. Minimizingthe generation of the pollutant nitric oxide is of particularinterest when improving the environmental acceptanceof internal combustion engines. While the release ofmany unwanted exhaust compounds like unburned hy-drocarbons and carbon monoxide has been drasticallyreduced within the last years, additional effort is nec-essary to further reduce the NO release in order tomeet future legislative regulations. Especially in mod-ern lean-burning engines, inhomogeneous combustionconditions make it difficult to control the pollutant for-mation. Furthermore, standard catalytic converters cannot be used since the overall air–fuel ratio deviates sig-nificantly from unity. Exhaust gas recirculation (EGR)has been used successfully in diesel and in gasolineengines to reduce the raw NO formation mainly dueto decreased combustion temperatures. A detailed un-derstanding of the elementary physical and chemicalsteps involved as well as their coupling is necessaryto allow a mathematical description of the combus-tion process. Models with the ability of predictingoptimized operating conditions, however, need inputand feedback from preferably quantitative in-cylinderexperiments.
For in-cylinder NO imaging diagnostics we use NOexcitation in the A−X(0, 2) band with a tunable KrFexcimer laser at 247.94 nm and subsequent detectionof the fluorescence light emitted from the A−X(0, 1)transition around 237 nm. This technique allows theeffective suppression of interfering LIF signals due
���������������6�������4�!7
(��������� �������
"
!#;P�
;90"0# " 090"0A
" @90"0A " �90"0@
" #90"0@ " #90"0@
!AAP�
!@+P�
Fig. 20.43 Comparison of measured an simulated NO concentrationdistributions in an IC engine fueled with iso-octane/air [20.173]
to hot O2 and CO2 and partially burned hydrocar-bons [20.274, 291, 292]. Therefore, selective detectionof NO is possible even in inhomogeneous combustionenvironments like in direct injecting gasoline [20.275]and Diesel engines [20.293]. Furthermore, with thisscheme the influence of laser beam attenuation is mini-mized [20.261, 270] (Fig. 20.38).
Figure 20.43 shows experimental and numericalresults for the NO concentration distribution in a single-cylinder engine fueled with iso-octane air equipped witha production-type Volvo cylinder head [20.173, 294].Care is taken to provide a homogeneous air/fuel mixturein these cases. Figure 20.44 shows results of spatiallyaveraged NO concentration versus detection time incrank angle in a direct-injection engine with variableamounts of synthetic recirculated exhaust gases (vari-able mixtures and concentrations of N2, CO2, H2Oadded to the intake air) [20.275, 290]. The experi-ments presented here were carried out in an opticallyaccessible gasoline engine featuring a direct-injectioncylinder head (BMW) and a Bosch injection system.A significant reduction of peak NO concentrations from1200 ppm to 200 ppm with increasing EGR rate canbe observed. A significant influence on the composi-tion of the synthetic exhaust gas added to the freshin-cylinder gases was found that correlates well withthe heat capacity of the gas mixture [20.290]. Forcomparison with exhaust gas NOx concentrations, re-sults from the chemiluminescence (CLD) measurements
���������������6��70;""0;""
+""
0"""
0�""
"
����M���*���6P�37���A"#";"!"�"0"":0":�"
�""
;""
A""
��G%�0">���
0">����4��
0">����4���4��
0A>����4���4��
Fig. 20.44 Crank-angle-resolved spatially averaged NOconcentrations for the different EGR conditions (see leg-end) in the BMW engine with gasoline direct injection.CLD NOx concentration measurements are included in thegraph [20.290]
PartC
20.4

Combustion Diagnostics 20.4 Application of Laser-Based Techniques 1281
have been included in Fig. 20.44. It should be kept inmind that the LIF images represent the NO concen-tration present in the plane defined by the position ofthe laser beam whereas the exhaust gas measurementsrepresent averaged concentrations after homogeneouslymixing the burned gases during the expansion andexhaust stroke. The comparison shows a good agree-ment of exhaust-gas concentrations and concentrationsof the in-cylinder LIF measurements in the observedplane.
Soot DiagnosticsSoot formation has been a major issue in combustionresearch over the last few decades as soot is emittedby many practical combustion processes, e.g., powerplants and IC engines. Soot is the result of incompletecombustion of hydrocarbons if not enough oxygen is lo-cally available for full oxidation. Soot consists mainly ofcarbon but may have a wide range of properties and com-position [20.295]. Transmission electron microscopy(TEM) shows that flame-generated soot consists of pri-mary particles which have a typical size between 5 and100 nm. Primary particles form aggregates that containup to several hundred primary particles and have a fractalstructure.
Laser-induced incandescence (LII) has proven to bea powerful tool for soot diagnostics. It was observedfor the first time by Week and Duley in 1973 whenthey heated aerosols of carbon black and alumina witha CO2 laser [20.296]. They set up the first energy bal-ance describing the heating and cooling of particlesand suggested that the method could be used for par-ticle sizing. Eckbreth observed the incandescence as aninterference in Raman scattering experiments in soot-ing propane diffusion flames [20.297]. In 1984 Meltonset up the first detailed energy- and mass balance forLII and suggested to use LII as a tool for quantita-tive measurements of soot volume fractions [20.298].Since the early 1990s LII has been used successfullyin a variety of systems for measuring volume frac-tions of soot in laminar diffusion flames [20.299–303],laminar premixed flames [20.22, 304, 305], and tur-bulent flames [20.299, 306–308]. Particle sizes havebeen deduced from the temporal behavior of the LIIsignal taking the ratio of the LII signal at two differ-ent delay times after the signal peak [20.309, 310] aswell as using the entire decay curve in point meas-urements [20.311–315]. In exhaust gases particle sizeshave been measured with LII as well [20.316, 317].Particle sizes were obtained assuming monodisperseparticles [20.311,313,314] as well as considering a poly-
disperse lognormal particle-size distribution [20.312,315].
The LII signal is due to thermal radiation fromparticles that are heated by an intense pulse laser. Sub-sequent cooling occurs due to several heat loss channelsuntil, typically after a few hundreds of nanoseconds, theparticle temperature reaches ambient gas temperatureagain. LII is basically used for two applications: Deter-mination of the volume fraction of particles and particlesizing in the submicron region. Though LII has beenused to investigate non-carbon particles [20.318–320]with increasing interest in recent years with the upcom-ing nanosciences, the main focus has been in the field ofsoot diagnostics. In the following overview LII will bediscussed with respect to soot.
Soot volume fractions measured with LII are basedon the detection of the temporally integrated LII sig-nal over a certain range of wavelengths. This allows theexpansion of the laser beam into a sheet and the detec-tion of the signal light with a fast gated intensified CCDcamera equipped with appropriate detection filters. Inthis way two-dimensional images of the soot distribu-tion can be obtained, even in turbulent flames. As theemitted radiation of the laser-heated soot is close to thatof a black body, corrected by the emissivity, a widechoice of detection wavelengths is available. Experi-mental and theoretical studies have shown [20.321,322]that detection towards longer wavelengths minimizes theinfluence of a variation in particle size and ambient gastemperature. However, in most practical environmentsa detection in the blue around 400 nm is preferred to ob-tain a better discrimination of LII signal against flameluminosity.
A large impact on the accuracy is caused by thechoice of the temporal detection gate. First, after thelaser heating smaller particles cool faster than large onesbecause small particles have a larger surface-to-volumeratio than large particles. If long or even delayed (relativeto the laser pulse) detection gates are used the integratedsignal will underestimate small particles [20.299, 321].Second, with increasing pressure the LII signal decaysfaster due to an increased heat conduction with increas-ing pressure [20.323]. If calibration is carried out at onesingle pressure, long or delayed detection gates shouldbe avoided. Hence, short and prompt, i. e., with the startof the laser pulse, detection gates of 50 ns or less shouldbe used.
In LII, several excitation wavelengths have beenused, mainly the fundamental, 1064 nm, and secondharmonic, 532 nm, of pulsed Nd:YAG lasers. Lightat 532 nm is easier to handle as it is visible and
PartC
20.4
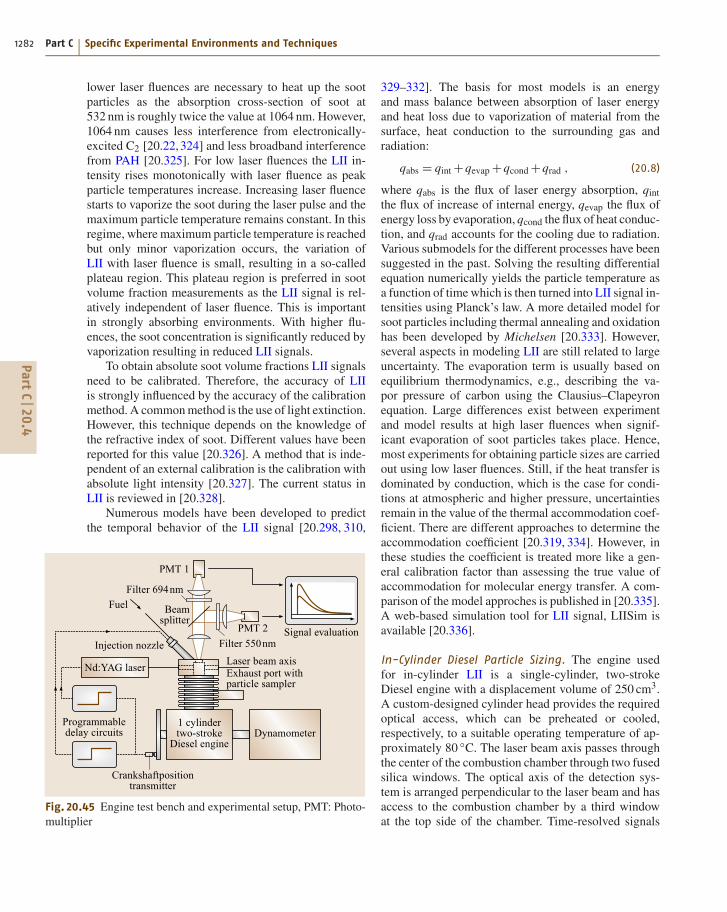
1282 Part C Specific Experimental Environments and Techniques
lower laser fluences are necessary to heat up the sootparticles as the absorption cross-section of soot at532 nm is roughly twice the value at 1064 nm. However,1064 nm causes less interference from electronically-excited C2 [20.22,324] and less broadband interferencefrom PAH [20.325]. For low laser fluences the LII in-tensity rises monotonically with laser fluence as peakparticle temperatures increase. Increasing laser fluencestarts to vaporize the soot during the laser pulse and themaximum particle temperature remains constant. In thisregime, where maximum particle temperature is reachedbut only minor vaporization occurs, the variation ofLII with laser fluence is small, resulting in a so-calledplateau region. This plateau region is preferred in sootvolume fraction measurements as the LII signal is rel-atively independent of laser fluence. This is importantin strongly absorbing environments. With higher flu-ences, the soot concentration is significantly reduced byvaporization resulting in reduced LII signals.
To obtain absolute soot volume fractions LII signalsneed to be calibrated. Therefore, the accuracy of LIIis strongly influenced by the accuracy of the calibrationmethod. A common method is the use of light extinction.However, this technique depends on the knowledge ofthe refractive index of soot. Different values have beenreported for this value [20.326]. A method that is inde-pendent of an external calibration is the calibration withabsolute light intensity [20.327]. The current status inLII is reviewed in [20.328].
Numerous models have been developed to predictthe temporal behavior of the LII signal [20.298, 310,
'(��0
&������A$;�
)����������
&���
.�F������� ��
'(���&������##"�
�*�����5�������
��������������G�����������-������������������
��DE3%������
'�*��������������������
0����������-����M�
���������*�����������
����M���������������������
Fig. 20.45 Engine test bench and experimental setup, PMT: Photo-multiplier
329–332]. The basis for most models is an energyand mass balance between absorption of laser energyand heat loss due to vaporization of material from thesurface, heat conduction to the surrounding gas andradiation:
qabs = qint +qevap +qcond +qrad , (20.8)
where qabs is the flux of laser energy absorption, qintthe flux of increase of internal energy, qevap the flux ofenergy loss by evaporation, qcond the flux of heat conduc-tion, and qrad accounts for the cooling due to radiation.Various submodels for the different processes have beensuggested in the past. Solving the resulting differentialequation numerically yields the particle temperature asa function of time which is then turned into LII signal in-tensities using Planck’s law. A more detailed model forsoot particles including thermal annealing and oxidationhas been developed by Michelsen [20.333]. However,several aspects in modeling LII are still related to largeuncertainty. The evaporation term is usually based onequilibrium thermodynamics, e.g., describing the va-por pressure of carbon using the Clausius–Clapeyronequation. Large differences exist between experimentand model results at high laser fluences when signif-icant evaporation of soot particles takes place. Hence,most experiments for obtaining particle sizes are carriedout using low laser fluences. Still, if the heat transfer isdominated by conduction, which is the case for condi-tions at atmospheric and higher pressure, uncertaintiesremain in the value of the thermal accommodation coef-ficient. There are different approaches to determine theaccommodation coefficient [20.319, 334]. However, inthese studies the coefficient is treated more like a gen-eral calibration factor than assessing the true value ofaccommodation for molecular energy transfer. A com-parison of the model approches is published in [20.335].A web-based simulation tool for LII signal, LIISim isavailable [20.336].
In-Cylinder Diesel Particle Sizing. The engine usedfor in-cylinder LII is a single-cylinder, two-strokeDiesel engine with a displacement volume of 250 cm3.A custom-designed cylinder head provides the requiredoptical access, which can be preheated or cooled,respectively, to a suitable operating temperature of ap-proximately 80 ◦C. The laser beam axis passes throughthe center of the combustion chamber through two fusedsilica windows. The optical axis of the detection sys-tem is arranged perpendicular to the laser beam and hasaccess to the combustion chamber by a third windowat the top side of the chamber. Time-resolved signals
PartC
20.4

Combustion Diagnostics 20.4 Application of Laser-Based Techniques 1283
were detected at 550 and 694 nm. The irradiated testvolume resulting from the present geometry is about0.6 cm3. The injection nozzle used is a Bosch com-mon rail system, also located in the cylinder head.The engine is motored by an electrical asynchronousmotor at a constant speed of 1500 min−1. For time-resolved LII (TiRe-LII) measurements, the engine wasfired for some individual cycles only. In this way, thewindows could be kept as clean as possible and thethermal load on the cylinder head was low. The Dieselengine was equipped with a pressure transducer anda supplementary crankshaft position transmitter. All ex-periments were performed at an injection crank angle of23◦ CA before TDC and an air/fuel equivalence ratio ofφ = 0.26. The particles were heated by an Nd:YAG laserat 1064 nm with a laser fluence of 0.10 J/cm2. Finally,a thermophoretic particle sampler was located in theexhaust gas manifold to get particle probes for furtheranalysis by transmission electron microscopy (TEM).The system is shown in Fig. 20.45.
In contrast to the laminar and well-defined condi-tions in the high-pressure burner the LII signals in theDiesel engine were taken in turbulent conditions withstrongly varying pressures and temperatures. A series ofnormalized particle emission signals during cooling ob-tained from single shot experiments at six different crankangles is shown in Fig. 20.46. Particle cooling stronglydepends on the engine crank angle and becomes longerwith increasing crank angle. The signals of Fig. 20.46and others were evaluated in terms of particle size byfitting lognormal distribution functions to the measuredcurves under the variation of the count mean diameter(CMD) and geometric standard deviation σg.
For the evaluation of the particle radiation signalsin terms of particle size, it is important to know the re-spective mean combustion chamber pressure pg and gastemperature Tg. For the present engine conditions, thepressure varied from nearly 80 bar at 0◦ CA to close to1 bar at 100◦ CA. Gas temperatures changed in this crankangle range from 2000 K to 1500 K, respectively. Thepressure was directly measured by a pressure transducerand the temperature was evaluated both from two-colorpyrometry without laser heating and by calculating anindividual combustion cycle. With these two parametersit was possible to evaluate the TiRe-LII signals shownin Fig. 20.46.
The results are shown in Fig. 20.47. CMD is in therange of 30 to 75 nm, increases up to a crank angle ofabout 10◦ CA and decreases again towards a value ofabout 30 nm at 100◦ CA after TDC. This behavior can beexplained by particle formation and subsequent particle
"
"
����6��7
����� �����*���0
"<�
"<;
"<A
"<+
!""0"" �""
"P��<����
0""P��<����
�"P��<����
;"P��<����
A"P��<����
+"P��<����
Fig. 20.46 Normalized TR LII signals at six crank angles
oxidation; σg is constant at a value of 1.1 up to a crankangle of 70◦ CA and then increases towards about 1.32.The two circled values of CMD and σg, which are shownat the right edge of the diagram, are results of the TEManalysis of the exhaust gas primary particles. The agree-ment between the TiRe-LII measured sizes at 100◦ CAafter TDC and the TEM determined primary particlesizes in the exhaust gas is quite good.
Additional Species and Techniquesfor In-Cylinder Measurements
Rayleigh scattering can be used as an alternative methodfor gas-phase measurements of the distribution of largemolecular species (i. e., hydrocarbon fuels) in the pres-ence of small molecular species (i. e., air). Rayleighscattering has been frequently used to measure gas den-sity (and hence temperature) in homogeneously mixed
""
����M���*���6P��<����7
�������������������6�7 %������������������5�����
�"
;"
A"
+"
0""
0
0<0
0<�
0<!
0<;
0<#
0""�" ;" A" +"
Fig. 20.47 CMD and σg evaluated from the signals inFig. 20.46
PartC
20.4

1284 Part C Specific Experimental Environments and Techniques
systems where the effective cross-section for elasticscattering does not vary spatially [20.337]. It has alsobeen used to measure relative temperature distributionsin the post-flame gases in engines with simplified ge-ometry [20.253]. Because of the linear dependenceof the Rayleigh signal on number density and laserintensity, the interpretation of the signal is straightfor-ward. As long as a single component dominates theeffective Rayleigh cross-section in a mixing system,Rayleigh scattering also allows the measurement ofspecies number densities. Hydrocarbons have a muchlarger cross-section for elastic scattering than air. There-fore, the overall scattering intensity can be used formeasuring the local fuel density. With this technique,fuel vapor density has been measured in internal en-gine combustion [20.338–341] and in the mixing fieldof atmospheric-pressure natural gas flames [20.142]. Inthe case of single-component substitute fuels effectsdue to preferential evaporation (i. e., spatial separa-tion of different fuel components that might havedifferent scattering cross-sections) are avoided. Thecross-sections for elastic scattering can be calculatedbased on data from [20.342–344] using dispersion rela-tions from [20.345, 346]. Fuel dominates the scatteringsignal in the case of n-decane in air by a factor ofσRay,fuel/σRay,air = 120. As long as no background scat-tering off surfaces and particles is present the totalsignal can be directly correlated with fuel numberdensities.
Rayleigh scattering, however, can be strongly in-fluenced by scattering of laser light off walls andparticles. It is therefore necessary to assess the back-ground level that comes from these additional processes.In environments with lots of scattering off surfaces orparticles (small enclosed housings, presence of fueldroplets, sooting environment) the standard techniquefails. Filtered Rayleigh scattering [20.347] has beendemonstrated under these conditions. Here, a narrow-band laser is used for excitation that overlaps witha narrow line filter. Only slightly frequency-shifted sig-nal (shifted by Doppler broadening due to the thermalvelocity of the scattering molecules) is detected.
Raman Scattering. Valuable information for most ma-jor species in engines can again be obtained fromspontaneous Raman scattering. Grünefeld et al. [20.249]performed spontaneous Raman imaging along a linewith noise levels of a few per cent in a single shot usingthe beam of a KrF excimer laser at 248 nm with spec-tral as well as spatial dispersion of the scattered lightaccomplished by mounting an intensified CCD (ICCD)
camera in the exit plane of a spectrograph. The largerscattering cross-sections in the ultraviolet allow imag-ing of the scattered light with smaller collection opticsand therefore, measurements in technically relevant de-vices such as engines and boilers. By taking advantageof the highly polarized Raman and Rayleigh scatteredlight in comparison with unwanted laser excited fluo-rescence and stray light from enclosure walls, they wereable to monitor major species in a iso-octane spray flameburner and a four-cylinder in-line engine by subtractingspectra taken with mutually perpendicular polarizationof the exciting laser beam.
CARS. The most accurate spatially-resolved tempera-ture measurements in engines can be performed withCARS as long as beam steering effects which severelydegrade the CARS signal generation process can be tol-erated. Therefore, precise cycle-resolved thermometryis possible in the compression stroke prior to igni-tion [20.117], in evaporating sprays [20.348] and inthe expansion stroke when the flame front has tra-versed through the focal volume of the beams [20.349].In any case the unstable resonator enhanced (USED)CARS phase-matching beam geometry [20.118] is pre-ferred in such measurements to minimize beam-steeringeffects.
20.4.5 Diagnostics for Stationary,Large-Scale Combustion Processes
Efficient control and optimization of large-scale in-dustrial combustion systems such as power plants,incinerators or heavy industries, is of considerable eco-logical and economical interest. In order to detect andcorrect deviations from the optimal process conditionsdetailed physical and chemical information – preferablyfrom within the main process volume – is needed to per-mit feedback to the process by fast active-control loops.This places high demands on sensors for the gaseousmajor species and trace species concentrations, gastemperature, gas residence time and other process pa-rameters. An efficient use of feedback loops for processcontrol also requires sensors with sufficient temporalresolution and close coupling of the sensor response tothe process of interest. Apart from sufficient sensitivity,selectivity and response times, a sensor for industrialprocess control applications must offer important addi-tional features like compactness, long sensor life time,good long-term stability, reliable and simple calibration,ease of use, and finally low cost of ownership with re-spect to the possible savings in the process [20.10,350].
PartC
20.4

Combustion Diagnostics 20.4 Application of Laser-Based Techniques 1285
In power plants and other stationary industrialcombustion processes most parameters and especiallygas-species concentrations are predominantly measuredwith extractive sensors. These are based on a multitudeof different detection principles ranging from spectrallybroadband optical sensors like nondispersive infrared(NDIR) photometers, fluorometric NO detectors, orFourier transform infrared (FTIR)-based spectrometersto non-optical principles like paramagnetic or ion-conductive O2 analyzers, metal-oxide-semiconductorsand expensive multispecies gas chromatographs or massspectrometers [20.351]. Common to these devices is thatthey always require extraction of a gas sample, which istypically done well behind the main reaction zone viaa single access point in the flue gas duct. Prior to anal-ysis the gas sample is filtered to remove particulates,usually cooled well below room temperature to removewater, avoid condensation and protect the sensor fromthe hot gas, and than transported to the main analyzervia a sampling tube that is sometimes up to 100 m long.This sampling process significantly affects the useful-ness of the species signal for process control and createsnumerous difficulties that can range from slow temporalresponse, systematic errors due to effects like adsorp-tion, condensation, chemical reaction and fractionationduring the sampling process and reduced representa-tiveness due to the local sampling. Furthermore, manyof this sensors often suffer – especially in the case ofcomplicated gas mixtures – from a lack of specificity,caused for instance by the low spectral resolution of theoptical filters used in some of these instruments. Ex-tractive sensors in general and NDIR in particular alsohave a rather high cost of ownership due to the require-ment for frequent cleaning of the sampling lines androutine calibrations with reference gases. Finally, due tothe heterogeneity in the extractive sensor principles andthe risk of fractionation during the sampling process itis in most cases impossible to perform a stringent com-parison of, e.g., multiple species concentrations withhigh temporal resolution, which would be most interest-ing for monitoring and optimization of the combustionchemistry.
Avoidance of these problems requires a single, ratheruniversally applicable, non-intrusive in-situ measure-ment technique for species concentrations, temperaturesand flow parameters, which provides sufficient selec-tivity, resolution and speed, which completely avoidsprobe sampling and the need for costly calibration proce-dures and which is capable of simultaneously measuringnearly unrestricted combinations of process parameterswithin the same detection volume. Furthermore, in order
to facilitate a widespread industrial use, the measure-ment technique should be rather independent of the type,size, and specific process conditions (temperature, pres-sure, particulate load of the gas) and, e.g., be applicableto a direct measurement even within large combustionchambers, with lateral dimensions in the order of tens ofmeters.
High-Resolution Laser-AbsorptionSpectroscopy
High-resolution laser absorption spectroscopy (LAS)[20.6, 352] is probably the only analytical techniquethat provides a simultaneous solution to most if notall of the above mentioned requirements. In absorp-tion spectroscopy (AS), one of the oldest techniquesof non-intrusive investigation of gaseous media, radi-ation directed straight through the measurement zonetowards a radiation detector is being absorbed and thisloss is monitored and analyzed for its dependence onwavelength.
AS is extremely versatile as every species of in-terest will show internal degrees of freedom whichmay be optically excited via the absorption process.Atomic species (and homonuclear molecules) maybe de-tected via electronic transitions in the ultraviolet (UV)and visible (VIS) spectral range, whereas heteronuclearmolecules offer several important additional detectionpathways via radiative excitation
1. of rotational levels in the far-infrared spectral range(FIR, λ = 0–100 µm)
2. of vibrational and rotational sublevels in the mid IR(MIR, λ = 10–3 µm) and
3. via vibrational overtone and combination bands inthe near IR (NIR, λ = 1–3 µm) [20.353–356].
This is a significant advantage to diagnostic tech-niques based on light emission like fluorescence,phosphorescence or chemiluminescence, which cannotbe applied to every analyte as radiative transitions areprerequisite for those techniques [20.357]. Addition-ally, emission techniques often suffer from problemslike radiative quenching, predissociation and other non-radiative de-excitation mechanisms. Thus, even thoughemission-based sensors are quite simple, inexpensiveand robust, extensive pressure-, species- and device-dependent calibration information is needed in order todeliver absolute process data. Especially the low spectralresolution of chemiluminescence techniques providesonly limited specificity, making it difficult to separatethe signal from fluctuating background radiation.
PartC
20.4

1286 Part C Specific Experimental Environments and Techniques
0�#�O'��������*�
����
��N����
%����
G�������
,�5����*��0"� 00""� 0J 0"J 0""J
��������������������������
���������������
���������������
����������������
��������
����������
����������������
���� ��D �������
K1����������L
G�!#/ %���/
3�0"/��!/D��&! ��!/�E3% �!/�E�.&;
������&.2 ��!&?���?�����?�<<
0<�#�O0�<#�O 0<�#�O "<0�#�O 0�<#�O
&������������������6&G�7
&� 3�& 8�&1��� ��3�/
����� �������� ���3��� �����)������ ��5����
Fig. 20.48 Wavelength range of various available laser light sources
Further unique properties of AS that are important tocombustion diagnostics are the possibility to determineabsolute absorber densities and temperatures withoutthe need for calibration and the linear sensitivity scalingwith absorption path length. The line-of-sight charac-ter of AS may be, to a certain extend, a disadvantagecompared to laser-induced emission-based techniques,because it prevents spatially resolved measurements incomplicated geometries. But on one hand this restric-tion can be lifted for many cases using tomographictechniques [20.358, 359]. On the other hand this path-averaging effect, as it permits much more representativeresults than extractive or point-sampling techniques,proves to be very important for the surveillance of thevery large measurement volumes frequently found instationary combustion processes, reaching up to 20 m indiameter [20.10, 350, 357, 360].
Laser Sources for Absorption SpectroscopyThe analytical potential of AS could be significantlyenhanced through its combination with laser excitation.The high spectral resolution of a laser light source maxi-
mizes the chemical selectivity especially in complex gasmixtures. Its high spectral power density minimizes oreven completely removes the influence of detector noise,one of the major limits when working with broadbandlight sources, thereby significantly enhancing the spec-trometer sensitivity. Furthermore, it is the high spectralpower density that is an enabling laser feature for non-intrusive diagnostics in strongly luminescent processes,as it often permits one to neglect the influence of thestrong thermal emission that occurs in many combustionprocesses.
Additionally, by taking advantage of the good laserbeam quality it is possible to drastically reduce the sizeof the optical access ports to the process, and even moreimportant, to considerably increase the maximum ab-sorption path lengths, thereby permitting a significantincrease in the sensitivity. Using laser sources in com-bination with simple single-path setups typical in-situabsorption path lengths in the order 1–5 m [20.361,362]are used in combustion applications, but up to 20 m havebeen demonstrated in large industrial combustion pro-cesses [20.363, 364]. If even longer path lengths are
PartC
20.4

Combustion Diagnostics 20.4 Application of Laser-Based Techniques 1287
needed, e.g., for the detection of minor species concen-trations, and provided that optical disturbances such aslight scattering by particles, are not too strong, it is pos-sible to apply special, ruggedized multipass optics of theHerriott [20.365,366] or White type [20.367,368] to foldthe beam path. Using that approach, path lengths in theorder of 100 m and beyond have been achieved and usedfor gas-phase analysis in multiphase flows, e.g., to studythe dynamics of ice cloud formation [20.369, 370]. Thesame technique is also advantageous if the measurementregion has to be spatially confined. Such an approachwas realized for the investigation of fire-suppression sys-tems to study the gas-phase composition within watersprays [20.371].
When comparing laser sources for absorption spec-troscopy rapid and, if possible, continuous tunabilityof the laser wavelength [20.10, 372] is one of the keyfeatures for combustion diagnostics. Rapid wavelength-tuning capabilities of many laser sources endow LASwith high temporal resolution and simultaneously permita high degree of robustness against optical disturbances.On the other hand continuous wavelength tuning al-lows the recovery of entire absorption line shapes.This provides not only enhanced signal stability viasuppression of spurious baseline effects, but moreimportantly the possibility of using line-shape analy-sis to access all the parameters that affect line area,shape and position (e.g., gas pressure, temperature,velocity, electric and magnetic fields etc. [20.6]) ex-perimentally. Additionally, and most importantly forindustrial applications, complete coverage of the absorp-tion profile allows a calibration-free determination of theabsolute absorber concentration by extraction of the in-tegrated line strength according to the Lambert–Beerlaw [20.352, 361, 362, 364, 371].
Laser Selection and Spectral Coverage. Another keyfeature for laser selection is spectral coverage [20.10].In general, the impressive versatility of LAS is basedupon the very large spectral coverage provided by mod-ern laser technology, spanning nearly seamlessly fromthe UV-VIS (e.g., via excimer, dye and solid-statelasers), over the mid infrared (e.g., CO2 and CO gaslasers) [20.372, 373] to the far-infrared and THz region(via masers, quantum-cascade diode lasers) [20.374–376] (Fig. 20.48).
Nevertheless, it must be kept in mind that most in-dividual laser types are limited to a relatively narrowspectral range and that many of them feature only dis-continuous or even no tuning capabilities at all. thushaving only rather specialized applications.
Typical examples are MIR gas lasers like theCO2 and the infrared HeNe laser (λ ≈ 10.6 µm resp.3.39 µm). Both are based on quite mature and thus ro-bust technologies, but their applicability for gas sensingrelies on accidental coincidences with strong absorptionlines. As the single emission line of the IR-HeNe co-incidences nicely with the very strong C−H stretch ofthe ro-vibrational transitions of most hydrocarbons it isquite frequently used for CH4 monitoring [20.377,378].Combined with special IR-transmitting fibers, robust,fast, and sensitive absorption sensors with up to 2 kHztime resolution have been demonstrated and for instanceused to study local mixing effects in CH4 combus-tion [20.379].
The CO2 laser is substantially more flexible owingto its high output power (> 1 W) and the multitude ofdiscretely accessible lines. This enabled the realizationof important sensing applications of hydrocarbons, am-monia and other species [20.380–382] and led to one ofthe first commercialized industrial in-situ species sen-sors for closed-loop control applications in large powerplants: a laser in-situ ammonia sensor [20.383, 384]used for optimization of NOx removal via the selec-tive catalytic reduction (SCR) or selective non-catalyticreduction (SNCR) process [20.358, 385].
Despite these successful applications, only very fewlaser principles feature the possibility to cover a sub-stantial part of the UV–VIS–IR spectral range witha single lasing mechanism, which is advantageous asthe development efforts and cost are substantially lowerwhen new species and hence new laser wavelengthsmust be incorporated. The two most important membersof this laser class are semiconductor diode lasers andsolid-state lasers, which provide this special propertyespecially in combination with nonlinear crystal-basedwavelength-mixing techniques like optical parametricgeneration (OPG), as well as second-harmonic, sum-frequency, and difference-frequency generation (SHG,SFG and DFG) [20.386].
However, practical combustion applications imposesevere restrictions on the laser choice simultane-ously requiring advantageous technical properties likeroom-temperature operation, long device life time, com-pactness, high electrical efficiency, and low cost, to namea few. As many of these laser systems are still in a de-velopmental stage they have to mature significantly tobe routinely applicable to the harsh boundary conditionsoften found in stationary combustion systems. As a con-sequence, the use of nonlinear laser-light generationtechniques seems currently, despite turbulent develop-ments, due to complexity, robustness, cost and space
PartC
20.4

1288 Part C Specific Experimental Environments and Techniques
restrictions limited to the mid-term future, which leavesthe diode laser as the premier choice with regard togeneral applicability.
The continuously tunable diode laser (TDL) is oneof the most powerful laser sources for combustion diag-nostics. Developed in the 1960s, soon after the first laserdemonstration by Maiman [20.4], TDLs in the mid IRquickly became an important working horse in analyti-cal basic research because they combined the three mostimportant properties for analytical problems.
• Excellent selectivity due to their very high spectralresolution (10−3 –10−4 cm−1)• Very good sensitivity,– due to the access to the strong absorption lines
in the molecular fingerprint region in the midinfrared, in combination with their
– rapid, versatile and continuous wavelength-tuning properties. Latter permitting the de-velopment of advanced noise-reduction tech-niques [20.387], which provide significantsensitivity enhancement; in some cases even upto the shot-noise limit, the ultimate limit forabsorption techniques [20.388].• Excellent flexibility, due to their near-complete cov-
erage of the MIR (λ = 4–20 µm).
The versatility of MIR-TDL is widely documented inliterature [20.389, 390] and first experiments deploying
"<#
0":�
,�5����*���6J7
��������������6��7��������������0":;���
0"!
0":0
0""
0"0
0"�
;0 0<# � �<# ! !<#
��
���
���
���
�����
�����)�
����.
��! ���
��
��;����
��� ���
��
������
�&
���
�&
��;
��
���
Fig. 20.49 Selection of detectable species and achievable sensitivi-ties using NIR diode lasers. Vibrational overtone transitions of somespecies are connected with dashed lines. Sensitivities in ppm at onemeter absorption path length are calculated assuming a detectablefractional absorption ∆I/I0 of 10−4 OD
their advantageous spectroscopic properties date backas far as in the 1970s, when a CO detection was first re-alized for environmental applications [20.391] and thenquickly transferred to combustion problems [20.392–394]. However, despite significant long-term develop-ment efforts the major drawback of these so-calledlead salt or IV–VI lasers [20.395] remained theirneed for cryogenic cooling to liquid-nitrogen or evenliquid-helium temperatures, which severely hinderedthe widespread transfer into industrial combustion di-agnostics. Nevertheless, MIR-TDLs are still frequentlyapplied and of significant importance for basic [20.396]and combustion research [20.397].
The availability of room-temperature operated nearinfrared diode lasers (NIR-DL) in the AlGaAs andInGaAs material system (λ = 780–1550 nm) withrelatively high optical output power (3–200 mW) signif-icantly changed this situation, especially for diagnosticsin large stationary combustors, because NIR-DL, whichwere initially developed and mass-produced for datastorage and fiber-based data transmission, for the firsttime combined wide spectral coverage with superiorspectroscopic and technical specifications. As a conse-quence, the NIR spectral range became quite interestingfor absorption-based combustion diagnostics, first, totake advantage of the NIR-DLs high spectral quality,simple operation and low costs, and second, partiallybecause the lower absorption coefficients of molecularovertone and combination bands in the NIR (Fig. 20.49)could be compensated by the longer absorption pathcommonly available in stationary combustion systems.
In recent years the wavelength coverage and thus theversatility of TDLAS has improved even further. As datastorage capacities of optical discs improved, the avail-able wavelength band for room temperature DL wasfirst extended to the red (λ > 630 nm) and meanwhileeven to the blue and near UV (450–350 nm) [20.398],with a small gap remaining in the 460–620 nm range.Simultaneously, the increased interest in industrial sens-ing applications in combination with a strong growth ofthe demand for security applications for military coun-termeasures and public safety provided the driving forcefor the development of promising new diode lasers in theshort wave IR, the mid IR and even the far-infrared (FIR)or Terahertz (THz) spectral ranges. The short wave IRat 1.8–2.8 µm, which is important for combustion di-agnostics, as this range is a good compromise betweenstronger absorption lines without too severe interferencefrom hot water or CO2, could be very recently accessedwith relatively mature room-temperature devices, thatare based on the InSb material system [20.362,399,400].
PartC
20.4
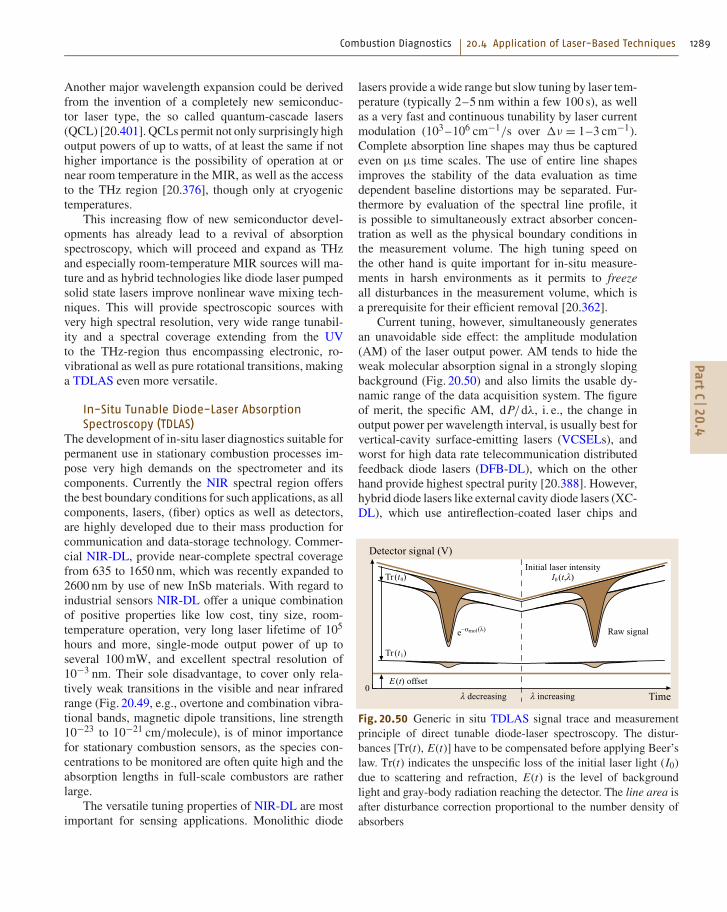
Combustion Diagnostics 20.4 Application of Laser-Based Techniques 1289
Another major wavelength expansion could be derivedfrom the invention of a completely new semiconduc-tor laser type, the so called quantum-cascade lasers(QCL) [20.401]. QCLs permit not only surprisingly highoutput powers of up to watts, of at least the same if nothigher importance is the possibility of operation at ornear room temperature in the MIR, as well as the accessto the THz region [20.376], though only at cryogenictemperatures.
This increasing flow of new semiconductor devel-opments has already lead to a revival of absorptionspectroscopy, which will proceed and expand as THzand especially room-temperature MIR sources will ma-ture and as hybrid technologies like diode laser pumpedsolid state lasers improve nonlinear wave mixing tech-niques. This will provide spectroscopic sources withvery high spectral resolution, very wide range tunabil-ity and a spectral coverage extending from the UVto the THz-region thus encompassing electronic, ro-vibrational as well as pure rotational transitions, makinga TDLAS even more versatile.
In-Situ Tunable Diode-Laser AbsorptionSpectroscopy (TDLAS)
The development of in-situ laser diagnostics suitable forpermanent use in stationary combustion processes im-pose very high demands on the spectrometer and itscomponents. Currently the NIR spectral region offersthe best boundary conditions for such applications, as allcomponents, lasers, (fiber) optics as well as detectors,are highly developed due to their mass production forcommunication and data-storage technology. Commer-cial NIR-DL, provide near-complete spectral coveragefrom 635 to 1650 nm, which was recently expanded to2600 nm by use of new InSb materials. With regard toindustrial sensors NIR-DL offer a unique combinationof positive properties like low cost, tiny size, room-temperature operation, very long laser lifetime of 105
hours and more, single-mode output power of up toseveral 100 mW, and excellent spectral resolution of10−3 nm. Their sole disadvantage, to cover only rela-tively weak transitions in the visible and near infraredrange (Fig. 20.49, e.g., overtone and combination vibra-tional bands, magnetic dipole transitions, line strength10−23 to 10−21 cm/molecule), is of minor importancefor stationary combustion sensors, as the species con-centrations to be monitored are often quite high and theabsorption lengths in full-scale combustors are ratherlarge.
The versatile tuning properties of NIR-DL are mostimportant for sensing applications. Monolithic diode
lasers provide a wide range but slow tuning by laser tem-perature (typically 2–5 nm within a few 100 s), as wellas a very fast and continuous tunability by laser currentmodulation (103 –106 cm−1/s over ∆ν = 1–3 cm−1).Complete absorption line shapes may thus be capturedeven on µs time scales. The use of entire line shapesimproves the stability of the data evaluation as timedependent baseline distortions may be separated. Fur-thermore by evaluation of the spectral line profile, itis possible to simultaneously extract absorber concen-tration as well as the physical boundary conditions inthe measurement volume. The high tuning speed onthe other hand is quite important for in-situ measure-ments in harsh environments as it permits to freezeall disturbances in the measurement volume, which isa prerequisite for their efficient removal [20.362].
Current tuning, however, simultaneously generatesan unavoidable side effect: the amplitude modulation(AM) of the laser output power. AM tends to hide theweak molecular absorption signal in a strongly slopingbackground (Fig. 20.50) and also limits the usable dy-namic range of the data acquisition system. The figureof merit, the specific AM, dP/dλ, i. e., the change inoutput power per wavelength interval, is usually best forvertical-cavity surface-emitting lasers (VCSELs), andworst for high data rate telecommunication distributedfeedback diode lasers (DFB-DL), which on the otherhand provide highest spectral purity [20.388]. However,hybrid diode lasers like external cavity diode lasers (XC-DL), which use antireflection-coated laser chips and
"�����������*
����������*����6O7
�����������* ��� 6�7������
��6�"7
�� 6�07
�:�� 6�7
.�����������������������" 6�?�7
��-���*���
Fig. 20.50 Generic in situ TDLAS signal trace and measurementprinciple of direct tunable diode-laser spectroscopy. The distur-bances [Tr(t), E(t)] have to be compensated before applying Beer’slaw. Tr(t) indicates the unspecific loss of the initial laser light (I0)due to scattering and refraction, E(t) is the level of backgroundlight and gray-body radiation reaching the detector. The line area isafter disturbance correction proportional to the number density ofabsorbers
PartC
20.4
1290 Part C Specific Experimental Environments and Techniques
externally mechanically tuned optics to select the laserwavelength, may be used to avoid AM [20.402]. More-over, XC-DL access the complete gain profile of thesemiconductor thus providing the widest tuning ranges(20 nm in the red, up to 200 nm in the NIR) [20.403].However, increased cost, size, and susceptibility to me-chanical instability, and reduced tuning speed, severelyhinders their use in combustion applications.
The basic setup of an absorption spectrometer isquite simple: the beam of a diode laser is collimated,directed through the measurement volume, collected bya spherical mirror and projected onto a photo detector.As the laser wavelength is continuously scanned overthe absorption line, the photodetector signal is amplified,filtered, digitized by an analog-to-digital (AD) converter,transferred to a computer, and evaluated for narrow bandlosses by a curve fitting algorithm, which, after removalof the AM and other disturbances, usually extracts thearea of the absorption line by applying the Lambert–Beerlaw, here written for homogeneous conditions along thebeam path:
I(λ) = I0(λ) exp [−S(T )g(λ−λ0)NL] .
The Lambert–Beer law relates the detected inten-sity I(λ) to the initial intensity I0(λ) (describing thecurrent- and thus wavelength-dependent AM) and themolecular absorption signal of a well-resolved indi-vidual absorption line. The latter is described by thetemperature-dependent line strength S(T ) of this line,the number density N of absorbers, the absorptionpath length L , and an area normalized (= 1) functiong(λ−λ0), describing only the shape of the absorptionline, which is centered at wavelength λ0. Using thisnormalization, this equation can be solved to yield theabsolute absorber density N ,
N = 1
S(T )L
∫ln
(I0(λ)
I(λ)
)dλ → X = N
kBT
p
or the absorber concentration X by applying the idealgas law and the measured temperature T and totalpressure p.
It is important to note, that this equation does notcontain any calibration parameters and that S(T ) isa molecular parameter, which is independent of thespectrometer configuration. Thus the absolute absorberdensity N , respectively the absolute absorber concentra-tion X, can be directly inferred from the measured linearea without any calibration. Only L , T and S(T ), andthe total pressure p, must be known/measured. Further-more, given a spectrally well-isolated absorption line,
the line profile integration yields that N is indepen-dent of the line shape, i. e., all line-broadening effectsand the total pressure. This property to avoid any cal-ibration as well as pressure-broadening effects, is veryadvantageous for in-situ measurements in combustiondevices or processes with variable pressure or tempera-ture, and is hardly achievable with other measurementprinciples, thus giving absorption spectroscopy a ratherunique position.
However, in order to take advantage these proper-ties, it has to be kept in mind, that the normalizationof the line area only holds in wavelength space. Hence,the absorption signal has to be transferred from timespace to wavelength space by taking care of the dy-namic tuning behavior, dλ/dt, of the diode laser. Forvery slow, quasistatic current tuning the conversion fac-tor is just a constant. But, for higher tuning speeds,which are needed for fast measurements or, as we willsee, under harsh boundary conditions in combustors,the tuning becomes highly nonlinear, which results inasymmetrically distorted line shapes in time space. Theline fitting process thus requires that dλ/dt is deter-mined experimentally and taken into account. This isfrequently realized using solid or air-spaced etalons asrelative frequency markers [20.402]. As the system-atic errors in N or X are dominated by errors in S(T )and dλ/dt, it is most important to determine dλ/dt atleast with the accuracy of S(T ). The use of compact,solid etalons, within the instrument, may therefore, de-spite their robustness, generate too large uncertainties,due to refractive index errors, temperature effects, andreduced resolution. More precise are large air spacedetalons, whose frequency markers depend to a verylarge extend on the spatial separation of the etalonmirrors only.
In-situ laser absorption spectroscopy in combus-tion environments requires not only the considerationof the spectroscopic effects of temperature or pressurevariations on the molecular signal. Furthermore, greatcare has to be taken to correct the detector signal forvarious strong disturbances that are often unavoidableunder combustion conditions [20.362, 363, 404]; mostimportant are strong fluctuations of the overall transmis-sion Tr(t) of the measurement path, which are causedby broadband absorption and scattering by particles,or beam steering due to refractive-index fluctuations.Additionally, there is frequently an intense thermalbackground radiation E(t) from the combustion zoneor radiating particles that increases the detector sig-nals. Both effects may be changing rapidly in time andhave to be included in an extended version of Beer’s
PartC
20.4

Combustion Diagnostics 20.4 Application of Laser-Based Techniques 1291
law:
I(λ) = I0(λ)Tr(t) exp [−S(T )g(λ−λ0)NL]+ E(t)
An exaggerated sketch of a typical in-situ TDLASsignal trace is shown in Fig. 20.50, indicating theadditive emission and the multiplicative transmissionterm.
The relative signal-to-disturbance ratio depicted inFig. 20.50 is however far from reality, as NIR absorp-tion signals only rarely yield more than 5% absorption,while the transmission losses, e.g., in large coal com-bustors [20.363] or dense water sprays in fire researchcan [20.371,405] exceed 99.99%, and the thermal back-ground in coal plants may become 10 times stronger thanthe transmitted laser light. As the disturbances are oftenorders of magnitudes larger than the molecular absorp-tion signals, they may bury the net signal completely.Effective disturbance suppression, compensation and re-moval strategies are thus essential in order to extractthe narrow-band absorption and compute the desiredcombustion parameters.
The basic idea to effectively separate and correctthe molecular absorption for the transmission and emis-sion effects takes advantage of two important features ofdiode lasers: their fast wavelength tunability and – takingadvantage of a mistake – their simultaneous current-induced output power modulation. By tuning the lasermuch faster than the transmission and emission fluc-tuations, both disturbances are effectively frozen, thuscan be assumed to be constant during the wavelengthscan and corrected by subtracting the offsets and di-viding the offset-corrected scan through the baselinefunction [20.362]. The AM thus serves as a transmis-sion sensor, while the emission term can be isolatedfrom the DC coupled detector signal by quickly switch-ing off the laser at the beginning of each scan. Hence, itis still possible to avoid calibrations and extract absoluteabsorber densities directly from the DC coupled detec-tor signal by exploiting the extended Lambert–Beer law,provided that Tr(t) and E(t) can be extracted from theunprocessed detector signal. Additionally rapid phase-locked averaging of the wavelength scans, equivalent tousing a comb filter at the modulation frequency and itsovertones, may be used for further noise reduction andimprovement of the detection limits [20.362, 406].
The described experimental concept, to directlycapture and evaluate the DC coupled detector sig-nal, including all offsets and disturbances, is termeddirect absorption spectroscopy (DAS). Though thesimplest approach to LAS, it was proved that DASis capable of routinely achieving fractional optical
resolutions, ∆I/I0, of 10−3 –5 × 10⁻⁵ in the in-situ sig-nal, depending on the complexity of the disturbancesand the measurement environment [20.362, 364, 407,408]. Other more-complicated double-modulation tech-niques such as wavelength modulation spectroscopy(WMS) [20.387, 406, 409–414] or frequency modula-tion spectroscopy (FMS) [20.397,415,416] or dual-pathapproaches such as balanced detection [20.388,417] arereported to provide one to two orders higher resolution,with ∆I/I0 better than 10−5 –10−6 being reported un-der well-controlled laboratory conditions or in extractivemeasurements. Application of these techniques to in-situmeasurements in combustion scenarios, however, con-siderably increases their technical complexity and cost,which limits their widespread use. Especially the treat-ment of pressure and temperature dependent line shapeeffects, as well as the removal of transmission fluctua-tions is not straightforward with these techniques, so thatsensor calibration if often required and most of the res-olution advantage is lost due to incomplete disturbancecorrection.
In comparison, DAS has a under certain circum-stances reduced sensitivity, but it also provides severalhighly important features, i. e., a relatively simple androbust setup, rapid response, and particularly the pos-sibility to perform a calibration-free measurement ofabsolute gas concentrations while simultaneously avoid-ing line broadening effects. Hence, DAS offers a goodcompromise between sensitivity and complexity, andtherefore is of great value for in-situ combustion diag-nostics in technical processes.
Application of In Situ TDLASTDLAS has been extensively used over the last decadesfor combustion diagnostics [20.10, 350, 357, 360]. Itsversatility can be nicely demonstrated by the longlist of accessible process parameters using NIR-TDLs.Most important and most frequently employed is thedetection of species concentrations, which has beenrealized for many light molecules (via their molecu-lar overtone and combination bands (Fig. 20.49), andeven many atomic species [20.418, 419], (e.g., mostalkali [20.402] and earth alkali atoms) via their elec-tronic transitions. Nearly as important to combustiondiagnostics is the measurement of gas temperatures,which may be determined either via two-line thermom-etry [20.364] from the line strength ratio of a suitableline pair or from Doppler broadening [20.420]. Colli-sional broadening of the line shape has been used forpressure measurements [20.420]. Even the flow speedof the absorber may be extracted using tracer meth-
PartC
20.4

1292 Part C Specific Experimental Environments and Techniques
ods [20.402, 421] or from the Doppler shift of theline profile and combined with the species concentra-tion to derive mass flux or thrust [20.420, 422]. Theresidence time distribution of the product gases in a re-actor [20.402] is another important parameter whichin high-temperature flows could only be measured byradioactive tracer methods. Using diode lasers that pa-rameter could be inferred by seeding the flow witha tracer molecule [20.402, 421] and detecting the re-lease of the tracer. Continuous seeding has been used ina pulsed flow [20.421,423], as well as pulsed seeding ina continuous flow [20.402].
Multi-Parameter Spectrometers. One particularstrength of laser absorption spectroscopy is the possi-bility for multi-parameter sensors with near arbitrarycombinations of measurement parameters [20.10, 350,357]. By optically superimposing the required numberof different laser beams, usually one per measurementparameter, a multicolor laser beam is formed and usedto enable simultaneous multi-parameter detection in thesame detection volume via a single pair of optical ac-cess ports. Beam superposition can be realized by freespace optics [20.364], or particularly elegant and robustby fiber-multiplexing several diode lasers into a single-mode glass fiber [20.424–427], taking advantage ofthe high-quality fiber-optical components developed fortelecommunication. Depending on the spectral separa-tion of the lasers needed for the individual parametersdifferent wavelength multiplexing schemes maybe used:
• Spectral wavelength multiplexing may be used forwell-separated wavelength channels. In this casethe absorption signals are acquired by simulta-neously scanning all lasers and dispersing themulti-wavelength beam after passage of the ab-sorption path onto multiple detectors by use ofa grating [20.424–427] or dichroic beam split-ters [20.361, 364].• Alternatively, for insufficient spectral separation,multi-parameter measurements may be realized bytemporal wavelength multiplexing [20.408, 428],taking advantage of the rapid amplitude modula-tion possible with diode lasers. Time multiplexingmeans sequentially scanning each individual laserof a laser array and detecting the transmitted lightwith a single detector.• Finally there is the possibility of modulation fre-quency multiplexing [20.410], which has only bedemonstrated in combination with double modu-lation techniques like WMS. Here all lasers are
operated simultaneously, but at different modulationfrequencies. The light of all the lasers is directedonto a single detector and the respective compo-nents are separated by narrow-band electrical filters,e.g., lock-in amplifiers.
Due to the scan range limitations of monolithiclasers multiple-parameter detection has mostly beenperformed with a combination of several indi-vidual diode lasers. However, with the persistent,telecommunication-driven progress in external-cavitydiode lasers [20.403,429] and multi-section distributed-feedback (DFB) and distributed-Bragg-reflector (DBR)lasers [20.428, 430] laser systems continuously scan-ning up to 100 nm have become available, which willsimplify the design of time-multiplexed multi-parameterspectrometers significantly.
Laboratory-Scale Combustion Control Applications.For large stationary combustion systems such as powerplants, incinerators and heavy industries, a tight moni-toring and control of combustion is of great importanceto achieve a high fuel efficiency and reduced pollu-tant emission. The development of adequate sensors andfast active control loops suffered for a long time fromthe complex boundary conditions found in full-scalecombustors. Thus the first successful TDLAS-basedclosed-loop combustion control experiments have beenrealized in well-controlled laboratory environments us-ing small atmospheric burners with a few cm absorptionpath [20.424, 431]. This first setup consisted of twofiber-coupled wavelength-multiplexed DFB-DLs, whichwere rapidly scanned (1 kHz) across two water absorp-tion lines in the 1.3 µm overtone band to measure waterconcentration (from peak height) and gas temperature(from peak ratio) 6 mm above the burner surface with2 ms time resolution. This permitted a closed-loop tem-perature control from 900 to 2400 K by adjusting thefuel flow with a proportionally acting voltage-controlledsolenoid valve thereby achieving a temperature devia-tion of only 1% (1σ) between 1800 and 2100 K. Thenext H2O/temperature sensor generation [20.432] (with∆l = 10 cm) used an adaptive controller and acousticforcing to optimize within 100 ms the performance ofan atmospheric 5 kW non-premixed, C2H4–air, annu-lar dump combustor (ADC) through improved fuel–airmixing achieved by adjusting amplitude and relativephase between air and fuel flow forcing. System scale-up ended with a 50 kW pulsed ADC waste incinerator,where CO emissions dropped from 2500 ppm to be-low 200 ppm by active optimization of the relative
PartC
20.4

Combustion Diagnostics 20.4 Application of Laser-Based Techniques 1293
phase between primary and secondary air flow basedon temperature measurements with 100 µs resolution ina 18 cm-wide flue gas duct [20.433]. Recently TDLAScontrol was also applied to modern propulsion sys-tems, so-called pulse detonation engines (PDE). PDEs,essentially narrow, few cm-inner-diameter steel tubes,generate thrust by discontinuously igniting premixedgas. To optimize fuel consumption, maximize specificimpulse and reduce temporal propulsion fluctuationsit is important to avoid overfilling of the PDE andto adapt the ignition timing to the changing bound-ary conditions in the PDE (i. e. temperature, residualgas). Using fixed-wavelength DFB-DLs and standardlock-in detection C2H4 mixture fraction and temperature(for T = 300–900 K) was determined (after calibration)from the peak height/peak ratio of the C2H4 Q-branchmultiplet at 1.62 µm [20.434]. Then, a simple closed-loop on–off controller adapted the fuel loading andignition timing. This reduced the shot-to-shot thrustfluctuations significantly, clearly demonstrating the ad-vantages of TDL-based control.
TDLAS Applicationto Stationary Combustion Systems
Sensor scale-up from rather short absorption paths inthe order of 10 cm and laboratory-like conditions intoindustrial combustion environments (i. e. power plantswith combustion chambers up to 100 times larger) haslong been hampered by the large, quite variable andonly rarely characterized disturbances present in largestationary combustors. Careful characterization of theoptical and optomechanical properties of the in-situabsorption paths in these combustors has increasedthe knowledge about these problems in a way thatrobust and highly efficient correction and data eval-uation algorithms for direct absorption spectroscopycould be developed, which can cope with the extremedisturbances levels, and extract weak molecular absorp-tion signals despite severe light losses of more than99.99% and background radiation signals, which may bemore than a 10-fold stronger than the transmitted laserlight [20.352, 361, 362, 364, 371]. The development ofthese procedures extended the working range of in-situabsorption spectroscopy drastically, so that despite themoderate laser output powers of 1–100 mW it becamepossible to detect and quantify specific absorptions onthe order of a few percent with an optical resolution of10−3 –10−4 and with a temporal resolution of 0.1–30 s.
Another key development which proved indis-pensable for the realization of industry grade in-situspectrometers, was the design of a new computer-
controlled optomechanical setup, which, in spite ofstrong disturbances caused by the in-situ path, is ableto ensure permanent optical access to the measure-ment volume by automatically controlling, optimizing,and stabilizing the optical alignment of the spectrom-eter. Combined with various techniques to suppressthe in-situ disturbances, this optomechanical setupcould compensate for strong temperature-induced de-formations of the combustion chambers, which beforeprevented continuous measurements during large com-bustor load changes [20.364]. Further, in cases ofextremely poor visibility, this system could also be usedto perform an automatic, computer-controlled initialalignment of the in-situ spectrometer [20.363].
All these critical developments are about to changethe situation, and to permit the scale-up of TDLAS sen-sors to full-size combustion processes thus opening upnew possibilities to optimize stationary combustion pro-cess. As a result of this progress NIR-DL-based in-situTDLAS has been recently applied to an increasing rangeof industrial combustion processes (including grate-firedwaste incinerators [20.361], rotary kilns [20.362], box-fired power plants [20.363] and even high-pressure coalcombustion [20.408]) and an extensive variety of fueltypes (encompassing coal, natural gas, biomass, house-hold and special waste) thus impressively demonstratingthe versatility and flexibility achievable by TDLAS.In order to give further insight in the potential ofNIR-TDLAS for applications in stationary combus-tion processes, selected example applications will bedescribed in further detail below, which indicate thatNIRDL-based absorption sensors are now most promis-ing for real-world applications, ranging from mobile andseverely space-restricted sensors to fast, non-intrusive,in-situ species and temperature sensors working inhigh-temperature and high-pressure environments likefull-scale power plants.
Waste Incinerators. The incineration of house hold aswell as special waste is in many developed countriesthe most strictly regulated combustion process, whichin combination with the high variability of the calorificvalue and water content of the waste creates a strongneed for active combustion control to adapt the wastefeed, the waste mixing or the amount of air/oxygen sup-plied to the process. To monitor the process conditions,enable process optimization via feedback control andensure a highly efficient and environmentally safe wasteincineration numerous optical techniques have beencombined in an advanced combustion control system(CCS) and were applied to an industrial 20 MWth waste
PartC
20.4
1294 Part C Specific Experimental Environments and Techniques
incinerator with a 4 m-diameter combustion chamber,depicted in Fig. 20.51.
Efficient NO reduction according to the SNCR pro-cess required the injection of precise amounts of NH3,which could be effectively monitored by the very firstin-situ laser absorption sensor (LISA) based on a 13CO2laser and differential absorption spectroscopy [20.383].In addition, the primary air injection, grate movementand fuel input are under closed-loop control througha scanning IR camera (TACCOS) [20.435] measuringthe waste-bed temperature. Finally in order to controlthe secondary air injection actively a fast NIR-DL-basedin-situ sensor for the simultaneous in-situ detection ofO2 and H2O directly in the combustion chamber wassuccessfully developed and tested [20.361].
Strong disturbances caused by the in-situ path suchas transmission fluctuations and thermal background
.���������������
�. 3
��������D�Q���
���������D���.�
����������
3�����F�����
&���*��
&���
%���������
'���������
����������
��
0
#
�!
;
Fig. 20.51 Intersection through a 20 MW incinerator for householdwaste in which the in situ detection of O2 and H2O has beenperformed. A selection of important sensors (in situ diode-lasersensor, in situ laser ammonia sensor, LISA, and IR-scanner-camera,TACCOS) as well as the possible actors that are connected to thecombustion control system (CCS) are indicated (further informationin [20.361, 383, 435])
emission, which interfere with the molecular absorptionsignal had to be suppressed. The laser signals, whichprovided a linear response with a sensitivity of about0.3 vol. % and a temporal resolution of 1 s were veri-fied by extractive reference O2 and H2O sensors, whichprobed the cold flue gas duct. As the laser spectrom-eter completely avoided gas transport the laser signalswere up to 60 s faster than the extractive reference sig-nals, which is of major importance for the combustioncontrol loop. A follow-up version of this sensor couldbe further improved by fiber-coupling of the laser andby the development of an inexpensive, compact and ro-bust, purely analog data evaluation [20.436], with thepotential for low-cost production. In the meantime evenfully fiber-coupled TDLAS spectrometers [20.437] havebeen demonstrated, which enable the important expan-sion of TDLAS to highly space-restricted applicationslike internal combustion engines or high-pressure gasturbines.
Gas-Fired Power Plants. Owing to their short turn-ontime large, gas-fired power plants are frequently used tocompensate for demand fluctuations in the power distri-bution network. But on rare occasions ignition delaysin the sequentially ignited multi-burner system, pre-sumably due to excessive humidity levels inside thecombustion chamber, are not detected because of a lackof suitable rapid response security sensors for CH4. Inthese cases disastrous explosions causing damage of$10 to 100 million dollar have been experienced, eventhough UV flame sensors and extractive CH4 detectorshave been installed. In the future, such accidents canbe avoided with the help of the first laser spectrome-ter [20.364] for the simultaneous in-situ measurement ofthe gas temperature and all majority species (CH4, H2O,O2, CO2) in large stationary combustors which has beendeveloped recently (Fig. 20.52). Employing two DFB-DL at 760 nm and 1.65 µm to detect O2, CH4 and CO2and a Fabry–Pérot DL at 812 nm to extract absoluteH2O concentrations it is now possible to determine rep-resentative, spatially integrated species concentrationsfrom within the main combustion chamber. The tem-perature signal that is needed to extract absolute speciesconcentrations, which was not available before, is simul-taneously derived from the line strength ratios within thegroup of rotational transitions of H2O near 0.81 µm viatwo-line thermometry. These transitions have the advan-tage of coinciding with high-output-power diode lasers(≈ 35 mW), which increase the spectrometers toleranceto the substantial light losses often found in the largetechnical combustors.
PartC
20.4
Combustion Diagnostics 20.4 Application of Laser-Based Techniques 1295
'�� �����
��� ��; ��
������
)�����;<�
)�����;<!
)�����;<0
)�����;<;
0�<+@
0" #
!<$!
��������
' �
)����������
&�����
������������
���
��;
��
Further, to allow permanent measurements duringstart-up conditions it was necessary to compensate forstrong temperature-induced wall deformations, whichwas accomplished with a new active laser beam
Fig. 20.52 Experimental setup of the spectrally multi-plexed multi-parameter in situ diode-laser spectrometerused for the detection of CH4, H2O, O2, CO2 and gas tem-perature in the combustion chamber of a 1000 MW gas-firedpower plant. Only the four of the 20 burners located in theplane of measurement are indicated. The optical setup con-taining lasers, optics, and detectors has been enlarged forclarity [20.364]
alignment control loop. Using this multi-parameter spec-trometer it was possible to analyze the full start-upand power-down procedure of a 1000 MW gas-firedpower plant with 20 50 MW burners and a 10 m furnacediameter and achieve to a time resolution of 1.6 s anda minimum detectable absorption better than 10−3 OD.This resulted in a CH4 detectivity of about 100 ppmVand a dynamic range of more than two orders of mag-nitude, as well as a relative temperature resolution of±10 K and a total temperature range of 300–1300 K.The ability to monitor H2O as the possible cause, aswell as CH4 as the consequence of an ignition delayoffers new possibilities to ensure a safe ignition proce-dure of large-scale multi-burner gas-fired combustionsystems. The device also demonstrates the excellentexpandability of multiplexed in-situ diode laser spec-trometers and is of high interest to investigate the fuelto air ratio as well as the local chemistry in combustionprocesses.
Coal-Fired Power Plants. CO, another important com-bustion species is one of the key control parameters forcombustion processes and one of the major pollutants offossil-fuel combustion. Furthermore it is closely linkedto reducing conditions in the combustor, which are re-sponsible for high-temperature corrosion effects as wellas fouling and slagging of the combustor containment.CO in-situ sensors are therefore of high interest and in-tensively studied. In the near-infrared range CO may bedetected via two overtone transitions, the 2ν and 3ν vi-brational bands at 2.3 and 1.5 µm. The 2.3 µm band haslong been inaccessible due to the lack of suitable lasers,while the 1.5 µm band directly coincides with the wave-length range of telecommunication lasers. Using thehigh optical power (over 20 mW) of the 1.5 µm telecomlasers, the long absorption paths available in full-sizepower plants and combining it with highly efficient androbust algorithms for the suppression of in-situ distur-bances it was recently shown for the first time that COcan be detected even in the very large combustion cham-ber (20 m diameter) of a 700 MWth lignite-fired powerplant. [20.363]. This offers new diagnostic opportunities
PartC
20.4

1296 Part C Specific Experimental Environments and Techniques
to investigate the slagging and fouling process in powerplants and their dependence on the composition of thecombustion gases. In addition by spectrally multiplex-ing the 1.5 µm CO laser with a 35 mW 813 nm FP-DLit was possible to access a H2O overtone transition,which permitted a simultaneous in-situ measurementof H2O and gas temperature. A major problem whichhad to be solved was the compensation of beam steeringand severe optical losses (Fig. 20.53) of 99.9–99.999%by dust. This zero-visibility condition also requireda method to permit the initial spectrometer alignment,which was ensured by an automatic feedback-controlledbeam alignment based on motorized bending mirrorsand a special phase-locked extraction algorithm to sep-arate the weak laser light from the strong backgroundradiation.
Rotary Kiln Combustors. Batch-fired rotary kilns(Fig. 20.54), used for the combustion of special wastes,are known to generate rapid and strong intermittentCO peaks, which have to be kept below a safety limit,thereby restricting the total waste throughput and theplant efficiency. Advanced control concepts to reduce
""
�����������690":!7
����������4�����6O:070<A
"<;"<+0<�
!"<# 0 0<# � �<#
"<+90":!
""
����6�7
�����������*������6O7"<+
�;� ; A + 0" 0� 0; 0A 0+ �" ��
G"
"<�
"<;
"<A
Fig. 20.53 Illustration of the transmission disturbances found in thecombustion chamber of a 700 MW coal-fired power plant. Top: DCcoupled in situ detector signal over a high number of wavelengthscans (each sharp spike corresponds to an up and a down scan).The amplitude modulation of the signal is modified by strong trans-mission losses along the absorption path. In addition, the detectorsignal is increased by thermal background emission E. Bottom: dis-tribution of transmission levels found over a longer time period,indicating an average in situ transmission of the measurement path(vertical line) of 8 × 10⁻⁴ [20.363]
the CO peaks and improve the throughput demanda very fast CO detection, preferentially directly throughthe rotary kiln. This could be realized for the firsttime [20.404] using a modified version of the 1.5 µmCO spectrometer described above. [20.363]. However,first measurements using standard personal computer(PC)-based data-acquisition (DAQ) cards showed thatthe strong, rapid and burst-like transmission fluctuationslead to saturation and clipping in the detector signaland systematic errors in the measured CO concentra-tion. A new high-speed data-acquisition system basedon a fast digital signal processor (DSP) removed theseproblems by enabling – at modulation frequencies ofup to 3 kHz – a real-time evaluation of the individ-ual, unaveraged absorption scans on a ms time scale,so that distorted scans could be rejected. Furthermorethe DSP ensured a much higher data throughput closeto 100% and allowed the transmission information ofeach scan to be used to realize an automatic real-time
'����������������
+<;������M���
��������F�����
'���)������
,����4-��4*����
%��?���N����?����������������
(����������
0# 0""":0!""P�
������3
+"":0�""P�
&���*��
��*
������)
+<A
Fig. 20.54 Simplified cross section of the THERESA plant(Thermische Entsorgung spezieller Abfälle) [20.362], a ro-tary kiln fired incinerator for special waste. A secondaryhigh-temperature combustion section [the post-combustionchamber (PCC)] is attached to the kiln exit. TDLAS wasused in the process to realize a simultaneous CO/O2
detection through the kiln (path A, Fig. 20.55), and atthe kiln exit (path B, Fig. 20.56), as well as simultane-ous O2/H2O/Temperature in the PCC. Multi-section gasresidence-time measurements using binary alkali tracerswere realized in the same process by injecting the tracernext to the main burner in the kiln and detecting the tracerat the exit of the kiln (path B, Fig. 20.57) and the exit of thePCC (path C, Fig. 20.57)
PartC
20.4

Combustion Diagnostics 20.4 Application of Laser-Based Techniques 1297
gain adaptation of the detector amplifiers, which signif-icantly improved the usable dynamic range of the ADconverter.
A comparison of both systems revealed that therelative systematic errors, that could be removed com-pletely by the DSP system, can be larger then 1000%under special conditions in the case of a 8 m-long rotarykiln with 3 MWth thermal power. Further enhancementof the DSP-based spectrometer was realized by spec-trally multiplexing the 1.5 µm and 760 nm diode laserto access the R23-CO and the R23R23 O2 transitionfor the first simultaneous CO/O2 detection within a ro-tary kiln [20.404]. A 1.9 s response time yielded anoptical resolution of 3–7 × 10⁻⁴ and detection limits of450 ppm CO resp. 2000 ppm O2, which was sufficientto experimentally reveal the close anti-correlation of theintermittent CO and O2 peaks (Fig. 20.55).
However, the approach of using the 3ν CO tran-sitions is not feasible in smaller combustors or atlow-ppm CO concentrations often found in moderncombustion systems. To address this sensor deficiencynew 2.3 µm distributed-feedback diode lasers (DFB-DL) that access the R30 line in the CO-2ν-band havebeen employed recently to develop a fast and highlysensitive in-situ CO absorption spectrometer suitablefor hazardous waste incinerators [20.362, 404]. Addi-tionally spectrally multiplexing the 2.3 µm DL witha 760 nm DFB-DL accessing the R17Q18/R19R19 O2lines again enabled a simultaneous in-situ detectionof CO and O2, which is most interesting for con-trol strategies requiring the coverage of a wide rangeof fuel/air ratios. These new spectrometers were suc-cessfully tested over periods of up to two weeks ina 3.5 MWth special waste incinerator. The absorptionpath (l = 2.5 m) was located at the rotary kiln exitin the lower part of the post combustion chamberwith temperatures of 800–1000 ◦C (Fig. 20.54). Directabsorption spectroscopy using the DSP-based data eval-uation enabled calibration-free species detection. With1 s data-acquisition time a fractional absorption resolu-tion (1σ) of 1.2 × 10⁻⁴ for CO (6 × 10⁻⁵ for O2) could beachieved corresponding to significantly improved detec-tion limits of 6.5 ppm CO (250 ppm O2) [20.362]. Thissensitivity and time resolution was high enough to de-tect even under lean-fuel conditions and with a relativelyshort absorption path small quasiperiodic stoichiometrychanges of ±15 ppm CO caused by the periodic fuelfeed of the rotary kiln (Fig. 20.56), thus nicely demon-strating the great potential of this device to establishan active combustion control system to optimize wastethroughput in special waste incinerators.
0;D#""<;
����6�D��7
���������������65�<�>7
"<A#
"<;#
"<#
"<##
"<A
���������������65�<�>7"
�����������6>7
"
#
0
�
!
;
0;D#;0;D#0 0;D#� 0;D#!
��D����0<@� ��D����!"��6��F�������5���*�7 ��D����#�
"<A
"<�
"<;
Fig. 20.55 Temporal evolution of the CO and O2 concentration(lower and middle traces with symbols) and the broadband trans-mission (top trace) within the THERESA rotary kiln (Fig. 20.55)measured with 1.56 and 760 nm DFB-DL. While all signals varysynchronously with the waste feed cycle of 30 s, O2 and CO areclearly anti-correlated, as expected from combustion chemistry. Forcomparison the flat lower line corresponds to a simulated signal foran extractive CO sensor [20.404]
High-Pressure Coal Combustion. The danger of se-vere corrosion damage in the high-temperature gasturbines needed for future high-efficiency pressurizedcoal combustion generates an immediate demand foroptical in-situ diagnostic tools that are compatible withhigh-temperature high-pressure conditions. In particu-lar alkali halide compounds have to be detected, butare spectroscopically difficult to access. ELIF [20.438–440], excimer-laser-induced fragmentation fluorescenceis one of very few non-intrusive techniques capable ofdirect monitoring of alkali compounds in an industrialenvironment. Here an excimer laser photodissociatesgaseous alkali compounds within the flue gas duct andgenerates electronically excited alkali atoms [Na(32P),K(42P)], which are then readily detected by their flu-orescence in the visible region via a fiber-coupled twospecies detection system [20.438]. The measured signalsare converted to absolute concentrations by a calibra-tion of the complete detection apparatus under knownthermodynamic conditions. A detection limit of 0.2 ppbcould be established for both alkalis at 10 bar totalpressure and 800 ◦C gas temperature.
As an alternative to the experimentally demanding,costly and calibration dependent, direct detection of
PartC
20.4

1298 Part C Specific Experimental Environments and Techniques
"+D0"��
A"
����6�D��7
���������������6��5�<7
0�"
@"
+"
$"
0""
00"
"+D0;��"+D0��� "<"�
3��������6����4� 7
"<";
!<;��35���*�0"��(-��*��5���*�
"<"�# "<"! "<"!#&��N������6� 7
Fig. 20.56 Left panel: high-speed detection of fast, periodic CO fluctuations with ±17 ppm amplitude (±10 ppm for10 s average) measured with 2.3 µm DFB-DL at the rotary kiln exit of the THERESA plant (Fig. 20.54). A fast Fouriertransform (FFT) of the fluctuations over a 2 h period (right panel) shows a single prominent peak, with the same frequencyas the feeding cycle of the incinerator [20.362]
the alkali compounds a diode-laser-based high-pressurecompatible in-situ absorption spectrometer to monitorthe alkali atoms (Li, K, Rb, Cs), which are producedby thermal dissociation of the compounds, was de-veloped and tested in the flue gas duct of a 1 MWthcoal combustor at temperatures of 1400 K and pressuresup to 15 bar [20.408]. In spite of severely broadenedabsorption lines, transmission fluctuations, and strongbackground emission it was shown for the first time ina practical combustion system that a fast and highly sen-sitive in-situ detection of alkali atoms is possible viatheir D-lines in the 670–850 nm spectral range. Cru-cial to the realization of these spectrometers was the use
������������F������6��D�7
8���������6���4!7
�90"0;
#90"0!
090"0;
0<#90"0;
�����������6���4!7
""D""
#90"0;
�90"0#
0<#90"0#
090"0#
"0D""""D!"
�� 8.�F�����+!A�
and detailed characterization of widely tunable vertical-cavity surface-emitting lasers (VCSEL). Despite the lowVCSEL output power of only a few 100 µW it was possi-ble to realize the first VCSEL-based in-situ detection ofalkali-metal atoms in a technical combustor and achievedetection limits of 1.4 pptm potassium. This demon-strates the applicability of TDLAS to high-pressurein-situ gas analysis and the possibility of low-cost ab-sorption sensors for the surveillance of hot gas filtersneeded for the protection of flue gas turbines in futurecoal-fired combined-cycle power plants.
Gas Residence-Time Measurements. Up to now theresidence time distribution of the product gases inhigh-temperature production processes could only be
Fig. 20.57 Simultaneous residence-time distribution meas-urements in different plant segments of the THERESArotary kiln (Fig. 20.54) using a binary tracer made froma mixture of K and Rb salts; the tracer mixture was injectedat t = 0 over a period of 836 ms at the head of the rotarykiln (Fig. 20.54). The two species were measured at two lo-cations within the plant: Rb atoms at the exit of the rotarykiln – 8.5 m from the injection site (left peak at t = 9 s);K atoms at the end of the PCC – 8.6 m downstream of thefirst measurement location (peak to the right at t = 15 s).Since K is part of the fuel its signal has – in contrast to Rb– an offset even without a tracer injection. Concentrationdistribution functions are fitted to the two traces [20.402]
PartC
20.4

Combustion Diagnostics 20.5 Conclusions 1299
measured by the use of radioactive tracers. In additionto the complicated regulations that have to be fulfilledfor the manipulation of radioactive substances, theiruse inevitably causes a contamination of the plant andtherefore hinders a frequent inspection of this impor-tant process parameter. Using the fast-response in-situspectrometers for alkali atoms [20.408] it was possibleto develop a new and promising alternative techniquefor the in-situ measurement of gas residence time distri-butions in high-temperature processes (patent pending),which uses cheap and harmless alkali compounds astemperature stable tracer species. These compounds canbe effectively monitored via the alkali atoms producedby thermal dissociation near the detection volume af-ter the compounds pass through the process volume.During the first successful demonstration of this tech-nique [20.402] in a 3 MWth rotary kiln followed bya high-temperature post-combustion chamber (PCC;Fig. 20.54) it could be shown that an injection of only100 mg of the tracer compound near the kiln entrance
was sufficient in such a large process to effectivelydetermine the residence time distribution. This highefficiency results from the extremely high detectivityof the laser in-situ absorption spectrometer of 80 ppqpotassium (ppq = 1 in 1015) or 4 × 10¹¹ K atoms/m3 at1200 K [20.402]. Using binary K/Rb tracer mixtures anda multispecies spectrometer detecting the atoms at dif-ferent locations in the plant it was possible to realizethe simultaneous characterization of the transport prop-erties of two consecutive plant segments (Fig. 20.57)located 8.4 m/17.0 m from the tracer discharge locationand determine the mean residence times to (15±1) sand (26±1) s, which met the expected values. With thisnew technique it is feasible for the first time to real-ize a permanent online measurement and verification ofthe residence time distribution of a combustion process,which is particularly important for the optimization ofchemical reactors and processes such as waste inciner-ators with statutory limits for the residence time of thecombustion products.
20.5 Conclusions
Despite intensive research for alternative energy sourcesfurther economic growth will be closely linked to anextensive use of combustion processes for mobility, en-ergy conversion, and generation of industrial processheat. The drastic increase of combustion fuel consump-tion has, however, now reached a level where the annualworldwide demand corresponds to amounts of fossil fuelthat has been accumulated during a period of 1 millionyears of the Earth’s history. The limited supply of fos-sil fuels and the detrimental environmental effects ofthe global use of combustion require pollutant emissionto be minimized and total energy conversion efficiencyand process performance to be optimized. Demandsare similarly important for industrial combustion-basedproduction processes, which are indispensable for high-volume products such as steel, glass, cement, and whichrequire simultaneous optimization of combustion pa-rameters, product quality, and product costs.
After four decades of research and development inthe area of laser-based concepts for combustion di-agnostics, many of the spectroscopic methods havematured now from qualitative to quantitative tech-niques. Its capabilities go far beyond the observation oftwo-dimensional distribution of signal intensities. Theinstantaneous simultaneous measurement of concentra-tion distribution of several scalars (species concentration
and temperature) gives insight in correlation of species,i. e., in turbulent combustion processes. The spatial com-bination of several observed planes on the other handallows a visualization of three-dimensional concentra-tion distributions and yields a unique view into turbulentnonreactive and reactive flow systems. The calculationof absolute (three-dimensional) species concentrationgradients and scalar dissipation rates is of majorimportance for combustion modeling. Finally, multiple-time-step imaging yields movie-like insight into fastprocesses and therefore allows for the first time theinvestigation of highly dynamic processes in real time.
The interpretation of measured signal intensitiesin practical combustion situations is not trivial. Highpressure, high temperature and a variety of sources ofinterfering signal and attenuation of laser and signallight hinders the selective and quantitative measure-ment. The spectroscopic properties of the species understudy, therefore, must be well examined. We pre-sented the required studies in high-pressure laminarflames for the example of nitric oxide. This informa-tion enables quantitative measurements even in harshenvironments such as in-cylinder gasoline and Dieselengine measurements with direct injection. Advancedlaser-based imaging diagnostics turns out to be an im-portant tool for the development and optimization of
PartC
20.5

1300 Part C Specific Experimental Environments and Techniques
modern combustion devices that can fulfill the future re-quirements in terms of energy efficiency and pollutantminimization.
Laser diagnostics techniques similar to those dis-cussed here are also used to study diverse applicationsbeyond combustion, including atmospheric chemistry,
plasma chemistry, and chemical vapor deposition andmaterial synthesis. Even biological applications of so-phisticated laser techniques are now being pursued insome combustion diagnostics groups since the couplingof elementary chemical reactions with various transportprocesses is also the basis of living systems.
References
20.1 G.R. Kirchhoff, R.W. Bunsen: Chemische Analysedurch Spectralbeobachtungen, Poggend. Annal.110, 161–176 (1860), in German
20.2 A. Einstein: Zur Quantentheorie der Strahlung,Phys. Z. 18, 21–128 (1917), in German
20.3 J.P. Gordon, H.H. Zeiger, C.H. Townes: The maser –new type of microwave amplifier, frequency stan-dard and spectrometer, Phys. Rev. 99, 1264–1274(1955)
20.4 T.H. Maiman: Stimulated optical radiation in ruby,Nature 187, 493–494 (1960)
20.5 A.G. Gaydon: The Spectroscopy of Flames (ChapmanHall, London 1967)
20.6 W. Demtröder: Laserspektroskopie. Grundlagenund Techniken, 3rd edn. (Springer, Berlin, Heidel-berg 2000), in German
20.7 A.C. Eckbreth: Laser Diagnostics for CombustionTemperature and Species, 2nd edn. (Gordon andBreach, Amsterdam 1996)
20.8 K. Kohse-Höinghaus, J.B. Jeffries (Eds.): AppliedCombustion Diagnostics (Taylor Francis, New York2002)
20.9 J. Warnatz, U. Maas, R.W. Dibble: Combustion, 3rdedn. (Springer, Berlin, Heidelberg 2001)
20.10 J. Wolfrum: Lasers in combustion: From basic the-ory to practical devices, Proc. Combust. Inst. 27,1–42 (1998)
20.11 C. Schulz, V. Sick: Tracer-LIF diagnostics: Quanti-tative measurement of fuel concentration, tem-perature and air/fuel ratio in practical combustionsituations, Prog. Energy Combust Sci. 31, 75–121(2005)
20.12 H. Zhao, N. Ladommatos: Optical diagnostics forin-cylinder mixture formation measurements in ICengines, Prog. Energy Combust. Sci. 24, 297–336(1998)
20.13 T. Etzkorn, J. Fitzer, S. Muris, J. Wolfrum: Determi-nation of absolute methyl- and hydroxyl-radicalconcentrations in a low pressure methane-oxygenflame, Chem. Phys. Lett. 208, 307–310 (1993)
20.14 D.F. Davidson, A.Y. Chang, M.D. DiRosa, R.K. Han-son: A CW laser absorption diagnostic for methylradicals, J. Quant. Spectrosc. Radiat. Transfer 49,559–571 (1993)
20.15 P. Zalicki, R.N. Zare: Cavity ring-down spectroscopyfor quantitative absorption measurements, J.Chem. Phys. 102, 2708 (1995)
20.16 W.K. Bischel, B.E. Perry, D.R. Crosley: Detection offluorescence from O and N atoms induced by two-photon absorption, Appl. Opt. 21, 1419–1429 (1982)
20.17 R.S. Barlow, C.D. Carter, R.W. Pitz: Multi-scalardiagnostics in turbulent flames. In: Applied Com-bustion Diagnostics, ed. by K. Kohse-Höinghaus,J.B. Jeffries (Taylor Francis, London 2003)
20.18 K. Müller-Dethlefs, M. Pealat, J.-P.E. Taran:Temperature and hydrogen concentration meas-urements by CARS in an ethylene-air bunsen flame,Ber. Bunsenges. Phys. Chem. 85, 803–807 (1981)
20.19 A. Dreizler, T. Dreier, J. Wolfrum: Thermal gratingeffects in infrared degenerate four-wave mixingfor trace gas detection, Chem. Phys. Lett. 233, 525–532 (1995)
20.20 A.A. Suvernev, A. Dreizler, T. Dreier, J. Wol-frum: Polarization-spectroscopic measurementand spectral simulation of OH (A2Σ-X2Π) and NH(A3Π-X3Σ) transitions, Appl. Phys. B 61, 421–427(1995)
20.21 R.W. Pitz, J.A. Wehrmeyer, J.M. Bowling, T.S. Cheng:Single pulse vibrational Raman scattering by abroadband KrFexcimer laser in a hydrogen/airflame, Appl. Opt. 29, 2325–2332 (1990)
20.22 R.L. Vander Wal: Laser-induced incandescence:Development and characterization towards a mea-surement of soot-volume fraction, Appl. Phys. B59, 445–452 (1994)
20.23 A. Dreizler, J. Janicka: Diagnostic challenges forgas turbine combustor model validation. In:Applied Combustion Diagnostics, ed. by K. Kohse-Höinghaus, J.B. Jeffries (Taylor Francis, New York2002)
20.24 M.D. Smooke: Reduced Kinetic Mechanismsand Asymptotic Approximations for Methane-AirFlames, Lecture Notes in Physics (Springer, Berlin,Heidelberg 1991)
20.25 N. Peters, F.A. Williams: The asymptotic structureof stoichiometric methane-air flames, Combust.Flame 68, 185–207 (1987)
20.26 U. Maas, S.B. Pope: Simplifying chemical kinetics:intrinsic low-dimensional manifolds in composi-tion space, Combust. Flame 88, 239–264 (1992)
20.27 J.B. Jeffries, G.P. Smith, D.E. Heard, D.R. Crosley:Comparing LIF measurements and computer mod-els of low pressure flame chemistry, Ber. Bunsen-ges. Phys. Chem. 96, 1410–1418 (1992)
PartC
20
Combustion Diagnostics References 1301
20.28 U. Meier, U. Kienle, I. Plath, K. Kohse-Höinghaus:Two-dimensional laser-induced fluorescence ap-proaches for the accurate determination of radicalconcentrations and temperature in combus-tion, Ber. Bunsenges. Phys. Chem. 96, 1401–1410(1992)
20.29 K. Fieweger, R. Blumenthal, G. Adomeit: Shock-tube investigations on the self-ignition ofhydrocarbon-air mixtures at high pressures, Proc.Combust. Inst. 25, 1579–1585 (1994)
20.30 R. Minetti, M. Carlier, M. Ribaucour, E. Therssen,L.R. Sochet: A rapid compression machine in-vestigation of oxidation and auto-ignition ofn-heptane: measurements and modelling, Com-bust. Flame 102, 298–309 (1995)
20.31 G.P. Smith: Diagnostics for detailed kinetic mod-eling. In: Applied Combustion Diagnostics, ed. byK. Kohse-Höinghaus, J.B. Jeffries (Taylor Francis,New York 2002) pp. 501–517
20.32 K.N.C. Bray: The challenge of turbulent combus-tion, Proc. Combust. Inst. 26, 1–26 (1996)
20.33 W.P. Jones, B.E. Launder: The prediction oflaminarization with a two-equation model of tur-bulence, Int. J. Heat Mass Transfer 15, 301–314 (1972)
20.34 J. Janicka, A. Sadiki: Large eddy simulation of tur-bulent combustion systems, Proc. Combust. Inst.30, 537–548 (2005)
20.35 C. Schneider, A. Dreizler, J. Janicka: Fluid dynamicalanalysis of atmospheric reacting and isothermalswirling flows, Flow Turbul. Combust. 74, 103–127(2005)
20.36 G.H. Wang, N.T. Clemens, P.L. Varghese: High-repetition-rate measurements of temperature andthermal dissipation in nonpremixed turbulent jetflames, Proc. Combust. Inst. 30, 691–700 (2005)
20.37 D. Geyer, A. Kempf, A. Dreizler, J. Janicka:Scalar dissipation rates in isothermal and reac-tive turbulent opposed-jets: 1D-Raman/Rayleighexperiments supported by LES, Proc. Combust. Inst.30, 681–689 (2005)
20.38 C.S. Barlow, A.N. Karpetis: Scalar length scalesand spatial averaging effects in turbulent pilotedmethans/air jet flames, Proc. Combust. Inst. 30,673–680 (2005)
20.39 T.J. Poinsot, D. Veynante: Theoretical and Numeri-cal Combustion (Edwards, Philadelphia 2005)
20.40 R.S. Barlow: Laser diagnostics and their interplaywith computations to understand turbulent com-bustion, Proc. Combust. Inst. 31, 49–76 (2007)
20.41 N. Peters: Laminar flamlet concepts in turbu-lent combustion, Proc. Combust. Inst. 21, 1231–1250(1986)
20.42 R.W. Bilger, S.B. Pope, K.N.C. Bray, J.F. Driscoll:Paradigms in turbulent combustion research, Proc.Combust. Inst. 30, 21–42 (2004)
20.43 S.B. Pope: Computations of turbulent combustion:Progress and challenges, Proc. Combust. Inst. 23,591–612 (1990)
20.44 N. Peters: Turbulent Combustion (Cambridge Univ.Press, Cambridge 2000)
20.45 R.S. Barlow, C.D. Carter, R.W. Pitz: Multiscalardiagnostics in turbulent flames. In: Applied Com-bustion Diagnostics, ed. by K. Kohse-Höinghaus,J.B. Jeffries (Taylor Francis, New York 2002) pp. 384–407
20.46 G. Grünefeld, A. Gräber, A. Diekmann, S. Krüger,P. Andresen: Measurement system for simultane-ous species densities, temperature and velocitydouble-pulse measurements in turbulent hydro-gen flames, Combust. Sci. Technol. 135, 135–152(1998)
20.47 R.B. Miles, W.R. Lempert: Two-dimensional meas-urement of density, velocity, and temperature inturbulent high-speed air flows by UV Rayleighscattering, Appl. Phys. B 51, 1–7 (1990)
20.48 R.W. Dibble, W. Kollmann, R.W. Schefer: Conservedscalar fluxes measured in a turbulent nonpremixedflame by combined laser Doppler velocimetry andlaser Raman scattering, Combust. Flame 55, 307–321 (1984)
20.49 A. Nauert, A. Dreizler: Conditional velocity meas-urements by simulatenously applied laser Dopplervelocimetry and planar laser-induced fluorescencein a swirling natural gas/air flame, Z. Phys. Chem.219, 635–648 (2005)
20.50 S. Geiss, A. Dreizler, Z. Stojanovic, A. Sadiki,J. Janicka: Experimental investigation of turbu-lence modification in a non-reactive two-phaseflow, Exp. Fluids 36, 344–354 (2004)
20.51 H.-E. Albrecht, M. Borys, N. Damaschke, C. Tropea:Laser Doppler and Phase Doppler MeasurementTechniques (Springer, Berlin, Heidelberg 2003)
20.52 N. Damaschke, H. Nobach, C. Tropea: Optical lim-its of particle concentration for multidimensionalparticle sizing techniques in fluid mechanics, Exp.Fluids 32, 143–152 (2002)
20.53 M.C. Jermy, D.A. Greenalgh: Planar dropsizing byelastic fluorescence scattering in sprays too densefor phase Doppler measurements, Appl. Phys. B 71,703–710 (2000)
20.54 I. Düwel, J. Schorr, J. Wolfrum, C. Schulz: Laser-induced fluorescence of tracers dissolved inevaporating droplets, Appl. Phys. B 78, 127–131(2004)
20.55 H.C. Hottel, A.F. Sarofim: Radiative Heat Transfer(McGraw Hill, New York 1997)
20.56 A.L. Crosbie, J.B. Farrell: Exact formulation of mul-tiple scattering in a three-dimensional cylindricalgeometry, J. Quant. Spectrosc. Radiat. Heat Trans-fer 31, 397–416 (1984)
20.57 J.T. Farmer, J.R. Howell: Monte Carlo predic-tion of radiative heat transfer in homogeneous,anisotropic, nongray media, J. Thermophys. HeatTransfer 8, 133–139 (1994)
20.58 A. Soufiani, E. Djavdan: A comparison betweenweigthed sum of gray gases and statistical
PartC
20

1302 Part C Specific Experimental Environments and Techniques
narrow-band radiation models for combustion ap-plications, Combust. Flame 97, 240–250 (1994)
20.59 R. Koch, S. Wittig, B. Noll: The harmonic transmis-sion model: A new approach to multidimensionalradiative transfer calculation in gases under con-sideration of pressure broadening, Int. J. Heat MassTransfer 34, 1871–1880 (1991)
20.60 J. Brübach, J. Zetterberg, A. Omrane, Z.S. Li,M. Aldén, A. Dreizler: Determination of surface nor-mal temperature gradients using thermographicphosphors and filtered Rayleigh scattering, Appl.Phys. B 84, 537–541 (2005)
20.61 T. Fuyuto, H. Kronemayer, B. Lewerich, W. Koban,K. Akihama, C. Schulz: Laser-based temperatureimaging close to surfaces with toluene and NO-LIF,J. Phys.: Conference Series 45, 69–76 (2006)
20.62 D. Geyer: 1D Raman/Rayleigh experiments in a tur-bulent opposed-jet. PhD Thesis (TU Darmstadt,Darmstadt 2004)
20.63 D. Geyer, A. Dreizler, J. Janicka, A.D. Permana,J.-Y. Chen: Finite rate chemistry effects in turbu-lent opposed flows: comparison of Raman/Rayleighmeasurements and Monte Carlo PDF simulation,Proc. Combust. Inst. 30, 711–718 (2005)
20.64 S.K. Omar, D. Geyer, A. Dreizler, J. Janicka:Investigation of flame structures in turbulentpartially premixed counter-flow flames usinglaser-induced fluorescence, Prog. Comput. FluidDyn. 4, 241–249 (2004)
20.65 B. Böhm, D. Geyer, K.K. Venkatesan, N.M. Lau-rendeau, M.W. Renfro: Simulatenous PIV/PTV/OH-PLIF imaging: Conditional flow field statistics inpartially-premixed turbulent opposed jet flames,Proc. Combust. Inst. 31, 709–717 (2007)
20.66 K.K. Venkatesan, N.M. Laurendeau, M.W. Renfro,D. Geyer, A. Dreizler: Time-resolved measure-ments of hydroxyl in stable and extinguishingpartially-premixed turbulent opposed-jez flames,Flow Turbulence Combustion 76, 257–278 (2006)
20.67 D. Geyer, A. Kempf, A. Dreizler, J. Janicka: Tur-bulent opposed jet flames: a critical benchmarkfor combustion LES, Combust. Flame 143, 524–548(2005)
20.68 K. Shimoda: Limits of sensitivity of laser spectrom-eters, Appl. Phys. 1, 77–86 (1973)
20.69 C.A. Taatjes, D.B. Oh: Time-resolved wavelengthmodulation spectroscopy measurements of HO2 ki-netics, Appl. Opt. 36, 5817–5821 (1997)
20.70 M.G. Allen: Diode laser absorption sensors for gasdynamic and combustion flows, Meas. Sci. Technol.9, 545–562 (1998)
20.71 S. Schäfer, M. Mashni, J. Sneider, A. Miklos, P. Hess,V. Ebert, K.-U. Pleban, H. Pitz: Sensitive detectionof methane with 1.65 µm diode laser by photoa-coustic and absorption spectroscopy, Appl. Opt. 66,511–516 (1998)
20.72 M.S. Chou, A.M. Dean, D. Stern: Laser absorp-tion measurements on OH, NH and NH2 in NH3/O2
flames: Determination of an oscillator strength forNH2, J. Chem. Phys. 76, 5334–5340 (1982)
20.73 S. Cheskis, I. Derzy, V.A. Lozovsky, A. Kachanov,D. Romanini: Cavity ring-down spectroscopy of OHradicals in low-pressure flames, Appl. Phys. B 66,377 (1998)
20.74 J.J. Scherer, D.J. Rakestraw: Cavity ring-down laserabsorption spectroscopy detection of formyl (HCO)radical in a low pressure flame, J. Chem. Phys 265,169 (1997)
20.75 J.J. Scherer, D.J. Rakestraw: Cavity ringdown laserabsorption spectroscopy detection of formyl (HCO)radical in a low-pressure flame, Chem. Phys. Lett.265, 168–176 (1997)
20.76 K. Kohse-Höinghaus, U. Meier, B. Attal-Trétout:Laser-induced fluorescence study of OH in flatflames of 1-10 bar compared with resonance CARSexperiments, Appl. Opt. 29, 1560–1569 (1990)
20.77 C.D. Carter, G.B. King, N.M. Laurendeau: Saturatedfluorescence measurements of the hydroxyl radicalin laminar high-pressure C2H6/O2/N2 flames, Appl.Opt. 31, 1511–1522 (1992)
20.78 T. Dreier, D. Rakestraw: Measurement of OH rota-tional temperatures in a flame using degeneratefour wave mixing, Opt. Lett. 15, 72–74 (1990)
20.79 H. Bervas, B. Attal-Tretout, S. Le Boiteux, J.P. Taran:OH detection and spectroscopy by DFWM in flames:comparison with CARS, J. Phys. B 25, 949–969(1992)
20.80 T. Dreier, D.J. Rakestraw: Degenerate four-wavemixing diagnostics on OH and NH radicals inflames, Appl. Phys. B 50, 479–485 (1990)
20.81 G.J. Germann, R.L. Farrow, D.J. Rakestraw: In-frared degenerate four-wave mixing spectroscopyof polyatomic molecules: CH4 and C2H2, J. Opt. Soc.Am. B 12, 25–32 (1995)
20.82 R.L. Vander Wal, B.E. Holmes, J.B. Jeffries,P.M. Danehy, R.L. Farrow, D.J. Rakestraw: Detec-tion of HF using infrared degenerate four-wavemixing, Chem. Phys. Lett. 191, 251–258 (1992)
20.83 R.L. Farrow, M.N. Bui-Pham: Degenerate four-wave mixing measurements of methyl radicaldistributions in hydrocarbon flames: Comparisonwith model predictions, Proc. Combust. Inst. 26,975–983 (1996)
20.84 C.F. Kaminski, I.G. Hughes, P. Ewart: Degener-ate four-wave mixing spectroscopy and spectralsimulation of C2 in an atmospheric pressure oxy-acetylene flame, J. Chem. Phys. 106, 5324–5332(1997)
20.85 B. Attal, D. Débarre, K. Müller-Dethlefs, J.P.E. Taran:Resonance-enhanced coherent anti-Stokes Ramanscattering in C2, Rev. Phys. Appl. 18, 39–50 (1983)
20.86 B. Attal-Trétout, P. Berlemont, J.P. Taran: Three-colour CARS spectroscopy of the OH radical at tripleresonance, Mol. Phys. 70, 1–51 (1990)
20.87 L.A. Rahn, P.L. Mattern, R.L. Farrow: A comparisonof coherent and spontaneous Raman combus-
PartC
20

Combustion Diagnostics References 1303
tion diagnostics, Proc. Combust. Inst. 18, 1533–1542(1981)
20.88 A.C. Eckbreth, R.J. Hall: CARS concentration sensi-tivity with aqnd without nonresonant backgroundsuppression, Combust. Sci. Technol. 25, 175–192(1981)
20.89 T. Dreier, J. Wolfrum: Detection of the free OH (X2Π)radical by CARS spectroscopy, J. Chem. Phys. 80,975–976 (1984)
20.90 T. Dreier, J. Wolfrum: Detection of free NH2 (X2B1)radicals by CARS spectroscopy, Appl. Phys. B 33, 213–218 (1984)
20.91 T.N. Tanada, J. Velazques, N. Hemmi, T.A. Cool: De-tection of toxic emissions from incinerators, Ber.Bunsenges. Phys. Chem. 97, 1516–1526 (1993)
20.92 C. Weickhard, U. Boesl: Time-resolved trace analy-sis of exhaust gas by means of laser mass spectro-metry, Ber. Bunsenges. Phys. Chem. 97, 1716–1719(1993)
20.93 K. Nyholm, M. Kaivola, C.G. Aminoff: Polarizationspectroscopy applied to C2 detection in a flame,Appl. Phys. B 60, 5–10 (1995)
20.94 K. Nyholm: Measurements of OH rotational tem-peratures in flames by using polarization spec-troscopy, Opt. Commun. 111, 66–70 (1994)
20.95 R.S. Barlow, A.N. Karpetis: Scalar length scalesand spatial averaging effects in turbulent pilotedmethane/eir jet flames, Proc. Combust. Inst. 30,673–680 (2005)
20.96 J.J. Scherer, J.B. Paul, A. O’Keefe, R.J. Saykally:Cavity ringdown laser absorption spectroscopy:History, development, and application to pulsedmolecular beams, Chem. Rev. 97, 25 (1997)
20.97 W. Juchmann, H. Latzel, D.-I. Shin, G. Peiter,T. Dreier, H.-R. Volpp, J. Wolfrum, R.P. Lindstedt,K.M. Leung: Absolute radical concentration meas-urements and modeling of low pressure CH4/O2/NOflames, Proc. Combust. Inst 27, 469–476 (1998)
20.98 M. Bachmann, J. Griesheimer, K.-H. Homann:Thermal and chemical influences on the soot massgrowth, Proc. Combust. Inst. 25, 635–643 (1994)
20.99 M. Hausmann, K.H. Homann: Scavenging ofhydrocarbon radicals from flames with dimethyl-disulfide II. Hydrocarbon radicals in fuel-richlow-pressure flames of acetylene, ethylene, 1,3-butadiene and methane with oxygen, Ber. Bun-senges. Phys. Chem. 101, 651–667 (1997)
20.100 J. Ahrens, A. Keller, R. Kovacs, K.-H. Homann:Large molecules, radicals, ions and soot par-ticles in fuel-rich hydrocarbon flames. Part III:REMPI mass spectrometry of large flame PAHsand fullerenes and their quantitative calibrationthrough sublimation, Ber. Bunsenges. Phys. Chem.102, 1823–1839 (1998)
20.101 M. Woyde, W. Stricker: The application of CARSfor temperature measurements in high pressurecombustion systems, Appl. Phys. B 50, 519–525(1990)
20.102 T. Dreier, M. Ridder, G. Schiff, A. Saur, A.A. Su-vernev: Determination of temperature from N2 andO2 CARS spectra at very high pressure, Proc. Com-bust. Inst. 25, 1727–1734 (1994)
20.103 L. Martinsson, P.-E. Bengtsson, M. Aldén, S. Kröll:Applications of rotational CARS for temperaturemeasurements at high pressure and in particle-laden flames. In: Temperature: Its Measurementsand Control in Science and Industry, ed. byJ.F. Schooley (American Institute of Physics, NewYork 1992) pp. 679–684
20.104 R.L. Vander Wal, R.L. Farrow, Rakestraw: High-resolution investigation of degenerate four-wavemixing in the γ (0,0) band of nitric oxide, Proc.Combust. Inst. 24, 1653–1659 (1992)
20.105 S.J. Tsay, K.G. Owens, K.W. Aniolek, D.L. Miller,N.P. Cernansky: Detection of CN by degeneratefour-wave mixing, Opt. Lett. 20, 1725–1727 (1995)
20.106 S. Williams, R.N. Zare, L.A. Rahn: Reduction ofdegenerate four-wave mixing spectra to relativepopulations II. Strong-field limit, J. Chem. Phys.101, 1093–1107 (1994)
20.107 A.P. Smith, G. Hall, B.J. Whitaker, A.G. Astill,D.W. Neyer, P.A. Delve: Effect of inert gases onthe degenerate four-wave mixing spectrum of NO2,Appl. Phys. B 60, 11–18 (1995)
20.108 G. Hall, A.G. Suits, B.J. Whitaker: Resonant degen-erate four wave mixing detection of HCO, Chem.Phys. Lett. 203, 277–282 (1993)
20.109 K. Nyholm, R. Fritzon, M. Aldén: Two-dimensionalimaging of OH in flames by use of polarizationspectroscopy, Opt. Lett. 18, 1672–1674 (1993)
20.110 B. Löfstedt, R. Fritzon, M. Aldén: Investigation ofNO detection in flames using polarization spec-troscopy, Appl. Opt. 35, 2140–2146 (1996)
20.111 T. Reichardt, R.P. Lucht: Theoretical calculation ofline shapes and saturation effects in polarizationspectroscopy, J. Chem. Phys. 109, 5830–5843 (1998)
20.112 J.B. Kelman, A.R. Masri: Reaction zone structureand scalar dissipation rates in turbulent diffusionflames, Appl. Opt. 36, 3506–3514 (1997)
20.113 Q.V. Nguyen, P.H. Paul: The time evolution ofa vortex-flame interaction observed via planarlaser-induced fluorescence imaging of CH and OH,Proc. Combust. Inst. 26, 357–364 (1996)
20.114 A.R. Masri, R.W. Dibble, R.S. Barlow: The struc-ture of turbulent nonpremixed flames revealed byRaman-Rayleigh-LIF measurements, Prog. EnergyCombust. Sci. 22, 307–362 (1996)
20.115 M. Decker, A. Schik, U.E. Meier, W. Stricker: Quan-titative Raman imaging investigations of mixingphenomena in high-pressure cryogenic jets, Appl.Opt. 37, 5620–5627 (1998)
20.116 M. Péalat, P. Bouchardy, M. Lefebvre, J.P. Taran:Precision of multiplex CARS temperature measure-ments, Appl. Opt. 24, 1012–1022 (1985)
20.117 R.P. Lucht, D. Dunn-Rankin, T. Walter, T. Dreier,S.C. Bopp: Heat transfer in engines: Comparison of
PartC
20
1304 Part C Specific Experimental Environments and Techniques
CARS thermal boundary layer measurements andheat flux measurements, SAE Techn. Paper Ser.910722 (1991)
20.118 A.C. Eckbreth, G.M. Dobbs, J.H. Stufflebeam,P.A. Tellex: CARS temperature measurements inaugmented jet engine exhausts, Appl. Opt. 23,1328–1339 (1984)
20.119 A.C. Eckbreth, T.J. Anderson, J.A. Shirley: LaserRaman diagnostics for propulsion systems de-velopment, Ber. Bunsenges. Phys. Chem. 97,1597–1608 (1993)
20.120 R. Bédué, R. Gastebois, R. Bailly, M. Pealat,J.P. Taran: CARS measurements in a simulated tur-bomachine combustor, Combust. Flame 57, 141–153(1984)
20.121 B. Lavorel, G. Millot, J. Bonamy, D. Robert: Study ofrotational relaxation fitting laws from calculationof SRS N2 Q-branch, Chem. Phys. 115, 69–78 (1987)
20.122 G. Millot, R. Saint-Loup, S. Santos, R. Chaux,H. Berger, J. Bonamy: Collisional effects in thestimulated Raman Q-branch of O2 and O2-N2, J.Chem. Phys. 96, 961–971 (1992)
20.123 L.A. Rahn, R.L. Farrow, G.J. Rosasco: Measurementof the self-broadening of the H2 Q(0-5) Ramantransitions from 295 to 1000 K, Phys. Rev. A 43,6075–6088 (1991)
20.124 J.P. Looney, G.J. Rosasco, L.A. Rahn, W.S. Hurst,J.W. Hahn: Comparison of rotational relaxation ratelaws to characterize the Raman Q-branch spec-trum of CO at 295 K, Chem. Phys. Lett. 161, 232–238(1989)
20.125 B. Lavorel, G. Millot, G. Fanjoux, R. Saint-Loup:Study of collisional effects on bandshapes of theν1/2ν2 Fermi dyad in CO2 gas with stimulated Ramanspectroscopy. III. Modeling of collisional narrowingand study of vibrational shifting and broadeningat high temperature, J. Chem. Phys. 101, 174–177(1994)
20.126 W. Kiefer: Non-linear Raman spectroscopy and itschemical applications. In: NATO Advanced StudyInsitutes Series C: Mathematical and Physical Sci-ences, ed. by W. Kiefer, D.A. Long (Reidel, Dordrecht1982) pp. 241–260
20.127 R. Suntz, H. Becker, P. Monkhouse, J. Wolfrum:Two-dimensional visualization of the flame frontin an internal combustion engine by laser-inducedfluorescence of OH radicals, Appl. Phys. B 47, 287–293 (1988)
20.128 P.H. Paul, H.N. Najm: Planar laser-induced flu-orescence imaging of flame heat release, Proc.Combust. Inst. 27, 43–50 (1998)
20.129 A. Hoffmann, C. Schulz, J. Ruckwied, D. Malcherek,T. Dreier, R. Schießl, U. Maas: Three-dimensionalmeasurement of OH-concentration gradients in a -turbulent flame by simultaneous laser inducedfluorescence and Raman scattering. In: EuropeanCombustion Meeting (The Combustion Institute, Or-léans 2003)
20.130 P.C. Miles: Raman line imaging for spatially andspectrally resolved mole fraction measurements ininternal combustion engines, Appl. Opt. 38, 1714–1732 (1999)
20.131 G. Grünefeld, M. Schütte, P. Andresen: Simulta-neous multiple-line Raman/Rayleigh/LIF measure-ments in combustion, Appl. Phys. B 70, 309–313(2000)
20.132 S. Böckle, J. Kazenwadel, T. Kunzelmann, D.-I. Shin, C. Schulz, J. Wolfrum: Simultaneoussingle-shot laser-based imaging of formaldehyde,OH and temperature in turbulent flames, Proc.Combust. Inst. 28, 279–286 (2000)
20.133 S. Böckle, J. Kazenwadel, C. Schulz: Laser-diagnostic multi-species imaging in stronglyswirling natural gas flames, Appl. Phys. B 71, 741–746 (2000)
20.134 S. Einecke, C. Schulz, V. Sick: Measurement of tem-perature, fuel concentration and equivalence ratiofields using tracer LIF in IC engine combustion,Appl. Phys. B 71, 717–723 (2000)
20.135 W. Koban, J. Schorr, C. Schulz: Oxygen distributionimaging with a novel two-tracer laser-inducedfluorescence technique, Appl. Phys. B 74, 111–114(2002)
20.136 C.F. Kaminski, J. Hult, M. Aldén: High repetitionrate planar laser induced fluorescence of OH in a -turbulent non-premixed flame, Appl. Phys. B 68,757–760 (1999)
20.137 C.F. Kaminski, M.B. Long: Multidimensional diag-nostics in space and time. In: Applied CombustionDiagnostics, ed. by K. Kohse-Höinghaus, J.B. Jef-fries (Taylor Francis, London 2003) pp. 224–251
20.138 I. Düwel, J. Schorr, P. Peuser, P. Zeller, J. Wolfrum,C. Schulz: Spray diagnostics using an all solid-stateNd:YAlO3 laser and fluorescence tracers in commer-cial gasoline and Diesel fuels, Appl. Phys. B 79,249–254 (2004)
20.139 W. Meier, O. Keck: Laser Raman scattering infuel-rich flames: background levels at differentexcitation wavelengths, Meas. Sci. Technol. 13, 741–749 (2002)
20.140 A. Buschmann, F. Dinkelacker, M. Schäfer,T. Schäfer, J. Wolfrum: Measurement of the in-stantaneous detailed flame structure in turbulentpremixed combustion, Proc. Combust. Inst. 26, 619(1996)
20.141 H.B. Najm, P.H. Paul, C.J. Mueller, P. Wyckoff: Onthe adequacy of certain experimental observablesas measurements of flame burning rate, Combust.Flame 113, 312–322 (1998)
20.142 T. Landenfeld, A. Kremer, E.P. Hassel, J. Janicka,T. Schäfer, J. Kazenwadel, C. Schulz, J. Wolfrum:Laserdiagnostic and numerical studies of stronglyswirling natural-gas flames, Proc. Combust. Inst.27, 1023–1030 (1998)
20.143 D.I. Shin, G. Peiter, T. Dreier, H.-R. Volpp, J. Wol-frum: Spatially resolved measurements of CN, CH,
PartC
20

Combustion Diagnostics References 1305
NH and H2CO concentration profiles in a domesticgas boiler, Proc. Combust. Inst. 28, 319–325 (2000)
20.144 N. Garland: Assignment of formaldehyde laser-induced Fluorescence spectrum from the Sandiaengine experiment, SRI International MP 84-033(1984)
20.145 D. Grebner, J. Hein, W. Triebel, A. Burkert, J. König,C. Eigenbrod: 2D-fast-scan cool-flame diagnos-tic using formaldehyde-LIF excited by XeF excimerlaser radiation. In: Proc. Joint Meeting of the BritishGerman and French sections of the CombustionInstitute Nancy (The Combustion Institute, Nancy1999) pp. 485–487
20.146 S. Böckle, J. Kazenwadel, T. Kunzelmann, D.-I. Shin, C. Schulz: Single-shot laser-inducedfluorescence imaging of formaldehyde with XeFexcimer excitation, Appl. Phys. B 70, 733–735 (2000)
20.147 J. Weickert: Anisotropic Diffusion in Image Process-ing (Teubner, Stuttgart 1998)
20.148 H. Scharr, B. Jähne, S. Böckle, J. Kazenwadel,T. Kunzelmann: Flame front analysis in turbulentcombustion. In: 22. DAGM Symposium (DeutscheArbeitsgemeinschaft Mustererkennung, Kiel 2000)pp. 325–332
20.149 N. Fricker, W. Leuckel: The characteristics of swirl-stabilized natural gas flames. Part 3: the effect ofswirl and burner mouth geometry on flame stabil-ity, J. Inst. Fuel 49, 152–158 (1976)
20.150 T. Dreier, A. Dreizler, J. Wolfrum: The applicationof a Raman-shifted tunable KrF excimer laser forlaser-induced fluorescence combustion diagnos-tics, Appl. Phys. B 55, 381–387 (1992)
20.151 W. Ketterle, M. Schäfer, A. Arnold, J. Wolfrum: 2Dsingle shot imaging of OH radicals using tunableexcimer lasers, Appl. Phys. B 54, 109–112 (1992)
20.152 E.W. Kaiser, K. Marko, D. Klick, L. Rimai, C.C. Wang,B. Shirinzadeh, D. Zhou: Measurement of OH den-sity profiles in atmospheric-pressure propane-airflames, Combust. Sci. Tech. 50, 163–183 (1986)
20.153 C. Schulz, V. Sick, U. Meier, J. Heinze, W. Stricker:Quantification of NO A-X(0,2) LIF: Investigationof calibration and collisional influences in high-pressure flames, Appl. Opt. 38, 434–1443 (1999)
20.154 B. Yip, D.C. Fourguette, M.B. Long: Three-dimensional gas concentration and gradientmeasurements in a photoacoustically perturbedjet, Appl. Opt. 25, 3919–3923 (1986)
20.155 J.H. Frank, K.M. Lyons, M.B. Long: Techniquefor three-dimensional measurements of the timedevelopment of turbulent flames, Opt. Lett. 16,958–960 (1991)
20.156 J. Nygren, J. Hult, M. Richter, M. Aldén,M. Christensen, A. Hultqvist, B. Johansson: Three-dimensional laser induced fluorescence of fueldistributions in an HCCI engine, Proc. Combust.Inst. 29, 679–685 (2002)
20.157 A. Hoffmann, F. Zimmermann, H. Scharr,S. Krömker, C. Schulz: Instantaneous three-
dimensional visualization of concentration dis-tributions in turbulent flows with crossed-planelaser-induced fluorescence imaging, Appl. Phys. B80, 125–131 (2005)
20.158 S.S. Sattler, F.C. Gouldin, N.T. Boertlein: Combinedcrossed-plane imaging and stereo-particle imagevelocimetry. In: Third Joint Meeting of the U.S. Sec-tions of the Combustion Institute (The CombustionInstitute, Chicago 2003)
20.159 D.A. Knaus, F.C. Gouldin: Measurement of flameletorientations in premixed flames with positive andnegative Markstein numbers, Proc. Combust. Inst.28, 367–373 (2000)
20.160 D.A. Knaus, F.C. Gouldin, D.C. Bingham: Assess-ment of crossed-plane tomography for flameletsurface normal measurements, Combust. Sci. Tech-nol. 174, 101–134 (2002)
20.161 A. Hoffmann, F. Zimmermann, and C. Schulz: In-stantaneous three-dimensional visualization ofconcentration distributions in turbulent flows witha single laser. In: First International Conference onOptical and Laser Diagnostics (London, 2002), inpress
20.162 A. Karpetis, R. Barlow: Measurements of flameorintation and scalar dissipation in turbulent hy-drocarbon flames. In: Third Joint Meeting of theU.S. Sections of The Combustion Institute (The Com-bustion Institute, Chicago 2003)
20.163 C. Dartu: Visualization of Volumetric Datasets (Uni-versität Heidelberg, Heidelberg 2001)
20.164 C. Kaminski, J. Hult, M. Aldén, S. Lindenmaier,A. Dreizler, U. Maas, M. Baum: Spark ignition ofturbulent methane/air mixtures revealed by timeresolved laser induced fluorescence and directnumerical simulations, Proc. Combust. Inst. 28,399–405 (2000)
20.165 A. Dreizler, S. Lindenmaier, U. Maas, J. Hult,M. Aldén, C.F. Kaminski: Characterisation of a sparkignition system by planar laser-induced fluo-rescence of OH at high repetition rates andcomparisons with chemical kinetics calculations,Appl. Phys. B 70, 287–294 (2000)
20.166 R.B. Williams, P. Ewart, A. Dreizler: Velocimetryof gas flows using degeneratre four-wave mixing,Opt. Lett. 19, 1486–1488 (1994)
20.167 R.W. Pitz, J.A. Wehrmeyer, L.A. Ribarov, D.A. Oguss,F. Batliwala, P.A. DeBarber, S. Deutsch, P.E. Di-motakis: Unseeded molecular flow tagging in coldand hot flows using ozone and hydroxyl tag-ging velocimetry, Meas. Sci. Technol. 11, 1259–1271(2000)
20.168 R. Miles, C. Cohen, J. Conners, P. Howard, S. Huang,E. Markovitz, G. Russell: Velocity measurementsby vibrational tagging and fluorescent probing ofoxygen, Opt. Lett. 12, 861 (1987)
20.169 R.B. Miles, W. Lempert, B. Zhang: Turbulence struc-ture measurement by RELIEF flow tagging, Fluid.Dyn. Res. 8, 9–17 (1991)
PartC
20

1306 Part C Specific Experimental Environments and Techniques
20.170 S. Krüger, G. Grünefeld: Gas-phase velocity fieldmeasurements in dense sprays by laser-based flowtagging, Appl. Phys. B 70, 463–466 (2000)
20.171 T. Elenbaas, N.M. Sijtsema, R.A.L. Tolboom,N.J. Dam, W. van de Water, J.J. ter Meulen: Char-acterization of turbulence by air photolysis andrecombination tracking (APART), AIAA 2002-0694(American Institute of Aeronautics and Astronau-tics, Inc., 2002)
20.172 I. Düwel, P. Peuser, P. Zeller, J. Wolfrum, C. Schulz:Laser-based spray diagnostics in commercial fuelsusing a new all-solid-state laser system. In: ILASSEurope (Nottingham 2004)
20.173 G. Josefsson, I. Magnusson, F. Hildenbrand,C. Schulz, V. Sick: Multidimensional laser diagnosticand numerical analysis of NO formation in a ga-soline engine, Proc. Combust. Inst. 27, 2085–2092(1998)
20.174 W.G. Bessler, M. Hofmann, F. Zimmermann,G. Suck, J. Jakobs, S. Nicklitzsch, T. Lee, J. Wolfrum,C. Schulz: Quantitative in-cylinder NO-LIF imagingin a realistic gasoline engine with spray-guideddirect injection, Proc. Combust. Inst. 30, 2667–2674(2005)
20.175 M.J. Hall, P. Zuzek, R.W. Anderson: Fiber opticsensor for crank angle resolved measurements ofburned gas residual fraction in the cylinder ofan SI engine, SAE Techn. Paper Ser. 2001-01-1921(2001)
20.176 R. Reichle, C. Pruss, W. Osten, H.J. Tiziani, F. Zim-mermann, C. Schulz: Acquisition of combustionparameters close to the ignition spark with a fiberoptic sensor. In: Optical measurement systems forindustrial inspection IV, Vol. 5856, ed. by W. Osten,C. Gorecki, E.L. Novak (SPIE-The International Soci-ety for Optical Engineering, Bellingham, WA 2005)pp. 158–168
20.177 M. Richter, B. Axelsson, M. Aldén: Engine diag-nostics using laser-induced fluorescence signalscollected through an endoscopic detection system,SAE Techn. Paper Ser. 982465 (1998)
20.178 H. Neij, M. Aldén: Application of two-photon laser-induced fluorescence for visualization of watervapor on combustion environments, Appl. Opt. 33,6514–6523 (1994)
20.179 W.G. Bessler, C. Schulz, T. Lee, J.B. Jeffries,R.K. Hanson: Carbon dioxide UV laser-induced flu-orescence in high-pressure flames, Chem. Phys.Lett. 375, 344–349 (2003)
20.180 A.A. Roller, M. Decker, V. Sick, J. Wolfrum,W. Hentschel, K.-P. Schindler: Non-Intrusive tem-perature measurements during the compressionphase of a DI Diesel engine, SAE Techn. Paper Ser.952461 (1995)
20.181 M.C. Drake, T.D. Fransler, D.T. French: Crevice flowand combustion visualization in a direct-injectionspark-ignition engine using laser imaging tech-niques, SAE Techn. Paper Ser. 952454 (1995)
20.182 J.E. Dec, J.O. Keller: High speed thermometry usingtwo-line atomic fluorescence, Proc. Combust. Inst.21, 1737–1745 (1986)
20.183 C.F. Kaminski, J. Engström, M. Aldén: Quasi-instantaneous two-dimensional temperature meas-urements in a spark ignition enginge using two-line atomic fluorescence, Proc. Combust. Inst. 27,85–93 (1998)
20.184 B.K. McMillin, J.L. Palmer, R.K. Hanson: Tempo-rally resolved, two-line fluorescence imaging ofNO temperature in a transverse jet in a supersoniccross flow, Appl. Opt. 32, 7532–7545 (1993)
20.185 W.G. Bessler, C. Schulz: Quantitative multi-line NO-LIF temperature imaging, Appl. Phys. B 78, 519–533(2004)
20.186 W.G. Bessler, C. Schulz, T. Lee, J.B. Jeffries,R.K. Hanson: Strategies for laser-induced fluores-cence detection of nitric oxide in high-pressureflames: III. Comparison of A-X strategies, Appl. Opt.42, 4922–4936 (2003)
20.187 C. Orlemann, C. Schulz, J. Wolfrum: NO-flow tag-ging by photodissociation of NO2. A new approachfor measuring small-scale flow structures, Chem.Phys. Lett. 307, 15–20 (1999)
20.188 N. Dam, R.J.H. Klein-Douwel, N. Sijstema, J. terMeulen: Nitirc oxide flow tagging in unseeded air,Opt. Lett. 26, 36–38 (2001)
20.189 M.P. Lee, R.K. Hanson: Calculations of O2 absorp-tion and fluorescence at elevated temperaturesfor a broadband argon-fluoride laser source at 193nm, J. Quant. Spectros. Radiat. Transfer 36, 425–440 (1986)
20.190 B. Hiller, R. Hanson: Properties of the iodinemolecule relevant to laser-induced fluorescenceexperiments in gaseous flows, Exp. Fluids 10, 1–11(1990)
20.191 K. Greenough, A. Duncan: The fluorescence of sul-fur dioxide, J. Am. Chem. Soc. 83, 555–560 (1961)
20.192 H. Mettee: Fluorescence and phosphorescence ofSO2 vapor, J. Chem. Phys. 49, 1784–1793 (1968)
20.193 S.J. Strickler, D. Howell: Luminescence and radi-ations transitions in sulfur dioxide gas, J. Chem.Phys. 49, 1947–1951 (1968)
20.194 V. Sick: Exhaust-gas imaging via planar laser-induced fluorescence of sulfur dioxide, Appl. Phys.B 74, 461–463 (2002)
20.195 T. Rao, S. Collier, J. Calvert: Primary photophysicalprocesses in the photochemistry of sulfur dioxideat 2875 Å, J. Am. Chem. Soc. 91, 1609–1615 (1969)
20.196 T. Rao, S. Collier, J.G. Calvert: The quenching reac-tions of the first excited singlet and triplet statesof sulfur dioxide with oxygen and carbon dioxide,J. Am. Chem. Soc. 91, 1616–1621 (1969)
20.197 R. Caton, A. Duncan: Lifetime of the lowest tripletstate of sulfur dioxide, J. Am. Chem. Soc. 90, 1945–1949 (1968)
20.198 A. Lozano: Laser-excited luminescent tracers forplanar concentration measurements in gaseous
PartC
20

Combustion Diagnostics References 1307
jets, Ph.D. Thesis (Stanford University, Stanford1992)
20.199 H. Krämer, S. Einecke, C. Schulz, V. Sick, S.R. Nat-trass, J.S. Kitching: Simultaneous mapping of thedistribution of different fuel volatility classes us-ing tracer-LIF and NIR tomography in an IC engine,SAE Transactions, J. Fuels Lubricants 107, 1048–1059(1998)
20.200 D. Han, R.R. Steeper: An LIF equivalence ratioimaging technique for multicomponent fuels in anIC engine, Proc. Combust. Inst 29, 727–734 (2002)
20.201 M.-T. Lin, V. Sick: Mixture evaporation charac-teristics prediction for LIF measurements usingPSRK (Predictive Soave-Redlich-Kwong) equationof state, SAE Transactions, J. Fuels Lubricants 111,1490–1499 (2002)
20.202 M.-T. Lin, V. Sick: Is toluene a suitable LIF tracerfor fuel film measurements?, SAE Techn. Paper Ser.2004-01-1355 (2004)
20.203 J. F. Le Coz, C. Catalano, T. Baritaud: Applica-tion of laser-induced fluorescence for measuringthe thickness of liquid films on transparent walls.In: 7th International Symposium on Applicationsof Laser Techniques to Fluid Mechanics II (Lisbon1994)
20.204 T. Fansler, D. French, M.C. Drake: Fuel Distribu-tions in a Firing Direct-injection Spark-ignitionEngine Using Laser-Induced Fluorescence Imaging,SAE Techn. Paper Ser. 950110 (1995)
20.205 D. A. Greenhalgh, D. F. Bryce, R. D. Lockett, andS. C. Harding: Development of planar laser in-duced fluorescence for fuel: Application to gasturbine combustion. In: AGARD PEP Symposiumon Advanced non-intrusive instrumentation forpropulsion engines (Brussels 1997)
20.206 W. Hentschel, B. Block, T. Hovestadt, H. Meyer,G. Ohmstede, V. Richter, B. Stiebels, A. Winkler:Optical diagnostics and CFD-simulations to sup-port the combustion process development of theVolkswagen FSI direct injection gasoline engine,SAE Techn. Paper Ser. 2001-01-3648 (2001)
20.207 J. Reboux, D. Puecheberty: A new approach of PLIFapplied to fuel/air ratio measurement in the com-pressive stroke of an optical SI engine, SAE Techn.Paper Ser. 941988 (1994)
20.208 W. Koban, J.D. Koch, R.K. Hanson, C. Schulz: Oxy-gen quenching of toluene fluorescence at elevatedtemperatures, Appl. Phys. B 80, 777–784 (2005)
20.209 W. Koban, J.D. Koch, V. Sick, N. Wermuth, R.K. Han-son, C. Schulz: Predicting LIF signal strength fortoluene and 3-pentanone under engine-relatedtemperature and pressure conditions, Proc. Com-bust. Inst. 30, 1545–1553 (2005)
20.210 S.A. Kaiser, M.B. Long: The effect of tempera-ture and quenching on laser-induced fluorescenceof naphtalenes as JP-8 tracers. In: Chemical andPhysical Processes in Combustion – Technical Meet-ing of the Eastern States Section of the Combustion
Institute (Pennsylvania State University, UniversityPark 2003)
20.211 L.A. Melton: Spectrally separated fluorescenceemissions for Diesel fuel droplets and vapor, Appl.Opt. 22, 2224–2226 (1983)
20.212 A. Lozano, B. Yip, R.K. Hanson: Acetone: A tracerfor concentration measurements in gaseous flowsby planar laser-induced fluorescence, Exp. Fluids13, 369–376 (1992)
20.213 F. Großmann, P.B. Monkhouse, M. Ridder, V. Sick,J. Wolfrum: Temperature and pressure depen-dences of the laser-induced fluorescence ofgas-phase acetone and 3-pentanone, Appl. Phys.B 62, 249–253 (1996)
20.214 L. Yuen, J. Peters, R. Lucht: Pressure dependenceof laser-induced fluorescence from acetone, Appl.Opt. 36, 3271–3277 (1997)
20.215 F. Ossler, M. Alden: Measurements of picosec-ond laser-induced fluorescence from gas-phase3-pentanone and acetone: Implications to com-bustion diagnostics, Appl. Phys. B 64, 493–502(1997)
20.216 J.D. Koch, R.K. Hanson: Temperature and exci-tation wavelength dependencies of 3-pentanoneabsorption and fluorescence for PLIF applications,Appl. Phys. B 76, 319–324 (2003)
20.217 J.B. Gandhi, P.G. Felton: On the fluorescent behav-ior of ketones at high temperatures, Exp. Fluids 21,143–144 (1996)
20.218 J.D. Koch, R.K. Hanson: Ketone photophysics forquantitative PLIF imaging, AIAA paper 2001-0413(2001)
20.219 N.P. Tait, D.A. Greenhalgh: 2D laser induced flu-orescence imaging of parent fuel fraction innonpremixed combustion, Proc. Combust. Inst. 24,1621–1628 (1992)
20.220 D. Wolff, H. Schlüter, V. Beushausen, P. Andresen:Quantitative determination of fule air mixture dis-tributions in an internal combustion engine usingPLIF of acetone, Ber. Bunsenges. Phys. Chem. 97,1738–1741 (1993)
20.221 M. Berckmuller, N. Tait, R. Lockett, D. Green-halgh: In-cylinder crank-angle-resolved imagingof fuel concentration in a firing spark-ignitionengine using planar laser-induced fluorescence,Proc. Combust. Inst. 25, 151–156 (1994)
20.222 M. Dawson, S. Hochgreb: Liquid Fuel Visualiza-tion Using Laser-Induced Fluorescence During ColdStart, SAE Techn. Paper Ser. 982466 (1998)
20.223 R.M. Green, L.D. Cloutman: Planar LIF observationsof unburned fuel escaping the upper ring-landcrevice in an SI engine, SAE Techn. Paper Ser.970823 (1997)
20.224 R. Bryant, J.F. Driscoll: Acetone laser induced flu-orescence for low pressure, low temperature flowvisualization, Exp. Fluids 28, 417–476 (2000)
20.225 H. Neij, B. Johansson, M. Aldén: Development anddemonstration of 2D-LIF for studies of mixture
PartC
20

1308 Part C Specific Experimental Environments and Techniques
preparation in SI engines, Combust. Flame 99,449–457 (1994)
20.226 A. Arnold, A. Buschmann, B. Cousyn, M. Decker,V. Sick, F. Vannobel, J. Wolfrum: Simultaneousimaging of fuel and hydroxyl radicals in an in-linefour cylinder SI engine, SAE Trans. 102, 1–9 (1993)
20.227 A. Arnold, H. Becker, R. Suntz, P. Monkhouse,J. Wolfrum, R. Maly, W. Pfister: Flame front imag-ing in an internal-combustion engine simulator bylaser-induced fluorescence of acetaldehyde, Opt.Lett. 15, 831–833 (1990)
20.228 J.C. Swindal, D.P. Dragonetti, R.T. Hahn, P.A. Fur-man, W.P. Acker: In-cylinder charge homogeneityduring cold-start studied with fluorescent tracerssimulating different fuel distillation temperatures,SAE Techn. Paper Ser. 950106 (1995)
20.229 D.A. Hansen, E.K.C. Lee: Radiative and nonradia-tive transitions in the first excited singlet state ofsimple linear aldehydes, J. Chem. Phys. 62, 3272–3277 (1975)
20.230 D.A. Hansen, E.K. Lee: Radiative and nonradiativetransistions in the first excited singlet state of sym-metrical methyl-substituted acetones, J. Chem.Phys. 62, 183–189 (1975)
20.231 A. Gandini, K. Kutschke: Primary process in photol-ysis of hexafluoroacetone vapour, 2. Fluorescenceand phosphorescence, Proc. R. Soc. London Ser. A306, 511 (1968)
20.232 A. Gandini, K.O. Kutschke: The effect of mercury onthe triplet state of hexafluoroacetone, Ber. Bun-senges. Phys. Chem 72, 296–301 (1968)
20.233 H. Okabe, W.A. Noyes: The relative intensities offluorescence and phosphorescence in biacetyl va-por, J. Am. Chem. Soc. 79, 810–806 (1957)
20.234 H.W. Sidebottom, C.C. Badcock, J.G. Calvert,B.R. Rabe, E.K. Damon: Lifetime studies of the bi-acetyl excited singlet and triplet states in the gasphase at 25°C, J. Am. Chem. Soc. 94, 13–19 (1972)
20.235 J.B. Liu, Q. Pan, C.S. Liu, J.R. Shi: Principles of flowfield diagnostics by laser-induced biacetyl phos-phorescence, Exp. Fluids 6, 505–513 (1988)
20.236 P. Pringsheim: Fluorescence and Phosphorescence(Interscience, New York 1949)
20.237 T. Itoh, A. Kakuho, H. Hishinuma, T. Urushi-hara, Y. Takagi, K. Horie, M. Asano, E. Ogata,T. Yamashita: Development of a New CompoundFuel and Fluorescent Tracer Combination for Usewith Laser Induced Fluorescence (Nissan MotorCo./University of Tokyo, Tokyo 1995)
20.238 P.G. Felton, F.V. Bracco, M.E.A. Bardsley: On thequantitative application of exciplex fluorescence toengine sprays, SAE Techn. Paper Ser. 930870 (1993)
20.239 A.P. Fröba, F. Rabenstein, K.U. Münch, A. Leipertz:Mixture of triethylamine and benzene as a newseeding material for the quantitative two-dimensional laser-induced exciplex fluorescenceimaging of vapor and liquid fuel inside SI engines,Combust. Flame 112, 199–209 (1998)
20.240 J.B. Ghandhi, P.G. Felton, D.F. Gajdezko,F.V. Bracco: Investigation of the fuel distribution ina two-stroke engine with an air-assisted injector,SAE Techn. Paper Ser. 940394 (1994)
20.241 M. Richter, B. Axelsson, K. Nyholm, M. Aldén: Real-time calibration of planar laser-induced fluores-cence air-fuel ratio measurements in combustionenvironments using in situ Raman scattering, Proc.Combust. Inst 27, 51–57 (1998)
20.242 D. Frieden, V. Sick, J. Gronki, C. Schulz: Quantitativeoxygen imaging in an engine, Appl. Phys. B 75,137–141 (2002)
20.243 J.C. Sacadura, L. Robin, F. Dionnet, D. Gervais,P. Gastaldi, A. Ahmed: Experimental investigationof an optical direct injection SI engine using FARLIF,SAE Techn. Paper Ser. 2000-01-1794 (2000)
20.244 W. Koban, J.D. Koch, R.K. Hanson, C. Schulz: Ab-sorption and fluorescence of toluene vapor atelevated temperatures, Phys. Chem. Chem. Phys.6, 2940–2945 (2004)
20.245 W. Koban, J.D. Koch, V. Sick, N. Wermuth, R.K. Han-son, C. Schulz: Predicting LIF signal strength fortoluene and 3-pentanone under engine-relatedtemperature and pressure conditions, Proc. Com-bust. Inst. 30, 1545–1553 (2005)
20.246 W. Koban, C. Schulz: Toluene as a tracer forfuel, temperature and oxygen concentrations, SAETechn. Paper Ser. 2005-01-2091 (2005)
20.247 M. Schütte, H. Finke, G. Grünefeld, S. Krüger,P. Andresen, B. Stiebels, B. Block, H. Meyer,W. Hentschel: Spatially resolved air/fuel ratio andresidual gas measurements by sponaneous Ra-man scattering in a firing direct injection fasolineengine, SAE Techn. Paper Ser. 2000-01-1795 (2000)
20.248 B. Mewes, G. Bauer, D. Brüggemann: Fuel va-por measurements by linear Raman spectroscopyusing spectral discriminattion from droplet inter-ferences, Appl. Opt. 38, 1040–1045 (1999)
20.249 G. Grünefeld, V. Beushausen, P. Andresen,W. Hentschel: Spatially resolved Raman scatter-ing for multi-species and temperature analysisin technically applied combustion systems: Sprayflame and four-cylinder in-line engine, Appl.Phys. B. 58, 333–342 (1994)
20.250 R. A. L. Tolboom, N. M. Sijtsema, N. J. Dam, J.J. t. Meulen, J. M. Mooij, J. D. M. Maassen: 2Dstoichiometries from snapshot Raman measure-ments, in 40th AIAA Aerospace Sciences Meeting.AIAA paper 2002-0400
20.251 D.C. Kyritsis, P.G. Felton, F.V. Bracco: On the fea-sibility of quantitative, single-shot, spontaneousRaman imaging in an optically accessible enginecylinder, SAE Techn. Paper Ser. 1999-01-3537 (1999)
20.252 D. Geyer: 1D Raman/Rayleigh experiments in aturbulent opposed jet, PhD Thesis (TU Darmstadt,Darmstadt 2004)
20.253 C. Schulz, V. Sick, J. Wolfrum, V. Drewes, M. Zahn,R. Maly: Quantitative 2D single-shot imaging of
PartC
20

Combustion Diagnostics References 1309
NO concentrations and temperatures in a transpar-ent SI engine, Proc. Combust. Inst. 26, 2597–2604(1996)
20.254 J. Engström, J. Nygren, M. Aldén, C.F. Kamin-ski: Two-line atomic fluorescence as a temperatureprobe for highly sooting flames, Opt. Lett. 25,1469–1471 (2000)
20.255 A. Arnold, B. Lange, T. Bouché, Z. Heitzmann,G. Schiff, W. Ketterle, P. Monkhouse, J. Wolfrum:Absolute temperature fields in flames by 2D-LIF ofOH using excimer lasers and CARS spectroscopy, Ber.Bunsenges. Phys. Chem. 96, 1388–1392 (1992)
20.256 M.C. Thurber, F. Griseh, R.K. Hanson: Temperatureimaging with single- and dual wavelength acetoneplanar laser-induced fluorescence, Opt. Lett. 22,251–253 (1997)
20.257 N.P. Tait, D.A. Greenhalgh: PLIF imaging of fuelfraction in practical devices and LII imaging of soot,Ber. Bunsenges. Phys. Chem. 97, 1619–1625 (1993)
20.258 J. Kazenwadel, W. Koban, T. Kunzelmann,C. Schulz: Fluorescence imaging of natural gas/airmixing without tracers added, Chem. Phys. Lett.345, 259–264 (2001)
20.259 W. Koban, C. Schulz: FAR-LIF: Myth and Reality.In: European Combustion Meeting (The CombustionInstitute, Louvain-la-Neuve 2005)
20.260 K. Kikuchi, C. Sato, M. Watabe, H. Ikeda, Y. Taka-hashi, T. Miyashi: New aspects on fluorescencequenching by molecular oxygen, J. Am. Chem. Soc.115, 5180–5184 (1993)
20.261 C. Schulz, J.B. Jeffries, D.F. Davidson, J.D. Koch,J. Wolfrum, R.K. Hanson: Impact of UV absorp-tion by CO2 and H2O on NO LIF in high-pressurecombustion applications, Proc. Combust. Inst. 29,2725–2742 (2002)
20.262 C.T. Bowman: Control of combustion-generatednitrogen oxide emissions: Technology driven byregulation, Proc. Combust. Inst. 24, 859–878 (1994)
20.263 A.M. Wodtke, M. Huwel, H. Schlüter, G. Meijer,P. Andresen, H. Voges: High-sensitivity detectionof NO in a flame using a tunable ArF laser, Opt.Lett. 13, 910–912 (1988)
20.264 C. Schulz, B. Yip, V. Sick, J. Wolfrum: A laser-induced fluorescence scheme for imaging nitricoxide in engines, Chem. Phys. Lett. 242, 259–264(1995)
20.265 M.D. DiRosa, K.G. Klavuhn, R.K. Hanson: LIF spec-troscopy of NO and O2 in high-pressure flames,Comb. Sci. Tech. 118, 257–283 (1996)
20.266 W.P. Partridge Jr., M.S. Klassen, D.D. Thom-sen, N.M. Laurendeau: Experimental assessmentof O2 interferences on laser-induced fluores-cence measurements of NO in high-pressure, leanpremixed flames by use of narrow-band andbroadband detection, Appl. Opt. 34, 4890–4904(1996)
20.267 P. Jamette, P. Desgroux, V. Ricordeau, B. De-schamps: Laser-induced fluorescence detection of
NO in the combustion chamber of an optical GDIengine with A-X(0,1) excitation, SAE Techn. PaperSer. 2001-01-1926 (2001)
20.268 W.G. Bessler, C. Schulz, T. Lee, J.B. Jeffries,R.K. Hanson: Laser-induced-fluorescence detec-tion of nitric oxide in high-pressure flames withA-X(0,1) excitation. In: Proc. Western States Sectionof the Combustion Institute Spring Meeting (TheCombustion Institute, Oakland 2001)
20.269 C. Schulz, J.D. Koch, D.F. Davidson, J.B. Jeffries,R.K. Hanson: Ultraviolet absorption spectra ofshock-heated carbon dioxide and water between900 and 3050 K, Chem. Phys. Lett. 355, 82–88(2002)
20.270 F. Hildenbrand, C. Schulz: Measurements and sim-ulation of in-cylinder UV-absorption in sparkignition and Diesel engines, Appl. Phys. B 73, 165–172 (2001)
20.271 A.O. Vyrodow, J. Heinze, M. Dillmann, U.E. Meier,W. Stricker: Laser-induced fluorescence thermom-etry and concentration measurements on NO A-X(0,0) transitions in the exhaust gas of high pressureCH4/air flames, Appl. Phys. B. 61, 409–414 (1995)
20.272 A. Bräumer, V. Sick, J. Wolfrum, V. Drewes,M. Zahn, R. Maly: Quantitative two-dimensionalmeasurements of nitric oxide and temperaturedistributions in a transparent square piston SI en-gine, SAE Techn. Paper Ser. 952462 (1995)
20.273 J.B. Jeffries, C. Schulz, D.W. Mattison, M. Oehl-schlaeger, W.G. Bessler, T. Lee, D.F. Davidson,R.K. Hanson: UV absorption of CO2 for temperaturediagnostics of hydrocarbon combustion applica-tions, Proc. Combust. Inst. 30, 1591–1599 (2005)
20.274 C. Schulz, V. Sick, J. Heinze, W. Stricker: Laser-induced fluorescence detection of nitric oxide inhigh-pressure flames using A-X(0,2) excitation,Appl. Opt. 36, 3227–3232 (1997)
20.275 F. Hildenbrand, C. Schulz, M. Hartmann, F. Puch-ner, G. Wawrschin: In-cylinder NO-LIF imaging ina realistic GDI engine using KrF excimer laser exci-tation, SAE Techn. Paper Ser. 1999-01-3545 (1999)
20.276 M. Hofmann, H. Kronemayer, B.F. Kock, H. Jan-der, C. Schulz: Laser-induced incandescence andmulti-line NO-LIF thermometry for soot diagnosticsat high pressures. In: European Combustion Meet-ing (The Combustion Institute, Louvain-la-Neuve2005)
20.277 W.G. Bessler, C. Schulz, T. Lee, D.I. Shin, M. Hof-mann, J.B. Jeffries, J. Wolfrum, R.K. Hanson:Quantitative NO-LIF imaging in high-pressureflames, Appl. Phys. B 75, 97–102 (2002)
20.278 T. Lee, W.G. Bessler, H. Kronemayer, C. Schulz,J.B. Jeffries, R.K. Hanson: Quantitative tempera-ture measurements in high-pressure flames withmulti-line nitric oxide (NO)-LIF thermometry. In:4th Joint Meeting of the U.S. Sections of the Com-bustion Institute (Drexel University, Philadelphia2005)
PartC
20

1310 Part C Specific Experimental Environments and Techniques
20.279 W.G. Bessler, C. Schulz, T. Lee, J.B. Jeffries,R.K. Hanson: Strategies for laser-induced fluores-cence detection of nitric oxide in high-pressureflames. I. A-X(0,0) excitation, Appl. Opt. 41, 3547–3557 (2002)
20.280 W.G. Bessler, C. Schulz, T. Lee, J.B. Jeffries,R.K. Hanson: Strategies for laser-induced fluores-cence detection of nitric oxide in high-pressureflames. II. A-X(0,1) excitation, Appl. Opt. 42, 2031–2042 (2003)
20.281 W.G. Bessler, C. Schulz, V. Sick, J.W. Daily: A versa-tile modeling tool for nitric oxide LIF spectra. In: 3rdJoint Meeting of the US Sections of the CombustionInstitute (The Combustion Institute, Chicago 2003)
20.282 M. Tamura, J. Luque, J.E. Harrington, P.A. Berg,G.P. Smith, J.B. Jeffries, D.R. Crosley: Laser-induced fluorescence of seeded nitric oxide asa flame thermometer, Appl. Phys. B 66, 503–510(1998)
20.283 W. Bessler, F. Hildenbrand, C. Schulz: Vibra-tional temperature imaging using two-line laser-induced fluorescence of seeded NO. In: LaserApplications to Chemical and environmental anal-ysis, OSA Technical Digest Series, Vol. 3 (Opt. Soc.Am., Washington 2000) pp. 149–151
20.284 R. Cattolica: OH rotational temperature from two-line laser-excited fluorescence, Appl. Opt. 20,1156–1166 (1981)
20.285 J.W. Daily, W.G. Bessler, C. Schulz, V. Sick: Roleof non-stationary collisional dynamics in deter-mining nitric oxide LIF spectra, AIAA 2004-0389(2004)
20.286 T. Lee, W.G. Bessler, C. Schulz, M. Patel, J.B. Jeffries,R.K. Hanson: UV planar laser-induced fluorescenceimaging of hot carbon dioxide in a high-pressureflame, Appl. Phys. B 79, 427–430 (2004)
20.287 H. Kronemayer, W. Bessler, C. Schulz: Gas-phasetemperature measurements in evaporating spraysand spray flames based on NO multiline LIF, Appl.Phys. B 81, 1071–1074 (2005)
20.288 T. Lee, W.G. Bessler, H. Kronemayer, C. Schulz,J.B. Jeffries: Quantitative temperature measure-ments in high-pressure flames with multi-linenitric oxide (NO)-LIF thermometry, Appl. Opt. 31,6718–6728 (2005)
20.289 I. Düwel, H.-W. Ge, H. Kronemayer, R.W. Dib-ble: Experimental and numerical characterizationof a turbulent spray flame, Proc. Combust. Inst. 31,2247–2255 (2007)
20.290 W.G. Bessler, C. Schulz, M. Hartmann, M. Schenk:Quantitative in-cylinder NO-LIF imaging ina direct-injected gasoline engine with exhaust gasrecirculation, SAE Techn. Paper Ser. 2001-01-1978(2001)
20.291 C. Schulz, J. Wolfrum, V. Sick: Comparative studyof experimental and numerical NO profiles in SIcombustion, Proc. Combust. Inst. 27, 2077–2084(1998)
20.292 F. Hildenbrand, C. Schulz, V. Sick, H. Jander,H.G. Wagner: Applicability of KrF excimer laserinduced fluorescence in sooting high-pressureflames, in VDI Flammentag Dresden, VDI Berichte1492, 269–274 (1999)
20.293 F. Hildenbrand, C. Schulz, J. Wolfrum, F. Keller,E. Wagner: Laser diagnostic analysis of NO for-mation in a direct injection Diesel engine withpump-line nozzle and common-rail injection sys-tems, Proc. Combust. Inst. 28, 1137–1144 (2000)
20.294 F. Hildenbrand, C. Schulz, V. Sick, G. Josefs-son, I. Magnusson, Ö. Andersson, M. Aldén: Laserspectroscopic invesitigation of flow fields and NO-formation in a realistic SI engine, SAE Techn. PaperSer. 980148 (1998)
20.295 A. D’Alessio: Laser light scattering and fluorescencediagnostics of rich flames produced by gascons andliquid fuels. In: Particulate carbon: Formation dur-ing combustion, ed. by D.C. Siegla, G.W. Smith(Plenum, New York 1981) p. 207
20.296 R.W. Weeks, W.W. Duley: Aerosol-particle sizesfrom light emission during excitation by TEA CO2
laser pulses, J. Appl. Phys 45, 4661–4662 (1973)20.297 A.C. Eckbreth: Effects of laser-modulated particle
incandescence on Raman scattering diagnostics, J.Appl. Phys. 48, 4473–4479 (1977)
20.298 L.A. Melton: Soot diagnostics based on laser heat-ing, Appl. Opt. 23, 2201–2208 (1984)
20.299 T. Ni, J.A. Pinson, S. Gupta, R.J. Santoro: Two-dimensional imaging of soot volume fraction bythe use of laser-induced incandescence, Appl. Opt.34, 7083–7091 (1995)
20.300 D.J. Bryce, N. Ladommatos, H. Zhao: Quantitativeinvestigation of soot distribution by laser-inducedincandescence, Appl. Opt. 39, 5012–5022 (2000)
20.301 C.R. Shaddix, K.C. Smyth: Laser-induced incandes-cence measurements of soot production in steadyand flickering methane, propane, and ethylenediffusion flames, Combust. Flame 107, 418–452(1996)
20.302 P.O. Witze, S. Hochgreb, D. Kayes, H.A. Michelsen,C.R. Shaddix: Time-resolved laser-induced incan-descence and laser elastic-scattering measure-ments in a propane diffusion flame, Appl. Opt. 40,2443–2452 (2001)
20.303 B. Quay, T.-W. Lee, T. Ni, R.J. Santoro: Spatially re-solved measurements of soot volume fraction usinglaser-induced incandescence, Combust. Flame 97,384–392 (1994)
20.304 J. Appel, B. Jungfleisch, M. Marquardt, R. Suntz,H. Bockhorn: Assessment of soot volume fractionsfrom laser-induced incandescence by compari-son with extinction measurements in laminar,premixed, flat flames, Proc. Combust. Inst. 26,2387–2395 (1996)
20.305 B. Axelsson, R. Collin, P.-E. Bengtsson: Laser-induced incandescence for soot particle size and
PartC
20
Combustion Diagnostics References 1311
volume fraction measurements using on-line ex-tinction calibration, Appl. Phys. B 72, 367–372(2001)
20.306 H. Geitlinger, T. Streibel, R. Suntz, H. Bockhorn:Two-dimensional imaging of soot volume frac-tions; particle number densities; and particle radiiin laminar and turbulent diffusion flames, Proc.Combust. Inst. 27, 1613–1621 (1998)
20.307 T.R. Meyer, S. Roy, V.M. Belovich, E. Corpo-ran, J.R. Gord: Simultaneous planar laser-inducedincandescence, OH planar laser-induced fluo-rescence, and droplet Mie scattering in swirl-stabilized spray flames, Appl. Opt. 44, 445–454(2005)
20.308 H. Bockhorn, H. Geitlinger, B. Jungfleisch, T. Lehre,A. Schön, T. Streibel, R. Suntz: Progress in charac-terization of soot formation by optical methods,Phys. Chem. Chem. Phys. 4, 3780–3793 (2002)
20.309 S. Will, S. Schraml, A. Leipertz: Comprehensivetwo-dimensional soot diagnostics based on laser-induced incandescence, Proc. Combust. Inst. 26,2277–2284 (1996)
20.310 S. Will, S. Schraml, K. Bader, A. Leipertz: Perfor-mance characteristics of soot primary particle sizemeasurements by time-resolved laser-induced in-candescence, Appl. Opt. 37, 5647–5658 (1998)
20.311 B. Axelsson, R. Collin, P.-E. Bengtsson: Laser-induced incandescence for soot particle sizemeasurements in premixed flat flames, Appl. Opt.39, 3683–3690 (2000)
20.312 T. Lehre, B. Jungfleisch, R. Suntz, H. Bock-horn: Size distributions of nanoscaled particlesand gas temperatures from time-resolved laser-induced-incandescence measurements, Appl. Opt.42, 2021–2030 (2003)
20.313 D. Woiki, A. Giesen, P. Roth: Time-resolved laser-induced incandescence for soot particle sizingduring acetylene pyrolysis behind shock waves,Proc. Combust. Inst. 28, 2531–2537 (2000)
20.314 R.L. Vander Wal, T.M. Ticich, A.B. Stephens: Cansoot primary particle size be determined usinglaser-induced incandescence?, Combust. Flame116, 291–296 (1999)
20.315 B.F. Kock, T. Eckhardt, P. Roth: In-cylinder sizingof Diesel particles by time-resolved laser-inducedincandescence (TR-LII), Proc. Combust. Inst. 29,2775–2781 (2002)
20.316 D.R. Snelling, G.J. Smallwood, R.A. Sawchuk,W.S. Neill, D. Gareau, D.J. Clavel, W.L. Chippior,F. Liu, Ö.L. Gülder: In-situ real-time charac-terization of particulate emissions from a Dieselengine exhaust by laser-induced incandescence,SAE Techn. Paper Ser. 2000-01-1994 (2000)
20.317 S. Schraml, S. Will, A. Leipertz: Performance char-acteristics of TIRE-LII soot diagnostics in exhaustgases of Diesel engines, SAE Techn. Paper Ser.2000-01-2002 (2000)
20.318 R.L. Vander Wal, T.M. Ticich, J.R. West Jr.:Laser-induced incandescence applied to metalnanostructures, Appl. Opt. 38, 5867–5879 (1999)
20.319 B.F. Kock, C. Kayan, J. Knipping, H.R. Orthner,P. Roth: Comparison of LII and TEM sizing duringsynthesis of iron particle chains, Proc. Combust.Inst. 30, 1689–1697 (2005)
20.320 T. Lehre, R. Suntz, H. Bockhorn: Time-resolvedtwo-color LII: size distributions of nano-particlesfrom gas-to-particle synthesis, Proc. Combust.Inst. 30, 2585–2593 (2005)
20.321 R.L. Vander Wal: Laser-induced incandescence:Detection issues, Appl. Opt. 35, 6548–6559 (1996)
20.322 B. Mewes, J.M. Seitzman: Soot volume fraction andparticle size measurements with laser-induced in-candescence, Appl. Opt. 36, 709–717 (1997)
20.323 M. Hofmann, W.G. Bessler, C. Schulz, H. Jander:Laser-induced incandescence (LII) for soot diag-nostics at high pressure, Appl. Opt. 42, 2052–2062(2003)
20.324 P.-E. Bengtsson, M. Aldén: Soot-visualizationstrategies using laser techniques, Appl. Phys. B 60,51–59 (1995)
20.325 C. Schoemaecker Moreau, E. Therssen, X. Mercier,J.F. Pauwels, P. Desgroux: Two-color laser-inducedincandescence and cavity ring-down spectroscopyfor sensitive and quantitative imaging of soot andPAHs in flames, Appl. Phys. B 78, 485–492 (2004)
20.326 K.C. Smyth, C.R. Shaddix: The elusive history ofm = 1.57 - 0.56i for the refractive index of soot,Combust. Flame 107, 314–320 (1996)
20.327 D.R. Snelling, G.J. Smallwood, F. Liu, Ö.L. Gülder,W.D. Bachalo: A calibration-independent LII tech-nique for soot measurement by detecting abolutelight intensity, Appl. Opt. 44, 6773–6785 (2005)
20.328 C. Schulz, B.F. Kock, M. Hofmann, H.A. Michelsen,S. Will, B. Bongie, R. Suntz, G. Smallwood: Laser-induced incandescence: Recent trends and currentquestions, Appl. Phys. B 83, 333–354 (2006)
20.329 D. R. Snelling, F. Liu, G. J. Smallwood, L. Ö. Gülder:Evaluation of the nanoscale heat and mass transfermodel of LII: Prediction of the excitation inten-sity. In: 34th National Heat Transfer Conference(Pittsburgh 2000)
20.330 B.F. Kock, B. Tribalet, C. Schulz, P. Roth: Two-colortime-resolved LII applied to soot particle sizing inthe cylinder of a Diesel engine, Combust. Flame147, 79–92 (2006)
20.331 D.L. Hofeldt: Real-time soot concentration meas-urement technique for engine exhaust streams,SAE Techn. Paper Ser. 930079 (1993)
20.332 H. Bladh, P.-E. Bengtsson: Characteristics of laser-induced incandescence from soot in studies ofa time-dependent heat and mass-transfer model,Appl. Phys. B 78, 241–248 (2004)
20.333 H.A. Michelsen: Understanding and predicting thetemporal response of laser-induced incandescence
PartC
20

1312 Part C Specific Experimental Environments and Techniques
from carbonaceous particles, J. Chem. Phys. 118,7012–7045 (2003)
20.334 D.R. Snelling, F. Liu, G.J. Smallwood, L. Ö. Gülder:Determination of the soot absorption functionand thermal accomodation coefficient using low-fluence LII in a laminar coflow ethylene diffusionflame, Combust. Flame 136, 180–190 (2004)
20.335 H.A. Michelsen, F. Lin, B.F. Kock, H. Bladh,A. Boiarcinc, M. Charwoth, T. Dreier, R. Hadef,M. Hofmann, J. Reimann, S. Will, P.-E. Bengtsson,H. Bockhorn, F. Foncher, K.-P. Geigle, C. Mounaïm-Rousselle, C. Schulz, R. Stirn, B. Tribalet, S. Suntz:Modeling laser-induced incandescence of soot: Asummary and comparison of LII models, Appl. Phys.B 87, 503–521 (2007)
20.336 M. Hofmann, B. Kock, C. Schulz: A web-based in-terface for modeling laser-induced incandescence(LIISim). In: Proceedings of the European Combus-tion Meeting, Chania, Greece, 2007 The CombustionInstitute
20.337 R.W. Dibble, R.E. Hollenbach: Laser Rayleigh ther-mometry in turbulent flames, Proc. Combust. Inst.18, 1489–1499 (1981)
20.338 C. Espey, J.E. Dec, T.A. Litzinger, D.A. Santavicca:Planar laser Rayleigh scattering for quantitativevapor-fuel imaging in a Diesel jet, Combust. Flame109, 65–86 (1997)
20.339 Ö. Andersson, R. Collin, M. Aldén, R. Egnell: Quanti-tative imaging of equivalence ratios in DME spraysusing a chemically preheated combustion vessel,SAE Techn. Paper Ser. 2000-01-2785 (2000)
20.340 C. Schulz, J. Gronki, S. Andersson: Multi-specieslaser-based imaging measurements in a Dieselspray, SAE Techn. Paper Ser. 2004-01-1917 (2004)
20.341 S. Vogel, C. Hasse, J. Gronki, S. Andersson, N. Pe-ters, J. Wolfrum, C. Schulz: Numerical simulationand laser-based imaging of mixture formation, ig-nition and soot formation in a Diesel spray, Proc.Combust. Inst. 30, 2029–2036 (2005)
20.342 A.I. Vogel: Physical properties and chemical con-stitution of aliphatic hydrocarbons, J. Chem. Soc.9, 133–142 (1946)
20.343 R.C. Weast: Handbook of Chemistry and Physics,54th edn. (CRC, Cleveland 1973)
20.344 Landolt-Börnstein: Eigenschaften der Materiein ihren Aggregatzuständen. Tabellen (Springer,Berlin, Heidelberg 1962)
20.345 J.R. Partington: An Advanced Treatise on PhysicalChemistry, Vol. 9 (Longmans, Green, London 1953)
20.346 W.C. Gardiner, Y. Hidaka, T. Tanzawa: Refractivityof combustion gases, Combust. Flame 40, 213–219(1981)
20.347 D. Hoffman, K.-U. Münch, A. Leipertz: Two-dimensional temperature determination in sootingflames by filtered Rayleigh scattering, Opt. Lett. 21,525–527 (1996)
20.348 F. Beyrau, A. Bruer, T. Seeger, A. Leipertz: Gas-phase temperature measurement in the vaporizing
spray of a gasoline direct-injection injector by useof pure rotational coherent anti-Stokes Ramanscattering, Opt. Lett. 29, 247–249 (2004)
20.349 D. Klick, K.A. Marko, L. Rimai: Broadband single-pulse CARS spectra in a fired internal combustionengine, Appl. Opt. 20, 1178–1185 (1981)
20.350 K. Kohse-Höinghaus, R.S. Barlow, M. Aldén, J. Wol-frum: Combustion at the focus: Laser diagnosticsand control, in Proc. Combust. Inst. 30, 89–123(2005)
20.351 P.T. Moseley, J.O.W. Norris, D.E. Williams: Tech-niques and Mechanisms in Gas Sensing (AdamHilger, New York 1991)
20.352 V. Ebert, J. Wolfrum: Absorption Spectroscopy. In:Optical Measurements – Techniques and Applica-tions, 2nd edn., ed. by F. Mayinger, O. Feldmann(Springer, Berlin, Heidelberg 2001) pp. 227–266
20.353 G. Herzberg: The Spectra and Structures of Sim-ple Free Radicals: An Introduction to MolecularSpectroscopy (Dover, New York 1988)
20.354 G. Herzberg: Spectra of Diatomic Molecules, Vol. I,2nd edn. (Krieger, Malobar, FL 1989)
20.355 G. Herzberg: Infrared and Raman Spectra of Poly-atomic Molecules, Vol. II (Krieger, Malobar, FL 1991)
20.356 G. Herzberg: Electronic Spectra of PolyatomicMolecules, Vol. III (Krieger, Malobar, FL 1991)
20.357 J. Wolfrum, T. Dreier, V. Ebert, C. Schulz: Laser-based combustion diagnostics. In: Encyclopedia ofAnalytical Chemistry, ed. by R.A. Meyers (Wiley,Chichester 2000) pp. 2118–2148
20.358 V. Ebert, R. Hemberger, W. Meienburg, J. Wol-frum: In-situ gas analysis with infrared lasers, Ber.Bunsenges. 97, 1527–1534 (1993)
20.359 R. Villarreal, P. Varghese: Frequency-resolved ab-sorption tomography with tunable diode lasers,Appl. Opt. 44, 6786–6795 (2005)
20.360 V. Ebert, C. Schulz, H.R. Volpp, J. Wolfrum,P. Monkhouse: Laser diagnostics of combustionprocesses: from chemical dynamics to technicaldevices, Israel J. Chem. 39, 1–24 (1999)
20.361 V. Ebert, J. Fitzer, I. Gerstenberg, K.U. Pleban,H. Pitz, J. Wolfrum, M. Jochem, J. Martin: Simul-taneous laser-based in situ detection of oxygenand water in a waste incinerator for active com-bustion control purposes, Proc. Combust. Inst. 27,1301–1308 (1998)
20.362 V. Ebert, H. Teichert, P. Strauch, T. Kolb, H. Seifert,J. Wolfrum: High sensitivity in-situ CO-detectionin a 3 MWth rotary kiln for special waste incinera-tion using new 2.3 µm distributed feedback diodelasers, Proc. Combust. Inst. 30, 1611–1618 (2005)
20.363 H. Teichert, T. Fernholz, V. Ebert: Simultaneous insitu measurement of CO, H2O, and gas temper-atures in a full-sized coal-fired power plant bynear-infrared diode lasers, Appl. Opt. 42, 2043–2051 (2003)
20.364 V. Ebert, T. Fernholz, C. Giesemann, H. Pitz,H. Teichert, J. Wolfrum, H. Jaritz: Simultaneous
PartC
20

Combustion Diagnostics References 1313
diode-laser-based in situ detection of mul-tiple species and temperature in a gas-firedpower plant, Proc. Combust. Inst. 28, 423–430(2000)
20.365 D.R. Herriott: Folded optical delay lines, Appl. Opt.4, 883–889 (1965)
20.366 D.R. Herriott, H. Kogelnik, R. Kompfner: Off-axispaths in spherical mirror interferometers, Appl.Opt. 3, 523–526 (1964)
20.367 J.U. White: Long optical path of large aperture, J.Opt. Soc. Am. 32, 285–288 (1942)
20.368 J. White: Very long optical path in air, J. Opt. Soc.Am. 66, 411–416 (1976)
20.369 V. Ebert, H. Teichert, C. Giesemann, H. Saathoff,U. Schurath: Fibre-coupled in-situ laser absorptionspectrometer for the selective detection of watervapor traces down to the ppb-level, Tech. Mess.72, 23–30 (2005)
20.370 W. Gurlit, R. Zimmermann, C. Giesemann, T. Fern-holz, V. Ebert, J. Wolfrum, U. Platt, J.P. Burrows:Lightweight diode laser spectrometer CHILD (com-pact high-altitude in-situ laser diode) for balloon-borne measurements of water vapor and methane,Appl. Opt. 44, 91–102 (2005)
20.371 H.E. Schlosser, J. Wolfrum, V. Ebert, B.A. Williams,R.S. Sheinson, J.W. Fleming: In situ determinationof molecular oxygen concentrations in full-scalefire-suppression tests using tunable diode laserabsorption spectroscopy, Proc. Combust. Inst. 29,353–360 (2002)
20.372 L.F. Mollenauer, J.C. White: Tunable Lasers(Springer, Berlin, Heidelberg 1987)
20.373 F.K. Kneubühl, M.W. Sigrist: Laser (Teubner,Stuttgart 1991)
20.374 L. Ajili, G. Scalari, D. Hofstetter, M. Beck, J. Faist,H. Beere, G. Davies, E. Linfield, D. Ritchie:Continuous-wave operation of far-infrared quan-tum cascade lasers, Electron. Lett. 38, 1675–1676(2002)
20.375 L. Ajili, J. Faist, H. Beere, D. Ritchie, G. Davies,E. Linfield: Loss-coupled distributed feedback far-infrared quantum cascade lasers, Electron. Lett. 41,419–420 (2005)
20.376 R. Köhler, A. Tredicucci, F. Beltram, H.E. Beere,E.H. Linfield, A.G. Davies, D.A. Ritchie, R.C. Iotti,F. Rossi: Terahertz semiconductor-heterostructurelaser, Nature 417, 156–159 (2002)
20.377 T. Tsuboi, N. Arimitsu, D. Ping, J.M. Hartmann: Lightabsorption by hydrocarbon molecules at 3.392 µmof He-Ne laser, Jpn. J. Appl. Phys. 24, 8–13 (1985)
20.378 W.G. Mallard, W.C. Gardiner: Absorption of the3.39 µm He-Ne laser line by methane from 300to 2400 K, Quant. Spectrosc. Radiat. Transfer 20,135–149 (1978)
20.379 R.K. Mongia, E. Tomita, F.K. Hsu, L. Talbot,R.W. Dibble: Use of an optical probe for time-resolved in situ measurement of local air-to-fuelratio and extent of fuel mixing with applicators to
low NOx emissions in premixed gas turbines, Proc.Combust. Inst. 26, 2749–2755 (1996)
20.380 S.A. Trushin: Photoacoustic air pollution monitor-ing with an isotopic CO2 laser, Ber. Bunsenges.Phys. Chem. Chem. Phys. 96, 319–322 (1992)
20.381 P.K. Cheo, C. Zhiping, C. Li, Z. Yi: Applications ofa tunable CO2 sideband laser for high-resolutionspectroscopic measurements of atmospheric gases,Appl. Opt. 32, 836–841 (1993)
20.382 D.E. Cooper, T.F. Gallagher: Frequency modulationspectroscopy with a CO2 laser: results and impli-cations for ultrasensitive point monitoring of theatmosphere, Appl. Opt. 24, 710–716 (1985)
20.383 W. Meienburg, H. Neckel, J. Wolfrum: In-situmeasurement of ammonia concentration in indus-trial combustion systems, Proc. Combust. Inst. 23,231–236 (1990)
20.384 A. Arnold, H. Becker, R. Hemberger, W. Hentschel,W. Ketterle, M. Köllner, W. Meienburg, P. Monk-house, H. Neckel, M. Schäfer, K.P. Schindler, V. Sick,R. Suntz, J. Wolfrum: Laser in-situ monitoring ofcombustion processes, Appl. Opt. 29, 4860–4872(1990)
20.385 R. Hemberger, S. Muris, K.U. Pleban, J. Wolfrum,I.S. Zaslonko, P. Kilpinen, A.E.J. Akanetuk: An ex-perimental and modeling study of the selectivenoncatalytic reduction of NO by ammonia in thepresence of hydrocarbons, Combust. Flame 99,660–668 (1994)
20.386 P. Günter: Nonlinear Optical Effects and Mater-ials, Springer Ser. Opt. Sci, Vol. 72 (Springer, Berlin,Heidelberg 2000)
20.387 J.A. Silver: Frequency modulation spectroscopy fortrace species detection: Theory and comparisonamong experimental methods, Appl. Opt. 31, 707–717 (1992)
20.388 P. Vogel, V. Ebert: Near shot noise detection ofoxygen in the A-band with vertical-cavity surface-emitting lasers, Appl. Phys. B 72, 127–135 (2001)
20.389 M. Tacke: Lead salt lasers. In: Long WavelengthInfrared Emitters Based on Quantum Wells andSuperlattices, ed. by M. Helm (Gordon+Breach,Amsterdam 2000) pp. 347–396
20.390 R. Grisar, G. Schmidke, M. Tacke, G. Restelli: Mon-itoring of Gaseous Pollutants by Tunable DiodeLasers (Kluwer, Dordrecht 1989)
20.391 R.T. Ku, J.O. Sample, E.D. Hinkley: Long-pathmonitoring of atmospheric carbon monoxide witha tunable diode laser system, Appl. Opt. 14, 854–861 (1975)
20.392 S.M. Schoenung, R.K. Hanson: CO and temperaturemeasurements in a flat flame by laser absorptionspectroscopy and probe techniques, Combust. Sci.Technol. 24, 227–237 (1981)
20.393 P.L. Varghese, R.K. Hanson: Collision width meas-urements of CO in combustion gases usinga tunable diode laser, J. Quant. Spectrosc. Radiat.Transfer 26, 339–347 (1981)
PartC
20

1314 Part C Specific Experimental Environments and Techniques
20.394 R.K. Hanson: Absorption spectroscopy in sootingflames using a tunable diode laser, Appl. Opt. 19,482–484 (1980)
20.395 M. Tacke, J.R. Meyer, A.R. Adams: Lead-salt lasers,Philos. T. Roy. Soc. A 359, 547–566 (2001)
20.396 P. Werle: Spectroscopic trace gas analysis usingsemiconductor diode lasers, Spectrochim. Acta A52, 805–822 (1996)
20.397 J.H. Miller, S. Elreedy, B. Ahvazi, F. Woldu, P. Has-sanzadeh: Tunable diode-laser measurement ofcarbon monoxide concentration and temperaturein a laminar methane-air diffusion flame, Appl.Opt. 32, 6082–6089 (1993)
20.398 U. Gustafsson, G. Somesfalean, J. Alnis, S. Svan-berg: Frequency-modulation spectroscopy withblue diode lasers, Appl. Opt. 39, 3774–3780 (2000)
20.399 C. Lin, M. Grau, O.D. and, M.-C. Amann: Lowthreshold room-temperature continuous-waveoperation of 2.24-3.04 µm GaInAsSb/AlGaAsSbquantum-well laser, Appl. Phys. Lett. 84, 5088–5090 (2004)
20.400 V. Ebert, C. Giesemann, J. Koeth, H. Teichert: Newroom-temperature 2.3 µm DFB-diode lasers: Firstspectroscopic characterization and CO-detection.In: Laser Applications to Chemical and Environ-mental Analysis OSA TEchnical Digest Series (Opt.Soc. Am., Washington 2004), Paper TuF-98
20.401 J. Faist, F. Capasso, D.L. Sivco, C. Sirtori,A.L. Hutchinson, A.Y. Cho: Quantum cascade laser,Science 264, 553–555 (1994)
20.402 E. Schlosser, J. Wolfrum, L. Hildebrandt, H. Seifert,B. Oser, V. Ebert: Diode laser based in situ detectionof alkali atoms: development of a new methodfor determination of residence-time distributionin combustion plants, Appl. Phys. B 75, 237–247(2002)
20.403 D. Wandt, M. Laschek, K. Przyklenk, A. Tünner-mann, H. Welling: External cavity laser diode with40 nm continuous tuning range around 825 nm,Opt. Commun. 130, 81–84 (1996)
20.404 V. Ebert, H. Teichert, C. Giesemann, T. Fernholz,E. Schlosser, P. Strauch, H. Seifert, T. Kolb, J. Wol-frum: Rapid multi-parameter in-situ spectrometerfor sensitive detection of CO, O2, H2O and tem-perature in industrial rotary kilns. In: 17. ExternalTECFLAM Seminar Joint Research Project Combus-tion Control and Simulation, ed. by W. Meier (AGTECFLAM, Stuttgart 2003) pp. 122–149
20.405 A.R. Awtry, J.W. Fleming, V. Ebert: Simultaneousdiode laser-based in-situ measurement of liquidwater content and oxygen mole fraction in densewater mist environments, Opt. Lett. 31, 900–902(2006)
20.406 T. Fernholz, H. Teichert, V. Ebert: Digital, phase-sensitive detection for in situ diode-laser spec-troscopy under rapidly changing transmissionconditions, Appl. Phys. B 75, 229–236 (2002)
20.407 V. Ebert, J. Fitzer, I. Gerstenberg, K.-U. Pleban,H. Pitz, J. Wolfrum, M. Jochem, J. Martin: Simul-taneous laser-based in-situ-detection of oxygenand water in a waste incinerator for active com-bustion control purposes, Proc. Combust. Inst. 27,1301–1308 (1998)
20.408 E. Schlosser, T. Fernholz, H. Teichert, V. Ebert:In situ detection of potassium atoms in high-temperature coal-combustion systems using near-infrared-diode lasers, Spectrochim. Acta A 58,2347–2359 (2002)
20.409 M. Grabrysch, C. Corsi, F.S. Pavone, M. Inguscio:Simultaneous detection of CO and CO2using a semi-conductor DFB diode laser at 1.578 µm, Appl. Phys.B 65, 75–79 (1997)
20.410 D.B. Oh, M.E. Paige, D.S. Bomse: Frequency mod-ulation multiplexing for simultaneous detectionof multiple gases by use of wavelength modula-tion spectroscopy with diode lasers, Appl. Opt. 37,2499–2501 (1998)
20.411 L.G. Blevins, B.W. Peterson: Obtaining and in-terpreting near-infrared wavelength modulationabsorption signals from hot fire gases: Practical is-sues. In: Combustion Institute Technical MeetingEastern States Section (Raleigh, NC 1999) pp. 85–88
20.412 L. G. Blevins, W. M. Pitts: Carbon monoxide meas-urement using a near-infrared tunable diodelaser. In: Annual Conference on Fire Research: Bookof Abstracts (1998) pp. 21-22
20.413 K. Muta, M. Tanoura, H. Honda: In-situ meas-urement of CO by tunable diode laser absorptionspectroscopy in a large scale waste test furnace.In: Proc. International Laser Sensing Symposium(Fukui 1999)
20.414 V. Ebert, K. U. Pleban, J. Wolfrum: In-situ oxygen-monitoring using near-infrared diode lasers andwavelength modulation spectroscopy. In: LaserApplications to Chemical and Environmental Anal-ysis, OSA Technical Digest Series (Opt. Soc. Am.,Washington, 1998) p. 206-209
20.415 J.J. Nikkari, J.M. Di Iorio, M.J. Thomson: In situcombustion measurements of CO, H2O and tem-perature with a 1.58 µm diode laser an two-tonefrequency modulation, Appl. Opt. 41, 446–452(2002)
20.416 M.G. Allen, B.L. Upschulte, D.M. Sonnenfroh,W.J. Kessler, P.A. Mulhall: Overview of diodelaser measurement in large-scale test facilities,Proc. Aerodynamic Measurement Technology andGround Testing Conference 21, 2452–2454 (2000)
20.417 D.M. Sonnenfroh, M.G. Allen: Observation of COand CO2 Absorption near 1.57 µm with an external-cavity diode laser, Appl. Opt. 36, 3298–3300 (1997)
20.418 C.E. Wieman, L. Hollberg: Using diode lasers foratomic physics, Rev. Sci. Instrum. 62, 1–20 (1991)
20.419 J.C. Camparo: The diode laser in atomic physics,Contemp. Phys. 26, 443–477 (1985)
PartC
20

Combustion Diagnostics References 1315
20.420 L.C. Philippe, R.K. Hanson: Laser diode wavelength-modulation spectroscopy for simultaneous meas-urement of temperature, pressure, and velocity inshock-heated oxygen flows, Appl. Opt. 32, 6090–6103 (1993)
20.421 S.T. Sanders, D.W. Mattison, L. Ma, J.B. Jeffries,R.K. Hanson: Wavelength-agile diode laser sensingstrategies for monitoring gas properties in opticallyharsh flows: Application in cesium-seeded pulsedetonation engine, Opt. Express 10, 505–514 (2002)
20.422 M.F. Miller, W.J. Kessler, M.G. Allen: Diodelaser-based air mass flux sensor for subsonic aero-propulsion inlets, Appl. Opt. 35, 4905–4912 (1996)
20.423 Z.C. Owens, D.W. Mattison, E.A. Barbour, C.I. Morris,R.K. Hanson: Flowfield characterization and simu-lation validation of multiple-geometry PDEs usingcesium-based velocimetry, Proc. Combust. Inst. 30,2791–2798 (2005)
20.424 E.R. Furlong, D.S. Baer, R.K. Hanson: Combustioncontrol using a multiplexed diode-laser sensorsystem, Proc. Combust. Inst. 26, 2851–2858 (1996)
20.425 R.M. Mihalcea, D.S. Baer, R.K. Hanson: Diode lasersensor for measurements of CO, CO2, and CH4 incombustion flows, Appl. Opt. 36, 8745–8752 (1997)
20.426 R. M. Mihalcea, D. S. Baer, R. K. Hanson: Diode-laser absorption sensor system for combustionmonitoring and control applications. In: AIAA Paper97-3356 (1997)
20.427 D.S. Baer, R.K. Hanson, M.E. Newfield, N.K.J.M. Go-paul: Multiplexed diode-laser sensor system forsimultaneous H2O, O2, and temperature measure-ments, Opt. Lett. 19, 1900–1902 (1994)
20.428 M.G. Allen: Diode laser absorption sensors for gas-dynamic and combustion flows, Meas. Sci. Technol.9, 545–562 (1998)
20.429 D. Wandt, M. Laschek, A. Tünnermann, H. Welling:Continuously tunable external-cavity diode laserwith a double-grating arrangement, Opt. Lett. 22,390–392 (1997)
20.430 A.P. Larson, L. Sandström, S. Höjer, H. Ahlberg,B. Broberg: Evaluation of distributed Bragg re-flector lasers for high-sensitivity near-infrared gasanalysis, Opt. Eng. 36, 117–123 (1997)
20.431 X. Zhou, X. Liu, J. B. Jeffries, R. K. Hanson: DiodeLaser Sensors for Combustion Control. In: AIAA Pa-per 2003–1010 (2003)
20.432 E.R. Furlong, D.S. Baer, R.K. Hanson: Real-timeadaptive combustion control using diode-laserabsorption sensors, Proc. Combust. Inst. 27, 103–111(1998)
20.433 E.R. Furlong, R.M. Mihalcea, M.E. Webber,D.S. Baer, T.P. Parr, R.K. Hanson: Diode-laser sen-sor system for closed-loop control of a 50-kWincinerator, AIAA Paper 97-2833 (1997)
20.434 L. Ma, S.T. Sanders, J.B. Jeffries, R.K. Hanson: Mon-itoring and control of a pulse detonation engineusing a diode-laser fuel concentration and tem-perature sensor, Proc. Combust. Inst. 29, 161–168(2002)
20.435 F. Schuler, F. Rampp, J. Martin, J. Wolfrum: TAC-COS - a thermography-assisted combustion controlsystem for waste incinerators, Combust. Flame 99,431–439 (1994)
20.436 V. Ebert, J. Fitzer, I. Gerstenberg, H. Pitz, K.U. Ple-ban, J. Wolfrum, M. Jochem, J. Martin: Onlinemonitoring of water vapour with a fiber coupledNIR-diode laser spectrometer, VDI Berichte 1366,145–154 (1998)
20.437 J. T. C. Liu, J. B. Jeffries, R. K. Hanson: Diodelaser absorption diagnostics for measurements inpractical combustion flow fields. In: AIAA Paper2003–4581 (2003)
20.438 F. Greger, K.T. Hartinger, P.B. Monkhouse, J. Wol-frum, H. Baumann, B. Bonn: In situ alkaliconcentration measurements in a pressurized flu-idized bed coal combustor by excimer laserinduced fragmentaiton fluorescence, Proc. Com-bust. Inst. 26, 3301–3307 (1996)
20.439 K.T. Hartinger, S. Nord, P.B. Monkhouse: Quench-ing of fluorescence from Na(32P) and K(42P) Atomsfollowing photodissociation of NaCl and KCl at 193nm, Appl. Phys. B 64, 363–367 (1997)
20.440 R.C. Oldenburg, S.L. Baughcum: Photofragmentfluorescence as an analytical technique: applica-tion to gas-phase alkali chlorides, Anal. Chem. 58,1430–1436 (1986)
PartC
20


![Application Package OF GOOD MORAL CHARACTER C.P.R. CARD [Mandatory] STATEMENT OF COMMITMENT INFECTION CONTROL [Signed] DESCRIPTION NUMBER EXP. DATE EXP. DATE EXP. DATE EXP. DATE EXP](https://img.pdfslide.us/doc/110x75/5abd9eef7f8b9a3a428bfa58/application-of-good-moral-character-cpr-card-mandatory-statement-of-commitment.jpg)