Embed Size (px)
Citation preview
Numerical simulation of delamination onset and growth in
laminated composites
G. Wimmer∗, C. Schuecker, H.E. Pettermann
Austrian Aeronautics Research (AAR) / Network for Materials and Engineeringat the
Institute of Lightweight Design and Structural Biomechanics,Vienna University of Technology, Vienna, Austria
October 5, 2006
Abstract
Delamination in fiber reinforced laminated composite structures is analyzed. The numericalsimulation of delamination is divided into creation of a starting delamination and delaminationgrowth. The starting delamination is predicted by a stress based failure criterion developed byPuck. Growth of the starting delamination is modeled by the Virtual Crack Closure Technique.A curved laminate is analyzed to demonstrate the proposed simulation procedure. A linearfinite element analysis is performed to predict the starting delamination, whereas non–linearanalysis are required for the simulation of delamination growth. The effect of the size of thestarting delamination is studied and a critical size is found. From the simulations of the growthof various starting delaminations the maximum bearable load of the structure is predicted.Moreover, structures containing initial delaminations were analyzed, yielding conditions forcrack growth stability. For the verification of the proposed simulation procedure, cohesivezone elements are used and the same results are achieved. However, the proposed simulationprocedure is computationally markedly cheaper than the use of cohesive zone elements.
Keyword: A: Delamination onset, B: Delamination growth, C: virtual crack closure technique, D:Puck criterion, E: FEM simulation, F:fiber reinforced laminates.
1 Introduction
Due to their great potential in weight saving, fiber reinforced laminated composites are becom-ing increasingly important in applications where low weight, high stiffness, and high strength isrequired, in particular the aircraft industry.
∗Vienna University of Technology, Gusshausstr. 27–29/317, 1040 Vienna, Austria; [email protected]
1
Wimmer et al./ Numerical simulation of delamination onset and growth. 2
Due to their complex structure, several failure modes occur in laminated composites. Dependingon the failure location ply failure and delamination are distinguished. Delamination is caused byout–of–plane shear and normal stresses attributed to e.g. impact loads, free edge effects, ply dropoffs, or transverse loading.The formation of a delamination in a flawless structure can be divided into two parts; delamina-tion onset and delamination growth. For the prediction of delamination onset, methods based onmaterial strength have been developed. The interlaminar stress state is computed and a strengthcriterion is utilized to predict onset of delamination, see e.g. Garg [1] for an overview. A specialcase of these methods is the First Ply Failure criterion developed by Puck [2, 3, 4, 5], wheredelamination is interpreted as a special mode of ply failure.For the simulation of delamination growth, methods employing fracture mechanics have been de-veloped. Linear Elastic Fracture Mechanics (LEFM) has been shown to be suitable for predictingdelamination growth when material non–linearities can be neglected [6, 7]. However, LEFM canonly be applied when a starting crack exists. For the prediction of delamination growth methodslike the Virtual Crack Closure Technique (VCCT)[7, 8, 9], the J–integral [10], and the VirtualCrack Extension Technique [11] are used successfully.Another approach for the numerical simulation of delamination is the Cohesive Zone Method(CZM) which uses the framework of damage mechanics and softening. A thin layer of matrixmaterial is assumed to exist between plies. Delamination is interpreted as creation of a cohesivedamage zone [12, 13] in front of the delamination front, separating the adjacent plies. Withinthe Finite Element Method (FEM) traction–separation laws are defined for the interface, see e.g.[14, 15]. The CZM can handle delamination onset as well as delamination growth. However, thismethod is numerically expensive and requires fine meshes in order to represent the damage zoneadequately.To overcome this drawback a combination of a First Ply Failure criterion and a fracture mechanicsapproach is proposed in this paper. The FEM is used to simulate delamination in a structure with-out initial delaminations and flaws. To predict delamination onset the failure criterion developedby Puck is used. Based on the results of the Puck criterion, a starting delamination is created.Growth of this starting delamination is simulated using the VCCT. In addition, growth of initialdelaminations is studied. These delaminations may stem from the production process or previousloadings. The CZM is used for verification of the proposed simulation procedure.
2 Simulation Tools
For the structural analysis the FEM package ABAQUS/Standard (ABAQUS Inc., RI, USA) isused.
2.1 Puck Criterion
Delamination onset in a flawless structure is predicted employing a First Ply Failure criteriondeveloped by Puck [2, 4, 3, 5]. It is a local strength criterion for three–axial stress states at theply level. The criterion is built on a physically based, phenomenological model and is suitable forlong fiber reinforced polymers. The Puck criterion is capable of predicting the risk of failure and
Wimmer et al./ Numerical simulation of delamination onset and growth. 3
the corresponding failure mode. It distinguishes between fiber failure and several modes of MatrixDominated Failure (MDF), where delamination is one of these MDF modes. The delaminationstrengths, typically, are estimated by slightly reducing the transverse ply strengths [3].The criterion has been implemented in ABAQUS as a post processing tool [4, 5]. It evaluatesthe stresses in each Gauss point and predicts the spatial distribution of the risk of failure and thefailure mode.
2.2 Virtual Crack Closure Technique
Delamination growth is modeled by the VCCT which is based on the Griffith crack growth criterionassuming LEFM [7, 8, 9]. According to the Griffith crack growth criterion, a crack grows if theenergy released at crack propagation is equal or larger than the energy required to create new cracksurface. The latter is called ”critical energy release rate” and can be derived from experiments.The central assumption of the VCCT is, that the energy released when the crack is extended bya length, ∆a, and the energy required to close the crack over a length, ∆a, are identical. Thisassumption holds true only, if ∆a is small compared to the total crack length and self similarcrack growth takes place, i. e. the shape of the crack does not change significantly during crackgrowth. The energy rate for closing the crack is computed from the force at the crack tip andthe crack opening displacement. If the computed energy rate is equal or greater than the criticalenergy release rate, the crack propagates.By considering the components of the force and the displacement in the principal directions, themode I, mode II, and mode III energy release rates can be computed. Various criteria have beendeveloped to take the mode mix at the crack tip into account, see e.g. [7, 16] for details. In thepresent paper, a quadratic criterion is used.The VCCT is available as an add on tool for ABAQUS and is implemented as a particular contactcondition [17]. The tool is capable to assess the crack growth conditions and to extend the crackif indicated.
2.3 Simulation Procedure
To model delamination onset and growth, two FEM runs are required. First, a linear simulation isdone to predict a starting delamination (i–iii). Second, a non–linear simulation is performed, de-lamination is triggered and the capabilities for the simulation of delamination growth are switchedon (iv–vi).(i) A linear elastic stress analysis is performed. (ii) The stresses are evaluated using the Puck cri-terion and the location as well as some size of a starting delamination is predicted. The questionwhich size of the starting delamination is critical is discussed in detail in section 3.3. The load fordelamination onset is computed from the highest risk of failure. (iii) At the location where thestarting delamination is predicted, the FEM model is adapted accordingly. (iv) The FEM model isloaded up to the load that corresponds to the size of the starting delamination predicted before.(v) The starting delamination is created by opening the interface while keeping the load constant.(vi) The VCCT tool is activated and if the conditions for delamination growth are fullfilled, thedelamination is extended. Depending on the structure and the prescribed loading stable growth,unstable growth, or no growth can take place.
Wimmer et al./ Numerical simulation of delamination onset and growth. 4
2.4 Cohesive Zone Method
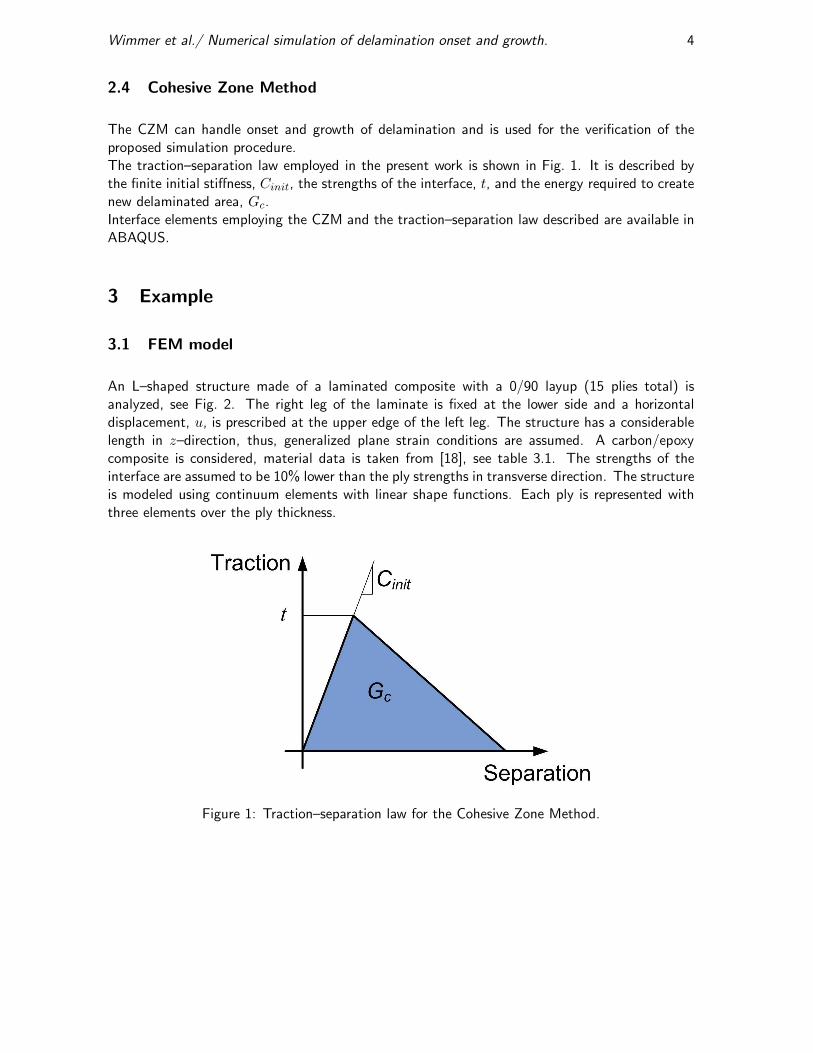
The CZM can handle onset and growth of delamination and is used for the verification of theproposed simulation procedure.The traction–separation law employed in the present work is shown in Fig. 1. It is described bythe finite initial stiffness, Cinit, the strengths of the interface, t, and the energy required to createnew delaminated area, Gc.Interface elements employing the CZM and the traction–separation law described are available inABAQUS.
3 Example
3.1 FEM model
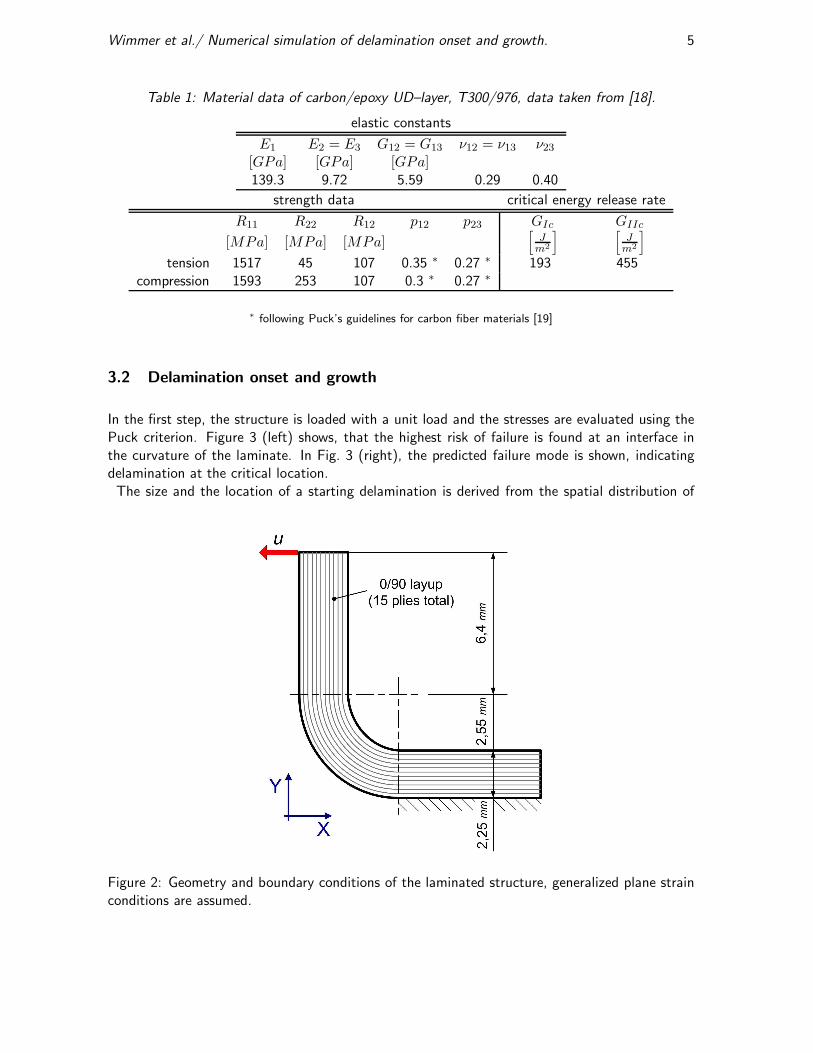
An L–shaped structure made of a laminated composite with a 0/90 layup (15 plies total) isanalyzed, see Fig. 2. The right leg of the laminate is fixed at the lower side and a horizontaldisplacement, u, is prescribed at the upper edge of the left leg. The structure has a considerablelength in z–direction, thus, generalized plane strain conditions are assumed. A carbon/epoxycomposite is considered, material data is taken from [18], see table 3.1. The strengths of theinterface are assumed to be 10% lower than the ply strengths in transverse direction. The structureis modeled using continuum elements with linear shape functions. Each ply is represented withthree elements over the ply thickness.
Figure 1: Traction–separation law for the Cohesive Zone Method.
Wimmer et al./ Numerical simulation of delamination onset and growth. 5
Table 1: Material data of carbon/epoxy UD–layer, T300/976, data taken from [18].
elastic constants
E1 E2 = E3 G12 = G13 ν12 = ν13 ν23
[GPa] [GPa] [GPa]139.3 9.72 5.59 0.29 0.40
strength data critical energy release rate
R11 R22 R12 p12 p23 GIc GIIc
[MPa] [MPa] [MPa][
J
m2
] [
J
m2
]
tension 1517 45 107 0.35 ∗ 0.27 ∗ 193 455compression 1593 253 107 0.3 ∗ 0.27 ∗
∗ following Puck’s guidelines for carbon fiber materials [19]
3.2 Delamination onset and growth
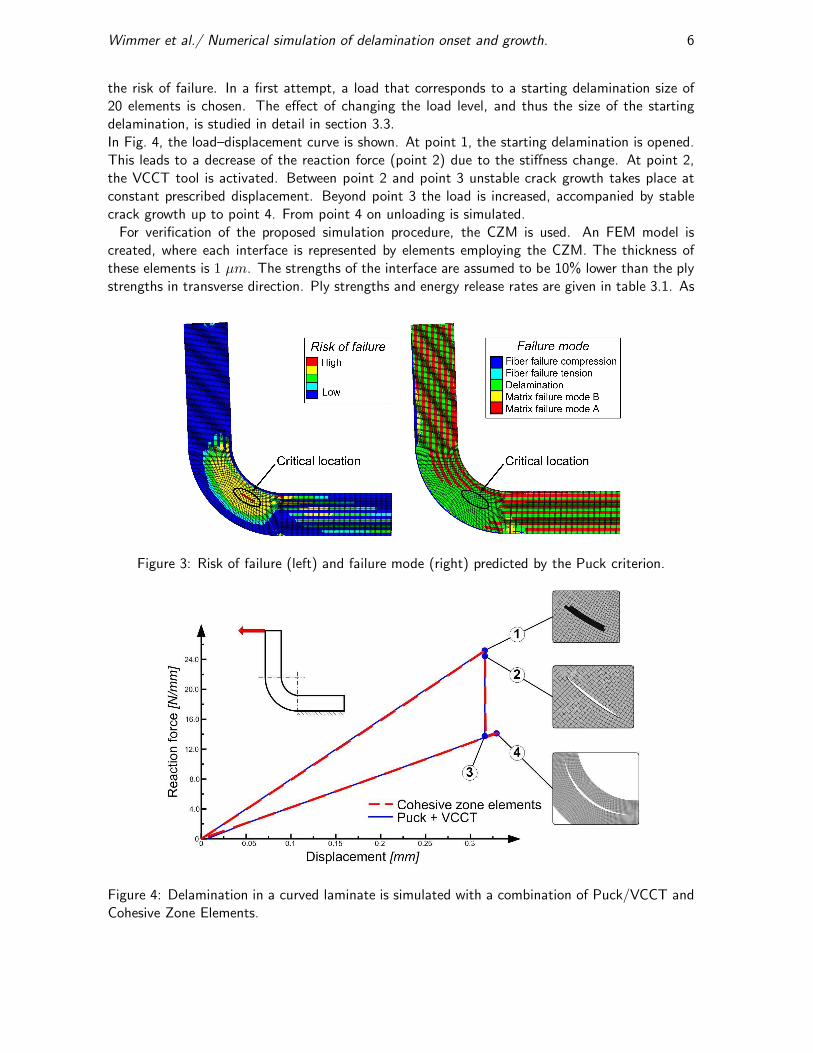
In the first step, the structure is loaded with a unit load and the stresses are evaluated using thePuck criterion. Figure 3 (left) shows, that the highest risk of failure is found at an interface inthe curvature of the laminate. In Fig. 3 (right), the predicted failure mode is shown, indicatingdelamination at the critical location.The size and the location of a starting delamination is derived from the spatial distribution of
Figure 2: Geometry and boundary conditions of the laminated structure, generalized plane strainconditions are assumed.
Wimmer et al./ Numerical simulation of delamination onset and growth. 6
the risk of failure. In a first attempt, a load that corresponds to a starting delamination size of20 elements is chosen. The effect of changing the load level, and thus the size of the startingdelamination, is studied in detail in section 3.3.In Fig. 4, the load–displacement curve is shown. At point 1, the starting delamination is opened.This leads to a decrease of the reaction force (point 2) due to the stiffness change. At point 2,the VCCT tool is activated. Between point 2 and point 3 unstable crack growth takes place atconstant prescribed displacement. Beyond point 3 the load is increased, accompanied by stablecrack growth up to point 4. From point 4 on unloading is simulated.
For verification of the proposed simulation procedure, the CZM is used. An FEM model iscreated, where each interface is represented by elements employing the CZM. The thickness ofthese elements is 1 µm. The strengths of the interface are assumed to be 10% lower than the plystrengths in transverse direction. Ply strengths and energy release rates are given in table 3.1. As
Figure 3: Risk of failure (left) and failure mode (right) predicted by the Puck criterion.
Figure 4: Delamination in a curved laminate is simulated with a combination of Puck/VCCT andCohesive Zone Elements.
Wimmer et al./ Numerical simulation of delamination onset and growth. 7
initial stiffnesses, the transverse ply stiffnesses are used.The results of the simulation employing the CZM show, that the location of the starting delam-ination is predicted correctly by the Puck criterion. Figure 4 shows, that the load–displacementcurves are nearly identical for both simulations. The same holds for the delamination growthbehavior with respect to size and direction. However, the simulation using the CZM lasts some10 times longer than the proposed simulation procedure.
3.3 Size of the starting delamination
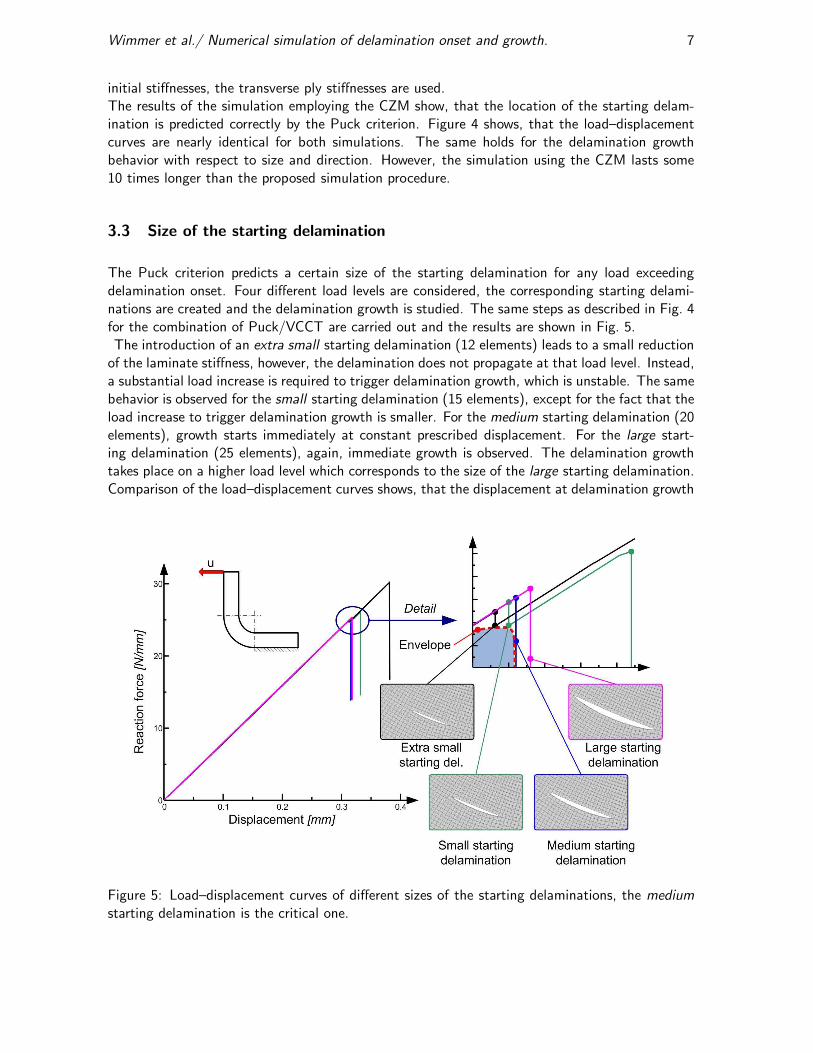
The Puck criterion predicts a certain size of the starting delamination for any load exceedingdelamination onset. Four different load levels are considered, the corresponding starting delami-nations are created and the delamination growth is studied. The same steps as described in Fig. 4for the combination of Puck/VCCT are carried out and the results are shown in Fig. 5.The introduction of an extra small starting delamination (12 elements) leads to a small reduction
of the laminate stiffness, however, the delamination does not propagate at that load level. Instead,a substantial load increase is required to trigger delamination growth, which is unstable. The samebehavior is observed for the small starting delamination (15 elements), except for the fact that theload increase to trigger delamination growth is smaller. For the medium starting delamination (20elements), growth starts immediately at constant prescribed displacement. For the large start-ing delamination (25 elements), again, immediate growth is observed. The delamination growthtakes place on a higher load level which corresponds to the size of the large starting delamination.Comparison of the load–displacement curves shows, that the displacement at delamination growth
Figure 5: Load–displacement curves of different sizes of the starting delaminations, the mediumstarting delamination is the critical one.
Wimmer et al./ Numerical simulation of delamination onset and growth. 8
is lowest for the medium starting delamination (0.316 mm).The load–displacement curves posses a lower envelope, see Fig. 5. From the envelope a conser-vative meassure for safe loading conditions, with respect to delamination growth in an initiallyflawless laminate, is obtained.
3.4 Unstable crack growth
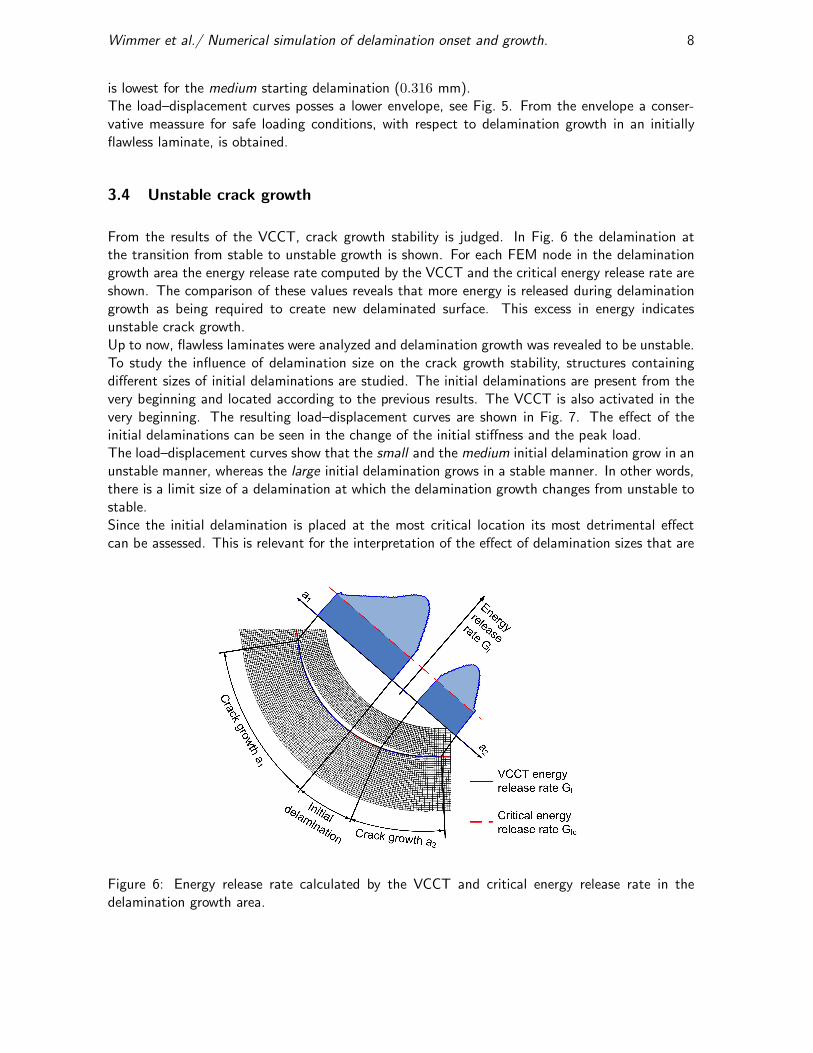
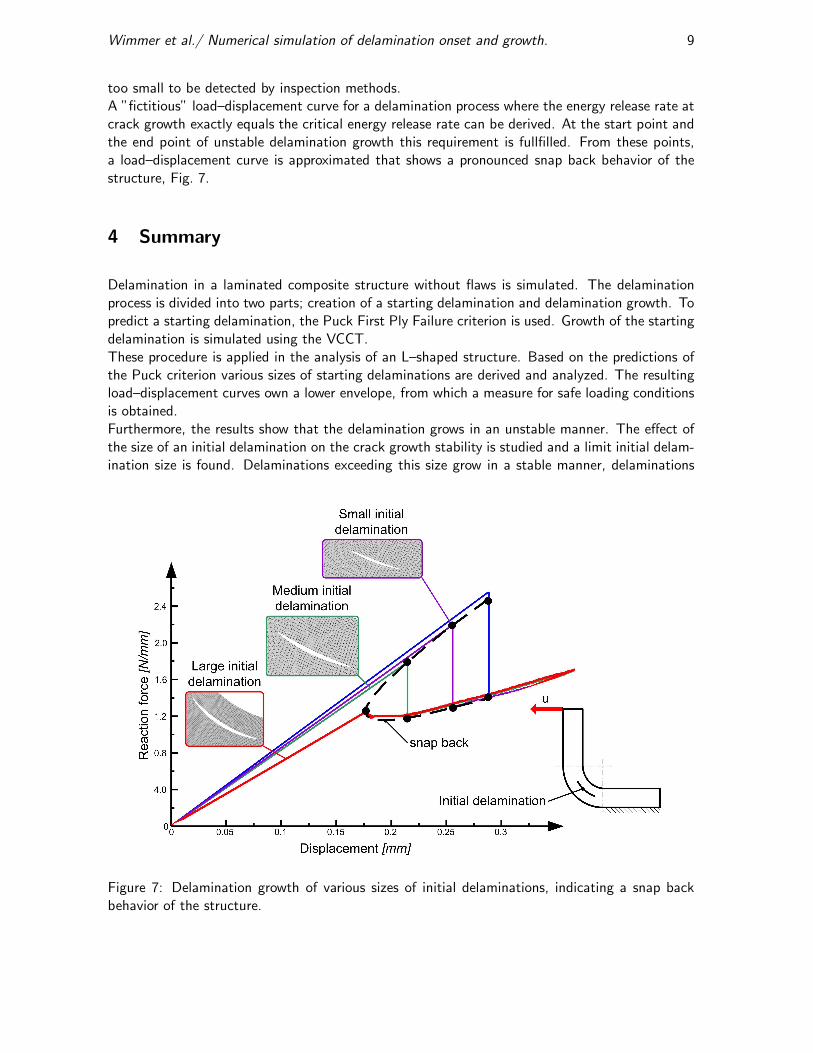
From the results of the VCCT, crack growth stability is judged. In Fig. 6 the delamination atthe transition from stable to unstable growth is shown. For each FEM node in the delaminationgrowth area the energy release rate computed by the VCCT and the critical energy release rate areshown. The comparison of these values reveals that more energy is released during delaminationgrowth as being required to create new delaminated surface. This excess in energy indicatesunstable crack growth.Up to now, flawless laminates were analyzed and delamination growth was revealed to be unstable.To study the influence of delamination size on the crack growth stability, structures containingdifferent sizes of initial delaminations are studied. The initial delaminations are present from thevery beginning and located according to the previous results. The VCCT is also activated in thevery beginning. The resulting load–displacement curves are shown in Fig. 7. The effect of theinitial delaminations can be seen in the change of the initial stiffness and the peak load.The load–displacement curves show that the small and the medium initial delamination grow in anunstable manner, whereas the large initial delamination grows in a stable manner. In other words,there is a limit size of a delamination at which the delamination growth changes from unstable tostable.Since the initial delamination is placed at the most critical location its most detrimental effectcan be assessed. This is relevant for the interpretation of the effect of delamination sizes that are
Figure 6: Energy release rate calculated by the VCCT and critical energy release rate in thedelamination growth area.
Wimmer et al./ Numerical simulation of delamination onset and growth. 9
too small to be detected by inspection methods.A ”fictitious” load–displacement curve for a delamination process where the energy release rate atcrack growth exactly equals the critical energy release rate can be derived. At the start point andthe end point of unstable delamination growth this requirement is fullfilled. From these points,a load–displacement curve is approximated that shows a pronounced snap back behavior of thestructure, Fig. 7.
4 Summary
Delamination in a laminated composite structure without flaws is simulated. The delaminationprocess is divided into two parts; creation of a starting delamination and delamination growth. Topredict a starting delamination, the Puck First Ply Failure criterion is used. Growth of the startingdelamination is simulated using the VCCT.These procedure is applied in the analysis of an L–shaped structure. Based on the predictions ofthe Puck criterion various sizes of starting delaminations are derived and analyzed. The resultingload–displacement curves own a lower envelope, from which a measure for safe loading conditionsis obtained.Furthermore, the results show that the delamination grows in an unstable manner. The effect ofthe size of an initial delamination on the crack growth stability is studied and a limit initial delam-ination size is found. Delaminations exceeding this size grow in a stable manner, delaminations
Figure 7: Delamination growth of various sizes of initial delaminations, indicating a snap backbehavior of the structure.
Wimmer et al./ Numerical simulation of delamination onset and growth. 10
below this size grow in an unstable manner. A further interpretation of these results reveals apronounced snap back behavior of the structure.The comparison to a simulation using the CZM shows excellent agreement. Advantages of theproposed procedure are low computational costs and numerical robustness. The procedure allowsto determine the critical size and location of a starting delamination and provides detailed infor-mation about the delamination growth stability.
Acknowledgement
The funding of the Austrian Aeronautics Research (AAR)/Network for Materials and Engineeringby the Austrian Federal Ministry of Economics and Labor is gratefully acknowledged.
References
[1] A.C. Garg. Delamination - a damage mode in composite structures. Eng. Fract. Mech., 29:557–584, 1988.
[2] A. Puck and H. Schurmann. Failure analysis of FRP laminates by means of physically based phenomenological models.Comp. Sci. and Tech., 58:1045–1067, 1998.
[3] A. Puck. Festigkeitsanalyse von Faser-Matrix-Laminaten. Carl Hanser Verlag, Munchen Wien, Germany, 1996.
[4] C. Schuecker. Mechanism based modeling of damage and failure in fiber reinforced polymer laminates. PhD thesis,Institute of Lightweight Design and Structural Biomechanics, Vienna University of Technology, Vienna, Austria, 2005.
[5] C. Schuecker, D.H. Pahr, and H.E. Pettermann. Accounting for residual stresses in FEM analyses of laminated structuresusing the Puck criterion for three-axial stress states. Comp. Sci. and Tech., 66(13):2054–2062, 2006.
[6] F. Hild. Discrete versus continuum damage mechanics: a probabilistic perspective. Elsevier Science Ltd, Oxford, UK,2002.
[7] R. Krueger. Virtual crack closure technique: History, approach, and applications. Applied Mechanics Reviews, 57:109 –143, Mar 2004.
[8] E.F. Rybicki and M.F. Kanninen. A finite element calculation of stress intensity factors by a modified crack closureintegral. Eng. Fract. Mech., 9:931–938, 1977.
[9] I.S. Raju. Calculation of strain-energy release rates with higher order and singular finite elements. Eng. Fract. Mech.,28:251–274, 1987.
[10] J. R. Rice. A path independent integral and the approximate analysis of strain concentration by notches and cracks.Engineering Fracture Mechanics, 35:379–386, 1968.
[11] T. K. Hellen. On the method of the virtual crack closure extension. Int. J. Num. Meth. Eng., 9:187–207, 1975.
[12] D. S. Dugdale. Yielding of steel sheets containing slits. J. of the Mechanics ans Physics of Solids, 8:100–104, 1960.
[13] G. Barenblatt. The mathematical theory of equilibrium cracks in brittle fracture. Advances in Applied Mechanics,7:55–129, 1962.
[14] P. Camanho, C. Davila, and D. R. Ambur. Numerical simulation of delamination growth in composite materials. NASA,NASA/TM-2001-211041, 2001.
[15] O. Allix. Interface damage mechanics: application to delamination. Elsevier Science Ltd, Oxford, UK, 2002.
[16] A. Turon, P. Camanho, J. Costa, and C.G. Davila. An interface damage model for the simulation of delamination undervariable-mode ratio in composite materials. NASA, NASA/TM-2004-213277, 2004.
[17] ABAQUS/VCCT for ABAQUS, User’s Manual, Version 1.1. Hibbit, Karlsson & Sorensen Inc., Pawtucket, RI, USA.
[18] Y. J. Lee, C. H. Lee, and W. S. Fu. Study on the compressive strength of laminated composite with through-the-widthdelamination. Composite Structures, 41:229–241, 1998.
[19] A. Puck, J. Kopp, and M. Knops. Guidelines for the determination of the parameters in Puck’s action plane strengthcriterion. Comp. Sci. and Tech., 62:371–378, 2002.