Embed Size (px)
Citation preview
Numerical modelling of spray and combustionprocesses using the Euler Eulerian multiphaseapproach
Petranović, Zvonimir
Doctoral thesis / Disertacija
2016
Degree Grantor / Ustanova koja je dodijelila akademski / stručni stupanj: University of Zagreb, Faculty of Mechanical Engineering and Naval Architecture / Sveučilište u Zagrebu, Fakultet strojarstva i brodogradnje
Permanent link / Trajna poveznica: https://urn.nsk.hr/urn:nbn:hr:235:810384
Rights / Prava: In copyright
Download date / Datum preuzimanja: 2022-02-11
Repository / Repozitorij:
Repository of Faculty of Mechanical Engineering and Naval Architecture University of Zagreb
Faculty of Mechanical Engineering and Naval Architecture
Zvonimir Petranović
NUMERICAL MODELLING OF SPRAY AND
COMBUSTION PROCESSES USING THE
EULER EULERIAN MULTIPHASE
APPROACH
DOCTORAL THESIS
Zagreb, 2016
Fakultet strojarstva i brodogradnje
Zvonimir Petranović
NUMERIČKO MODELIRANJE PROCESA SPREJA I IZGARANJA KORIŠTENJEM
EULER EULEROVOG VIŠEFAZNOG PRISTUPA
DOKTORSKI RAD
Zagreb, 2016.
Faculty of Mechanical Engineering and Naval Architecture
Zvonimir Petranović
NUMERICAL MODELLING OF SPRAY AND
COMBUSTION PROCESSES USING THE
EULER EULERIAN MULTIPHASE
APPROACH
DOCTORAL THESIS
Supervisor:
Asst. prof. dr. sc. MILAN VUJANOVIĆ
Zagreb, 2016
Fakultet strojarstva i brodogradnje
Zvonimir Petranović
NUMERIČKO MODELIRANJE PROCESA SPREJA I IZGARANJA KORIŠTENJEM
EULER EULEROVOG VIŠEFAZNOG PRISTUPA
DOKTORSKI RAD
Mentor:
Doc. dr. sc. MILAN VUJANOVIĆ
Zvonimir Petranović Phd Thesis
Faculty of Mechanical Engineering and Naval Architecture I
BIBLIOGRAPHY DATA
UDC: 519.876.5
Keywords: Multiphase, spray, combustion, CFD, modelling
Scientific area: TECHNICAL SCIENCES
Scientific field: Mechanical engineering
Institution Faculty of Mechanical Engineering and Naval Architecture
Thesis supervisor: Asst. prof. dr.sc. Milan Vujanović (FMENA, Zagreb)
Number of pages: 176
Number of figures: 63
Number of tables: 17
Number of references: 118
Date of examination: 05 December 2016
Jury members:
Asst. prof. dr.sc. Milan Vujanović (FMENA, Zagreb)
Prof. dr. sc. Neven Duić (FMENA, Zagreb)
Asst. prof. dr.sc. Darko Kozarac (FMENA, Zagreb)
Dr. sc. Wilfried Edelbauer – (AVL AST, Graz)
Dr. sc. Peter Priesching – (AVL AST, Graz)
Archive: Faculty of Mechanical Engineering and Naval Architecture
Zvonimir Petranović Phd Thesis
Faculty of Mechanical Engineering and Naval Architecture II
ACKNOWLEDGMENT
This work was carried out at the Department of Energy, Power Engineering and
Environment in the Faculty of Mechanical Engineering and Naval Architecture, University of
Zagreb. I hereby declare that this thesis is entirely the result of my own work and knowledge
obtained during my studies, except where otherwise indicated.
First, I would like to express my gratitude to the supervisor of this thesis, Associate
Professor Milan Vujanović, for the opportunity, guidance, patience and support throughout this
work. I would also like to thank Professor Neven Duić, for giving me the opportunity to work
in his group, full of extremely bright, intelligent people that I consider as experts in their
scientific field.
I would also like thank the AVL AST team in Graz, Dr. Reinhard Tatschl, Dr. Klaus
Pachler, Eberhard Von Berg, and others in the CFD development group, for the continuous
support and accessibility. I would also like to acknowledge the financial support of AVL AST
Zagreb. Very special thanks in this regard to its director, Mr. Goran Mirković.
I am very thankful for the valuable comments from jury members, Professor Darko
Kozarac, Dr. Peter Priesching and Dr. Wilfried Edelbauer.
With this opportunity I would like to acknowledge special thanks to Dr. Wilfried
Edelbauer and Professor Milan Vujanović for leading me through this work, for showing me
hints and tips in programming, for sharing their knowledge, for helping me in publishing
scientific papers, and for being full of understanding and support. This I will never forget.
I would also like to extend my appreciation to my colleagues, Dr. Marko Ban, Dr. Luka
Perković, Dr. Hrvoje Mikulčić, Dr. Jakov Baleta, and Tibor Bešenić who also played a part in
this work through helpful discussions.
My beloved parents, who supported this venture, deserve also the deepest gratitude. As
I like to say, the opportunity is all I need, and they provided me the one. Thank you for your
understanding, for your support, and unconditional love. I would like to thank Sanjin, Eduard
and Zinka for being supportive and proud on my accomplishments. Also, I would like to thank
Drago and Vesna for their support.
Finally, hereby I acknowledge my greatest thanks to my wife, Iva, and to our daughter
Ana for giving me strength. Therefore, I dedicate this work to them, my two shining stars.
Zagreb, December 2016
Zvonimir Petranović
Zvonimir Petranović Phd Thesis
Faculty of Mechanical Engineering and Naval Architecture III
TABLE OF CONTENTS
BIBLIOGRAPHY DATA ........................................................................................................... I
ACKNOWLEDGMENT ............................................................................................................ II
TABLE OF CONTENTS ......................................................................................................... III
SUMMARY ............................................................................................................................. VI
SAŽETAK ............................................................................................................................... VII
PROŠIRENI SAŽETAK ....................................................................................................... VIII
KEYWORDS ........................................................................................................................ XIII
KLJUČNE RIJEČI ................................................................................................................ XIV
LIST OF ABBREVIATIONS ................................................................................................. XV
NOMENCLATURE ............................................................................................................. XVII
LIST OF FIGURES ............................................................................................................ XXIV
LIST OF TABLES ............................................................................................................ XXVII
1. INTRODUCTION ............................................................................................................... 1
1.1. Background .................................................................................................................. 1
1.2. Overview ...................................................................................................................... 2
1.2.1. Compression Ignition Processes ........................................................................... 2
1.2.2. Fuel Injection and Spray Processes ....................................................................... 4
1.2.3. Combustion Processes ........................................................................................ 16
1.2.4. Emissions from IC diesel engines ....................................................................... 18
1.2.5. Modelling Spray Processes ................................................................................. 20
1.2.6. Modelling Reactive Spray Processes .................................................................. 22
1.3. Objective and hypothesis of research ......................................................................... 24
1.4. Materials and methodology of research ..................................................................... 24
1.5. Scientific contribution ................................................................................................ 27
2. NUMERICAL MODELLING ........................................................................................... 28
2.1. Fundamental equations of fluid flow and heat transfer .............................................. 28
2.2. Turbulent flows .......................................................................................................... 29
2.2.1. Averaging of the conservation equations ............................................................ 30
2.2.2. k turbulence model ...................................................................................... 33
2.2.3. k f turbulence model ................................................................................ 34
2.3. Multiphase flows ........................................................................................................ 36
2.4. The Euler Lagrangian formulation ............................................................................. 36
Zvonimir Petranović Phd Thesis
Faculty of Mechanical Engineering and Naval Architecture IV
2.5. The Euler Eulerian formulation ................................................................................. 37
2.5.1. Averaging in multiphase flows ........................................................................... 38
2.5.2. Mass conservation ............................................................................................... 40
2.5.3. Momentum conservation .................................................................................... 41
2.5.4. Enthalpy conservation ......................................................................................... 42
2.5.5. Species transport conservation ............................................................................ 42
2.6. Euler Eulerian spray sub – models ............................................................................. 43
2.6.1. Primary atomization ............................................................................................ 43
2.6.2. Secondary atomization ........................................................................................ 46
2.6.3. Droplet collision .................................................................................................. 48
2.6.4. Droplet evaporation ............................................................................................ 49
2.6.5. Momentum exchange via drag force ................................................................... 53
2.6.6. Combustion ......................................................................................................... 55
3. RESULTS AND DISCUSSION ........................................................................................ 59
3.1. Eulerian Lagrangian engine modelling ...................................................................... 59
3.1.1. Experimental data and numerical setup .............................................................. 60
3.1.2. Results and discussion ........................................................................................ 63
3.2. Euler Eulerian spray model parametric studies .......................................................... 67
3.2.1. Experimental data and numerical setup .............................................................. 68
3.2.2. Results and discussion ........................................................................................ 70
3.3. Nozzle – flow spray coupling .................................................................................... 75
3.4. Primary atomization modelling .................................................................................. 80
3.4.1. DNS data and numerical setup ............................................................................ 80
3.4.2. Results and discussion ........................................................................................ 83
3.5. Secondary atomization modelling .............................................................................. 86
3.5.1. Experimental data and numerical setup .............................................................. 86
3.5.2. Results and discussion ........................................................................................ 89
3.6. O’Rourke collision model .......................................................................................... 92
3.7. Reactive multiphase spray modelling ........................................................................ 95
3.7.1. Euler Eulerian reactive spray method verification .............................................. 96
3.7.2. Experimental data and numerical setup .............................................................. 98
3.7.3. Results and Discussion ..................................................................................... 101
3.8. Euler Eulerian engine modelling .............................................................................. 111
Zvonimir Petranović Phd Thesis
Faculty of Mechanical Engineering and Naval Architecture V
3.8.1. Experimental data and numerical setup ............................................................ 111
3.8.2. Results and discussion ...................................................................................... 116
4. CONCLUDING REMARKS, CONTRIBUTION AND FUTURE WORK
RECOMMENDATIONS ................................................................................................. 122
4.1. Thesis conclusion ..................................................................................................... 122
4.1.1. Eulerian Lagrangian modelling ......................................................................... 122
4.1.2. Parametric study of spray sub – models ........................................................... 123
4.1.3. Validation of the WAVE secondary atomization model .................................. 124
4.1.4. O’Rourke collision model ................................................................................. 125
4.1.5. Verification of the developed multiphase combustion method ........................ 125
4.1.6. Validation of the developed multiphase combustion method ........................... 126
4.2. Thesis contributions ................................................................................................. 127
4.3. Recommendations for future research ..................................................................... 128
LITERATURE ....................................................................................................................... 131
CURRICULUM VITAE ........................................................................................................ 142
ŽIVOTOPIS ........................................................................................................................... 144
Zvonimir Petranović Phd Thesis
Faculty of Mechanical Engineering and Naval Architecture VI
SUMMARY
The goal of this thesis is to develop advanced engineering method for numerical
modelling of highly turbulent multiphase combustion processes.
The first objective was to use the commercial 3D Computational Fluid Dynamics (CFD)
code FIRE® and model real engineering system by changing various combustion parameters.
In this section, the spray process was modelled by employing the widely used Euler Lagrangian
discrete Droplet Method (DDM). The focus was to gain insight into advantages and
disadvantages of that approach. In the second section, the Euler Eulerian multiphase approach
sub – models, namely the liquid jet primary atomization and droplet secondary atomization
model were thoroughly analysed and parametrized. Furthermore, the primary atomization
model was validated against Direct Numerical Simulation (DNS) data, a new inlet boundary
condition was developed, and the nozzle flow – spray interface was enhanced within the Euler
Eulerian spray module. In the third section, the validation and enhancement of the WAVE
secondary break – up model within the Euler Eulerian framework was performed. The modelled
spray cloud shape, spray cone angle, liquid penetration, and droplet size distributions were
compared to the available experimental data. In the fourth section, the stochastic O’Rourke
collision model was modified and implemented into the Euler Eulerian spray code. In the fifth
section, the multiphase module was enhanced with the combustion model where the combustion
process was described through general gas phase reactions and chemistry mechanisms. The
developed method was verified by numerical modelling of constant volume reactor filled with
liquid – gas mixture under elevated pressure and temperature conditions. In the last section, the
newly developed method was extensively validated by comparing the simulation results to the
available experimental data from the Engine Combustion Network (ECN) database. The liquid
and vapour phase penetration, mixture distribution, spray cloud shape and temperature field
were examined for various combustion parameters. To find the most suitable spray sub – model
coefficients, a high pressure liquid fuel injection into the non – reactive environment was
modelled. Finally, the developed method was used to model internal combustion engine
compression and expansion stroke. The given results imply that the developed method can be
reliably used in a modern engineering development processes.
Zvonimir Petranović Phd Thesis
Faculty of Mechanical Engineering and Naval Architecture VII
SAŽETAK
Cilj ovog rada je razviti naprednu inženjersku metodu za računalno modeliranje
turbulentnih višefaznih strujanja i procesa izgaranja.
U prvom dijelu teze modelirani su realni inženjerski sustavi uz varijacije parametara
izgaranja. U ovom dijelu teze, za opisivanje procesa spreja korišten je Euler Lagrangeov pristup
izoliranih čestica (DDM). Navedeni model spreja korišten je s ciljem stjecanja razumijevanja
njegovih prednosti i nedostataka. U drugom dijelu teze provedena je parametrizacija postojećih
modela primarnog raspada mlaza goriva i sekundarnog raspada kapljica korištenjem Euler
Eulerovog višefaznog pristupa. Modeli su parametrizirani računalnim modeliranjem
ubrizgavanja goriva u nereaktivnu okolinu s povišenom temperaturom. Nadalje, primarni
model raspadanja mlaza goriva validiran je usporedbom s rezultatima izravnih numeričkih
simulacija (DNS), razvijen je novi rubni uvjet za ubrizgavanje goriva i unaprijeđeno je
postojeće sučelje sapnica – sprej unutar Euler Eulerovog modela spreja. U trećem dijelu teze
verificiran je, validiran i modificiran WAVE model sekundarnog raspada kapljica unutar Euler
Eulerovog pristupa. Izračunati oblik isparenog goriva, kut spreja, penetracija goriva te
distribucija kapljica uspoređeni su s dostupnim eksperimentalnim podacima. U četvrtom dijelu
teze modificiran je i unaprijeđen O'Rourke model sudaranja kapljica unutar Euler Eulerovog
sprej modela. U petom dijelu teze Euler Eulerov model nadograđen je s modelom za opisivanja
procesa izgaranja. Verifikacija razvijene metode izvršena je računalnim modeliranjem reaktora
s konstantnim volumenom ispunjenog smjesom goriva i plinova u uvjetima povišenog tlaka i
temperature. U šestom dijelu teze novo razvijena metoda validirana je usporedbom modeliranih
rezultata s eksperimentalnim podacima grupe koja se bavi istraživanjem procesa izgaranja u
motorima s unutarnjim izgaranjem (eng. Engine Combustion Network – ECN). Uspoređeni su
podaci penetracije kapljevite i plinovite faze, radijalna i aksijalna distribucija isparenog goriva,
oblik isparenog goriva te temperaturna polja. Kako bi se definirali odgovarajući koeficijenti
korištenih modela spreja, provedeno je istraživanje ubrizgavanja kapljevitog goriva u
nereaktivnu okolinu. Nakon toga, izvršena je validacija razvijene metode računalnim
modeliranjem realnih sustava ubrizgavanja. U završnom dijelu rada, novo razvijena metoda
korištena je za računalne simulacije motora s unutarnjim izgaranjem.
Zvonimir Petranović Phd Thesis
Faculty of Mechanical Engineering and Naval Architecture VIII
PROŠIRENI SAŽETAK
Kao rezultat izgaranja fosilnih goriva velika količina emisija ispušta se u atmosferu.
Veliki dio tih emisija dolazi iz transportnog sektora u kojem je u posljednjem desetljeću
zabilježen značajan porast potrošnje energije. Zbog toga, važno je pronaći rješenje i utjecati na
smanjenje štetnih emisija iz rastućeg transportnog sektora. U posljednje vrijeme propisane su
stroge regulative vezane uz štetne emisije, a još se strože očekuju u budućnosti. Štetne emisije
iz motora s unutarnjim izgaranjem ovise o procesu spreja i atomizaciji goriva, pogotovo o
kvaliteti miješanja goriva i zraka. Razumijevanje i poboljšavanje tih procesa predstavlja jedno
od rješenja u daljnjem razvoju motora s unutarnjim izgaranjem te u razvoju drugih sustava gdje
dolazi do procesa spreja i izgaranja. Zbog dugog vremenskog perioda i visoke cijene
eksperimentalnih ispitivanja, kombinirana primjena eksperimenata i Računalne Dinamike
Fluida (RDF) postao je uobičajeni razvojni pristup. Zbog toga se odgovarajuće i pouzdano
numeričko modeliranje interakcije goriva i zraka smatra kao važna stavka za uvid u proces
spreja i za razumijevanje turbulentnih strujanja fluida. Razumijevanjem procesa spreja i
interakcije goriva i zraka moguće je pristupiti unaprijeđenu različitih inženjerskih sustava.
Postoji nekoliko računalnih pristupa koji se koriste za modeliranje turbulentnih
višefaznih strujanja, kao što su: računalno zahtjevne izravne numeričke simulacije (eng. Direct
Numerical Simulations – DNS), pristup izoliranih čestica (eng. Discrete Particle Model –
DPM), Euler Lagrangeov pristup praćenja kapljica, Euler Eulerov višefazni pristup, itd. Euler
Lagrangeov pristup uobičajen je i često korišten pristup za računanje procesa spreja u kojem se
kapljevito gorivo grupira u skupine kapljica (parcele) sličnog promjera i sličnih fizikalnih
svojstava. Za svaku parcelu rješavaju Lagrangeove jednadžbe te se računa njihova trajektorija,
dok se plinovita faza tretira kao kontinuum te se modelira pomoću jednadžbi očuvanja mase,
količine gibanja i energije. Ovakav pristup ima nedostatke kao što su ovisnost o prostornoj
diskretizaciji u blizini točke ubrizgavanja goriva te porast računalnog opterećenja s povećanjem
broja parcela. Također, takav pristup modeliranja spreja ima i nedostatak vezan uz statističku
konvergenciju. Unatoč navedenim nedostatcima, Lagrangeov pristup pogodan je za
modeliranje područja raspršenog spreja gdje je koncentracija kapljevite faze dovoljno niska.
Proces spreja može se opisati korištenjem metoda praćenja površine interakcije
kapljevite i plinovite faze, kao što su Volume of Fluid (VOF) i „level-set“ metode. Takve
metode, unatoč visokoj razini točnosti, računalno su zahtjevne i trenutačno nisu u tolikoj mjeri
zastupljene u razvoju realnih inženjerskih sustava.
Zvonimir Petranović Phd Thesis
Faculty of Mechanical Engineering and Naval Architecture IX
Kako bi se zaobišli nedostaci Euler Lagrangeovog pristupa može se koristiti Euler
Eulerov višefazni pristup. U ovom pristupu, postignuta je jača fizikalna sprega između
kapljevite i plinovite faze te je kao takav pogodniji za računalno modeliranje područja gustog
spreja. Jača fizikalna sprega postignuta je pretpostavkom da su kapljevita i plinovita faza
kontinuumi, te rješavanjem Eulerovih jednadžbi očuvanja za obje faze. Za efikasno numeričko
modeliranje procesa spreja potrebno je razumjeti utjecaj pojedinih parametara na proces spreja.
Neki od parametara su strujanje unutar sapnice, tlak ubrizgavanja, tlak komore izgaranja,
temperatura goriva, itd.
Kako bi se iskoristile prednosti Euler Eulerovog i Euler Lagrangeovog pristupa, oni se
mogu koristiti istovremeno u spregnutim računalnim simulacijama – ACCI metoda (AVL Code
Coupling Interface). Na taj način, rezultati dobiveni u jednoj računalnoj simulaciji koriste se,
ili kao rubni uvjet, ili kao izvorski član/ponor u drugoj simulaciji. U posljednje vrijeme razvijan
je još jedan pristup spregnutih simulacija - ELSA (Euler Lagrangian Spray Atomization) model.
Glavna prednost ELSA modela je bolje opisivanje područja gustog spreja. Razlika između
ELSA i ACCI modela je što se u ELSA modelu, u blizini sapnice, plinovita i kapljevita faza
modeliraju kao smjesa kapljevite i plinovite.
Trenutno postoji nekoliko različitih pristupa modeliranju izgaranja gorivih para nastalih
prilikom procesa spreja kao što su eddy dissipation, flamelet, PDF (eng. Probability Density
Function), modeli izgaranja uz korištenje detaljne kemijske kinetike, itd. Mogućnost korištenja
Euler Eulerovog višefaznog pristupa u kombinaciji s kemijskom kinetikom za opisivanje
višefaznih reaktivnih strujanja do sada nije obrađena i objavljena u literaturi. Stoga, glavni cilj
ovog doktorskog rada bio je razviti i implementirati takav pristup koji će biti korišten za
pouzdano računalno modeliranje procesa turbulentnog višefaznog procesa spreja i procesa
izgaranja.
CILJ I HIPOTEZA
Hipoteza ovog rada je da su numeričke simulacije ubrizgavanja kapljevitog goriva i
procesa izgaranja, korištenjem Euler Eulerovog pristupa u kombinaciji s kemijskom kinetikom
izvedive, te da se mogu koristiti u razvoju različitih inženjerskih sustava s postojećim
reaktivnim tokovima fluida. Rezultati ovog rada omogućuju pouzdan opis procesa spreja u
području gustog i razrijeđenog spreja. Nadalje, s detaljnim opisom procesa spreja dobiven je i
pouzdan opis procesa izgaranja. Cilj ovog rada je bio uspostaviti pristup koji će potvrditi
Zvonimir Petranović Phd Thesis
Faculty of Mechanical Engineering and Naval Architecture X
hipotezu opsežnom usporedbom rezultata računalnog modeliranja i dostupnih eksperimentalnih
podataka.
ZNANSTVENI DOPRINOS
Rezultat ovog rada je nova metoda za računalno modeliranje višefaznih procesa spreja
i procesa izgaranja. Metoda je razvijena kombiniranjem Euler Eulerovog višefaznog modela s
kemijskom kinetikom za opisivanje procesa izgaranja. Postojeće sučelje sapnica – sprej
unaprijeđeno je za višeprocesorsko računanje i razvijen je novi rubni uvjet za Eulerov model
spreja. Nadalje, Euler Eulerov model spreja unaprijeđen je s O’Rourke modelom za opisivanje
procesa sudaranja kapljica te je validiran primarni model raspadanja mlaza goriva usporedbom
s rezultatima izravnih numeričkih simulacija dostupnih iz literature. S ciljem boljeg opisivanja
spreja u vidu predviđanja volumne i brojčane distribucije kapljica spreja, model sekundarnog
raspadanja kapljica goriva unaprijeđen je s opcijom stvaranja satelitskih kapljica (eng. child
droplet). Na temelju prikazanih rezultata može se zaključiti da razvijena metoda može proširiti
područje korištenja Euler Eulerovog modela spreja, metode klase kapljica, na različite
inženjerske aplikacije gdje postoje višefazni reaktivni tokovi fluida.
METODE I POSTUPCI
Postoji nekoliko računalnih pristupa za rješavanje turbulentnih višefaznih strujanja kao
što su izravne numeričke simulacije, pristup izoliranih čestica, Euler Lagrangeov pristup
praćenja kapljica, Euler Eulerov višefazni pristup, itd. Euler Lagrangeov pristup je uobičajen i
često korišten numerički pristup korišten za računanje procesa spreja, ali ima neke nedostatke.
Da bi se izbjegli ti nedostaci može se koristiti Euler Eulerov višefazni pristup. U tom pristupu,
kapljevita i plinovita faza smatraju se kontinuumom te se obje faze rješavaju Eulerovim
pristupom. Ista diskretizacija, slične numeričke tehnike i jednadžbe očuvanja koriste se za obje
faze. Kako bi se što točnije opisalo ponašanje spreja, kapljice se dijele u konačan broj klasa
karakteriziranih promjerom kapljica. Takav model, ujedno korišten i razvijan u ovome radu,
uobičajeno se naziva model klasa kapljica. Za svaku klasu kapljica rješava se set jednadžbi
očuvanja s dodatnim izvorskim članovima za opis dinamike kapljica. Matematički modeli
računanja procesa spreja i izgaranja korišteni su unutar Eulerovog sprej koda, prilikom čega se
termo kemijske reakcije računaju unutar plinovite faze u pojedinom kontrolnom volumenu.
Kemijske reakcije unutar plinovite faze rješavaju se korištenjem rješavača diferencijalnih
jednadžbi pomoću kojeg se računaju izvorski i ponorski članovi za transportne jednadžbe
Zvonimir Petranović Phd Thesis
Faculty of Mechanical Engineering and Naval Architecture XI
kemijskih vrsta i entalpije. Prikazani modeli spreja integrirani su u komercijalni kod AVL
FIRE® korištenjem korisničkih funkcija. Spajanje jednadžbi modela s RDF kodom omogućeno
je korištenjem uobičajenih FORTRAN funkcija. Istraživanje je izrađeno u nekoliko koraka
kako bi se dobio pouzdan pristup za modeliranje procesa spreja i izgaranja.
Prvi korak istraživanja je opsežan pregled literature vezan na područje spreja te su
prikazani rezultati računalnih simulacija korištenjem Euler Lagrangeovog pristupa. Računalno
je modeliran jednocilindrični eksperimentalni motor s unutarnjim izgaranjem uz variranje
pojedinih parametra izgaranja. Nadalje, izrađena je analiza polja temperature i štetnih emisija.
Model je uspješno validiran usporedbom izračunatih rezultata s dostupnim eksperimentalnim
podacima te su prikazani prednosti i nedostaci Euler Lagrangeovog pristupa modeliranja spreja.
Drugi korak istraživanja je detaljna parametrizacija postojećih modela primarnog
raspada mlaza goriva i sekundarnog raspada kapljica korištenjem Euler Eulerovog višefaznog
pristupa. U ovome dijelu opisan je navedeni pristup rješavanja spreja te su prikazane korištene
jednadžbe očuvanja. Istraženi su modeli primarnog i sekundarnog raspada te je odabran set
koeficijenata modela koji je dalje korišten u računalnim simulacijama u ovom dijelu rada.
Parametrizacija modela izrađena je računalnim modeliranjem ubrizgavanja kapljevitog goriva
u nereaktivnu okolinu povišene temperature. Na taj način, omogućen je proces isparavanja, ali
je izbjegnut proces izgaranja. Model je validiran usporedbom rezultata računalnih simulacija s
dostupnim eksperimentalnim podacima, prilikom čega je ispitan utjecaj koeficijenata modela
na penetraciju kapljevitog i isparenog goriva. Modelirani slučajevi spreja razlikuju se u
tlakovima ubrizgavanja i tlaku komore izgaranja. Nadalje, u ovome dijelu rada verificiran je
model primarnog raspadanja mlaza kapljevitog goriva usporedbom s rezultatima izravnih
numeričkih simulacija, implementiran je rubni uvjet za ubrizgavanje kapljevitog goriva uz
korištenje dijagrama ubrizgavanja goriva te je unaprijeđeno sučelje za spajanje računalnih
simulacija toka goriva kroz sapnicu i procesa spreja.
Treći korak istraživanja je verifikacija i validacija WAVE modela sekundarnog raspada
kapljica goriva unutar Euler Eulerovog pristupa. Model je validiran usporedbom rezultata
računalnog modeliranja raspada kapljica goriva s dostupnim eksperimentalnim podacima iz
literature te istraživanjem visokotlačnog ubrizgavanja kapljevitog goriva s detaljno definiranom
selekcijom ulaska goriva. Rubni uvjet ubrizgavanja goriva u sprezi je s računalnom simulacijom
toka goriva kroz mlaznicu korištenjem datoteke sapnice i sučelja razvijenog u drugome dijelu
teze. U datoteci sapnice zapisani su podaci turbulencije, temperature, brzine, gustoće goriva i
smjese plinova za svaku fazu kroz cijeli vremenski period ubrizgavanja goriva, te su ti podaci
Zvonimir Petranović Phd Thesis
Faculty of Mechanical Engineering and Naval Architecture XII
preslikani na ulaznu selekciju u Euler Eulerovoj računalnoj simulaciji procesa spreja.
Računalno su modelirani različiti slučajevi visokotlačnog ubrizgavanja goriva u komoru
konstantnog volumena ispunjenu nereaktivnom smjesom plinova. Oblik isparenog goriva, kut
spreja, penetracija goriva te distribucija kapljica uspoređeni su s dostupnim eksperimentalnim
podacima.
Četvrti korak istraživanja je modifikacija i implementacija stohastičkog O'Rourke
modela sudaranja kapljica za Euler Eulerov višefazni pristup. Sudaranje kapljica računa se za
definirana sučelja klasa u svim kontrolnim volumenima gdje ima dovoljno kapljevite faze. Za
svaku fazu aktivnog sučelja, na odgovarajući način, računa se promjer kapljice, brzina i
temperatura slijedeći konzervativna svojstva mase, količine gibanja i energije. Implementirani
model sudaranja kapljica korišten je za računanje procesa spajanja kapljica.
Peti korak istraživanja je razvoj Euler Eulerovog pristupa modeliranja spreja s ciljem
opisivanja procesa izgaranja. Rezultati ovog dijela rada omogućuju korištenje homogenih
kemijskih reakcija u računalnim simulacijama višefaznih strujanja prilikom čega je proces
izgaranja opisan korištenjem kemijske kinetike. Razvijena metoda verificirana je računalnim
modeliranjem reaktora s konstantnim volumenom ispunjenog smjesom goriva i plinova pod
povišenim tlakom i temperaturom te je istražen utjecaj procesa isparavanja na masene bilance,
razvoj topline, i na promjene temperature nastale uslijed procesa izgaranja.
Šesti korak istraživanja je detaljna validacija nove metode koja obuhvaća istovremeno
korištenje Euler Eulerovog modela spreja i kemijske kinetike. Metoda je validirana
uspoređivanjem rezultata računalnog modeliranja s dostupnim eksperimentalnim podacima iz
ECN baze podataka. Istražen je utjecaj raznih parametara spreja na penetracije kapljevite i
plinovite faze, radijalna i aksijalna distribucija isparenog goriva, oblik oblaka isparenog goriva
te temperaturna polja. Inicijalno su istraženi slučajevi ubrizgavanja kapljevitog goriva u
nereaktivno okruženje. Nakon toga, računalno su modelirani različiti reaktivnih slučajevi
ubrizgavanja kapljevitog goriva te su rezultati simulacije uspoređeni s dostupnim
eksperimentalnim podacima kao što su udaljenosti procesa izgaranja od sapnice, porast tlaka u
komori izgaranja, polja koncentracije OH radikala, polja temperature te vrijeme početka
izgaranja. U završnom dijelu teze, novo razvijena metoda korištena je za računalne simulacije
realnog motora s unutarnjim izgaranjem.
Zvonimir Petranović Phd Thesis
Faculty of Mechanical Engineering and Naval Architecture XIII
KEYWORDS
Computational fluid dynamics;
Numerical modelling;
Euler Eulerian approach;
Euler Lagrangian approach;
Multiphase;
Spray process;
Primary break – up;
Secondary break – up;
Droplet collision;
Droplet evaporation;
Vapour combustion;
Compression ignition;
IC engine;
Diesel;
n – heptane;
n – dodecane;
Reaction kinetics;
Constant volume vessel;
Pollutant emission;
Zvonimir Petranović Phd Thesis
Faculty of Mechanical Engineering and Naval Architecture XIV
KLJUČNE RIJEČI
Računalna mehanika fluida;
Modeliranje;
Euler Eulerov pristup;
Euler Lagrangeov pristup;
Višefazno strujanje;
Proces spreja;
Primarno raspadanje mlaza goriva;
Sekundarno raspadanje kapljica goriva;
Sudaranje kapljica;
Isparavanje;
Izgaranje;
Samozapaljenje;
Motor s unutarnjim izgaranjem;
Dizel;
n – heptane;
n – dodecane;
Kemijska kinetika;
Komora s konstantnim volumenom;
Štetne emisije;
Zvonimir Petranović Phd Thesis
Faculty of Mechanical Engineering and Naval Architecture XV
LIST OF ABBREVIATIONS
Abbreviations Description
ACCI AVL code coupling interface
AVL Anstalt für Verbrennungskraftmaschinen List
(German)
BDC Bottom dead centre
CDS Central differencing scheme
CEN European Standards Committee
CFD Computational fluid dynamics
CI Compression ignition
CVV Constant volume vessel
DDM Discrete droplet method
DNS Direct numerical simulations
DPF Diesel particulate filter
DPM Discrete particle model
ECN Engine combustion network
EDC Eddy dissipation concept
EGR Exhaust gas residuals
ELSA Euler Lagrangian spray atomization
EOI End of injection
EVM Eddy viscosity model
FIPA Fractionnement Induit Par Acceleration
GHG Greenhouse gases
HC Hydrocarbons
IC Internal combustion
ID Ignition delay
KH Kevin – Helmholtz instabilities
LES Large eddy simulations
LNT Lean NOx trap
LOL Lift off length
PDF Probability density function
Zvonimir Petranović Phd Thesis
Faculty of Mechanical Engineering and Naval Architecture XVI
PM Particulate matter
RANS Reynolds averaged Naiver Stoke
RDF Računalna dinamika fluida
RN1, RN2 collision model random numbers
ROHR Rate of heat release
ROI Rate of injection
RT Rayleigh – Taylor instabilities
SAC Sack area around the needle tip
SCR Selective catalyst reduction
RSM Reynolds stress model
SMD Sauter mean diameter
SOI Start of injection
TAB Taylor analogy break – up model
TDC Top dead centre
TED Turbulent dissipation energy
TKE Turbulent kinetic energy
VOF Volume of fluid
WAVE secondary break – up model WAVE
Zvonimir Petranović Phd Thesis
Faculty of Mechanical Engineering and Naval Architecture XVII
NOMENCLATURE
Roman Description Unit
DA droplet frontal area [m2]
iA Coefficient in the Arrhenius expression [1/s]
crb Critical impact parameter [-]
1SB , 2SB Constants in secondary break-up model [-]
MB Spalding mass number [-]
TB Spalding heat number [-]
Ca Area contraction coefficient [-]
Cd Nozzle discharge coefficient [-]
Dc drag coefficient [-]
C Constant in turbulence model [-]
pkc Specific heat capacity for phase k [J/kg/K]
pFC specific heat capacity of vapour phase [J/kg/K]
1C , 2C ,
3C ,4C, TC ,
LC ,C ,C
Constants in turbulence model [-]
1PB , 2PB , 3PB
, 4C , 5C , 6C ,
7C
Constants in primary break-up model [-]
d diameter [m]
klD Turbulent dissipation inter-phase exchange
between phase k and l
[W/m3/s]
DiY species diffusion coefficient [m2/s]
iE activation energy, [J/kmol]
if Cartesian component of the force vector [m/s2]
Zvonimir Petranović Phd Thesis
Faculty of Mechanical Engineering and Naval Architecture XVIII
f Elliptic function [kg/m3/s]
f complex function used within the collision
model
[-]
DF Drag force [N]
StF Stokes drag force [N]
MF ,TF Diffusional and thermal film correction
factors
G production/destruction of quantity by body
force
[kg/m/s3]
h Specific enthalpy [J/kg]
H Interfacial enthalpy exchange term [W/m3]
fkH Heat of formation of the species k [kJ/kmol]
I number of reactions in the system [-]
k Turbulent kinetic energy [m2/s2]
bk backward reaction rate coefficients [-]
fk forward reaction rate coefficients [-]
gk Thermal conductivity [W/m/K]
ik chemical reaction rate [-]
klK Turbulent kinetic energy inter-phase
exchange term between phase k and l
[W/m3]
l Mixing length [m]
ml Turbulent mixing length [m]
L turbulent length [m]
L latent heat [J/kg]
AL atomization length scale [m]
Le Lewis number [-]
nozL Nozzle channel length [m]
TL Turbulent length scale [m]
WL Aerodynamic length scale [m]
M Molar mass [kg/kmol]
Zvonimir Petranović Phd Thesis
Faculty of Mechanical Engineering and Naval Architecture XIX
m mass [kg]
n number of collisions [-]
n sample range [m]
jn Cartesian component of the unit normal
vector
[-]
N number of process/experiment realisations
III
jN number density [1/m3]
Oh Ohnesorge number [-]
p pressure [Pa]
P Production of transported property by mean
flow deformation
[kg/m/s3]
nP Probability of collision process [-]
oP Probability that the collision process will not
occur
[-]
kjq Cartesian component of the heat flux vector
for phase k
[W/ m2]
iq reaction rate of reaction i
LQ heat transfer into to droplet [J]
R universal gas constant [J/kmol/K]
Re Reynolds number [-]
r radius [m]
ir Reaction rate of species i [1/s]
S surface [m2]
S additional term for definition of turbulent
length and time scales
[s-1]
Sct Turbulent Schmidt number [-]
gS soot surface growth source [kg/s]
HS Source term for heat of reaction [W]
nS soot nucleation source [kg/s]
kS Mass source term for species k [kg/s]
Zvonimir Petranović Phd Thesis
Faculty of Mechanical Engineering and Naval Architecture XX
2OS soot oxidation source [kg/s]
SS soot formation rate source [kg/s]
iYS Species i source term [kg/s]
t time [s]
T turbulent time
Taylor number
Temperature
[s]
[-]
[K]
refT Reference temperature [K]
u velocity [m/s]
iu Cartesian velocity component [m/s]
ju Cartesian velocity component [m/s]
ku Cartesian velocity component [m/s]
molu Averaged velocity [m/s]
tu Characteristic turbulent velocity [m/s]
V volume [m3]
cellV cell volume [m3]
We Weber number [-]
kW Molecular weight of species k [kg/kmol]
n
kw starting value of species k mass fraction [kg/kg]
1n
kw 0D reactor model value of species k mass
fraction
[kg/kg]
ix Cartesian coordinate [m]
jx Cartesian coordinate [m]
kx Cartesian coordinate [m]
kX molar concentration of species k [kmol/kmol]
y droplet distortion parameter [-]
iY Species mass fraction [-]
FY Fuel mass fraction [-]
Zvonimir Petranović Phd Thesis
Faculty of Mechanical Engineering and Naval Architecture XXI
Greek Description Unit
volume fraction [-]
gD Binary diffusion coefficient [m2/s]
Dissipation rate of the turbulent kinetic
energy
[m2/s3]
0T Thermal film thickness [m]
0M Diffusion film thickness [m]
k Thermal conductivity for phase k [W/m/K]
k species k [-]
Kinematic viscosity [m/s2]
Mass transfer between phases [kg/m³/s]
n droplet class range for SMD calculation [m]
density [kg/m3]
Dynamic molecular viscosity [Pas]
t turbulent viscosity [Pas]
i collision frequency [1/s]
'
ki stoichiometric coefficient of reactants [kmol]
''
ki stoichiometric coefficient of products [kmol]
wave length [m]
wave growth rate [1/s]
k rate of production of species k [kg/m3/s]
surface tension N/m2
k Constant in turbulence model [-]
Constant in turbulence model [-]
T Turbulent Prandtl number [-]
Velocity scales ratio [-]
A Atomization time scale [s]
ij Tangential stress tensor component [N/m2]
Zvonimir Petranović Phd Thesis
Faculty of Mechanical Engineering and Naval Architecture XXII
kij Viscous stress tensor of phase k N/m2
t
kij Reynolds stress tensor of phase k
General transport scalar variable [-]
Mean part of averaged general transport
scalar variable
[-]
' Fluctuating part of averaged general
transport scalar variable
Quantity
k component-weighted average
k mass-weighted average
phase indicator function [-]
Subscripts Description
A atomization
avg averaged
cr critical
drop droplet
D drag
g gas phase
i species index
reaction index
collector class
inj injection
j droplet class in the collision model
k phase index in multiphase flow
index of liquid class within the Euler Eulerian
size – of – classes approach
K number of gas phase species
l liquid phase
mol number of moles
Zvonimir Petranović Phd Thesis
Faculty of Mechanical Engineering and Naval Architecture XXIII
n nozzle
number of experiments/realisations for
averaging procedure
bulk liquid class
starting value
1n reactor model results
nph number of phases
noz nozzle
P Lagrangian particle
S surface
target target droplet class
W aerodynamic
f Intensive property
f General variable
1 gas phase
ambient condition
Superscripts Description
ib Coefficient in Arrhenius expression
nph number of phases
' Reynold fluctuation
'' Favre fluctuation
Reynolds average
Favre average
III number density
* Modified
Zvonimir Petranović Phd Thesis
Faculty of Mechanical Engineering and Naval Architecture XXIV
LIST OF FIGURES
Figure 1 Schematic of IC diesel engine combustion chamber ............................................... 3
Figure 2 Schematic of fuel injection system and cavitation process ..................................... 5
Figure 3 Schematic of spray regimes ..................................................................................... 6
Figure 4 Schematic of liquid jet atomization mechanisms .................................................... 7
Figure 5 Schematic of liquid jet break – up regimes [11] ..................................................... 9
Figure 6 Schematic of droplet secondary break – up regimes reproduced from [13] ......... 10
Figure 7 Schematic of catastrophic secondary break – up mechanisms reproduced from
[14][12] .................................................................................................................. 11
Figure 8 Schematic of spray characteristics ........................................................................ 14
Figure 9 Schematic of IC diesel engine working cycle ....................................................... 17
Figure 10 Schematic of spray modelling approaches and the Euler Eulerian spray
sub – models .......................................................................................................... 38
Figure 11 Computational mesh for engine calculation .......................................................... 62
Figure 12 Calculated temperature, NO mass fraction, and soot mass fraction field ............. 64
Figure 13 Comparison of calculated and experimental in – cylinder mean pressure and mean
temperature profiles ............................................................................................... 66
Figure 14 Comparison of calculated and measured soot and NOx emissions relative to the case
a ............................................................................................................................. 67
Figure 15 Experimental data of injection velocity and fuel tip penetration .......................... 68
Figure 16 Computational mesh for Euler Eulerian spray model parameterization ............... 69
Figure 17 Parameterization of the primary atomization model for operating point d ........... 71
Figure 18 Parameterization of the secondary atomization model for operating point d ........ 72
Figure 19 Comparison of calculated and experimental liquid and vapour spray tip penetration
............................................................................................................................... 73
Figure 20 Comparison of calculated and measured liquid and vapour penetration (top), and
distribution (bottom) for case d .............................................................................. 74
Figure 21 Results of nozzle file mapping for the liquid volume fraction ................................ 76
Figure 22 Results of nozzle file mapping for various quantities ............................................. 77
Figure 23 Computational meshes used for validation of the nozzle file interface ................. 78
Figure 24 Calculated mass flow profile ................................................................................. 79
Figure 25 Cavitation influence on the spray inlet boundary selection captured with the
mapping procedure ................................................................................................ 79
Zvonimir Petranović Phd Thesis
Faculty of Mechanical Engineering and Naval Architecture XXV
Figure 26 Computational mesh used for validation of the primary break – up model.............. 81
Figure 27 2D Euler Eulerian simulation results and DNS diagrams of volume fraction
distribution ............................................................................................................. 82
Figure 28 Comparison of calculated and DNS radial mixture distribution at x/d=5 ............... 83
Figure 29 Comparison of calculated and DNS radial mixture distribution at x/d=10 ............. 84
Figure 30 Comparison of calculated and DNS radial mixture distribution at x/d=20 ............. 84
Figure 31 Comparison of calculated and DNS axial mixture distribution .............................. 85
Figure 32 Comparison of calculated and DNS liquid volume fraction field ........................... 85
Figure 33 Measured spray tip penetration .............................................................................. 86
Figure 34 Computational meshes used for validation of secondary break – up model ......... 88
Figure 35 Comparison of calculated and measured spray tip penetration ............................. 90
Figure 36 Comparison of calculated and measured spray angle ........................................... 90
Figure 37 Comparison of calculated and measured droplet number distribution (left) and
droplet volume distribution (right) ........................................................................ 91
Figure 38 Computational mesh used for verification of the collision model ........................ 92
Figure 39 Calculated volume fraction field, and the number of droplet collisions with
implemented collision model ................................................................................ 93
Figure 40 Calculated volume fraction field without implemented collision model .............. 94
Figure 41 Calculated sauter mean diameter field without (left) and with implemented collision
model (right) .......................................................................................................... 95
Figure 42 Computational mesh used for verification of the Euler Eulerian reactive spray
method ................................................................................................................... 97
Figure 43 Calculated profiles of fuel mass fraction, oxygen mass fraction, temperature and
ROHR .................................................................................................................... 98
Figure 44 Computational mesh used for the n – heptane spray simulation ......................... 100
Figure 45 Comparison of calculated and measured liquid and vapour penetration, and mixture
radial distribution profiles (right) for Case_h ...................................................... 102
Figure 46 Comparison of calculated and measured mixture field for Case_h ..................... 103
Figure 47 Comparison of calculated and measured temperature field for Case_h .............. 104
Figure 48 Comparison of calculated and measured liquid and vapour penetration for Case_d1
and Case_d2 ........................................................................................................ 105
Figure 49 Comparison of calculated and measured fuel vapour radial (top) and axial
distribution (bottom) for Case_d1 and Case_d2 .................................................. 106
Zvonimir Petranović Phd Thesis
Faculty of Mechanical Engineering and Naval Architecture XXVI
Figure 50 Comparison of calculated mixture and temperature field for Case_d2 ............... 107
Figure 51 Comparison of calculated and measured lift off length and ignition delay for
n – heptane spray cases ....................................................................................... 108
Figure 52 Comparison of calculated and measured vapour penetration for Case_d_r ........ 109
Figure 53 Comparison of calculated and measured OH results of mass fraction field (left),
pressure rise and rate of heat release profiles ...................................................... 110
Figure 54 Computational mesh used for engine calculation ................................................ 112
Figure 55 Details of the computational mesh used for engine modelling ........................... 113
Figure 56 Injection velocity profile ..................................................................................... 115
Figure 57 Experimental results of mean pressure a), mean temperature traces b) and rate of
heat release c) ...................................................................................................... 117
Figure 58 Comparison of calculated and measured in – cylinder mean pressure ................ 118
Figure 59 Comparison of calculated and measured in – cylinder mean temperature .......... 118
Figure 60 Comparison of calculated and measured rate of heat release .............................. 119
Figure 61 Cutting plane used for analysing the calculated results ...................................... 119
Figure 62 Calculated gas velocity field at different crank angle positions .......................... 120
Figure 63 Calculated gas temperature field at different crank angle positions ................... 121
Zvonimir Petranović Phd Thesis
Faculty of Mechanical Engineering and Naval Architecture XXVII
LIST OF TABLES
Table 1 Default values of k turbulence model. ............................................................ 33
Table 2 Default values of k f turbulence model ...................................................... 35
Table 3 Euler Eulerian size – of – classes approach class specification. ........................... 37
Table 4 Chemistry mechanisms used within this thesis ..................................................... 58
Table 5 Characteristics of the experimental engine and the BOSCH Piezo common rail
injection system ..................................................................................................... 61
Table 6 Combustion system parameters ............................................................................. 61
Table 7 Pollutant emission concentrations measured in the exhaust pipe .......................... 61
Table 8 Computational mesh boundary conditions .............................................................. 62
Table 9 Parameters of the engine operating points .............................................................. 63
Table 10 Operating conditions for model parameterization ................................................. 69
Table 11 Nozzle flow – spray interface validation cases ........................................................ 77
Table 12 Measured spray characteristics for the examined nozzle designs ......................... 87
Table 13 Operation conditions for the non-reactive and the reactive spray cases ............... 99
Table 14 Engine specifications ........................................................................................... 112
Table 15 Combustion characteristics of the simulated operating point ............................. 114
Table 16 Initial conditions for engine simulation ............................................................... 115
Table 17 Time discretization for engine simulation ........................................................... 116
Zvonimir Petranović PhD Thesis
Faculty of Mechanical Engineering and Naval Architecture 1
1. INTRODUCTION
1.1. Background
Due to a higher fuel conversion efficiency, the compression ignition Internal
Combustion (IC) engines are a favourable choice on the transportation vehicle market in the
European countries. In addition, there are several other factors for their favourable choice such
as high power output, fuel consumption reduction, high durability, and their reliability. The IC
engines are usually powered by burning the fossil fuels which results in emitting great amounts
of pollutant emissions into the Earth atmosphere. Such pollution is a hot topic and a great
challenge for modern society. Therefore, a special attention is given to this issue. In order to
reduce the harmful pollutants, specifically soot and NOx emissions, more and more stringent
regulations are being put in front of the IC engine manufacturers. Those regulations represent
a huge motivation and obligation to improve the existing technology. European Union
developed the Euro standards Euro 1 – 6 that are used as a benchmark for reducing the pollutant
emissions. The latest Euro 6 standard prescribes 80 % lower pollutant emission amounts from
diesel engines compared to the Euro 1 standard. To reach this goal several measures have to be
taken.
One of the measures for reducing the pollutant emissions emitted from IC engines is the
use of aftertreatment emission control systems, such as diesel oxidation catalyst, diesel
particulate filter, and Selective Catalytic Reduction (SCR). With emission control, pollutants
from the exhaust system can be eliminated after they leave the IC engine combustion chamber.
The pollutant emission control systems that are being used to reduce the Nitrogen Oxide (NOx)
emissions are Exhaust Gas Recirculation (EGR), Lean NOx Trap (LNT) [1], SCR, etc. In EGR
systems, widely used in IC diesel engines, the burned gas mixture is recirculated in the
combustion chamber. This reduces the combustion efficiency but decreases the in – cylinder
temperature. Accordingly, the NOx concentration is lowered and the concentration of HC and
CO species is increased. The EGR and LNT systems are not enough to meet the EURO 6
emission standards and therefore another strategies, such as SCR had to be developed. The SCR
is used to minimize the NOx emissions in the exhaust system, mostly from high duty vehicles,
by using ammonia NH3 as reductant. The ammonia is obtained from the thermal decomposition
of urea, which is added as aqueous solution, and hydrolysis of isocyanic acid (HNCO).
The amount of pollutant emissions released from a modern combustion system depend
Zvonimir Petranović PhD Thesis
Faculty of Mechanical Engineering and Naval Architecture 2
on the spray process, especially on fuel atomization and air – fuel mixing process [2]. Besides,
with the use of flue gas aftertreatment systems, pollutant emissions can be reduced through the
optimization of these processes. Optimization can include system operation at higher injection
pressures, different nozzle design, modified needle movement, occurrence of cavitation,
multiple injections, swirl motion, blending diesel fuel with biofuels, different piston design, etc.
In general, it can be concluded that a detailed understanding of spray process is of utmost
importance for engine development. Such understanding is limited from experimental
investigations and therefore the CFD tools are usually being employed.
The objective of this thesis was to develop an advanced engineering method for
numerical simulations of highly turbulent multiphase spray and combustion processes. The
spray was modelled with the Euler Eulerian size – of – classes approach. Additionally, the
existing interface for coupling spray and nozzle flow computational simulations was further
enhanced. Furthermore, the primary and secondary atomization models were verified by
comparing the calculated results to DNS results and to the available experimental data. To take
into account the influence of droplet collision on the overall spray process, the O’Rourke
collision model was modified and implemented within the Euler Eulerian spray code. The
model was verified on a computational simulation of two colliding droplet jets. The Eulerian
spray code was further enhanced with the combustion model, where the combustion process
was modelled by using chemistry mechanisms, and it was thoroughly validated against
experimental research of Constant Volume Vessel (CVV), and by modelling the IC diesel
engine compression and expansion stroke.
1.2. Overview
In this part of the thesis, the fundamentals regarding the injection, spray, and combustion
processes will be discussed. Also, the introduction to the commonly used numerical modelling
approaches will be given.
1.2.1. Compression Ignition Processes
In IC diesel engines the liquid fuel is injected into a pressurized combustion chamber
by using various injection systems. The injected fuel disintegrates into a big number of small
diameter droplets that rapidly evaporate. Furthermore, evaporated fuel tends to self – ignite due
to the increased temperature conditions. At crank angle positions around the start of injection,
temperature and pressure are in the levels of 1000 K and 50 bar, respectively. To ensure a good
combustion process the liquid fuel have to be disintegrated into a fine droplets, which is
Zvonimir Petranović PhD Thesis
Faculty of Mechanical Engineering and Naval Architecture 3
achieved by the atomization process. In IC diesel engines the liquid fuel is injected through a
small diameter nozzles possessing a high velocity. This generates high liquid – air relative
velocities, contributing to the fuel droplet break – up process. To achieve complete combustion
of each fuel droplet a fuel lean environment has to be ensured, which can be done by increasing
the air excess ratio. The choice of proper air excess ratio is not straight forward, since it
contributes to the emission levels.
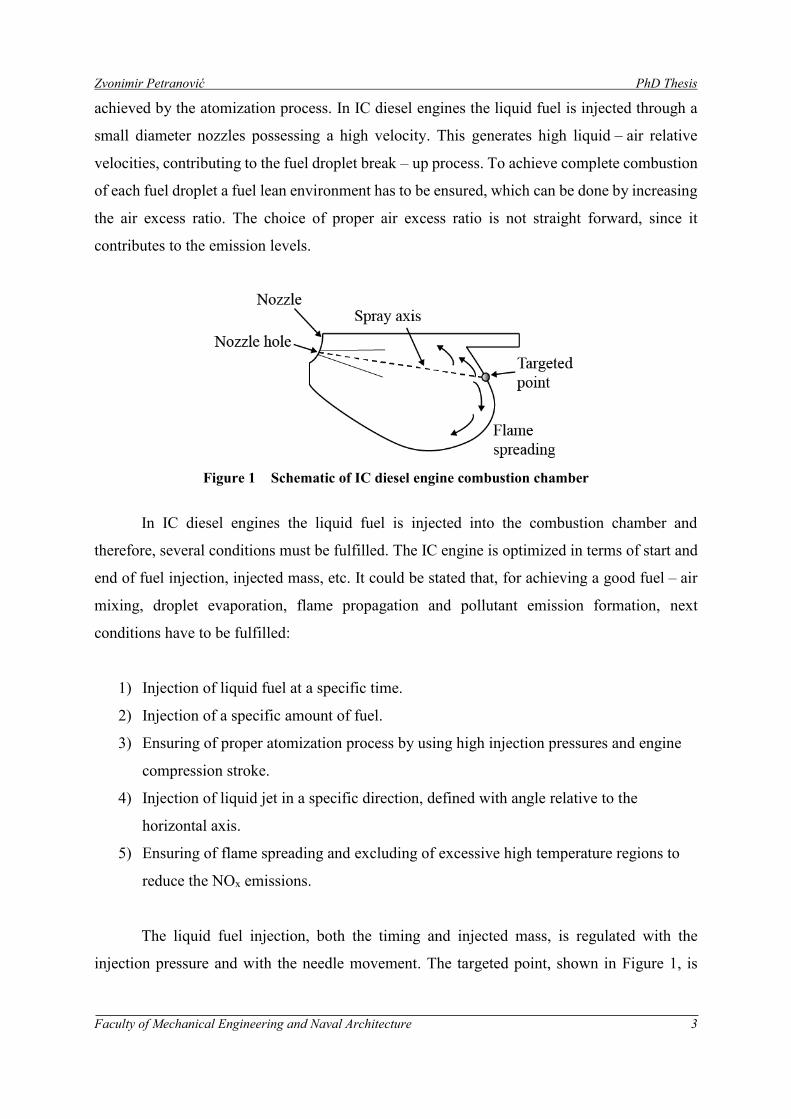
Figure 1 Schematic of IC diesel engine combustion chamber
In IC diesel engines the liquid fuel is injected into the combustion chamber and
therefore, several conditions must be fulfilled. The IC engine is optimized in terms of start and
end of fuel injection, injected mass, etc. It could be stated that, for achieving a good fuel – air
mixing, droplet evaporation, flame propagation and pollutant emission formation, next
conditions have to be fulfilled:
1) Injection of liquid fuel at a specific time.
2) Injection of a specific amount of fuel.
3) Ensuring of proper atomization process by using high injection pressures and engine
compression stroke.
4) Injection of liquid jet in a specific direction, defined with angle relative to the
horizontal axis.
5) Ensuring of flame spreading and excluding of excessive high temperature regions to
reduce the NOx emissions.
The liquid fuel injection, both the timing and injected mass, is regulated with the
injection pressure and with the needle movement. The targeted point, shown in Figure 1, is
Zvonimir Petranović PhD Thesis
Faculty of Mechanical Engineering and Naval Architecture 4
defined through detailed engine design investigations. Usually, the target is aimed with nozzle
position and nozzle hole normal vector direction.
1.2.2. Fuel Injection and Spray Processes
Liquid sprays are used in a widespread field of technical applications, such as internal
combustion engines, gas turbines, rockets, spray painting, spray cooling, fire extinction, spray
quenching, waste treatment, etc. Usually, the liquid is delivered to the system as turbulent spray,
which is defined as dynamic collection of liquid droplets dispersed in gas as a result of an
intense atomization process. The spray process is used to distribute the liquid on a wider area,
and to increase the surface needed for more intensive evaporation process. In this thesis the
spray is produced by a high pressure liquid fuel injection through a small diameter nozzle,
characteristic for real engineering combustion systems such as IC diesel engines. It is a common
knowledge that the combustion efficiency, combustion stability, and pollutant formation
depend on the spray process. Therefore an understanding of such process is necessary for
further development of various engineering applications. Modelling the spray processes, which
are considered highly turbulent and transient processes, is challenging since it involves
modelling of turbulence, heat and mass transfer, phase change, chemical reactions, inter – phase
coupling, etc. Next sections will provide a brief overview of the fuel injection systems, and also
the basics regarding the spray and atomization regimes.
Fuel injection
To meet the high requirements on the pollutant emissions, regulated by the EU, the
pollutant emission released from the IC diesel engines has to be somehow controlled and
reduced under a certain thresholds. Such emissions can be reduced by ensuring a proper fuel
air mixing process, which can be achieved by a high pressure liquid fuel injection through a
small diameter nozzle. In a modern injection systems available on the market in 2016, fuel is
injected under pressures over 2000 bar through the cylindrical nozzle holes which are around
0.1 mm in diameter. The schematic of injector nozzle is shown on left – hand side of Figure 2.
Fluid flow under conditions characteristic for the injectors used in modern IC engines is a highly
transient, turbulent, and subject to the cavitation process. The cavitation process is defined as
phase change from the liquid to the gas phase when local pressure drops below the saturated
vapour pressure of a liquid. Cavitation is one of the factors that can significantly affect the spray
development in the combustion chamber. The phase change from liquid to gas phase occurs at
Zvonimir Petranović PhD Thesis
Faculty of Mechanical Engineering and Naval Architecture 5
almost constant temperature, similar to the boiling process which occurs at constant pressure
conditions.
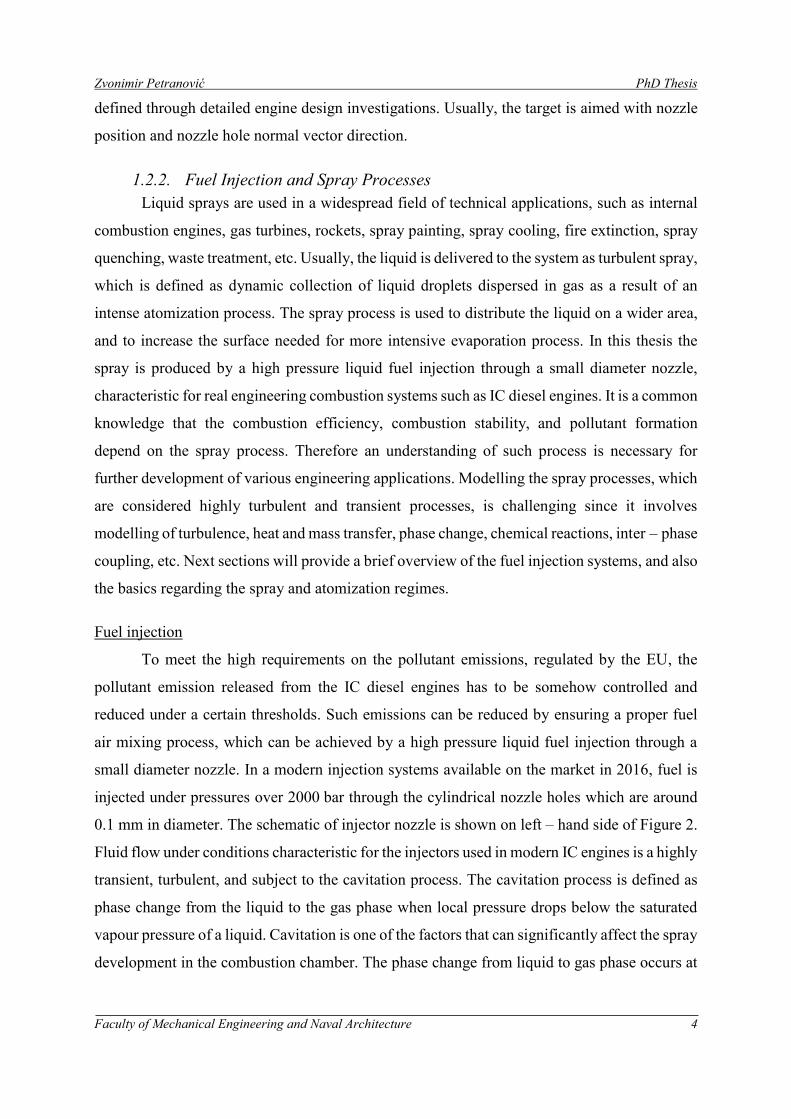
Figure 2 Schematic of fuel injection system and cavitation process
In liquid fuel injectors the cavitation usually occurs as a result of the injector design. As
shown on the right – hand side in Figure 2, the liquid fuel flows through the small diameter
nozzle channel with high velocity. At the entrance of the nozzle channel, the liquid fuel is
suddenly curved and separation of the boundary layer could occur. This leads to a flow
recirculation followed by a significant local pressure drop. As mentioned before, at the point
when pressure is low enough, the cavitation process takes place. The occurrence of the gas
phase within the nozzle channel, reduces the nozzle channel effective cross section and
subsequently, a higher outflow velocity can be observed. If the vapour bubble collapse time is
longer than the time necessary for vapour bubble to pass the whole nozzle channel, it can
outflow and collapse in the combustion chamber. This leads to accelerated atomization of the
liquid fuel and it could have a positive effect on the pollutant emissions. It is worth noting that
in the multi hole injectors, due to the needle movement a vapour string connecting different
nozzle holes can be created within the nozzle with sack area around the pintle tip (SAC). This
process is commonly known as the string cavitation. It usually occurs upstream the nozzle
channel cavitation, and it is a consequence of vortices created by the needle movement.
The influence of the nozzle cavitation on the spray characteristics by observing
momentum and mass fluxes was reported in [3]. In this research the authors have found that
with intensive cavitation, the liquid fuel velocity on the entrance of the combustion chamber
increases. Such behaviour can be addressed to reduction of the nozzle hole effective cross
Zvonimir Petranović PhD Thesis
Faculty of Mechanical Engineering and Naval Architecture 6
section due to presence of the vapour phase. The increase of the spray angle due to the cavitating
nozzle flow is reported by [4], whilst the influence of the orifice geometry on the spray and
combustion processes is presented by [2]. In that research, the authors have shown that with
decreased cavitation, the dispersion and the break – up intensity is lower, whilst at the same
time the liquid fuel jet penetration is more pronounced.
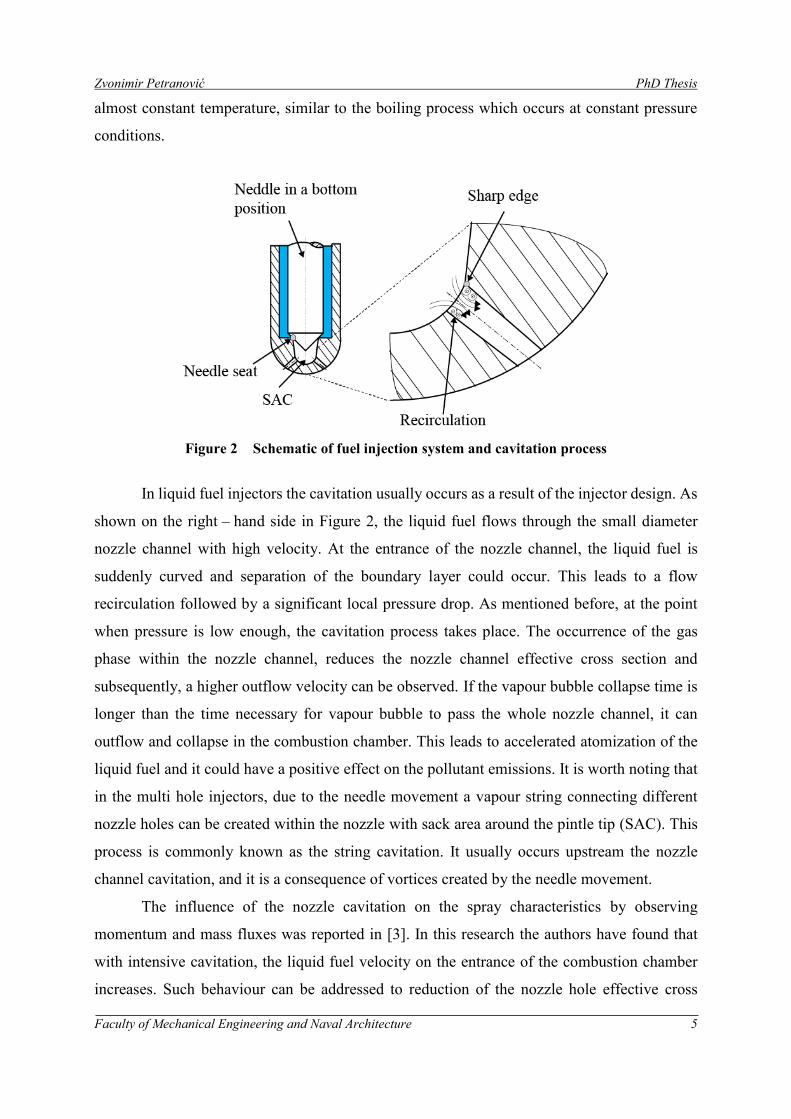
Spray regimes
The atomization of liquid fuel jet plays a significant role in engine operation as it is
responsible for creating fine droplets needed for efficient evaporation process. Sprays can be
divided into several parts based on the mass fraction of the dispersed phase FY . According to
such criterion, the spray can be divided into dense, thin, and diluted spray regions, as shown in
Figure 3.
Figure 3 Schematic of spray regimes
In the nozzle vicinity, where the dense spray is prevailing, the liquid core is disintegrated
into unstable ligaments and bigger diameter droplets due to the primary atomization process.
The liquid – gas density ratio and turbulence generated within the nozzle together define the
mixing rate, droplet size distribution and flow structure of the dense spray region [5]. Further
downstream from the nozzle, where the liquid fuel is completely atomized, a thin spray region
is formed. It is a region where certain droplet population is already produced, and a dispersed
phase volume fraction 𝛼𝑙 is low comparing to the gas phase volume fraction 𝛼𝑔. However, due
to the high liquid – gas density ratios, and a significant liquid mass fraction FY , there is still an
influence of the dispersed phase on the gas phase. The diluted spray regime is defined in the
region further downstream from the nozzle hole where the dispersed phase mass fraction is
Zvonimir Petranović PhD Thesis
Faculty of Mechanical Engineering and Naval Architecture 7
negligible. In this region, fuel droplets are widely spread and isolated, and the droplet collision
is not occurring anymore.
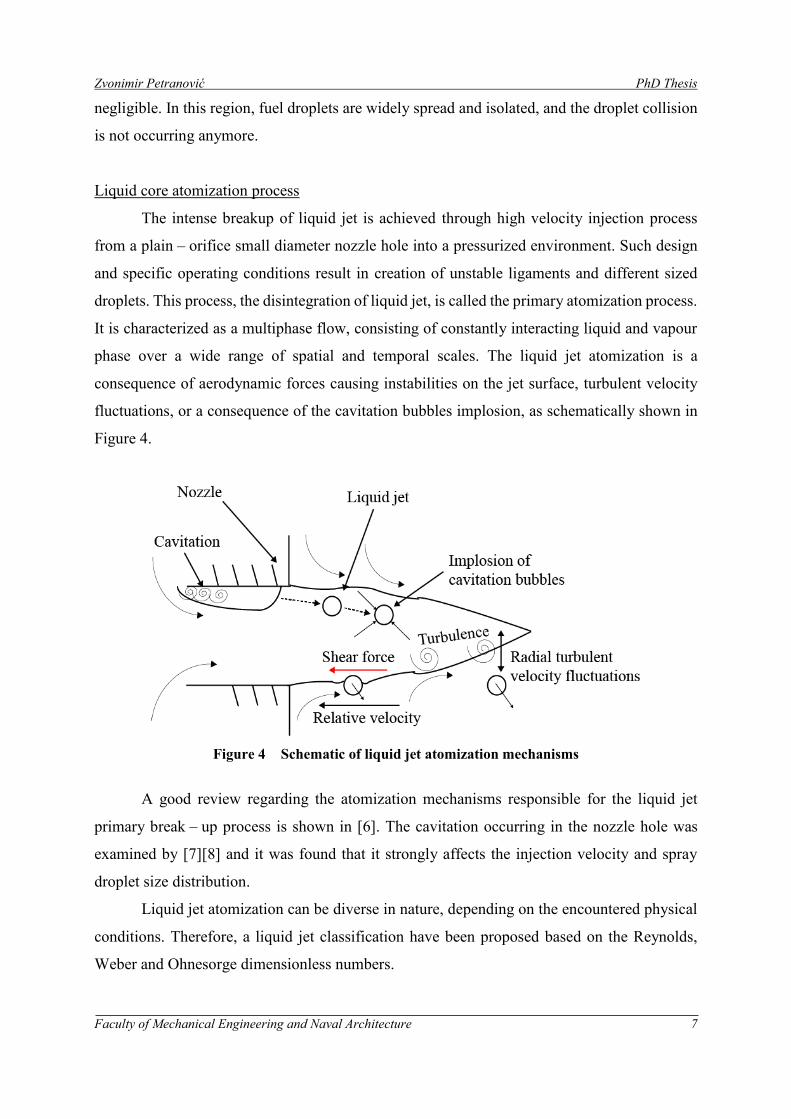
Liquid core atomization process
The intense breakup of liquid jet is achieved through high velocity injection process
from a plain – orifice small diameter nozzle hole into a pressurized environment. Such design
and specific operating conditions result in creation of unstable ligaments and different sized
droplets. This process, the disintegration of liquid jet, is called the primary atomization process.
It is characterized as a multiphase flow, consisting of constantly interacting liquid and vapour
phase over a wide range of spatial and temporal scales. The liquid jet atomization is a
consequence of aerodynamic forces causing instabilities on the jet surface, turbulent velocity
fluctuations, or a consequence of the cavitation bubbles implosion, as schematically shown in
Figure 4.
Figure 4 Schematic of liquid jet atomization mechanisms
A good review regarding the atomization mechanisms responsible for the liquid jet
primary break – up process is shown in [6]. The cavitation occurring in the nozzle hole was
examined by [7][8] and it was found that it strongly affects the injection velocity and spray
droplet size distribution.
Liquid jet atomization can be diverse in nature, depending on the encountered physical
conditions. Therefore, a liquid jet classification have been proposed based on the Reynolds,
Weber and Ohnesorge dimensionless numbers.
Zvonimir Petranović PhD Thesis
Faculty of Mechanical Engineering and Naval Architecture 8
The Reynolds number, widely used to characterize the turbulence and energy of a flow,
relates the inertia forces arising from the droplet gas relative velocity to the viscous forces, as
shown with next equation:
Re l l n
l
u d
, (1)
where the term nd stands for the nozzle hole exit diameter,
l is the liquid density, lu is the
liquid velocity, and l is the dynamic viscosity.
The second number that is used for characterization of liquid jet break – up nature is the
liquid Weber number defined with next equation:
2
l l n
l
uWe
d
, (2)
where the variable l stands for surface tension of the liquid. The Weber number correlates the
inertia and surface tension forces. A detailed explanation of the Weber number and the jet
stability is provided in [9].
The third relevant dimensionless number used for the liquid jet break – up classification
is the Ohnesorge number defined with next equation:
n
l
l l
Ohd
. (3)
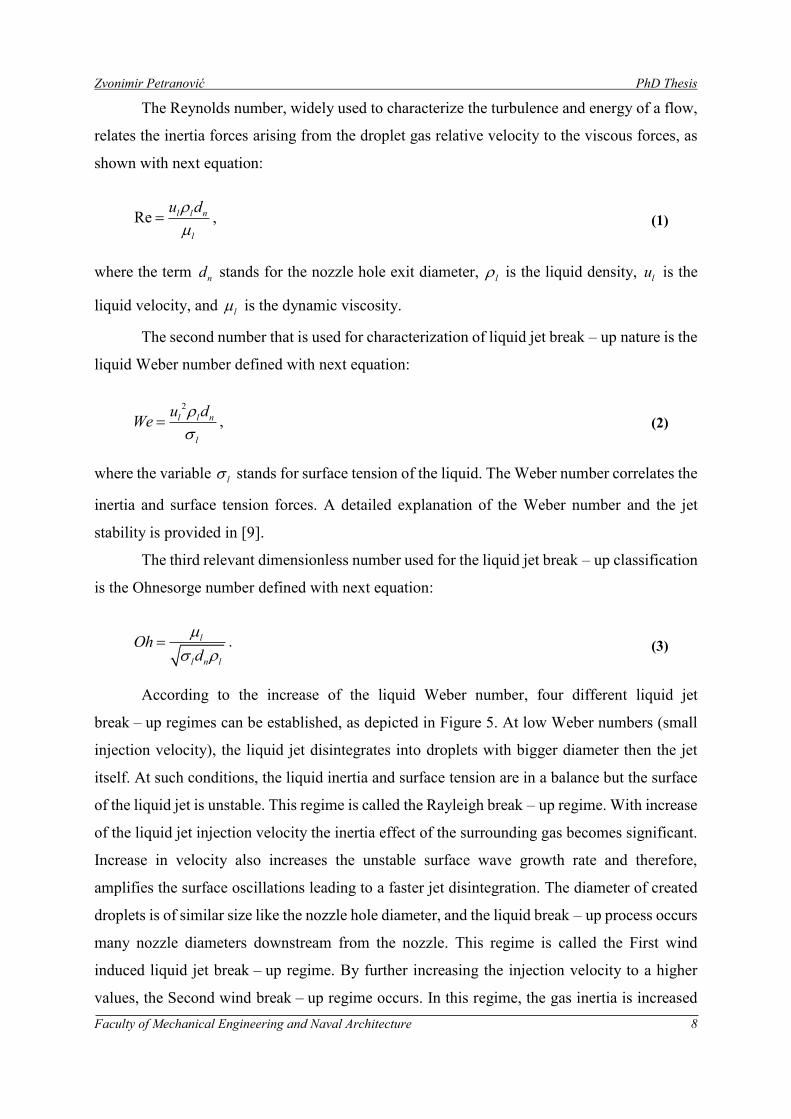
According to the increase of the liquid Weber number, four different liquid jet
break – up regimes can be established, as depicted in Figure 5. At low Weber numbers (small
injection velocity), the liquid jet disintegrates into droplets with bigger diameter then the jet
itself. At such conditions, the liquid inertia and surface tension are in a balance but the surface
of the liquid jet is unstable. This regime is called the Rayleigh break – up regime. With increase
of the liquid jet injection velocity the inertia effect of the surrounding gas becomes significant.
Increase in velocity also increases the unstable surface wave growth rate and therefore,
amplifies the surface oscillations leading to a faster jet disintegration. The diameter of created
droplets is of similar size like the nozzle hole diameter, and the liquid break – up process occurs
many nozzle diameters downstream from the nozzle. This regime is called the First wind
induced liquid jet break – up regime. By further increasing the injection velocity to a higher
values, the Second wind break – up regime occurs. In this regime, the gas inertia is increased
Zvonimir Petranović PhD Thesis
Faculty of Mechanical Engineering and Naval Architecture 9
and the liquid jet disintegrates due to the unstable growth of small wavelength surface waves.
This implies that the droplet population from this regime consists of droplets with much smaller
diameter comparing to the nozzle hole diameter. The liquid jet categorization that distinguished
the first and second wind induced break – up was introduced by [10]. A regime that is of utmost
importance in the IC diesel engine investigation is the atomization regime. It is characteristic
for the liquid jet injection with high Weber number and sufficiently high gas density. When the
conditions for the atomization regime are met, the fuel jet atomization starts immediately at the
nozzle exit hole and a conical shaped spray characterized with small diameter droplets is
produced.
Figure 5 Schematic of liquid jet break – up regimes [11]
In this thesis the spray generated by the high pressure liquid fuel injection into a
pressurized gas environment is considered. Therefore, the atomization break – up regime is
dominant where break – up of liquid jet starts directly at the nozzle exit. This process is referred
as the primary break – up of the liquid core.
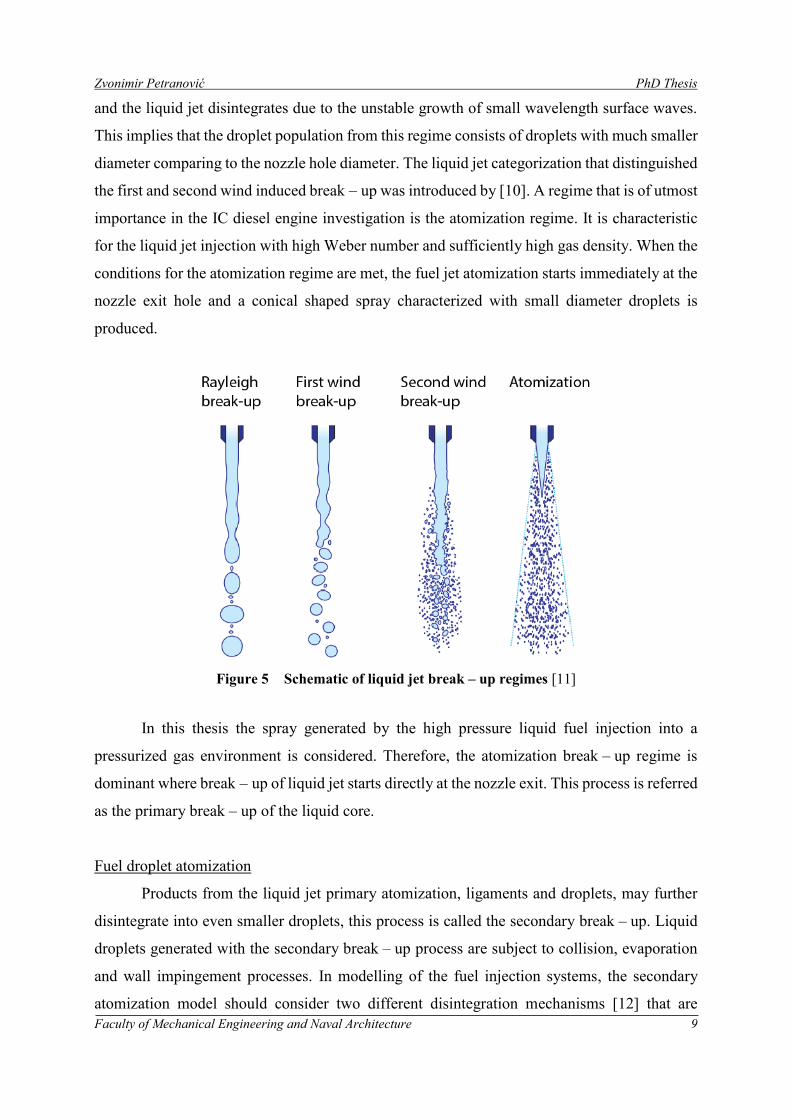
Fuel droplet atomization
Products from the liquid jet primary atomization, ligaments and droplets, may further
disintegrate into even smaller droplets, this process is called the secondary break – up. Liquid
droplets generated with the secondary break – up process are subject to collision, evaporation
and wall impingement processes. In modelling of the fuel injection systems, the secondary
atomization model should consider two different disintegration mechanisms [12] that are
Zvonimir Petranović PhD Thesis
Faculty of Mechanical Engineering and Naval Architecture 10
dominant for higher droplet – gas relative velocities. This mechanisms are known as the
Rayleigh – Taylor (RT) accelerative instabilities and Kevin – Helmholtz (KH) instabilities
responsible for deformations on the droplets surface.
The secondary atomization process is characterized considering the gas Weber number.
According to [13], there are five regimes of secondary break – up process, as illustrated in
Figure 6. The gas Weber number correlates the aerodynamic and surface tension forces.
Figure 6 Schematic of droplet secondary break – up regimes reproduced from [13]
a) At low Weber numbers (We < 12), droplet surface instabilities develop at natural
frequency which is amplified by the surrounding flow. At such conditions, the droplet
disintegration process occurs at relatively large time scales and only a small number of
large fragments are being created. This regime is called the vibrational break – up, and
usually it is not considered in droplet break – up studies.
b) Increasing the Weber number (12 < We < 50), liquid droplets undergo the bag
break – up regime. Herein, a thin hollow bag is being formed and blown off the droplet
surface as a result of aerodynamic forces. The bag burst at some point creating toroidal
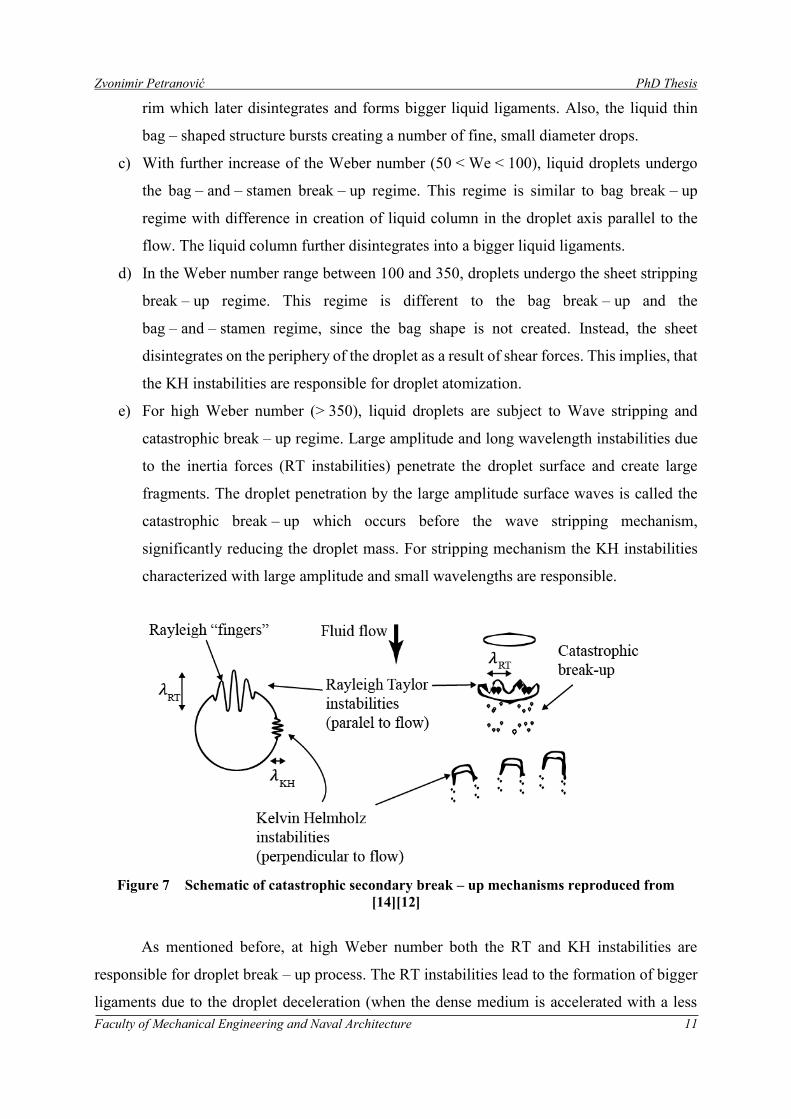
Zvonimir Petranović PhD Thesis
Faculty of Mechanical Engineering and Naval Architecture 11
rim which later disintegrates and forms bigger liquid ligaments. Also, the liquid thin
bag – shaped structure bursts creating a number of fine, small diameter drops.
c) With further increase of the Weber number (50 < We < 100), liquid droplets undergo
the bag – and – stamen break – up regime. This regime is similar to bag break – up
regime with difference in creation of liquid column in the droplet axis parallel to the
flow. The liquid column further disintegrates into a bigger liquid ligaments.
d) In the Weber number range between 100 and 350, droplets undergo the sheet stripping
break – up regime. This regime is different to the bag break – up and the
bag – and – stamen regime, since the bag shape is not created. Instead, the sheet
disintegrates on the periphery of the droplet as a result of shear forces. This implies, that
the KH instabilities are responsible for droplet atomization.
e) For high Weber number (> 350), liquid droplets are subject to Wave stripping and
catastrophic break – up regime. Large amplitude and long wavelength instabilities due
to the inertia forces (RT instabilities) penetrate the droplet surface and create large
fragments. The droplet penetration by the large amplitude surface waves is called the
catastrophic break – up which occurs before the wave stripping mechanism,
significantly reducing the droplet mass. For stripping mechanism the KH instabilities
characterized with large amplitude and small wavelengths are responsible.
Figure 7 Schematic of catastrophic secondary break – up mechanisms reproduced from
[14][12]
As mentioned before, at high Weber number both the RT and KH instabilities are
responsible for droplet break – up process. The RT instabilities lead to the formation of bigger
ligaments due to the droplet deceleration (when the dense medium is accelerated with a less
Zvonimir Petranović PhD Thesis
Faculty of Mechanical Engineering and Naval Architecture 12
dense one). They are characterized by large amplitude surface oscillations. On the other hand,
the KH instabilities are associated with lower values of amplitude and wavelength. Both
mechanisms are schematically shown in Figure 7.
Spray characterization
To validate the developed mathematical models used for spray modelling, several spray
properties have to be defined and experimentally recorded. Usually, the quantities of interest
are fuel liquid and vapour penetrations, spray angle, droplet size and number distributions, etc.
Regarding the reactive spray process characterization a lift – off length and ignition delay time
are used. Roughly, the quality of atomization is determined by two parameters: level and
uniformity of atomization. The level of atomization refers to the mean diameter of droplets,
whilst the uniformity refers to the scatter of droplet diameters where a smaller scatter denotes
higher uniformity level.
Spray penetration is not exactly defined and its quantification depends on the used
measuring technique and measuring accuracy. Some authors define the liquid and vapour
penetration as the furthest distance where their experimental apparatus recorded the fuel
droplets or vaporized fuel. From this definition, it can be stated that the penetration depends on
the measuring equipment accuracy. Furthermore, the liquid penetration could be defined as the
distance where a certain mass of liquid fuel is penetrated into the domain, compared to the
overall spray mass. During the CFD simulations and spray model development, of utmost
importance is to correctly interpret the used experimental data. Otherwise, wrong conclusions
may be drawn. For IC diesel engines it is characteristic that the liquid and vapour temporal and
spatial penetrations are similar at early stage of injection. In later stages, when the liquid fuel
reaches the quasi – steady (developed) state, the vaporized fuel continues to develop through
the domain due to the momentum transferred from the liquid fuel. Another examined spray
characteristic, closely related to the liquid tip penetration is the liquid core break – up length. It
is measured as the axial distance between the tip of liquid jet and the nozzle orifice. Several
investigations regarding the tip penetration and break – up length were reported in the literature.
For example, the influence of ambient pressure on the liquid jet break – up length was
investigated in [15][16] where the authors provided correlations between the liquid core
break – up length, injection pressure and the surrounding gas density. The influence of the
injection pressure on the spray properties was observed in the research conducted by [17]. In
their research, the authors reported that the liquid penetration increases with the increase in
Zvonimir Petranović PhD Thesis
Faculty of Mechanical Engineering and Naval Architecture 13
injection pressure, whilst it decreases with higher ambient pressure. The influence of the fuel
properties and fuel temperature on liquid fuel penetration was described in the research carried
out by [15].
Another spray characteristic that is used to define spray processes is the spray angle,
which is defined as the opening angle of the fuel vapour cloud, as shown in Figure 8. The
experimental measurement of this quantity is not straightforward due to the highly transient
spray cloud development. In this thesis, the spray angle is quantified as a single value defined
at 70 % of spray vapour cloud penetration in the axial direction recorded at the end of injection.
In modelling of spray processes, the definition of the spray angle depends on the used approach.
For instance, in Euler Lagrangian DDM approach the spray angle have to be pre – defined by
the user, whilst in the Euler Eulerian size – of – classes approach the spray spreading is
dynamically calculated through use of the turbulent dispersion model. The spray shape must
ensure a proper droplet distribution through the combustion chamber [18]. In the literature, it is
reported that the spray angle is affected by the environment density, but it is not dependent on
the injection pressure [15][17][18]. A denser gas environment results in a wider spray cloud
characterized with shorter liquid penetration length. This could be addressed to the fact that
higher energy is acquired for the fuel propagation due to the increase of the surrounding gas
density. As a result, instead of penetrating along the spray axis direction, the fuel droplets spread
in the radial direction due to the increased dissipation forces.
The common spray characteristic recorded in the experimental research are
liquid/vapour penetration and spray angle. This can be addressed to high expenses of
experimental research for measuring spray microscopic characteristics, such as droplet number
and volume distributions. To develop efficient computational models that are capable to capture
the transient spray behaviour, a more detailed experimental data are necessary. For instance,
the ECN [19] database offers additional data such as the mixture fraction distribution in the
axial and radial direction on several distances from the injecting point. This data is valuable to
quantify the accuracy of mass and momentum transfer from the liquid to the vapour phase. The
cutting plane AA in Figure 8 is one example where the axial mixture fraction could be
experimentally and computationally recorded, whilst planes B1B1 and B2B2 could be used for
recording the radial mixture distribution.
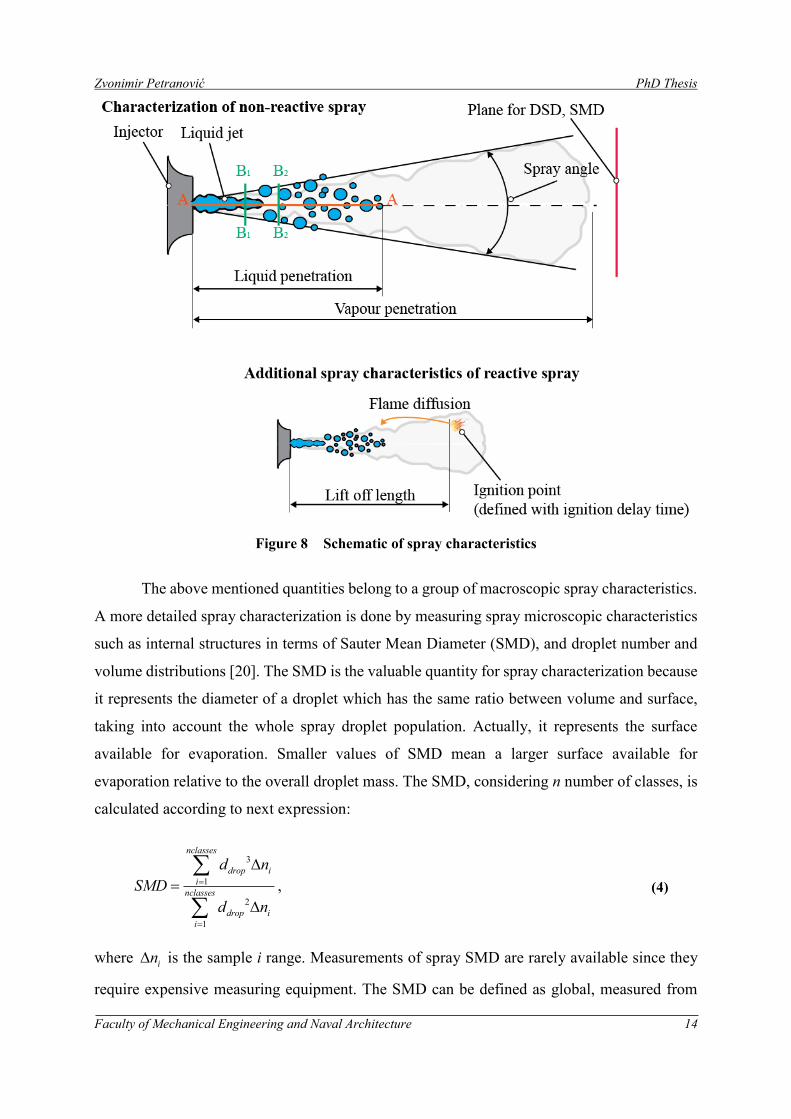
Zvonimir Petranović PhD Thesis
Faculty of Mechanical Engineering and Naval Architecture 14
Figure 8 Schematic of spray characteristics
The above mentioned quantities belong to a group of macroscopic spray characteristics.
A more detailed spray characterization is done by measuring spray microscopic characteristics
such as internal structures in terms of Sauter Mean Diameter (SMD), and droplet number and
volume distributions [20]. The SMD is the valuable quantity for spray characterization because
it represents the diameter of a droplet which has the same ratio between volume and surface,
taking into account the whole spray droplet population. Actually, it represents the surface
available for evaporation. Smaller values of SMD mean a larger surface available for
evaporation relative to the overall droplet mass. The SMD, considering n number of classes, is
calculated according to next expression:
3
1
2
1
nclasses
drop i
i
nclasses
drop i
i
d n
SMD
d n
, (4)
where in is the sample i range. Measurements of spray SMD are rarely available since they
require expensive measuring equipment. The SMD can be defined as global, measured from
Zvonimir Petranović PhD Thesis
Faculty of Mechanical Engineering and Naval Architecture 15
the whole spray droplet population, or as SMD at a certain location of spray. Regarding the
time scale, the SMD can be recorded instantaneously at any desired time frame, or it can be
averaged over a certain time period. Experimental investigations regarding the SMD have been
performed in [21][22][23][24], where the authors reported that with increase in injection
pressure the SMD exhibits lower values, whilst with increase of ambient density the SMD
increases. The authors also stated that the choice of the injection system influences the overall
SMD value. Furthermore, in the literature it was addressed, that smaller droplets retain around
the spray axis whilst bigger droplets form the edge of the spray cone [25]. In example discussed
in this thesis, the SMD was defined as the global “planar cut” SMD, averaged for time period
from 3 to 8 ms after start of injection.
The averaged SMD provides valuable information about the surface available for
evaporation, but it does not provide information about the shape of the droplet size distribution.
It is obvious that such detailed experimental data is of great importance for validation of new
spray related models. Other microscopic spray characteristics used for model validation within
this thesis are the droplet size probability density functions, which are either number or volume
based, and they consider the whole spray droplet population.
In order to quantify the reactive spray process, two quantities are defined: the Ignition
Delay (ID) and the Lift Off Length (LOL). In the literature there are several different definitions
that are used for describing the ID. The ID can be defined as the highest gradient in the rate of
heat release curve or the highest mean pressure gradient. On the other hand, it can be defined
as time from start of injection to the time instance when first traces of the high temperature
flame are recorded. Within this thesis, the ID was defined as the time period calculated from
the SOI until a temperature higher than 1600 K was firstly recorded in the computational
domain. It is worth to note that the ID definition should be carefully chosen by taking into
account the used experimental technique. The same is valid for the LOL, which is defined as
the smallest distance between the injection point and the spatial location where the gas
temperature exceeds 1600 K. Alternatively, the LOL can be determined by observing the OH
species concentration, which is beneficial if the OH chemiluminescence measurement
technique was applied.
The rate of injected fuel correlated to the crankshaft angle is referred to the “Rate Of
Injection (ROI) characteristics”. The integrated ROI curve provides the total fuel mass injected
for each engine injection process. Such curve can be used as boundary condition of the spray
inlet in CFD simulations, and therefore, it is of great importance to acquire a reliable ROI
Zvonimir Petranović PhD Thesis
Faculty of Mechanical Engineering and Naval Architecture 16
characteristic. For the validation of the spray method developed within this thesis, a new type
of spray boundary condition was developed and the ROI curve was used.
1.2.3. Combustion Processes
Reactive sprays are used in various engineering applications, and they are burned under
a variety of circumstances. According to [26], different combustion models are used for
different applications. For example, in liquid rocket engines, both, the liquid and the oxidizer,
are injected from one end providing a premixed combustion process. For this kind of application
a steady – state combustion model can be applied. Other examples are gas turbine combustor,
which are similar to rocket engines but different since the combustion process is diffusion
driven. The IC diesel engines are one of the most difficult application for modelling the
combustion process. In such engines the combustion is a diffusion driven and highly transient
process. Additionally, the flow is three – dimensional and the influence of the fuel impingement
on the piston wall surface may have a significant influence on the overall engine performance.
Combustion process in IC diesel engines
The combustion process occurring inside the IC diesel engine combustion chamber is
divided into several distinguished parts. The green curve in Figure 9 shows the mean
in – cylinder pressure curve through the engine working cycle, including the compression and
expansion strokes. In the compression stroke the engine piston moves towards Top Dead Centre
(TDC) and compresses the cylinder working volume, which leads to pressure and temperature
rise. At a certain crank angle position, in general several degrees before TDC, the liquid fuel is
injected into the cylinder. The Start Of Injection is denoted with SOI in Figure 9. The
abbreviation EOI stands for the End Of Injection, whilst the area below the rate of injection
curve represents the liquid mass injected into the cylinder. Usually, the ROI curve has a “hat-
like” shape, and it is defined by the nozzle needle movement and fuel pump pressure. Once the
liquid fuel is injected, due to the elevated temperature conditions, the fuel starts to evaporate
and to combust. The time between SOI and start of premixed combustion is denoted as ID,
which depends on the fuel type, pressure conditions and piston bowl shape.
When the vaporized fuel is ignited, an uncontrolled and fast combustion process,
characterized by a rapid pressure increase and a huge heat release, takes place. In this period,
the fuel is partially oxidized to CO, H and C2H2 which tend to diffuse towards nonpremixed
regions. The premixed combustion speed depends on the air excess ratio and on the in - cylinder
temperature.
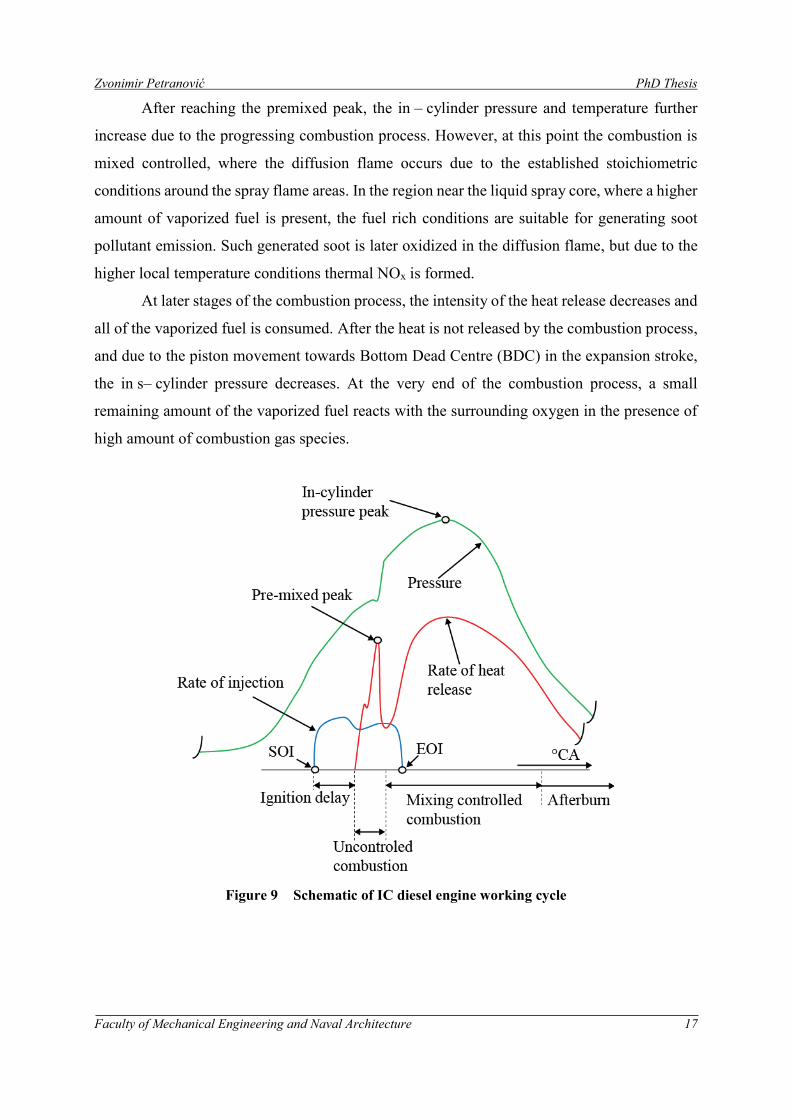
Zvonimir Petranović PhD Thesis
Faculty of Mechanical Engineering and Naval Architecture 17
After reaching the premixed peak, the in – cylinder pressure and temperature further
increase due to the progressing combustion process. However, at this point the combustion is
mixed controlled, where the diffusion flame occurs due to the established stoichiometric
conditions around the spray flame areas. In the region near the liquid spray core, where a higher
amount of vaporized fuel is present, the fuel rich conditions are suitable for generating soot
pollutant emission. Such generated soot is later oxidized in the diffusion flame, but due to the
higher local temperature conditions thermal NOx is formed.
At later stages of the combustion process, the intensity of the heat release decreases and
all of the vaporized fuel is consumed. After the heat is not released by the combustion process,
and due to the piston movement towards Bottom Dead Centre (BDC) in the expansion stroke,
the in s– cylinder pressure decreases. At the very end of the combustion process, a small
remaining amount of the vaporized fuel reacts with the surrounding oxygen in the presence of
high amount of combustion gas species.
Figure 9 Schematic of IC diesel engine working cycle
Zvonimir Petranović PhD Thesis
Faculty of Mechanical Engineering and Naval Architecture 18
1.2.4. Emissions from IC diesel engines
A vast amount of Green House Gasses (GHG) are released into the environment by
combusting fossil fuels [27], and a rapid emission reduction (up to 85 %) has to be achieved by
2050 [28]. Both, the powering of diesel engines and fossil fuel combustion in a great amount
contribute to the increase of atmosphere GHG concentrations. Most of the worldwide CO2
emissions are released by burning the coal for power production and from the transportation
sector. According to [29], in 2013 the share of transportation sector in global CO2 emission was
approximately 25 %. This can be addressed to a rapid increase of motor vehicles and limited
use of emission control systems. Usually, running by the diesel engines is preferred comparing
to the gas oil engines due their low operating costs, reliability, energy efficiency, etc. Therefore,
in this section of the thesis, a description of emissions released from the IC diesel engines is
provided. The special focus is given to Particulate Matter (PM) and NOx emissions, because
diesel engine flue gases contain higher amounts of NOx and PM. In the later sections, a brief
description of HC and CO emissions is provided.
Diesel fuel is comprised of carbon and hydrogen molecules in a certain ratio. For ideal
conditions, the complete diesel fuel combustion would lead to generation of CO2 and H2O
species. In addition to CO2 and H2O, in highly transient IC engine working conditions, a vast
amount of other species is produced. The major part of these emissions are harmful pollutant
species such as CO, HC, PM and NOx. In relative comparison to total flue gas amount, only
1 % of pollutant emissions is released from the engine exhaust system. A major part of these
pollutant emissions, approximately 50 %, are the NOx pollutants whilst the second biggest
emission share belongs to the PM emissions [30]. Even though other species such as CO, HC,
and SO2 are found in really small concentrations, they are not negligible due to their toxic
influence on the human health and destructive behaviour towards the Earth ozone layers.
Nitrogen oxides (NOx)
Among various types of vehicles, diesel driven ones are the major contributors to NOx
emissions. This is mostly a consequence of their higher in – cylinder temperatures compared to
the gasoline engines. NOx emissions causes health problems, contribute to acidification, support
destruction of the ozone layer, causes smog formation, etc. Their impact on human health is
usually connected with lung and respiratory system diseases.
During the compression stroke of IC diesel engine the in – cylinder pressure and
temperature increase, and consequently these conditions lead to auto ignition of the vaporized
Zvonimir Petranović PhD Thesis
Faculty of Mechanical Engineering and Naval Architecture 19
fuel. In low temperature conditions, the nitrogen from the entrained air would not react with the
surrounding oxygen. However, the in – cylinder temperatures found in the diesel engine
combustion chamber reach locally values above 1850 K [31]. Such temperatures are enough to
break – up nitrogen triple bonds and to form nitrogen oxides (NOx), which are referred as NO,
NO2, N2O, N2O2, N2O3, N2O4, and N2O5 [32]. Most of the NOx emissions, approximately
85 - 95 %, is constituted of the hazardous nitrogen compound nitric oxide NO. Nitric oxide can
be produced by several mechanisms such as thermal, prompt, and fuel mechanism. To model
the thermal NO emissions, a reaction mechanism was previously developed by Zeldovich [33].
This mechanism is described by a set of chemical reactions where reaction constants are gained
from the experimental research. Some authors noticed that the NO species concentration is
much higher than those predicted by the Zeldovich mechanism, which was addressed to the
prompt NO formation. The NO emissions formed by prompt mechanism occurs much earlier
than the previously described thermal NO emissions. They are formed by the reaction of
atmospheric nitrogen and hydrocarbon fragments, which is further oxidized to form NO. The
third mechanism of NO formation is the fuel mechanism relevant when the liquid fuel contain
organically bounded nitrogen, which is released during the combustion process. However,
organically bounded nitrogen can be found only in heavy fuels and in coal.
Particulate matter
PM emissions in the exhaust gases are formed during the combustion process within the
engine combustion chamber. The PM has a wide range of potential environmental impacts,
including health effects, ecological effects, climate change, etc. The new PM emission
threshold limits are so low that they cannot be achieved solely by engine design and, therefore,
engine flue gases require additional aftertreatment. The PM consists of two types of particles:
(a) fractal – like agglomerates of primary particles 15 – 30 nm in diameter, composed of carbon
and traces of metallic ash (partly burned fuel), and coated with condensed heavier end organic
compounds and sulfate (partly burned lube oil); (b) nucleation particles composed of condensed
hydrocarbons and sulfate [34]. Diesel PM are usually spherical with diameters of about
15 – 40 nm, and approximately more than 90 % of PM are smaller than 1 μm in diameter.
According to [35], the PM formation process is dependent on many factors such as combustion
process and expansion stroke, fuel quality, lubrication oil quality, oil consumption, combustion
temperature, exhaust gas cooling, etc. The PM emissions from IC diesel engines are
approximately six to ten times higher than from gasoline engines.
Zvonimir Petranović PhD Thesis
Faculty of Mechanical Engineering and Naval Architecture 20
The PM emissions can be divided into three main components: soot, Soluble Organic
Fraction (SOF), and Inorganic Fraction (IF). More than 50 % of the total PM emissions are
soot, which can be observed as black smoke.
Carbon monoxide (CO)
The carbon monoxide (CO) is released into the Earth atmosphere due to the incomplete
combustion where the oxidation process did not occurred completely. Usually, it is generated
under the fuel rich conditions where carbon cannot convert to CO2 due to oxygen deficiency.
However, a small amount of CO can also occur in the fuel lean conditions, which is of particular
importance for IC diesel engines. The CO can be also formed, if the right conditions are
achieved, such as too high SMD, to low turbulence or swirl motion, etc.
Carbon monoxide emissions have a negative effect on the human health. If inhaled, it
binds to haemoglobin and inhibits its capacity to transfer oxygen causing severe health issues.
Hydrocarbons (HC)
Another pollutant compound that affect the Earth’s environment and Human health are
hydrocarbons. Regarding the influence on the environment, they are a huge contributor to
ground level ozone formation and from the standpoint of human health, hydrocarbons are
harmful to respiratory tract. They are usually formed from the unburned fuel in lower
temperature regions near the cylinder walls. Therefore, a proper spray development and engine
design could contribute to HC emission reduction. If the unburned HC outflow to the exhaust
pipes and the conditions are adequate, they continue to react, and emitted HC concentration
could be several times lower than those found inside the engine cylinder.
1.2.5. Modelling Spray Processes
Numerous studies about spray processes have helped engineers to establish the criteria
needed to design and develop more efficient combustion devices while minimizing the pollutant
emissions [36][37][38]. The understanding of the complex fuel spray process, which are mostly
formed by high pressure injectors [39], in experimental research is limited and this
understanding can be significantly improved with the numerical simulations. Compared to a
single – phase flow modelling the modelling of the spray process, which represents a
multiphase flow is a very challenging task. The challenges arise from the interaction between
phases and property variations across the phase interfaces. Thus, computational spray models
demand a complicated techniques to couple the dynamics of the liquid droplets with the carrier
Zvonimir Petranović PhD Thesis
Faculty of Mechanical Engineering and Naval Architecture 21
gas. A variety of strategies have been formulated during the last years in order to address this
problem. In general, most of these strategies fall into two basic methods that are commonly
used to couple the dynamics of the liquid and the gas phase: the Euler Lagrangian and the Euler
Eulerian method.
The Euler Lagrangian method has been firstly used in [40][41][42][43]. Currently, this
method is the most common method for numerical modelling of spray processes in a wide range
of engineering applications. In such method, the spray is represented by a finite numbers of
grouped droplets called parcels. The assumption is that all droplets of a single parcel have the
same size and physical properties. The transport of each parcel through the flow field is solved
by using the Lagrangian formulation, whilst the continuous gas phase is described by solving
the Eulerian conservation equations. The phase coupling is performed by introducing the source
terms for interfacial mass, momentum and energy exchange. The Euler Lagrangian method has
several limitations, as it is very sensitive to the numerical grid resolution in the near nozzle
region [44]. The limitations on grid size also affect the modelling of heat transfer, momentum
exchange, etc. Therefore, the numerical resolution is important in reproducing the structure of
sprays [45]. This results in inadequate description of dense spray region in the vicinity of the
nozzle. However, the Euler Lagrangian method is suitable for calculating the diluted region,
where a lower liquid phase volume fraction is encountered. Other drawbacks of the Euler
Lagrangian formulation are the increase of computational costs with higher number of
introduced parcels, and the parallelization issues. The method also suffers from the statistical
convergence problems, as discussed in [46] and [47].
A spray process can be modelled by employing the numerical methods used for tracking
the liquid – gas interface, such as VOF and level – set methods. Authors in [48] examined the
liquid jet break – up (constant injection velocity of 100 m/s, nozzle diameter 100 µm) on a
2.1 mm computational domain consisting of over 14 million control volumes by employing the
level set/ VOF/ ghost fluid method. The authors in [49] used the level set method to solve the
disintegration of a liquid jet with same injection conditions on a 2 mm computational domain
consisting of several billions control volumes. The authors in [50] presented the modelling of
primary atomization process by employing the refined level set grid method. They pointed out
extremely high memory requirements (10 GB for every 50 ns) of such simulations. More
detailed description of sharp interface techniques for multi – fluid flow modelling can be found
in [51]. Based upon the literature review, despite their high accuracy, such models are highly
Zvonimir Petranović PhD Thesis
Faculty of Mechanical Engineering and Naval Architecture 22
computationally expensive which represents a huge disadvantage for their usage in the
industrial sector.
To overcome disadvantages of the Euler Lagrangian method, the Euler Eulerian
multi – continuum method can be employed. In this method, both phases (liquid and gas) are
treated as continuum, and conservation equations are solved for each phase separately. The
Euler Eulerian method was firstly addressed by [52], and has been adopted and applied for
computational simulations, e.g., [53][54][55], and others. Compared to the Euler Lagrangian
method, the Euler Eulerian method is fairly efficient for calculation of flows with high droplet
concentration. Driven by those facts, the two mentioned methods can be used in combination
to overcome disadvantages inherent for both methods and to improve the accuracy of spray
modelling. Coupling of the methods can be performed by using the AVL FIRE® Code Coupling
Interface [56][57][58][59]. The coupling process means that the calculated results of both
simulations are used either as boundary condition values, or as source/sink terms for the other
simulation. The coupled modelling is performed on the two separate computational simulations
with overlapping domains where a certain rules are applied for mass, momentum and energy
source terms exchange. A detailed explanation on the mentioned spray modelling approach is
described in [60].
An alternative to the coupled ACCI modelling approach is the ELSA model proposed in
[61]. This approach has been under constant development, as discussed by [62], [63], and
others. It is used for modelling the high speed turbulent sprays in order capture the processes
within the dense spray region. Basically, ELSA model can be divided into three zones: Eulerian
mixture zone, transition zone and the Lagrangian zone. The main difference between the ELSA
and the ACCI approach is that in the ELSA model, in the vicinity of the nozzle the gas and the
liquid phase are considered as one mixture phase.
1.2.6. Modelling Reactive Spray Processes
Reactive turbulent spray processes have been modelled by employing various
approaches such as eddy dissipation model, flamelet models, PDF methods, reaction
mechanisms, etc. The numerical modelling of a reactive methanol spray employing the Euler
Lagrangian spray approach and the Eddy Dissipation Concept combustion model (EDC) was
presented in [64]. The authors mentioned that the use of detailed chemistry would give a more
reliable results for spray combustion. In recent years, researchers showed that detailed kinetic
mechanisms are essential to properly predict spray burning characteristics such as lift off length.
Combustion of diluted methanol sprays was performed in [65] and [66], whilst the diluted
Zvonimir Petranović PhD Thesis
Faculty of Mechanical Engineering and Naval Architecture 23
ethanol/air spray combustion was presented in [67]. To account the influence of the turbulence
on the spray combustion, a detailed investigation was performed by [68]. The authors used the
steady flamelet model together with a detailed reaction mechanism in combination with the
Euler Lagrangian method for spray modelling. The influence of the nozzle orifice geometry on
combustion of the n – heptane spray, employing the same spray approach in combination with
a detailed chemistry was discussed in [2]. The authors noticed a significant influence of injector
design on spray combustion characteristics. Furthermore, the research of [69] showed the
influence of injection timing on pollutant emissions, whilst the possibility of Euler Lagrangian
spray approach to predict the NO and soot trends for various combustion parameters was shown
in [70]. In the research of [71], the Euler Lagrangian spray approach in combination with the
ECFM combustion model and presumed Probability Density Function (PDF) look – up table
was used to model the dual fuel turbulence – chemistry interactions.
The Euler Eulerian reactive spray modelling was also researched in recent years. The
simulation of reactive diluted sprays by employing the Euler Eulerian approach in combination
with the eddy break – up combustion model was presented in [72]. Their method correctly
described the spray combustion process, but discrepancies in modelled CO and CO2 species
concentrations have been recorded. The PDF Chemical equilibrium combustion model in
combination with the Euler Eulerian spray approach, without discretisation of the liquid phase
into droplet classes [73] was used for research of reactive sprays [74].
The LES studies, which can be used for studies of cyclic variabilities, need a high
number of Lagrangian parcels to achieve accuracy, and therefore the Euler Eulerian approach
could be used within the LES modelling framework [75]. To avoid the difficulties of near nozzle
region, the authors introduced the downstream inflow turbulent boundary condition model [76].
The tabulated chemistry within the LES framework, where the discrete phase was described
with the Eulerian modulation, was used for modelling the combustion process of a diluted
n – heptane fuel [77]. The combustion of the mono dispersed spray, modelled with the Euler
Eulerian spray approach within the LES framework was researched in [78]. The authors
highlighted the influence of the dispersed phase on the flame propagation. The importance of
the poly dispersed spray was shown in [79], where the flamelet generated manifold based on
tabulated chemistry was coupled to an advanced spray module in order to investigate the
partially premixed reacting acetone sprays. Combustion of two phase flows in the LES
framework is still in its infancy and a good summary is presented in [80].
Zvonimir Petranović PhD Thesis
Faculty of Mechanical Engineering and Naval Architecture 24
From the given literature review regarding modelling reactive spray processes, it can be
concluded that the Euler Eulerian multi – continuum model extended to the size – of – classes
approach has not been extensively tested on its ability to capture highly turbulent diesel spray
and combustion processes. The main objective of this thesis was to develop a new
computational method in order to resolve the dense spray region including the atomization,
collision and evaporation processes, and to link it with the downstream vapour combustion.
1.3. Objective and hypothesis of research
The hypothesis of this thesis is that numerical simulations of liquid fuel injection and
combustion process are feasible, and that the Euler Eulerian multi continuum model
size – of – classes approach in combination with chemistry kinetics can be used in development
of various applications with reactive flow. The results of the thesis provide a reliable description
of spray processes, especially in the near nozzle region. Furthermore, with a detailed spray
characterisation a respectable description of the combustion process is achieved. The ultimate
goal of thesis was to establish a model that confirms the hypothesis by comprehensive
comparison of modelling results and the available experimental data.
1.4. Materials and methodology of research
There are several existing approaches used for solving turbulent dispersed multiphase
flows such as DNS resolving the particles, the Discrete Particle Model (DPM), the Euler
Lagrangian, and the Euler Eulerian model, etc. [51]. The Euler Lagrangian approach is a
common and widely used numerical approach for modelling the spray process, but it has some
disadvantages. In order to overcome these disadvantages, the Euler Eulerian multi – continuum
approach can be used. This approach considers the liquid and the gas phases as interpenetrating
continuum, and both phases are treated from the Eulerian point of view. The same
discretization, similar numerical techniques and conservation equations are used for both
phases. For improved modelling accuracy, the droplet distribution is divided into a fixed
number of droplet classes characterized by their droplet diameter. The complete set of
conservation equations with additional source terms accounting for the droplet dynamics are
solved for the gas phase and for each droplet class under consideration.
In this thesis the mathematical models used for calculation of the spray and combustion
processes are treated in the Eulerian spray module of the applied CFD code, where
thermochemical reactions occur in the gas phase within a certain control volume. The chemical
Zvonimir Petranović PhD Thesis
Faculty of Mechanical Engineering and Naval Architecture 25
reactions of the gas phase are treated via an Ordinary Differential Equation (ODE) solver
providing an additional sink and source terms for the species and enthalpy transport equations.
The presented spray model is integrated into the commercial CFD code AVL FIRE® by using
the user defined function capability based on FORTRAN subroutines. The conducted research
is performed in several steps to get a reliable and accurate approach for modelling spray and
combustion processes.
In the first step a comprehensive literature review regarding the spray modelling was
shown and several computational simulations of the real engine configuration, using the Euler
Lagrangian approach, are presented. The different combustion parameters were researched, and
their influence on mean temperature and mean pressure is shown. Also, an investigation
regarding the influence of the combustion parameters on the pollutant emission is shown. The
validation process was conducted by comparing the calculated results to the available
experimental data. In this section of the thesis the current status, advantages and disadvantages
encountered by using the Euler Lagrangian approach were investigated.
In the second step of this research, a detailed parameterization of the atomization models
was performed. The liquid jet primary break – up model and the droplet secondary break – up
model were researched and parametrized. In this section the Euler Eulerian size – of – classes
approach was used for spray modelling. The primary and secondary break – up models were
thoroughly examined, and an adequate set of model coefficients was defined. The
parameterization of the spray models was conducted by modelling several evaporative spray
cases, where the liquid fuel is injected into non – reactive, high temperature gas environment.
In the conducted simulations, the evaporation process was enforced, whilst the combustion of
the vaporised fuel was avoided due to deficiency of the reactant species. The modelled results
are compared with the available experimental data, where the influence of model coefficients
on the liquid and vapour tip penetration is presented. Furthermore, for the nozzle flow – spray
coupling interface a several new features were developed. A new type of boundary condition
for spray injection was developed, and the primary atomization model was validated against
the available DNS data.
In the third step, the validation and enhancement of the secondary WAVE break – up
model within the Euler Eulerian framework was performed. The validation of the implemented
code was conducted by comparing the modelled results to the available experimental data found
in the literature, and by examining the high pressure liquid fuel injection with detailed spray
inlet boundary condition. The spray inlet was coupled with the nozzle flow simulation through
Zvonimir Petranović PhD Thesis
Faculty of Mechanical Engineering and Naval Architecture 26
the enhanced and modified nozzle file interface. In such interface the turbulence, temperature,
velocity, volume fraction, and density information are recorded for each phase. In the spray
simulation, the recorded data was adequately mapped to the spray inlet boundary selection,
which was then used for representing a realistic fuel injection process. The results of high
pressure liquid fuel injection into a constant volume chamber filled with an inert gases are
presented. The spray cloud shape, spray cone angle, liquid penetration, and droplet size
distribution are compared to the available experimental data.
In the fourth step, the stochastic O’Rourke collision model was modified for the Euler
Eulerian size – of – classes approach and it was implemented into the CFD code FIRE®. The
collision between droplets is considered for defined interfaces in all computational cells where
a certain amount of liquid fuel is present. For each droplet class participating on the collisions
process, the droplet diameter, velocity and temperature are properly defined according to the
mass, momentum and energy conservation laws. The model is currently used to predict the
coalescence of the colliding droplets.
In the fifth step the Euler Eulerian spray model was enhanced with the combustion
model. The results of this section offer a new method that uses the general gas phase reactions
for modelling the combustion process in combination with the Euler Eulerian size – of – classes
approach. The method was developed by performing plausibility tests on a constant volume
reactor filled with liquid – gas mixture under elevated pressure and temperature conditions. The
influence of evaporation on the mass balance, heat release and temperature change due to the
combustion is discussed.
In the sixth step, the developed and verified method was validated by comparing
modelling results with the available experimental data from ECN database. The liquid and
vapour phase penetrations, the radial and axial mixture distribution, the spray cloud shape and
the temperature fields are compared with the experimental data. Initially, the modelling of high
pressure liquid fuel injection into the non – reactive environment was performed. Afterwards,
the validation of the developed method was conducted by numerical modelling of various
reactive spray cases, and by comparing lift off length, pressure rise, OH radical concentration,
and temperature fields to the available experimental data.
Finally, the developed method and validated spray sub models were used for 3D CFD
modelling of a real engineering combustion system such as IC diesel engine. The engine
working cycle (compression and expansion stroke) was modelled by including the mesh
Zvonimir Petranović PhD Thesis
Faculty of Mechanical Engineering and Naval Architecture 27
movement and geometry mapping called mesh rezone. The simulated mean pressure and
temperature traces, as well as the ROHR are compared to the available experimental data.
1.5. Scientific contribution
The result of this thesis is a new method that can be used for modelling spray and combustion
processes. The method was developed by combining the Euler Eulerian multi – continuum
model size – of – classes approach with the chemical kinetics. The existing nozzle flow – spray
interface was enhanced for MPI simulations and a new type of spray inlet boundary condition
was developed. The Eulerian spray model was enhanced by the droplet collision model, and the
primary atomization model was validated against the DNS data. To improve prediction of the
droplet size distribution, the existing disintegration model was enhanced by taking into account
child droplets. It can be stated that the developed method can be used to extend the applicability
of the Euler Eulerian size – of – classes approach for various engineering applications with
reactive multiphase flows.
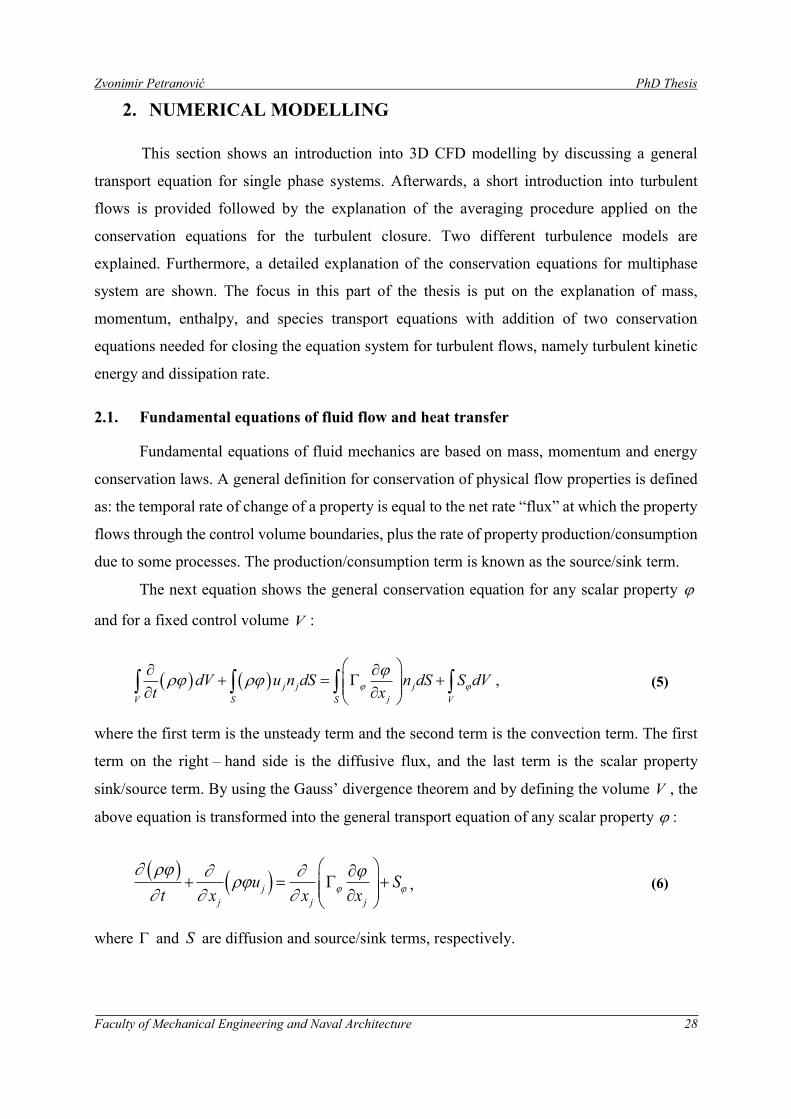
Zvonimir Petranović PhD Thesis
Faculty of Mechanical Engineering and Naval Architecture 28
2. NUMERICAL MODELLING
This section shows an introduction into 3D CFD modelling by discussing a general
transport equation for single phase systems. Afterwards, a short introduction into turbulent
flows is provided followed by the explanation of the averaging procedure applied on the
conservation equations for the turbulent closure. Two different turbulence models are
explained. Furthermore, a detailed explanation of the conservation equations for multiphase
system are shown. The focus in this part of the thesis is put on the explanation of mass,
momentum, enthalpy, and species transport equations with addition of two conservation
equations needed for closing the equation system for turbulent flows, namely turbulent kinetic
energy and dissipation rate.
2.1. Fundamental equations of fluid flow and heat transfer
Fundamental equations of fluid mechanics are based on mass, momentum and energy
conservation laws. A general definition for conservation of physical flow properties is defined
as: the temporal rate of change of a property is equal to the net rate “flux” at which the property
flows through the control volume boundaries, plus the rate of property production/consumption
due to some processes. The production/consumption term is known as the source/sink term.
The next equation shows the general conservation equation for any scalar property
and for a fixed control volume V :
j j j
jV S S V
dV u n dS n dS S dVt x
, (5)
where the first term is the unsteady term and the second term is the convection term. The first
term on the right – hand side is the diffusive flux, and the last term is the scalar property
sink/source term. By using the Gauss’ divergence theorem and by defining the volume V , the
above equation is transformed into the general transport equation of any scalar property :
j
j j j
u St x x x
, (6)
where and S are diffusion and source/sink terms, respectively.
Zvonimir Petranović PhD Thesis
Faculty of Mechanical Engineering and Naval Architecture 29
2.2. Turbulent flows
A turbulent flow is characterized by a broad range of temporal and spatial scales.
Therefore, for direct solving of turbulent flows a fine computational mesh and small time steps
should be used. Direct solving of turbulent flows is theoretically possible, but since it requires
higher computational power, in a real engineering applications its use is currently limited. It is
considered that a turbulent flow is composed of different sized eddies, where the largest ones
possess most of the turbulent energy, and they are placed within the spatial scale named energy
range. Energy from larger eddies is transferred towards smaller eddies with spatial scales placed
within the initial subrange. Statistics of subrange eddies depend only on the energy transfer rate
from the larger scale eddies. Furthermore, the energy is transferred towards the smallest scale
eddies placed within the range of Kolmogorov scale. The Kolmogorov length scale becomes
smaller with increase in turbulence, which implies that with turbulent flows characterized by
high Reynolds number, a fine computational domain is required for adequate modelling.
Computational solving of eddies covering the whole time and spatial scales is called DNS. Such
approach is powerful, but currently too expensive for calculating combustion and spray
processes in a real engineering applications. However, such approach can be used for simulation
of simplified or small systems, in some cases with low Reynolds number. For instance, when
the experimental research of a process is not available, or it is highly complicated, engineers
could use DNS modelling results for development of computational models in LES or RANS
framework. The LES stands for Large Eddy Simulations in which turbulent eddies are directly
solved for the energy range, whilst smaller eddies are being modelled by using some turbulence
modelling approach.
The abbreviation RANS stands for the Reynolds Averaged Naiver Stokes equation
approach in which all turbulent eddies are being modelled by means of the turbulence models.
In such approach, the instantaneous variables of turbulent flow quantities are replaced with the
time averaged value and its fluctuating part. Additionally, two terms are introduced into the
conservation equations: the Reynolds stress tensor and the turbulent heat flux which result from
the averaging processes. In order to solve a turbulent flow those terms have to be modelled,
which is done by means of turbulence models. The next section shows the overview of statistical
approaches used for conservation equations averaging within the RANS framework.
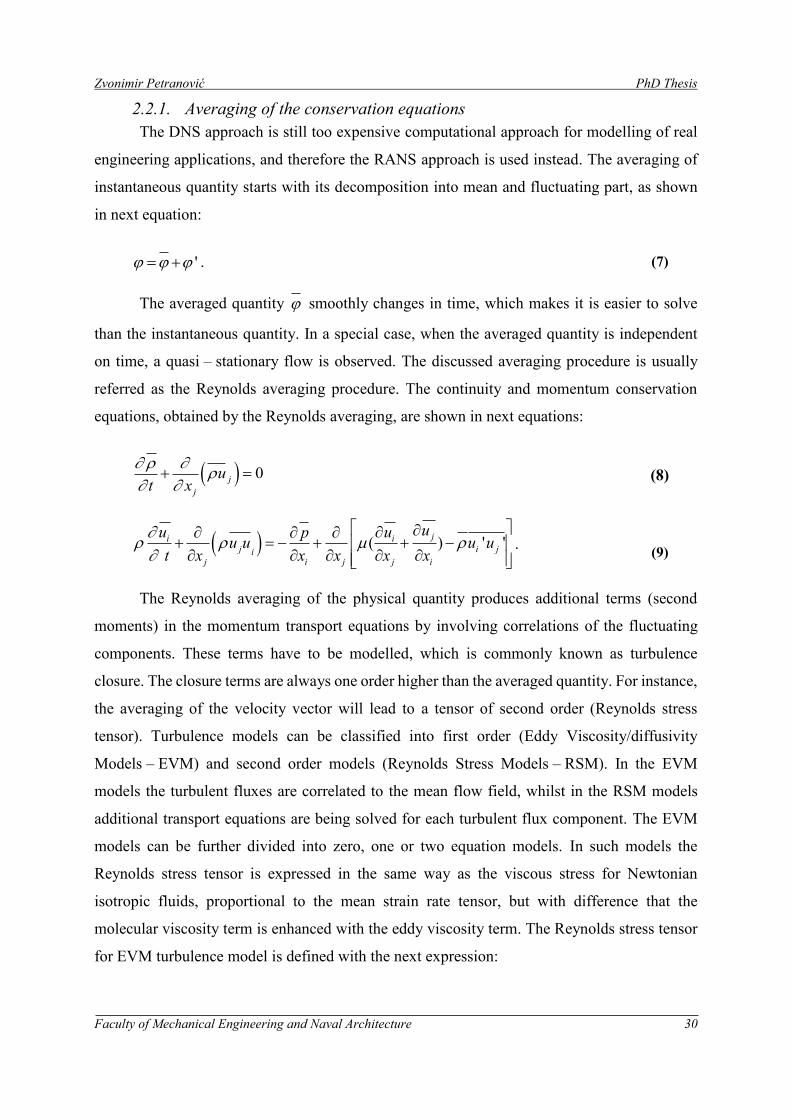
Zvonimir Petranović PhD Thesis
Faculty of Mechanical Engineering and Naval Architecture 30
2.2.1. Averaging of the conservation equations
The DNS approach is still too expensive computational approach for modelling of real
engineering applications, and therefore the RANS approach is used instead. The averaging of
instantaneous quantity starts with its decomposition into mean and fluctuating part, as shown
in next equation:
' . (7)
The averaged quantity smoothly changes in time, which makes it is easier to solve
than the instantaneous quantity. In a special case, when the averaged quantity is independent
on time, a quasi – stationary flow is observed. The discussed averaging procedure is usually
referred as the Reynolds averaging procedure. The continuity and momentum conservation
equations, obtained by the Reynolds averaging, are shown in next equations:
0j
j
ut x
(8)
( ) ' '
ji ij i ji
j i j j i
uu upu u u u
t x x x x x
. (9)
The Reynolds averaging of the physical quantity produces additional terms (second
moments) in the momentum transport equations by involving correlations of the fluctuating
components. These terms have to be modelled, which is commonly known as turbulence
closure. The closure terms are always one order higher than the averaged quantity. For instance,
the averaging of the velocity vector will lead to a tensor of second order (Reynolds stress
tensor). Turbulence models can be classified into first order (Eddy Viscosity/diffusivity
Models – EVM) and second order models (Reynolds Stress Models – RSM). In the EVM
models the turbulent fluxes are correlated to the mean flow field, whilst in the RSM models
additional transport equations are being solved for each turbulent flux component. The EVM
models can be further divided into zero, one or two equation models. In such models the
Reynolds stress tensor is expressed in the same way as the viscous stress for Newtonian
isotropic fluids, proportional to the mean strain rate tensor, but with difference that the
molecular viscosity term is enhanced with the eddy viscosity term. The Reynolds stress tensor
for EVM turbulence model is defined with the next expression:

Zvonimir Petranović PhD Thesis
Faculty of Mechanical Engineering and Naval Architecture 31
2
3
kjii j t t ij
j i k
uu uu u k
x x x
, (10)
where t is the turbulent viscosity and k is the turbulent kinetic energy defined according to
next equation:
' '
2
i iu uk . (11)
In processes with large density variations such as combustion process, the RANS
equations are further complicated due to the velocity density fluctuation term ' 'u . To reduce
the system complexity the Favre averaging is introduced, as shown with eq. (12):
. (12)
Similarly to the Reynolds averaging, the instantaneous quantity is decomposed into Favre mean
and fluctuating component, as shown with next equation:
'' . (13)
Favre averaging is performed on all quantities except pressure and density, which are Reynolds
averaged quantities. The continuity and momentum conservation equations, obtained by the
Favre density averaging, are shown in next equations:
0j
j
ut x
(14)
'' ''
i i j ij
i j i
j i j j
u u upu u f
t x x x x
, (15)
where term '' ''i ju u represents the Reynold stress tensor which needs to be modelled by the
turbulence model. The same conservation averaging principle is put upon the enthalpy and
species conservation equations. In the averaged enthalpy conservation equation, the additional
term '' ''jh u arises, which also needs to be modelled.
Zvonimir Petranović PhD Thesis
Faculty of Mechanical Engineering and Naval Architecture 32
The Reynolds stress tensor shown for Reynolds and Favre averaging is modified according to
next equation:
2
'' ''3
ji ki j t t ij
j i k
uu uu u k
x x x
. (16)
The Favre averaged turbulent kinetic energy is calculated according to next expression:
'' ''
2
i iu uk . (17)
For calculating turbulent stresses and fluxes, the turbulent viscosity and conduction
coefficients have to be known. Those coefficients are not fluid properties, but instead they are
in a function of flow properties. Therefore, Prandtl defined those coefficients by postulating the
turbulent viscosity t according to the gas kinetic theory. Consequently, the viscosity is
calculated according to the next expression:
1
3mollu , (18)
where l is the mixing length and molu is the averaged velocity. Turbulent viscosity is defined
as:
t m tl u , (19)
where ml is the turbulent mixing length and tu is the characteristic turbulent velocity. The
turbulent mixing length must be defined, and it is a function of the observed system and the
flow characteristics. The above mentioned expression for turbulent viscosity is used in zero
equation EVM models, whilst in more complex models (one or two equation), a different
approach for calculation of t is used. In one equation models, an additional transport equation
for the turbulent kinetic energy is solved, whilst the energy dissipation rate is modelled. In two
equation models, both transport equation are being solved. In the following section a brief
introduction into two equation turbulence models is shown, focusing on the widely used k
and the more advanced k f turbulence model.
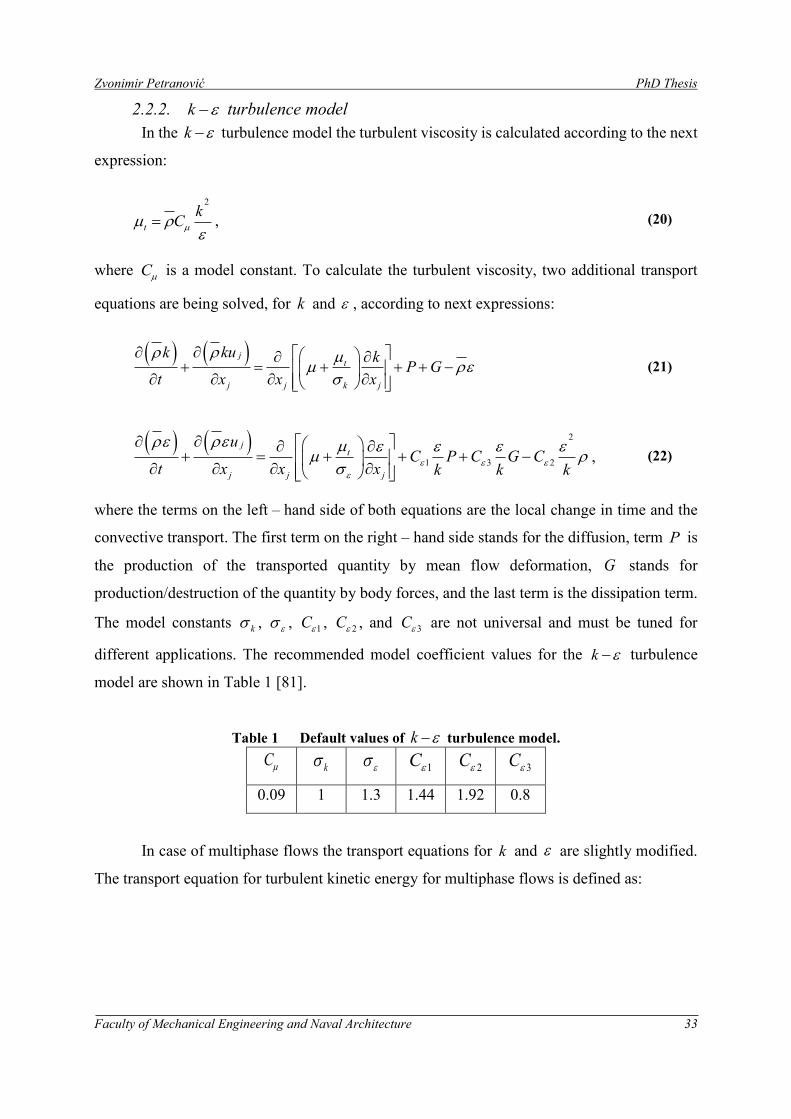
Zvonimir Petranović PhD Thesis
Faculty of Mechanical Engineering and Naval Architecture 33
2.2.2. k turbulence model
In the k turbulence model the turbulent viscosity is calculated according to the next
expression:
2
t
kC
, (20)
where C is a model constant. To calculate the turbulent viscosity, two additional transport
equations are being solved, for k and , according to next expressions:
j
t
j j k j
kuk kP G
t x x x
(21)
2
1 3 2
jt
j j j
uC P C G C
t x x x k k k
, (22)
where the terms on the left – hand side of both equations are the local change in time and the
convective transport. The first term on the right – hand side stands for the diffusion, term P is
the production of the transported quantity by mean flow deformation, G stands for
production/destruction of the quantity by body forces, and the last term is the dissipation term.
The model constants k , , 1C , 2C , and 3C are not universal and must be tuned for
different applications. The recommended model coefficient values for the k turbulence
model are shown in Table 1 [81].
Table 1 Default values of k turbulence model.
C k 1C 2C 3C
0.09 1 1.3 1.44 1.92 0.8
In case of multiphase flows the transport equations for k and are slightly modified.
The transport equation for turbulent kinetic energy for multiphase flows is defined as:
Zvonimir Petranović PhD Thesis
Faculty of Mechanical Engineering and Naval Architecture 34
1, 1,
k k k kjk k k t k kk k k k
j j k j
nph nph
k k k kl kl kl
l l k l l k
k uk kP
t x x x
K k
, (23)
where term kP represents the production of turbulent kinetic energy by mean flow deformation
for phase k. The transport equation of the turbulent dissipation rate is defined as
1,
2
1 2 4
1,
nphk k k kjk k k t k k
k k kl
l l kj j j
nphkjk k
kl kl k k k k k k k
l l k k k j
uD
t x x x
uC P C C
k k k
. (24)
Terms klK and klD are the inter – phase exchange terms and have to be modelled. In theory,
the turbulent viscosity should be calculated for each Eulerian class. However, in this thesis the
assumption is made that the level of turbulence of the droplet classes are equal to the continuous
phase, and that the interaction between the phases is neglected [82]. In addition to the
coefficient set shown in Table 1, a new coefficient 4C is introduced with recommended value
of -0.33. The used assumptions lead to the closure of k and equations similar to single phase
flows. In the multiphase conservation equations, the averaged terms are shown as regular due
to easier reading.
2.2.3. k f turbulence model
In some parts of this thesis the eddy-viscosity k f turbulence model was
employed for the description of the highly turbulent spray behaviour [83][84]. This turbulence
model is based on Durbins’ elliptic relaxation concept [85], and it solves an additional transport
equation for the velocity scale ratio 2 /v k . It is robust and suitable for spray process
modelling, and for describing the swirl motion which is characteristic for IC diesel engines.
The eddy viscosity term is calculated according to the next equation:
2
t
kC
, (25)
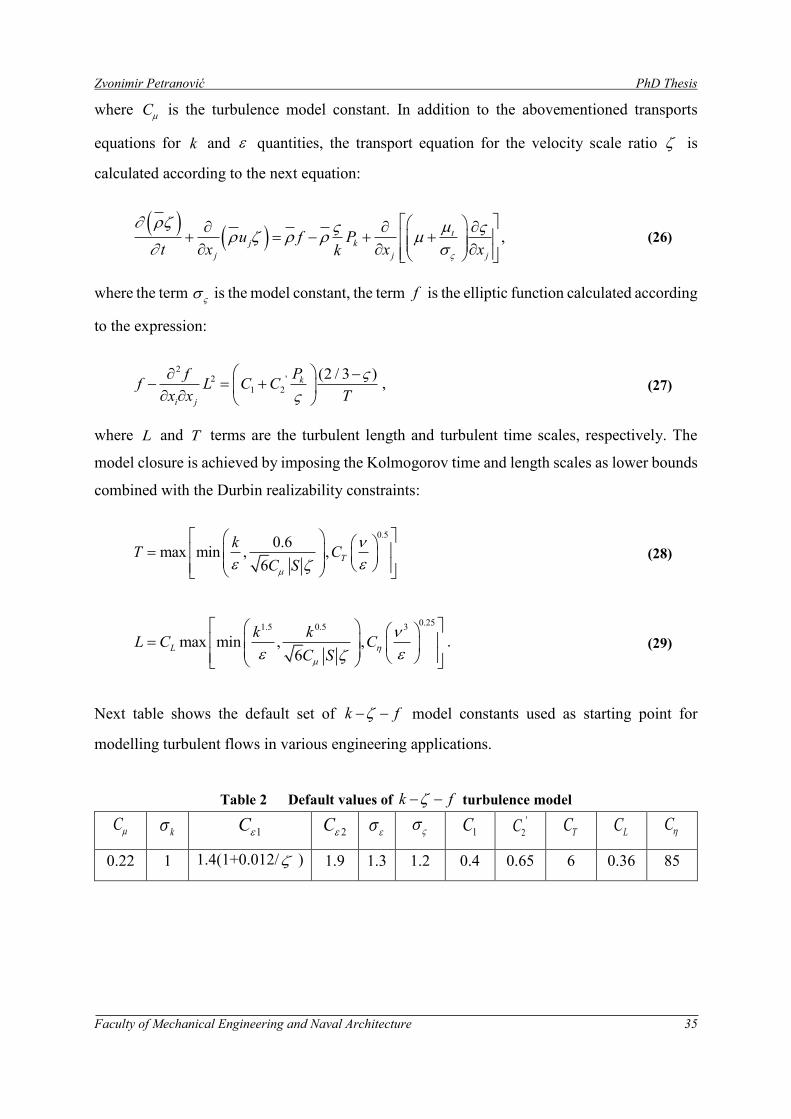
Zvonimir Petranović PhD Thesis
Faculty of Mechanical Engineering and Naval Architecture 35
where C is the turbulence model constant. In addition to the abovementioned transports
equations for k and quantities, the transport equation for the velocity scale ratio is
calculated according to the next equation:
tj k
j j j
u f Pt x x xk
, (26)
where the term is the model constant, the term f is the elliptic function calculated according
to the expression:
22 '
1 2
(2 / 3 )k
i j
Pff L C C
x x T
, (27)
where L and T terms are the turbulent length and turbulent time scales, respectively. The
model closure is achieved by imposing the Kolmogorov time and length scales as lower bounds
combined with the Durbin realizability constraints:
0.50.6
max min , ,6
T
kT C
C S
(28)
0.251.5 0.5 3
max min , ,6
L
k kL C C
C S
. (29)
Next table shows the default set of k f model constants used as starting point for
modelling turbulent flows in various engineering applications.
Table 2 Default values of k f turbulence model
C k 1C 2C 1C '
2C TC LC C
0.22 1 1.4(1+0.012/ ) 1.9 1.3 1.2 0.4 0.65 6 0.36 85
Zvonimir Petranović PhD Thesis
Faculty of Mechanical Engineering and Naval Architecture 36
2.3. Multiphase flows
Multiphase flows are found in many engineering applications and in various industries
such as transport, chemical, aerospace industry, etc. Such flows can be categorized as
liquid – liquid, liquid – gas, liquid – solid, and gas – solid combinations. Furthermore, they can
be divided into thin, diluted or dense multiphase flows. Due to such a variety, there are different
computational methods that are being used for multiphase flow modelling. It should be
mentioned, that none of the existing methods is suitable for solving all types of multiphase
flows. On contrary, the models are developed specifically to describe a certain multiphase flow
category. This implies, that each developed model has certain advantages and disadvantages,
which have to be taken into account before approaching to CFD numerical modelling. A high
pressure liquid fuel injection is considered as liquid – gas multiphase flow covering the dense,
diluted and thin multiphase flow regime. To model such a complicated process, two
distinguished modelling approaches are frequently used, the Euler Lagrangian and Euler
Eulerian approach. For both approaches the Eulerian formulation is used to describe the gas
phase, whilst for modelling the discrete phase the Lagrangian equations of motion, or the
Eulerian conservation equations, are being used. For capturing the interfacial mass, momentum
and enthalpy exchange in Lagrangian formulation a large number of liquid parcels have to be
introduced into the computational domain, whilst in the Euler Eulerian formulation an increased
number of classes is required.
In the next section the two above mentioned formulations for modelling multiphase flows
are briefly described. The first one is the mostly used Lagrangian DDM approach which tracks
liquid particle separately and calculates its trajectory. The second is the Euler Eulerian approach
in which both phases are considered as inter – penetrating continuum.
2.4. The Euler Lagrangian formulation
In the Euler Lagrangian DDM approach, a sample of individual droplets same in
dimensions and physical quantities, are tracked through the calculation domain. Such defined
groups are referred as parcels [40]. Instead of tracking each droplet, the grouping procedure
allows tracking of parcels which reduces the computational effort. To track the spray spatial
and temporal distribution, for each parcel a trajectory is calculated according to the next
expression:
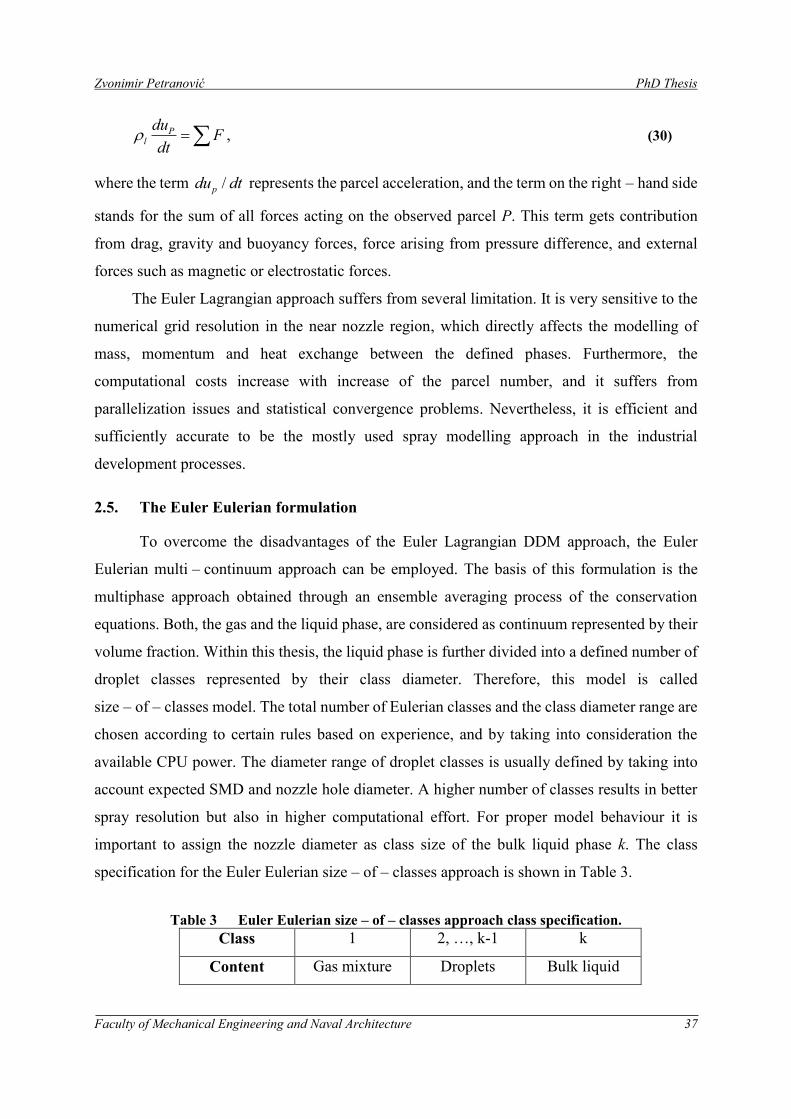
Zvonimir Petranović PhD Thesis
Faculty of Mechanical Engineering and Naval Architecture 37
Pl
duF
dt , (30)
where the term /pdu dt represents the parcel acceleration, and the term on the right – hand side
stands for the sum of all forces acting on the observed parcel P. This term gets contribution
from drag, gravity and buoyancy forces, force arising from pressure difference, and external
forces such as magnetic or electrostatic forces.
The Euler Lagrangian approach suffers from several limitation. It is very sensitive to the
numerical grid resolution in the near nozzle region, which directly affects the modelling of
mass, momentum and heat exchange between the defined phases. Furthermore, the
computational costs increase with increase of the parcel number, and it suffers from
parallelization issues and statistical convergence problems. Nevertheless, it is efficient and
sufficiently accurate to be the mostly used spray modelling approach in the industrial
development processes.
2.5. The Euler Eulerian formulation
To overcome the disadvantages of the Euler Lagrangian DDM approach, the Euler
Eulerian multi – continuum approach can be employed. The basis of this formulation is the
multiphase approach obtained through an ensemble averaging process of the conservation
equations. Both, the gas and the liquid phase, are considered as continuum represented by their
volume fraction. Within this thesis, the liquid phase is further divided into a defined number of
droplet classes represented by their class diameter. Therefore, this model is called
size – of – classes model. The total number of Eulerian classes and the class diameter range are
chosen according to certain rules based on experience, and by taking into consideration the
available CPU power. The diameter range of droplet classes is usually defined by taking into
account expected SMD and nozzle hole diameter. A higher number of classes results in better
spray resolution but also in higher computational effort. For proper model behaviour it is
important to assign the nozzle diameter as class size of the bulk liquid phase k. The class
specification for the Euler Eulerian size – of – classes approach is shown in Table 3.
Table 3 Euler Eulerian size – of – classes approach class specification.
Class 1 2, …, k-1 k
Content Gas mixture Droplets Bulk liquid
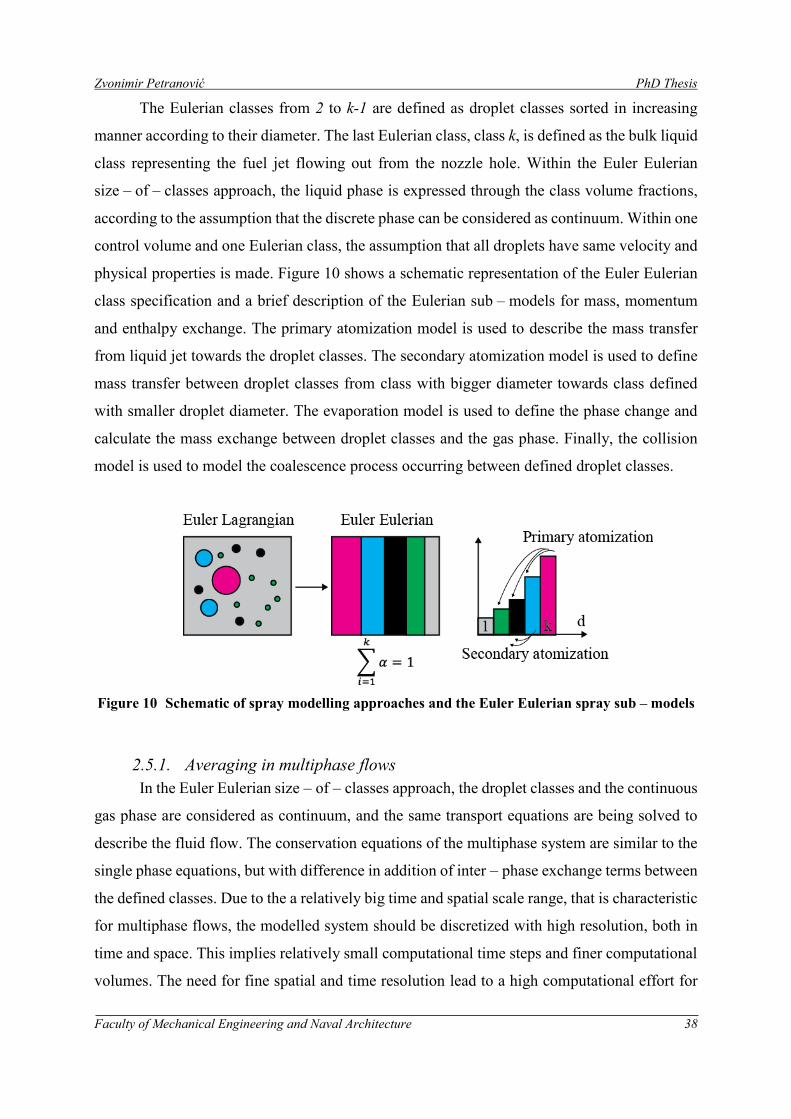
Zvonimir Petranović PhD Thesis
Faculty of Mechanical Engineering and Naval Architecture 38
The Eulerian classes from 2 to k-1 are defined as droplet classes sorted in increasing
manner according to their diameter. The last Eulerian class, class k, is defined as the bulk liquid
class representing the fuel jet flowing out from the nozzle hole. Within the Euler Eulerian
size – of – classes approach, the liquid phase is expressed through the class volume fractions,
according to the assumption that the discrete phase can be considered as continuum. Within one
control volume and one Eulerian class, the assumption that all droplets have same velocity and
physical properties is made. Figure 10 shows a schematic representation of the Euler Eulerian
class specification and a brief description of the Eulerian sub – models for mass, momentum
and enthalpy exchange. The primary atomization model is used to describe the mass transfer
from liquid jet towards the droplet classes. The secondary atomization model is used to define
mass transfer between droplet classes from class with bigger diameter towards class defined
with smaller droplet diameter. The evaporation model is used to define the phase change and
calculate the mass exchange between droplet classes and the gas phase. Finally, the collision
model is used to model the coalescence process occurring between defined droplet classes.
Figure 10 Schematic of spray modelling approaches and the Euler Eulerian spray sub – models
2.5.1. Averaging in multiphase flows
In the Euler Eulerian size – of – classes approach, the droplet classes and the continuous
gas phase are considered as continuum, and the same transport equations are being solved to
describe the fluid flow. The conservation equations of the multiphase system are similar to the
single phase equations, but with difference in addition of inter – phase exchange terms between
the defined classes. Due to the a relatively big time and spatial scale range, that is characteristic
for multiphase flows, the modelled system should be discretized with high resolution, both in
time and space. This implies relatively small computational time steps and finer computational
volumes. The need for fine spatial and time resolution lead to a high computational effort for
Zvonimir Petranović PhD Thesis
Faculty of Mechanical Engineering and Naval Architecture 39
multiphase flows modelling. Another difficulty, arising from the continuum assumption and
from dividing the discrete phase into classes, is the description of the physical processes
occurring at the phase interfaces.
Depending on the turbulent flow characterization, three different averaging methods can
be introduced [86][87]:
1. Time averaging
2. Spatial averaging
3. Ensemble averaging of identical processes/experiments
To average the multiphase conservation equations the ensemble averaging procedure is used.
Ensemble averaging builds the simple sum of a quantity for all process/experiment realisations
and divides them by the number realisations, as shown with next equation:
1
1, ,
N
i i n
n
x t x tN
, (31)
where N is the number of process/experiment realisations.
The averaging procedure is enhanced by introducing a phase indicator function which
ensures the contribution of a particular phase to the averaging procedure, only if this phase
exists in the region of interest. The phase indicator function is defined as:
, 1k x t if phase k is present at location x at time t (32)
, 0k x t if phase k is not present at location x at time t . (33)
The volumetric concentration (or volume fraction, or relative residence time) of phase k
is defined according to equation
k k , (34)
where k stands for the ensemble averaged phase indicator function. In multiphase flows, two
types of averaged variables are considered: the component weighted average k , and the mass
weighted average k . The former mentioned averaging is defined as:
k
k
, (35)
Zvonimir Petranović PhD Thesis
Faculty of Mechanical Engineering and Naval Architecture 40
whilst the latter mentioned one is defined as:
k
k
k k
. (36)
The component weighted average is used to express the averaged phase density, whilst
the mass average is used for expressing the averaged phase velocity. Due to the above
mentioned difficulties, the multiphase conservation equations are derived by applying these
averaging approaches on the transport equations, as described in the following section.
2.5.2. Mass conservation
The continuity equation for compressible single phase system is expressed by the next
expression:
0j
j
ut x
, (37)
which can be converted for multiphase systems by taking into account the ensemble averaging
procedure, as shown in the previous section. Rearranging the upper equation, the continuity
equation for phase k can be derived as:
1,
Nphk k
k k kj kl
l l kj
ut x
, (38)
where k is the Eulerian class volume fraction, k is class density and kju is the velocity at
phase interface. The term on the right – hand side stands for the interfacial mass exchange
between classes k and 1.
In the Euler Eulerian size – of – classes approach an additional condition regarding the
class volume fraction k must be fulfilled. To achieve mass conservation, the sum of volume
fractions must be equal to one, as shown with next equation:
1
1Nph
k
k
. (39)
Zvonimir Petranović PhD Thesis
Faculty of Mechanical Engineering and Naval Architecture 41
2.5.3. Momentum conservation
The momentum conservation equations for multiphase system are defined as:
1, 1,
( )
k k ki t
k k ki kj k k kij kij k k i
j i j
Nph Nph
kl i kli kl
l l k l l k
u pu u f
t x x x
u
M
, (40)
where the terms on the left – hand side are the time derivative of momentum for class k and the
convective momentum transport, respectively. The first term on the right – hand side is the
pressure gradient term yielding the pressure forces on the droplets of class k. In this thesis the
pressure was assumed identical for all phases. The second term represents the momentum
exchange due to surface forces arising from molecular and turbulent stresses (viscous and
Reynolds stresses). For a multiphase system the viscous stress tensor is calculated according to
next expression:
2
3
kj ki kmkij k ij
i j m
u u u
x x x
, (41)
where k is the molecular viscosity of phase k. The Reynolds stress tensor is calculated
according to next expression:
2 2
3 3
kjt t ki kmkij k ij ij k k
i j m
u u uk
x x x
, (42)
where turbulent viscosity t
k of phase k is calculated according to next expression:
2t k
k k
k
kC
or
2t k
k k k
k
kC
, (43)
depending on the applied turbulence model. The third term on the right – hand side of
momentum conservation equation is the gravity force term, term kl iM represents the interfacial
momentum transfer from the class k to gas phase, and term kl stands for momentum change
due to the mass transfer between the Eulerian classes.
Zvonimir Petranović PhD Thesis
Faculty of Mechanical Engineering and Naval Architecture 42
2.5.4. Enthalpy conservation
The total enthalpy conservation for each Eulerian class is shown by the next expression:
1, 1,
( ) H
k k k t
k k kj k k kj kj k k j ki
j j
Nph Npht
k ki kij kij k kl kl kl
l l k l l kj
hu h q q f u
t x x
pu h
x t
, (44)
where the terms on the left – hand side are the time derivative of the total enthalpy for phase k
and the enthalpy convective transport, respectively. The first term on the right – hand side is
the total enthalpy change from molecular and turbulent heat fluxes. The third term represents
the enthalpy change due to surface forces. The heat flux vector kjq is calculated according to
next expression:
k k
kj
pk j
hq
c x
, (45)
where k is phase k thermal conductivity. The turbulent heat flux vector t
kjq is calculated as
follows:
tt k kkj
T j
hq
x
, (46)
where t
k is turbulent viscosity of phase k, and T is turbulent Prandtl number.
2.5.5. Species transport conservation
In order to model chemical reactions within the gas phase, either by using combustion
model or chemical mechanisms, the gas phase is divided into a desired number of chemical
species. In order to transport chemical species additional transport equations need to be solved,
named species transport equations. The FIRE® species transport module allows to transport an
arbitrary number of species with a user defined set of properties to model general transport
problems like multi – component mixing, flue gases aftertreatment, or combustion processes.
The next equation represents the species transport equation for the chemical species i
transported by the gas phase 1:
Zvonimir Petranović PhD Thesis
Faculty of Mechanical Engineering and Naval Architecture 43
t
11 1 1 1 1 1( D )
Sci i
ii i i Y Yt
j j j
YY u Y S
t x x x
, (47)
where the first term is the time derivative, whilst the second term is the species convective
transport. The first term on the right – hand side is the diffusion term where DiY is the effective
diffusion coefficient of species i, whilst Sct is the turbulent Schmidt number with a default
value of 0.7. The last term stands for the species mass source modelled by taking into account
the species reaction rate ir and the molar mass iM . The expression for the species mass source
term is defined according to next expression:
iY i iS rM . (48)
2.6. Euler Eulerian spray sub – models
2.6.1. Primary atomization
In various engineering applications where the liquid fuel is injected through a small
diameter nozzle holes as a result of high pressure difference, the liquid core is subject to a rapid
disintegration process. This phenomenon, disintegration of the liquid core itself, is called the
primary atomization process. It is a consequence of nozzle flow turbulence, aerodynamic
surface instabilities occurring outside the nozzle channel, and the cavitation process.
The pressurized liquid fuel passes through small gaps determined by the nozzle needle
movement, and the high pressure differences accelerate the fluid towards the nozzle exit hole.
The fluid flow inside the nozzle is considered as a highly turbulent multiphase flow where the
fluids aggregate state may change in regions with very low pressure – this process is called
cavitation. At the entrance into the nozzle hole channel, the fluid changes its direction which
results in velocity increase and a local pressure drop. When the pressure is reduced below the
vapour saturation pressure, liquid fuel is vaporized and the cavitation process is induced. The
bubbles created by the cavitation contribute to the break – up of the liquid core, and they can
significantly reduce the effective outflow cross section area of the nozzle which influences the
liquid jet velocity. The liquid fuel flows out from the nozzle channel, and aerodynamic forces
act on the liquid jet surface contributing to the jet atomization.
The liquid core, within the Eulerian size – of – classes approach, is represented as a
certain number of droplets characterized with the nozzle hole diameter. This assumption is
Zvonimir Petranović PhD Thesis
Faculty of Mechanical Engineering and Naval Architecture 44
called the blob injection model. The liquid core is modelled as separate bulk liquid class, and it
is the only class that is subject of the primary atomization process. The primary atomization
model used within this thesis considers two independent mechanisms: the aerodynamic surface
wave growth and internal stresses caused by turbulence. The applied model was developed by
[88] and later modified by [89].
The liquid core disintegration rate can be modelled by estimating averaged values of
nozzle flow turbulence or by using the AVL nozzle file interface where realistic boundary
conditions on the inlet selection are prescribed. The turbulent perturbations initiate the surface
instabilities which grow further as a result of aerodynamic pressure forces. Those instabilities
results in creation of unstable fuel ligaments and bigger droplets.
The mass loss of the bulk liquid class in each computational cell is calculated according to
equation:
24 n n
dm drr
dt dt , (49)
where the right – hand side denotes the artificial radius change rate of injected droplets or blobs.
Within this model, the radius of the injected droplet remains constant, but the bulk liquid class
volume fraction is reduced. The radius change rate is defined as ratio of atomization length
scale AL and overall break-up time scale A , as shown as in the next equation:
A
A
Ldr
dt . (50)
The atomization length scale is considered equivalent to the liquid jet turbulent length scale,
and it is related to the averaged turbulent kinetic energy and energy dissipation rate at the exit
of the nozzle, as shown by the next equation:
1.5
2
avg
T P A
avg
kL B C L
. (51)
The atomization length scale can be modified to match the experimental data by changing
model coefficient 2PB , whilst coefficient C is set to 0.09 in all simulations. The average
turbulent kinetic energy and energy dissipation rate are calculated according to:
Zvonimir Petranović PhD Thesis
Faculty of Mechanical Engineering and Naval Architecture 45
2
2
4 62
7
11
8
inj noz
avg
noz
u dk C C
L C
(52)
3
2
5 4 62
7
11
2 n
in
a g
oz
j
v
uC C C
L C
, (53)
where inju is the injection velocity, nozL is the nozzle channel length and nozd is the nozzle hole
diameter. The model coefficients 4C and 5C are held constant with values 0.45 and 0.27
respectively, whilst the area contraction coefficient 6C and the discharge coefficient 7C are
chosen from the experimental research. The aerodynamic length scale is considered
proportional to the turbulent length scale:
2W TL L . (54)
The turbulent time scale is calculated according to the next equation:
avg
T
avg
kC
. (55)
The aerodynamic time scale is calculated according to the KH instability model, as shown in
the next equation:
2
1 1
2
11
WW
n n
n Wn
L
u u
L
,
(56)
where index 1 represents the gas phase and index n stands for the bulk liquid class. Term
stands for the class density, is the surface tension of the dispersed phase, and the term 1nu u
stands for the relative liquid – gas velocity. The total atomization time scale is calculated as
linear combination of the turbulent and aerodynamic time scale:
1 3A P T P WB B , (57)
or as a harmonic combination of turbulent and aerodynamic time scales, where the faster
process dominates the break – up mechanism:
Zvonimir Petranović PhD Thesis
Faculty of Mechanical Engineering and Naval Architecture 46
1
1 3
1 1A
P T P WB B
. (58)
The term 1PB is the model constant which defines the turbulent time scale, whilst 3PB defines
the aerodynamic time scale. Both model constant are used to match the experimental data.
2.6.2. Secondary atomization
After the primary atomization of the liquid core, which causes generation of unstable
ligaments and bigger droplets, a further disintegration into even smaller drops occurs – this
process is called the secondary atomization process. The disintegration of liquid droplets is a
consequence of instabilities resulting from aerodynamic and turbulent forces acting on the
droplet surface. In the literature several secondary break – up models have been proposed, i.e.
WAVE, TAB (Taylor Analogy Break-up), FIPA (Fractionnement Induit Par Acceleration),
KHRT (Kevin Helmholtz – Rayleigh Taylor), HuhGosman, Chu [56]. All of these model are
capable to reproduce the measured data with a right set of model coefficients. In this thesis, the
WAVE secondary break – up model was used. The basis of this model is the linear stability
analysis applied on a liquid jet penetrating into an incompressible and quiescent gas
environment. To develop the model, an infinitesimal axisymmetric surface displacement was
imposed onto the droplet surface, characterised by the fluctuating pressure and the radial and
axial velocity components. Such fluctuations have been described by the continuity equation
and the equation of motion, which were solved to obtain the dispersion relation for the wave
growth rate and the corresponding wavelength. By use of the experimental investigation the
semi empirical equations (curve fits of the numerical solution) were given for the wavelength
and for the maximum growth rate in function on local flow properties, as shown with
next equations [9]:
0.5 0.7
0.61.67
1
1 0.45 1 0.49.02
1 0.87k k
Oh Tr
We
(59)
0.53 1.5
1
0.6
0.34 0.38
1 1 1.4
k kk
r We
Oh T
, (60)
Zvonimir Petranović PhD Thesis
Faculty of Mechanical Engineering and Naval Architecture 47
where kr is the droplet radius of the parent class, Oh is the Ohnesorge number, T is the Taylor
number, and We is the gas phase Weber number. The break-up target radius targetr is modelled
according to:
1target Sr B , (61)
following the assumption that the created droplet is proportional to the wavelength of the fastest
growing instability acting on the droplet surface. In this thesis, the constant 1SB was set to 0.61.
Due to the production of new droplets, the volume fraction of the parent class is reduced and
the assumed change rate of the parent droplet diameter is defined as:
target
target,kk
k
A
r rdrr r
dt
, (62)
where term A is the break-up time defined according to:
23.726 ka S
k k
rB
. (63)
The constant 2SB is the break – up time constant used to scale the break – up time. It varies
from one injector to another with recommended values from 1.73 – 20. The expression for the
modelled mass loss due to the secondary droplet break-up process is defined according to the
next equation:
24k k
k k
dm drr
dt dt , (64)
where the left – hand side of the equation represents the mass loss rate k, and the last term is
radius change rate described in equation (64).
Modelling the secondary droplet atomization within the Eulerian size – of – classes
approach is highly dependent on the choice of the class diameters. It can occur that the target
diameter lays within the parent class diameter boundaries, and therefore, droplets of smaller
diameter will not be created. Thus, the common WAVE model is modified with the child
droplet option to reduce its dependency on the choice of the droplet classes.
Zvonimir Petranović PhD Thesis
Faculty of Mechanical Engineering and Naval Architecture 48
2.6.3. Droplet collision
From the viewpoint of the statistical particle method, which builds the basis of the
common spray simulation module, the droplet collisions are modelled by a statistical approach.
In the work carried out within tasks defined in this thesis the O’Rourke collision model [90]
was implemented into the commercial CFD code FIRE® for the Eulerian size – of – classes
spray modelling approach. The droplet collision process is modelled for a defined number of
liquid class interfaces. Currently, the model is used to calculate the coalescence regime, where
two droplets stick together and form a new droplet with bigger radius, according to the mass
conservation law. The collision frequency is calculated by using the relative velocity between
the colliding droplets. Thus, in the deficiency of the relative velocity, the collision between the
droplets within the same class is not modelled. For each of the colliding droplets, the diameter,
velocity and the temperature are appropriately modified to conserve the mass, momentum and
energy. The model verification was performed on a 2 – dimensional geometry with two
colliding jets.
Droplet collision is considered in each computational cell where the volume fraction of
the colliding classes is greater than a defined threshold value. The bigger of two colliding
droplets is referred as collector, whilst the smaller one is referred as droplet. The collision
frequency i
between collector and the surrounding droplets is calculated according to
equation:
2
-4
i jIII
i j i j
d dN u u
, (65)
where III
jN is the number density of the droplet class,
id ,
jd , i
u and j
u are the diameters and
velocities of the collector and the droplet classes, respectively. The probability nP that the
collector undergoes n number of collisions with the surrounding droplets follows a Poisson
distribution according to the next equation:
!
n
n
n
nP e
n
, 0
nP e . (66)
The number of expected collisions in each computational time step is calculated according to
equation:
Zvonimir Petranović PhD Thesis
Faculty of Mechanical Engineering and Naval Architecture 49
n t , (67)
where t is the computational time step. The collision probability is zero, denoted with 0P in
equation (66), when the mean value of expected collisions n is equal to 0. Additionally, two
random numbers 1RN and 2RN in the range between 0 and 1 are introduced. Both random
numbers are defined at the beginning of each time step of the CFD simulation, and they are
held constant for all collision interfaces. This contributes to the numerical stability, and leads
to better convergence of the solution. The first random number 1RN is compared to the zero
probability 0P . When 1RN is smaller than 0P , then droplet collision is not considered. In the
other case, when 1 0RN P , a new random number 2RN is introduced. The 2RN determines the
outcome of the collision process, either coalescence or grazing collision. In the Euler Eulerian
approach, this number replaces the droplet impact parameter b , described in [91]. Furthermore,
the critical impact parameter, crb , is calculated according to next equation, and its value is
compared to 2RN :
2 min 1.0,2.4 /cr db f y We . (68)
The function f y is calculated according to [92], whilst the term dWe stands for the droplet
class Weber number. When the critical impact parameter crb is greater than impact parameter
b , the outcome of every collision is droplet coalescence.
2.6.4. Droplet evaporation
Beside the aforementioned liquid jet primary atomization, droplet secondary
atomization and droplet collision processes, the liquid fuel evaporation process plays a
significant role in the IC engine overall efficiency in terms of fuel consumption and pollutant
formation. Evaporation occurs when the thermodynamic conditions are not in equilibrium
enforced by the high pressure and elevated temperature within the combustion chamber. As
mentioned before, in the Eulerian size – of – classes approach the spray droplets are sorted into
classes, where the first class is reserved for the gas phase. Other classes are dedicated to the
spray droplet classes, and the last class represents the bulk liquid jet. Therefore, it is worth
noting that the mass source modelled with the evaporation model gets it contribution from all
droplet classes and from the bulk liquid class. The evaporation model used for the CFD
Zvonimir Petranović PhD Thesis
Faculty of Mechanical Engineering and Naval Architecture 50
modelling in this thesis considers fuel droplets as isolated spheres, where a cross influence of
surrounding droplets is neglected. Furthermore, according to the infinite conductivity model, it
is assumed that the liquid droplet temperature is uniform for the whole droplet, and that the
pressure change in the gas is negligible. Also, the radiative heat transfer is neglected. The
mathematical expressions for modelling the evaporation process are derived by Abramzon and
Sirignano [93].
To take into account the effect of convective transport caused by the droplet – gas
relative motion, the authors apply the film theory. This theory assumes that heat and mass
transfer between droplet surface and gas flow are analogous, and they take place within a certain
gas film thickness, as shown by the next equations:
0
0
2
2
sT
r
Nu
(69)
0
0
2
2
sM
r
Sh
, (70)
where 0Nu is the Nusselt number derived for non – evaporating droplets, and 0Sh is the
analogous Sherwood number, as proposed by Clift [94]. For taking into account the influence
of Stefan flow, which leads to a thickening of the film, those parameters are corrected by the
next expressions:
0
TT
T
F
(71)
0
MM
M
F
.
(72)
The final droplet vaporization/condensation rate can be calculated according to the next
expressions:
*2 ln 1g g s MD r Sh Bm (73)
*2 ln 1g
s TpF
kr Nu Bm
C
, (74)
Zvonimir Petranović PhD Thesis
Faculty of Mechanical Engineering and Naval Architecture 51
where g , gD and gk are the average density, binary diffusion coefficient and thermal
conductivity in the gas film. The term pFC represents the integral specific heat capacity of the
vapour phase, whilst terms MB and TB are Spalding mass and heat transfer numbers calculated
according to next equations:
1
Fs FM
Fs
Y YB
Y
(75)
/
pF S
T
S L
C T TB
L T Q m
, (76)
where the term T stands for temperature, the term FY represents the fuel mass fraction, and
subscripts S and refer to droplet surface and ambient conditions, respectively. To calculate
the average temperature and fuel mass fraction in the film, the 1/3 – rule was employed [95].
The terms *Sh and
*Nu are the modified Nusselt and Sherwood numbers defined as the
non - dimensional heat and mass transfer coefficients according to:
0*
22
M
ShSh
F
(77)
0*
22
T
NuNu
F
. (78)
The correction factors MF and TF , that represent the diffusional film correction, are
approximated according to the next equation:
;M M T TF F B F F B . (79)
The universal function xF B is calculated according to:
0.7 ln 1
1x
x x
x
BF B B
B
, (80)
where index x is either subscript M or T . The iterative calculation procedure of the
evaporation rate and the heat transferred into the droplet classes is described by the following
steps:
Zvonimir Petranović PhD Thesis
Faculty of Mechanical Engineering and Naval Architecture 52
1) Calculation of the fuel vapour mass fraction at the droplet surface.
2) Calculation of the average physical film properties according to 1/3 – rules described
in [95].
3) Calculation of the Nusselt number of non-vaporizing droplets and the corresponding
Sherwood number for the initial state according to the next expressions:
1/2 1/3
0 2 0.552Re PrNu (81)
1/2 1/3
0 2 0.552ReSh Sc . (82)
4) Calculation of m
, MB , *Sh and MF according to equations (73), (75), (77), and (79).
At this point the droplet vaporization rate is calculated by using MB and *Sh .
5) Calculation of TB by using values from the old time step; calculation of the correction
factor TF .
6) Calculation of the modified Nusselt number *Nu and calculation of the corrected TB
according to expression:
1 1T MB B
, (83)
where parameter is defined according to:
*
*
1PF
PG
C Sh
Nu LeC
. (84)
7) Comparison of the calculated Spalding heat transfer number with the one assumed
from the previous time step. If the relative value is over the predefined value, the
iteration process continues – return to step 5).
8) Calculation of heat transferred into the droplet according to:
PF S
d S
T
C T TQ m L T
B
. (85)
Zvonimir Petranović PhD Thesis
Faculty of Mechanical Engineering and Naval Architecture 53
The terms m
and dQ are used to calculate the total evaporation mass and heat transfer rates
from all Eulerian classes (droplets), which is done by multiplying the calculated values with the
total number of droplets in each control volume [56].
2.6.5. Momentum exchange via drag force
The relative motion between liquid droplets and the surrounding gas causes a drag force.
This force points into the direction opposite to the relative velocity vector, and it is shown with
the next equation:
2
2
g
D D D relF c A u
, (86)
where g is the ambient gas density, Dc is the drag coefficient, DA is the droplet frontal area,
and relu is the relative velocity between droplet and gas. The drag coefficient is not constant, it
varies with flow speed, direction, object size, density and viscosity. Therefore, it can be said
that drag coefficient is in a function of the droplet Reynolds number, defined with the next
equation:
Reg rel D
g
u d
, (87)
where Dd is the droplet diameter and g is the ambient gas viscosity. At low flow velocities,
when inertial forces are negligible compared to the viscous ones, the Stokes’ law is being used
to calculate the drag coefficient. The total force acting on a spherical droplet is calculated as
follows [96]:
3St D g DF d u . (88)
The Stokes’ drag force is usually normalized by the dynamic pressure (assumption of
incompressible flow) and droplet area projected into direction of the droplet motion vector.
Accordingly, the expression for the drag coefficient at low Reynolds number is given as
follows:
24
ReDc . (89)
Zvonimir Petranović PhD Thesis
Faculty of Mechanical Engineering and Naval Architecture 54
For higher droplet Reynolds number, the drag coefficient is often modelled according to the
next expression [97] and [98]:
0.687241 0.15 Re Re 1000
Re
0.44 Re 1000D
forc
for
. (90)
Furthermore, when a droplet enters a gas stream with a sufficiently large Reynolds and Weber
numbers, it is being deformed as it interacts with the gas [97]. This effect can be modelled by
the next equation:
1 2.632D Dc c y , (91)
where term y is the droplet distortion parameter. The expression (93) correlates the droplet
drag coefficient and droplet distortion, calculated according to the equations of TAB droplet
break – up model [99].
Within this thesis the drag coefficient for each Eulerian liquid class k was modelled according
to modified drag coefficient expression:
0.66
2.65 1,78
,
Re241 1
Re 6
kDk k k Dk Def
k
c c
, (92)
where term k denotes class volume fraction. When applied for the Lagrangian formulation,
the subscript k vanishes from the above mentioned equation.
The next expression is used to calculate drag force of each Eulerian droplet class expressed per
unit volume:
2
, 2
,
3
2 4
rel kg III kDk g Dk Dk dk Dk g rel kg
dk
uF c A N c u
D
. (93)
In general, the assumption that all droplets within one Eulerian class and one computational
cell are same in the diameter and have same relative velocity was imposed. Term IIIN stands
for the number of droplets per unit volume. The same expression is used for the Lagrangian
spray formulation but the subscript denoting the droplet classes is then excluded from the
equation (95).
Zvonimir Petranović PhD Thesis
Faculty of Mechanical Engineering and Naval Architecture 55
2.6.6. Combustion
The fuel combustion is a process of heat release due to the chemical reactions of the fuel
vapour species and an oxidizer. The combustion process can be described through combustion
models with different level of complexity or by employing the detailed/reduced chemical
mechanisms. Within the used CFD code several combustion models are implemented, such as:
1) Eddy break up model.
2) Turbulent flame speed closure model.
3) Coherent flame model.
4) PDF model.
5) Characteristic timescale model.
6) Steady combustion model.
7) General gas phase reaction model.
In the following section of the thesis, the description of combustion modelling by
employing the chemistry mechanisms is shown. In the literature, according to the authors’
knowledge there are no published sources on the modelling the reactive spray processes by
using the Euler Eulerian size – of – classes approach in combination with chemistry
mechanism. Therefore, one goal of this thesis was to enhance the Euler Eulerian spray model
with the general gas phase reaction model to solve the reactive multiphase processes.
The use of the general gas phase reaction model together with multiphase flow solver
enables modelling of different types of kinetic problems. This feature opens a huge variety of
applications involving multiphase reactive flows, e.g. the combustion processes in IC diesel
engines. The combustion model is used in combination with the general species transport
model, and it is used to calculate reaction rates of gas species. The reaction rates are dependent
on the temperature and species concentrations, and they are used as source/sink terms in the
species and enthalpy transport equations. The reaction rates are evaluated through the FIRE®
internal chemistry interpreter [56].
To calculate chemical reactions within the gas phase, the Arrhenius expression is used.
This expression correlates the reaction rate constant ik of reaction i with the local temperature
T , according to the next expression:
Zvonimir Petranović PhD Thesis
Faculty of Mechanical Engineering and Naval Architecture 56
expib ifi i
Ek AT
RT
, (94)
where term ib
iAT is the chemical reaction rate coefficient (composed of pre-exponential factor
A and temperature T ), which can be physically interpreted as molecular collision number, term
iE is the activation energy, and R is the universal gas constant. The term exp /iE RT is
the Boltzmann factor which shows the amount of molecules containing enough energy
necessary for triggering chemical reactions. The individual quantities such as iA , ib , and iE
have to be determined experimentally for each reaction. This leads to the conclusion that for
modelling the combustion process of different fuels, separate reactions mechanism have to be
employed. All above mentioned coefficients, together with the stoichiometry of the reactions,
are provided within a chemistry input file. The general set of elementary reactions is expressed
with next equation:
,
,1 1
' '' 1,K K
kf i
ki k ki kkb i
k k
i I
, (95)
where term K is the total number of gas phase species in the system, ' and '' are the
stoichiometric coefficients of reactants and products, respectively. Furthermore, fk and bk
stand for the forward and backward reaction rate coefficients calculated according to the
Arrhenius expression. The above mentioned equation is used to calculate the reaction rates of
all species from I number of chemical reactions.
The rate of production of species k (the reaction rate) is calculated according to the next
expression:
1
I
k ki i
i
q
, (96)
where term iq is the reaction rate of reaction i, or commonly called the production rate of
reaction i.
The production rate is defined as the difference of the forward and backwards reaction rates,
according to the next expression:
Zvonimir Petranović PhD Thesis
Faculty of Mechanical Engineering and Naval Architecture 57
' ''
1 1
ki kiK K
i fi k bi k
k k
q k X k X
, (97)
where term kX is the molar concentration of species k.
In the FIRE® multiphase code the 0D reactor model is used to calculate source terms for species
and enthalpy transport equations. The source terms for the species transport equations are
calculated as:
1 1n n n n
k kk cell
w wS V
t
, (98)
where the superscript n denotes the previous time step and 1n the new time step resulting
from the single zone reactor model. The above equation is shown for species k and cell volume
cellV . The source term of the enthalpy transport equation, based on the species source terms, is
calculated as:
1
1
ref
K
H k fk
k T k
S S HW
, (99)
which represents the sum of enthalpy sources arising from all gas species.
In the section “result and discussion”, the modelling results of different liquid fuel
atomization, evaporation and combustion processes are shown. Initially, the developed method
was validated on a constant volume vessel where the atomization and combustion process of
n – dodecane and n – heptane fuel was simulated. Afterwards, the combustion of the diesel
biofuel blend, named EN 590 B7, was modelled on a real engineering application. The EN 590
B7 is a diesel biodiesel fuel blend containing 7 % of biofuel, which is actually the maximum
allowable biofuel addition for road transportation powering systems. Chemical reactions, their
rates, and thermodynamic and transport properties have been introduced through the chemical
reaction mechanisms.
Table 4 shows the number of chemical species, number of reactions, literature source,
and the observed spray characteristics for the chemistry mechanisms used within the scope of
this thesis.
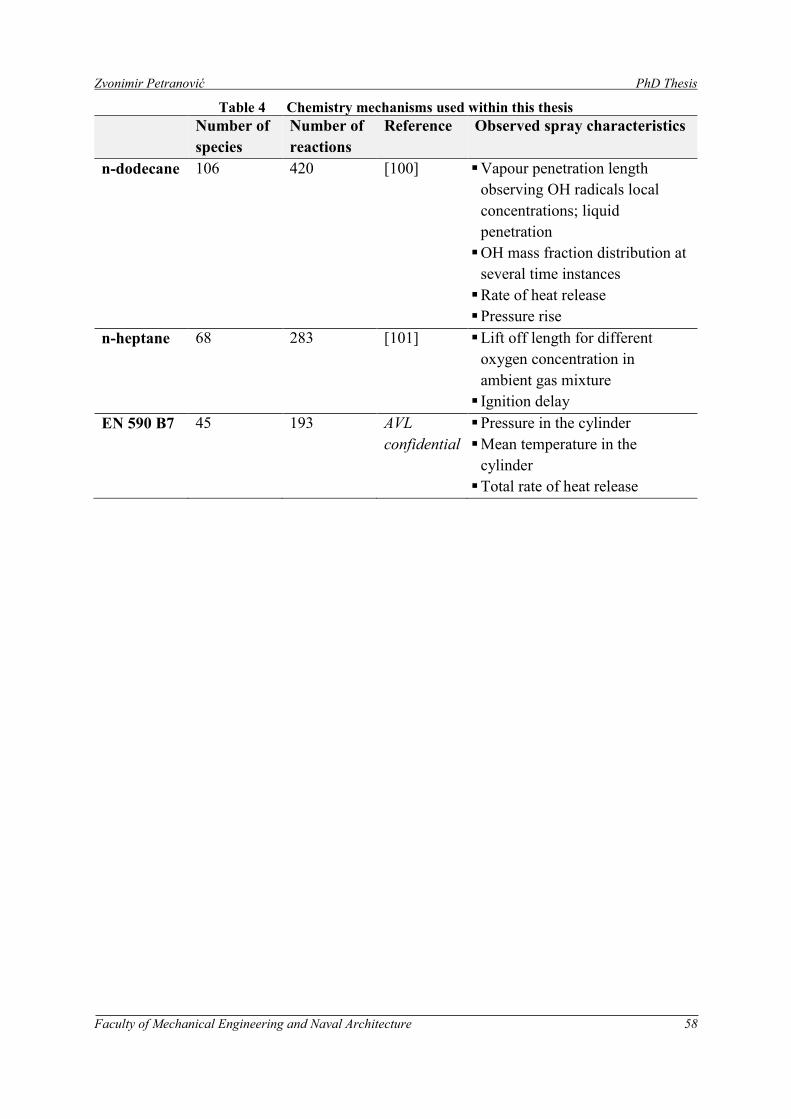
Zvonimir Petranović PhD Thesis
Faculty of Mechanical Engineering and Naval Architecture 58
Table 4 Chemistry mechanisms used within this thesis
Number of
species
Number of
reactions
Reference Observed spray characteristics
n-dodecane 106 420 [100] Vapour penetration length
observing OH radicals local
concentrations; liquid
penetration
OH mass fraction distribution at
several time instances
Rate of heat release
Pressure rise
n-heptane 68 283 [101] Lift off length for different
oxygen concentration in
ambient gas mixture
Ignition delay
EN 590 B7 45 193 AVL
confidential
Pressure in the cylinder
Mean temperature in the
cylinder
Total rate of heat release
Zvonimir Petranović PhD Thesis
Faculty of Mechanical Engineering and Naval Architecture 59
3. RESULTS AND DISCUSSION
In the next sections the results of 3D CFD numerical modelling are shown. In the first
section the modelling results of spray, combustion and emission processes occurring in the IC
engine by employing the Euler Lagrangian spray approach are shown. The second section
shows the results obtained by modelling the non – reactive spray processes where the Euler
Eulerian size – of – classes approach was utilized. This section was performed to understand
the influence of spray sub model coefficients on the mass, momentum and enthalpy exchange
occurring during the fuel atomization process. In the third section the nozzle flow – spray
interface is described, whilst in the fourth section the validation of the primary atomization
model is performed. In the fifth section the modelling results of non – reactive fuel spray
process by using the modified WAVE model are shown. In the sixth section the results of two
colliding droplet jets by taking into account droplet collision model are presented. In the seventh
section the verification and validation results of the developed method are shown. Finally, in
the last section, the developed method is used to model the real engineering application, and
the modelling results are shown and discussed.
3.1. Eulerian Lagrangian engine modelling
In this section the results of numerical modelling of an experimental IC engine are
discussed. The physical models for the liquid fuel disintegration, evaporation and pollutant
formation, existing within the commercial CFD code FIRE®, were utilized for the IC engine
simulations. These models are capable to predict the complex in – cylinder processes and,
ultimately, the formation of pollutant emissions. The aim of this section was to investigate the
important thermos – chemical parameters, and the chemical kinetic mechanisms that describe
the NOx formation process, and to gain insights into advantages and disadvantages of the Euler
Lagrangian DDM models. The results from numerical simulations, such as in – cylinder
pressure and temperature traces, and NOx and soot concentrations, are found to be in good
agreement with the existing experimental data.
In the used Euler Lagrangian DDM approach the gas phase is described by the Eulerian
formulation, whilst the discrete phase is described with the Lagrangian equations. The phase
coupling is performed by introducing the adequate source terms for mass, momentum and energy
exchange. Several physical models were used for calculation of dispersed spray flow, combustion
and pollutant formation. For modelling the droplet break – up process, the common WAVE
model was applied, whilst for modelling the NOx formation two different reaction mechanisms
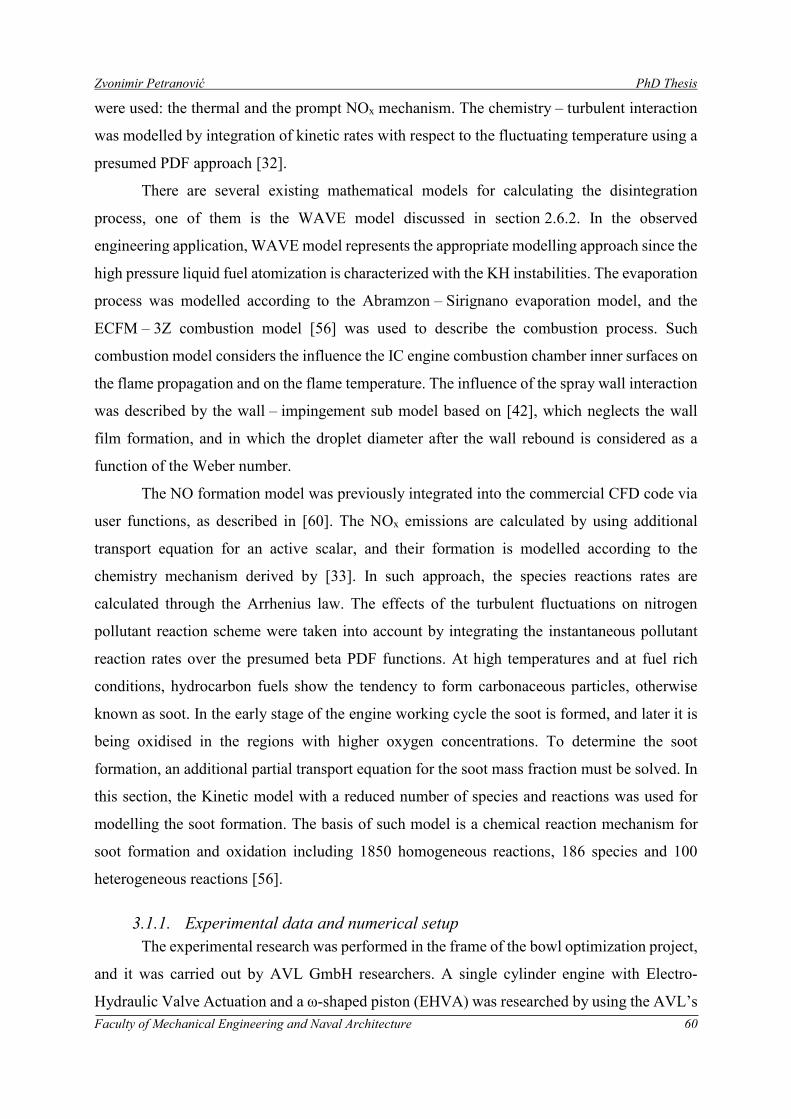
Zvonimir Petranović PhD Thesis
Faculty of Mechanical Engineering and Naval Architecture 60
were used: the thermal and the prompt NOx mechanism. The chemistry – turbulent interaction
was modelled by integration of kinetic rates with respect to the fluctuating temperature using a
presumed PDF approach [32].
There are several existing mathematical models for calculating the disintegration
process, one of them is the WAVE model discussed in section 2.6.2. In the observed
engineering application, WAVE model represents the appropriate modelling approach since the
high pressure liquid fuel atomization is characterized with the KH instabilities. The evaporation
process was modelled according to the Abramzon – Sirignano evaporation model, and the
ECFM – 3Z combustion model [56] was used to describe the combustion process. Such
combustion model considers the influence the IC engine combustion chamber inner surfaces on
the flame propagation and on the flame temperature. The influence of the spray wall interaction
was described by the wall – impingement sub model based on [42], which neglects the wall
film formation, and in which the droplet diameter after the wall rebound is considered as a
function of the Weber number.
The NO formation model was previously integrated into the commercial CFD code via
user functions, as described in [60]. The NOx emissions are calculated by using additional
transport equation for an active scalar, and their formation is modelled according to the
chemistry mechanism derived by [33]. In such approach, the species reactions rates are
calculated through the Arrhenius law. The effects of the turbulent fluctuations on nitrogen
pollutant reaction scheme were taken into account by integrating the instantaneous pollutant
reaction rates over the presumed beta PDF functions. At high temperatures and at fuel rich
conditions, hydrocarbon fuels show the tendency to form carbonaceous particles, otherwise
known as soot. In the early stage of the engine working cycle the soot is formed, and later it is
being oxidised in the regions with higher oxygen concentrations. To determine the soot
formation, an additional partial transport equation for the soot mass fraction must be solved. In
this section, the Kinetic model with a reduced number of species and reactions was used for
modelling the soot formation. The basis of such model is a chemical reaction mechanism for
soot formation and oxidation including 1850 homogeneous reactions, 186 species and 100
heterogeneous reactions [56].
3.1.1. Experimental data and numerical setup
The experimental research was performed in the frame of the bowl optimization project,
and it was carried out by AVL GmbH researchers. A single cylinder engine with Electro-
Hydraulic Valve Actuation and a ω-shaped piston (EHVA) was researched by using the AVL’s
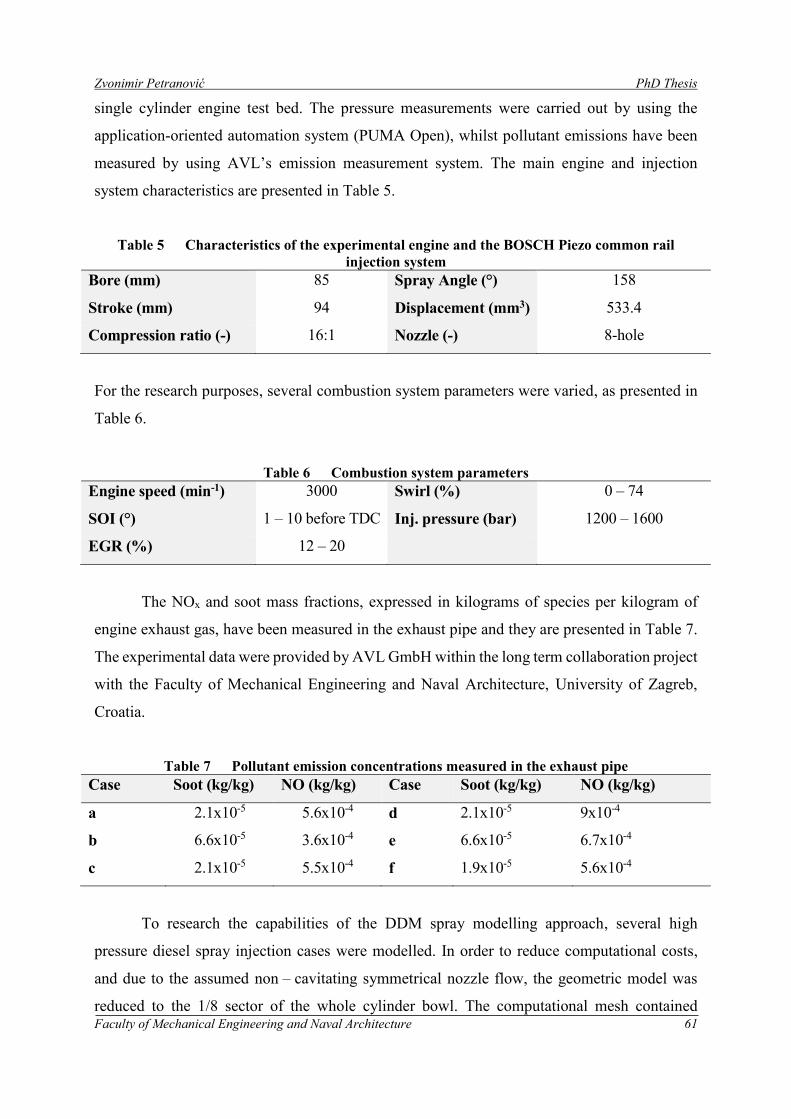
Zvonimir Petranović PhD Thesis
Faculty of Mechanical Engineering and Naval Architecture 61
single cylinder engine test bed. The pressure measurements were carried out by using the
application-oriented automation system (PUMA Open), whilst pollutant emissions have been
measured by using AVL’s emission measurement system. The main engine and injection
system characteristics are presented in Table 5.
Table 5 Characteristics of the experimental engine and the BOSCH Piezo common rail
injection system
Bore (mm) 85 Spray Angle (°) 158
Stroke (mm) 94 Displacement (mm3) 533.4
Compression ratio (-) 16:1 Nozzle (-) 8-hole
For the research purposes, several combustion system parameters were varied, as presented in
Table 6.
Table 6 Combustion system parameters
Engine speed (min-1) 3000 Swirl (%) 0 – 74
SOI (°) 1 – 10 before TDC Inj. pressure (bar) 1200 – 1600
EGR (%) 12 – 20
The NOx and soot mass fractions, expressed in kilograms of species per kilogram of
engine exhaust gas, have been measured in the exhaust pipe and they are presented in Table 7.
The experimental data were provided by AVL GmbH within the long term collaboration project
with the Faculty of Mechanical Engineering and Naval Architecture, University of Zagreb,
Croatia.
Table 7 Pollutant emission concentrations measured in the exhaust pipe
Case Soot (kg/kg) NO (kg/kg) Case Soot (kg/kg) NO (kg/kg)
a 2.1x10⁻⁵ 5.6x10⁻⁴ d 2.1x10⁻⁵ 9x10⁻⁴
b 6.6x10⁻⁵ 3.6x10⁻⁴ e 6.6x10⁻⁵ 6.7x10⁻⁴
c 2.1x10⁻⁵ 5.5x10⁻⁴ f 1.9x10⁻⁵ 5.6x10⁻⁴
To research the capabilities of the DDM spray modelling approach, several high
pressure diesel spray injection cases were modelled. In order to reduce computational costs,
and due to the assumed non – cavitating symmetrical nozzle flow, the geometric model was
reduced to the 1/8 sector of the whole cylinder bowl. The computational mesh contained
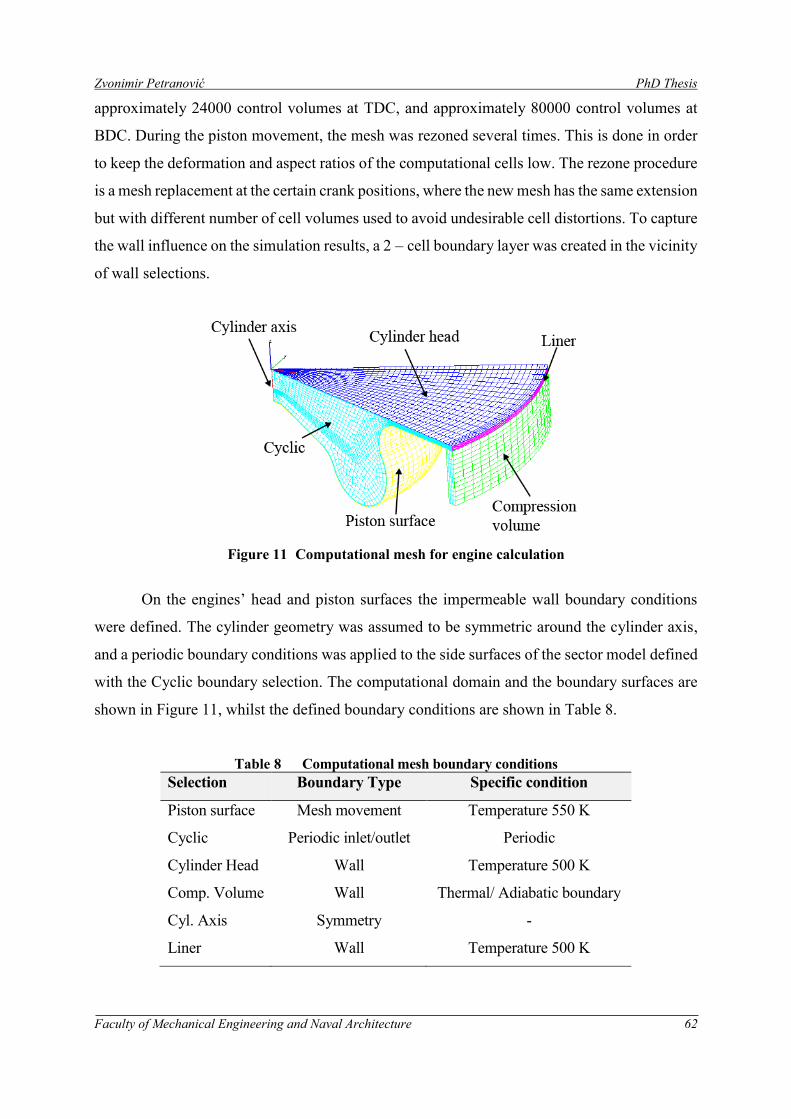
Zvonimir Petranović PhD Thesis
Faculty of Mechanical Engineering and Naval Architecture 62
approximately 24000 control volumes at TDC, and approximately 80000 control volumes at
BDC. During the piston movement, the mesh was rezoned several times. This is done in order
to keep the deformation and aspect ratios of the computational cells low. The rezone procedure
is a mesh replacement at the certain crank positions, where the new mesh has the same extension
but with different number of cell volumes used to avoid undesirable cell distortions. To capture
the wall influence on the simulation results, a 2 – cell boundary layer was created in the vicinity
of wall selections.
Figure 11 Computational mesh for engine calculation
On the engines’ head and piston surfaces the impermeable wall boundary conditions
were defined. The cylinder geometry was assumed to be symmetric around the cylinder axis,
and a periodic boundary conditions was applied to the side surfaces of the sector model defined
with the Cyclic boundary selection. The computational domain and the boundary surfaces are
shown in Figure 11, whilst the defined boundary conditions are shown in Table 8.
Table 8 Computational mesh boundary conditions
Selection Boundary Type Specific condition
Piston surface Mesh movement Temperature 550 K
Cyclic Periodic inlet/outlet Periodic
Cylinder Head Wall Temperature 500 K
Comp. Volume Wall Thermal/ Adiabatic boundary
Cyl. Axis Symmetry -
Liner Wall Temperature 500 K
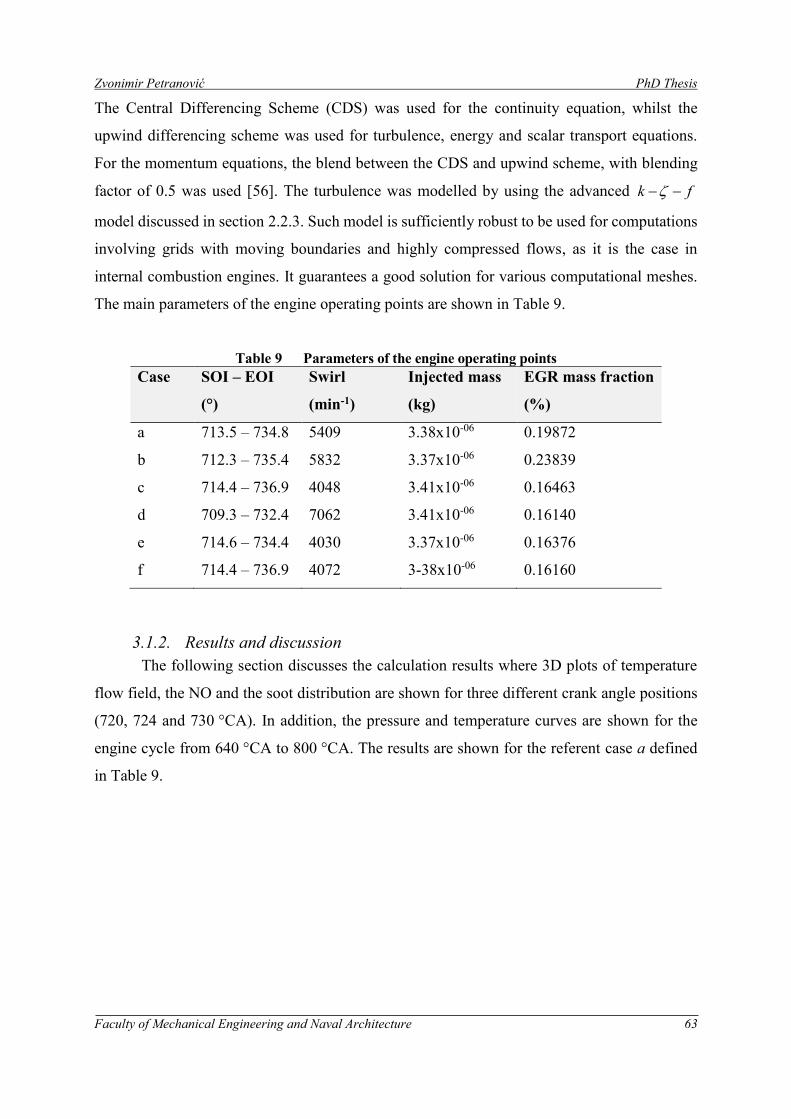
Zvonimir Petranović PhD Thesis
Faculty of Mechanical Engineering and Naval Architecture 63
The Central Differencing Scheme (CDS) was used for the continuity equation, whilst the
upwind differencing scheme was used for turbulence, energy and scalar transport equations.
For the momentum equations, the blend between the CDS and upwind scheme, with blending
factor of 0.5 was used [56]. The turbulence was modelled by using the advanced k f
model discussed in section 2.2.3. Such model is sufficiently robust to be used for computations
involving grids with moving boundaries and highly compressed flows, as it is the case in
internal combustion engines. It guarantees a good solution for various computational meshes.
The main parameters of the engine operating points are shown in Table 9.
Table 9 Parameters of the engine operating points
Case SOI – EOI
(°)
Swirl
(min-1)
Injected mass
(kg)
EGR mass fraction
(%)
a 713.5 – 734.8 5409 3.38x10-06 0.19872
b 712.3 – 735.4 5832 3.37x10-06 0.23839
c 714.4 – 736.9 4048 3.41x10-06 0.16463
d 709.3 – 732.4 7062 3.41x10-06 0.16140
e 714.6 – 734.4 4030 3.37x10-06 0.16376
f 714.4 – 736.9 4072 3-38x10-06 0.16160
3.1.2. Results and discussion
The following section discusses the calculation results where 3D plots of temperature
flow field, the NO and the soot distribution are shown for three different crank angle positions
(720, 724 and 730 °CA). In addition, the pressure and temperature curves are shown for the
engine cycle from 640 °CA to 800 °CA. The results are shown for the referent case a defined
in Table 9.
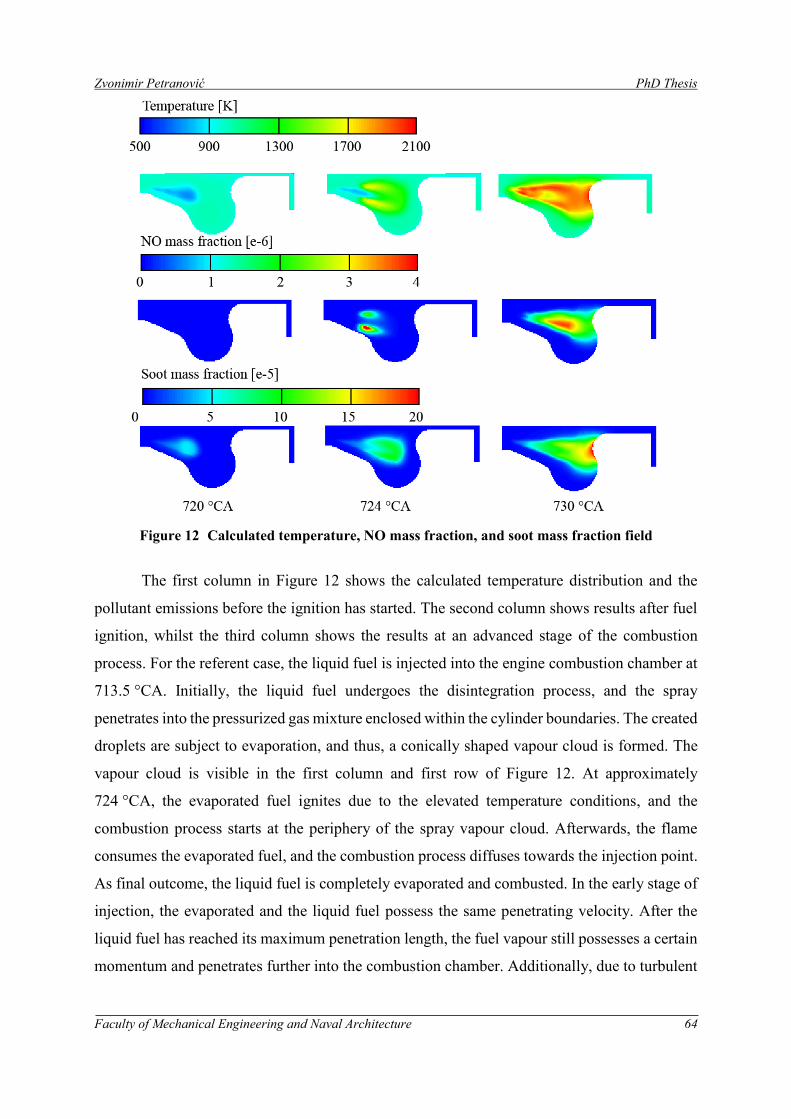
Zvonimir Petranović PhD Thesis
Faculty of Mechanical Engineering and Naval Architecture 64
Figure 12 Calculated temperature, NO mass fraction, and soot mass fraction field
The first column in Figure 12 shows the calculated temperature distribution and the
pollutant emissions before the ignition has started. The second column shows results after fuel
ignition, whilst the third column shows the results at an advanced stage of the combustion
process. For the referent case, the liquid fuel is injected into the engine combustion chamber at
713.5 °CA. Initially, the liquid fuel undergoes the disintegration process, and the spray
penetrates into the pressurized gas mixture enclosed within the cylinder boundaries. The created
droplets are subject to evaporation, and thus, a conically shaped vapour cloud is formed. The
vapour cloud is visible in the first column and first row of Figure 12. At approximately
724 °CA, the evaporated fuel ignites due to the elevated temperature conditions, and the
combustion process starts at the periphery of the spray vapour cloud. Afterwards, the flame
consumes the evaporated fuel, and the combustion process diffuses towards the injection point.
As final outcome, the liquid fuel is completely evaporated and combusted. In the early stage of
injection, the evaporated and the liquid fuel possess the same penetrating velocity. After the
liquid fuel has reached its maximum penetration length, the fuel vapour still possesses a certain
momentum and penetrates further into the combustion chamber. Additionally, due to turbulent
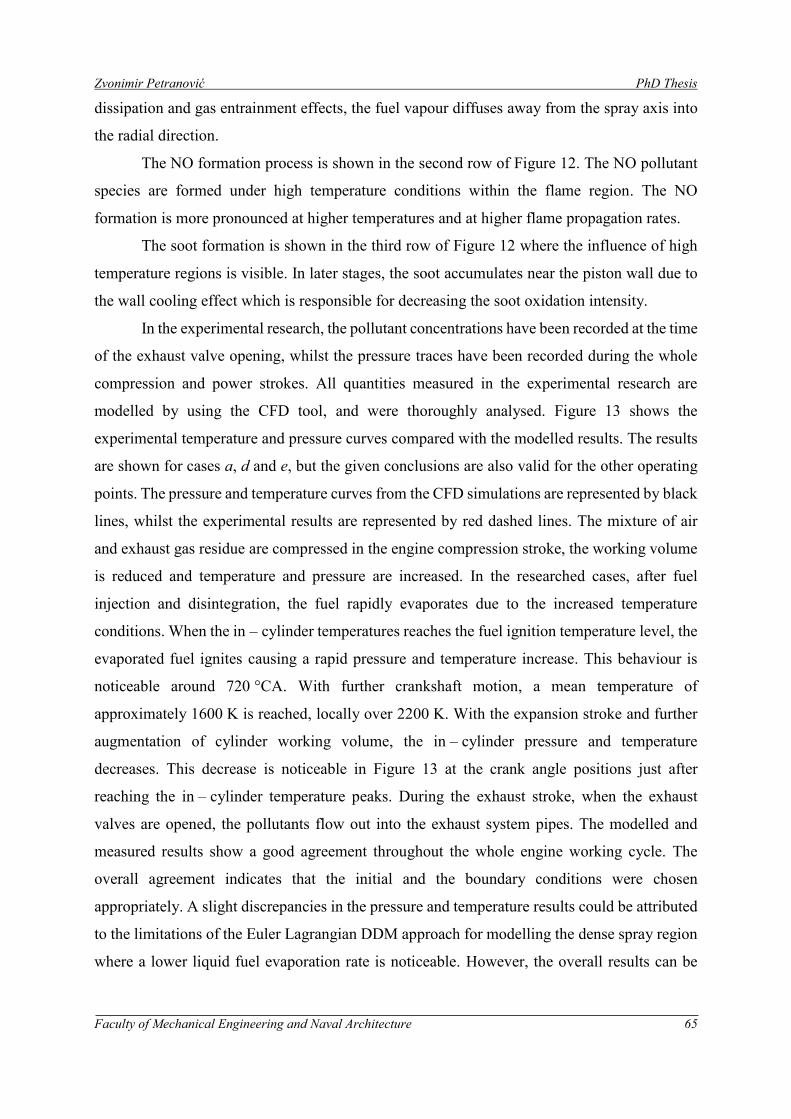
Zvonimir Petranović PhD Thesis
Faculty of Mechanical Engineering and Naval Architecture 65
dissipation and gas entrainment effects, the fuel vapour diffuses away from the spray axis into
the radial direction.
The NO formation process is shown in the second row of Figure 12. The NO pollutant
species are formed under high temperature conditions within the flame region. The NO
formation is more pronounced at higher temperatures and at higher flame propagation rates.
The soot formation is shown in the third row of Figure 12 where the influence of high
temperature regions is visible. In later stages, the soot accumulates near the piston wall due to
the wall cooling effect which is responsible for decreasing the soot oxidation intensity.
In the experimental research, the pollutant concentrations have been recorded at the time
of the exhaust valve opening, whilst the pressure traces have been recorded during the whole
compression and power strokes. All quantities measured in the experimental research are
modelled by using the CFD tool, and were thoroughly analysed. Figure 13 shows the
experimental temperature and pressure curves compared with the modelled results. The results
are shown for cases a, d and e, but the given conclusions are also valid for the other operating
points. The pressure and temperature curves from the CFD simulations are represented by black
lines, whilst the experimental results are represented by red dashed lines. The mixture of air
and exhaust gas residue are compressed in the engine compression stroke, the working volume
is reduced and temperature and pressure are increased. In the researched cases, after fuel
injection and disintegration, the fuel rapidly evaporates due to the increased temperature
conditions. When the in – cylinder temperatures reaches the fuel ignition temperature level, the
evaporated fuel ignites causing a rapid pressure and temperature increase. This behaviour is
noticeable around 720 °CA. With further crankshaft motion, a mean temperature of
approximately 1600 K is reached, locally over 2200 K. With the expansion stroke and further
augmentation of cylinder working volume, the in – cylinder pressure and temperature
decreases. This decrease is noticeable in Figure 13 at the crank angle positions just after
reaching the in – cylinder temperature peaks. During the exhaust stroke, when the exhaust
valves are opened, the pollutants flow out into the exhaust system pipes. The modelled and
measured results show a good agreement throughout the whole engine working cycle. The
overall agreement indicates that the initial and the boundary conditions were chosen
appropriately. A slight discrepancies in the pressure and temperature results could be attributed
to the limitations of the Euler Lagrangian DDM approach for modelling the dense spray region
where a lower liquid fuel evaporation rate is noticeable. However, the overall results can be
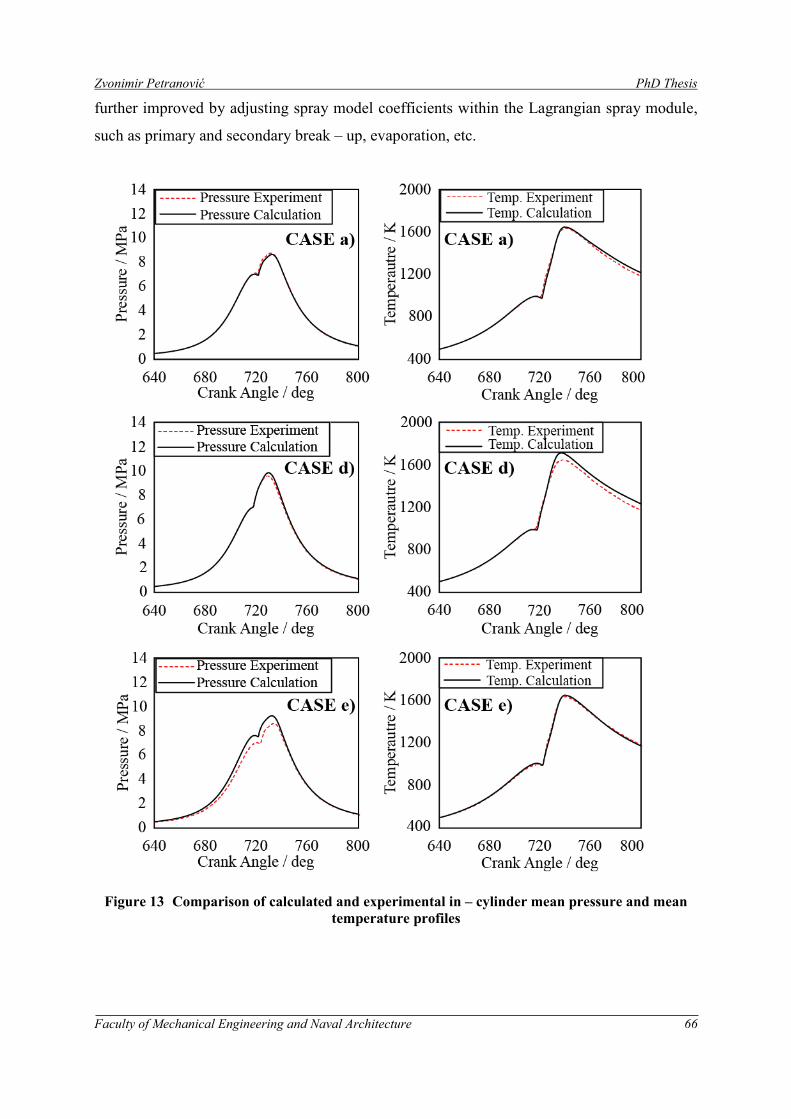
Zvonimir Petranović PhD Thesis
Faculty of Mechanical Engineering and Naval Architecture 66
further improved by adjusting spray model coefficients within the Lagrangian spray module,
such as primary and secondary break – up, evaporation, etc.
Figure 13 Comparison of calculated and experimental in – cylinder mean pressure and mean
temperature profiles
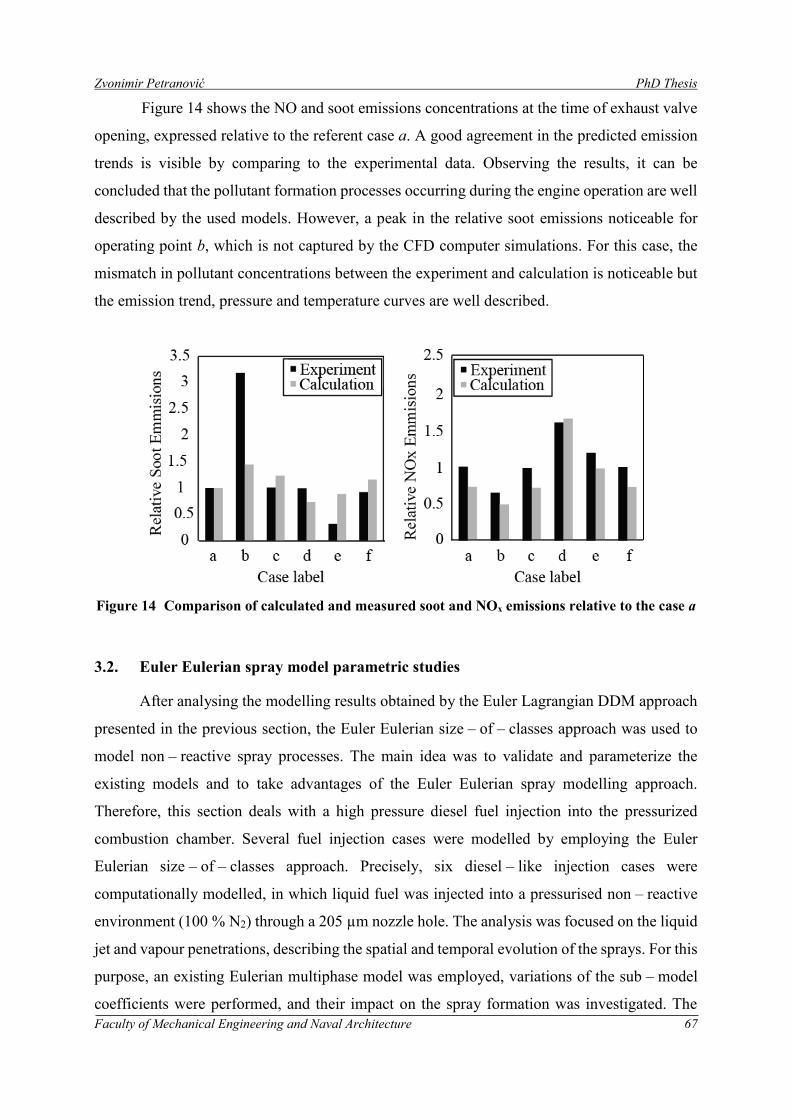
Zvonimir Petranović PhD Thesis
Faculty of Mechanical Engineering and Naval Architecture 67
Figure 14 shows the NO and soot emissions concentrations at the time of exhaust valve
opening, expressed relative to the referent case a. A good agreement in the predicted emission
trends is visible by comparing to the experimental data. Observing the results, it can be
concluded that the pollutant formation processes occurring during the engine operation are well
described by the used models. However, a peak in the relative soot emissions noticeable for
operating point b, which is not captured by the CFD computer simulations. For this case, the
mismatch in pollutant concentrations between the experiment and calculation is noticeable but
the emission trend, pressure and temperature curves are well described.
Figure 14 Comparison of calculated and measured soot and NOx emissions relative to the case a
3.2. Euler Eulerian spray model parametric studies
After analysing the modelling results obtained by the Euler Lagrangian DDM approach
presented in the previous section, the Euler Eulerian size – of – classes approach was used to
model non – reactive spray processes. The main idea was to validate and parameterize the
existing models and to take advantages of the Euler Eulerian spray modelling approach.
Therefore, this section deals with a high pressure diesel fuel injection into the pressurized
combustion chamber. Several fuel injection cases were modelled by employing the Euler
Eulerian size – of – classes approach. Precisely, six diesel – like injection cases were
computationally modelled, in which liquid fuel was injected into a pressurised non – reactive
environment (100 % N2) through a 205 µm nozzle hole. The analysis was focused on the liquid
jet and vapour penetrations, describing the spatial and temporal evolution of the sprays. For this
purpose, an existing Eulerian multiphase model was employed, variations of the sub – model
coefficients were performed, and their impact on the spray formation was investigated. The
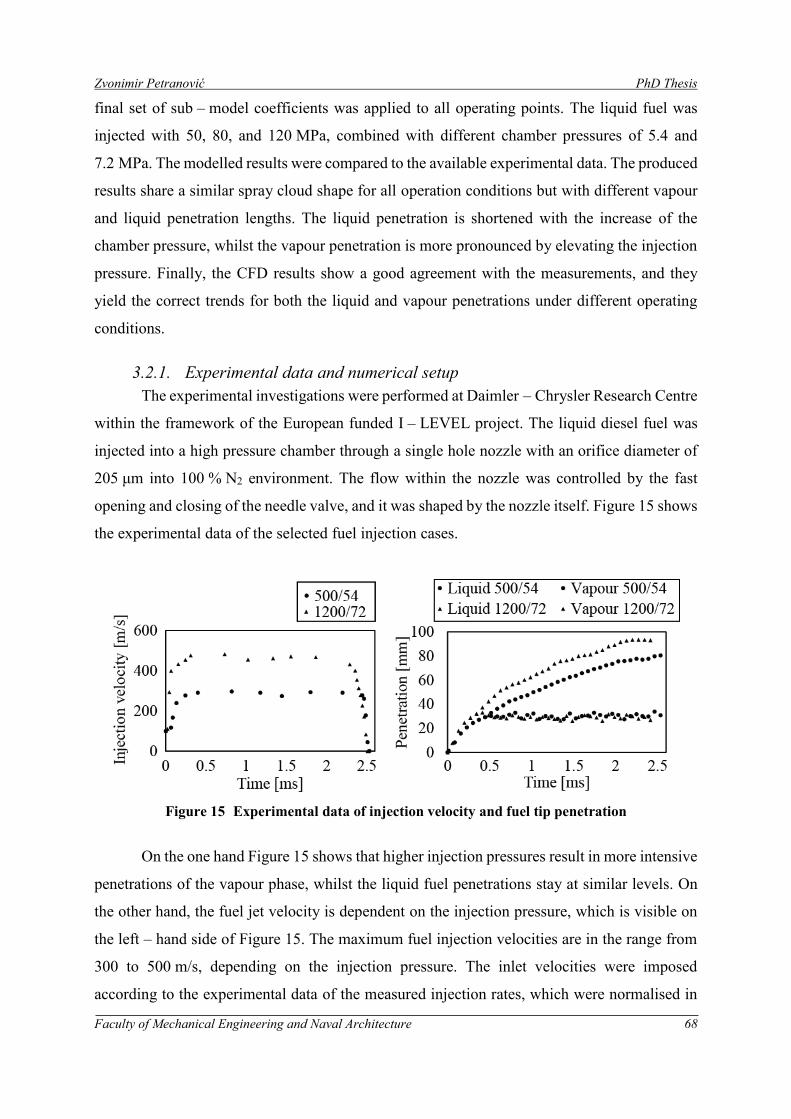
Zvonimir Petranović PhD Thesis
Faculty of Mechanical Engineering and Naval Architecture 68
final set of sub – model coefficients was applied to all operating points. The liquid fuel was
injected with 50, 80, and 120 MPa, combined with different chamber pressures of 5.4 and
7.2 MPa. The modelled results were compared to the available experimental data. The produced
results share a similar spray cloud shape for all operation conditions but with different vapour
and liquid penetration lengths. The liquid penetration is shortened with the increase of the
chamber pressure, whilst the vapour penetration is more pronounced by elevating the injection
pressure. Finally, the CFD results show a good agreement with the measurements, and they
yield the correct trends for both the liquid and vapour penetrations under different operating
conditions.
3.2.1. Experimental data and numerical setup
The experimental investigations were performed at Daimler – Chrysler Research Centre
within the framework of the European funded I – LEVEL project. The liquid diesel fuel was
injected into a high pressure chamber through a single hole nozzle with an orifice diameter of
205 μm into 100 % N2 environment. The flow within the nozzle was controlled by the fast
opening and closing of the needle valve, and it was shaped by the nozzle itself. Figure 15 shows
the experimental data of the selected fuel injection cases.
Figure 15 Experimental data of injection velocity and fuel tip penetration
On the one hand Figure 15 shows that higher injection pressures result in more intensive
penetrations of the vapour phase, whilst the liquid fuel penetrations stay at similar levels. On
the other hand, the fuel jet velocity is dependent on the injection pressure, which is visible on
the left – hand side of Figure 15. The maximum fuel injection velocities are in the range from
300 to 500 m/s, depending on the injection pressure. The inlet velocities were imposed
according to the experimental data of the measured injection rates, which were normalised in
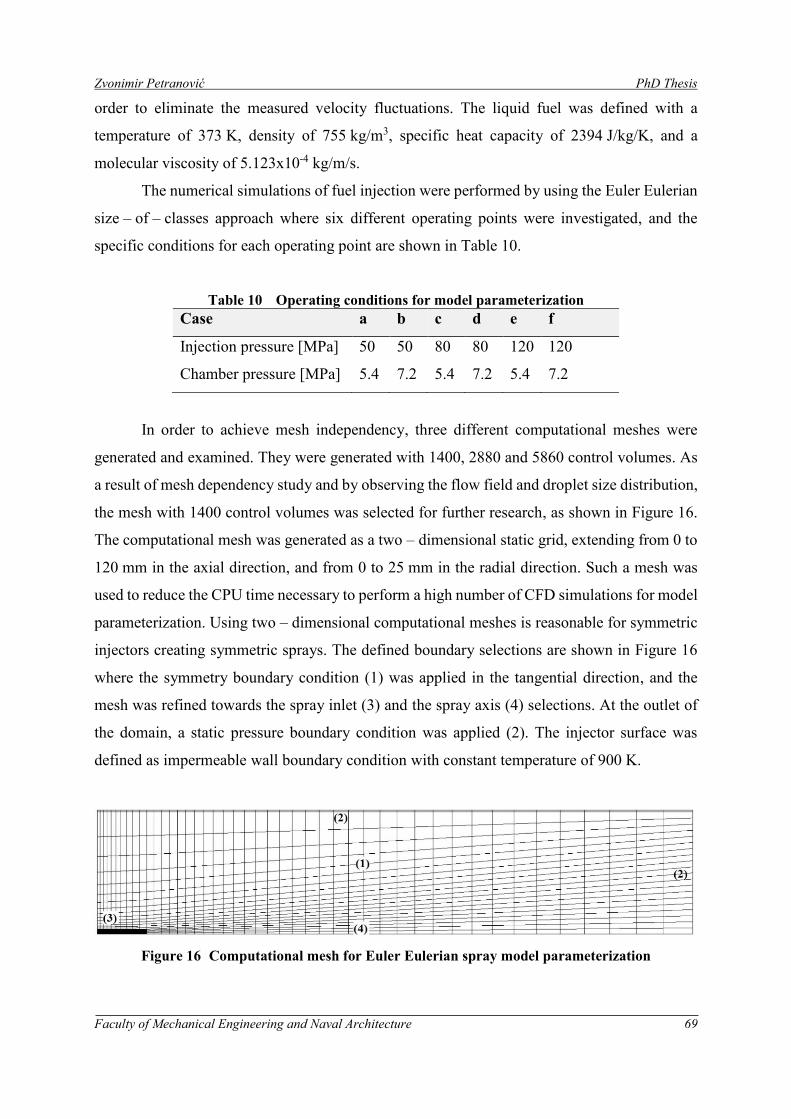
Zvonimir Petranović PhD Thesis
Faculty of Mechanical Engineering and Naval Architecture 69
order to eliminate the measured velocity fluctuations. The liquid fuel was defined with a
temperature of 373 K, density of 755 kg/m3, specific heat capacity of 2394 J/kg/K, and a
molecular viscosity of 5.123x10⁻⁴ kg/m/s.
The numerical simulations of fuel injection were performed by using the Euler Eulerian
size – of – classes approach where six different operating points were investigated, and the
specific conditions for each operating point are shown in Table 10.
Table 10 Operating conditions for model parameterization
Case a b c d e f
Injection pressure [MPa] 50 50 80 80 120 120
Chamber pressure [MPa] 5.4 7.2 5.4 7.2 5.4 7.2
In order to achieve mesh independency, three different computational meshes were
generated and examined. They were generated with 1400, 2880 and 5860 control volumes. As
a result of mesh dependency study and by observing the flow field and droplet size distribution,
the mesh with 1400 control volumes was selected for further research, as shown in Figure 16.
The computational mesh was generated as a two – dimensional static grid, extending from 0 to
120 mm in the axial direction, and from 0 to 25 mm in the radial direction. Such a mesh was
used to reduce the CPU time necessary to perform a high number of CFD simulations for model
parameterization. Using two – dimensional computational meshes is reasonable for symmetric
injectors creating symmetric sprays. The defined boundary selections are shown in Figure 16
where the symmetry boundary condition (1) was applied in the tangential direction, and the
mesh was refined towards the spray inlet (3) and the spray axis (4) selections. At the outlet of
the domain, a static pressure boundary condition was applied (2). The injector surface was
defined as impermeable wall boundary condition with constant temperature of 900 K.
Figure 16 Computational mesh for Euler Eulerian spray model parameterization
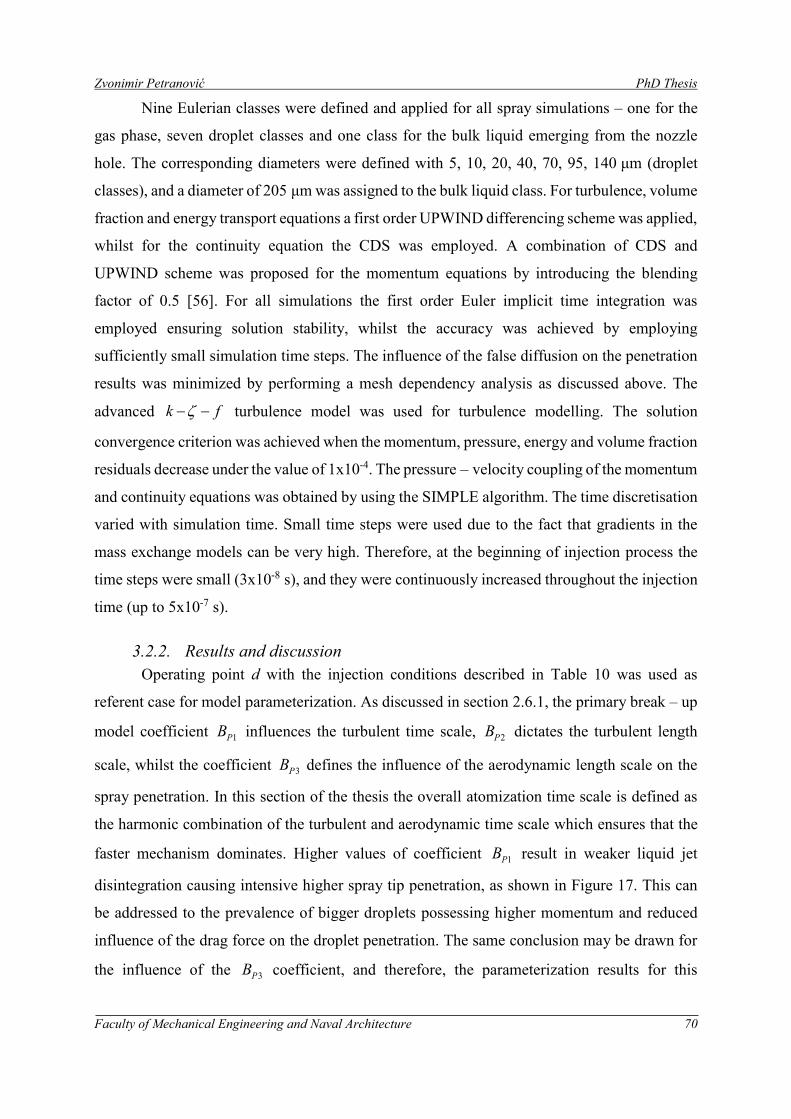
Zvonimir Petranović PhD Thesis
Faculty of Mechanical Engineering and Naval Architecture 70
Nine Eulerian classes were defined and applied for all spray simulations – one for the
gas phase, seven droplet classes and one class for the bulk liquid emerging from the nozzle
hole. The corresponding diameters were defined with 5, 10, 20, 40, 70, 95, 140 μm (droplet
classes), and a diameter of 205 μm was assigned to the bulk liquid class. For turbulence, volume
fraction and energy transport equations a first order UPWIND differencing scheme was applied,
whilst for the continuity equation the CDS was employed. A combination of CDS and
UPWIND scheme was proposed for the momentum equations by introducing the blending
factor of 0.5 [56]. For all simulations the first order Euler implicit time integration was
employed ensuring solution stability, whilst the accuracy was achieved by employing
sufficiently small simulation time steps. The influence of the false diffusion on the penetration
results was minimized by performing a mesh dependency analysis as discussed above. The
advanced k f turbulence model was used for turbulence modelling. The solution
convergence criterion was achieved when the momentum, pressure, energy and volume fraction
residuals decrease under the value of 1x10⁻⁴. The pressure – velocity coupling of the momentum
and continuity equations was obtained by using the SIMPLE algorithm. The time discretisation
varied with simulation time. Small time steps were used due to the fact that gradients in the
mass exchange models can be very high. Therefore, at the beginning of injection process the
time steps were small (3x10⁻⁸ s), and they were continuously increased throughout the injection
time (up to 5x10⁻⁷ s).
3.2.2. Results and discussion
Operating point d with the injection conditions described in Table 10 was used as
referent case for model parameterization. As discussed in section 2.6.1, the primary break – up
model coefficient 1PB influences the turbulent time scale, 2PB dictates the turbulent length
scale, whilst the coefficient 3PB defines the influence of the aerodynamic length scale on the
spray penetration. In this section of the thesis the overall atomization time scale is defined as
the harmonic combination of the turbulent and aerodynamic time scale which ensures that the
faster mechanism dominates. Higher values of coefficient 1PB result in weaker liquid jet
disintegration causing intensive higher spray tip penetration, as shown in Figure 17. This can
be addressed to the prevalence of bigger droplets possessing higher momentum and reduced
influence of the drag force on the droplet penetration. The same conclusion may be drawn for
the influence of the 3PB coefficient, and therefore, the parameterization results for this
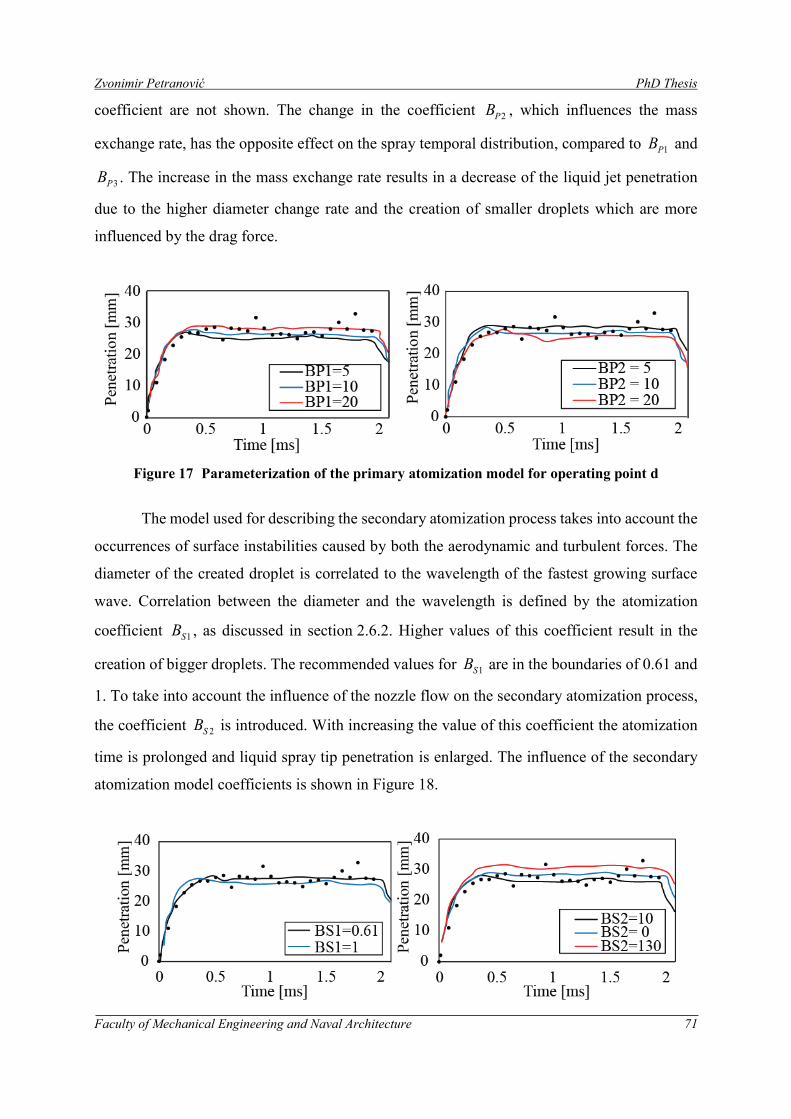
Zvonimir Petranović PhD Thesis
Faculty of Mechanical Engineering and Naval Architecture 71
coefficient are not shown. The change in the coefficient 2PB , which influences the mass
exchange rate, has the opposite effect on the spray temporal distribution, compared to 1PB and
3PB . The increase in the mass exchange rate results in a decrease of the liquid jet penetration
due to the higher diameter change rate and the creation of smaller droplets which are more
influenced by the drag force.
Figure 17 Parameterization of the primary atomization model for operating point d
The model used for describing the secondary atomization process takes into account the
occurrences of surface instabilities caused by both the aerodynamic and turbulent forces. The
diameter of the created droplet is correlated to the wavelength of the fastest growing surface
wave. Correlation between the diameter and the wavelength is defined by the atomization
coefficient 1SB , as discussed in section 2.6.2. Higher values of this coefficient result in the
creation of bigger droplets. The recommended values for 1SB are in the boundaries of 0.61 and
1. To take into account the influence of the nozzle flow on the secondary atomization process,
the coefficient 2SB is introduced. With increasing the value of this coefficient the atomization
time is prolonged and liquid spray tip penetration is enlarged. The influence of the secondary
atomization model coefficients is shown in Figure 18.
Zvonimir Petranović PhD Thesis
Faculty of Mechanical Engineering and Naval Architecture 72
Figure 18 Parameterization of the secondary atomization model for operating point d
Figure 19 shows the comparison of the simulated and measured liquid and vapour spray
tip penetrations for all investigated cases. The black solid line represents the calculated results,
where primary atomization, secondary atomization, and evaporation models were considered,
whilst the results of the experimental research are represented with black dots. At the initial
stage, the liquid fuel penetrates rapidly. The normal velocity condition was applied for the inlet
boundary. For a detailed investigation of the spray characteristics and the combustion process,
a more detailed inlet boundary description by resolving the nozzle flow field should be used.
Such a condition, which is discussed in section 3.3, will resolve the flow effects caused by the
needle movement and the nozzle hole geometrical imperfections. Therefore, a more accurate
and reliable approach would measure the needle lift movement by including the axial and radial
displacement as first step, and calculate fuel flow through the nozzle channel as second step. In
this way, a more realistic conditions at the nozzle hole exit, which takes into account the
turbulent fluid flow and the cavitation process, would be considered.
The liquid fuel evaporates due to the elevated temperature conditions, and a certain
amount of mass and momentum is transferred to the gas phase, leading the similar penetration
velocities for both phases. At this point it is important to mention that the detection of the spray
contour in the Euler Eulerian spray simulation was more difficult than for the Lagrangian spray
model. Here, the spray contours were determined by scanning the flow fields for the threshold
values of liquid volume and vapour mass fractions, respectively. In this section of the thesis,
the liquid spray tip penetration was defined as the furthest distance of the liquid phase where
the total liquid volume fraction accounts for 0.1 % of the observed control volume. With regard
to the vapour penetration, a threshold value of 1 % was defined. At a certain time after start of
injection, approximately at 0.4 ms, the liquid droplets located at the jet tip are completely
evaporated, and the liquid volume fraction drops below the defined threshold value. Complete
evaporation for the defined injection parameters was achieved at approximately 30 mm from
the nozzle hole in the spray axis direction. The given results imply that the vapour penetration
is reduced with increase in the ambient density due to the higher momentum dissipation.
Furthermore, the vapour cloud penetrated further into the domain owing to increased injection
pressure and higher liquid jet velocity.
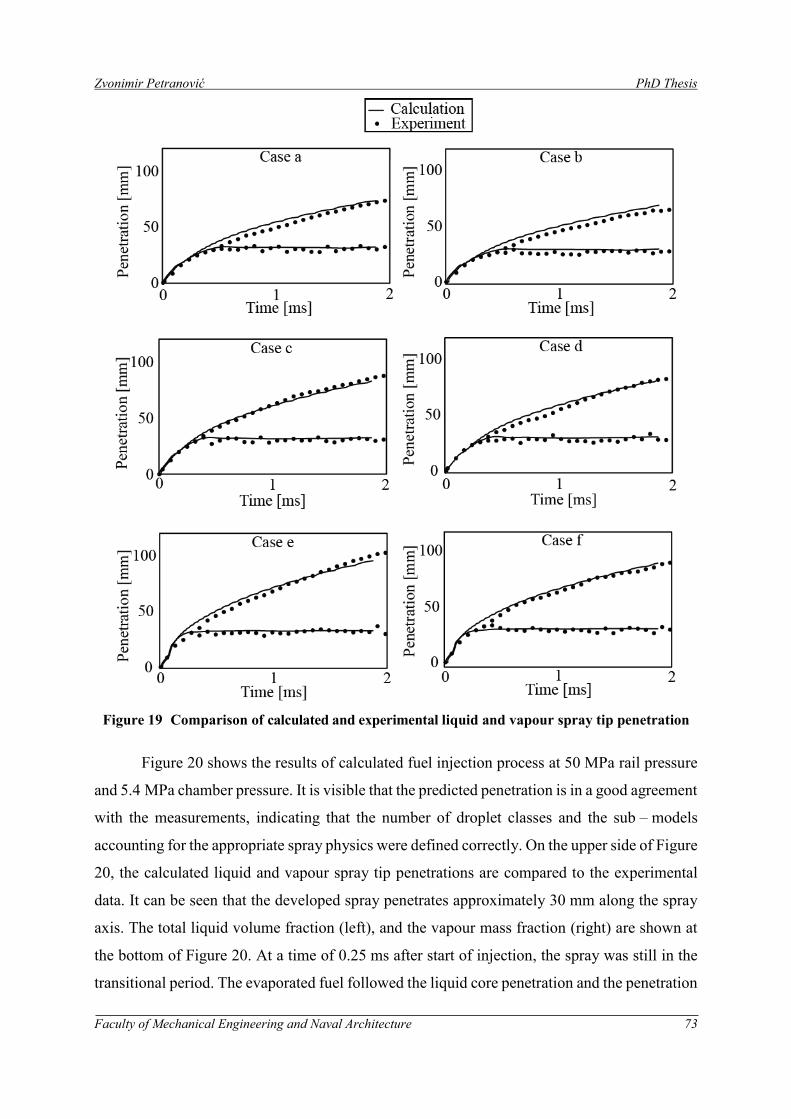
Zvonimir Petranović PhD Thesis
Faculty of Mechanical Engineering and Naval Architecture 73
Figure 19 Comparison of calculated and experimental liquid and vapour spray tip penetration
Figure 20 shows the results of calculated fuel injection process at 50 MPa rail pressure
and 5.4 MPa chamber pressure. It is visible that the predicted penetration is in a good agreement
with the measurements, indicating that the number of droplet classes and the sub – models
accounting for the appropriate spray physics were defined correctly. On the upper side of Figure
20, the calculated liquid and vapour spray tip penetrations are compared to the experimental
data. It can be seen that the developed spray penetrates approximately 30 mm along the spray
axis. The total liquid volume fraction (left), and the vapour mass fraction (right) are shown at
the bottom of Figure 20. At a time of 0.25 ms after start of injection, the spray was still in the
transitional period. The evaporated fuel followed the liquid core penetration and the penetration
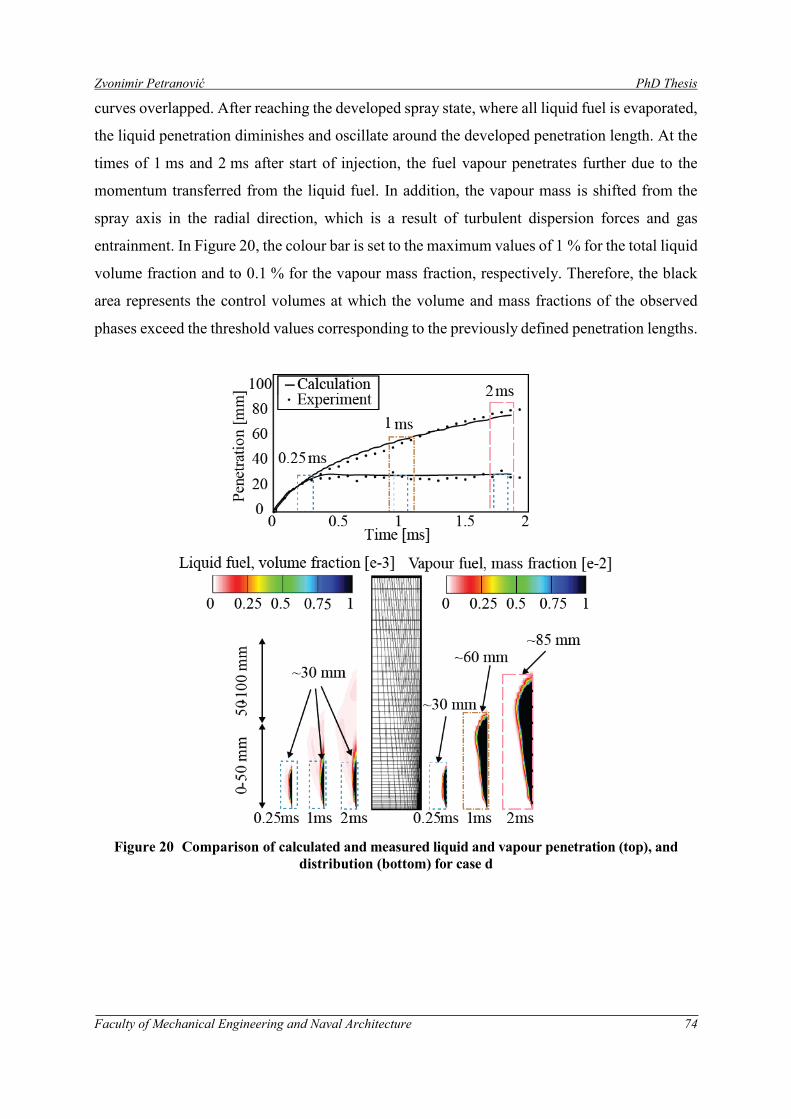
Zvonimir Petranović PhD Thesis
Faculty of Mechanical Engineering and Naval Architecture 74
curves overlapped. After reaching the developed spray state, where all liquid fuel is evaporated,
the liquid penetration diminishes and oscillate around the developed penetration length. At the
times of 1 ms and 2 ms after start of injection, the fuel vapour penetrates further due to the
momentum transferred from the liquid fuel. In addition, the vapour mass is shifted from the
spray axis in the radial direction, which is a result of turbulent dispersion forces and gas
entrainment. In Figure 20, the colour bar is set to the maximum values of 1 % for the total liquid
volume fraction and to 0.1 % for the vapour mass fraction, respectively. Therefore, the black
area represents the control volumes at which the volume and mass fractions of the observed
phases exceed the threshold values corresponding to the previously defined penetration lengths.
Figure 20 Comparison of calculated and measured liquid and vapour penetration (top), and
distribution (bottom) for case d
Zvonimir Petranović PhD Thesis
Faculty of Mechanical Engineering and Naval Architecture 75
3.3. Nozzle – flow spray coupling
After validation of the Euler Eulerian spray code implemented within the used CFD tool,
a more detailed investigation was performed regarding the modelling of fuel injection process.
As it was mentioned in the introduction and in the section 3.2, the fuel injection can be modelled
with a high level of details considering the in – nozzle flow (through the nozzle file interface),
or it can be simplified to a velocity boundary condition. In this section of the thesis the
verification results of the enhanced interface are shown. The nozzle file interface is used to
couple nozzle – flow and spray CFD simulations by using the generated nozzle file as inlet
boundary condition in spray simulations. Consequently, such an interface improves the
predictions of spray simulations, since it takes into account the cavitation process and
inhomogeneous turbulence and velocity fields at the nozzle orifice.
Nozzle file interface enhancement and verification
The nozzle file interface, implemented within the used CFD tool, was further enhanced
with MPI option and flexible nozzle file ability. These enhancements ensured that the inlet
selection of spray simulation can be divided on different processors making it more efficient in
terms of overall CPU time. Furthermore, the code was modified to remove the mesh
dependency disadvantage and now, the nozzle file feature can be used on any desired spray
mesh. The verification of the enhanced nozzle file interface was performed by running a vast
number of CFD simulations on a simplified computational domains, as shown in Figure 21. To
check the feature functionality, the nozzle outlet and spray inlet selections were generated
similar in size and with different number of faces. Three different meshes were used to cover
all possibilities of the nozzle – spray interface, where the spray inlet selection can be generated
as selection identical to the nozzle outflow selection, considering the same number of selection
faces. Furthermore, the spray inlet selection can contain different number of faces which is also
covered with the modified interface. The next section of this thesis shows a short introduction
in the mapping procedure, and the quantities that are being mapped through the nozzle – spray
interface.
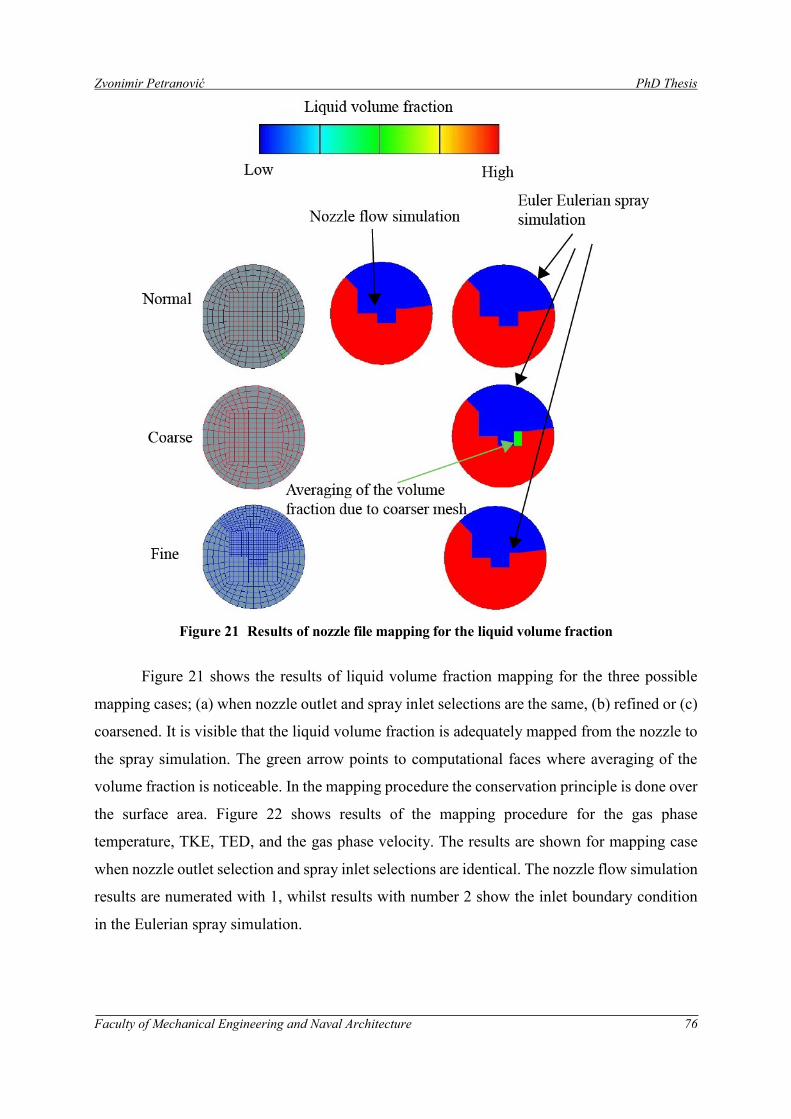
Zvonimir Petranović PhD Thesis
Faculty of Mechanical Engineering and Naval Architecture 76
Figure 21 Results of nozzle file mapping for the liquid volume fraction
Figure 21 shows the results of liquid volume fraction mapping for the three possible
mapping cases; (a) when nozzle outlet and spray inlet selections are the same, (b) refined or (c)
coarsened. It is visible that the liquid volume fraction is adequately mapped from the nozzle to
the spray simulation. The green arrow points to computational faces where averaging of the
volume fraction is noticeable. In the mapping procedure the conservation principle is done over
the surface area. Figure 22 shows results of the mapping procedure for the gas phase
temperature, TKE, TED, and the gas phase velocity. The results are shown for mapping case
when nozzle outlet selection and spray inlet selections are identical. The nozzle flow simulation
results are numerated with 1, whilst results with number 2 show the inlet boundary condition
in the Eulerian spray simulation.
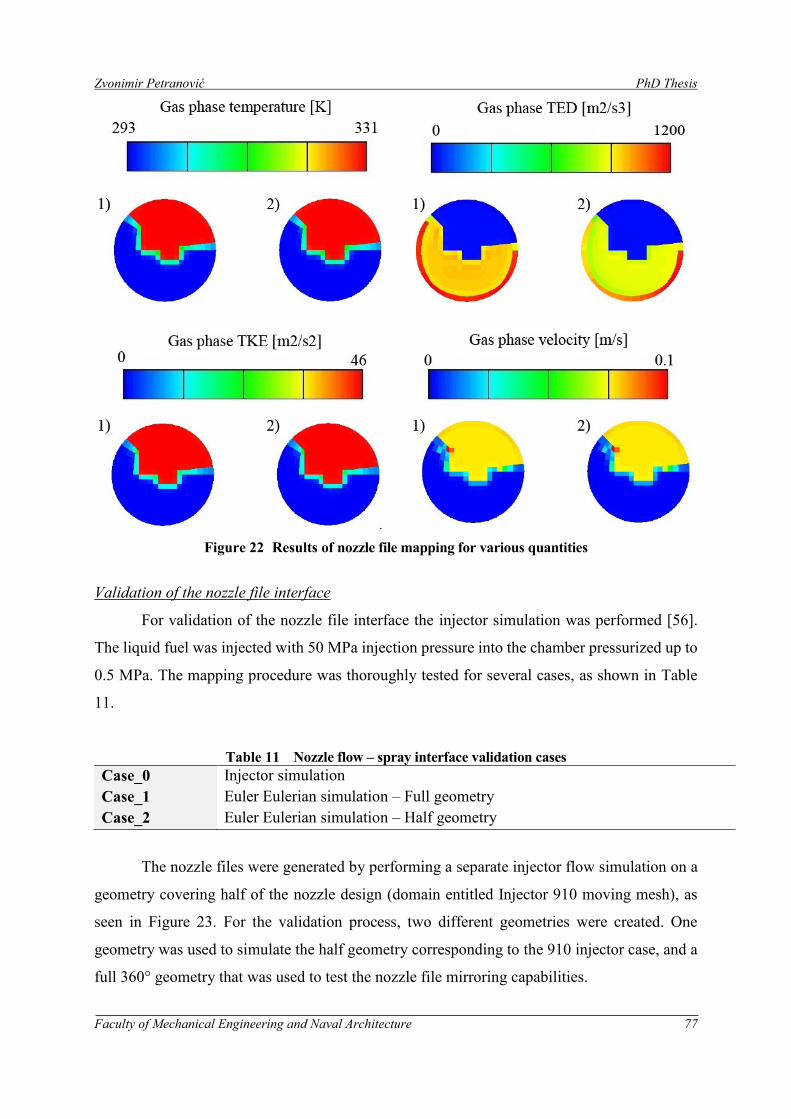
Zvonimir Petranović PhD Thesis
Faculty of Mechanical Engineering and Naval Architecture 77
Figure 22 Results of nozzle file mapping for various quantities
Validation of the nozzle file interface
For validation of the nozzle file interface the injector simulation was performed [56].
The liquid fuel was injected with 50 MPa injection pressure into the chamber pressurized up to
0.5 MPa. The mapping procedure was thoroughly tested for several cases, as shown in Table
11.
Table 11 Nozzle flow – spray interface validation cases
Case_0 Injector simulation
Case_1 Euler Eulerian simulation – Full geometry
Case_2 Euler Eulerian simulation – Half geometry
The nozzle files were generated by performing a separate injector flow simulation on a
geometry covering half of the nozzle design (domain entitled Injector 910 moving mesh), as
seen in Figure 23. For the validation process, two different geometries were created. One
geometry was used to simulate the half geometry corresponding to the 910 injector case, and a
full 360° geometry that was used to test the nozzle file mirroring capabilities.
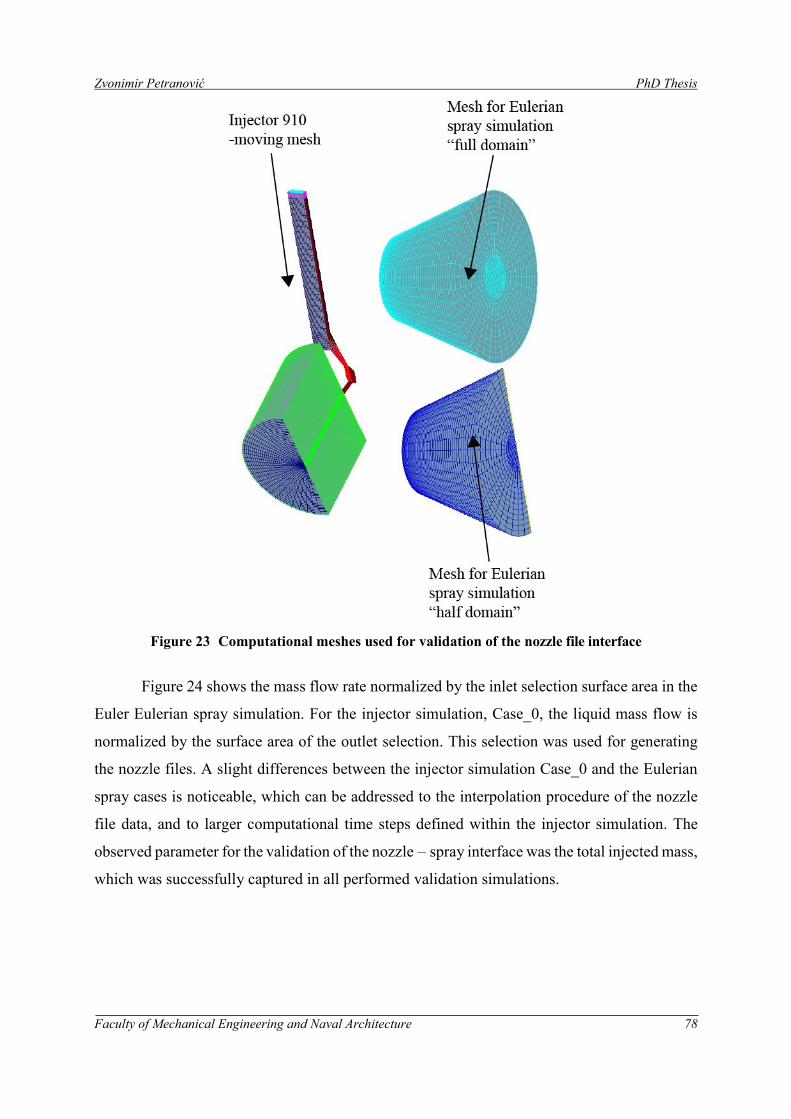
Zvonimir Petranović PhD Thesis
Faculty of Mechanical Engineering and Naval Architecture 78
Figure 23 Computational meshes used for validation of the nozzle file interface
Figure 24 shows the mass flow rate normalized by the inlet selection surface area in the
Euler Eulerian spray simulation. For the injector simulation, Case_0, the liquid mass flow is
normalized by the surface area of the outlet selection. This selection was used for generating
the nozzle files. A slight differences between the injector simulation Case_0 and the Eulerian
spray cases is noticeable, which can be addressed to the interpolation procedure of the nozzle
file data, and to larger computational time steps defined within the injector simulation. The
observed parameter for the validation of the nozzle – spray interface was the total injected mass,
which was successfully captured in all performed validation simulations.
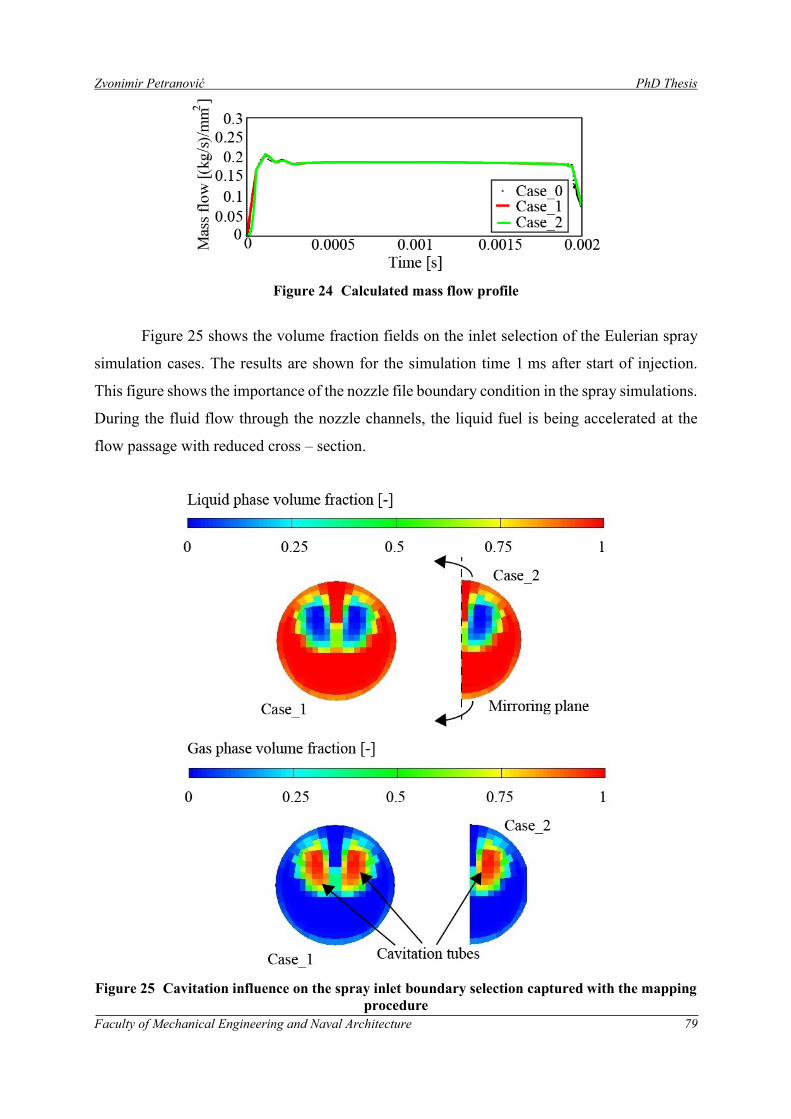
Zvonimir Petranović PhD Thesis
Faculty of Mechanical Engineering and Naval Architecture 79
Figure 24 Calculated mass flow profile
Figure 25 shows the volume fraction fields on the inlet selection of the Eulerian spray
simulation cases. The results are shown for the simulation time 1 ms after start of injection.
This figure shows the importance of the nozzle file boundary condition in the spray simulations.
During the fluid flow through the nozzle channels, the liquid fuel is being accelerated at the
flow passage with reduced cross – section.
Figure 25 Cavitation influence on the spray inlet boundary selection captured with the mapping
procedure
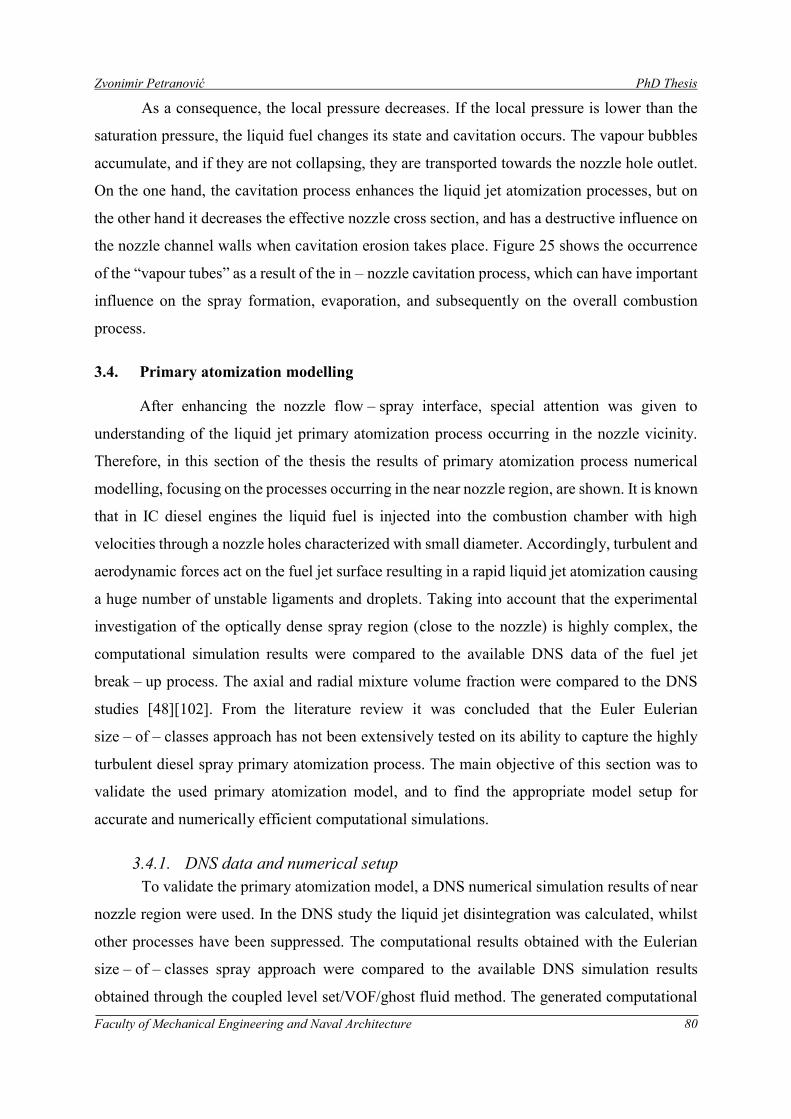
Zvonimir Petranović PhD Thesis
Faculty of Mechanical Engineering and Naval Architecture 80
As a consequence, the local pressure decreases. If the local pressure is lower than the
saturation pressure, the liquid fuel changes its state and cavitation occurs. The vapour bubbles
accumulate, and if they are not collapsing, they are transported towards the nozzle hole outlet.
On the one hand, the cavitation process enhances the liquid jet atomization processes, but on
the other hand it decreases the effective nozzle cross section, and has a destructive influence on
the nozzle channel walls when cavitation erosion takes place. Figure 25 shows the occurrence
of the “vapour tubes” as a result of the in – nozzle cavitation process, which can have important
influence on the spray formation, evaporation, and subsequently on the overall combustion
process.
3.4. Primary atomization modelling
After enhancing the nozzle flow – spray interface, special attention was given to
understanding of the liquid jet primary atomization process occurring in the nozzle vicinity.
Therefore, in this section of the thesis the results of primary atomization process numerical
modelling, focusing on the processes occurring in the near nozzle region, are shown. It is known
that in IC diesel engines the liquid fuel is injected into the combustion chamber with high
velocities through a nozzle holes characterized with small diameter. Accordingly, turbulent and
aerodynamic forces act on the fuel jet surface resulting in a rapid liquid jet atomization causing
a huge number of unstable ligaments and droplets. Taking into account that the experimental
investigation of the optically dense spray region (close to the nozzle) is highly complex, the
computational simulation results were compared to the available DNS data of the fuel jet
break – up process. The axial and radial mixture volume fraction were compared to the DNS
studies [48][102]. From the literature review it was concluded that the Euler Eulerian
size – of – classes approach has not been extensively tested on its ability to capture the highly
turbulent diesel spray primary atomization process. The main objective of this section was to
validate the used primary atomization model, and to find the appropriate model setup for
accurate and numerically efficient computational simulations.
3.4.1. DNS data and numerical setup
To validate the primary atomization model, a DNS numerical simulation results of near
nozzle region were used. In the DNS study the liquid jet disintegration was calculated, whilst
other processes have been suppressed. The computational results obtained with the Eulerian
size – of – classes spray approach were compared to the available DNS simulation results
obtained through the coupled level set/VOF/ghost fluid method. The generated computational
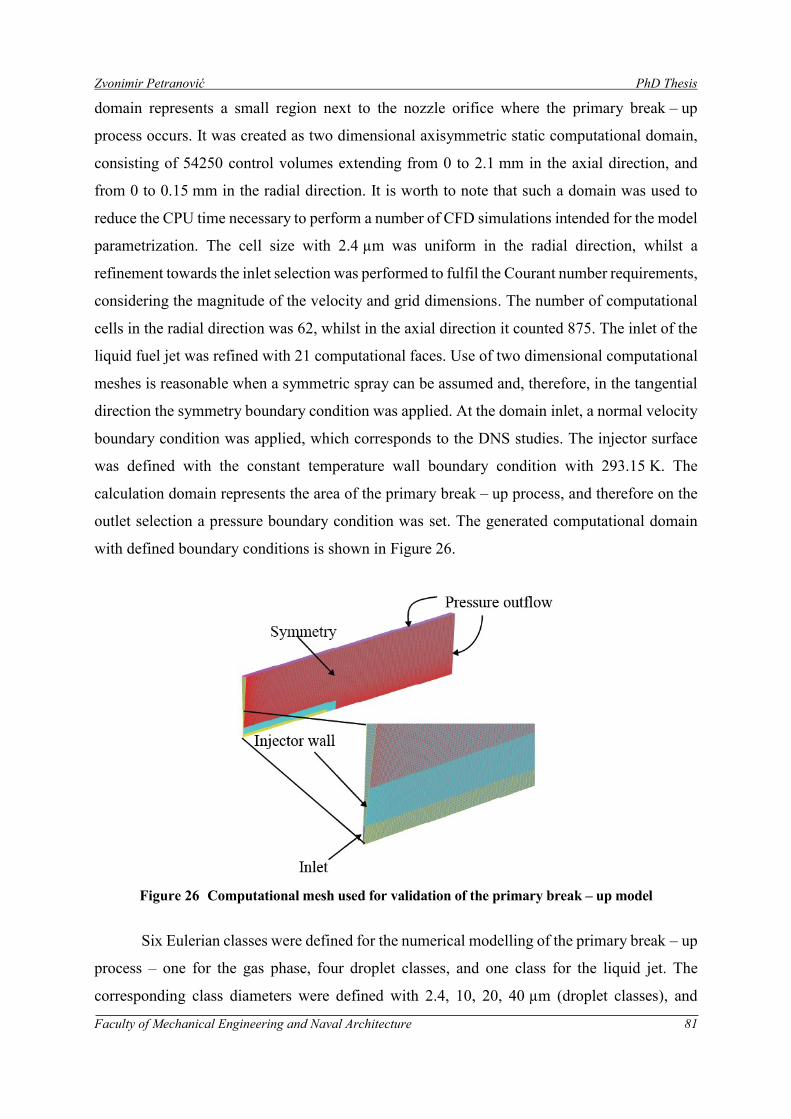
Zvonimir Petranović PhD Thesis
Faculty of Mechanical Engineering and Naval Architecture 81
domain represents a small region next to the nozzle orifice where the primary break – up
process occurs. It was created as two dimensional axisymmetric static computational domain,
consisting of 54250 control volumes extending from 0 to 2.1 mm in the axial direction, and
from 0 to 0.15 mm in the radial direction. It is worth to note that such a domain was used to
reduce the CPU time necessary to perform a number of CFD simulations intended for the model
parametrization. The cell size with 2.4 µm was uniform in the radial direction, whilst a
refinement towards the inlet selection was performed to fulfil the Courant number requirements,
considering the magnitude of the velocity and grid dimensions. The number of computational
cells in the radial direction was 62, whilst in the axial direction it counted 875. The inlet of the
liquid fuel jet was refined with 21 computational faces. Use of two dimensional computational
meshes is reasonable when a symmetric spray can be assumed and, therefore, in the tangential
direction the symmetry boundary condition was applied. At the domain inlet, a normal velocity
boundary condition was applied, which corresponds to the DNS studies. The injector surface
was defined with the constant temperature wall boundary condition with 293.15 K. The
calculation domain represents the area of the primary break – up process, and therefore on the
outlet selection a pressure boundary condition was set. The generated computational domain
with defined boundary conditions is shown in Figure 26.
Figure 26 Computational mesh used for validation of the primary break – up model
Six Eulerian classes were defined for the numerical modelling of the primary break – up
process – one for the gas phase, four droplet classes, and one class for the liquid jet. The
corresponding class diameters were defined with 2.4, 10, 20, 40 µm (droplet classes), and
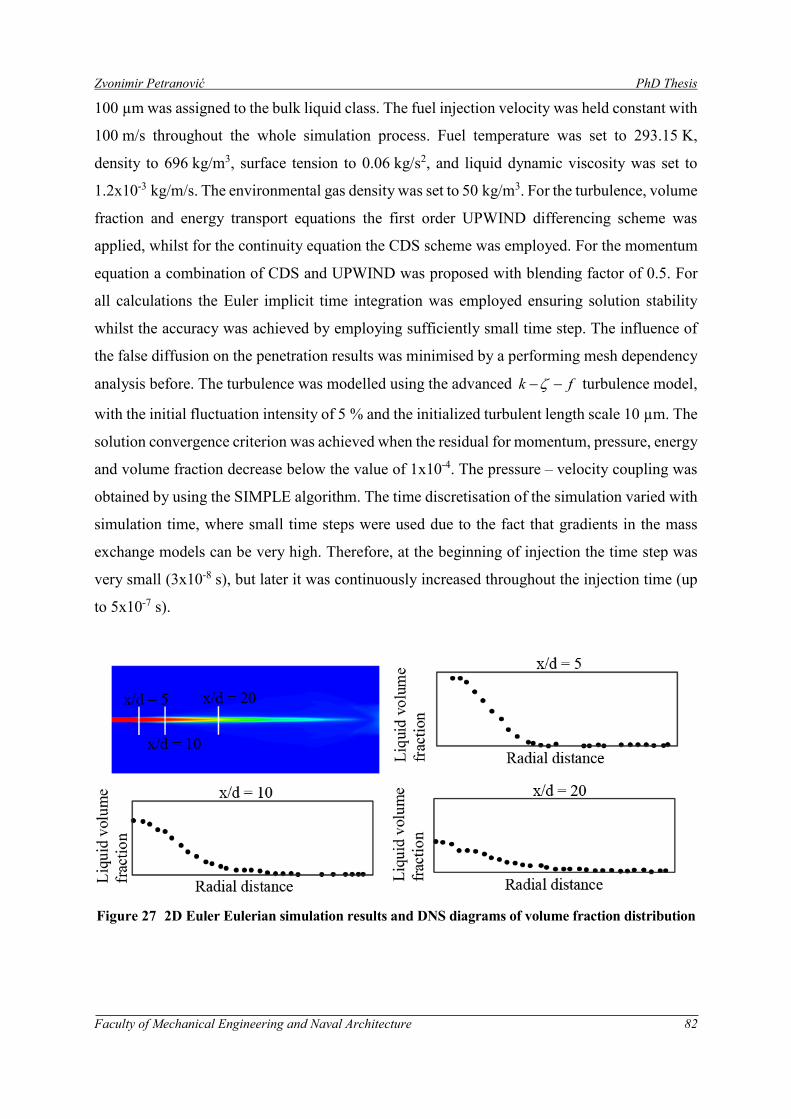
Zvonimir Petranović PhD Thesis
Faculty of Mechanical Engineering and Naval Architecture 82
100 µm was assigned to the bulk liquid class. The fuel injection velocity was held constant with
100 m/s throughout the whole simulation process. Fuel temperature was set to 293.15 K,
density to 696 kg/m3, surface tension to 0.06 kg/s2, and liquid dynamic viscosity was set to
1.2x10⁻³ kg/m/s. The environmental gas density was set to 50 kg/m3. For the turbulence, volume
fraction and energy transport equations the first order UPWIND differencing scheme was
applied, whilst for the continuity equation the CDS scheme was employed. For the momentum
equation a combination of CDS and UPWIND was proposed with blending factor of 0.5. For
all calculations the Euler implicit time integration was employed ensuring solution stability
whilst the accuracy was achieved by employing sufficiently small time step. The influence of
the false diffusion on the penetration results was minimised by a performing mesh dependency
analysis before. The turbulence was modelled using the advanced k f turbulence model,
with the initial fluctuation intensity of 5 % and the initialized turbulent length scale 10 µm. The
solution convergence criterion was achieved when the residual for momentum, pressure, energy
and volume fraction decrease below the value of 1x10⁻⁴. The pressure – velocity coupling was
obtained by using the SIMPLE algorithm. The time discretisation of the simulation varied with
simulation time, where small time steps were used due to the fact that gradients in the mass
exchange models can be very high. Therefore, at the beginning of injection the time step was
very small (3x10⁻⁸ s), but later it was continuously increased throughout the injection time (up
to 5x10⁻⁷ s).
Figure 27 2D Euler Eulerian simulation results and DNS diagrams of volume fraction distribution
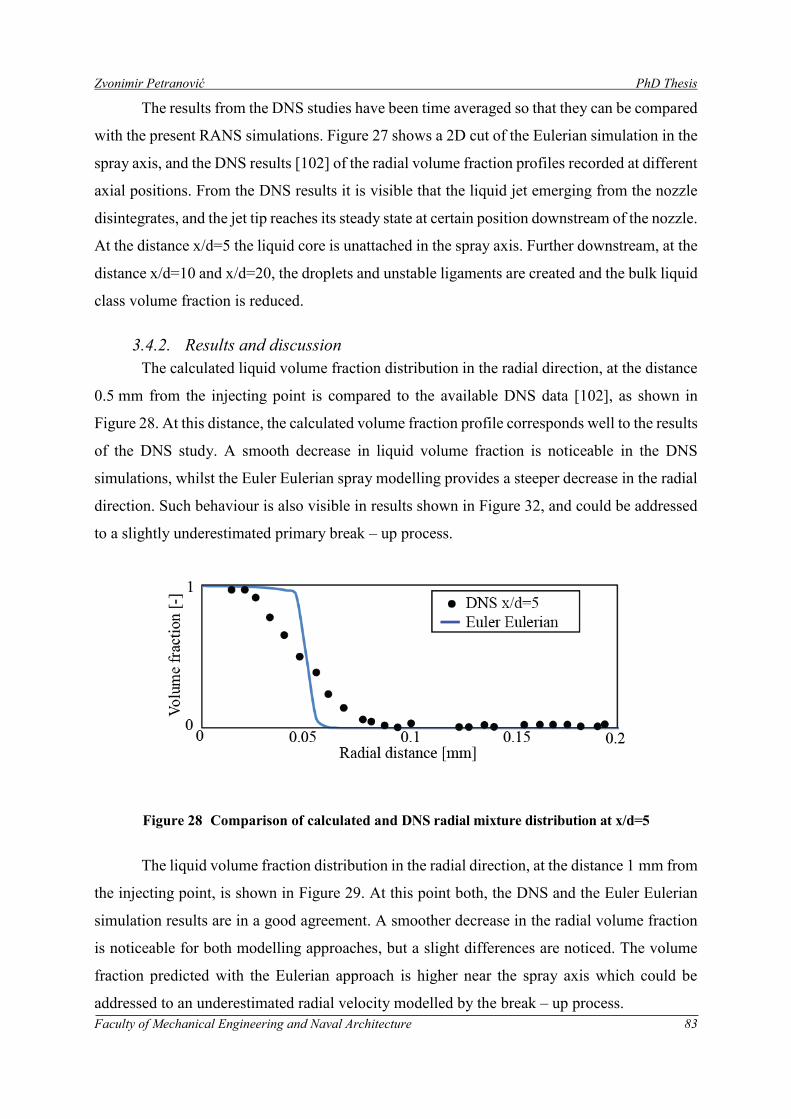
Zvonimir Petranović PhD Thesis
Faculty of Mechanical Engineering and Naval Architecture 83
The results from the DNS studies have been time averaged so that they can be compared
with the present RANS simulations. Figure 27 shows a 2D cut of the Eulerian simulation in the
spray axis, and the DNS results [102] of the radial volume fraction profiles recorded at different
axial positions. From the DNS results it is visible that the liquid jet emerging from the nozzle
disintegrates, and the jet tip reaches its steady state at certain position downstream of the nozzle.
At the distance x/d=5 the liquid core is unattached in the spray axis. Further downstream, at the
distance x/d=10 and x/d=20, the droplets and unstable ligaments are created and the bulk liquid
class volume fraction is reduced.
3.4.2. Results and discussion
The calculated liquid volume fraction distribution in the radial direction, at the distance
0.5 mm from the injecting point is compared to the available DNS data [102], as shown in
Figure 28. At this distance, the calculated volume fraction profile corresponds well to the results
of the DNS study. A smooth decrease in liquid volume fraction is noticeable in the DNS
simulations, whilst the Euler Eulerian spray modelling provides a steeper decrease in the radial
direction. Such behaviour is also visible in results shown in Figure 32, and could be addressed
to a slightly underestimated primary break – up process.
Figure 28 Comparison of calculated and DNS radial mixture distribution at x/d=5
The liquid volume fraction distribution in the radial direction, at the distance 1 mm from
the injecting point, is shown in Figure 29. At this point both, the DNS and the Euler Eulerian
simulation results are in a good agreement. A smoother decrease in the radial volume fraction
is noticeable for both modelling approaches, but a slight differences are noticed. The volume
fraction predicted with the Eulerian approach is higher near the spray axis which could be
addressed to an underestimated radial velocity modelled by the break – up process.
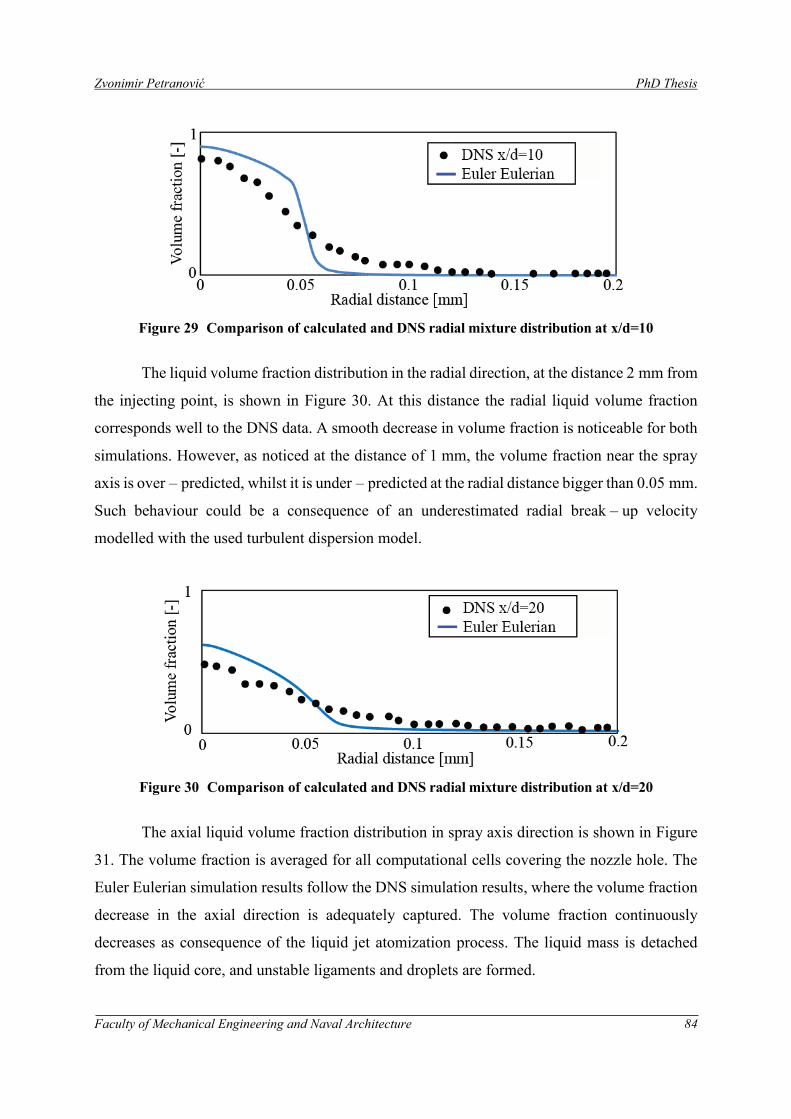
Zvonimir Petranović PhD Thesis
Faculty of Mechanical Engineering and Naval Architecture 84
Figure 29 Comparison of calculated and DNS radial mixture distribution at x/d=10
The liquid volume fraction distribution in the radial direction, at the distance 2 mm from
the injecting point, is shown in Figure 30. At this distance the radial liquid volume fraction
corresponds well to the DNS data. A smooth decrease in volume fraction is noticeable for both
simulations. However, as noticed at the distance of 1 mm, the volume fraction near the spray
axis is over – predicted, whilst it is under – predicted at the radial distance bigger than 0.05 mm.
Such behaviour could be a consequence of an underestimated radial break – up velocity
modelled with the used turbulent dispersion model.
Figure 30 Comparison of calculated and DNS radial mixture distribution at x/d=20
The axial liquid volume fraction distribution in spray axis direction is shown in Figure
31. The volume fraction is averaged for all computational cells covering the nozzle hole. The
Euler Eulerian simulation results follow the DNS simulation results, where the volume fraction
decrease in the axial direction is adequately captured. The volume fraction continuously
decreases as consequence of the liquid jet atomization process. The liquid mass is detached
from the liquid core, and unstable ligaments and droplets are formed.
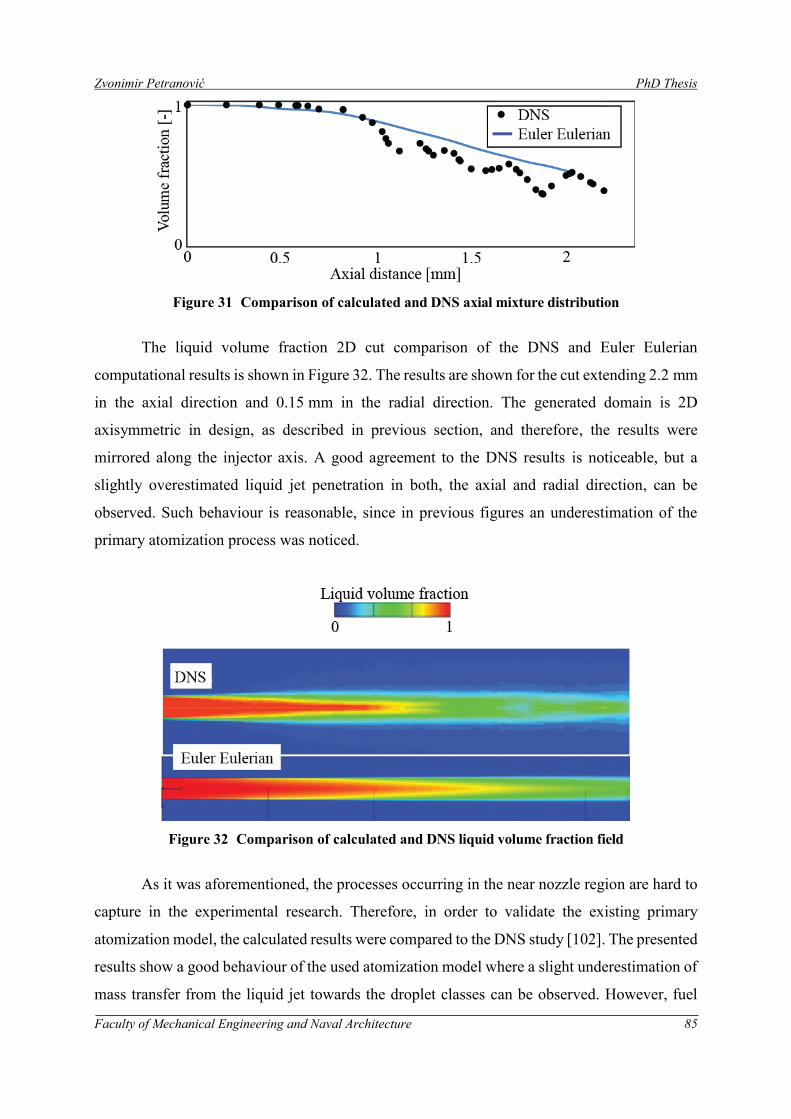
Zvonimir Petranović PhD Thesis
Faculty of Mechanical Engineering and Naval Architecture 85
Figure 31 Comparison of calculated and DNS axial mixture distribution
The liquid volume fraction 2D cut comparison of the DNS and Euler Eulerian
computational results is shown in Figure 32. The results are shown for the cut extending 2.2 mm
in the axial direction and 0.15 mm in the radial direction. The generated domain is 2D
axisymmetric in design, as described in previous section, and therefore, the results were
mirrored along the injector axis. A good agreement to the DNS results is noticeable, but a
slightly overestimated liquid jet penetration in both, the axial and radial direction, can be
observed. Such behaviour is reasonable, since in previous figures an underestimation of the
primary atomization process was noticed.
Figure 32 Comparison of calculated and DNS liquid volume fraction field
As it was aforementioned, the processes occurring in the near nozzle region are hard to
capture in the experimental research. Therefore, in order to validate the existing primary
atomization model, the calculated results were compared to the DNS study [102]. The presented
results show a good behaviour of the used atomization model where a slight underestimation of
mass transfer from the liquid jet towards the droplet classes can be observed. However, fuel
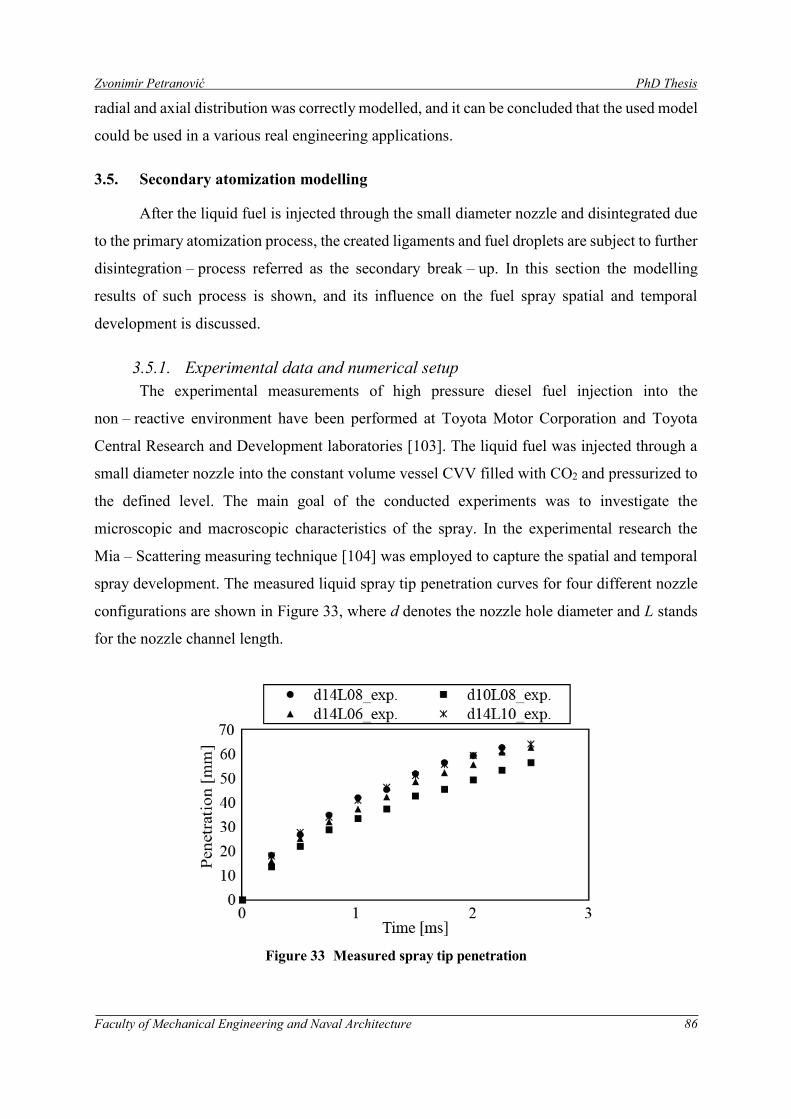
Zvonimir Petranović PhD Thesis
Faculty of Mechanical Engineering and Naval Architecture 86
radial and axial distribution was correctly modelled, and it can be concluded that the used model
could be used in a various real engineering applications.
3.5. Secondary atomization modelling
After the liquid fuel is injected through the small diameter nozzle and disintegrated due
to the primary atomization process, the created ligaments and fuel droplets are subject to further
disintegration – process referred as the secondary break – up. In this section the modelling
results of such process is shown, and its influence on the fuel spray spatial and temporal
development is discussed.
3.5.1. Experimental data and numerical setup
The experimental measurements of high pressure diesel fuel injection into the
non – reactive environment have been performed at Toyota Motor Corporation and Toyota
Central Research and Development laboratories [103]. The liquid fuel was injected through a
small diameter nozzle into the constant volume vessel CVV filled with CO2 and pressurized to
the defined level. The main goal of the conducted experiments was to investigate the
microscopic and macroscopic characteristics of the spray. In the experimental research the
Mia – Scattering measuring technique [104] was employed to capture the spatial and temporal
spray development. The measured liquid spray tip penetration curves for four different nozzle
configurations are shown in Figure 33, where d denotes the nozzle hole diameter and L stands
for the nozzle channel length.
Figure 33 Measured spray tip penetration
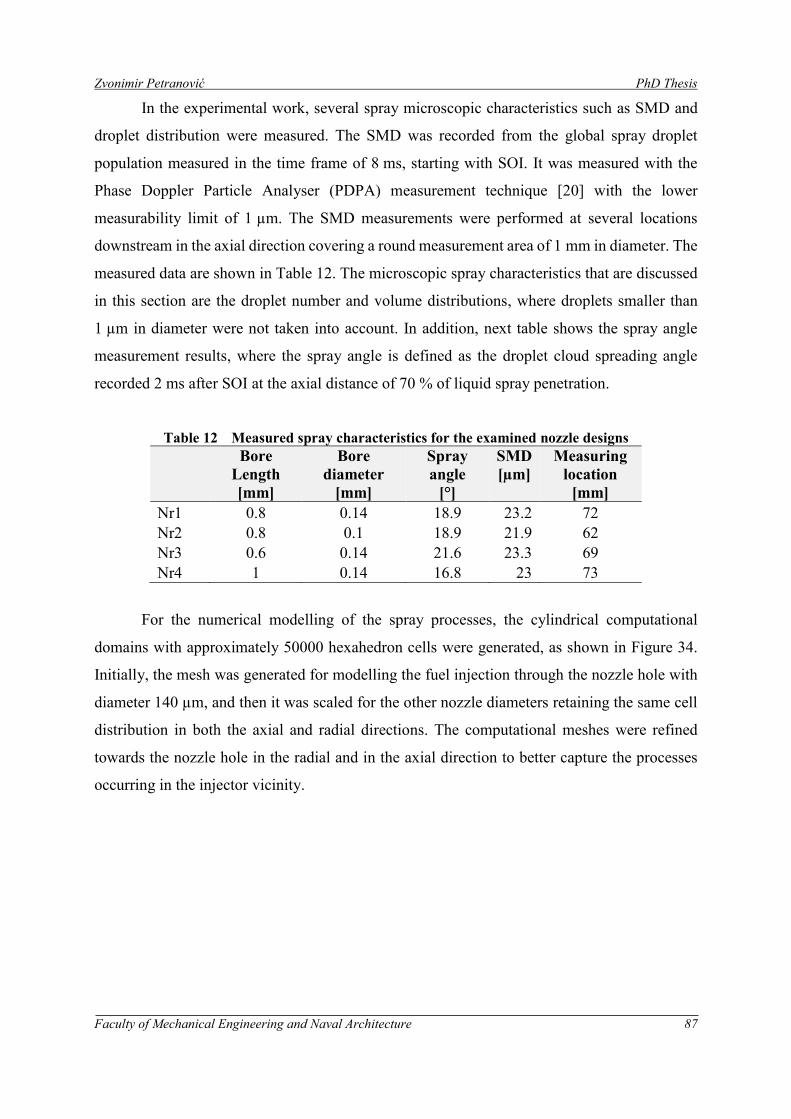
Zvonimir Petranović PhD Thesis
Faculty of Mechanical Engineering and Naval Architecture 87
In the experimental work, several spray microscopic characteristics such as SMD and
droplet distribution were measured. The SMD was recorded from the global spray droplet
population measured in the time frame of 8 ms, starting with SOI. It was measured with the
Phase Doppler Particle Analyser (PDPA) measurement technique [20] with the lower
measurability limit of 1 µm. The SMD measurements were performed at several locations
downstream in the axial direction covering a round measurement area of 1 mm in diameter. The
measured data are shown in Table 12. The microscopic spray characteristics that are discussed
in this section are the droplet number and volume distributions, where droplets smaller than
1 µm in diameter were not taken into account. In addition, next table shows the spray angle
measurement results, where the spray angle is defined as the droplet cloud spreading angle
recorded 2 ms after SOI at the axial distance of 70 % of liquid spray penetration.
Table 12 Measured spray characteristics for the examined nozzle designs
Bore
Length
[mm]
Bore
diameter
[mm]
Spray
angle
[°]
SMD
[µm]
Measuring
location
[mm]
Nr1 0.8 0.14 18.9 23.2 72
Nr2 0.8 0.1 18.9 21.9 62
Nr3 0.6 0.14 21.6 23.3 69
Nr4 1 0.14 16.8 23 73
For the numerical modelling of the spray processes, the cylindrical computational
domains with approximately 50000 hexahedron cells were generated, as shown in Figure 34.
Initially, the mesh was generated for modelling the fuel injection through the nozzle hole with
diameter 140 µm, and then it was scaled for the other nozzle diameters retaining the same cell
distribution in both the axial and radial directions. The computational meshes were refined
towards the nozzle hole in the radial and in the axial direction to better capture the processes
occurring in the injector vicinity.
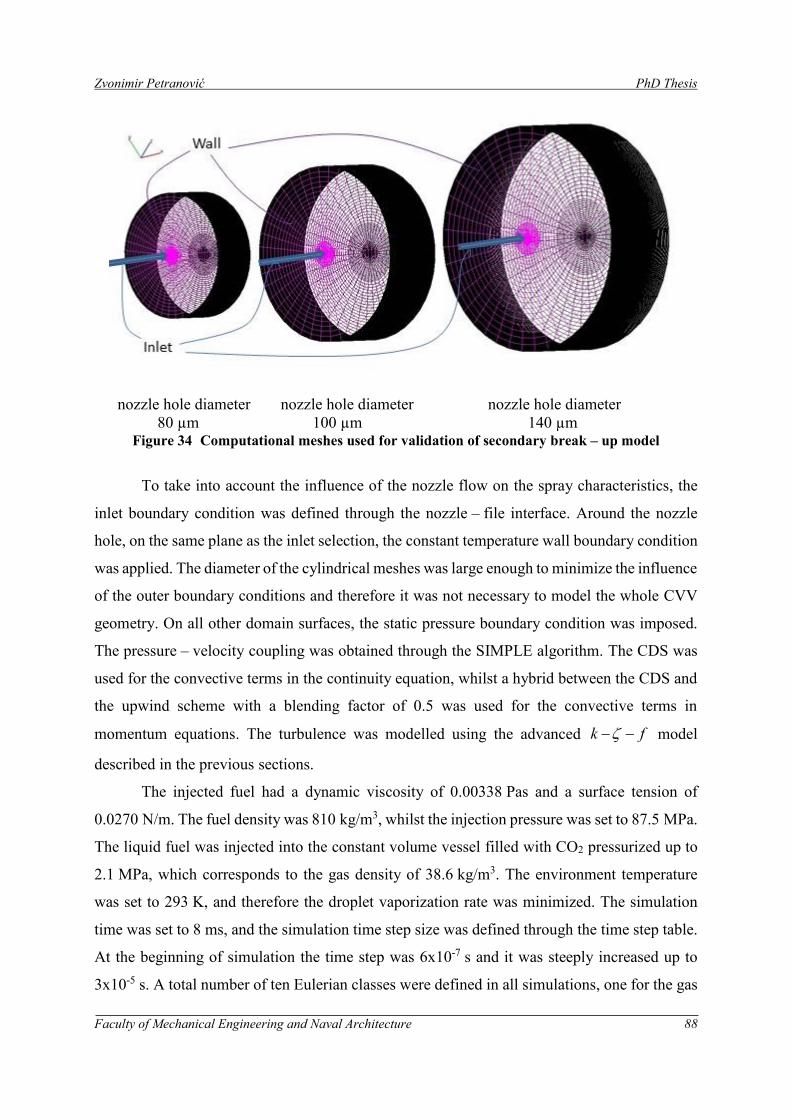
Zvonimir Petranović PhD Thesis
Faculty of Mechanical Engineering and Naval Architecture 88
nozzle hole diameter
80 µm
nozzle hole diameter
100 µm
nozzle hole diameter
140 µm Figure 34 Computational meshes used for validation of secondary break – up model
To take into account the influence of the nozzle flow on the spray characteristics, the
inlet boundary condition was defined through the nozzle – file interface. Around the nozzle
hole, on the same plane as the inlet selection, the constant temperature wall boundary condition
was applied. The diameter of the cylindrical meshes was large enough to minimize the influence
of the outer boundary conditions and therefore it was not necessary to model the whole CVV
geometry. On all other domain surfaces, the static pressure boundary condition was imposed.
The pressure – velocity coupling was obtained through the SIMPLE algorithm. The CDS was
used for the convective terms in the continuity equation, whilst a hybrid between the CDS and
the upwind scheme with a blending factor of 0.5 was used for the convective terms in
momentum equations. The turbulence was modelled using the advanced k f model
described in the previous sections.
The injected fuel had a dynamic viscosity of 0.00338 Pas and a surface tension of
0.0270 N/m. The fuel density was 810 kg/m3, whilst the injection pressure was set to 87.5 MPa.
The liquid fuel was injected into the constant volume vessel filled with CO2 pressurized up to
2.1 MPa, which corresponds to the gas density of 38.6 kg/m3. The environment temperature
was set to 293 K, and therefore the droplet vaporization rate was minimized. The simulation
time was set to 8 ms, and the simulation time step size was defined through the time step table.
At the beginning of simulation the time step was 6x10⁻⁷ s and it was steeply increased up to
3x10⁻⁵ s. A total number of ten Eulerian classes were defined in all simulations, one for the gas
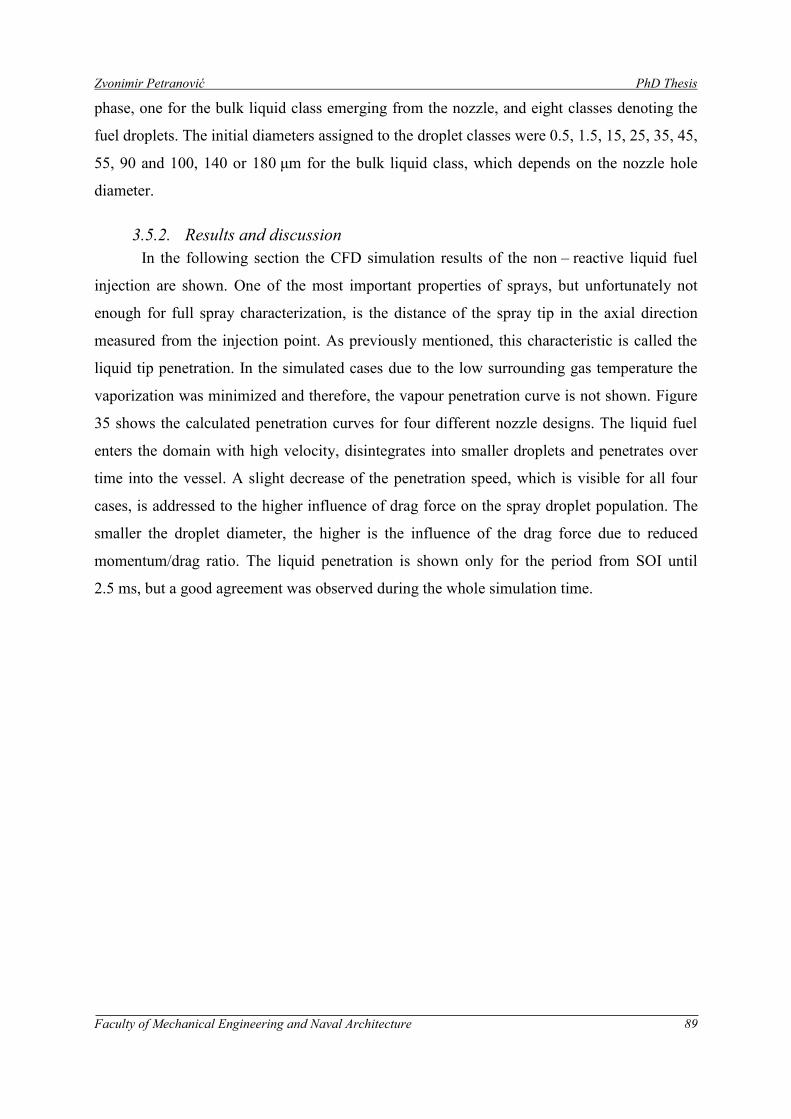
Zvonimir Petranović PhD Thesis
Faculty of Mechanical Engineering and Naval Architecture 89
phase, one for the bulk liquid class emerging from the nozzle, and eight classes denoting the
fuel droplets. The initial diameters assigned to the droplet classes were 0.5, 1.5, 15, 25, 35, 45,
55, 90 and 100, 140 or 180 μm for the bulk liquid class, which depends on the nozzle hole
diameter.
3.5.2. Results and discussion
In the following section the CFD simulation results of the non – reactive liquid fuel
injection are shown. One of the most important properties of sprays, but unfortunately not
enough for full spray characterization, is the distance of the spray tip in the axial direction
measured from the injection point. As previously mentioned, this characteristic is called the
liquid tip penetration. In the simulated cases due to the low surrounding gas temperature the
vaporization was minimized and therefore, the vapour penetration curve is not shown. Figure
35 shows the calculated penetration curves for four different nozzle designs. The liquid fuel
enters the domain with high velocity, disintegrates into smaller droplets and penetrates over
time into the vessel. A slight decrease of the penetration speed, which is visible for all four
cases, is addressed to the higher influence of drag force on the spray droplet population. The
smaller the droplet diameter, the higher is the influence of the drag force due to reduced
momentum/drag ratio. The liquid penetration is shown only for the period from SOI until
2.5 ms, but a good agreement was observed during the whole simulation time.
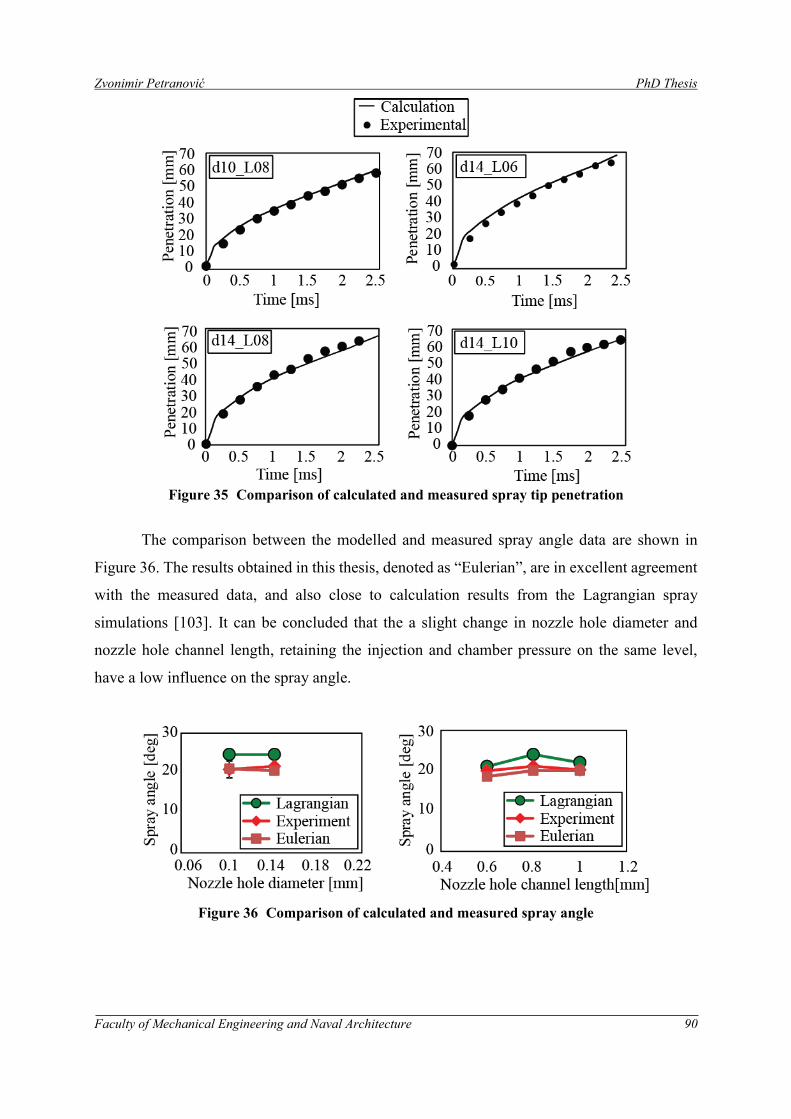
Zvonimir Petranović PhD Thesis
Faculty of Mechanical Engineering and Naval Architecture 90
Figure 35 Comparison of calculated and measured spray tip penetration
The comparison between the modelled and measured spray angle data are shown in
Figure 36. The results obtained in this thesis, denoted as “Eulerian”, are in excellent agreement
with the measured data, and also close to calculation results from the Lagrangian spray
simulations [103]. It can be concluded that the a slight change in nozzle hole diameter and
nozzle hole channel length, retaining the injection and chamber pressure on the same level,
have a low influence on the spray angle.
Figure 36 Comparison of calculated and measured spray angle
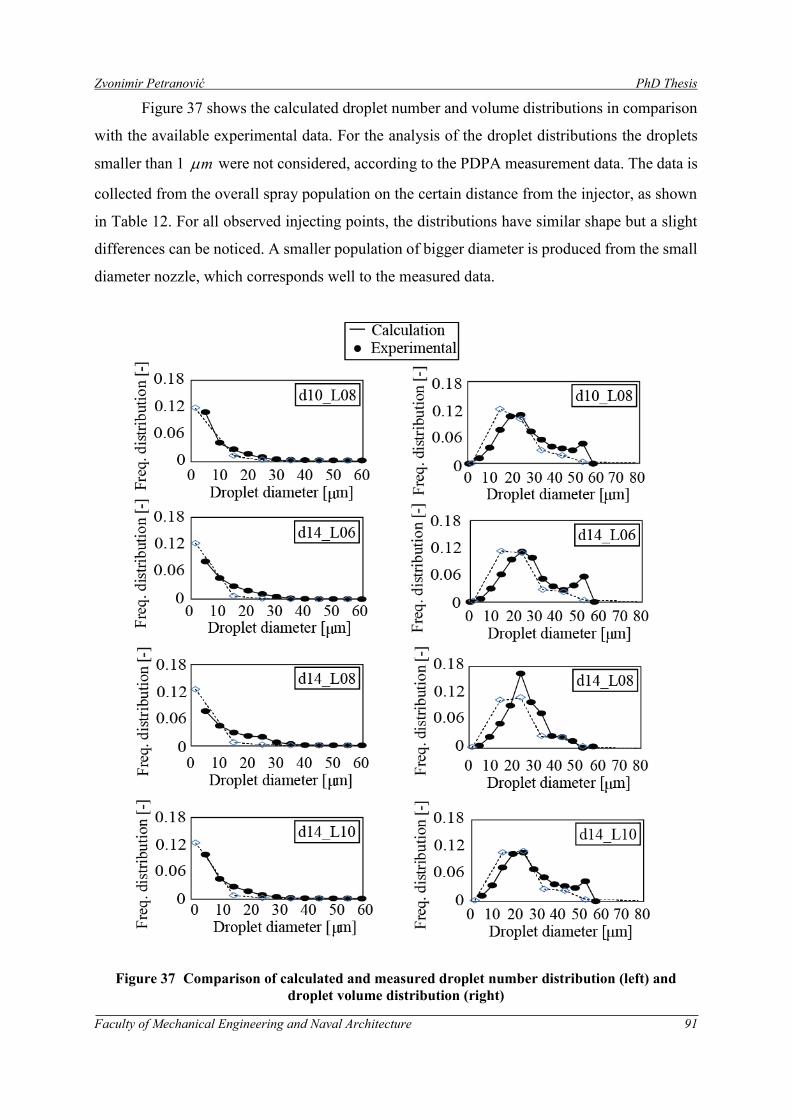
Zvonimir Petranović PhD Thesis
Faculty of Mechanical Engineering and Naval Architecture 91
Figure 37 shows the calculated droplet number and volume distributions in comparison
with the available experimental data. For the analysis of the droplet distributions the droplets
smaller than 1 m were not considered, according to the PDPA measurement data. The data is
collected from the overall spray population on the certain distance from the injector, as shown
in Table 12. For all observed injecting points, the distributions have similar shape but a slight
differences can be noticed. A smaller population of bigger diameter is produced from the small
diameter nozzle, which corresponds well to the measured data.
Figure 37 Comparison of calculated and measured droplet number distribution (left) and
droplet volume distribution (right)
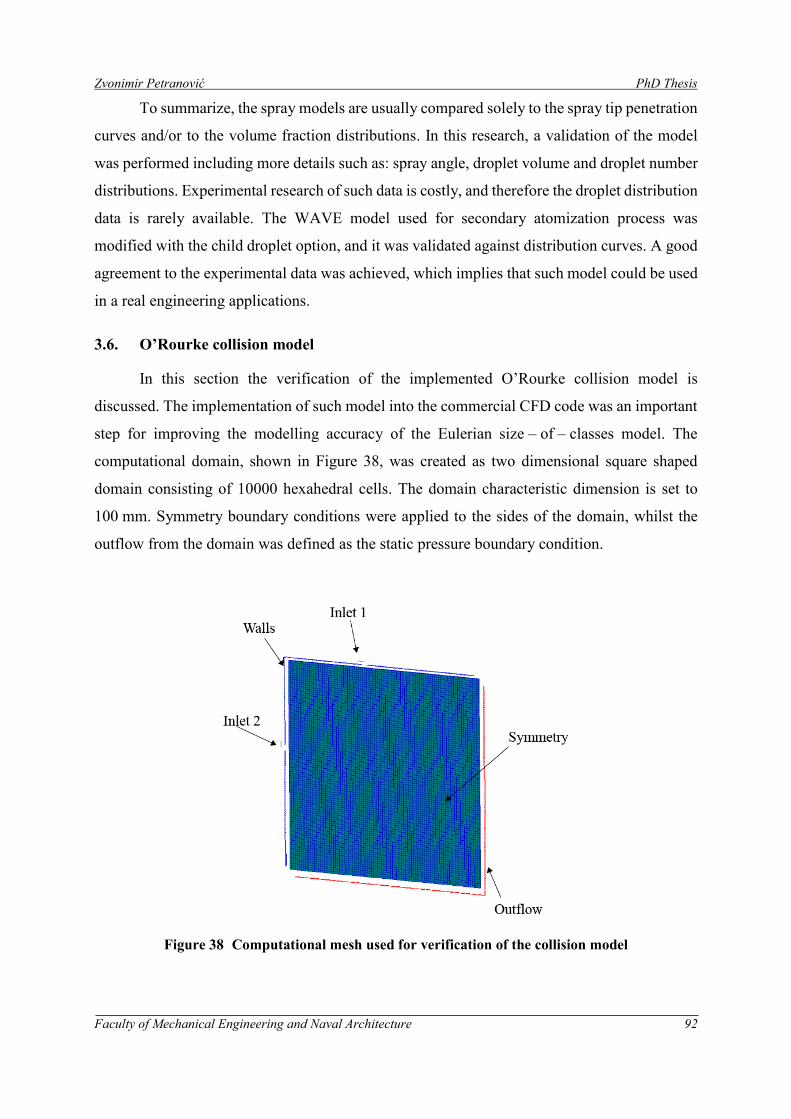
Zvonimir Petranović PhD Thesis
Faculty of Mechanical Engineering and Naval Architecture 92
To summarize, the spray models are usually compared solely to the spray tip penetration
curves and/or to the volume fraction distributions. In this research, a validation of the model
was performed including more details such as: spray angle, droplet volume and droplet number
distributions. Experimental research of such data is costly, and therefore the droplet distribution
data is rarely available. The WAVE model used for secondary atomization process was
modified with the child droplet option, and it was validated against distribution curves. A good
agreement to the experimental data was achieved, which implies that such model could be used
in a real engineering applications.
3.6. O’Rourke collision model
In this section the verification of the implemented O’Rourke collision model is
discussed. The implementation of such model into the commercial CFD code was an important
step for improving the modelling accuracy of the Eulerian size – of – classes model. The
computational domain, shown in Figure 38, was created as two dimensional square shaped
domain consisting of 10000 hexahedral cells. The domain characteristic dimension is set to
100 mm. Symmetry boundary conditions were applied to the sides of the domain, whilst the
outflow from the domain was defined as the static pressure boundary condition.
Figure 38 Computational mesh used for verification of the collision model
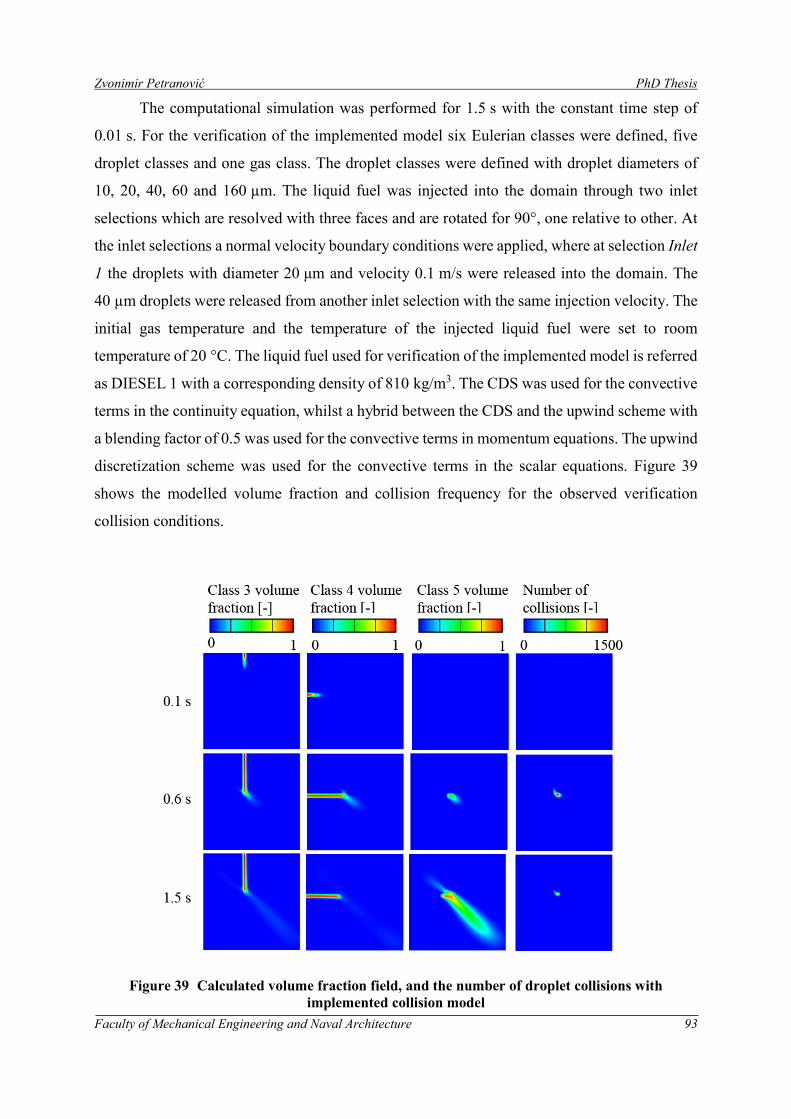
Zvonimir Petranović PhD Thesis
Faculty of Mechanical Engineering and Naval Architecture 93
The computational simulation was performed for 1.5 s with the constant time step of
0.01 s. For the verification of the implemented model six Eulerian classes were defined, five
droplet classes and one gas class. The droplet classes were defined with droplet diameters of
10, 20, 40, 60 and 160 µm. The liquid fuel was injected into the domain through two inlet
selections which are resolved with three faces and are rotated for 90°, one relative to other. At
the inlet selections a normal velocity boundary conditions were applied, where at selection Inlet
1 the droplets with diameter 20 μm and velocity 0.1 m/s were released into the domain. The
40 µm droplets were released from another inlet selection with the same injection velocity. The
initial gas temperature and the temperature of the injected liquid fuel were set to room
temperature of 20 °C. The liquid fuel used for verification of the implemented model is referred
as DIESEL 1 with a corresponding density of 810 kg/m3. The CDS was used for the convective
terms in the continuity equation, whilst a hybrid between the CDS and the upwind scheme with
a blending factor of 0.5 was used for the convective terms in momentum equations. The upwind
discretization scheme was used for the convective terms in the scalar equations. Figure 39
shows the modelled volume fraction and collision frequency for the observed verification
collision conditions.
Figure 39 Calculated volume fraction field, and the number of droplet collisions with
implemented collision model
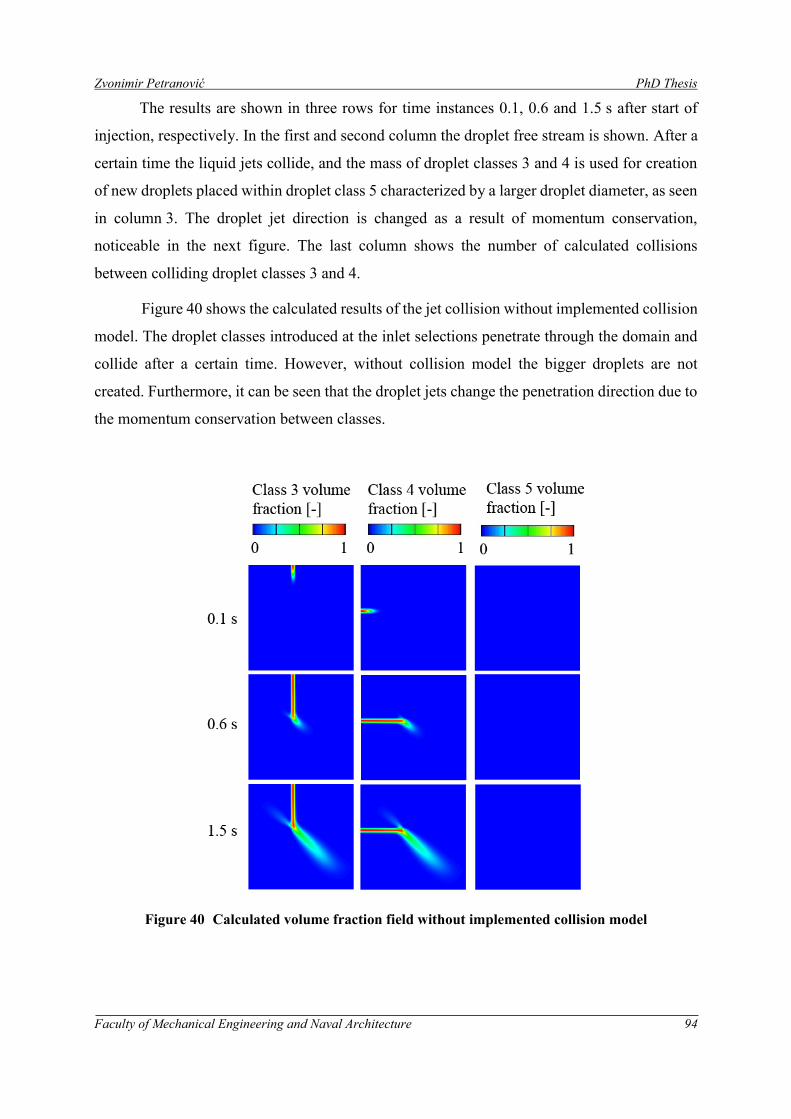
Zvonimir Petranović PhD Thesis
Faculty of Mechanical Engineering and Naval Architecture 94
The results are shown in three rows for time instances 0.1, 0.6 and 1.5 s after start of
injection, respectively. In the first and second column the droplet free stream is shown. After a
certain time the liquid jets collide, and the mass of droplet classes 3 and 4 is used for creation
of new droplets placed within droplet class 5 characterized by a larger droplet diameter, as seen
in column 3. The droplet jet direction is changed as a result of momentum conservation,
noticeable in the next figure. The last column shows the number of calculated collisions
between colliding droplet classes 3 and 4.
Figure 40 shows the calculated results of the jet collision without implemented collision
model. The droplet classes introduced at the inlet selections penetrate through the domain and
collide after a certain time. However, without collision model the bigger droplets are not
created. Furthermore, it can be seen that the droplet jets change the penetration direction due to
the momentum conservation between classes.
Figure 40 Calculated volume fraction field without implemented collision model
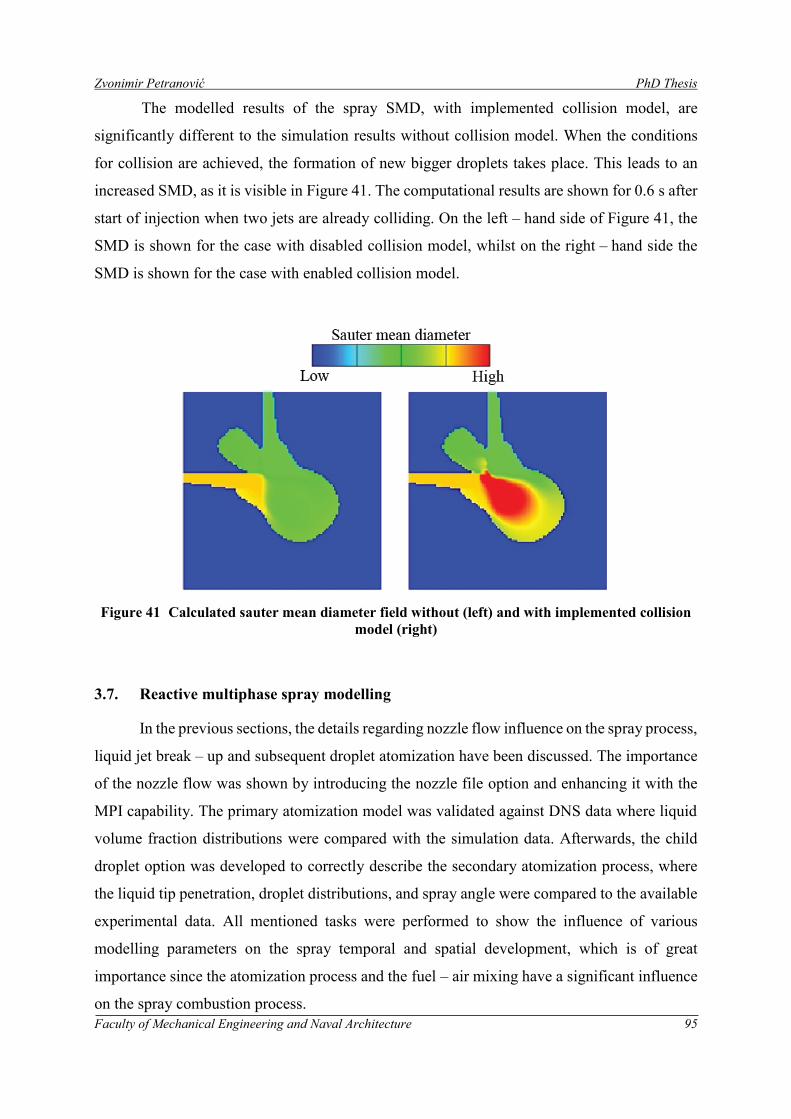
Zvonimir Petranović PhD Thesis
Faculty of Mechanical Engineering and Naval Architecture 95
The modelled results of the spray SMD, with implemented collision model, are
significantly different to the simulation results without collision model. When the conditions
for collision are achieved, the formation of new bigger droplets takes place. This leads to an
increased SMD, as it is visible in Figure 41. The computational results are shown for 0.6 s after
start of injection when two jets are already colliding. On the left – hand side of Figure 41, the
SMD is shown for the case with disabled collision model, whilst on the right – hand side the
SMD is shown for the case with enabled collision model.
Figure 41 Calculated sauter mean diameter field without (left) and with implemented collision
model (right)
3.7. Reactive multiphase spray modelling
In the previous sections, the details regarding nozzle flow influence on the spray process,
liquid jet break – up and subsequent droplet atomization have been discussed. The importance
of the nozzle flow was shown by introducing the nozzle file option and enhancing it with the
MPI capability. The primary atomization model was validated against DNS data where liquid
volume fraction distributions were compared with the simulation data. Afterwards, the child
droplet option was developed to correctly describe the secondary atomization process, where
the liquid tip penetration, droplet distributions, and spray angle were compared to the available
experimental data. All mentioned tasks were performed to show the influence of various
modelling parameters on the spray temporal and spatial development, which is of great
importance since the atomization process and the fuel – air mixing have a significant influence
on the spray combustion process.
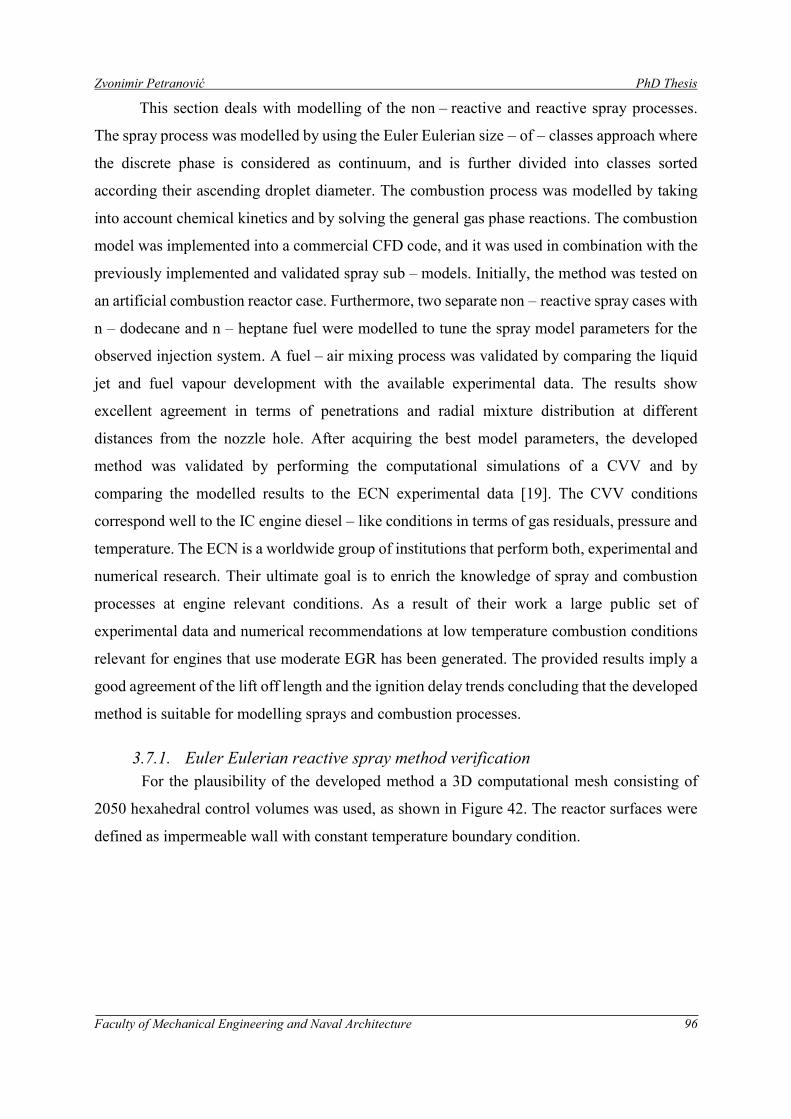
Zvonimir Petranović PhD Thesis
Faculty of Mechanical Engineering and Naval Architecture 96
This section deals with modelling of the non – reactive and reactive spray processes.
The spray process was modelled by using the Euler Eulerian size – of – classes approach where
the discrete phase is considered as continuum, and is further divided into classes sorted
according their ascending droplet diameter. The combustion process was modelled by taking
into account chemical kinetics and by solving the general gas phase reactions. The combustion
model was implemented into a commercial CFD code, and it was used in combination with the
previously implemented and validated spray sub – models. Initially, the method was tested on
an artificial combustion reactor case. Furthermore, two separate non – reactive spray cases with
n – dodecane and n – heptane fuel were modelled to tune the spray model parameters for the
observed injection system. A fuel – air mixing process was validated by comparing the liquid
jet and fuel vapour development with the available experimental data. The results show
excellent agreement in terms of penetrations and radial mixture distribution at different
distances from the nozzle hole. After acquiring the best model parameters, the developed
method was validated by performing the computational simulations of a CVV and by
comparing the modelled results to the ECN experimental data [19]. The CVV conditions
correspond well to the IC engine diesel – like conditions in terms of gas residuals, pressure and
temperature. The ECN is a worldwide group of institutions that perform both, experimental and
numerical research. Their ultimate goal is to enrich the knowledge of spray and combustion
processes at engine relevant conditions. As a result of their work a large public set of
experimental data and numerical recommendations at low temperature combustion conditions
relevant for engines that use moderate EGR has been generated. The provided results imply a
good agreement of the lift off length and the ignition delay trends concluding that the developed
method is suitable for modelling sprays and combustion processes.
3.7.1. Euler Eulerian reactive spray method verification
For the plausibility of the developed method a 3D computational mesh consisting of
2050 hexahedral control volumes was used, as shown in Figure 42. The reactor surfaces were
defined as impermeable wall with constant temperature boundary condition.
Zvonimir Petranović PhD Thesis
Faculty of Mechanical Engineering and Naval Architecture 97
Figure 42 Computational mesh used for verification of the Euler Eulerian reactive spray
method
The domain interior was filled with a gas mixture (99.95 % vol.) consisting of 24 % O2 and
76 % N2 (mass), whilst the rest of the volume was occupied by n – heptane fuel in liquid form.
The initial gas temperature and pressure conditions were set to 1200 K and 2 MPa respectively,
the fuel temperature was initialised with 323 K, and a quiescent environment was assumed. For
the plausibility tests three Eulerian classes were defined, one for the gas phase and two droplet
classes with diameters equal to 10 and 20 µm. The Abramzon – Sirignano evaporation model
was used to model the droplet evaporation process. It should be mentioned that the exact
evaporation rate, species concentration or temperature values were not of primary interest in
this section of research. Instead, the overall system behaviour was observed. The CDS scheme
was used for the continuity equations, while a combination of CDS and UDS scheme with
blending factor 0.5 was used for the momentum equation. The UDS was also applied for
turbulence, volume fraction and energy transport equations. The turbulence was modelled by
the standard k turbulence model and the convergence criterion was achieved when the
normalized residuals for momentum, pressure, energy and volume fraction reached values
lower than 10-4. The pressure – velocity coupling was obtained by using the SIMPLE algorithm
and the simulation time step was set to 10-5 s.
The fuel droplets placed within the reactor are enforced to evaporate due to the elevated
temperature conditions. The concentration of fuel vapour arises according to the evaporation
model, and the reactor mean temperature decreases, as seen in Figure 43.
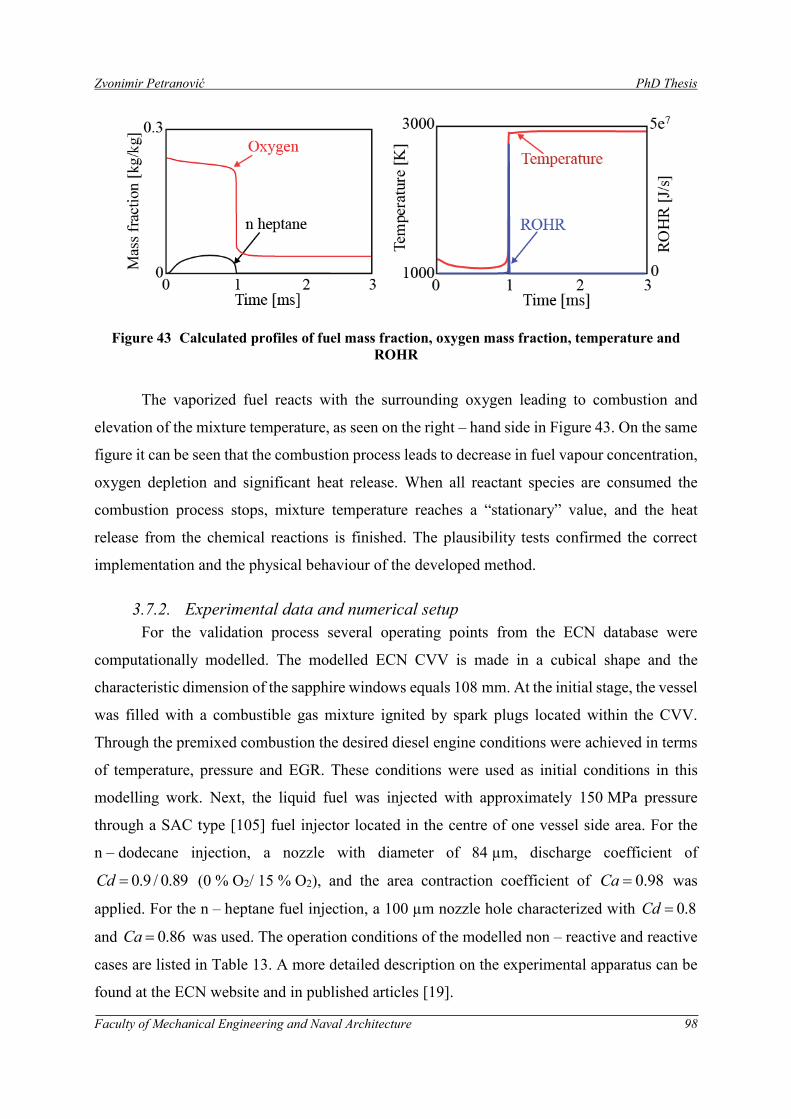
Zvonimir Petranović PhD Thesis
Faculty of Mechanical Engineering and Naval Architecture 98
Figure 43 Calculated profiles of fuel mass fraction, oxygen mass fraction, temperature and
ROHR
The vaporized fuel reacts with the surrounding oxygen leading to combustion and
elevation of the mixture temperature, as seen on the right – hand side in Figure 43. On the same
figure it can be seen that the combustion process leads to decrease in fuel vapour concentration,
oxygen depletion and significant heat release. When all reactant species are consumed the
combustion process stops, mixture temperature reaches a “stationary” value, and the heat
release from the chemical reactions is finished. The plausibility tests confirmed the correct
implementation and the physical behaviour of the developed method.
3.7.2. Experimental data and numerical setup
For the validation process several operating points from the ECN database were
computationally modelled. The modelled ECN CVV is made in a cubical shape and the
characteristic dimension of the sapphire windows equals 108 mm. At the initial stage, the vessel
was filled with a combustible gas mixture ignited by spark plugs located within the CVV.
Through the premixed combustion the desired diesel engine conditions were achieved in terms
of temperature, pressure and EGR. These conditions were used as initial conditions in this
modelling work. Next, the liquid fuel was injected with approximately 150 MPa pressure
through a SAC type [105] fuel injector located in the centre of one vessel side area. For the
n – dodecane injection, a nozzle with diameter of 84 µm, discharge coefficient of
0.9 / 0.89Cd (0 % O2/ 15 % O2), and the area contraction coefficient of 0.98Ca was
applied. For the n – heptane fuel injection, a 100 µm nozzle hole characterized with 0.8Cd
and 0.86Ca was used. The operation conditions of the modelled non – reactive and reactive
cases are listed in Table 13. A more detailed description on the experimental apparatus can be
found at the ECN website and in published articles [19].
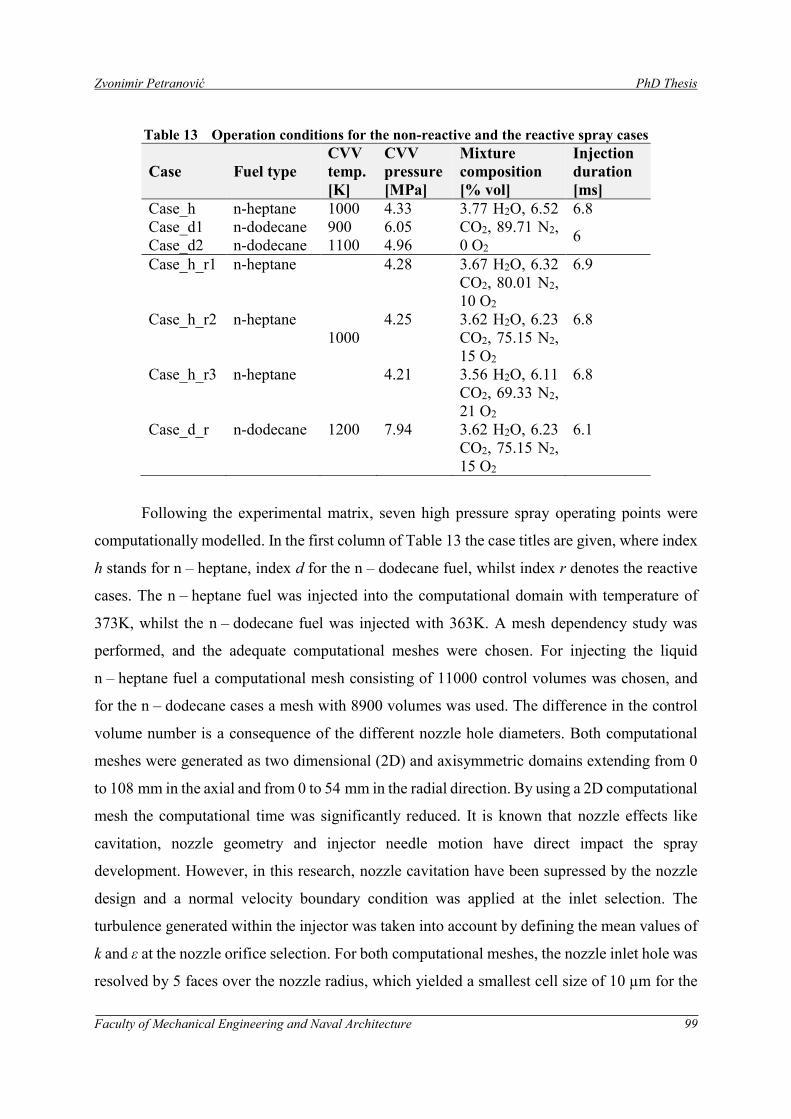
Zvonimir Petranović PhD Thesis
Faculty of Mechanical Engineering and Naval Architecture 99
Table 13 Operation conditions for the non-reactive and the reactive spray cases
Case Fuel type
CVV
temp.
[K]
CVV
pressure
[MPa]
Mixture
composition
[% vol]
Injection
duration
[ms]
Case_h n-heptane 1000 4.33 3.77 H2O, 6.52
CO2, 89.71 N2,
0 O2
6.8
Case_d1 n-dodecane 900 6.05 6
Case_d2 n-dodecane 1100 4.96
Case_h_r1 n-heptane
1000
4.28 3.67 H2O, 6.32
CO2, 80.01 N2,
10 O2
6.9
Case_h_r2 n-heptane 4.25 3.62 H2O, 6.23
CO2, 75.15 N2,
15 O2
6.8
Case_h_r3 n-heptane 4.21 3.56 H2O, 6.11
CO2, 69.33 N2,
21 O2
6.8
Case_d_r n-dodecane 1200 7.94 3.62 H2O, 6.23
CO2, 75.15 N2,
15 O2
6.1
Following the experimental matrix, seven high pressure spray operating points were
computationally modelled. In the first column of Table 13 the case titles are given, where index
h stands for n – heptane, index d for the n – dodecane fuel, whilst index r denotes the reactive
cases. The n – heptane fuel was injected into the computational domain with temperature of
373K, whilst the n – dodecane fuel was injected with 363K. A mesh dependency study was
performed, and the adequate computational meshes were chosen. For injecting the liquid
n – heptane fuel a computational mesh consisting of 11000 control volumes was chosen, and
for the n – dodecane cases a mesh with 8900 volumes was used. The difference in the control
volume number is a consequence of the different nozzle hole diameters. Both computational
meshes were generated as two dimensional (2D) and axisymmetric domains extending from 0
to 108 mm in the axial and from 0 to 54 mm in the radial direction. By using a 2D computational
mesh the computational time was significantly reduced. It is known that nozzle effects like
cavitation, nozzle geometry and injector needle motion have direct impact the spray
development. However, in this research, nozzle cavitation have been supressed by the nozzle
design and a normal velocity boundary condition was applied at the inlet selection. The
turbulence generated within the injector was taken into account by defining the mean values of
k and ε at the nozzle orifice selection. For both computational meshes, the nozzle inlet hole was
resolved by 5 faces over the nozzle radius, which yielded a smallest cell size of 10 µm for the
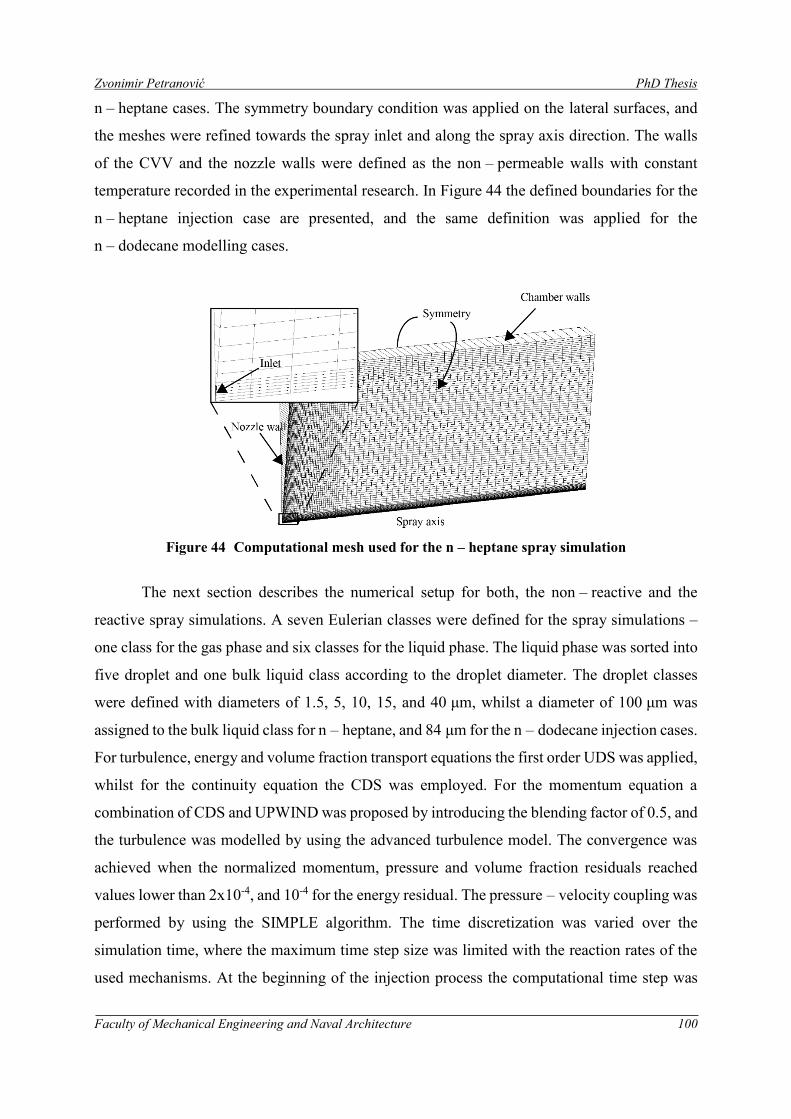
Zvonimir Petranović PhD Thesis
Faculty of Mechanical Engineering and Naval Architecture 100
n – heptane cases. The symmetry boundary condition was applied on the lateral surfaces, and
the meshes were refined towards the spray inlet and along the spray axis direction. The walls
of the CVV and the nozzle walls were defined as the non – permeable walls with constant
temperature recorded in the experimental research. In Figure 44 the defined boundaries for the
n – heptane injection case are presented, and the same definition was applied for the
n – dodecane modelling cases.
Figure 44 Computational mesh used for the n – heptane spray simulation
The next section describes the numerical setup for both, the non – reactive and the
reactive spray simulations. A seven Eulerian classes were defined for the spray simulations –
one class for the gas phase and six classes for the liquid phase. The liquid phase was sorted into
five droplet and one bulk liquid class according to the droplet diameter. The droplet classes
were defined with diameters of 1.5, 5, 10, 15, and 40 μm, whilst a diameter of 100 μm was
assigned to the bulk liquid class for n – heptane, and 84 μm for the n – dodecane injection cases.
For turbulence, energy and volume fraction transport equations the first order UDS was applied,
whilst for the continuity equation the CDS was employed. For the momentum equation a
combination of CDS and UPWIND was proposed by introducing the blending factor of 0.5, and
the turbulence was modelled by using the advanced turbulence model. The convergence was
achieved when the normalized momentum, pressure and volume fraction residuals reached
values lower than 2x10⁻⁴, and 10-4 for the energy residual. The pressure – velocity coupling was
performed by using the SIMPLE algorithm. The time discretization was varied over the
simulation time, where the maximum time step size was limited with the reaction rates of the
used mechanisms. At the beginning of the injection process the computational time step was
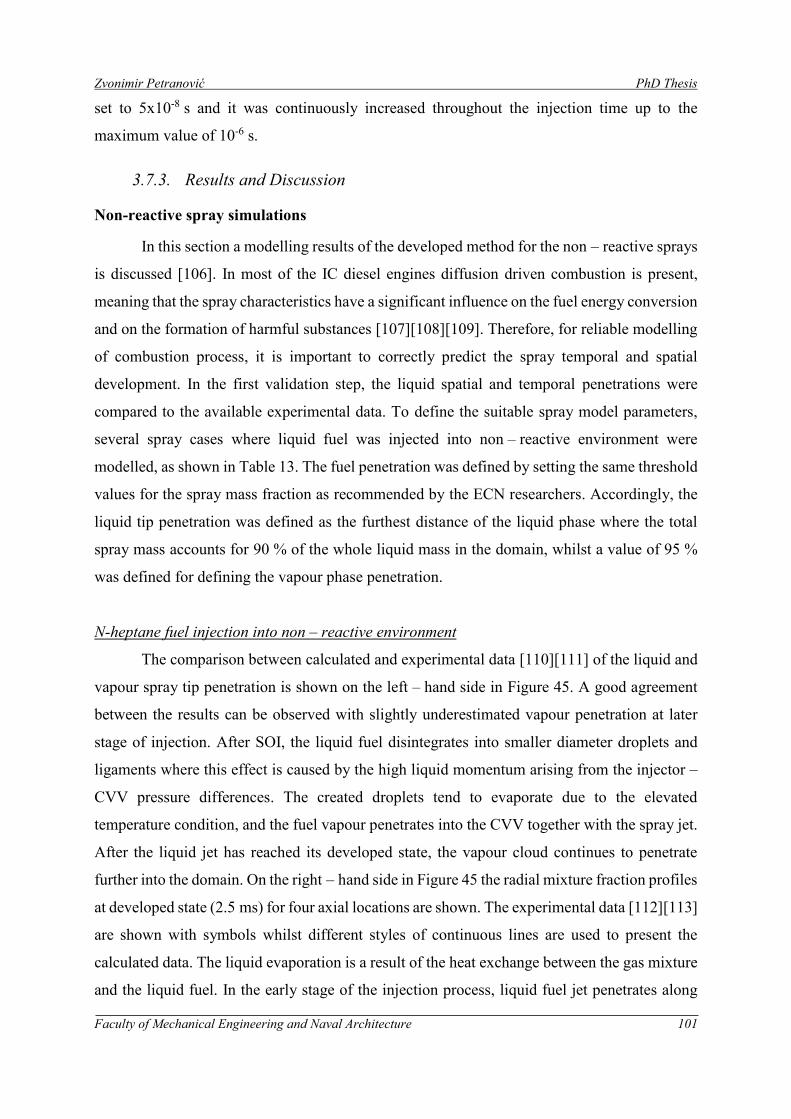
Zvonimir Petranović PhD Thesis
Faculty of Mechanical Engineering and Naval Architecture 101
set to 5x10⁻⁸ s and it was continuously increased throughout the injection time up to the
maximum value of 10-6 s.
3.7.3. Results and Discussion
Non-reactive spray simulations
In this section a modelling results of the developed method for the non – reactive sprays
is discussed [106]. In most of the IC diesel engines diffusion driven combustion is present,
meaning that the spray characteristics have a significant influence on the fuel energy conversion
and on the formation of harmful substances [107][108][109]. Therefore, for reliable modelling
of combustion process, it is important to correctly predict the spray temporal and spatial
development. In the first validation step, the liquid spatial and temporal penetrations were
compared to the available experimental data. To define the suitable spray model parameters,
several spray cases where liquid fuel was injected into non – reactive environment were
modelled, as shown in Table 13. The fuel penetration was defined by setting the same threshold
values for the spray mass fraction as recommended by the ECN researchers. Accordingly, the
liquid tip penetration was defined as the furthest distance of the liquid phase where the total
spray mass accounts for 90 % of the whole liquid mass in the domain, whilst a value of 95 %
was defined for defining the vapour phase penetration.
N-heptane fuel injection into non – reactive environment
The comparison between calculated and experimental data [110][111] of the liquid and
vapour spray tip penetration is shown on the left – hand side in Figure 45. A good agreement
between the results can be observed with slightly underestimated vapour penetration at later
stage of injection. After SOI, the liquid fuel disintegrates into smaller diameter droplets and
ligaments where this effect is caused by the high liquid momentum arising from the injector –
CVV pressure differences. The created droplets tend to evaporate due to the elevated
temperature condition, and the fuel vapour penetrates into the CVV together with the spray jet.
After the liquid jet has reached its developed state, the vapour cloud continues to penetrate
further into the domain. On the right – hand side in Figure 45 the radial mixture fraction profiles
at developed state (2.5 ms) for four axial locations are shown. The experimental data [112][113]
are shown with symbols whilst different styles of continuous lines are used to present the
calculated data. The liquid evaporation is a result of the heat exchange between the gas mixture
and the liquid fuel. In the early stage of the injection process, liquid fuel jet penetrates along
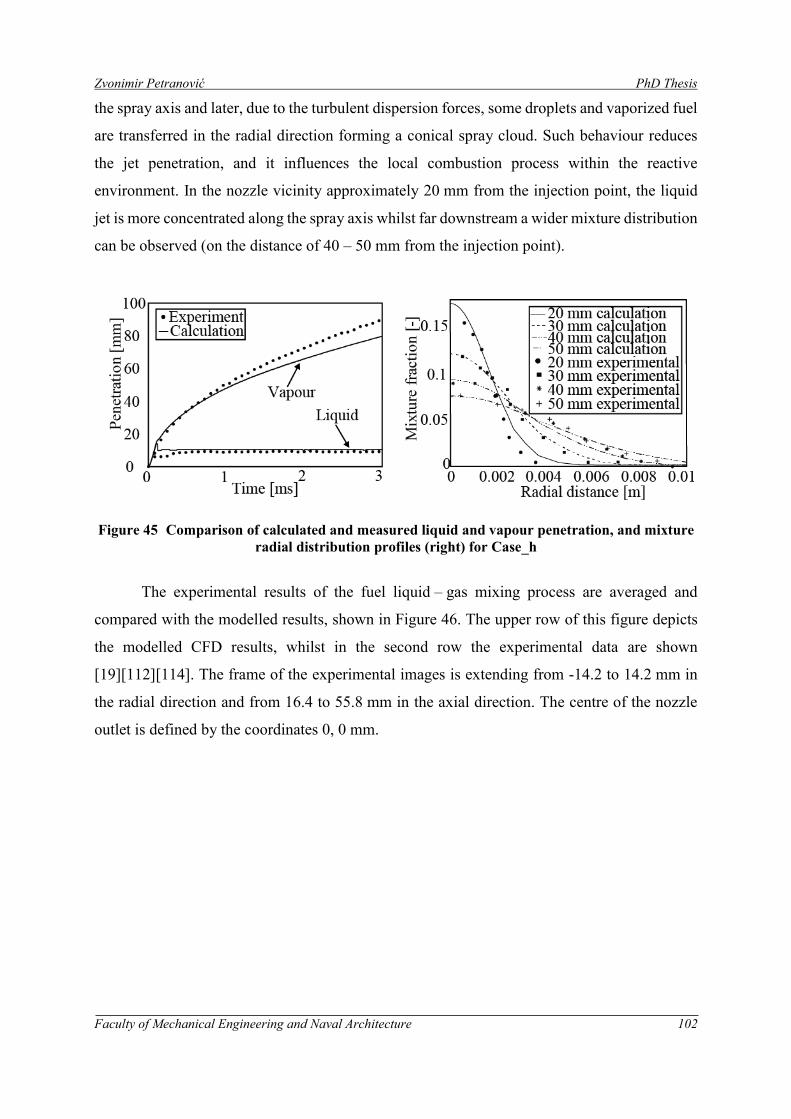
Zvonimir Petranović PhD Thesis
Faculty of Mechanical Engineering and Naval Architecture 102
the spray axis and later, due to the turbulent dispersion forces, some droplets and vaporized fuel
are transferred in the radial direction forming a conical spray cloud. Such behaviour reduces
the jet penetration, and it influences the local combustion process within the reactive
environment. In the nozzle vicinity approximately 20 mm from the injection point, the liquid
jet is more concentrated along the spray axis whilst far downstream a wider mixture distribution
can be observed (on the distance of 40 – 50 mm from the injection point).
Figure 45 Comparison of calculated and measured liquid and vapour penetration, and mixture
radial distribution profiles (right) for Case_h
The experimental results of the fuel liquid – gas mixing process are averaged and
compared with the modelled results, shown in Figure 46. The upper row of this figure depicts
the modelled CFD results, whilst in the second row the experimental data are shown
[19][112][114]. The frame of the experimental images is extending from -14.2 to 14.2 mm in
the radial direction and from 16.4 to 55.8 mm in the axial direction. The centre of the nozzle
outlet is defined by the coordinates 0, 0 mm.
Zvonimir Petranović PhD Thesis
Faculty of Mechanical Engineering and Naval Architecture 103
Figure 46 Comparison of calculated and measured mixture field for Case_h
The calculated vapour cloud is in a good agreement with the experimental data at early
stage of injection, as it is visible in the first column in Figure 46. In the later stage, a slight
underestimation of vapour penetration is noticeable, both at 0.9 ms and 1.1 ms after SOI. Such
behaviour corresponds well to the results shown on the left – hand side in Figure 45. The
slightly under – predicted vapour penetration may be addressed to too intensive break – up of
the liquid core and the droplets which result from the used break – up model constants. In the
same figure, the conically shaped vapour cloud is visible, which is a result of turbulent
dispersion forces acting on fuel droplets providing the momentum in the radial direction.
The averaged temperature fields for different time steps are shown in Figure 47. The
temperature is shown for the range from 700 K – 1000 K, which corresponds to the available
experimental data. The lowest temperature, caused by the temperature of the injected fuel, is
noticeable in the region near the injection axis, whilst higher temperatures are visible at the
periphery of the spray cloud. An increase of the vapour temperature is noticeable at later stages
of injection due to the higher amount of heat transferred from the surrounding mixture. It is
important to mention that the experimental images of gas mixture are recorded from the lateral
position, and therefore they represent the whole spray surface, whilst the simulation results are
shown for the planar cut in the middle of the spray cloud.
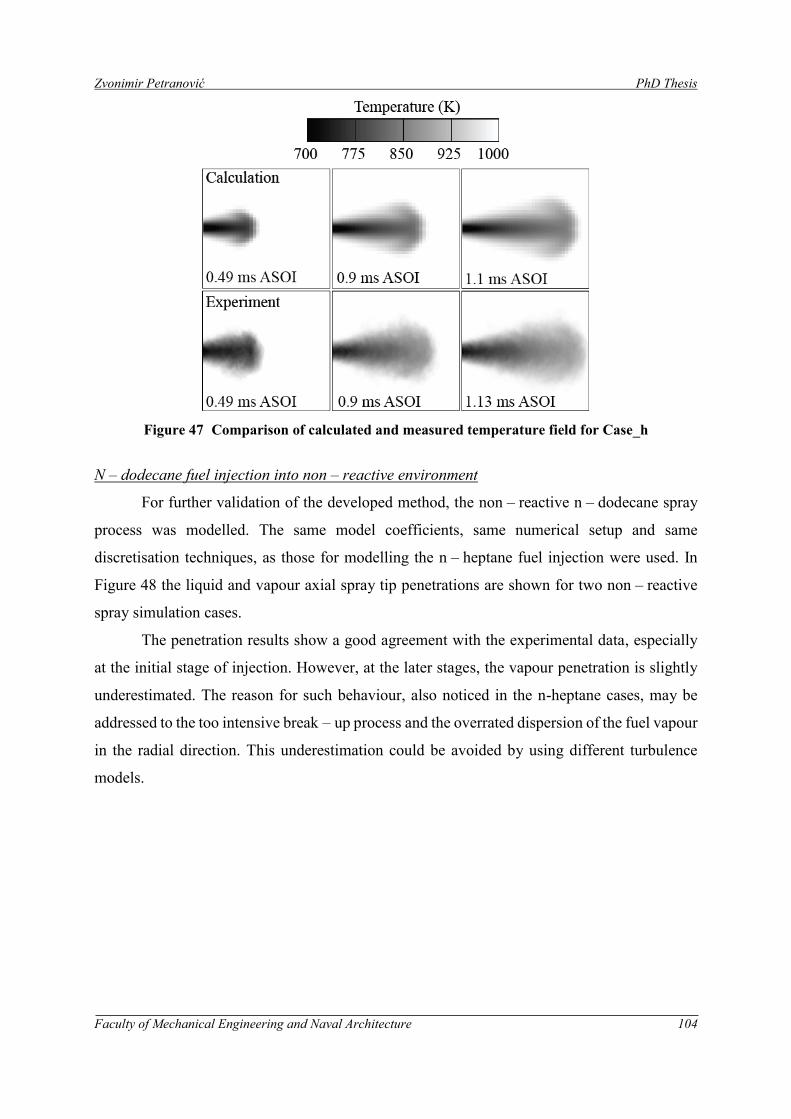
Zvonimir Petranović PhD Thesis
Faculty of Mechanical Engineering and Naval Architecture 104
Figure 47 Comparison of calculated and measured temperature field for Case_h
N – dodecane fuel injection into non – reactive environment
For further validation of the developed method, the non – reactive n – dodecane spray
process was modelled. The same model coefficients, same numerical setup and same
discretisation techniques, as those for modelling the n – heptane fuel injection were used. In
Figure 48 the liquid and vapour axial spray tip penetrations are shown for two non – reactive
spray simulation cases.
The penetration results show a good agreement with the experimental data, especially
at the initial stage of injection. However, at the later stages, the vapour penetration is slightly
underestimated. The reason for such behaviour, also noticed in the n-heptane cases, may be
addressed to the too intensive break – up process and the overrated dispersion of the fuel vapour
in the radial direction. This underestimation could be avoided by using different turbulence
models.
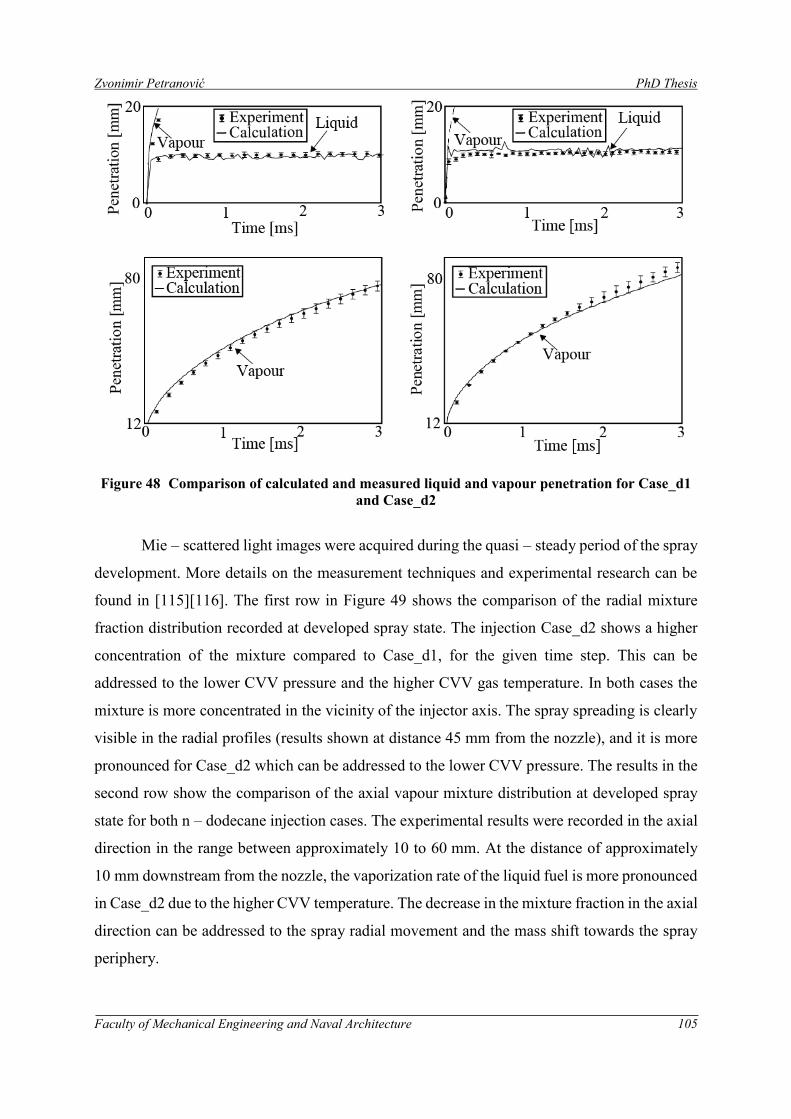
Zvonimir Petranović PhD Thesis
Faculty of Mechanical Engineering and Naval Architecture 105
Figure 48 Comparison of calculated and measured liquid and vapour penetration for Case_d1
and Case_d2
Mie – scattered light images were acquired during the quasi – steady period of the spray
development. More details on the measurement techniques and experimental research can be
found in [115][116]. The first row in Figure 49 shows the comparison of the radial mixture
fraction distribution recorded at developed spray state. The injection Case_d2 shows a higher
concentration of the mixture compared to Case_d1, for the given time step. This can be
addressed to the lower CVV pressure and the higher CVV gas temperature. In both cases the
mixture is more concentrated in the vicinity of the injector axis. The spray spreading is clearly
visible in the radial profiles (results shown at distance 45 mm from the nozzle), and it is more
pronounced for Case_d2 which can be addressed to the lower CVV pressure. The results in the
second row show the comparison of the axial vapour mixture distribution at developed spray
state for both n – dodecane injection cases. The experimental results were recorded in the axial
direction in the range between approximately 10 to 60 mm. At the distance of approximately
10 mm downstream from the nozzle, the vaporization rate of the liquid fuel is more pronounced
in Case_d2 due to the higher CVV temperature. The decrease in the mixture fraction in the axial
direction can be addressed to the spray radial movement and the mass shift towards the spray
periphery.
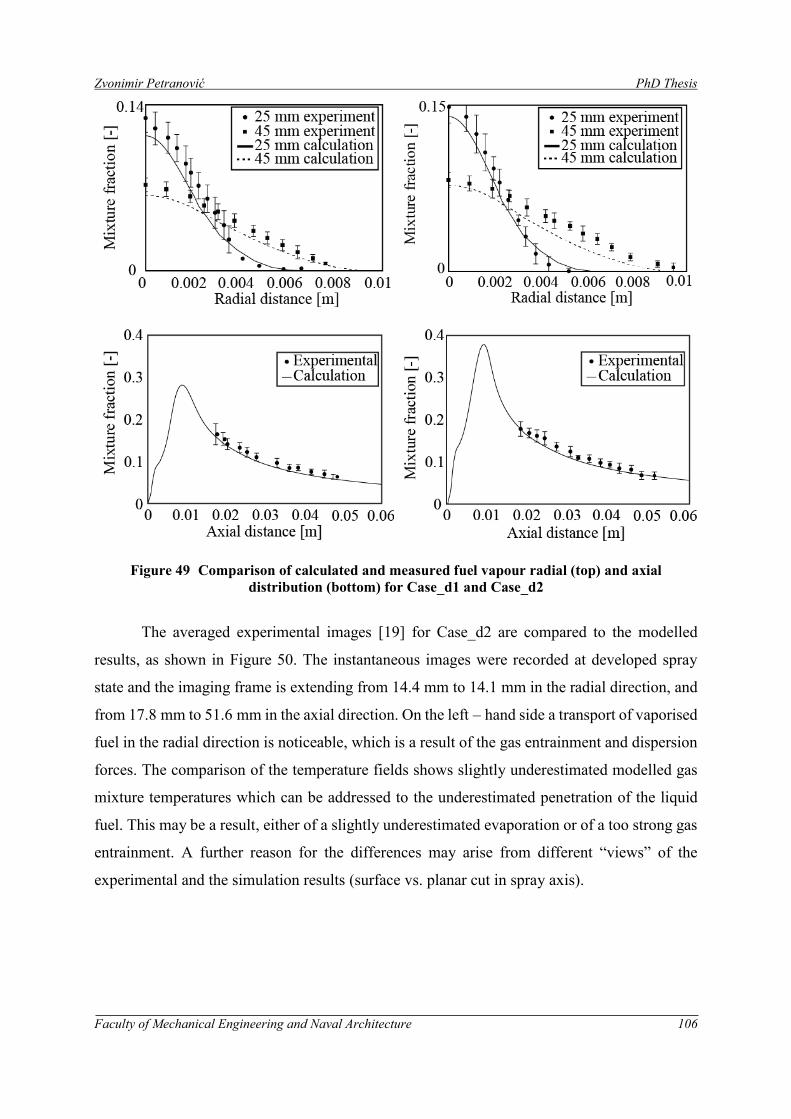
Zvonimir Petranović PhD Thesis
Faculty of Mechanical Engineering and Naval Architecture 106
Figure 49 Comparison of calculated and measured fuel vapour radial (top) and axial
distribution (bottom) for Case_d1 and Case_d2
The averaged experimental images [19] for Case_d2 are compared to the modelled
results, as shown in Figure 50. The instantaneous images were recorded at developed spray
state and the imaging frame is extending from 14.4 mm to 14.1 mm in the radial direction, and
from 17.8 mm to 51.6 mm in the axial direction. On the left – hand side a transport of vaporised
fuel in the radial direction is noticeable, which is a result of the gas entrainment and dispersion
forces. The comparison of the temperature fields shows slightly underestimated modelled gas
mixture temperatures which can be addressed to the underestimated penetration of the liquid
fuel. This may be a result, either of a slightly underestimated evaporation or of a too strong gas
entrainment. A further reason for the differences may arise from different “views” of the
experimental and the simulation results (surface vs. planar cut in spray axis).
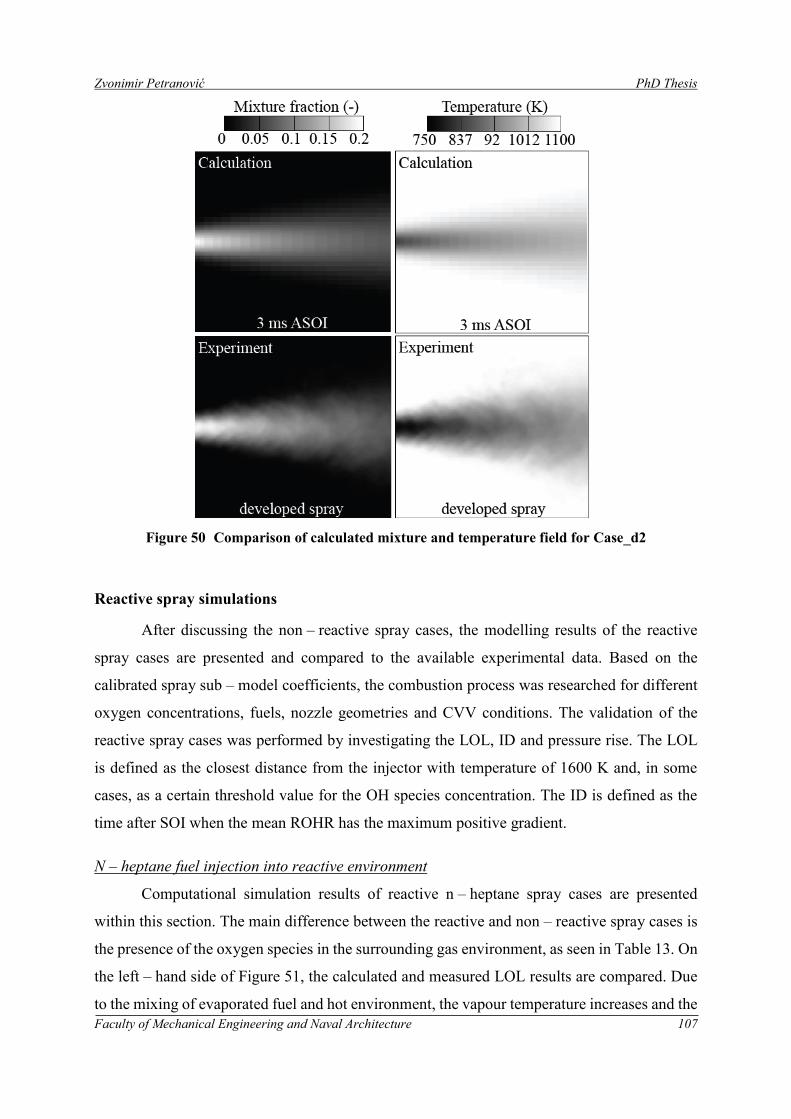
Zvonimir Petranović PhD Thesis
Faculty of Mechanical Engineering and Naval Architecture 107
Figure 50 Comparison of calculated mixture and temperature field for Case_d2
Reactive spray simulations
After discussing the non – reactive spray cases, the modelling results of the reactive
spray cases are presented and compared to the available experimental data. Based on the
calibrated spray sub – model coefficients, the combustion process was researched for different
oxygen concentrations, fuels, nozzle geometries and CVV conditions. The validation of the
reactive spray cases was performed by investigating the LOL, ID and pressure rise. The LOL
is defined as the closest distance from the injector with temperature of 1600 K and, in some
cases, as a certain threshold value for the OH species concentration. The ID is defined as the
time after SOI when the mean ROHR has the maximum positive gradient.
N – heptane fuel injection into reactive environment
Computational simulation results of reactive n – heptane spray cases are presented
within this section. The main difference between the reactive and non – reactive spray cases is
the presence of the oxygen species in the surrounding gas environment, as seen in Table 13. On
the left – hand side of Figure 51, the calculated and measured LOL results are compared. Due
to the mixing of evaporated fuel and hot environment, the vapour temperature increases and the
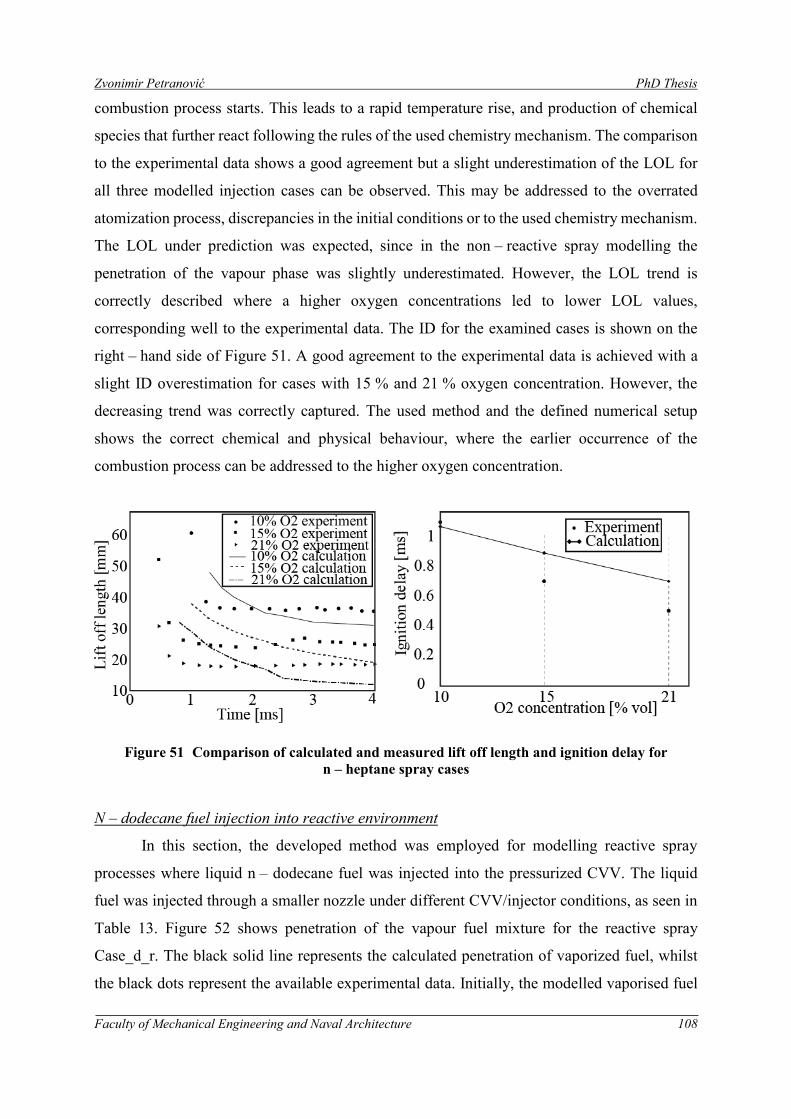
Zvonimir Petranović PhD Thesis
Faculty of Mechanical Engineering and Naval Architecture 108
combustion process starts. This leads to a rapid temperature rise, and production of chemical
species that further react following the rules of the used chemistry mechanism. The comparison
to the experimental data shows a good agreement but a slight underestimation of the LOL for
all three modelled injection cases can be observed. This may be addressed to the overrated
atomization process, discrepancies in the initial conditions or to the used chemistry mechanism.
The LOL under prediction was expected, since in the non – reactive spray modelling the
penetration of the vapour phase was slightly underestimated. However, the LOL trend is
correctly described where a higher oxygen concentrations led to lower LOL values,
corresponding well to the experimental data. The ID for the examined cases is shown on the
right – hand side of Figure 51. A good agreement to the experimental data is achieved with a
slight ID overestimation for cases with 15 % and 21 % oxygen concentration. However, the
decreasing trend was correctly captured. The used method and the defined numerical setup
shows the correct chemical and physical behaviour, where the earlier occurrence of the
combustion process can be addressed to the higher oxygen concentration.
Figure 51 Comparison of calculated and measured lift off length and ignition delay for
n – heptane spray cases
N – dodecane fuel injection into reactive environment
In this section, the developed method was employed for modelling reactive spray
processes where liquid n – dodecane fuel was injected into the pressurized CVV. The liquid
fuel was injected through a smaller nozzle under different CVV/injector conditions, as seen in
Table 13. Figure 52 shows penetration of the vapour fuel mixture for the reactive spray
Case_d_r. The black solid line represents the calculated penetration of vaporized fuel, whilst
the black dots represent the available experimental data. Initially, the modelled vaporised fuel
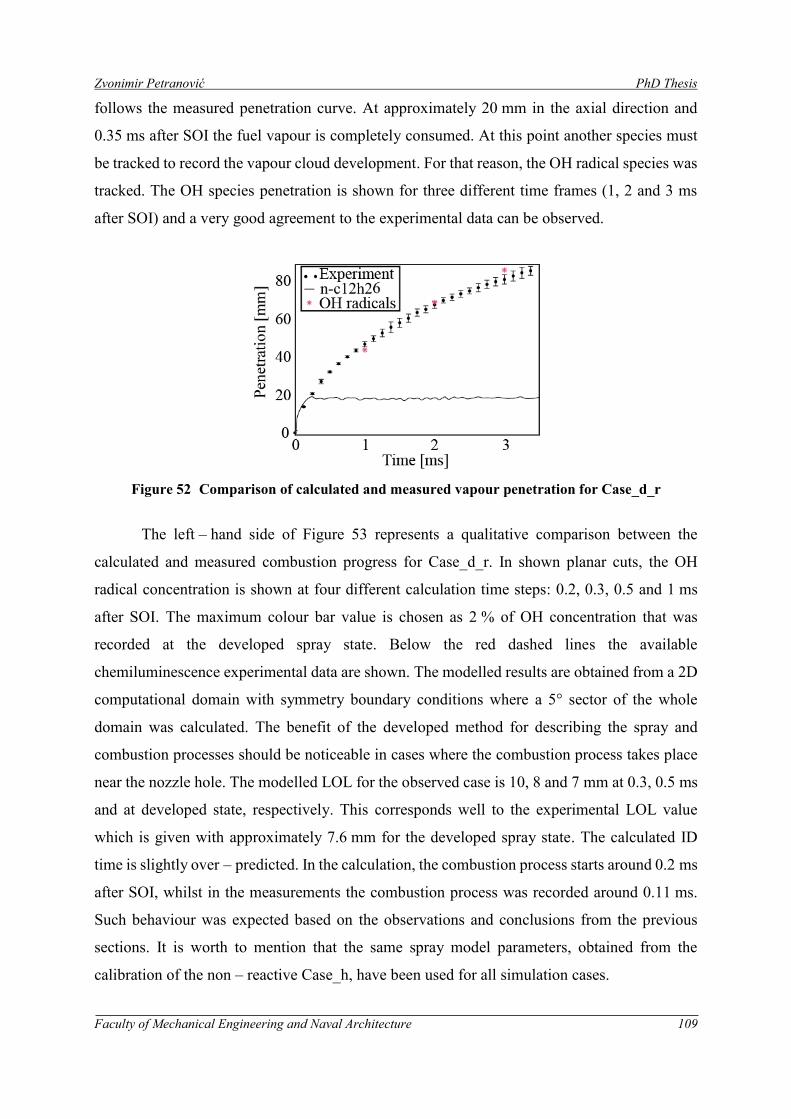
Zvonimir Petranović PhD Thesis
Faculty of Mechanical Engineering and Naval Architecture 109
follows the measured penetration curve. At approximately 20 mm in the axial direction and
0.35 ms after SOI the fuel vapour is completely consumed. At this point another species must
be tracked to record the vapour cloud development. For that reason, the OH radical species was
tracked. The OH species penetration is shown for three different time frames (1, 2 and 3 ms
after SOI) and a very good agreement to the experimental data can be observed.
Figure 52 Comparison of calculated and measured vapour penetration for Case_d_r
The left – hand side of Figure 53 represents a qualitative comparison between the
calculated and measured combustion progress for Case_d_r. In shown planar cuts, the OH
radical concentration is shown at four different calculation time steps: 0.2, 0.3, 0.5 and 1 ms
after SOI. The maximum colour bar value is chosen as 2 % of OH concentration that was
recorded at the developed spray state. Below the red dashed lines the available
chemiluminescence experimental data are shown. The modelled results are obtained from a 2D
computational domain with symmetry boundary conditions where a 5° sector of the whole
domain was calculated. The benefit of the developed method for describing the spray and
combustion processes should be noticeable in cases where the combustion process takes place
near the nozzle hole. The modelled LOL for the observed case is 10, 8 and 7 mm at 0.3, 0.5 ms
and at developed state, respectively. This corresponds well to the experimental LOL value
which is given with approximately 7.6 mm for the developed spray state. The calculated ID
time is slightly over – predicted. In the calculation, the combustion process starts around 0.2 ms
after SOI, whilst in the measurements the combustion process was recorded around 0.11 ms.
Such behaviour was expected based on the observations and conclusions from the previous
sections. It is worth to mention that the same spray model parameters, obtained from the
calibration of the non – reactive Case_h, have been used for all simulation cases.
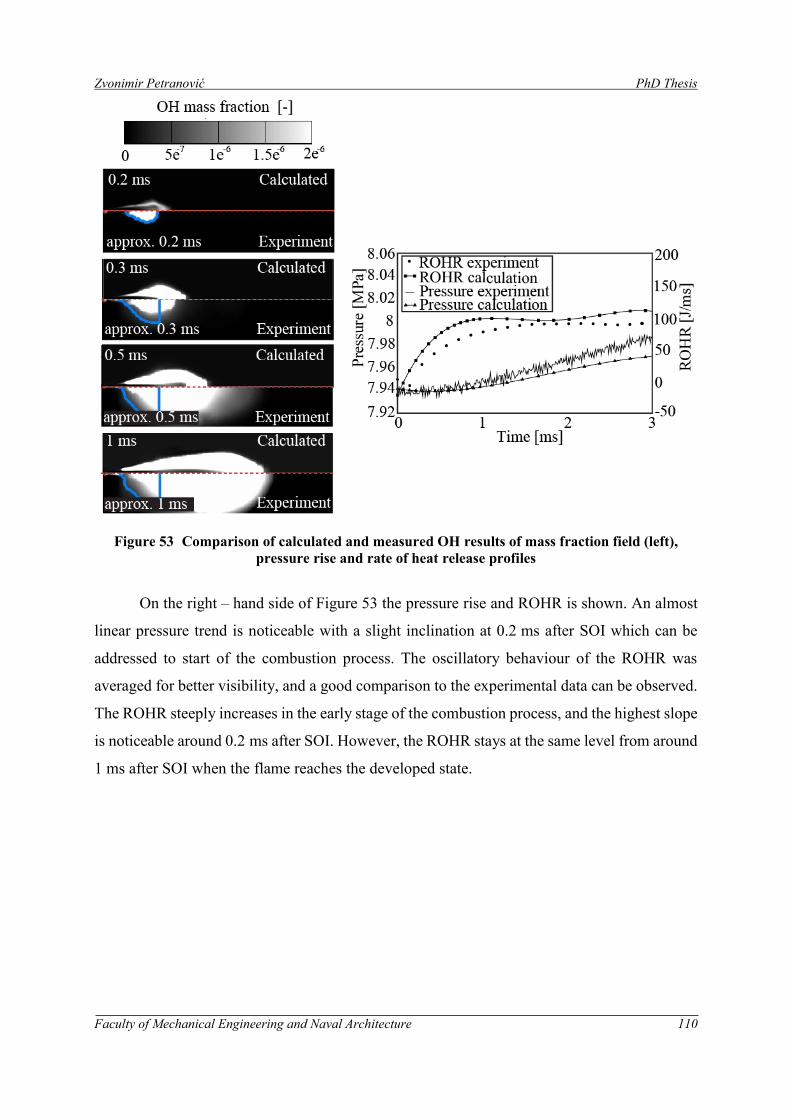
Zvonimir Petranović PhD Thesis
Faculty of Mechanical Engineering and Naval Architecture 110
Figure 53 Comparison of calculated and measured OH results of mass fraction field (left),
pressure rise and rate of heat release profiles
On the right – hand side of Figure 53 the pressure rise and ROHR is shown. An almost
linear pressure trend is noticeable with a slight inclination at 0.2 ms after SOI which can be
addressed to start of the combustion process. The oscillatory behaviour of the ROHR was
averaged for better visibility, and a good comparison to the experimental data can be observed.
The ROHR steeply increases in the early stage of the combustion process, and the highest slope
is noticeable around 0.2 ms after SOI. However, the ROHR stays at the same level from around
1 ms after SOI when the flame reaches the developed state.
Zvonimir Petranović PhD Thesis
Faculty of Mechanical Engineering and Naval Architecture 111
3.8. Euler Eulerian engine modelling
This section illustrates the capabilities of the developed method for simulating complex
engineering applications such as IC diesel engines. The spray process was modelled with the
Euler Eulerian size – of – classes approach which has advantages in description of the physical
processes occurring in the near nozzle region. The combustion process was modelled by solving
the chemical reactions within the gas phase by using reaction mechanisms. In the vicinity of
the nozzle it is considered that the Eulerian spray approach is fairly efficient. This approach is
extended to the multi – continuum approach when the discrete phase is divided into droplet
classes, where for each class a set of conservation equations is solved. By increasing the number
of classes the resolution of the droplet size distribution is enhanced, but also the computational
effort is increased. Even though such approach is considered suitable for modelling the dense
spray region, it can be used for the whole spray domain as it is shown in the results of this
section. The calculated results are compared to the available experimental data, and to the
results obtained with Euler Lagrangian DDM approach.
3.8.1. Experimental data and numerical setup
A new method was used for modelling a real IC engine configuration, where the
validated spray approach was used together with the chemistry mechanism to adequately
describe the dense spray region and combustion processes. The geometry of the IC engine
combustion chamber and the 7 – hole injector are symmetrical in design. Therefore, the engine
calculation domain was constructed as 1/7 of the total engine geometry considering the fuel
flow from a single nozzle hole and the computational effort was significantly reduced. The
engine computational mesh contains approximately 37400 control volumes at the TDC, and
approximately 112000 control volumes in the BDC. During the piston movement, the mesh is
rezoned due to the deformation and high aspect ratio of some computational cells. The rezone
procedure is a mesh replacement at defined crankshaft position, where the mesh has the same
outer shape but a different number of control volumes, used to avoid undesirable cell
distortions. To provide an adequate wall treatment on the modelled results, a 2 – cell boundary
layer was created in the vicinity of the defined wall boundary selections.
The stroke, bore, compression ratio and the engine speed of the investigated engine
configuration are 93.15 mm, 81 mm, 15.6:1, and 2000 rpm, respectively, as shown in Table 14.
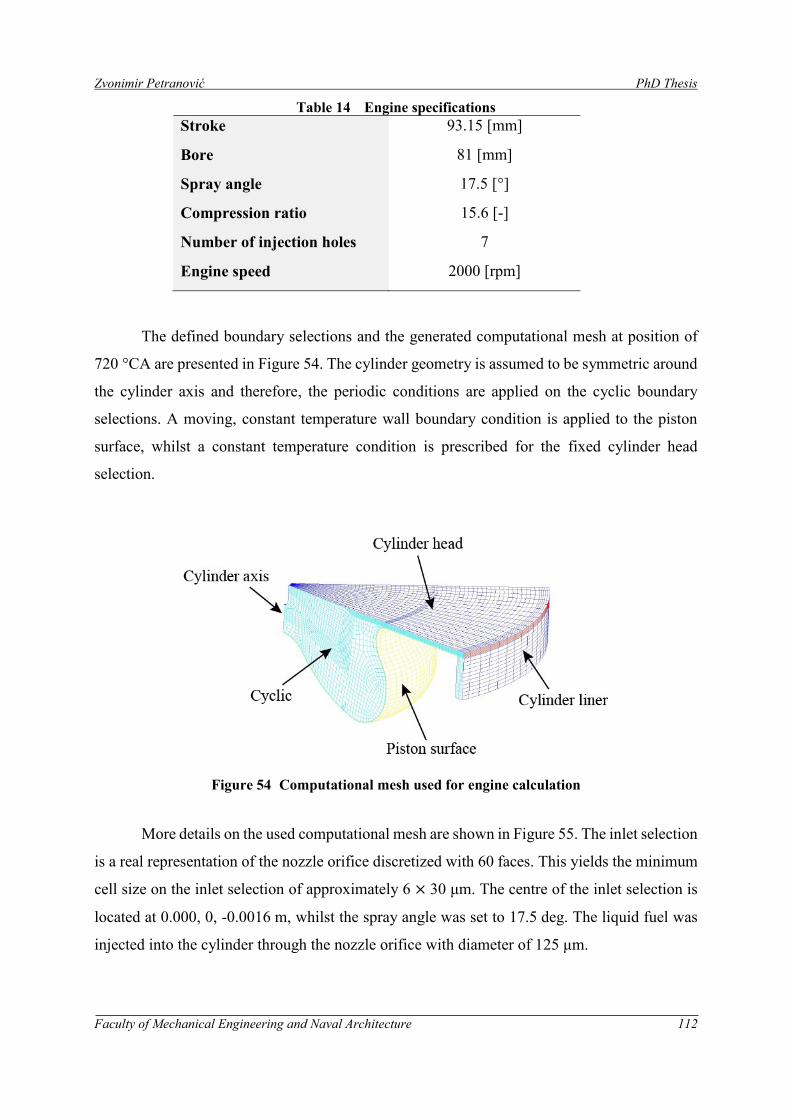
Zvonimir Petranović PhD Thesis
Faculty of Mechanical Engineering and Naval Architecture 112
Table 14 Engine specifications
Stroke 93.15 [mm]
Bore 81 [mm]
Spray angle 17.5 [°]
Compression ratio 15.6 [-]
Number of injection holes 7
Engine speed 2000 [rpm]
The defined boundary selections and the generated computational mesh at position of
720 °CA are presented in Figure 54. The cylinder geometry is assumed to be symmetric around
the cylinder axis and therefore, the periodic conditions are applied on the cyclic boundary
selections. A moving, constant temperature wall boundary condition is applied to the piston
surface, whilst a constant temperature condition is prescribed for the fixed cylinder head
selection.
Figure 54 Computational mesh used for engine calculation
More details on the used computational mesh are shown in Figure 55. The inlet selection
is a real representation of the nozzle orifice discretized with 60 faces. This yields the minimum
cell size on the inlet selection of approximately 6 × 30 μm. The centre of the inlet selection is
located at 0.000, 0, -0.0016 m, whilst the spray angle was set to 17.5 deg. The liquid fuel was
injected into the cylinder through the nozzle orifice with diameter of 125 μm.
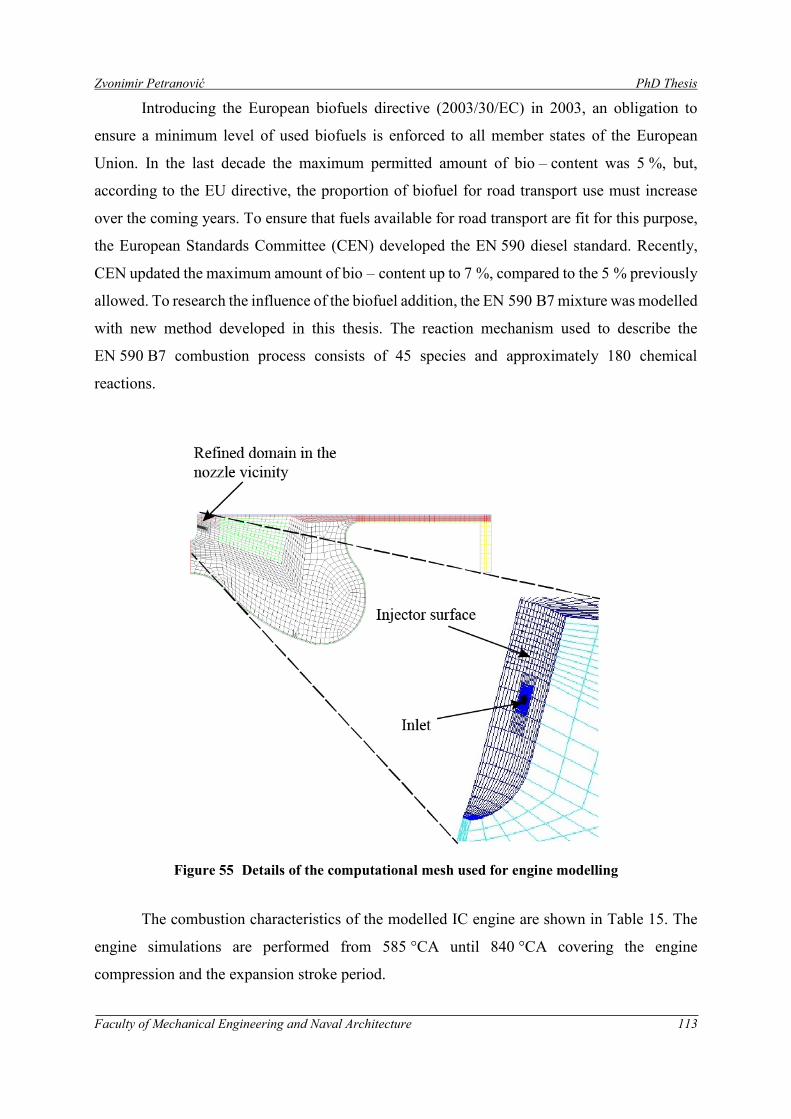
Zvonimir Petranović PhD Thesis
Faculty of Mechanical Engineering and Naval Architecture 113
Introducing the European biofuels directive (2003/30/EC) in 2003, an obligation to
ensure a minimum level of used biofuels is enforced to all member states of the European
Union. In the last decade the maximum permitted amount of bio – content was 5 %, but,
according to the EU directive, the proportion of biofuel for road transport use must increase
over the coming years. To ensure that fuels available for road transport are fit for this purpose,
the European Standards Committee (CEN) developed the EN 590 diesel standard. Recently,
CEN updated the maximum amount of bio – content up to 7 %, compared to the 5 % previously
allowed. To research the influence of the biofuel addition, the EN 590 B7 mixture was modelled
with new method developed in this thesis. The reaction mechanism used to describe the
EN 590 B7 combustion process consists of 45 species and approximately 180 chemical
reactions.
Figure 55 Details of the computational mesh used for engine modelling
The combustion characteristics of the modelled IC engine are shown in Table 15. The
engine simulations are performed from 585 °CA until 840 °CA covering the engine
compression and the expansion stroke period.
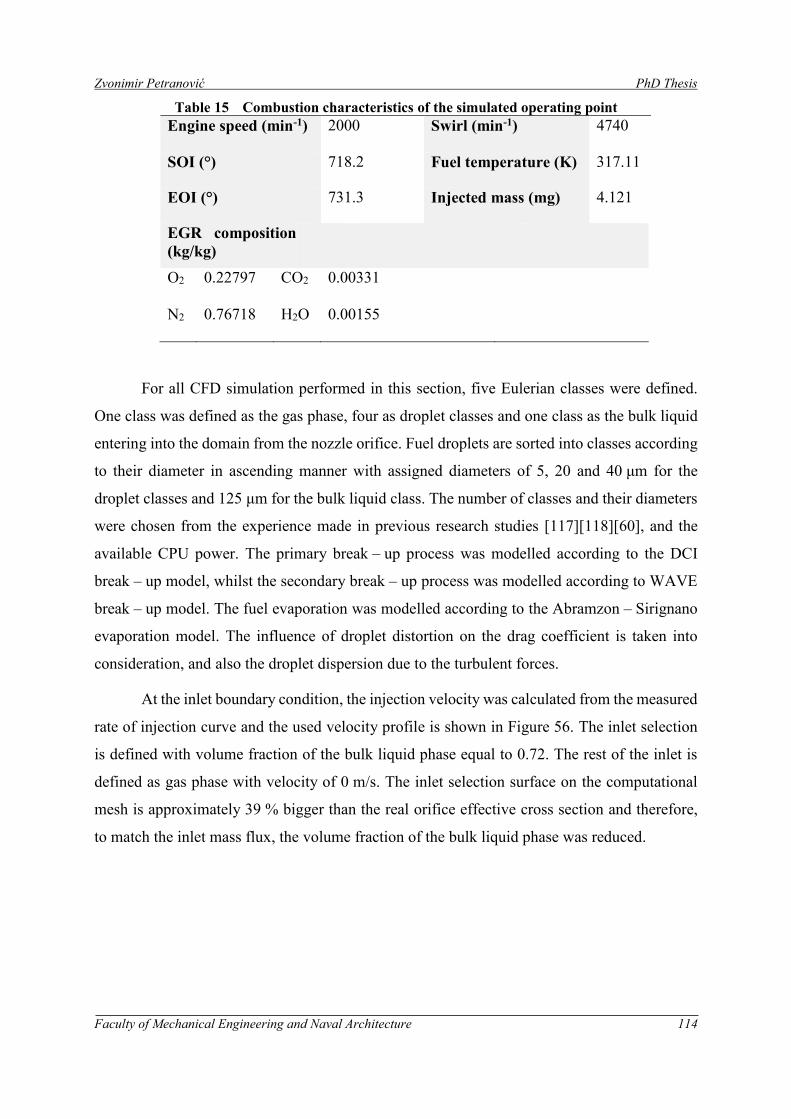
Zvonimir Petranović PhD Thesis
Faculty of Mechanical Engineering and Naval Architecture 114
Table 15 Combustion characteristics of the simulated operating point
Engine speed (min-1) 2000 Swirl (min-1) 4740
SOI (°) 718.2 Fuel temperature (K) 317.11
EOI (°) 731.3 Injected mass (mg) 4.121
EGR composition
(kg/kg)
O2 0.22797 CO2 0.00331
N2 0.76718 H2O 0.00155
For all CFD simulation performed in this section, five Eulerian classes were defined.
One class was defined as the gas phase, four as droplet classes and one class as the bulk liquid
entering into the domain from the nozzle orifice. Fuel droplets are sorted into classes according
to their diameter in ascending manner with assigned diameters of 5, 20 and 40 μm for the
droplet classes and 125 μm for the bulk liquid class. The number of classes and their diameters
were chosen from the experience made in previous research studies [117][118][60], and the
available CPU power. The primary break – up process was modelled according to the DCI
break – up model, whilst the secondary break – up process was modelled according to WAVE
break – up model. The fuel evaporation was modelled according to the Abramzon – Sirignano
evaporation model. The influence of droplet distortion on the drag coefficient is taken into
consideration, and also the droplet dispersion due to the turbulent forces.
At the inlet boundary condition, the injection velocity was calculated from the measured
rate of injection curve and the used velocity profile is shown in Figure 56. The inlet selection
is defined with volume fraction of the bulk liquid phase equal to 0.72. The rest of the inlet is
defined as gas phase with velocity of 0 m/s. The inlet selection surface on the computational
mesh is approximately 39 % bigger than the real orifice effective cross section and therefore,
to match the inlet mass flux, the volume fraction of the bulk liquid phase was reduced.
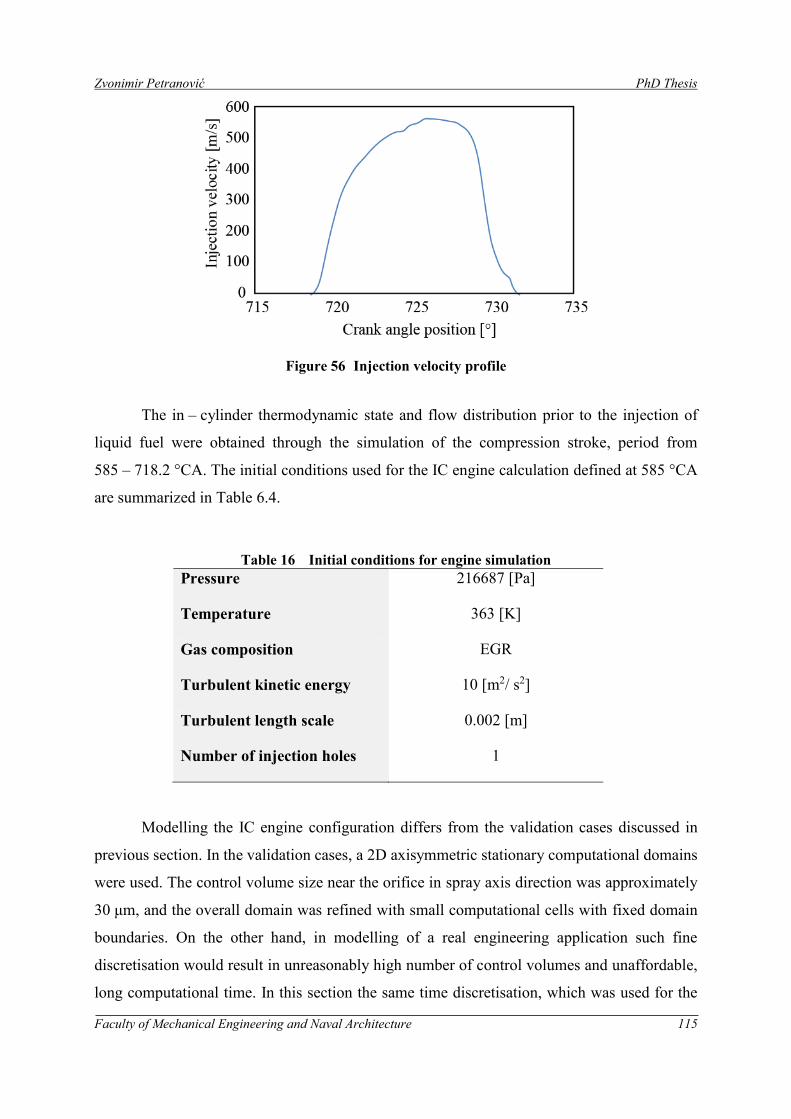
Zvonimir Petranović PhD Thesis
Faculty of Mechanical Engineering and Naval Architecture 115
Figure 56 Injection velocity profile
The in – cylinder thermodynamic state and flow distribution prior to the injection of
liquid fuel were obtained through the simulation of the compression stroke, period from
585 – 718.2 °CA. The initial conditions used for the IC engine calculation defined at 585 °CA
are summarized in Table 6.4.
Table 16 Initial conditions for engine simulation
Pressure 216687 [Pa]
Temperature 363 [K]
Gas composition EGR
Turbulent kinetic energy 10 [m2/ s2]
Turbulent length scale 0.002 [m]
Number of injection holes 1
Modelling the IC engine configuration differs from the validation cases discussed in
previous section. In the validation cases, a 2D axisymmetric stationary computational domains
were used. The control volume size near the orifice in spray axis direction was approximately
30 μm, and the overall domain was refined with small computational cells with fixed domain
boundaries. On the other hand, in modelling of a real engineering application such fine
discretisation would result in unreasonably high number of control volumes and unaffordable,
long computational time. In this section the same time discretisation, which was used for the
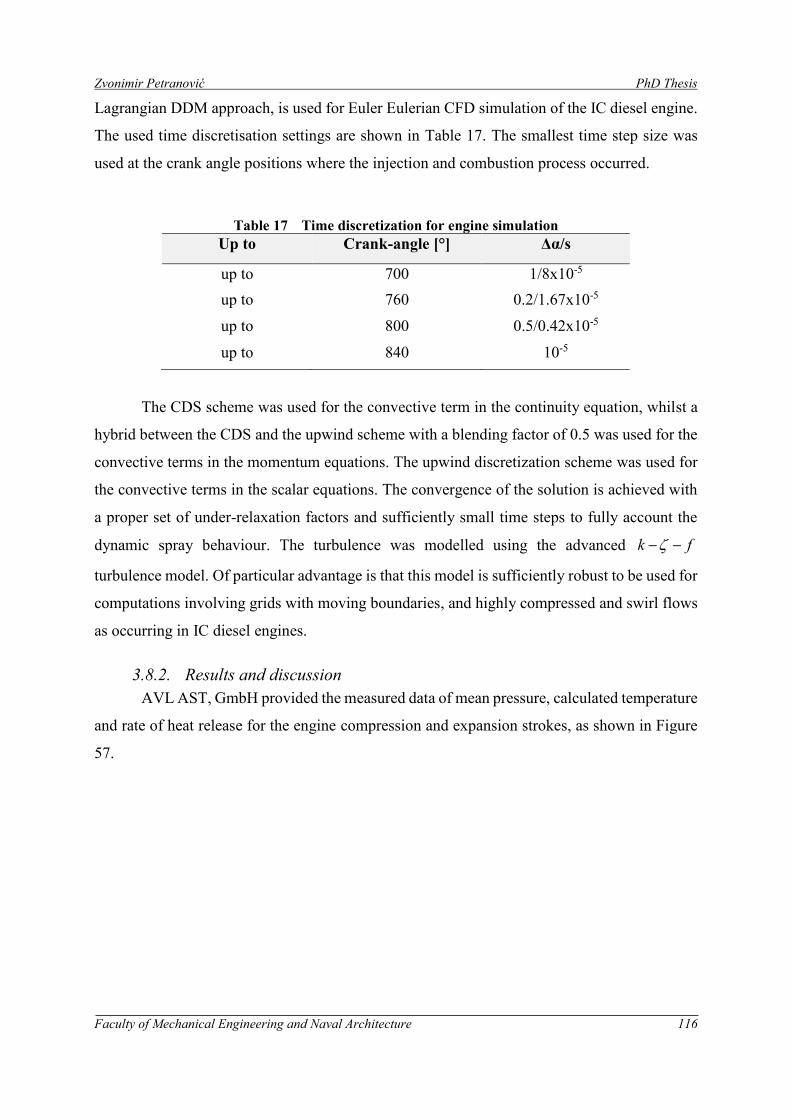
Zvonimir Petranović PhD Thesis
Faculty of Mechanical Engineering and Naval Architecture 116
Lagrangian DDM approach, is used for Euler Eulerian CFD simulation of the IC diesel engine.
The used time discretisation settings are shown in Table 17. The smallest time step size was
used at the crank angle positions where the injection and combustion process occurred.
Table 17 Time discretization for engine simulation
Up to Crank-angle [°] Δα/s
up to 700 1/8x10-5
up to 760 0.2/1.67x10-5
up to 800 0.5/0.42x10-5
up to 840 10-5
The CDS scheme was used for the convective term in the continuity equation, whilst a
hybrid between the CDS and the upwind scheme with a blending factor of 0.5 was used for the
convective terms in the momentum equations. The upwind discretization scheme was used for
the convective terms in the scalar equations. The convergence of the solution is achieved with
a proper set of under-relaxation factors and sufficiently small time steps to fully account the
dynamic spray behaviour. The turbulence was modelled using the advanced k f
turbulence model. Of particular advantage is that this model is sufficiently robust to be used for
computations involving grids with moving boundaries, and highly compressed and swirl flows
as occurring in IC diesel engines.
3.8.2. Results and discussion
AVL AST, GmbH provided the measured data of mean pressure, calculated temperature
and rate of heat release for the engine compression and expansion strokes, as shown in Figure
57.
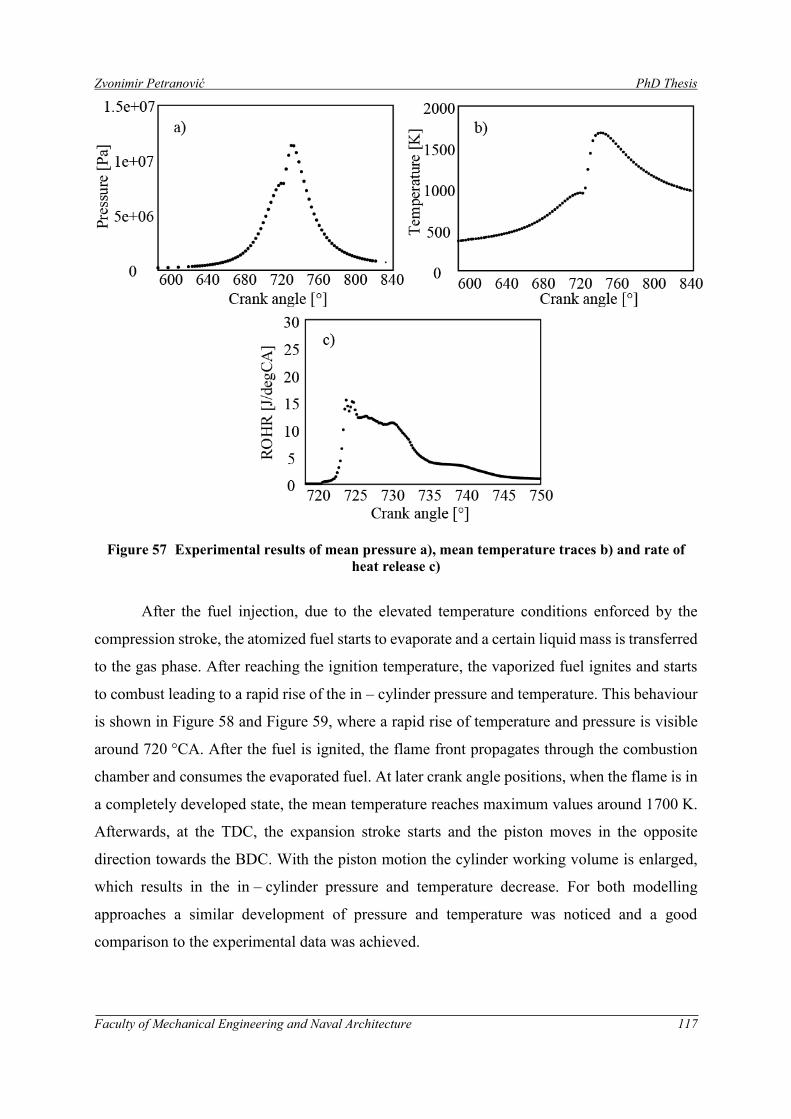
Zvonimir Petranović PhD Thesis
Faculty of Mechanical Engineering and Naval Architecture 117
Figure 57 Experimental results of mean pressure a), mean temperature traces b) and rate of
heat release c)
After the fuel injection, due to the elevated temperature conditions enforced by the
compression stroke, the atomized fuel starts to evaporate and a certain liquid mass is transferred
to the gas phase. After reaching the ignition temperature, the vaporized fuel ignites and starts
to combust leading to a rapid rise of the in – cylinder pressure and temperature. This behaviour
is shown in Figure 58 and Figure 59, where a rapid rise of temperature and pressure is visible
around 720 °CA. After the fuel is ignited, the flame front propagates through the combustion
chamber and consumes the evaporated fuel. At later crank angle positions, when the flame is in
a completely developed state, the mean temperature reaches maximum values around 1700 K.
Afterwards, at the TDC, the expansion stroke starts and the piston moves in the opposite
direction towards the BDC. With the piston motion the cylinder working volume is enlarged,
which results in the in – cylinder pressure and temperature decrease. For both modelling
approaches a similar development of pressure and temperature was noticed and a good
comparison to the experimental data was achieved.
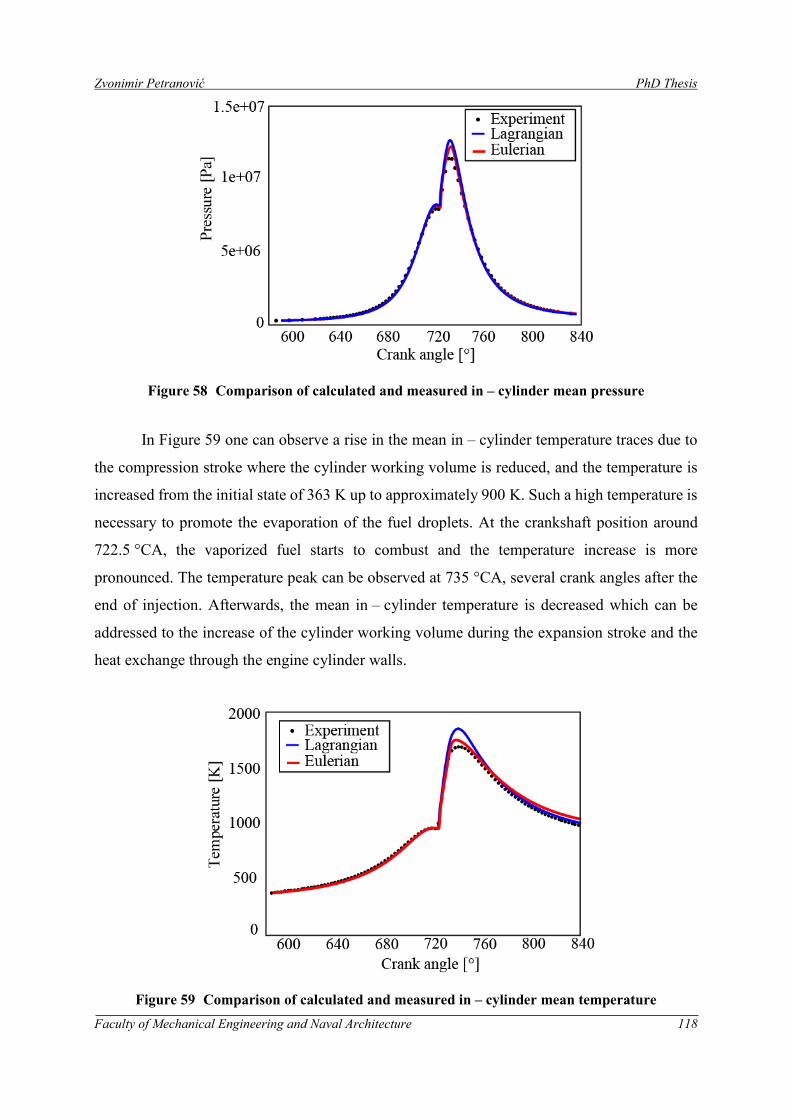
Zvonimir Petranović PhD Thesis
Faculty of Mechanical Engineering and Naval Architecture 118
Figure 58 Comparison of calculated and measured in – cylinder mean pressure
In Figure 59 one can observe a rise in the mean in – cylinder temperature traces due to
the compression stroke where the cylinder working volume is reduced, and the temperature is
increased from the initial state of 363 K up to approximately 900 K. Such a high temperature is
necessary to promote the evaporation of the fuel droplets. At the crankshaft position around
722.5 °CA, the vaporized fuel starts to combust and the temperature increase is more
pronounced. The temperature peak can be observed at 735 °CA, several crank angles after the
end of injection. Afterwards, the mean in – cylinder temperature is decreased which can be
addressed to the increase of the cylinder working volume during the expansion stroke and the
heat exchange through the engine cylinder walls.
Figure 59 Comparison of calculated and measured in – cylinder mean temperature
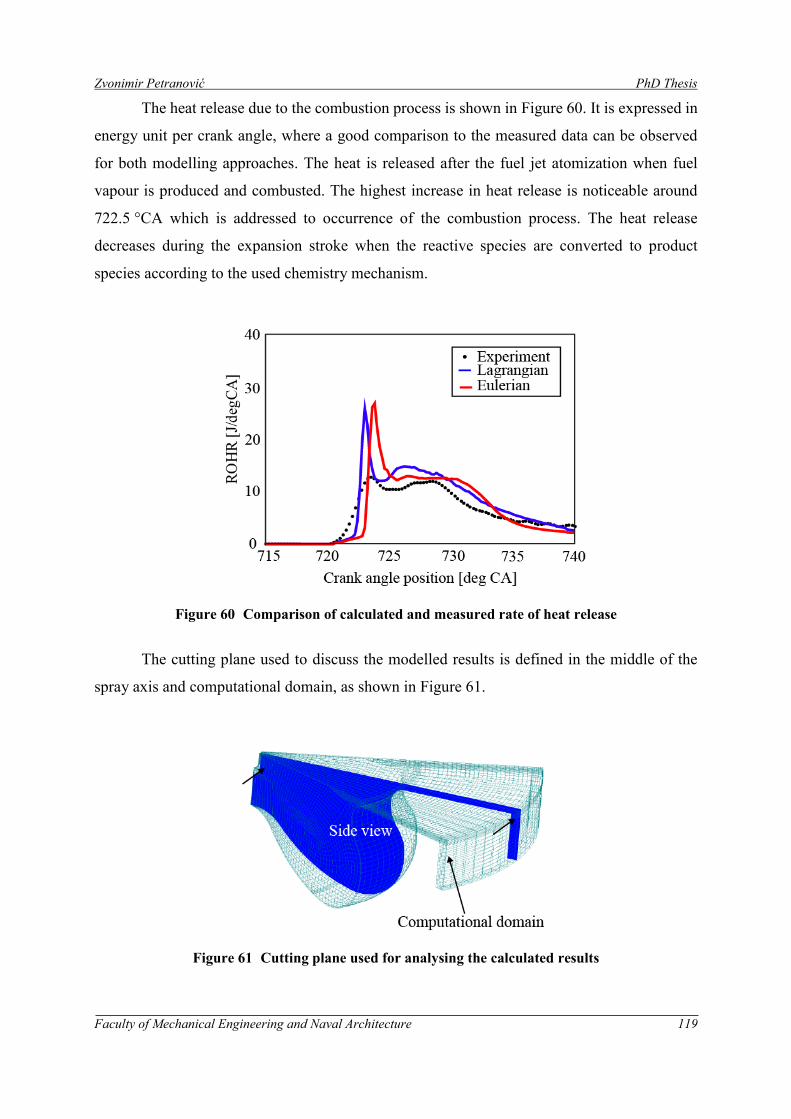
Zvonimir Petranović PhD Thesis
Faculty of Mechanical Engineering and Naval Architecture 119
The heat release due to the combustion process is shown in Figure 60. It is expressed in
energy unit per crank angle, where a good comparison to the measured data can be observed
for both modelling approaches. The heat is released after the fuel jet atomization when fuel
vapour is produced and combusted. The highest increase in heat release is noticeable around
722.5 °CA which is addressed to occurrence of the combustion process. The heat release
decreases during the expansion stroke when the reactive species are converted to product
species according to the used chemistry mechanism.
Figure 60 Comparison of calculated and measured rate of heat release
The cutting plane used to discuss the modelled results is defined in the middle of the
spray axis and computational domain, as shown in Figure 61.
Figure 61 Cutting plane used for analysing the calculated results
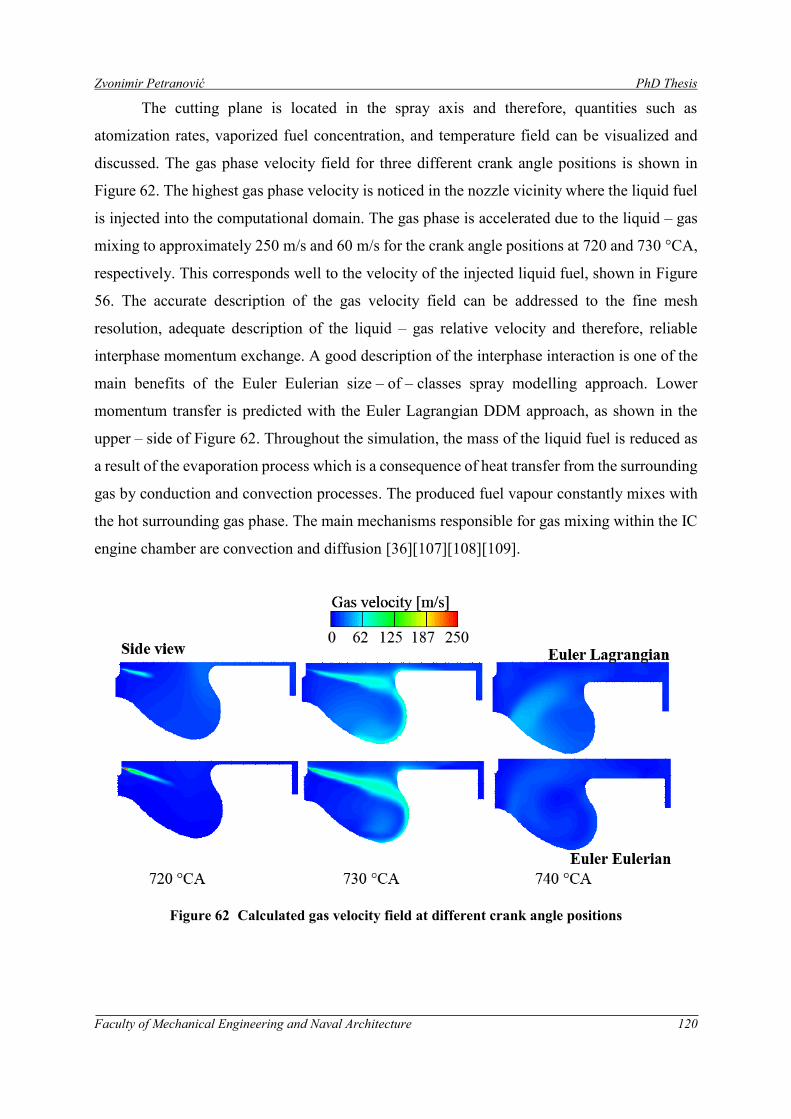
Zvonimir Petranović PhD Thesis
Faculty of Mechanical Engineering and Naval Architecture 120
The cutting plane is located in the spray axis and therefore, quantities such as
atomization rates, vaporized fuel concentration, and temperature field can be visualized and
discussed. The gas phase velocity field for three different crank angle positions is shown in
Figure 62. The highest gas phase velocity is noticed in the nozzle vicinity where the liquid fuel
is injected into the computational domain. The gas phase is accelerated due to the liquid – gas
mixing to approximately 250 m/s and 60 m/s for the crank angle positions at 720 and 730 °CA,
respectively. This corresponds well to the velocity of the injected liquid fuel, shown in Figure
56. The accurate description of the gas velocity field can be addressed to the fine mesh
resolution, adequate description of the liquid – gas relative velocity and therefore, reliable
interphase momentum exchange. A good description of the interphase interaction is one of the
main benefits of the Euler Eulerian size – of – classes spray modelling approach. Lower
momentum transfer is predicted with the Euler Lagrangian DDM approach, as shown in the
upper – side of Figure 62. Throughout the simulation, the mass of the liquid fuel is reduced as
a result of the evaporation process which is a consequence of heat transfer from the surrounding
gas by conduction and convection processes. The produced fuel vapour constantly mixes with
the hot surrounding gas phase. The main mechanisms responsible for gas mixing within the IC
engine chamber are convection and diffusion [36][107][108][109].
Figure 62 Calculated gas velocity field at different crank angle positions
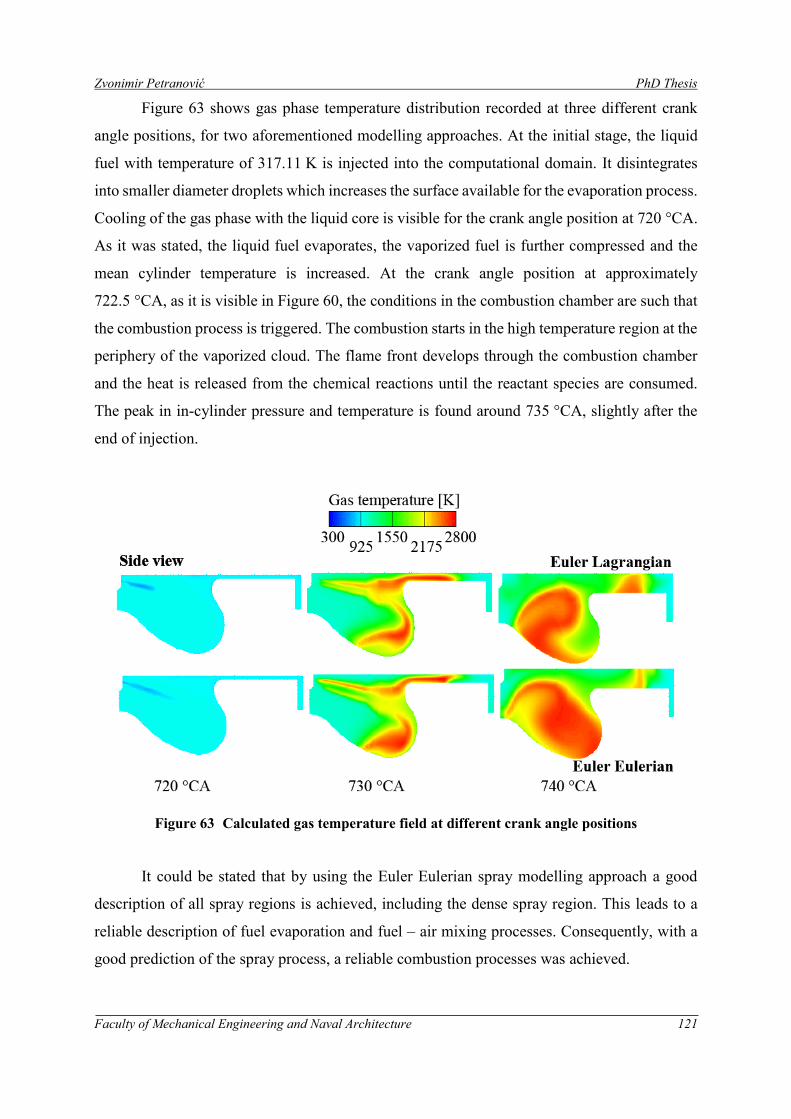
Zvonimir Petranović PhD Thesis
Faculty of Mechanical Engineering and Naval Architecture 121
Figure 63 shows gas phase temperature distribution recorded at three different crank
angle positions, for two aforementioned modelling approaches. At the initial stage, the liquid
fuel with temperature of 317.11 K is injected into the computational domain. It disintegrates
into smaller diameter droplets which increases the surface available for the evaporation process.
Cooling of the gas phase with the liquid core is visible for the crank angle position at 720 °CA.
As it was stated, the liquid fuel evaporates, the vaporized fuel is further compressed and the
mean cylinder temperature is increased. At the crank angle position at approximately
722.5 °CA, as it is visible in Figure 60, the conditions in the combustion chamber are such that
the combustion process is triggered. The combustion starts in the high temperature region at the
periphery of the vaporized cloud. The flame front develops through the combustion chamber
and the heat is released from the chemical reactions until the reactant species are consumed.
The peak in in-cylinder pressure and temperature is found around 735 °CA, slightly after the
end of injection.
Figure 63 Calculated gas temperature field at different crank angle positions
It could be stated that by using the Euler Eulerian spray modelling approach a good
description of all spray regions is achieved, including the dense spray region. This leads to a
reliable description of fuel evaporation and fuel – air mixing processes. Consequently, with a
good prediction of the spray process, a reliable combustion processes was achieved.
Zvonimir Petranović PhD Thesis
Faculty of Mechanical Engineering and Naval Architecture 122
4. CONCLUDING REMARKS, CONTRIBUTION AND FUTURE
WORK RECOMMENDATIONS
4.1. Thesis conclusion
Numerous reliable and validated methods have to be used to model turbulent reacting
multiphase flows in a real combustion applications. In this thesis, an advanced modelling
method was developed for the computational simulation of highly turbulent reactive multiphase
flows. The method was developed by combining the Euler Eulerian size – of – classes approach
that is suitable for modelling the dense and diluted spray regions, together with the chemistry
mechanism that was used for modelling the combustion process. Such a method was validated
on various spray cases, both simplified and real engineering applications. The main aim of the
developed method is a good description of the fuel – air mixing process, focusing on the near
nozzle region, and therefore achieving a reliable modelling of multiphase combustion
processes. In the following part the conclusions derived for each thesis section, defined in the
chapter 1.3 Objective and hypothesis of research, are shown.
4.1.1. Eulerian Lagrangian modelling
In this section of the thesis the spray process was modelled by employing the Euler
Lagrangian DDM model. The combustion was modelled by using the common ECFM 3Z
combustion model, whilst the soot and the NOx emissions were modelled by using the kinetic
and extended Zeldovich models, respectively. The aim of this section was to gain insight into
advantages and disadvantages of the Euler Lagrangian DDM spray model.
Concluding remarks are:
The investigation of in – cylinder fluid flows and chemical reactions was performed and
the mathematical models for prediction of the in – cylinder processes were presented.
The mathematical models of spray and pollutant emission formation previously
implemented into a commercial CFD code FIRE® were validated.
Combustion parameters such as start and end of injection, swirl number, injected mass
and exhaust gas mass fraction were varied, and their influence on the emission was
investigated.
Modelled results show the influence of the combustion system parameter variations on
in – cylinder pressure, NOx and soot formation trends.
Pressure and temperature traces, heat release and pollutant formation show a good
agreement with the experimental data.
Zvonimir Petranović PhD Thesis
Faculty of Mechanical Engineering and Naval Architecture 123
The disadvantages of the Lagrangian DDM model were noticed. Such model suffers
from poor description of the interfacial momentum transfer in the near nozzle region,
lower statistical convergence, it is mesh dependant, and it suffers from several
disadvantages related to the MPI performance.
4.1.2. Parametric study of spray sub – models
The validation of the Euler Eulerian size – of – classes approach was conducted by
comparing the modelling results against the available experimental data. Overall, it can be
stated that the used approach adequately describes the liquid and fuel vapour penetrations in
comparison with all observed experimental cases, covering a wide range of high pressure
injection conditions. The Euler Eulerian multiphase spray approach showed the capability of
predicting the impact of the rail pressure on the vapour and liquid spray tip penetrations.
Furthermore, it was shown that the used approach is capable to adequately describe the highly
turbulent liquid fuel injection, and it can serve as valuable tool in the development process of
modern fuel injection systems.
Concluding remarks are:
An Eulerian multiphase spray modelling concept, applying the method with constant
size class diameters assigned to each of the liquid droplet phases, was presented.
The primary break – up, secondary break – up, and evaporation models were utilised to
model the fuel spray injection with different injection and chamber pressure
combinations.
The increase of the injection pressure results in the increase of the fuel vapour
penetration, but it has only minor influences on the liquid fuel penetration.
The increase of the chamber pressure had the opposite effect. Due to the higher
surrounding gas mixture pressure and increased density, a larger spray angle with lower
tip penetration was observed.
The final set of model coefficients was derived by performing the model
parameterization on the reference case, where the influence of individual model
coefficients was examined.
Changing the model coefficients influences the droplet size and atomization rate. This
results in different temporal and spatial droplet-vapour distributions.
Zvonimir Petranović PhD Thesis
Faculty of Mechanical Engineering and Naval Architecture 124
Concluding remarks from modelling the primary atomization model:
In this section of the thesis computational simulations of liquid fuel atomization focusing
on the processes in the near nozzle region were performed. The atomization process was
modelled by employing the Euler Eulerian size – of – classes approach. The simulation results
were compared to available DNS results where the axial and radial mixture volume fractions
were researched.
At small distances, in the near nozzle region (in the observed case at 5 x nozzle diameter
distance in the axial direction) the liquid core is unattached. Further downstream, the
liquid mass detachment due to the primary atomization is visible.
The calculated volume fraction is higher near the spray axis, comparing to the DNS
data. This could be addressed to underestimated modelled radial velocity arising from
the droplet detachment from the liquid core.
Further downstream the radial liquid volume fraction corresponds better to the DNS
data.
The liquid volume fraction decreases along the axial direction, which is a consequence
of the primary atomization of the liquid jet. The liquid mass is detached from the liquid
core and an unstable ligaments and droplets are formed.
4.1.3. Validation of the WAVE secondary atomization model
In this section of the thesis a high-pressure diesel fuel injection into a pressurized CVV
filled with non – reactive gases was modelled. The influence of the nozzle hole diameter and
the nozzle channel length on the spray characteristics was examined. The spray penetration,
spray angle, droplet distributions and the SMD were thoroughly analysed and compared to the
available experimental data. The common WAVE model was modified where the target droplet
diameter was taken as the arithmetic mean value between parent and original target droplet
diameter.
Concluding remarks are:
Four non – reactive spray operating points were simulated.
A small influence of the nozzle channel length on the liquid penetration was observed.
A small influence of the nozzle hole length and nozzle diameter on the spray angle was
observed. This corresponds well to the data found in the literature. A stronger influence
on the spray angle could be achieved by variations in chamber and injection pressures.
Zvonimir Petranović PhD Thesis
Faculty of Mechanical Engineering and Naval Architecture 125
The WAVE model in the Euler Eulerian size – of – classes approach, is found to be
sensitive to the mesh resolution and the number of Eulerian droplet classes. Therefore,
a modification of the model was performed.
The global SMD is found to be similar for all modelling cases were a small influence of
the bore length and diameter was observed.
For the observed cases the spray droplet cloud was consisting of droplets with diameters
between 1 and 20 μm.
A good agreement between modelled and measured volume and number based droplet size
distributions was achieved.
4.1.4. O’Rourke collision model
The aim of this section was to modify and to implement the O’Rourke collision model
within the Euler Eulerian size – of – classes approach framework. As a results, the collision
process can be calculated for defined collision interfaces. The implemented model was verified
on a simplified case with two colliding droplet jets.
Concluding remarks are:
The O’Rourke collision model was adjusted for the Euler Eulerian approach and it was
verified on a 2D domain.
The influence of the collision model on the SMD distribution was discussed, and the
introduced constraints regarding mass exchange were presented. These constraints
allow collision process calculations for defined Eulerian collision interfaces.
The mass exchange from the collisions process results in a change of the droplet size
and droplet number distributions.
A clear influence of the collision model on the colliding jets was noticed in terms of
SMD increase.
4.1.5. Verification of the developed multiphase combustion method
The reactive spray process was modelled by using the Euler Eulerian size – of – classes
approach, and the combustion process was modelled through chemical kinetics by solving
general gas phase reaction equations. The method was initially verified on the simplified
combustion case.
Concluding remarks are:
The concentration of fuel vapour arises due to the evaporation process and the reactor
mean temperature decreases.
Zvonimir Petranović PhD Thesis
Faculty of Mechanical Engineering and Naval Architecture 126
The combustion process leads to decrease in fuel vapour concentration, oxygen
depletion and a rise of the heat release.
After the reactant species have been completely consumed, the combustion process is
finished and the mixture temperature reaches a stationary value; the heat is not
released by the reactions anymore.
The specific multiphase combustion cases provided the same results as the single
phase combustion approach, which was considered as a verification proof of the
implemented method.
The method was implemented into the commercial CFD software and can be used on
MPI simulations for both the stationary and moving meshes including the rezone and
restart options.
4.1.6. Validation of the developed multiphase combustion method
Several non – reactive and reactive spray cases with n-dodecane and n-heptane fuel
were modelled to acquire the best set of spray model parameters for the observed injection
system. The fuel – air mixing process was validated by comparing liquid jet and vapour
development to the available experimental data from the ECN database.
Concluding remarks regarding the non – reactive spray modelling:
The radial/axial mixture distributions, and the liquid/vapour penetrations were
compared to the available experimental data.
The method successfully captured the influence of the nozzle diameter, fuel inlet
conditions and CVV thermodynamic state on the overall spray development.
Due to the turbulent dispersion force, fuel droplets and vapour tend to move in a radial
direction and form a conically shaped spray cloud. Radial movement reduces the liquid
jet penetration.
In the nozzle vicinity, the liquid jet is more concentrated around the spray axis, whilst
further downstream a wider mixture distribution was noticed.
The lower vapour penetration may be addressed to a slightly overrated break – up of the
liquid core and liquid droplets which is a result of the used model constants.
Higher CVV pressure leads to higher spray spreading and to decreased vapour axial
penetrations. The decrease of the mixture fraction in the axial direction can be addressed
to the mass shift to the spray periphery due to the radial forces.
Zvonimir Petranović PhD Thesis
Faculty of Mechanical Engineering and Naval Architecture 127
Concluding remarks regarding the reactive spray modelling:
An increase in the ambient oxygen concentrations leads to lower LOL and ID values.
This behaviour corresponds well to the experimental data.
A slight underestimation of the LOL and slight overestimation of the ID was observed.
This may be addressed to the overrated atomization process, discrepancies in the initial
conditions or to the used reaction mechanism.
The overall spray characteristics, LOL and ID trends were described correctly.
The ROHR and pressure change due to the combustion process were found to be in good
agreement with the experimental data.
4.2. Thesis contributions
The thesis expected contributions are:
The validation of the Euler Lagrangian DDM model was performed on a real
engineering combustion systems. The previously implemented spray and emission
models were used to show the ability of the used CFD code to predict the pollutant
emissions. The CFD modelling was performed on a computational domain with moving
boundaries with included rezone procedure.
The validation of the primary and secondary atomization models within the Euler
Eulerian multiphase spray module was performed. The Diesel Core Injection (DCI)
primary atomization model was thoroughly compared to DNS simulation results from
the literature. The secondary atomization model was modified to match the global SMD,
and global number and volume distributions. A deeper insight into the primary and
secondary atomization processes was provided, and a recommended set of model
coefficients was found.
The nozzle file interface, used for coupling nozzle flow and spray simulations, was
enhanced for full MPI and flexible nozzle format capability. The enhancement was done
in AVL FIRE® for the Euler Eulerian spray model, and the same methodology was used
for coupling the nozzle flow and ELSA spray simulations.
To accurately model near nozzle processes that occurs in a high pressure liquid fuel
injection systems, a droplet collision process should be considered. Due to that fact, the
O’Rourke collision model was modified and implemented into the Euler Eulerian spray
code.
Zvonimir Petranović PhD Thesis
Faculty of Mechanical Engineering and Naval Architecture 128
A new method for solving the reactive multiphase processes was developed by
combining the Euler Eulerian size – of – classes approach together with the chemical
kinetics. The method was initially developed on a simplified combustion case and it was
later thoroughly validated taking into account various combustion parameters.
The newly developed method was used for modelling real engineering combustion
systems. To the authors knowledge such an approach has never been reported in the
literature.
All the performed work within this thesis directly contributed to the industrial sector
where all model modifications were implemented into the commercial CFD code.
The developed method can be used to extend the usage of the Eulerian multi-continuum
approach to various applications with reactive multiphase flows.
4.3. Recommendations for future research
The work performed in this thesis produced new ideas for further development of CFD
models. The work was based on some assumptions and simplification which can be further
improved. Also, the numerical efficiency of the overall method could be increased. Some of the
recommendations for future work are described in the following part:
The nozzle flow – spray interface could be further enhanced. In the current approach,
the mapping is performed by searching nearest neighbour faces between the overlapping
selections. This way, a n2 loop was introduced which is found to be computationally
ineffective (n is number of nozzle outlet faces). It could be enhanced by developing the
spline surface from the nozzle outlet selection data (for all necessary quantities). Such
surface can be mirrored and placed in a certain direction and position to cover the inlet
selection in the spray simulation. The inlet boundary data can then be interpolated from
the spline surface, which is considered to be efficient and mesh independent.
The primary break – up model within the Euler Eulerian framework could be further
modified to take into account creation of unstable fuel ligament structures. The question
is how the solver should be changed, and if this could be done only by modification of
the drag coefficient for certain droplet classes. Such an enhancement would lead to some
changes in the modelled results, but it would introduce more physics in the overall
modelling process.
The secondary break-up WAVE model could be further modified. Instead of the
modification shown in this thesis, the mass shift from the parent class could be
Zvonimir Petranović PhD Thesis
Faculty of Mechanical Engineering and Naval Architecture 129
transferred to all child classes through desired distribution function. For this, a
validation case which neglects all other physical models should be used. Therefore,
instead of injection of a bulk jet, injection of droplets from a droplet generator should
be applied. The evaporation process can be supressed by injection at low temperature
environments.
The O’Rourke collision model implemented within the Euler Eulerian
size – of – classes approach could be further improved. In the current approach, the
collision between droplets of same Eulerian class is not calculated due to the absence of
the droplet relative velocity which is needed to calculate droplet collision frequency.
The implemented model considers only the coalescence collision regime. This could be
enhanced with other collision outcomes, as there are separation and bouncing described
in the literature.
The Euler Eulerian size – of – classes approach could be further enhanced with a wall
interaction model.
The developed method for modelling the multiphase combustion process could be
modified by several enhancements:
o In a real combustion applications where the combustion is described through
chemistry mechanisms, a common way is to use the multi – zone model. This
model groups computational cells according to certain rules and significantly
reduces the computational time necessary for DVODE solver. In the current
approach, the multi – zone model cannot be used together with the turbulence
chemistry interaction model. Therefore, the development of the multi – zone
model to take into account the turbulence influence should be developed [56].
o The developed method should be tested on more chemistry mechanisms to found
the reasons for the overestimated ID discussed in this thesis in sections 3.7 and
3.8.
o Some user – friendly GUI modification should be performed. As it was stated in
the thesis, the ID and LOL are quantities used for spray characterization. In the
literature both of them are defined in various ways, and therefore it is not straight
forward how to define them within the commercial CFD code.
The Euler Eulerian size – of – classes approach could be further enhanced with the soot
model.
Zvonimir Petranović PhD Thesis
Faculty of Mechanical Engineering and Naval Architecture 130
The Euler Eulerian spray size – of – classes approach could be further enhanced with
the NOx model.
The numerical efficiency of the Euler Eulerian size – of –classes approach could be
further improved. In the engine working cycle, the multiphase flow is only reasonable
in the period from SOI until the EOI. This implies, that before and after this points the
flow could be considered as a single phase flow which could reduce the necessary CPU
time.
Zvonimir Petranović PhD Thesis
Faculty of Mechanical Engineering and Naval Architecture 131
LITERATURE
[1] Reşitoʇlu IA, Altinişik K, Keskin A. The pollutant emissions from diesel-engine vehicles
and exhaust aftertreatment systems. Clean Technol Environ Policy 2014;17:15–27.
doi:10.1007/s10098-014-0793-9.
[2] Som S, Ramirez AI, Longman DE, Aggarwal SK. Effect of nozzle orifice geometry on
spray, combustion, and emission characteristics under diesel engine conditions. Fuel
2011;90:1267–76. doi:10.1016/j.fuel.2010.10.048.
[3] Payri R, García JM, Salvador FJ, Gimeno J. Using spray momentum flux measurements
to understand the influence of diesel nozzle geometry on spray characteristics. Fuel
2005;84:551–61. doi:10.1016/j.fuel.2004.10.009.
[4] Payri F, Bermúdez V, Payri R, Salvador FJ. The influence of cavitation on the internal
flow and the spray characteristics in diesel injection nozzles. Fuel 2004;83:419–31.
doi:10.1016/j.fuel.2003.09.010.
[5] Faeth G., Hsiang L-P, Wu P-K. Structure and breakup properties of sprays. Int J Multiph
Flow 1995;21:99–127. doi:10.1016/0301-9322(95)00059-7.
[6] Reitz RD. Mechanism of atomization of a liquid jet. Phys Fluids 1982;25:1730.
doi:10.1063/1.863650.
[7] Arcoumanis C, Gavaises M, French B. Effect of Fuel Injection Processes on the Structure
of Diesel Sprays, 1997. doi:10.4271/970799.
[8] Gavaises M, Arcoumanis C, Theodorakakos A, Bergeles G. Structure of high-pressure
diesel sprays, 2001. doi:10.4271/2001-24-0009.
[9] Reitz RD. Modeling atomization processes in high-pressure vaporizing sprays. At Spray
Technol 1987;3:309–37.
[10] Reitz RD. Atomization and other breakup regimes of a liquid jet. PhD Thesis Princet
Univ, NJ 1978.
[11] In EU zur S, Transparenten verdampfenden und nicht verdampfenden B unter,
Hochdruck. Experimentelle Untersuchung zur Spraystruktur in transparenten,
verdampfenden und nicht verdampfenden Brennstoffstrahlen unter Hochdruck.
Experimentelle Untersuchung zur Spraystruktur in transparenten, verdampfenden und
Zvonimir Petranović PhD Thesis
Faculty of Mechanical Engineering and Naval Architecture 132
nicht verdampfenden Brennstoffstrahlen unter Hochdruck, 2003.
[12] Rotondi R, Bella G, Grimaldi C, Postrioti L. Atomization of High-Pressure Diesel Spray:
Experimental Validation of a New Breakup Model, 2001. doi:10.4271/2001-01-1070.
[13] Pilch M, Erdman CA. Use of breakup time data and velocity history data to predict the
maximum size of stable fragments for acceleration-induced breakup of a liquid drop. Int
J Multiph Flow 1987;13:741–57. doi:10.1016/0301-9322(87)90063-2.
[14] Bower G, Chang SK, Corradini ML, El-Beshbeeshy M, Martin JK, Krueger J. Physical
Mechanisms for Atomization of a Jet Spray: A Comparison of Models and Experiments,
1988. doi:10.4271/881318.
[15] Hiroyasu H, Arai M. Structures of Fuel Sprays in Diesel Engines. 1990.
doi:10.4271/900475.
[16] Dent JC. A Basis for the Comparison of Various Experimental Methods for Studying
Spray Penetration. 1971. doi:10.4271/710571.
[17] Delacourt E, Desmet B, Besson B. Characterisation of very high pressure diesel sprays
using digital imaging techniques. Fuel 2005;84:859–67. doi:10.1016/j.fuel.2004.12.003.
[18] Sovani S., Chou E, Sojka P., Gore J., Eckerle W., Crofts J. High pressure effervescent
atomization: effect of ambient pressure on spray cone angle. Fuel 2001;80:427–35.
doi:10.1016/S0016-2361(00)00105-8.
[19] Pickett L. Engine Combustion Network 2014. http://www.sandia.gov/ecn/.
[20] Semião V, Andrade P, Carvalho M da G. Spray characterization: Numerical prediction
of Sauter mean diameter and droplet size distribution. Fuel 1996;75:1707–14.
doi:10.1016/S0016-2361(96)00163-9.
[21] Luo Y, Zhu L, Fang J, Zhuang Z, Guan C, Xia C, et al. Size distribution, chemical
composition and oxidation reactivity of particulate matter from gasoline direct injection
(GDI) engine fueled with ethanol-gasoline fuel. Appl Therm Eng 2015;89:647–55.
doi:10.1016/j.applthermaleng.2015.06.060.
[22] Chen P-C, Wang W-C, Roberts WL, Fang T. Spray and atomization of diesel fuel and
its alternatives from a single-hole injector using a common rail fuel injection system.
Fuel 2013;103:850–61. doi:10.1016/j.fuel.2012.08.013.
Zvonimir Petranović PhD Thesis
Faculty of Mechanical Engineering and Naval Architecture 133
[23] Suh HK, Lee CS. Effect of cavitation in nozzle orifice on the diesel fuel atomization
characteristics. Int J Heat Fluid Flow 2008;29:1001–9.
doi:10.1016/j.ijheatfluidflow.2008.03.014.
[24] Suh HK, Roh HG, Lee CS. Spray and Combustion Characteristics of Biodiesel∕Diesel
Blended Fuel in a Direct Injection Common-Rail Diesel Engine. J Eng Gas Turbines
Power 2008;130:32807. doi:10.1115/1.2835354.
[25] Labs J, Parker T. Two-dimensional droplet size and volume fraction distributions from
the near-injector region of high-pressure diesel sprays. At Sprays 2006;16:843–56.
doi:10.1615/AtomizSpr.v16.i7.90.
[26] Faeth GM. Current status of droplet and liquid combustion 1977;3. doi:10.1016/0360-
1285(77)90012-0.
[27] Taseska V, Markovska N, Causevski A, Bosevski T, Pop-Jordanov J. Greenhouse gases
(GHG) emissions reduction in a power system predominantly based on lignite. Energy
2011;36:2266–70. doi:10.1016/j.energy.2010.04.010.
[28] Mathiesen BV, Lund H, Karlsson K. 100% Renewable energy systems, climate
mitigation and economic growth. Appl Energy 2011;88:488–501.
doi:10.1016/j.apenergy.2010.03.001.
[29] International Energy Agency. CO2 Emissions from fuel Combustion. vol. S/V. 2012.
doi:10.1787/co2-table-2011-1-en.
[30] Khair KM, Majewski WA. Diesel Emissions and Their Control. SAE International;
2006.
[31] Correa SM, Smooke MD. Nox in parametrically varied methane flames. Symp Combust
1991;23:289–95. doi:10.1016/S0082-0784(06)80272-9.
[32] Vujanović M. Numerical Modelling of Multiphase Flow in Combustion of Liquid Fuel,
Doctoral Thesis. Zagreb: 2010.
[33] Zeldovich YB, Sadovnikov YP, Frank-Kamenetskii D. a. Oxidation of nitrogen in
combustion. Academy of Sciences of USSR, Institute of Chemical Physics, Moscow-
Leningrad.; 1947.
[34] Matti Maricq M. Chemical characterization of particulate emissions from diesel engines:
Zvonimir Petranović PhD Thesis
Faculty of Mechanical Engineering and Naval Architecture 134
A review. J Aerosol Sci 2007;38:1079–118. doi:10.1016/j.jaerosci.2007.08.001.
[35] Burtscher H. Physical characterization of particulate emissions from diesel engines: a
review. J Aerosol Sci 2005;36:896–932. doi:10.1016/j.jaerosci.2004.12.001.
[36] Choi CY, Reitz RD. An experimental study on the effects of oxygenated fuel blends and
multiple injection strategies on DI diesel engine emissions. Fuel 1999;78:1303–17.
doi:10.1016/S0016-2361(99)00058-7.
[37] Kong S-C, Reitz RD. Application of detailed chemistry and CFD for predicting direct
injection HCCI engine combustion and emissions. Proc Combust Inst 2002;29:663–9.
doi:10.1016/S1540-7489(02)80085-2.
[38] SAARIO A, REBOLA A, COELHO P, COSTA M, OKSANEN A. Heavy fuel oil
combustion in a cylindrical laboratory furnace: measurements and modeling. Fuel
2005;84:359–69. doi:10.1016/j.fuel.2004.10.002.
[39] Sun Z-Y, Li G-X, Chen C, Yu Y-S, Gao G-X. Numerical investigation on effects of
nozzle’s geometric parameters on the flow and the cavitation characteristics within
injector’s nozzle for a high-pressure common-rail DI diesel engine. Energy Convers
Manag 2015;89:843–61. doi:10.1016/j.enconman.2014.10.047.
[40] Dukowicz JK. A particle-fluid numerical model for liquid sprays. J Comput Phys
1980;35:229–53. doi:10.1016/0021-9991(80)90087-X.
[41] Gouesbet G, Berlemont A. Eulerian and Lagrangian approaches for predicting the
behaviour of discrete particles in turbulent flows. Prog Energy Combust Sci
1999;25:133–59. doi:10.1016/S0360-1285(98)00018-5.
[42] Loth E. Numerical approaches for motion of dispersed particles, droplets and bubbles.
Prog Energy Combust Sci 2000;26:161–223. doi:10.1016/S0360-1285(99)00013-1.
[43] Chen X-Q, Pereira JCF. Stochastic-probabilistic efficiency enhanced dispersion
modeling of turbulent polydispersed sprays. J Propuls Power 1996;12:760–9.
doi:10.2514/3.24099.
[44] IYER V, ABRAHAM J. Penetration and Dispersion of Transient Gas Jets and Sprays.
Combust Sci Technol 1997;130:315–34. doi:10.1080/00102209708935747.
[45] Jiang X, Siamas GA, Jagus K, Karayiannis TG. Physical modelling and advanced
Zvonimir Petranović PhD Thesis
Faculty of Mechanical Engineering and Naval Architecture 135
simulations of gas–liquid two-phase jet flows in atomization and sprays. Prog Energy
Combust Sci 2010;36:131–67. doi:10.1016/j.pecs.2009.09.002.
[46] Hallmann M, Scheurlen M, Wittig S. Computation of Turbulent Evaporating Sprays:
Eulerian Versus Lagrangian Approach. J Eng Gas Turbines Power 1995;117:112.
doi:10.1115/1.2812758.
[47] Subramaniam S. Lagrangian–Eulerian methods for multiphase flows. Prog Energy
Combust Sci 2013;39:215–45. doi:10.1016/j.pecs.2012.10.003.
[48] Ménard T, Tanguy S, Berlemont A. Coupling level set/VOF/ghost fluid methods:
Validation and application to 3D simulation of the primary break-up of a liquid jet. Int J
Multiph Flow 2007;33:510–24. doi:10.1016/j.ijmultiphaseflow.2006.11.001.
[49] Shinjo J, Umemura A. Detailed simulation of primary atomization mechanisms in Diesel
jet sprays (isolated identification of liquid jet tip effects). Proc Combust Inst
2011;33:2089–97. doi:10.1016/j.proci.2010.07.006.
[50] Herrmann M. on Simulating Primary Atomization Using the Refined Level Set Grid
Method. At Sprays 2011;21:283–301. doi:10.1615/AtomizSpr.2011002760.
[51] Martin Sommerfeld, Berend van Wachem RO, editor. Best Practice Guidelines for
Computational Fluid Dynamics of Dispersed Multiphase Flows. vol. 8. 2008.
[52] Harlow FH, Amsden AA. Numerical calculation of multiphase fluid flow. J Comput
Phys 1975;17:19–52. doi:10.1016/0021-9991(75)90061-3.
[53] Iyer VA, Abraham J, Magi V. Exploring injected droplet size effects on steady liquid
penetration in a Diesel spray with a two-fluid model. Int J Heat Mass Transf
2002;45:519–31. doi:10.1016/S0017-9310(01)00168-5.
[54] Issa R., Oliveira P. Numerical prediction of phase separation in two-phase flow through
T-junctions. Comput Fluids 1994;23:347–72. doi:10.1016/0045-7930(94)90045-0.
[55] Behzadi A, Issa RI, Rusche H. Modelling of dispersed bubble and droplet flow at high
phase fractions. Chem Eng Sci 2004;59:759–70. doi:10.1016/j.ces.2003.11.018.
[56] FIRE manual 2013. Graz: 2013.
[57] von Berg E, Edelbauer W, Alajbegovic A, Tatschl R, Volmajer M, Kegl B, et al. Coupled
Simulations of Nozzle Flow, Primary Fuel Jet Breakup, and Spray Formation. J Eng Gas
Zvonimir Petranović PhD Thesis
Faculty of Mechanical Engineering and Naval Architecture 136
Turbines Power 2005;127:897. doi:10.1115/1.1914803.
[58] Edelbauer W, Suzzi D, Sampl P, Tatschl R, Krueger C, Weigand B. New Concept for
on-Line Coupling of 3D Eulerian and Lagrangian Spray Approaches in Engine
Simulations. Iclass-2006 2006.
[59] Edelbauer W. Coupling of 3D Eulerian and Lagrangian spray approaches in industrial
combustion engine simulations. J Energy Power Eng 2014;8:190–200.
doi:10.17265/1934-8975/2014.01.022.
[60] Vujanović M, Petranović Z, Edelbauer W, Duić N. Modelling spray and combustion
processes in diesel engine by using the coupled Eulerian–Eulerian and Eulerian–
Lagrangian method. Energy Convers Manag 2016.
doi:10.1016/j.enconman.2016.03.072.
[61] Vallet A, Burluka AA, Borghi R. Development of a Eulerian Model for the
“Atomization” of a Liquid Jet. At Sprays 2001;11:24. doi:10.1615/AtomizSpr.v11.i6.20.
[62] De Luca M, Vallet A, Borghi R. Pesticide Atomization Modeling for Hollow-Cone
Nozzle. At Sprays 2009;19:741–53. doi:10.1615/AtomizSpr.v19.i8.30.
[63] Ning W, Reitz RD, Diwakar R, Lippert AM. An Eulerian-Lagrangian Spray and
Atomization Model With Improved Turbulence Modeling. At Sprays 2009;19:727–39.
doi:10.1615/AtomizSpr.v19.i8.20.
[64] Collazo J, Porteiro J, Patiño D, Miguez JL, Granada E, Moran J. Simulation and
experimental validation of a methanol burner. Fuel 2009;88:326–34.
doi:10.1016/j.fuel.2008.09.003.
[65] Gutheil E. Numerical investigation of the ignition of dilute fuel sprays including detailed
chemistry. Combust Flame 1993;93:239–54. doi:10.1016/0010-2180(93)90106-D.
[66] Ge H-W, Gutheil E. Simulation of a turbulent spray flame using coupled PDF gas phase
and spray flamelet modeling. Combust Flame 2008;153:173–85.
doi:10.1016/j.combustflame.2007.10.019.
[67] Düwel I, Ge H-W, Kronemayer H, Dibble R, Gutheil E, Schulz C, et al. Experimental
and numerical characterization of a turbulent spray flame. Proc Combust Inst
2007;31:2247–55. doi:10.1016/j.proci.2006.07.111.
Zvonimir Petranović PhD Thesis
Faculty of Mechanical Engineering and Naval Architecture 137
[68] Zhu S, Roekaerts D, Meer T Van Der. Numerical study of a methanol spray flame.
Seventh Mediterr. Combust. Symp., 2011, p. 1–8.
[69] Shuai S, Abani N, Yoshikawa T, Reitz RD, Park SW. Evaluation of the effects of
injection timing and rate-shape on diesel low temperature combustion using advanced
CFD modeling. Fuel 2009;88:1235–44. doi:10.1016/j.fuel.2009.01.012.
[70] Petranović Z, Vujanović M, Duić N. Towards a more sustainable transport sector by
numerically simulating fuel spray and pollutant formation in diesel engines. J Clean Prod
2014. doi:10.1016/j.jclepro.2014.09.004.
[71] Huang Y, Hong G, Huang R. Numerical investigation to the dual-fuel spray combustion
process in an ethanol direct injection plus gasoline port injection (EDI+GPI) engine.
Energy Convers Manag 2015;92:275–86. doi:10.1016/j.enconman.2014.12.064.
[72] Guo Y. A pure Eulerian model for simulating dilute spray combustion. Fuel
2002;81:2131–44. doi:10.1016/S0016-2361(02)00140-0.
[73] Beck JC, Watkins AP. Simulation of Water and Other Non-Fuel Sprays Using a New
Spray Model. At Sprays 2003;13:1–26. doi:10.1615/AtomizSpr.v13.i1.10.
[74] Dhuchakallaya I, Watkins AP. Application of spray combustion simulation in DI diesel
engine. Appl Energy 2010;87:1427–32. doi:10.1016/j.apenergy.2009.08.029.
[75] Martinez L, Benkenida A, Cuenot B. A model for the injection boundary conditions in
the context of 3D simulation of Diesel Spray: Methodology and validation. Fuel
2010;89:219–28. doi:10.1016/j.fuel.2009.06.012.
[76] Xue Q, Battistoni M, Powell CF, Longman DE, Quan SP, Pomraning E, et al. An
Eulerian CFD model and X-ray radiography for coupled nozzle flow and spray in internal
combustion engines. Int J Multiph Flow 2015;70:77–88.
doi:10.1016/j.ijmultiphaseflow.2014.11.012.
[77] Bekdemir C, Somers LMT, de Goey LPH, Tillou J, Angelberger C. Predicting diesel
combustion characteristics with Large-Eddy Simulations including tabulated chemical
kinetics. Proc Combust Inst 2013;34:3067–74. doi:10.1016/j.proci.2012.06.160.
[78] Boileau M, Pascaud S, Riber E, Cuenot B, Gicquel LYM, Poinsot TJ, et al. Investigation
of Two-Fluid Methods for Large Eddy Simulation of Spray Combustion in Gas Turbines.
Flow, Turbul Combust 2007;80:291–321. doi:10.1007/s10494-007-9123-1.
Zvonimir Petranović PhD Thesis
Faculty of Mechanical Engineering and Naval Architecture 138
[79] Chrigui M, Gounder J, Sadiki A, Masri AR, Janicka J. Partially premixed reacting
acetone spray using LES and FGM tabulated chemistry. Combust Flame
2012;159:2718–41. doi:10.1016/j.combustflame.2012.03.009.
[80] A. Kronenburg. Spray Combustion – A Fresh Perspective. In: University of Sydney,
editor. Proc. Aust. Combust. Symp., Sydney: University of Sydney; 2007.
[81] Launder BE, Spalding DB. The numerical computation of turbulent flows. Comput
Methods Appl Mech Eng 1974;3:269–89. doi:10.1016/0045-7825(74)90029-2.
[82] Lee SL, Lahey RT, Jones OC. The Prediction of Two-Phase Turbulence and Phase
Distribution Phenomena Using a K-κ Model. JAPANESE J Multiph FLOW 1989;3:335–
68. doi:10.3811/jjmf.3.335.
[83] Hanjalić K, Popovac M, Hadžiabdić M. A robust near-wall elliptic-relaxation eddy-
viscosity turbulence model for CFD. Int J Heat Fluid Flow 2004;25:1047–51.
doi:10.1016/j.ijheatfluidflow.2004.07.005.
[84] Popovac M, Hanjalic K. Compound Wall Treatment for RANS Computation of Complex
Turbulent Flows and Heat Transfer. Flow, Turbul Combust 2007;78:177–202.
doi:10.1007/s10494-006-9067-x.
[85] Durbin PA. Near-wall turbulence closure modeling without “damping functions.” Theor
Comput Fluid Dyn n.d.;3:1–13. doi:10.1007/BF00271513.
[86] Hinze JO. Fundamentals of the hydrodynamic mechanism of splitting in dispersion
processes. AIChE J 1955;1:289–95. doi:10.1002/aic.690010303.
[87] Drew DA. Mathematical Modeling of Two-Phase Flow. 1982.
[88] Huh, K Y and Gosman AD. A phenomenological model of Diesel spray atomisation. Int
Conf, Multiph. Flows, Tsukuba, Japan: 1991.
[89] Bianchi GM, Pelloni P. Modeling the Diesel Fuel Spray Breakup by Using a Hybrid
Model. 1999. doi:10.4271/1999-01-0226.
[90] O’Rourke PJ. Statistical properties and numerical implementation of a model for droplet
dispersion in a turbulent gas. J Comput Phys 1989;83:345–60. doi:10.1016/0021-
9991(89)90123-X.
[91] Post SL, Abraham J. Modeling the outcome of drop–drop collisions in Diesel sprays. Int
Zvonimir Petranović PhD Thesis
Faculty of Mechanical Engineering and Naval Architecture 139
J Multiph Flow 2002;28:997–1019. doi:10.1016/S0301-9322(02)00007-1.
[92] JSTOR: Proceedings of the Royal Society of London. Series A, Mathematical and
Physical Sciences, Vol. 326, No. 1566 (Jan. 25, 1972), pp. 393-408 n.d.
http://www.jstor.org/discover/10.2307/78012?uid=3738200&uid=2&uid=4&sid=2110
4439754933 (accessed July 8, 2014).
[93] Abramzon B, Sirignano WA. Droplet vaporization model for spray combustion
calculations. Int J Heat Mass Transf 1989;32:1605–18. doi:10.1016/0017-
9310(89)90043-4.
[94] Clift, R., Grace, J.R., Weber ME. Bubbles, Drops and Particles. vol. 94. New York: New
York ; London : Academic Press, 1978.; 1978. doi:10.1017/S0022112079221290.
[95] YUEN MC, CHEN LW. On Drag of Evaporating Liquid Droplets. Combust Sci Technol
1976;14:147–54. doi:10.1080/00102207608547524.
[96] Batchelor GK. An Introduction to Fluid Dynamics. Cambridge: Cambridge University
Press; 2000. doi:10.1017/CBO9780511800955.
[97] Liu AB, Mather D, Reitz RD. Modeling the Effects of Drop Drag and Breakup on Fuel
Sprays. 1993. doi:10.4271/930072.
[98] Schiller L, Naumann Z. A drag coefficient correlation. ZVerDeutschIng 1933;77:318–
20. doi:10.1016/j.ijheatmasstransfer.2009.02.006.
[99] O’Rourke P, Amsden A. The TAB Method for Numerical Calculation of Spray Droplet
Breakup. SAE Tech. Pap., 1987, p. 872089. doi:10.4271/872089.
[100] Sarathy SM, Westbrook CK, Mehl M, Pitz WJ, Togbe C, Dagaut P, et al. Comprehensive
chemical kinetic modeling of the oxidation of 2-methylalkanes from C7 to C20. Combust
Flame 2011;158:2338–57. doi:10.1016/j.combustflame.2011.05.007.
[101] Luo Z, Som S, Sarathy SM, Plomer M, Pitz WJ, Longman DE, et al. Development and
validation of an n-dodecane skeletal mechanism for spray combustion applications.
Combust Theory Model 2014;18:187–203. doi:10.1080/13647830.2013.872807.
[102] Lebas R, Menard T, Beau PA, Berlemont A, Demoulin FX. Numerical simulation of
primary break-up and atomization: DNS and modelling study. Int J Multiph Flow
2009;35:247–60. doi:10.1016/j.ijmultiphaseflow.2008.11.005.
Zvonimir Petranović PhD Thesis
Faculty of Mechanical Engineering and Naval Architecture 140
[103] Kadocsa A. Modeling of Spray Formation in Diesel Engines. BUDAPEST
UNIVERSITY OF TECHNOLOGY AND ECONOMICS, 2007.
[104] Smallwood G, Gulder O. Views on the structure of transient diesel sprays. At Sprays
2000;10:355–86. doi:10.1615/AtomizSpr.v10.i3-5.70.
[105] Fuel/Engine Interactions n.d. http://books.sae.org/r-409/ (accessed April 28, 2015).
[106] Petranović Z, Edelbauer W, Vujanović M, Duić N. Modelling of spray and combustion
processes by using the Eulerian multiphase approach and detailed chemical kinetics. Fuel
2017;191:25–35. doi:10.1016/j.fuel.2016.11.051.
[107] Su L, Li X, Zhang Z, Liu F. Numerical analysis on the combustion and emission
characteristics of forced swirl combustion system for DI diesel engines. Energy Convers
Manag 2014;86:20–7. doi:10.1016/j.enconman.2014.05.023.
[108] Wei S, Wang F, Leng X, Liu X, Ji K. Numerical analysis on the effect of swirl ratios on
swirl chamber combustion system of DI diesel engines. Energy Convers Manag
2013;75:184–90. doi:10.1016/j.enconman.2013.05.044.
[109] Reitz R. Development and testing of diesel engine CFD models. Prog Energy Combust
Sci 1995;21:173–96. doi:10.1016/0360-1285(95)00003-Z.
[110] Naber J, Siebers DL. Effects of Gas Density and Vaporization on Penetration and
Dispersion of Diesel Sprays, 1996. doi:10.4271/960034.
[111] Siebers DL. Scaling Liquid-Phase Fuel Penetration in Diesel Sprays Based on Mixing-
Limited Vaporization, 1999. doi:10.4271/1999-01-0528.
[112] Idicheria C a, Pickett LM. Quantitative Mixing Measurements in a Vaporizing Diesel
Spray by Rayleigh Imaging. SAE Int J Engines 2007;1:776–90. doi:10.4271/2007-01-
0647.
[113] Pickett LM, Kook S, Williams TC. Visualization of Diesel Spray Penetration , Cool-
Flame , Ignition , High- Temperature Combustion , and Soot Formation Using High-
Speed Imaging. SAE Int J Engines 2009;2:439–59. doi:10.4271/2009-01-0658.
[114] Pickett LM, Manin J, Genzale CL, Siebers DL, Musculus MPB, Idicheria C a.
Relationship Between Diesel Fuel Spray Vapor Penetration/Dispersion and Local Fuel
Mixture Fraction. SAE Int J Engines 2011;4:764–99. doi:10.4271/2011-01-0686.
Zvonimir Petranović PhD Thesis
Faculty of Mechanical Engineering and Naval Architecture 141
[115] Pickett LM, Genzale CL, Bruneaux G, Malbec L-M, Hermant L, Christiansen C, et al.
Comparison of Diesel Spray Combustion in Different High-Temperature, High-Pressure
Facilities. SAE Int J Engines 2010;3:156–81. doi:10.4271/2010-01-2106.
[116] Pickett, L.M., Genzale, C.L., Manin, J., Malbec, L.-M. and Hermant L. Measurement
Uncertainty of Liquid Penetration in Evaporating Diesel Sprays. ILASS-Americas,
Ventura, California: 2011, p. Paper No. 2011-111.
[117] Petranović Z, Edelbauer W, Vujanović M DN. The O’Rourke droplet collision model
for the Euler–Eulerian framework. Proc. 26th Conf. Liq. At. Spray Syst., 2014.
[118] Vujanović M, Petranović Z, Edelbauer W, Baleta J, Duić N. Numerical modelling of
diesel spray using the Eulerian multiphase approach. Energy Convers Manag 2015.
doi:10.1016/j.enconman.2015.03.040.
Zvonimir Petranović PhD Thesis
Faculty of Mechanical Engineering and Naval Architecture 142
CURRICULUM VITAE
Zvonimir Petranović was born on July 15th in 1986 in town of Koprivnica, Republic of
Croatia. He finished the elementary school in his hometown of Križevci, Republic of Croatia.
He attended and finished Air technician high school Rudolf Perešin in Zagreb, Republic of
Croatia. He was enrolled in the Department of Mechanical Engineering and Naval Architecture
at University of Zagreb in 2005 where he completed his master’s degree in 2012. His Master
thesis entitled “Numerical simulations of spray process during high pressure fuel injection into
diesel engine” was done in cooperation with AVL List GmbH, Advanced Simulation
Technologies, Graz, Austria. In September 2012 he was enrolled in the doctoral program as a
research assistant on the Process and Energy Engineering chair, Faculty of Mechanical
Engineering and Naval Architecture, University of Zagreb. The proposed title of his PhD thesis
is “Numerical modelling of spray and combustion processes using the Euler Eulerian
multiphase approach”. He gained knowledge in numerical simulations, advanced use of the
CFD code FIRE®, programing of the user defined functions and compiling with the existing
code, numerical simulations of IC engines, etc. He contributed to the CFD code FIRE® through:
parameterization of spray atomization models; modification and implementation of the
O'Rourke collision model for the Eulerian size – of – classes spray model; validation and
enhancement of the WAVE secondary breakup model; enhancement and development of the
Spray-Nozzle interface for MPI simulations; enhancement and development of mesh
independency for the Spray-Nozzle interface; implementation of Homogenous gas phase
reactions for multiphase simulations and Nozzle interface for ELSA simulations; development
of inlet boundary condition from the rate of injection diagram. All of his work is currently
available for industry through the modified AVL FIRE’s graphical user interface.
During his stay at the University of Zagreb he was a teaching as assistant for several
courses such as Numerical modelling of combustion and radiation processes, Numerical
modelling in aeronautics 2, and Numerical methods in continuum mechanics. He was a
corresponding person for several student seminars regarding the numerical simulations of
internal combustion engines. Currently, he is one of the corresponding persons for two BSc
thesis regarding the injector flow and non-reactive spray process.
During his scientific work he was involved in an international project financed by AVL-
AST GmbH entitled “Numerical modelling of combustion processes and formation of pollutant
emissions”. The results of his scientific research were published in 5 CC indexed international
journals and he published dozen of research papers on internationally recognized conferences

Zvonimir Petranović PhD Thesis
Faculty of Mechanical Engineering and Naval Architecture 143
(more information can be found on website: https://bib.irb.hr/lista-radova?autor=335816). He
is a reviewer in several scientific papers for the respected international Journals such as: Energy
Conversion and Management, Applied Thermal Engineering, International Communications in
Heat and Mass Transfer and International Journal of Heat and Fluid Flow, International Journal
of Spray and Combustion Dynamics, and SAE World Congress 2017.
Since 2013 as the member of the Local organizing Committee he helps with organization of
several conferences in the series of “Conference on sustainable development of energy, water
and environment systems (SDEWES)”. Since 2013 he is a member of the Faculty Council and
a member of the student Council. Since 2014 he is the member of the Croatian section of the
Combustion Institute. Since 2015 he is the vice president of the student Council, member of the
Committee for e-learning and member of the Faculty disciplinary Committee.
He is a winner of international award “Paul Eisenklam Travel Awards for Young
Researchers” given by the ILASS-EUROPE for year 2016. He finished his master study with
Magna Cum Laude award given for excellent grades. He is a winner of Student Scholarship
from National foundation for the support of student living standard in 2011.
He has good English language knowledge, both spoken and written. He has basic
German language knowledge.
Zvonimir Petranović PhD Thesis
Faculty of Mechanical Engineering and Naval Architecture 144
ŽIVOTOPIS
Zvonimir Petranović rođen je 15. srpnja 1986. godine u Koprivnici, Republika Hrvatska.
Završio je osnovnu školu Vladimira Nazora u Križevcima. Nakon završetka osnovne škole
2001. godine upisao je srednju zrakoplovnu školu Rudolf Perešin u Zagrebu. Nakon završetka
srednje škole 2005. godine upisao je fakultet strojarstva i brodogradnje Sveučilišta u Zagrebu.
Diplomirao je s pohvalom za visoki prosjek na procesno energetskom smjeru, usmjerenje
energetika 2012 godine obranivši diplomski rad pod nazivom “Računalna simulacija stvaranja
spreja prilikom visokotlačnog ubrizgavanja goriva u dizel motor”. Rad je financiran i izrađen u
suradnji s tvrtkom AVL List GmbH Graz, Republika Austrija. U rujnu 2012 upisao je
poslijediplomski doktorski studij na Fakultetu strojarstva i brodogradnje Sveučilišta u Zagrebu,
procesno energetsko usmjerenje. Predložena tema doktorskog rada pod nazivom “Numerical
modelling of spray and combustion processes using the Euler Eulerian multiphase approach”
obranjena je u studenom 2015. godine. Tijekom izrade doktorskog rada i boravka na
poslijediplomskom studiju stekao je napredna znanja u numeričkim simulacijama, korištenju
računalnog programa dinamike fluida AVL FIRE®, objektnog programiranja, itd. Njegov rad
direktno je odražen na industriju jer je prilikom rada implementirao i unaprijedio nekoliko
modela unutar računalnog programa FIRE® kao što su: parametrizacija modela raspadanja
goriva prilikom visokotlačnog ubrizgavanja, implementacija O’Rourke modela sudaranja
kapljica za Eulerovo sučelje, validacija i unaprjeđenje sekundarnog modela raspadanja za
Eulerovo sučelje, unaprijeđene sučelja koje se koristi za preslikavanje podataka dobivenih
računalnom simulacijom kroz sapnicu na ulaznu selekciju simulacije spreja, unaprjeđenje
takvog sučelja za višeprocesorsko računanje, implementacija modula za računanje kemijskih
reakcija odnosno procesa izgaranja za Eulerov višefazni pristup, razvoj sučelja sapnica-sprej za
ELSA simulacije.
Prilikom svog boravka na Fakultetu strojarstva i brodogradnje držao je vježbe na nekoliko
predmeta kao što su modeliranje izgaranja i zračenja, numeričke metode u mehanici
kontinuuma te numeričke metode u zrakoplovstvu 2. Bio je jedna od odgovornih osoba za
vođenje nekoliko desetaka seminarskih radova u području numeričkih simulacija motora s
unutarnjim izgaranjem. Bio je jedna od odgovornih osoba za dva završna rada u području
strujanja fluida kroz sapnice malog promjera te pojave procesa spreja prilikom visokotlačnog
ubrizgavanja.
Prilikom svoga znanstveno-istraživačkog rada uključen je u međunarodni projekt
financiran od strane AVL AST d.o.o pod nazivom „Numeričko modeliranja procesa izgaranja
Zvonimir Petranović PhD Thesis
Faculty of Mechanical Engineering and Naval Architecture 145
i stvaranja štetnih emisija“. Rezultati njegova istraživanja objavljena su u 5 rada indeksirana u
CC/SCI bazama te u desetak istraživačkih radova objavljenih na međunarodno priznatim
konferencijama (više informacija može se pronaći na https://bib.irb.hr/lista-
radova?autor=335816). Trenutno je prijavljen kao evaluator u međunarodno priznatim
časopisima visokog faktora odjeka kao što Energy conversion and Management, Applied
Thermal Engineering, International Communications in Heat and Mass Transfer, International
Journal of Heat and Fluid Flow, International Journal of Spray and Combustion Dynamics, te
je bio evaluator za SAE Svjetski Kongres koji će se održati 2017. u Detroitu.
Od 2013. član je lokalne organizacijske skupine na SDEWES konferencijama „Conference
on sustainable development of energy, water and environment systems“. Od 2014. član je
Jadranske sekcije instituta za izgaranja. Od 2013. član je Fakultetskog vijeća Fakulteta
strojarstva i brodogradnje, Sveučilišta u Zagrebu. Od 2015. potpredsjednik je studentskog zbora
Fakulteta strojarstva i brodogradnje, Sveučilišta u Zagrebu, član je vijeća za e-učenje i član je
stegovnog suda.
Dobitnik je nagrade „Paul Eienklam Travel Awards for Young Researchers“ za 2016.
godinu koju dodjeljuje ILASS Europe (European Conference on Liquid Atomization and Spray
Systems). Za odličan uspjeh na diplomskom studiju Fakulteta strojarstva I brodogradnje u
Zagrebu, dobio je “Magna Cum Laude” pohvalu. Također, 2011. Godine dobio je
jednogodišnju stipendiju za porast studentskom standardu u kategoriji deficitarnih zanimanja.
Dobro koristi Engleski jezik, kako u pismu tako i u govoru. Ima osnovno znanje
Njemačkog jezika