Embed Size (px)
Citation preview

NSF GK-12 MAVS Project Lesson 6
GK-12 MAVS Fellow: Larrissa Owens
GK-12 MAVS Mentor Teacher: Daree Yancey
Title of Lesson: Exponential What?
Class: 7th
Grade Math Pre-Algebra
Topic: Exponential Growth and Decay
Objectives: Through the use of a penny activity to model a half-life trend, students will be able to better understand
scenarios that exhibit exponential growth or decay. Students will extend what they know about linear functions to this
new type of non-linear function. In a follow up activity graphing calculators will be used as a tool as students discover
how the base of an exponential function effects the graph, they will further be able to comment on y-intercepts,
domain, range, and be able to form a story to accurately describe what is occurring during exponential decay.
Standards TEKS: A.11C Analyze data and represent situations involving exponential growth and decay using concrete
models, tables, graphs, or algebraic methods, (A2. 11F) determine solutions of exponential and logarithmic equations
using graphs, tables, and algebraic methods; analyze a situation modeled by an exponential function, PC 3.B Use
functions such as exponential to model real life data.
Standards NCTM - 2. Algebra, 6. Problem Solving, 8. Communication, 9. Connections, 10. Representation.
Key vocabulary: Exponential growth and decay, apoptosis, y-intercept, half-life
Materials and Resources: Graphing Calculators, 50 Pennies (per group), PowerPoint, Penny Experiment worksheets,
Page 2 Penny Experiment Worksheet, Communicator sleeves, white board markers, communicator worksheet,
worksheet lesson 6b
Research Setting/Connection/Motivation: Cell apoptosis (death) and cell proliferation (cell splitting) both play
important roles in modeling that we do of cell population involved in immune response. Specifically the final graph that
the students will plot and investigate is an isolation of the cell death of macrophages from our actual model. Other than
the slight change to the starting value, the graph is accurate to what we work with as we investigate the effects of
immune response. The exponential decay has been observed in biology labs and is an agreed upon method for
mathematically modeling population growth (not only limited to cell populations).
Prior knowledge: Linear equations, y-intercept, domain, range, exponents
Vertical Strands: TEKS-A.11C Analyze data and represent situations involving exponential growth and decay using
concrete models, tables, graphs, or algebraic methods, (A2. 11F) determine solutions of exponential and logarithmic
equations using graphs, tables, and algebraic methods; analyze a situation modeled by an exponential function, PC 3.B
Use functions such as exponential to model real life data. College Algebra: exponential functions and affects of base
change of exponential function graphs. Statistics: knowledge of scatterplot and exponential regression functions.

Math Journal
Wednesday: Explain whether the following is
a function or is not a function:
Number of hours studied to the score on an
exam
Miles over the speed limit and amount of the
ticket.

Larrissa Owens Graduate Students, GK12 Fellow
Department of Mathematics, UTA


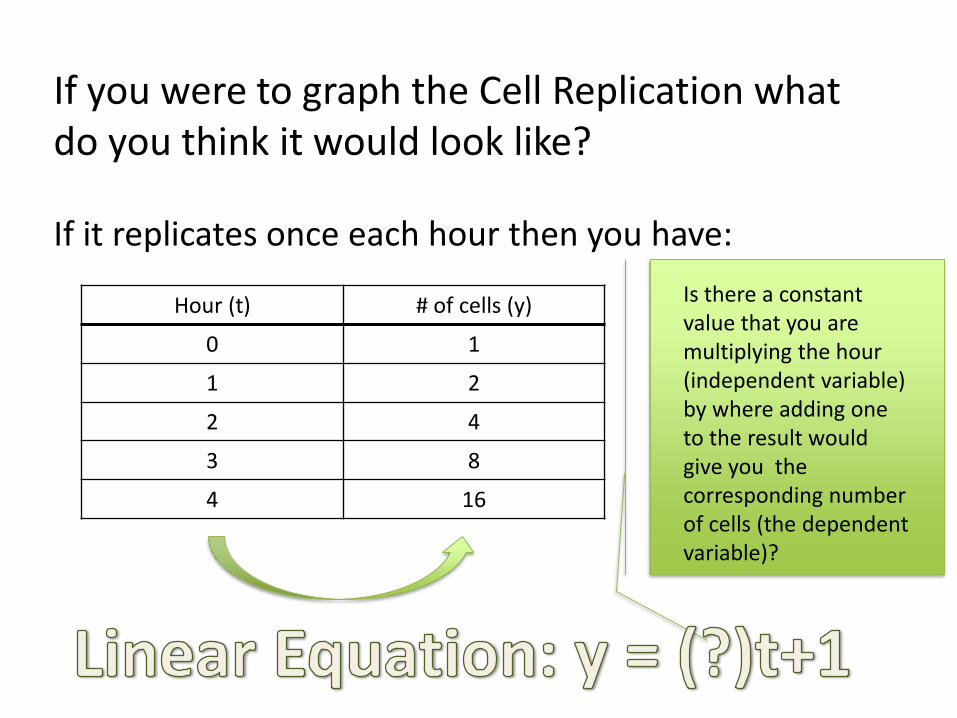
If you were to graph the Cell Replication what
do you think it would look like?
If it replicates once each hour then you have:
Hour (t) # of cells (y)
0 1
1 2
2 4
3 8
4 16
What is the y-intercept?
Is there a constant value
that you are multiplying
the hour (independent
variable) by where adding
one to the result would
give you the
corresponding number of
cells (the dependent
variable)?

If you were to graph the Cell Replication what
do you think it would look like?
If it replicates once each hour then you have:
Hour (t) # of cells (y)
0 1
1 2
2 4
3 8
4 16
On your communicator, give a quick sketch of what
you think the graph of the # of cells will look like over
time.
If you were to graph the Cell Replication what
do you think it would look like?
If it replicates once each hour then you have:
Hour (t) # of cells (y)
0 1
1 2
2 4
3 8
4 16
Is there a constant
value that you are
multiplying the hour
(independent variable)
by where adding one
to the result would
give you the
corresponding number
of cells (the dependent
variable)?

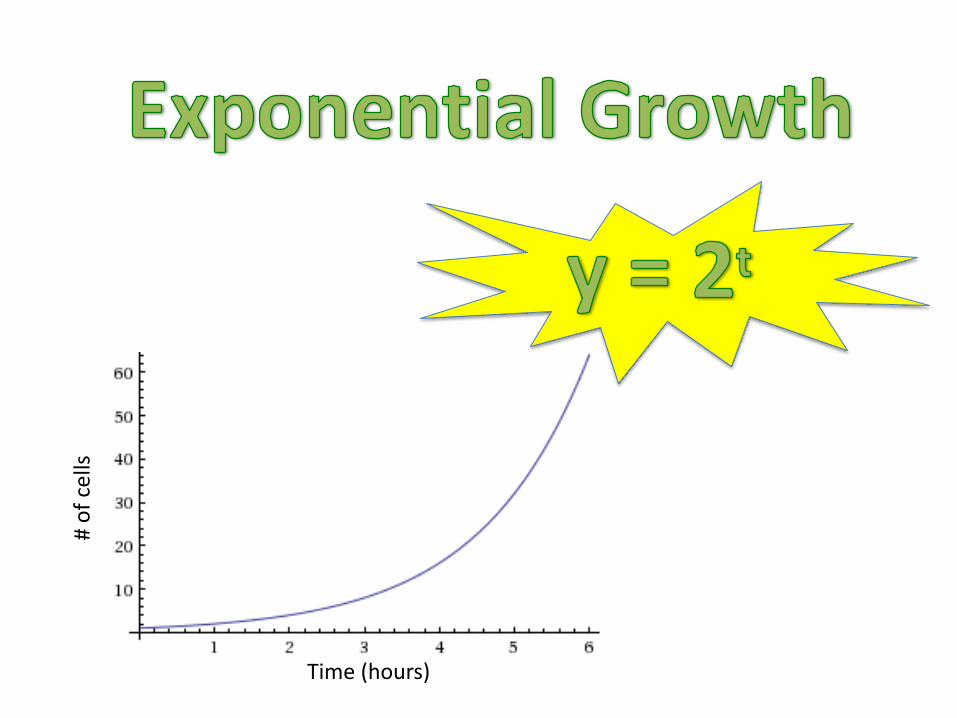
What do you think the equation of this graph
might involve? Do you see any pattern in the
column of cell amounts?
Hour (t) # of cells (y)
0 1
1 2
2 4
3 8
4 16

What do you think the equation of this graph
might involve? Do you see any pattern in the
column of cell amounts?
Hour (t) # of cells (y)
0 1 = 20
1 2 = 21
2 4 = 22
3 8 = 23
4 16 = 24
What is the value of a for our model of cell replication ?
What is the value of b for our model of cell replication?

What is the t referred to as in this equation?

What is the t referred to as in this equation?

What is the t referred to as in this equation?
What do you think they named
equations of this form as a result?

What is the t referred to as in this equation?
What do you think they named
equations of this form as a result?

Time (hours)
# o
f ce
lls

Pop Quiz
Assume: every minute a
cells splits to form 2 new
cells.
At 5pm you put one cell
into a box.
At 6pm the box first
reaches full capacity.
When was the box half full?

One Minute
Later

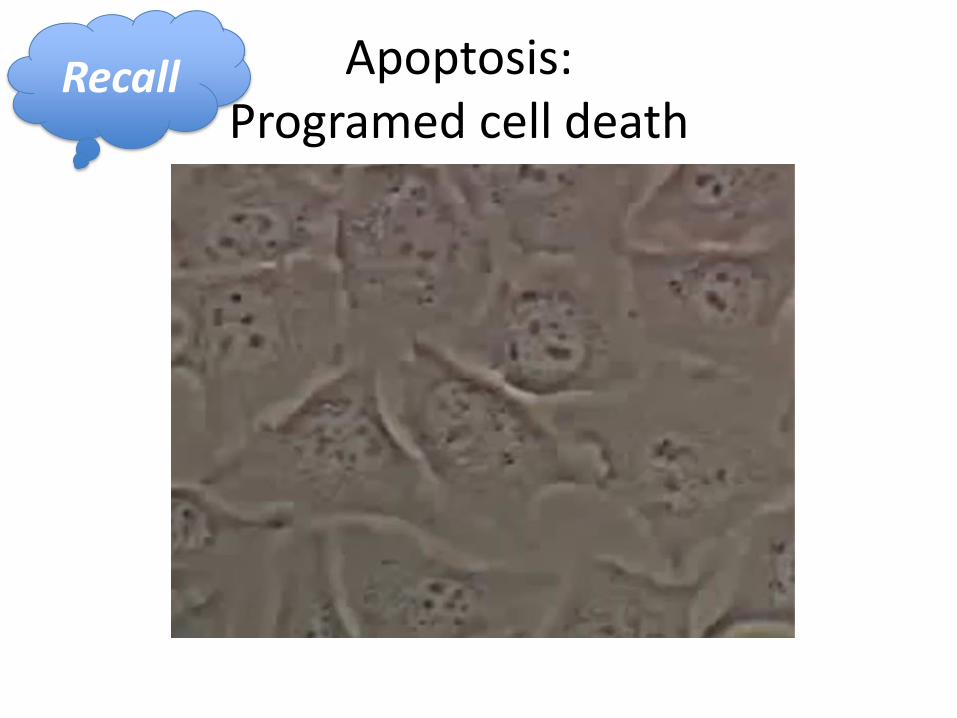
Apoptosis:
Programed cell death Recall

Half Life: Penny activity

What do you think the equation of this graph
might involve? Do you see any pattern in the
column of cell amounts?
Hour (t) # of cells (y)
0 16
1 8
2 4
3 2
4 1
What is the value of a for our model of cell replication ?
What is the value of b for our model of cell replication?
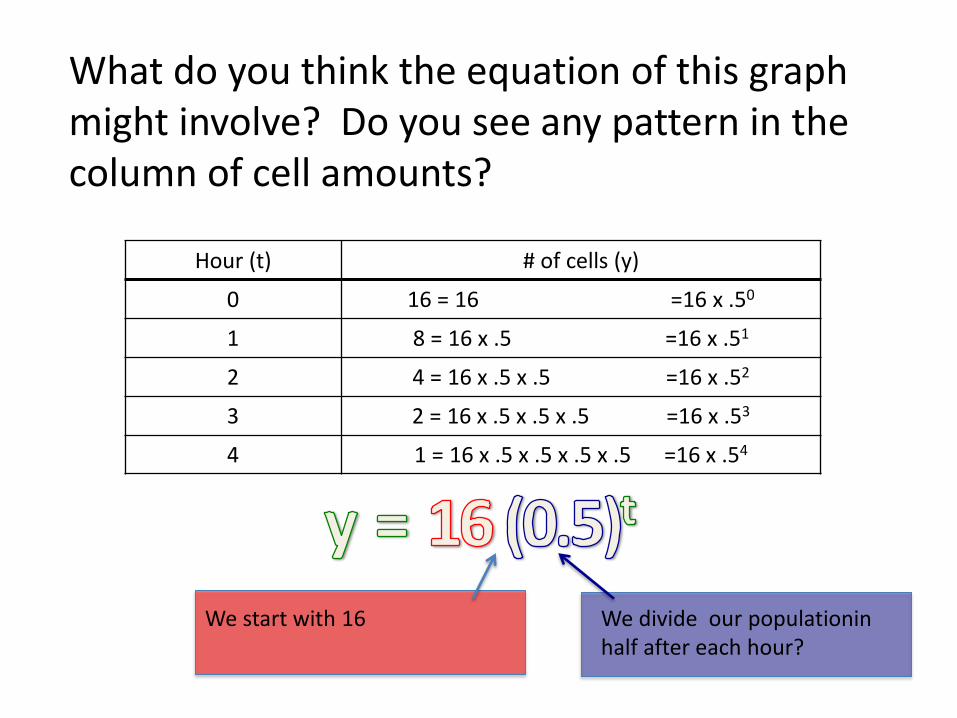
What do you think the equation of this graph
might involve? Do you see any pattern in the
column of cell amounts?
Hour (t) # of cells (y)
0 16 = 16 =16 x .50
1 8 = 16 x .5 =16 x .51
2 4 = 16 x .5 x .5 =16 x .52
3 2 = 16 x .5 x .5 x .5 =16 x .53
4 1 = 16 x .5 x .5 x .5 x .5 =16 x .54
We start with 16 We divide our populationin
half after each hour?

Clearing out your calculator:
• Press Y= and hit CLEAR
• Press 2nd and + then press 4
and enter . The screen Should
say Clr All Lists then Enter
one more time

els
ge
2
4
6 2 6 2
2 2 2 4 9 8
2 2 3 4 2
Isolating just the decay term of the macrophages:

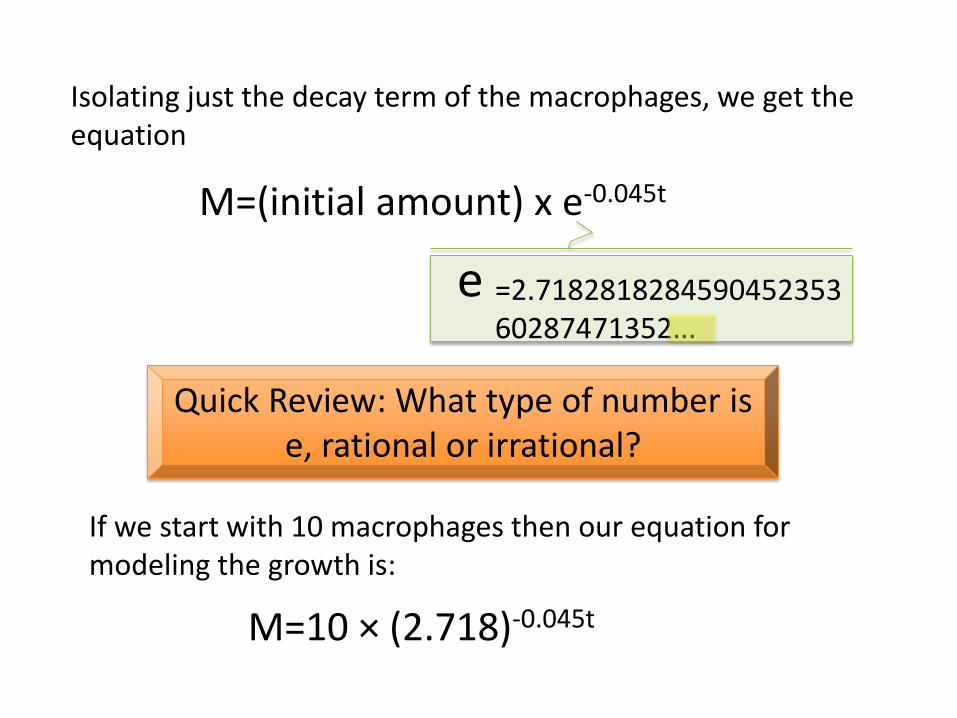
Isolating just the decay term of the macrophages, we get the
equation
=2.7182818284590452353
60287471352...
e
M=(initial amount) x e-0.045t
M=10 × (2.718)-0.045t
Quick Review: What type of number is
e, rational or irrational?
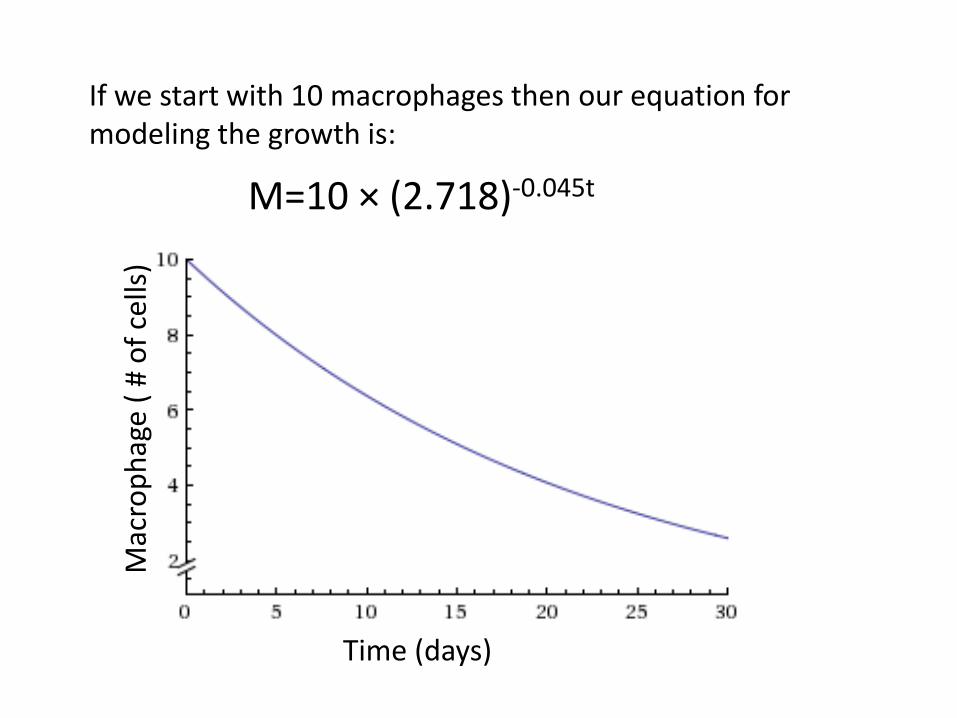
If we start with 10 macrophages then our equation for
modeling the growth is:

M=10 × (2.718)-0.045t
If we start with 10 macrophages then our equation for
modeling the growth is:
Time (days)
Ma
cro
ph
ag
e (
# o
f ce
lls)

Lesson Presentation:
1. Engage: Wa up e ie i g the p e ious day’s topi of fu tio s, stude ts the plot poi ts o thei communicator sleeves and struggle to fit the data into their knowledge of equations (limited to
linear equations)
2. Explore: Students are introduced to exponential functions and work through a penny activity to
better grasp Half –Life trends
3. Explain: Students will describe how the base of the exponential affects the graph.
4. Extend: Students will see how exponential growth and decay graphs again the following week and
will investigate multiple exponential graphs and be able to describe how the base of the exponential
affects the graph.
5. Evaluate: “tude ts ill e p ese ted ith the pop uiz uestio du i g the Po e Poi t to determine if the class as a whole is beginning to understand the difference between linear and non-
linear functions. Furthermore students will be asked to figure out the exponential equation for half-
life during the penny activity.

Teacher Notes:
Prior to this lesson students had been working regularly with linear functions but had never seen
exponential functions. The PowerPoint aims to give the students a non-linear set of data and asks them
to figure out a linear equation that fits perfectly with the data (not a possible task, but still constructive).
This allows students to realize that linear slope-i te ept e uatio s o ’t o k fo e e ta le of data, it also provides a good launching point as students recognize new patterns and ways to express those in
equations that are different from the forms they have previously seen. The communicators help the
students to have a way to sketch out this process as they begin to realize that cell growth is not a linear
trend and must instead be modeled using an equation in which the independent variable resides in the
exponent (the PowerPoint indicated at which point the communicators should be used). Students are
p ese ted ith the pop uiz uestio du i g the Po e Poi t to help fu the e phasize the concept of
exponential growth and just ho ou te i tuiti e so e of it’s p ope ties a e si e the a e so used to thinking linearly. Most students think the box should be half full at 5:30, a correct assumption if the
growth was linear (which is still an answer with applauding), it took most classes several guesses (and
took e e plai i g that if I ha e full o at 6: the I’d ha e full o es at 6: ) efo e the fi all started to really grasp the exponential trend and reached the correct solution.
The students really benefited from verbal instructions leading them through the penny experiment.
When they were led through the calculator steps then the lesson could be finished in 45 min, otherwise
a longer time was needed to help students troubleshoot he the did ’t follo a itte i st u tio correctly. Students really enjoyed this activity and really started to understand what half-life looks like.
The power point has a slide which instructs the students to clear out their calculators, this is key so that
data does ’t i te fe e ith the e t lass pe iod. Du i g the fi al lass of the da ou a also a t them to turn the Stat Plot back off so that the calculators are ready for the extension activity where they
will only be graphing from the Y= window.
The extension activity was a great opportunity for students to better connect the features of
exponential equations with their corresponding behaviors. During the calculator assisted exploration the
students were able to see the shift from exponential growth to decay when the base term went from
being greater than one to being less than one. Some made the false generation that increasing
functions must have a whole number base, but after providing them with the example y=(5/3)^x to try
they soon understood that it is the quantity being greater than one not the fact that it is a whole
number that produced the increasing quality in the graph.
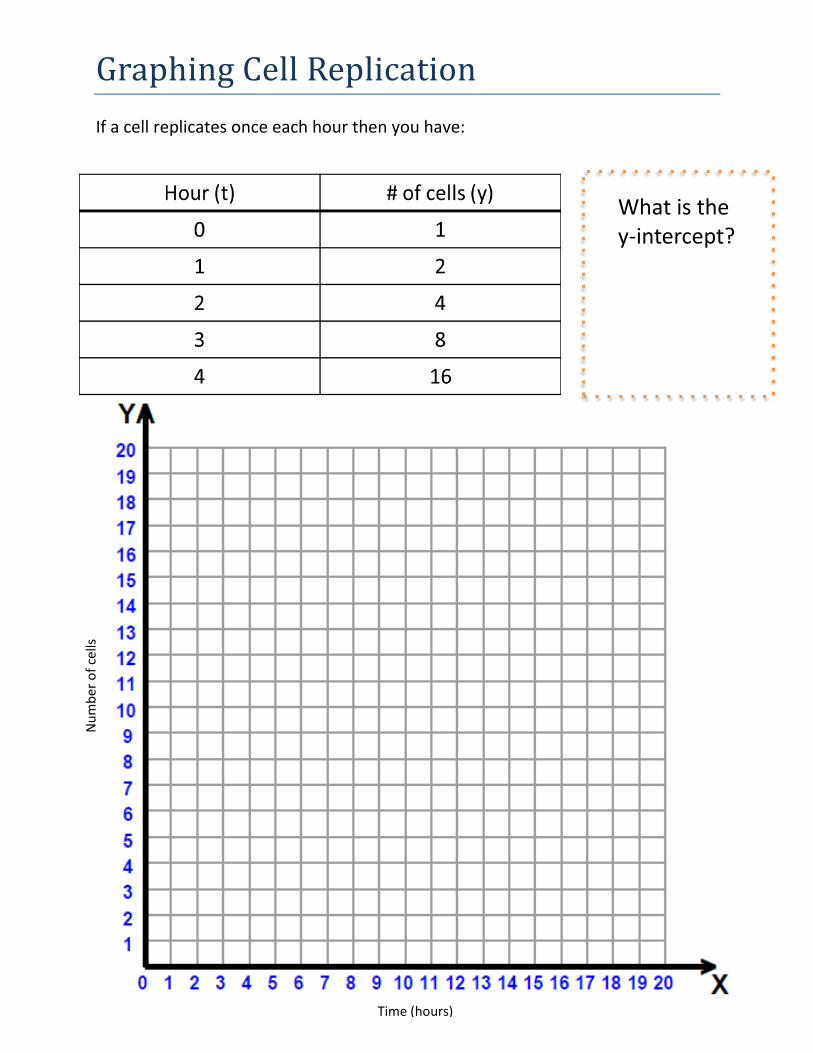
Graphing Cell Replication
If a cell replicates once each hour then you have:
What is the y-intercept?
Time (hours)
Nu
mb
er
of
cell
s

Name_____________KEY___________________
Entering Penny Data in TI-83 Graphing Calculator
Images and activity inspired by: http://www.nsa.gov/academia/_files/collected_learning/high_school/algebra/exploring_exponential_growth.pdf
Step 6: Press STAT ; Press 1 (Edit) and press enter. Begin
then entering your data from your experiment in L1 (toss#) and
in L2 (pennies remaining).*Any entry where no pennies remained
should be left out.
Step 7: Press 2nd STAT PLOT ; Press 1
(Plot 1); Put cursor on ON and press enter.
Step 8: Press ZOOM ; Press 9 (ZoomStat). Draw the graph below.
Step 9:To find the best fit graph: Press STAT ; Press CALC ; Press 0 (ExpReg); The word “ExpReg” will appear on your screen. Press ENTER . You will see the following screen: This equation is the exponential function that
best fits your data. Round a and b to two decimal places and record the equation here:
y =______(_____)x
What mathematical equation is more commonly used to model the half-life of 50 cells?
y =_50_(_.5_)x
Step 10: Press Y=; type this equation in and press GRAPH to see how close your data points are to this equation. Add the exponential decay line to your graph above in Step 8.
How closely did your experiment fit with the commonly used decay equation? _____________________________________________________________
____*____^x

Name________________________________
Entering Penny Data in TI-83 Graphing Calculator
Images and activity inspired by: http://www.nsa.gov/academia/_files/collected_learning/high_school/algebra/exploring_exponential_growth.pdf
Step 6: Press STAT ; Press 1 (Edit) and press enter. Begin
then entering your data from your experiment in L1 (toss#) and
in L2 (pennies remaining).*Any entry where no pennies remained
should be left out.
Step 7: Press 2nd STAT PLOT ; Press 1
(Plot 1); Put cursor on ON and press enter.
Step 8: Press ZOOM ; Press 9 (ZoomStat). Draw the graph below.
Step 9:To find the best fit graph: Press STAT ; Press CALC ; Press 0 (ExpReg); The word “ExpReg” will appear on your screen. Press ENTER . You will see the following screen: This equation is the exponential function that
best fits your data. Round a and b to two decimal places and record the equation here:
y =______(_____)x
What mathematical equation is more commonly used to model the half-life of 50 cells?
y =____(____)x
Step 10: Press Y=; type this equation in and press GRAPH to see how close your data points are to this equation. Add the exponential decay line to your graph above in Step 8.
How closely did your experiment fit with the commonly used decay equation? _____________________________________________________________
____*____^x
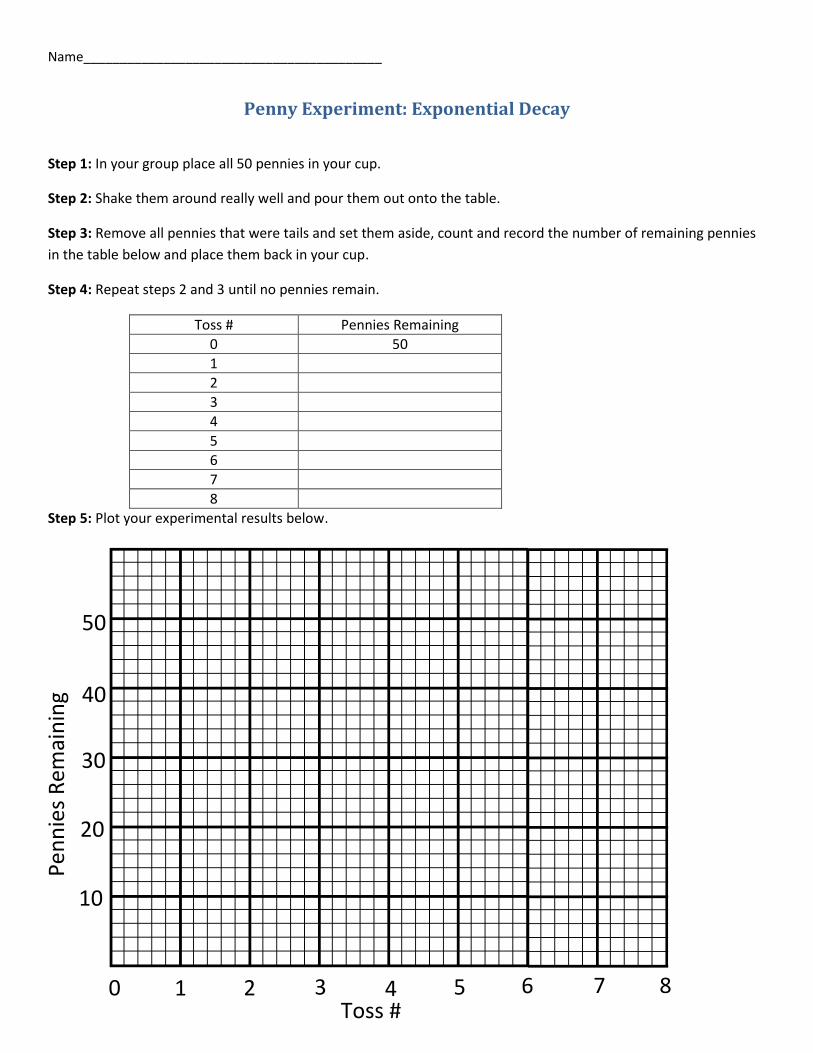
Name_________________________________________
Penny Experiment: Exponential Decay
Step 1: In your group place all 50 pennies in your cup.
Step 2: Shake them around really well and pour them out onto the table.
Step 3: Remove all pennies that were tails and set them aside, count and record the number of remaining pennies
in the table below and place them back in your cup.
Step 4: Repeat steps 2 and 3 until no pennies remain.
Toss # Pennies Remaining
0 50
1
2
3
4
5
6
7
8
Step 5: Plot your experimental results below.
1 2 3 4
1
5 6 0 7 8
10
20
30
40
50
Toss #
Pe
nn
ies
Re
ma
inin
g

Name _______________________________ Period_______
(Pages 1-3 published by Sharon Nussbaum, Jessica Redlin, and Denise Stewart at
http://www.nsa.gov/academia/_files/collected_learning/high_school/algebra/exploring_exponential
_growth.pdf, page 4 is unique to this lesson)

Name _______________________________ Period_______
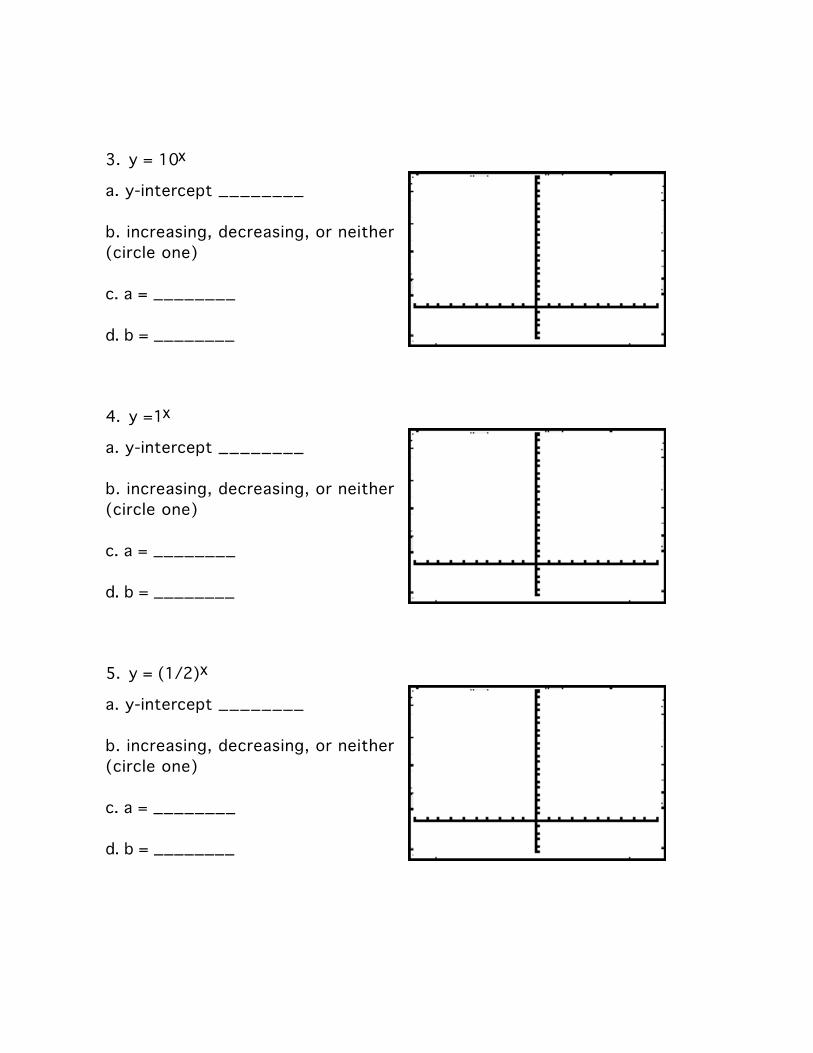
Use your TI-83 graphing calculator to graph the following functions and answer the questions.
Suggested Window:
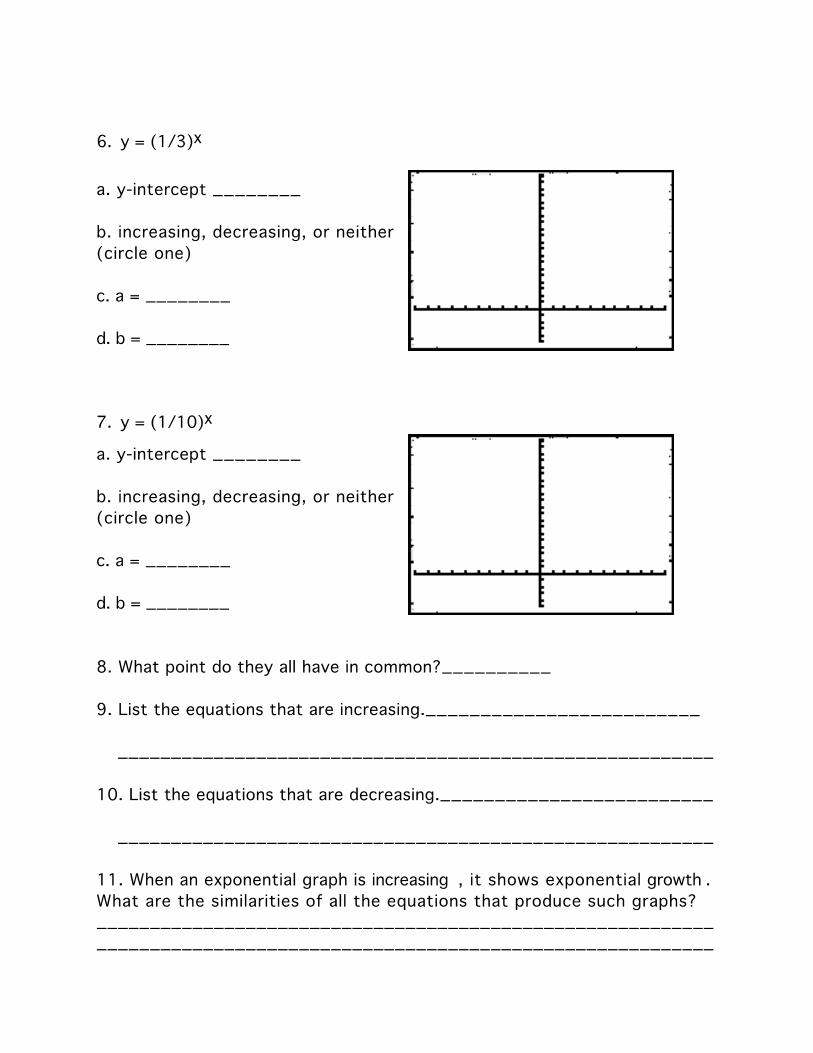
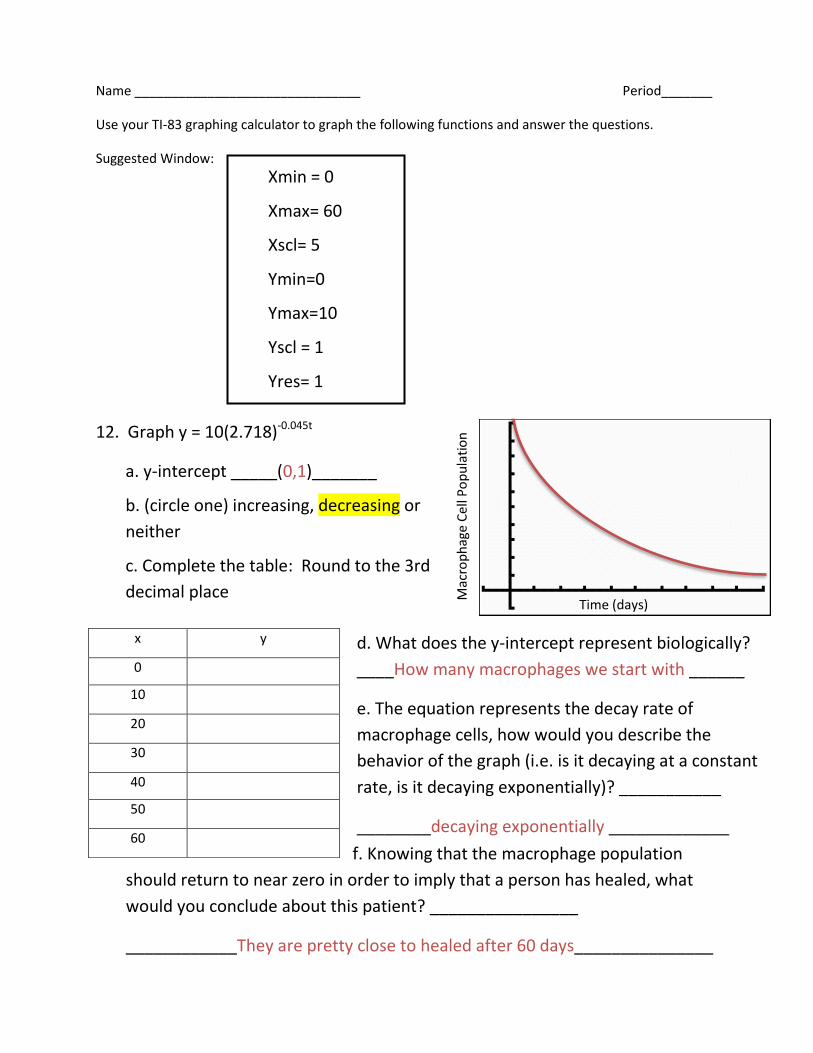
12. Graph y = 10(2.718)-0.045t
a. y-intercept _______________
b. (circle one) increasing, decreasing or
neither
c. Complete the table: Round to the 3rd
decimal place
f. Knowing that the macrophage population
should return to near zero in order to imply that a person has healed, what
would you conclude about this patient?
_______________________________________________________________
x y
0
10
20
30
40
50
60
Ma
cro
ph
ag
e C
ell P
op
ula
tio
n
Time (days)
Xmin = 0
Xmax= 60
Xscl= 5
Ymin=0
Ymax=10
Yscl = 1
Yres= 1
d. What does the y-intercept represent biologically?
___________________________________________
e. The equation represents the decay rate of
macrophage cells, how would you describe the
behavior of the graph (i.e. is it decaying at a constant
rate, is it decaying exponentially)?
___________________________________________

Name ___________KEY____________________ Period_______
(Pages 1-3 published by Sharon Nussbaum, Jessica Redlin, and Denise Stewart at
http://www.nsa.gov/academia/_files/collected_learning/high_school/algebra/exploring_exponential
_growth.pdf, page 4 is unique to this lesson)


Name _______________________________ Period_______
Use your TI-83 graphing calculator to graph the following functions and answer the questions.
Suggested Window:
12. Graph y = 10(2.718)-0.045t
a. y-intercept _____(0,1)_______
b. (circle one) increasing, decreasing or
neither
c. Complete the table: Round to the 3rd
decimal place
f. Knowing that the macrophage population
should return to near zero in order to imply that a person has healed, what
would you conclude about this patient? ________________
____________They are pretty close to healed after 60 days_______________
x y
0
10
20
30
40
50
60
Ma
cro
ph
ag
e C
ell P
op
ula
tio
n
Time (days)
d. What does the y-intercept represent biologically?
____How many macrophages we start with ______
e. The equation represents the decay rate of
macrophage cells, how would you describe the
behavior of the graph (i.e. is it decaying at a constant
rate, is it decaying exponentially)? ___________
________decaying exponentially _____________
____________________________________
Xmin = 0
Xmax= 60
Xscl= 5
Ymin=0
Ymax=10
Yscl = 1
Yres= 1
Math Journal
Wednesday: Explain whether the following is
a function or is not a function:
Number of hours studied to the score on an
exam
Miles over the speed limit and amount of the
ticket.

Larrissa Owens Graduate Students, GK12 Fellow
Department of Mathematics, UTA


If you were to graph the Cell Replication what
do you think it would look like?
If it replicates once each hour then you have:
Hour (t) # of cells (y)
0 1
1 2
2 4
3 8
4 16
What is the y-intercept?
Is there a constant value
that you are multiplying
the hour (independent
variable) by where adding
one to the result would
give you the
corresponding number of
cells (the dependent
variable)?

If you were to graph the Cell Replication what
do you think it would look like?
If it replicates once each hour then you have:
Hour (t) # of cells (y)
0 1
1 2
2 4
3 8
4 16
On your communicator, give a quick sketch of what
you think the graph of the # of cells will look like over
time.

If you were to graph the Cell Replication what
do you think it would look like?
If it replicates once each hour then you have:
Hour (t) # of cells (y)
0 1
1 2
2 4
3 8
4 16
Is there a constant
value that you are
multiplying the hour
(independent variable)
by where adding one
to the result would
give you the
corresponding number
of cells (the dependent
variable)?

What do you think the equation of this graph
might involve? Do you see any pattern in the
column of cell amounts?
Hour (t) # of cells (y)
0 1
1 2
2 4
3 8
4 16

What do you think the equation of this graph
might involve? Do you see any pattern in the
column of cell amounts?
Hour (t) # of cells (y)
0 1 = 20
1 2 = 21
2 4 = 22
3 8 = 23
4 16 = 24
What is the value of a for our model of cell replication ?
What is the value of b for our model of cell replication?

What is the t referred to as in this equation?

What is the t referred to as in this equation?

What is the t referred to as in this equation?
What do you think they named
equations of this form as a result?

What is the t referred to as in this equation?
What do you think they named
equations of this form as a result?
Time (hours)
# o
f ce
lls

Pop Quiz
Assume: every minute a
cells splits to form 2 new
cells.
At 5pm you put one cell
into a box.
At 6pm the box first
reaches full capacity.
When was the box half full?

One Minute
Later


Apoptosis:
Programed cell death Recall

Half Life: Penny activity

What do you think the equation of this graph
might involve? Do you see any pattern in the
column of cell amounts?
Hour (t) # of cells (y)
0 16
1 8
2 4
3 2
4 1
What is the value of a for our model of cell replication ?
What is the value of b for our model of cell replication?

What do you think the equation of this graph
might involve? Do you see any pattern in the
column of cell amounts?
Hour (t) # of cells (y)
0 16 = 16 =16 x .50
1 8 = 16 x .5 =16 x .51
2 4 = 16 x .5 x .5 =16 x .52
3 2 = 16 x .5 x .5 x .5 =16 x .53
4 1 = 16 x .5 x .5 x .5 x .5 =16 x .54
We start with 16 We divide our populationin
half after each hour?

Clearing out your calculator:
• Press Y= and hit CLEAR
• Press 2nd and + then press 4
and enter . The screen Should
say Clr All Lists then Enter
one more time

els
ge
2
4
6 2 6 2
2 2 2 4 9 8
2 2 3 4 2
Isolating just the decay term of the macrophages:
Isolating just the decay term of the macrophages, we get the
equation
=2.7182818284590452353
60287471352...
e
M=(initial amount) x e-0.045t
M=10 × (2.718)-0.045t
Quick Review: What type of number is
e, rational or irrational?
If we start with 10 macrophages then our equation for
modeling the growth is:
M=10 × (2.718)-0.045t
If we start with 10 macrophages then our equation for
modeling the growth is:
Time (days)
Ma
cro
ph
ag
e (
# o
f ce
lls)

Lesson 6
Reflections:
Over all this lesson really had the students engaged and encountering new trend
that challenged the linear behaviors they were so used to observing. The students
answered my questions just as I had anticipated, they first assumed that there
would be a way to form a linear equation to accurately produce the table they were
given, as soon as we allowed the students to draw the points they could easily see
that the plots were non-linear and therefore different from the tables they are used
to finding equations for. By establishing the pattern in the table the students were
able to easily follow the reasoning behind why an exponent is needed and began to
grasp the idea behind the symbolic structure of an exponential function. This was
good, but to test whether or not they where understanding beyond the symbolic
structure they were asked a pop quiz question which quickly helped them realize
that they were still assuming linear qualities about the behavior of the exponential
scenario which led them to drawing incorrect conclusions. Providing a visual of the
exponential behavior, showing how many cells are previous at one time step and
then the next they started to understand where their reasoning was flawed.
Working with the pennies as a physical prop to represent cell death really helped
the remaining students grasp the concept. It was cool to watch as each student
really began to grasp the concept at different times in the lesson. Through
observing the time constraint in the first class I gave a little more guidance in the
activity portion of the lesson to insure that students would finish in time and see
how calculators can help us relate our experiment to mathematical models.
Students responded well to both the communicator interaction, the pop quiz and the
penny activity. Of all of the activities I think the pop quiz was really the most common light bulb moment for them. Their questions and curiosity about the cell
replication and the behavior of the growth and decay confirmed that they were
engaged and able to observe how the mathematics related to the real world
behaviors. Teaching this lesson really showed me the importance of multiple
representations as well as different learning styles because some students were
really able to understand it from the symbolic representation, others gleaned the
most from the verbal discussion during the pop quiz, while others understood the behavior better after experimenting with it with objects they could touch. I don’t know that I really have anything that I would change other than to go back and wish
1st period had received more instruction so that they would have more time to
complete the experiment.
For the extension assignment in the future I would include a function along the lines
of y=(4/3)^x so that the students would have a non-whole number increasing
example in their tool box as they worked to discern qualities that determine
whether an exponential function is increasing or decreasing.