Embed Size (px)
Citation preview
ACPD4, 6149–6183, 2004
NOy instrumentaboard MOZAIC
in-service aircraft
A. Volz-Thomas et al.
Title Page
Abstract Introduction
Conclusions References
Tables Figures
J I
J I
Back Close
Full Screen / Esc
Print Version
Interactive Discussion
© EGU 2004
Atmos. Chem. Phys. Discuss., 4, 6149–6183, 2004www.atmos-chem-phys.org/acpd/4/6149/SRef-ID: 1680-7375/acpd/2004-4-6149© European Geosciences Union 2004
AtmosphericChemistry
and PhysicsDiscussions
Measurements of total odd nitrogen (NOy)aboard MOZAIC in-service aircraft:instrument design, operation andperformanceA. Volz-Thomas, M. Berg, T. Heil, N. Houben, A. Lerner, W. Petrick, D. Raak, andH.-W. Patz
Institut fur Chemie und Dynamik der Geosphare II: Troposphare, Forschungszentrum Julich,Julich, Germany
Received: 13 July 2004 – Accepted: 27 August 2004 – Published: 5 October 2004
Correspondence to: A. Volz-Thomas ([email protected])
6149
ACPD4, 6149–6183, 2004
NOy instrumentaboard MOZAIC
in-service aircraft
A. Volz-Thomas et al.
Title Page
Abstract Introduction
Conclusions References
Tables Figures
J I
J I
Back Close
Full Screen / Esc
Print Version
Interactive Discussion
© EGU 2004
Abstract
A small system for the unattended measurement of total odd nitrogen (NOy, i.e., thesum of NO and its atmospheric oxidation products) aboard civil in-service aircraft in theframework of MOZAIC is described. The instrument employs the detection of NO by itschemiluminescence with O3 in combination with catalytic conversion of the other NOy5
compounds to NO at 300◦C on a gold surface in the presence of H2. The instrumenthas a sensitivity of 0.4–0.7 cps/ppt and is designed for unattended operation during1–2 service cycles of the aircraft (400–800 flight hours). The total weight is 50 kg,including calibration system, compressed gases, mounting, and safety measures. Thelayout and inlet configuration are governed by requirements due to the certification for10
passenger aircraft. Laboratory tests are described regarding the conversion efficiencyfor NO2 and HNO3 (both >98%). Interference by HCN and NH3 is 100% and <1%,respectively. The time response (90% time) of the instrument is <1 s for NO2 and 150 sfor HNO3, the latter being caused by memory effects in the 80 cm long inlet line.
1. Introduction15
Nitrogen oxides play a key role in atmospheric photochemistry by catalysing the re-cycling of free radicals and the formation of ozone (Chameides and Walker, 1973;Crutzen, 1973; Liu et al., 1980). Despite of the many field measurements includingcampaigns with research aircraft (c.f., Emmons et al., 1997, 2000), the distribution andvariability of nitrogen oxides is still not well known, in particularly in the upper tropo-20
sphere and lower stratosphere (UT/LS). The existing data suggest a large variabilityand significant differences in the partitioning of NOy into active compounds, i.e., NOx(NO + NO2) and reservoir species such as HNO3, HNO4, PAN and other organic ni-trates. The pathways for recycling of NOx from, e.g. HNO3, are not well understood.The different sources of NOy to the upper troposphere include lightning and emis-25
sions by aircraft (in the form of NOx), uplifting of surface emissions (variable NOx/NOy
6150

ACPD4, 6149–6183, 2004
NOy instrumentaboard MOZAIC
in-service aircraft
A. Volz-Thomas et al.
Title Page
Abstract Introduction
Conclusions References
Tables Figures
J I
J I
Back Close
Full Screen / Esc
Print Version
Interactive Discussion
© EGU 2004
ratio) and downward transport from the stratosphere (mainly HNO3, c.f., Neuman etal., 2001).
Regular surveys of the NOy distribution in the UT/LS can help to gain a better un-derstanding of the downward transport of O3 from the stratosphere (c.f., Murphy et al.,1993; Murphy and Fahey, 1994) and to discriminate the impact of aircraft emissions on5
the UT/LS from the influence of convective transport of surface emissions.While it has become possible to derive important information on the tropospheric
column of NO2 from space-borne remote sensing (Richter and Burrows, 2002), it is notyet possible to obtain remote sensing data with the spacial resolution required to studythe tropopause region. The only climatological dataset of NOx in the UT/LS comes from10
the NOXAR project (Measurements of Nitrogen Oxides and Ozone Along Air Routes,(Brunner et al., 2001).
We describe here a small NOy instrument that was built in the framework of the Eu-ropean Project MOZAIC (Measurements of Ozone and Water Vapour aboard AirbusIn-service Aircraft, (Marenco et al., 1998) and has been certified for unattended oper-15
ation aboard passenger aircraft. The instrument was installed aboard an A-340-300long-haul aircraft of Deutsche Lufthansa AG and is in operation since January 2001.
2. The NOy instrument
The design of the NOy-instrument for MOZAIC followed largely that of previous airborneinstruments, e.g., (Drummond et al., 1985; Ridley and Grahek, 1990), by combining a20
chemiluminescence detector (CLD) for NO with a catalytic converter for conversion ofthe different NOy compounds to NO (Fahey et al., 1985; Gerbig et al., 1996; Kliner etal., 1997). An overview of the main components is given in Fig. 1. Major constraintswere weight, size, and the supply of compressed gases. The latter precluded the useof large sample flow rates as required for achieving maximum sensitivity. Other con-25
straints were posed by the certification for passenger aircraft and by the requirement forunattended deployment during at least one full service cycle of the aircraft (>50 flights
6151
ACPD4, 6149–6183, 2004
NOy instrumentaboard MOZAIC
in-service aircraft
A. Volz-Thomas et al.
Title Page
Abstract Introduction
Conclusions References
Tables Figures
J I
J I
Back Close
Full Screen / Esc
Print Version
Interactive Discussion
© EGU 2004
or >400 flight hours), including measures against contamination during landing or takeoff and while the aircraft is at ground with or without electrical power. The individualcomponents of the instrument are described in the following.
2.1. The CLD
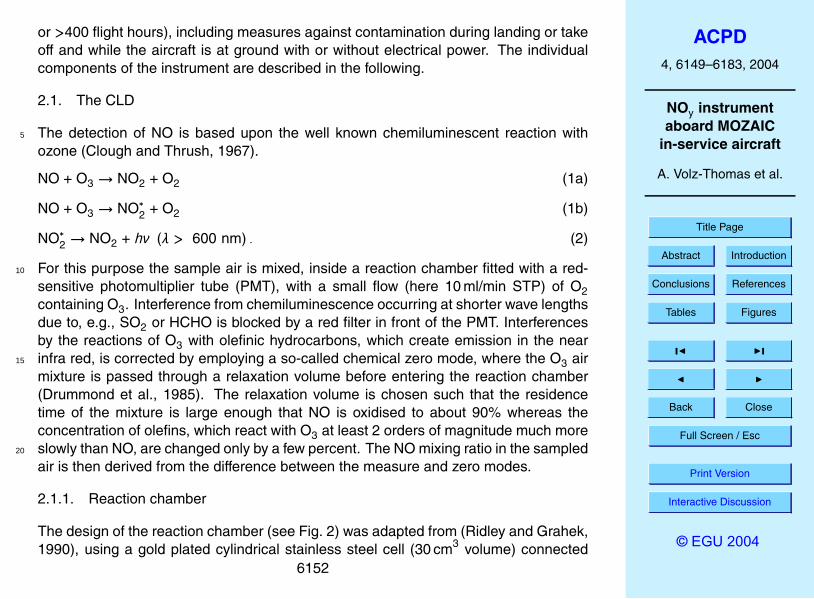
The detection of NO is based upon the well known chemiluminescent reaction with5
ozone (Clough and Thrush, 1967).
NO + O3 → NO2 + O2 (1a)
NO + O3 → NO∗2 + O2 (1b)
NO∗2 → NO2 + hν (λ > 600 nm) . (2)
For this purpose the sample air is mixed, inside a reaction chamber fitted with a red-10
sensitive photomultiplier tube (PMT), with a small flow (here 10 ml/min STP) of O2containing O3. Interference from chemiluminescence occurring at shorter wave lengthsdue to, e.g., SO2 or HCHO is blocked by a red filter in front of the PMT. Interferencesby the reactions of O3 with olefinic hydrocarbons, which create emission in the nearinfra red, is corrected by employing a so-called chemical zero mode, where the O3 air15
mixture is passed through a relaxation volume before entering the reaction chamber(Drummond et al., 1985). The relaxation volume is chosen such that the residencetime of the mixture is large enough that NO is oxidised to about 90% whereas theconcentration of olefins, which react with O3 at least 2 orders of magnitude much moreslowly than NO, are changed only by a few percent. The NO mixing ratio in the sampled20
air is then derived from the difference between the measure and zero modes.
2.1.1. Reaction chamber
The design of the reaction chamber (see Fig. 2) was adapted from (Ridley and Grahek,1990), using a gold plated cylindrical stainless steel cell (30 cm3 volume) connected
6152

ACPD4, 6149–6183, 2004
NOy instrumentaboard MOZAIC
in-service aircraft
A. Volz-Thomas et al.
Title Page
Abstract Introduction
Conclusions References
Tables Figures
J I
J I
Back Close
Full Screen / Esc
Print Version
Interactive Discussion
© EGU 2004
to a photomultiplier (PMT). The reaction cell is separated from the PMT housing bymeans of two 1mm thick windows (Schott WG320, and RG610), which provide thermalinsulation and discriminate light from wavelengths below 600 nm. The space betweenthe cell window and the red filter, as well as the PMT housing, are purged with a smallflow of O2 (0.2 ml/min). The temperature of the cell is controlled at 20◦C.5
The photomultiplier (Thorn-EMI 9828A, 1′′diameter S20 photocathode, selected forenhanced red sensitivity and low dark current) is operated in the photon counting mode.The preamplifier (Thorn-EMI C637AFP) is located inside the housing and feeds intoa fast discriminator (10 ns peak resolution) which delivers TTL pulses to the counterboard in the PC-104 computer system (see below). The PMT is cooled to −12◦C by10
four Peltier elements (Melcor, CPO.8-71-06L-2-RTV) mounted at the front part of thehousing. A copper mesh between the photocathode and the red filter enhances theheat transfer. The Peltier elements are air cooled via heat sinks and two small fans.
Sample air and O3 enter the cell through concentric slits around the cell windowand are exhausted through a 4 mm diameter hole in the back flange. For switching15
between measure and zero modes, both sample air and O3 flow paths are altered bymeans of two magnetic 3/2-way valves (Entegris PFA 203-3414-215 for sample air,Fluid Automation SS 6-311N102-41EDCEDE, for O3). The zero mode is activatedevery 28 s for 4 s. The relaxation volume is made of a 35 cm long, 6mm ID FEP tube.All tubes connected to the reaction chamber are covered with black heat shrink and20
the PFA valve is placed inside an aluminium housing in order to prevent light leaks.
2.1.2. Ozone generator
The self-built ozone generator consists of a coaxial discharge tube made of an 18 cmlong, 4 mm ID ceramic tube (Alsint 99.7) with a 3 mm OD stainless steel electrodewhich is fed with 3.7 kV, 400 Hz from a high voltage transformer connected to the25
aircraft power supply. The end fittings of the discharge tube are made of FEP. Theouter electrode is made from copper and is connected to the housing for cooling. A3 MOhm resistor in the high voltage line serves to protect the transformer from tran-
6153
ACPD4, 6149–6183, 2004
NOy instrumentaboard MOZAIC
in-service aircraft
A. Volz-Thomas et al.
Title Page
Abstract Introduction
Conclusions References
Tables Figures
J I
J I
Back Close
Full Screen / Esc
Print Version
Interactive Discussion
© EGU 2004
sients. The oxygen flow (10 ml/min STP) is controlled by the central oxygen pressureregulator (see Fig. 1) and a quartz capillary upstream of the discharge tube. A sec-ond capillary mounted downstream of the tube serves to control the pressure in thedischarge at 1.15 bar, which provides the maximum ozone yield.
2.2. Pneumatics, pump5
A small two-stage, four-head membrane pump (Vacuubrand GmbH, MD 1 Vario-SP)is used in combination with a downstream-pressure regulator (Brooks TR 5866/A1-D-2-B-2-B-B-2) and a critical orifice upstream of the CLD to maintain the flow throughthe CLD. The pressure in front of the orifice (0.6 mm diameter) is maintained by thepressure regulator at 30 mbar for a constant sample flow of 90 ml/min STP. The pump10
is equipped with PTFE-coated membranes and Kalrez valves for resisting high ozoneconcentrations. In addition, a charcoal filter is place between reaction cell and pumpfor protecting the pump and for preventing hazardous ozone concentrations being ex-hausted from the NOy-instrument because of safety requirements.
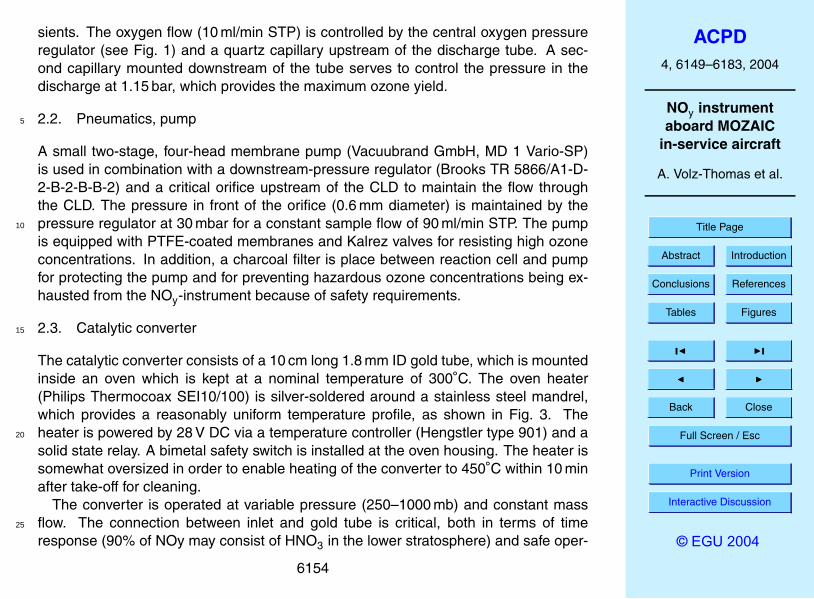
2.3. Catalytic converter15
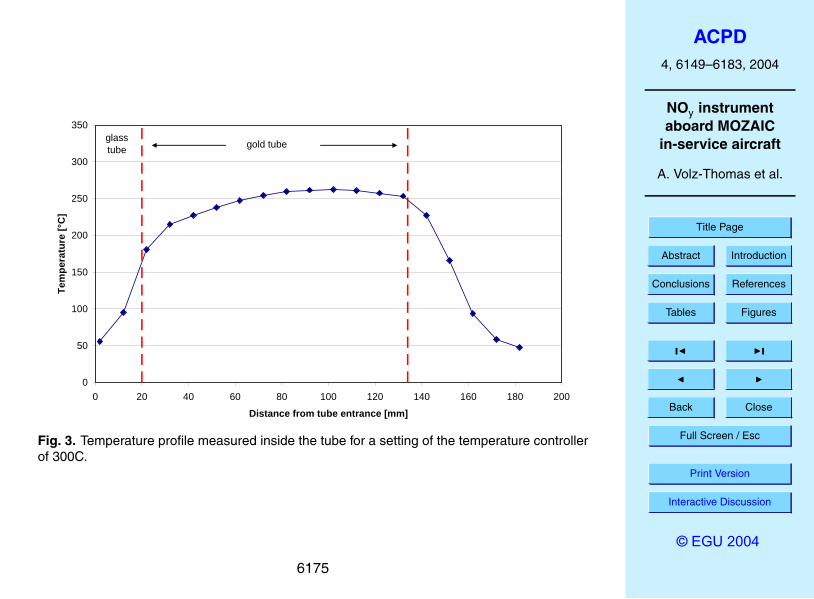
The catalytic converter consists of a 10 cm long 1.8 mm ID gold tube, which is mountedinside an oven which is kept at a nominal temperature of 300◦C. The oven heater(Philips Thermocoax SEI10/100) is silver-soldered around a stainless steel mandrel,which provides a reasonably uniform temperature profile, as shown in Fig. 3. Theheater is powered by 28 V DC via a temperature controller (Hengstler type 901) and a20
solid state relay. A bimetal safety switch is installed at the oven housing. The heater issomewhat oversized in order to enable heating of the converter to 450◦C within 10 minafter take-off for cleaning.
The converter is operated at variable pressure (250–1000 mb) and constant massflow. The connection between inlet and gold tube is critical, both in terms of time25
response (90% of NOy may consist of HNO3 in the lower stratosphere) and safe oper-
6154
ACPD4, 6149–6183, 2004
NOy instrumentaboard MOZAIC
in-service aircraft
A. Volz-Thomas et al.
Title Page
Abstract Introduction
Conclusions References
Tables Figures
J I
J I
Back Close
Full Screen / Esc
Print Version
Interactive Discussion
© EGU 2004
ation. At the upstream side, a 30 mm long, SS-tube (3 mm ID, 4 mm OD ) is solderedonto the gold tube. The SS tube is inserted into the inlet manifold, where it is sealedwith a 4mm PFA-Ferrule and Valco nut. A 20 mm long, 3 mm OD borosilicate tube(Fig. 4) is inserted into the SS tube so that the sample air has no contact with the SSsurface. The construction serves to keep the temperature of the FEP manifold (see5
below) at 50◦C when the converter temperature is set at nominally 300◦C and whenthe tip of the gold tube is at 250◦C (see Fig. 3). In earlier tests, it had been noted,that overheating the FEP or PFA tubes produced large background signals. At thedownstream side, a SS-reducer to 1/8′′ is soldered over the gold tube.
The length of the gold tube is sufficient for mass flow rates of up to 300 scc/min (c.f.,10
Murphy and Fahey, 1987), as experimentally verified by shortening a tube by a factor ofthree. The longer tubes are used because of the long operating cycles of the MOZAICinstrument, without the possibility for cleaning in between flights.
H2 is used as a reducing agent instead of CO (c.f., Kliner et al., 1997), becauseof unsolvable problems with the certification of CO for operation on passenger air-15
craft due to its toxicity in addition to flammability. Whilst certification problems hadfirst been encountered for H2 as well, this was finally solved by using a metal hy-dride storage device. The H2 storage container (Hycob GmbH, HS20) consistsof a SS cylinder (Hoke, type 4HS75, 75 ml volume) containing 120 g of a Ti alloy(Ti0.95Zr0.05Mn0.15V0.04Fe0.01). The thermodynamics of this alloy allow its use20
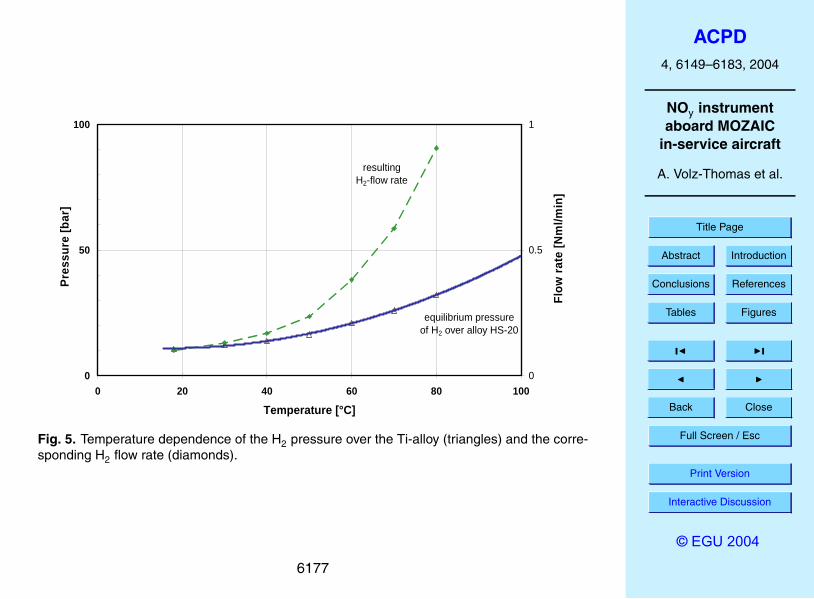
without a pressure regulator. The H2 flow rate is controlled by the equilibrium pressureof H2 over the alloy and a capillary, which is directly mounted at the cylinder valve.As shown in Fig. 5, the H2 pressure changes only moderately with temperature. For afreshly filled cylinder containing 2g of H2, flow rates remain between 0.2 and 0.4 ml/minover a temperature range of 10–50◦C (The temperature of the avionic compartment25
varies only between 15 and 25◦C during flight). During seven weeks of operation theflow rate decreases to 0.05 ml/min, which is still more than sufficient for maintaining theconversion efficiency of the converter for NO2 and HNO3 at >95%.
6155
ACPD4, 6149–6183, 2004
NOy instrumentaboard MOZAIC
in-service aircraft
A. Volz-Thomas et al.
Title Page
Abstract Introduction
Conclusions References
Tables Figures
J I
J I
Back Close
Full Screen / Esc
Print Version
Interactive Discussion
© EGU 2004
2.4. Inlet configuration
The design of the inlet configuration was one of the most problematic parts of the wholeenterprise. The limited space available on the existing MOZAIC flange together withthe safety requirements for, e.g., smoke detection and overheating protection, as wellas the need for regular removal of the NOy instrument for maintenance and quality5
control, precluded the integration of the gold converter into the inlet probe. It wastherefore decided to integrate the converter into the housing of the NOy instrument,with the disadvantage of having to use an 80 cm long inlet line.
Similarly, a decision had to be made on the configuration of the air intake. Afterseveral tests, it was decided to adapt the Rosemount probe (Model 102B) deployed10
in MOZAIC since 1994 for temperature and humidity measurements (c.f., Gierens etal., 1999; Helten et al., 1998; Helten et al., 1999) for the NOy inlet. The schematics ofthe design are shown in Fig. 6. The FEP inlet line is inserted into the (10 mm ID) sidearm of the probe such that the tip is located about 2 mm behind the bend. The partof the inlet tube inside the Rosemount probe is heated to 20◦C by a PTFE-insulated15
heating wire wound tightly around the tube and fixed by two layers of ceramic tape.A 0.5 mm DIA thermocouple and a temperature controller (PMA, type KS10) serve tomaintain a constant temperature. A thin wall SS-tube of 8 mm OD serves as a liner inorder to prevent the inlet line from touching the walls of the Rosemount probe.
Inside the NOy-instrument, the inlet line is connected to a manifold (Fig. 4) made from20
FEP, which contains ports for the addition of zero air, calibration gases and hydrogen,pressure measurement, and a by-pass around the gold converter that allows to makemeasurements of NO. The port opposite to the inlet line is connected to a backwardfacing 4mm ID tube on the aircraft flange that serves for purging of the inlet line and forventing of the calibration gases and the pump exhaust.25
At cruise altitude, the total flow rate through the inlet line is 900 ml/min STP and thepressure in the inlet manifold is 250 mbar. The resulting residence time in the inlet lineis 0.05 s. When the aircraft is grounded, the connection between manifold and exhaust
6156
ACPD4, 6149–6183, 2004
NOy instrumentaboard MOZAIC
in-service aircraft
A. Volz-Thomas et al.
Title Page
Abstract Introduction
Conclusions References
Tables Figures
J I
J I
Back Close
Full Screen / Esc
Print Version
Interactive Discussion
© EGU 2004
line is closed by a magnetic valve and the inlet line is back-flushed with the O2 flowfrom the ozone generator.
2.5. Calibration
In flight calibration of the CLD is achieved by adding a small flow of a calibration gas(10 ppm NO in ultra-pure N2) to the sample flow of the instrument. The calibration gas5
is contained in a 400 ml PTFE-coated SS cylinder (Whitey 304L-HDF4-400-T). Theflow rate of the calibration gas (0.2 ml/min) is controlled by two SS pressure regula-tors and a quartz capillary. A second capillary (flow rate 2 ml/min) connected to theexhaust serves the purpose to maintain a shorter residence time of the calibration gasin the pressure regulators and lines. All flow rates are determined from pressure mea-10
surements made upstream (P1) and downstream (P2) of the capillaries according toHagen-Poiseuille’s Law (Eq. 3).
dM/dt = f r∗i (P21 − P 2
2 ) (3)
The flow resistances f r i of the capillaries are determined in the laboratory with anabsolute flow meter (Gillian) and are checked during each maintenance cycle. The15
relevant pressures (see Fig. 1) are measured by small sensors (Sensortechnics, type144SB00xA-PCB) and are recorded at a rate of 1 Hz. The sensors are calibrated duringmaintenance against a reference standard (Leitenberger GmbH, PC6-005-C-2). Thestability of the calibration of the pressure sensors proved better than ±0.5% .
For in-flight calibration of the conversion efficiency, a miniature gas phase titration20
system (GPT) is used to convert the NO partially to NO2 (Eq. 1). The ozone is madein a flow of 0.2 ml/min of O2 in a 1/16′′ PFA tube which is irradiated by a Hg-lamp.The O3 concentration is adjusted to 70±10% of the NO concentration in the calibrationgas by changing the irradiated length of the PFA-tube. The O2 is always flowing andthe NO2 calibration is initiated by actuation of a shutter in between the Hg-lamp and25
the PFA tube (see Fig. 1). The degree of titration is checked in flight by measuringthe calibration gas with and without the shutter activated in both modes of the NOy
6157
ACPD4, 6149–6183, 2004
NOy instrumentaboard MOZAIC
in-service aircraft
A. Volz-Thomas et al.
Title Page
Abstract Introduction
Conclusions References
Tables Figures
J I
J I
Back Close
Full Screen / Esc
Print Version
Interactive Discussion
© EGU 2004
instrument, i.e., through the converter and bypassing the converter. In addition, theO3 concentration is measured before being mixed with the calibration gas, in a smallphotometer (l=40 mm; ID=0.8 mm), using the light of the same Hg-lamp as used forgenerating the O3.
The background of the instrument is also determined in flight by overflowing the inlet5
manifold with O2. The results of this procedure compare within the statistical errorswith measurements of zero air. The conversion efficiency for HNO3 is checked duringmaintenance in the laboratory (see below).
2.6. Safety features
In order to comply with the certification requirements for passenger aircraft, most com-10
ponents are selected for respective specifications. Furthermore, the NOy instrumentis integrated into one box, which is equipped with provisions for overheating protectionand an avionic smoke detection system. The latter also provides the ventilation forthe entire system. The heater for the inlet line and the de-icing heater of the Rose-mount probe are disabled when the aircraft is grounded by the landing gear signal of15
the aircraft and by pressure switches (600 mb) connected to the NOy inlet line.
2.7. Data acquisition and control
A PC-104-computer system is used for instrument control and data acquisition/storage.It contains a cpu board with intel pentium processor, a 1Gb Flash Memory Disk (SANDisk Corp.), and several I/O boards containing ten 16-bit counters, digital I/Os and20
16 analog I/Os with opto-coupled inputs and individual pre-amplifiers for signal condi-tioning, as well as 16 relays for switching of the magnetic valves. The PC-104 systemis powered via a 24 V vehicle power supply with battery back-up (NiMH). The dataacquisition system is enclosed in an aluminium box for EMI protection.
The NOy-instrument is powered from the aircraft 115 V/400 Hz power supply. The25
main power is distributed via a line filter and fuses to the ozone generator and to a
6158
ACPD4, 6149–6183, 2004
NOy instrumentaboard MOZAIC
in-service aircraft
A. Volz-Thomas et al.
Title Page
Abstract Introduction
Conclusions References
Tables Figures
J I
J I
Back Close
Full Screen / Esc
Print Version
Interactive Discussion
© EGU 2004
switching power supply (Vicor Flatpac, Model VI-MUL-IQ-VIC; input 115 V, 400 Hz, out-put 24 V DC, 400 VA), which provides the power to the data acquisition unit and fromthere to the other units.
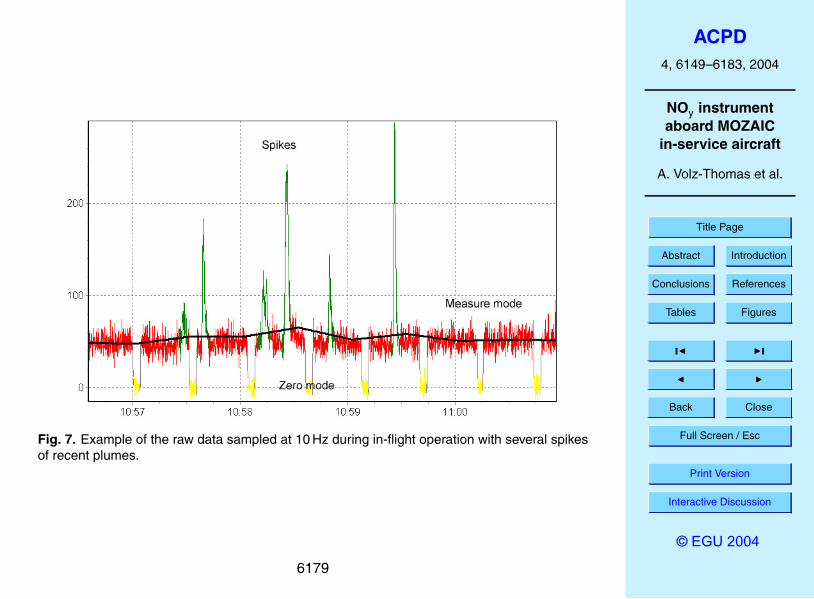
The software package for instrument control, data acquisition and storage is writtenin Borland Delphi version 5 under Windows 98SE. Data from the photon counter are5
stored at a rate of 10 Hz in order to allow the detection of short spikes, as highlightedin Fig. 7. Housekeeping data (pressures, temperatures) are stored as 1 s averages.The program controls the different measurement modes of the instrument and enablesthe in-flight calibration cycles for NO, NO2, and instrument background. The programis always running when the aircraft is under power. When power is disconnected, the10
PC-104 continues operation from the battery pack. If power is disconnected for longerthan 15 s, the program and operating system are terminated. Upon power on, thewhole process starts automatically. As long as the aircraft is grounded, the programkeeps the instrument in stand-by mode, in which the inlet line is back-flushed with O2from the ozone generator. Operation is started after take-off, when the landing gear15
is taken in. In addition, the program monitors the pressure difference between inletmanifold and exhaust line, which is a measure of the aircraft speed.
During the first 30 min of each flight, the gold converter is heated to 450◦C for clean-ing. During this time, the by-pass is active so that the instrument measures NO. There-after, the gold converter is reset to 300◦C and the regular NOy measurement cycle is20
started. Calibration cycles and background determination (see Fig. 8) are configuredby entries in a configuration file. At the beginning of the operation in MOZAIC, 2–3calibration cycles with NO and NOx measurements, both in the NOy and NO measur-ing modes, were made during each flight (every 4 h). The background was determinedevery 2 h for 5 min. This procedure was later relaxed to 1 calibration and 1 background25
determination per flight. The chemical zero mode of the CLD is actuated every 28 s for4 s.
6159
ACPD4, 6149–6183, 2004
NOy instrumentaboard MOZAIC
in-service aircraft
A. Volz-Thomas et al.
Title Page
Abstract Introduction
Conclusions References
Tables Figures
J I
J I
Back Close
Full Screen / Esc
Print Version
Interactive Discussion
© EGU 2004
2.8. Maintenance and QA/QC
Extensive pre- and post-flight calibrations are made in the laboratory using a primarystandard (10 ppm NO in ultra pure N2, BOC/Messer Griesheim). The procedure in-cludes:
1. A calibration with the pre-diluted primary standard provided to the inlet line at5
excess flow in order to determine the sensitivity of the instrument and the trans-mission of the converter for NO.
2. A calibration with the primary NO-standard connected to the internal calibrationsystem of the instrument (in both modes) in order to obtain information on pos-sible losses of NO in the calibration system or possible changes in the capillar-10
ies/pressure sensors used for determination of the flows. The conversion effi-ciency is determined in the same experiment with the internal GPT system.
3. An internal calibration with the internal NO cylinder in order to observe possiblechanges in the NO mixing ratio of the in-flight standard during the previous op-erating cycle and for calibrating the internal NO-cylinder after refilling for the next15
cycle.
4. The conversion efficiency for HNO3 is determined with the permeation sourcedescribed below.
Other maintenance includes:Every cycle, the hydride cylinder is replaced (and refilled at factory), the internal NO20
cylinder is refilled, the charcoal in the ozone scrubber is replaced. Safety inspectionsinclude a complete leak test, electrical and mechanical inspection, in particular of safetyrelevant components (e.g., pressure switches), documentation for reinstallation, andfinal calibration as outlined above. Cleaning/replacement of the gold tube is done ifnecessary because of increased background or when the conversion efficiency has25
dropped below 95%.6160
ACPD4, 6149–6183, 2004
NOy instrumentaboard MOZAIC
in-service aircraft
A. Volz-Thomas et al.
Title Page
Abstract Introduction
Conclusions References
Tables Figures
J I
J I
Back Close
Full Screen / Esc
Print Version
Interactive Discussion
© EGU 2004
Every third cycle (or earlier if necessary), the membrane pump is replaced (and ser-viced at the factory), the ozone generator is refurbished with a new discharge tube,the reaction chamber of the CLD is cleaned, and the pressure sensors and flow resis-tors are re-calibrated. The latter is always performed if discrepancies between experi-ments 1. and 2. are observed.5
3. Laboratory tests
Laboratory tests were conducted for establishing the conversion efficiency of the con-verter and the time response of the inlet system for NO2 and HNO3, and for interferencefrom atmospheric constituents that do not fall into the NOy family. For this purpose, amulti source permeation system was set up, using commercial permeation tubes (Kin-10
tek). The permeation system holds four different permeation tubes (PT), which areplaced inside individual stainless steel containers mounted inside a temperature con-trolled oven at 35◦C. The tubes are fed with zero grade air at 4 atm and the air flowis controlled by capillaries downstream of the permeation tubes. The effluent is thenadded either into the inlet of the NOy instrument or is pre-mixed with a known flow of15
zero air. For each PT, a pair of capillaries is used with a split ratio of 1:5, enablingcalibrations at concentrations differing by a factor of five to be made without changingthe conditions of the permeation sources or the dilution flow.
The permeation rates for HNO3, HCN and NH3 were determined by ion chromatog-raphy against weighted standards in samples obtained by absorption of the effluent20
from the PTs in aqueous solutions (pure H2O for HNO3, 0.1 n NaOH for HCN and0.1 n H2SO4 for NH3). The permeation rate for NO2 was determined with the NOyinstrument by comparison against the GPT system.
6161

ACPD4, 6149–6183, 2004
NOy instrumentaboard MOZAIC
in-service aircraft
A. Volz-Thomas et al.
Title Page
Abstract Introduction
Conclusions References
Tables Figures
J I
J I
Back Close
Full Screen / Esc
Print Version
Interactive Discussion
© EGU 2004
3.1. Conversion efficiency and interferences
Figure 9 shows the conversion efficiency of the gold converter for NO2 (13 ppb),HNO3 (14 ppb) and HCN (83 ppb) as a function of converter temperature, both for H2(filled symbols) and CO (open symbols), at flow rates of 0.2 ml/min STP. For HNO3 andNO2, significant conversion is already observed at room temperature and conversion5
efficiencies above 90% are found at 200◦C. The results for CO and H2 as reducingagent are similar within the experimental uncertainties.
The conversion efficiency for HCN is also displayed in Fig. 9. For experiments withH2, HCN is converted to 100% at 300◦C, in agreement with the results of Kliner etal. (1997), for dry air. When H2 is replaced by CO, however, the entire curve for HCN10
is shifted by about 100◦C and quantitative conversion is only reached at temperatures>400◦C. This results is in general agreement with those obtained by other investiga-tors, e.g. Weinheimer et al. (1998), who found conversion efficiencies below 40% forconverters operated with CO at 300◦C.
Conversion of NH3 was negligible (i.e. <1%) for either CO or H2 at temperatures up15
to 400◦C.Because of the sufficient length and the relatively homogeneous temperature profile
of the converter, we found no significant pressure dependence of the conversion effi-ciency for NO2 and HNO3, although the temperature of the gold tube is actually lessthan 300◦C (Fig. 3). We should like to note that operation of the gold tube at 50◦C20
higher temperatures, which was accidentally done during one service period, did notgive different results in terms of NOy to O3 ratios. Losses of NO were not observedwith our converter in the presence of H2, similar to the results of Kliner et al. (1997).The transmission for NO always remained at >98%, except for a situation when theconverter was heavily contaminated as indicated by very low conversion efficiencies25
for NO2 and HNO3.
6162

ACPD4, 6149–6183, 2004
NOy instrumentaboard MOZAIC
in-service aircraft
A. Volz-Thomas et al.
Title Page
Abstract Introduction
Conclusions References
Tables Figures
J I
J I
Back Close
Full Screen / Esc
Print Version
Interactive Discussion
© EGU 2004
3.2. Time response
The response time of the inlet configuration is important for, e.g., the interpretationof the correlation between ozone and NOy, because of the strong layering observedfrom, e.g., the MOZAIC ozone data (Thouret et al., 2000) and in particular the fasttransitions observed when the aircraft cross the tropopause (c.f., Thouret et al., 1998).5
HNO3 is the most important species to be considered because of its larger affinity tosurfaces as compared to NOx and because it comprises about 90% of NOy in the lowerstratosphere (c.f., Neuman et al., 2001).
We investigated the behaviour of inlet lines of different lengths made of PTFE, PFAand FEP tubing at different temperatures, before the first MOZAIC III test flight in 2000.10
The results are shown in Fig. 10. Different from Neuman et al. (1999), we found thebehaviour of FEP superior to PFA in terms of memory, which lead to the use of FEP forthe inlet line and inlet manifold.
The results for the actual MOZAIC inlet (about 80 cm, 1/8′′ FEP tubing, controlled at20◦C) are shown in the lower panel of Fig. 10. They were obtained with the following15
setup: The HNO3 permeation source (1 ml/min) was connected to a 1/32′′ OD PFAtube mounted inside a sliding injector made from borosilicate glass with an extrudedtip. The sliding injector was mounted opposite to the inlet line inside a glass flow tube.Excess zero air (5 l/min) was introduced into the flow tube passing along the inlet lineand being exhausted through a metering valve and pump connected to a port behind20
the injector. In this position, the HNO3 flow from the injector is vented together with thezero air and does not reach the inlet line. For injection, the sliding injector is movedforward against a stop such that the tip of the 1/32′′ tube is inserted 3 mm into the inletline. In this position, the flow from the PT enters the inlet line. The setup allows to injectinto and remove HNO3 from the inlet line within less than 1 s.25
The pressure in the flow tube was varied between 1 atm and 300 mb, correspondingto the ambient conditions during flight. The flow rate through the inlet line was adjustedto match exactly the conditions during flight by adjusting the pressures in the inlet
6163

ACPD4, 6149–6183, 2004
NOy instrumentaboard MOZAIC
in-service aircraft
A. Volz-Thomas et al.
Title Page
Abstract Introduction
Conclusions References
Tables Figures
J I
J I
Back Close
Full Screen / Esc
Print Version
Interactive Discussion
© EGU 2004
manifold and in the exhaust of the NOy instrument according to the data recorded in-flight. The negative ram pressure at the exhaust was simulated with a vacuum pumpand metering valve connected to the exhaust line of the NOy instrument.
4. Discussion
4.1. Sensitivity5
Assuming optimum design of the other components, i.e., reaction cell, PMT and ozonegenerator, the sensitivity of the CLD is proportional to the volume flow provided bythe pump. The pump chosen for the MOZAIC instrument maintains a total flow rate(sample and ozone) of 100 ml/min STP at a cell pressure of <10 mbar, corresponding toa volume flow rate of about 200 ml/s through the reaction cell. It has the best efficiency10
in its weight class and is equipped with a lightweight brushless 28 V DC motor thathas optimum performance with regard to electromagnetic interference, an importantrequirement for installation inside the avionic bay of the aircraft. A larger sensitivitywould have been achievable only with large increases in weight, which was not possiblewithin the framework of MOZAIC, because the airlines carrying the equipment without15
charging for transportation cost.
4.2. Inlet system
The Rosemount probe was chosen as inlet because a simple forward facing probewould lead to size dependent enrichment factors for atmospheric aerosol (c.f., Fa-hey et al., 2001), thus rendering the interpretation of the NOy-data difficult. Back-20
ward sampling, on the other hand, while discriminating against aerosol nitrate, has thestrong disadvantage of the negative ram pressure that does not allow a large sampleflow through the sampling line without employing an additional pump (the sample flowthrough the converter and CLD is only 90 ml/min STP). The Rosemount probe com-bines both advantages, by acting as a virtual impactor, thereby separating the particles25
6164
ACPD4, 6149–6183, 2004
NOy instrumentaboard MOZAIC
in-service aircraft
A. Volz-Thomas et al.
Title Page
Abstract Introduction
Conclusions References
Tables Figures
J I
J I
Back Close
Full Screen / Esc
Print Version
Interactive Discussion
© EGU 2004
like a backward facing inlet, and by providing almost the full positive ram pressure. Aminor technical advantage is that Rosemount probes come with the required certifica-tion for civil aircraft.
Ryerson et al. (1999) argued that earlier measurements made with a gold convertermounted inside a Rosemount probe seemed to suffer from wall effects in the probe5
before the air reached the converter (T. Ryerson, private communication). This findingis in contradiction to the results from the MOZAIC humidity/temperature sensor. Theabsence of a detectable change in the signal of the temperature sensor when the de-icing heater of the Rosemount probe is switched on and off during flight clearly showsthat the air sampled through the side arm of the probe has no measurable contact10
with the wall of the probe. This conclusion is supported by results from an in-flightcomparison with a research instrument operated by ETH-Zurich aboard a Learjet aspart of the SPURT project, which has the gold converter mounted outside the fuselagewithout any inlet line. The good agreement between the two instruments limits potentiallosses of HNO3 in the MOZAIC inlet to 15% (Patz et al., in preparation, 2004 1).15
The suitability of different inlet materials for measurements of HNO3 was investigatedby (Neuman et al., 1999), who found PFA tubing to provide the best time responsewhen kept at temperatures above 20◦C. Different from our results, these authors foundPFA and FEP tubing to exhibit a similar memory for HNO3, whereas we found repeat-edly FEP to provide a faster time response. The reasons for the differing results are20
not clear.
4.3. Converter
During long series of laboratory tests for this and other gold converters deployed, e.g.,at Schauinsland (Flocke et al., 1998; Patz et al., 2000) and aboard the UK research
1Patz, H. W., Volz-Thomas, A., Hegglin, M., Brunner, D., and Schmidt, U.: In-situ comparisonof the NOy instruments flown in MOZAIC and SPURT, Atmos. Chem. Phys. Discuss., inpreparation, 2004.
6165

ACPD4, 6149–6183, 2004
NOy instrumentaboard MOZAIC
in-service aircraft
A. Volz-Thomas et al.
Title Page
Abstract Introduction
Conclusions References
Tables Figures
J I
J I
Back Close
Full Screen / Esc
Print Version
Interactive Discussion
© EGU 2004
aircraft C-130 (Gerbig et al., 1996), we always found the same behaviour in terms ofthe temperature dependence of the conversion efficiency for NO2 and HNO3, as wellas PAN and other organic nitrates. Therefore, only the conversion efficiency for NO2is checked in flight. The conversion efficiency for HNO3 is regularly checked duringmaintenance (see above).5
Our results for HNO3 (Fig. 9) are somewhat different to those obtained by Fahey etal. (1985), who found the conversion efficiency for HNO3 to be 5–10% smaller than forNO2. A possible explanation is the larger ratio of tube length to sample flow rate of ourconverter, which was designed for flow rates up to 300 ml/min. The longer tubes werechosen because of the long operating cycles of the MOZAIC instrument, without the10
possibility for cleaning in between flights.Different from Kliner et al. (1997), we found no significant pressure dependence
of the conversion efficiency for NO2 and HNO3, likely because of the length of ourconverter and the relatively homogeneous temperature profile.
4.4. Specifications and outlook15
The features of the MOZAIC NOy-instrument are summarised in Table 1. The sensi-tivity of 0.4–0.7 cps/ppt with the zero mode signal of about 200 cps gives a statisticaldetection limit of better than ±30–50 ppt for an integration time of 4 s, i.e. the data stor-age rate for the MOZAIC data base, and ±150–300 ppt at the maximum resolution ofthe instrument (10 Hz). The inaccuracy arising from uncertainties in the sensitivity of20
the CLD and the conversion efficiency during a flight period are ±5% each. A relativelylarge source of inaccuracy comes from the instrumental background, which in flightis usually 100–200 ppt with an uncertainty of 30–60 ppt. Hence, the overall statisticalerror of a 4 s NOy measurement (in ppt) is
∆NOy = ±(A ∗ µ(NOy) + B)25
with A = 0.07 and 60 ppt <B<80 ppt.
6166

ACPD4, 6149–6183, 2004
NOy instrumentaboard MOZAIC
in-service aircraft
A. Volz-Thomas et al.
Title Page
Abstract Introduction
Conclusions References
Tables Figures
J I
J I
Back Close
Full Screen / Esc
Print Version
Interactive Discussion
© EGU 2004
The contributions are added arithmetically to provide a conservative estimate of theoverall error, because the absence of correlation between the two terms is not easilyargued.
Additional errors arise from interferences and, in case of sharp transients, from thememory for HNO3. Atmospheric mixing ratios of HCN in the range of 100–300 ppt5
were reported for springtime over the Pacific during TRACE-P (Singh et al., 2003),with somewhat higher concentrations found in biomass burning plumes. Thein-situ measurements were in good agreement with the tropospheric column ofHCN (4×1015 cm−2) measured over Japan (Zhao et al., 2000). HCN-columns of2–3×1015 cm−2 obtained over Jungfraujoch and Mauna Loa (Rinsland et al., 1999;10
Rinsland et al., 2000), would lead to similar tropospheric mixing ratios, because of thehigher altitude of the observatories. Therefore, a significant fraction of the NOy mixingratios observed in the troposphere with the MOZAIC NOy instrument could in fact bedue to HCN. In the lower stratosphere on the other hand, the fraction of HCN is gener-ally below 10% because of the higher concentrations of HNO3 (Neuman et al., 1999)15
and the slightly lower values of HCN.The NOy instrument has been flown continuously aboard a MOZAIC A-340 aircraft
operated by Deutsche Lufthansa on more than 1800 flights (>10 000 h with data) sinceApril 2001. About 40% of the data recovered had a lower accuracy than describedabove, because of deterioration of the sensitivity or conversion efficiency or because20
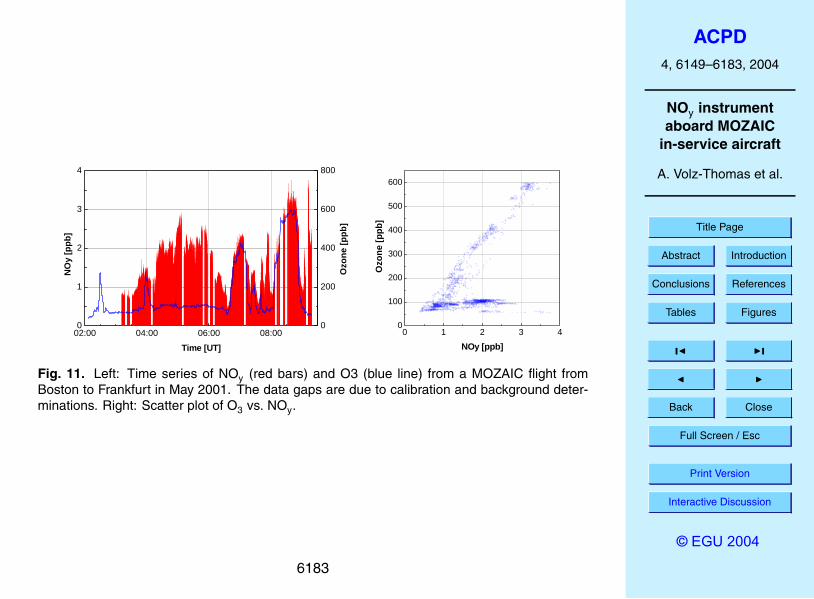
of increased memory, usually due to contamination occurring during an operation cy-cle. Such data were not submitted to the MOZAIC data base. An example for theperformance during flight is given in Fig. 11. Both NOy and O3 mixing ratios increasewhenever the aircraft enters the stratosphere. In the troposphere, NOy shows a muchlarger variance than O3. The right panel shows the scatter plot between O3 and NOy.25
The slope of 200 (mole O3 per mole NOy ) found in the stratospheric data, correspondsto a NOy/O3 ratio of 5 ppt/ppb, which is slightly higher than the results obtained duringflights with the NASA ER-2 aircraft (Fahey et al., 1996; Murphy et al., 1993).
An in-flight comparison with a research instrument operated by ETH-Zurich was con-
6167
ACPD4, 6149–6183, 2004
NOy instrumentaboard MOZAIC
in-service aircraft
A. Volz-Thomas et al.
Title Page
Abstract Introduction
Conclusions References
Tables Figures
J I
J I
Back Close
Full Screen / Esc
Print Version
Interactive Discussion
© EGU 2004
ducted in April 2003. As will be discussed in detail in Patz et al. (in preparation, 2004)1,the two instruments agreed within their specified uncertainties. The systematicallylower measurements of the MOZAIC instrument may, however, indicate the presenceof small (<15%) losses of HNO3 in the MOZAIC inlet system.
Acknowledgements. The authors like to thank R. Gorlich, P. Ladwig, J. Probst, and J. Volkmar5
of Lufthansa Technik for their expert assistance during the process of certification and adapta-tion of the instrument aboard the A-340 and in the development of the necessary maintenanceprocedures. H. Franke and the team from enviscope are thanked for construction of the in-strument frame and H. Smit for stimulating discussions and valuable information on the Rose-mount probe. W. Strater kindly prepared the drawing of the Rosemount probe. The support for10
MOZAIC by the European Commission, DG Research (contracts no. EVK2-1999-00015 andENV4-CT96-0321) is greatly acknowledged.
References
Brunner, D., Staehelin, J., Jeker, D., Wernli, H., and Schumann, U.: Nitrogen oxides and ozonein the tropopause region of the Northern Hemisphere: Measurements from commercial air-15
craft in 1995/96 and 1997, J. Geophys. Res., 106, 27 673–27 699, 2001.Chameides, W. and Walker, J. C. G.: A Photochemical Theory of Tropospheric Ozone, J. Geo-
phys. Res., 78, 8751–8760, 1973.Clough, P. N. and Thrush, B. A.: Mechanism of the Chemiluminescent Reaction Between NO
and O3, Transactions of the Faraday Society, 63, 915–925, 1967.20
Crutzen, P. J.: A discussion of the chemistry of some minor constituents in the stratosphereand troposphere, Pure Appl. Geophys., 106–108, 1385–1399, 1973.
Drummond, J. W., Volz, A., and Ehhalt, D. H.: An optimized chemiluminescence detector fortropospheric NO measurements, J. Atmos. Chem., 2, 287–306, 1985.
Emmons, L. K., Carroll, M. A., Hauglustaine, D. A., Brasseur G. P., Atherton, C., Penner, J.,25
Sillman, S., Levy II, H., Rohrer, F., Wauben, W. M. F., Velthoven, P. F. J. V., Wang, Y., Jacob,D., Bakwin, P., Dickerson, R., Doddridge, B., Gerbig, C., Honrath, R., Hubler, G., Jaffe, D.,Kondo, Y., Munger, J. W., Torres, A., and Volz-Thomas, A.: Climatologies of NOx and NOy:a comparison of data and models, Atm. Env., 31, 1851–1904, 1997.
6168
ACPD4, 6149–6183, 2004
NOy instrumentaboard MOZAIC
in-service aircraft
A. Volz-Thomas et al.
Title Page
Abstract Introduction
Conclusions References
Tables Figures
J I
J I
Back Close
Full Screen / Esc
Print Version
Interactive Discussion
© EGU 2004
Emmons, L. K., Hauglustaine, D. A., Muller, J.-F., Caroll, M. A., Brasseur, G. P., Brunner, D.,Staehelin, J., Thouret, V., and Marenco, A.: Data composites of airborne observations oftropospheric ozone and its precursors, J. Geophys. Res., 105, 20 497–20 538, 2000.
Fahey, D. W., Eubank, C. S., H’ubler, G., and Fehsenfeld, F. C.: Evaluation of a Catalytic Reduc-tion Technique for the Measurement of Total Reactive Odd-Nitrogen NOy in the Atmosphere.5
J. Atmos. Chem., 3, 435–468, 1985.Fahey, D. W., Donnelly, S. G., Keim, E. R., Gao, R. S., Wamsley, R. C., Delnegro, L. A., Wood-
bridge, E. L., Proffitt, M. H., Rosenlof, K. H., Ko, M. K. W., Weisenstein, D. K., Scott, C. J.,Nevison, C., Solomon, S., and Chan, K. R.: In situ observations of NOy, O3, and the NOy/O3ratio in the lower stratosphere. Geophys. Res. Lett., 23, 1653–1656, 1996.10
Fahey, D. W., Gao, R. S., Carslaw, K. S., Kettleborough, J., Popp, P. J., Northway, M. J., Holecek,J. C., Ciciora, S. C., McLaughlin, R. J., Thompson, T. L., Winkler, R. H., Baumgardner, D. G.,Gandrud, B., Wennberg, P. O., Dhaniyala, S., McKinney, K., Peter, T., Salawitch, R. J., Bui, T.P., Elkins, J. W., Webster, C. R., Atlas, E. L., Jost, H., Wilson, J. C., Herman, R. L., Kleinbohl,A., and v. Konig, M.: The Detection of Large HNO3-Containing Particles in the Winter Arctic15
Stratosphere, Science, 291, 1026–1031, 2001.Flocke, F., Volz-Thomas, A., Buers, H.-J., Patz, W., Garthe, H.-J., and Kley, D.: Long-term
Measurements of Alkyl Nitrates in Southern Germany, 1. General Behaviour, Seasonal andDiurnal Variation, J. Geophys. Res., 103, 5729–5746, 1998.
Gerbig, C., Kley, D., Volz-Thomas, A., Kent, J., Dewey, K., and McKenna, D. S.: Fast-Response20
Resonance Fluorescence CO Measurements Aboard the C-130: Instrument Characteriza-tion and Measurements Made During NARE ’93, J. Geophys. Res., 101, 29 229–29 238,1996.
Gierens, K., Schumann, U., Helten, M., Smit, H. G. J., and Marenco, A.: A distribution law forrelative humidity in the upper troposphere and lower stratosphere derived from three years25
of MOZAIC measurements, Ann. Geophys., 17, 1218–1226, 1999,SRef-ID: 1432-0576/ag/1999-17-1218.
Helten, M., Smit, H. G. J., Straeter, W., Kley, D., Nedelec, P., Zoger, M., and Busen, R.: Calibra-tion and Performance of Automatic Compact Intrumentation for the Measurement of RelativeHumidity from Passenger Aircraft, J. Geophys. Res., 103, 25 643–25 652, 1998.30
Helten, M., Smit, H. G. J., Kley, D., Ovarlez, J., Schlager, H., Baumann, R., Schumann, U.,Nedelec, P., and Marenco, A.: In-flight intercomparison of MOZAIC and POLINAT watervapor measurements, J. Geophys. Res., 104, 26 087–26 096, 1999.
6169
ACPD4, 6149–6183, 2004
NOy instrumentaboard MOZAIC
in-service aircraft
A. Volz-Thomas et al.
Title Page
Abstract Introduction
Conclusions References
Tables Figures
J I
J I
Back Close
Full Screen / Esc
Print Version
Interactive Discussion
© EGU 2004
Kliner, D. A. V., Daube, B. C., Burley, J. D., and Wofsy, S. C.: Laboratory investigation of thecatalytic reduction technique for measurement of atmospheric NOy, J. Geophys. Res., 102,10 759–10 776, 1997.
Liu, S. C., Kley, D., McFarland, M., Mahlman, J. D., and Levy, H.: On the origin of troposphericozone, J. Geophys. Res., 85, 7546–7552, 1980.5
Marenco, A., Thouret, V., Nedelec, P., Smit, H., Helten, M., Kley, D., Karcher, F., Simon, P., Law,K., Pyle, J., Poschmann, G., von Wrede, R., Hume, C., and Cook, T.: Measurement of ozoneand water vapor by Airbus in-service aircraft: The MOZAIC airborne program, An overview,Geophys. Res.-Atmos., 103, 25 631–25 642, 1998.
Murphy, D. M., Fahey, D. H., Proffitt, M. H., Liu, S. C., Chan, K. R., Eubank, C. S., Kawa, S. R.,10
and Kelly, K. K.: Reactive Nitrogen and its Correlation With Ozone in the Lower Stratosphereand Upper Troposhere, J. Geophys. Res., 98, 8751–8773, 1993.
Murphy, D. M. and Fahey, D. W.: An Estimate of the Flux of Stratospheric Reactive Nitrogenand Ozone into the Troposphere, J. Geophys. Res., 99, 5325–5332, 1994.
Neuman, J. A., Huey, L. G., Ryerson, T. B., and Fahey, D. W.: Study of Inlet Materials for15
Sampling Atmospheric Nitric Acid, Environmental Science & Technology, 33, 1133–1136,1999.
Neuman, J. A., Gao, R. S., Fahey, D. W., Holecek, J. C., Ridley, B. A., Walega, J. G., Grahek,F. E., Richard, E. C., McElroy, C. T., Thompson, T. L., Elkins, J. W., Moore, F. L., and Ray, E.A.: In situ measurements of HNO3, NOy, NO, and O3 in the lower stratosphere and upper20
troposphere, Atm. Env., 35, 5789–5797, 2001.Patz, H.-W., Corsmeier, U., Glaser, K., Kalthoff, N., Kolahgar, B., Klemp, D., Lerner, A.,
Neininger, B., Schmitz, T., Schultz, M., Slemr, J., Vogt, U., and Volz-Thomas, A.: Measure-ments of trace gases and photolysis frequencies during SLOPE96 and a coarse estimate ofthe local OH concentration from HNO3 formation, J. Geophys. Res., 105, 1563–1583, 2000.25
Richter, A. and Burrows, J. P.: Retrieval of tropospheric NO2 from GOME measurements, Adv.Space Res., 29, 1673–1683, 2002.
Ridley, B. A. and Grahek, F. E.: A small, low flow, high sensitivity reaction vessel forNO/O3 chemiluminescence detectors, Journal Atmospheric Oceanic Technology, 7, 307–311, 1990.30
Rinsland, C. P., Goldman, A., Murcray, F. J., Stephen, T. M., Pougatchev, N. S., Fishman, J.,David, S. J., Blatherwick, R. D., Novelli, P. C., Jones, N. B., and Connor, B. J. : Infrared solarspectroscopic measurements of free tropospheric CO, C2H6, and HCN above Mauna Loa,
6170

ACPD4, 6149–6183, 2004
NOy instrumentaboard MOZAIC
in-service aircraft
A. Volz-Thomas et al.
Title Page
Abstract Introduction
Conclusions References
Tables Figures
J I
J I
Back Close
Full Screen / Esc
Print Version
Interactive Discussion
© EGU 2004
Hawaii: Seasonal variations and evidence for enhanced emissions from the Southeast Asiantropical fires of 1997–1998. J. Geophys. Res., 104, 18 667–18 680, 1999.
Rinsland, C. P., Mahieu, E., Zander, R., Demoulin, P., Forrer, J., and Buchmann, B.: Freetropospheric CO, C2H6, and HCN above central Europe: Recent measurements from theJungfraujoch station including the detection of elevated columns during 1998, J. Geophys.5
Res., 105, 24 235–24 249, 2000.Ryerson, T. B., Huey, L. G., Knapp, K., Neuman, J. A., Parrish, D. D., Sueper, D. T., and Fehsen-
feld, F. C.: Design and initial characterization of an inlet for gas-phase NOy measurementsfrom aircraft, J. Geophys. Res., 104, 5483, 1999.
Singh, H. B., Salas, L., Herlth, D., Kolyer, R., Czech, E., Viezee, W., Li, Q., Jacob, D. J., Blake,10
D., Sachse, G., Harward, C. N., Fuelberg, H., Kiley, C. M., Zhao, Y., and Kondo, Y.: In situmeasurements of HCN and CH3CN over the Pacific Ocean: Sources, sinks, and budgets, J.Geophys. Res., 108, 8795, 2003.
Thouret, V., Marenco, A., Nedelec, P., and Grouhel, C.: Ozone climatologies at 9–12 altitudeas seen by the MOZAIC airborne program between September 1994 and August 1996, J.15
Geophys. Res., 103, 25 653–25 679, 1998.Thouret, V., Cho, J. Y. N., Newell, R. E., Marenco, A., and Smit, H. G. J.: General characteristics
of troposphereic trace constituent layers observed inthe MOZAIC program, J. Geophys. Res.,105, 17 379–17 392, 2000.
Weinheimer, A. J., Campos, T. L., and Ridley, B. A.: The in-flight sensitivity of gold-tube NOy20
converters to HCN, Geophys. Res. Lett., 25, 3943–3946, 1998.Zhao, Y., Kondo, Y., Murcray, F. J., Liu, X., Koike, M., Irie, H., Strong, K., Suzuki, K., Sera,
M., and Ikegami, M.: Seasonal variations of HCN over northern Japan measured by ground-based infrared solar spectroscopy, Geophys. Res. Lett., 27, 2085–2088, 2000.
6171

ACPD4, 6149–6183, 2004
NOy instrumentaboard MOZAIC
in-service aircraft
A. Volz-Thomas et al.
Title Page
Abstract Introduction
Conclusions References
Tables Figures
J I
J I
Back Close
Full Screen / Esc
Print Version
Interactive Discussion
© EGU 2004
Table 1. Specifications of the MOZAIC NOy-instrument.
Specification Quantity Remarks
Size (w, l, h) 30×70×30 cm3 including calibration system and pump
Weight 50 kg including fixation and 20L O2 cylinder
Sensitivity 0.5 cps/ppb 0.3–0.7, depending on PMT etc.
data acquisition rate 10 Hz PMT signal
1 Hz housekeeping data
time resolution 0.1 s (NOx)
20 s (HNO3) due to memory in the inlet line
Endurance >5 weeks assuming full operation of aircraft
6172

ACPD4, 6149–6183, 2004
NOy instrumentaboard MOZAIC
in-service aircraft
A. Volz-Thomas et al.
Title Page
Abstract Introduction
Conclusions References
Tables Figures
J I
J I
Back Close
Full Screen / Esc
Print Version
Interactive Discussion
© EGU 2004
Vaccum pump
MV4
P-1
MV 2b
MV 2a
Pre-reaction volume 25 ml
Pressure
controlerFR11 MV 0a
Relief
valve
PR1
Flexible SS line
FR9
FR4
MV9
FR1
Relief valve 10 psi
FR6
MV5
PS3
PS4
PS5
N2 (0.4L, 120 bar)
with 10 ppm NO
PR2
9 bar
PR3
3 bar
MV6PS2
FR5
Hg lamp
PhotometerPMT
MV8
PS1
FR7
MV1
MV3
FR8
FR12
Inlet
manifold
Rosemount probe
Inlet plate
Flight direction
PS7
Cabin pressure
Ozone
Scrubber
Vent
FR16
Burst disc
MV0b
Shutter
Discharge tube 1.2 bar
Relief valve 15 psi
FR2 FR3
PS6
Reaction
chamber
10 mbar 20°C
PMT
-12°C
Fig. 1. Schematics of the MOZAIC NOy-instrument (FRn: flow restrictors, i.e., capillaries orcritical orifices; PSn: pressure sensors; PR: pressure regulators; MVn: magnetic valves).
6173

ACPD4, 6149–6183, 2004
NOy instrumentaboard MOZAIC
in-service aircraft
A. Volz-Thomas et al.
Title Page
Abstract Introduction
Conclusions References
Tables Figures
J I
J I
Back Close
Full Screen / Esc
Print Version
Interactive Discussion
© EGU 2004
PMTReaction
cell
Heat sink
Peltier elements
Pre-amplifier
WG 320
RG 610
Sample air
Ozone
Pump
Heat sink
Peltier elements
Fig. 2. Details of the CLD.
6174
ACPD4, 6149–6183, 2004
NOy instrumentaboard MOZAIC
in-service aircraft
A. Volz-Thomas et al.
Title Page
Abstract Introduction
Conclusions References
Tables Figures
J I
J I
Back Close
Full Screen / Esc
Print Version
Interactive Discussion
© EGU 2004
gold tubeglasstube
0
50
100
150
200
250
300
350
0 20 40 60 80 100 120 140 160 180 200
Distance from tube entrance [mm]
Tem
per
atu
re [
°C]
Fig. 3. Temperature profile measured inside the tube for a setting of the temperature controllerof 300C.
6175

ACPD4, 6149–6183, 2004
NOy instrumentaboard MOZAIC
in-service aircraft
A. Volz-Thomas et al.
Title Page
Abstract Introduction
Conclusions References
Tables Figures
J I
J I
Back Close
Full Screen / Esc
Print Version
Interactive Discussion
© EGU 2004
Go
ldtu
be G
lass
tub
e
FE
Pin
let
SS
tub
e
Hydrogen
NO/NOx cal gas
Ambient IN Ambient OUT
Bypass AuC
Zero air
Pressure
Fig. 4. Details of the inlet manifold and connection of the catalytic converter.
6176
ACPD4, 6149–6183, 2004
NOy instrumentaboard MOZAIC
in-service aircraft
A. Volz-Thomas et al.
Title Page
Abstract Introduction
Conclusions References
Tables Figures
J I
J I
Back Close
Full Screen / Esc
Print Version
Interactive Discussion
© EGU 2004
equilibrium pressure of H2 over alloy HS-20
resultingH2-flow rate
0
50
100
0 20 40 60 80 100
Temperature [°C]
Pre
ssu
re [
bar
]
0
0.5
1
Flo
w r
ate
[Nm
l/min
]
Fig. 5. Temperature dependence of the H2 pressure over the Ti-alloy (triangles) and the corre-sponding H2 flow rate (diamonds).
6177

ACPD4, 6149–6183, 2004
NOy instrumentaboard MOZAIC
in-service aircraft
A. Volz-Thomas et al.
Title Page
Abstract Introduction
Conclusions References
Tables Figures
J I
J I
Back Close
Full Screen / Esc
Print Version
Interactive Discussion
© EGU 2004
Fig. 6. Drawing of the Rosemount probe and the NOy inlet line. The arrows indicate the airflow.
6178
ACPD4, 6149–6183, 2004
NOy instrumentaboard MOZAIC
in-service aircraft
A. Volz-Thomas et al.
Title Page
Abstract Introduction
Conclusions References
Tables Figures
J I
J I
Back Close
Full Screen / Esc
Print Version
Interactive Discussion
© EGU 2004
Fig. 7. Example of the raw data sampled at 10 Hz during in-flight operation with several spikesof recent plumes.
6179

ACPD4, 6149–6183, 2004
NOy instrumentaboard MOZAIC
in-service aircraft
A. Volz-Thomas et al.
Title Page
Abstract Introduction
Conclusions References
Tables Figures
J I
J I
Back Close
Full Screen / Esc
Print Version
Interactive Discussion
© EGU 2004
Fig. 8. Example for an in-flight calibration cycle (red/green: CLD measure modes ambient airfor NOy and NO; yellow: CLD zero mode; blue: NO calibration added to ambient in NOy andNO modes; turquois: NO2 calibration in NOy and NO modes; pink: zero air in NOy and NOmodes).
6180

ACPD4, 6149–6183, 2004
NOy instrumentaboard MOZAIC
in-service aircraft
A. Volz-Thomas et al.
Title Page
Abstract Introduction
Conclusions References
Tables Figures
J I
J I
Back Close
Full Screen / Esc
Print Version
Interactive Discussion
© EGU 2004
-0.2
0
0.2
0.4
0.6
0.8
1
1.2
0 100 200 300 400
T (°C)
Co
nve
rsio
n e
ffic
ien
cy
HCN_H2
HCN_CO
HNO3_H2
HNO3_CO
NO2_H2
NO2_CO
Fig. 9. Conversion efficiency of the gold converter for NO2 (circles, 7.7 ppb), HNO3 (trian-gles, 9.7 ppb), and HCN (squares, 71 ppb), as a function of temperature at a pressure of250 mb. Open and filled symbols refer to experiments with CO and H2, respectively (flow rate0.2 ml/min). Results for NH3 are not shown, as the conversion efficiency was always <1% attemperatures up to 400◦C. The temperature scale at the abscissa corresponds to the setting ofthe controller. The actual temperature of the gold tube is somewhat lower (see Fig. 3).
6181

ACPD4, 6149–6183, 2004
NOy instrumentaboard MOZAIC
in-service aircraft
A. Volz-Thomas et al.
Title Page
Abstract Introduction
Conclusions References
Tables Figures
J I
J I
Back Close
Full Screen / Esc
Print Version
Interactive Discussion
© EGU 2004
0 200 4000
2000
4000
6000
8000
10000
12000
14000
16000
t90
= 8s
goldconverter
NO
y-S
igna
l[c
ps]
Time [s]200 400
t90
= 27s
FEP 20 cm
200 400
t90
= 107s
FEP 200 cm
200 400
t90
= 350s
PFA 30 cm
200 400 600 800
t90
= 405s
PFA 400 cm
0 50 100 150 200
0
20
40
60
80
100
-1.5 -1.0 -0.5 0.0 0.5 1.0 1.5 2.0
0
20
40
60
80
100
HNO3
P(Inlet)=217 hPa
HN
O3S
ignal[
%]
Time (s)
NO2
P(Inlet)=217 hPaN
O2S
ignal[
%]
Time (s)
90%: Increase ~ 1.0 s
Decrease ~ 1.1 s
90%: Increase ~ 150 s
Decrease ~ 140 s
0 50 100 150 200
0
20
40
60
80
100
-1.5 -1.0 -0.5 0.0 0.5 1.0 1.5 2.0
0
20
40
60
80
100
HNO3
P(Inlet)=217 hPa
HN
O3S
ignal[
%]
Time (s)
NO2
P(Inlet)=217 hPaN
O2S
ignal[
%]
Time (s)
90%: Increase ~ 1.0 s
Decrease ~ 1.1 s
90%: Increase ~ 150 s
Decrease ~ 140 s
Fig. 10. Time response of the gold tube and different inlet line materials (upper panel) and timeresponse of the actual MOZAIC inlet line (80 cm FEP) for NO2 and HNO3 (lower panel).
6182
ACPD4, 6149–6183, 2004
NOy instrumentaboard MOZAIC
in-service aircraft
A. Volz-Thomas et al.
Title Page
Abstract Introduction
Conclusions References
Tables Figures
J I
J I
Back Close
Full Screen / Esc
Print Version
Interactive Discussion
© EGU 2004
02:00 04:00 06:00 08:000
1
2
3
4
0
200
400
600
800
0 1 2 3 40
100
200
300
400
500
600
NO
y [p
pb
]
Time [UT]O
zon
e [p
pb
]
Ozo
ne
[pp
b]
NOy [ppb]
Fig. 11. Left: Time series of NOy (red bars) and O3 (blue line) from a MOZAIC flight fromBoston to Frankfurt in May 2001. The data gaps are due to calibration and background deter-minations. Right: Scatter plot of O3 vs. NOy.
6183