1
Nowcasting Bacteria Levels and Beach Advisories at Lake Erie Beaches Donna S. Francy 1 , Robert A. Darner 1 , Erin E. Bertke 1 , and Jill Lis 2 1 U.S. Geological Survey (USGS) Ohio Water Science Center, Columbus, OH 2 Cuyahoga County Board of Health, Parma, OH Swim advisories issued by beach managers in Ohio are based on concentrations of the indicator bacterium Escherichia coli (E. coli). Because concentrations may change between the time of sampling and the reporting of results (18–24 hours), advisories issued on the pre- vious day’s E. coli may cause unwarranted loss of rec- reational access or may permit swimming when there is an unknown, unacceptable level of risk. Predictive models have been recognized as alternative tools to pro- vide real-time assessments of recreational water quality. Work is being done to develop and test models to pre- dict E. coli concentrations at five Ohio Lake Erie beach- es. For Huntington, where investigations are further along than at the other beaches, predictions based on a model have been available to the public through an In- ternet-based “nowcasting” system since May 30, 2006. The other beach models are being validated for the first time in 2006 and will be added to the nowcasting web site in the future. Models for predicting E. coli concentrations are being developed for five Lake Erie beaches. Daily data on E. coli concentrations and environ- mental and water-quality variables were collect- ed by local agencies to develop and test predictive models. Samples were collected at 2- to 3-ft depths in the swim- ming area on weekdays between 8 a.m. and noon. Sam- ples were collected at two or three locations at each beach, and resulting concentrations were averaged for analysis. Samples were analyzed for E. coli by means of the mTEC or modified mTEC membrane-filtration methods. Associated environmental and water-quality data (water temperature, rainfall, wave height, etc.) were collected by field crews or compiled from a variety of sources. Collecting samples and measuring water quality at Lakeview, Lorain, Ohio E. coli concentrations at Lake Erie beaches, 2004–2005 [CFU/100 mL, colony-forming units per 100 milliliters] E. coli concentration (CFU/100 mL) 46 300 210 70 55 Median b 1 11 9 1 2 Min 54 (16.9) 6,600 319 Huntington a 57 (60.0) 4,200 95 Lakeview 39 (43.8) 14,000 89 Lakeshore 51 (28.3) 6,900 188 Villa Angela 24 (12.5) 1,900 192 Edgewater Number (%) of days exceeding 235 Max Number of samples Beach a Data were collected in 20002005. The relations between E. coli concentrations and possible model variables were examined. Models are based on the relations between explanatory variables and E. coli. Statistical tests were done and plots were constructed to determine the strength of as- sociations between E. coli and explanatory variables. Huntington 2000-2004: Relation between E. coli and turbidity. r =0.51 p <0.0001 0.0 0.5 1.0 1.5 2.0 2.5 3.0 3.5 4.0 0 50 100 150 200 Turbidity, in nephelometric turbidity ratio units Log 10 Escherichia coli, in colony- forming units per 100 mL The best model for each beach was based on a unique combination of explanatory variables. Beach-specific models were developed using a statis- tical technique called multiple-linear regression. The output from the models is the probability of exceeding the single-sample maximum bathing-water standard of 235 CFU/100 mL. A threshold probability associated with too great a chance of exceeding the bathing-water standard was determined for each beach by maximiz- ing the number of correct responses while minimizing the number of false negative responses. Water quality advisories are issued when the model predicts a prob- ability equal to or greater than the threshold probability. The Huntington 2000-2005 model was validated in 2006 and compared to using the current method. Lake Erie beach models Turbidity Wave height Day of the year Rainfall 48 hr, weighted Turbidity Wind direction Day of the year Turbidity Water temperature Rainfall 72 hr, weighted Turbidity Wave height Rainfall 24 hr Water temperature Turbidity Wave height Rainfall 72 hr, weighted Lake level Variables in model 27 38 32 31 29 Threshold probability 0.42 2000–2005 Huntington 0.44 2004–2005 Lakeview 0.35 2004–2005 Lakeshore 0.38 2004–2005 Villa Angela 0.40 2004–2005 Edgewater R 2 of model a Time period for model development Beach a R 2 is the fraction of the variation in Escherichia coli concentration explained by the model. Predictions based on a model are available to the public through an Internet-based “nowcasting” system for Huntington. www.ohionowcast.info Conclusions and next steps Statistical techniques can be used to generate beach- specific models for Lake Erie beaches using a combi- nation of three or more explanatory variables. A model for Huntington based on rainfall, wave height, day of the year, and turbidity performed better than using yesterday’s E. coli during 2006. Models will be validated and refined in 2007. As the models are validated, steps may be taken to fur- ther refine and improve them. Possible improvements include obtaining more accurate measurements of wave heights, measuring continuous turbidity, obtain- ing data from local rain gages, and incorporating rapid analytical methods for E. coli into the models. Results in 2006 51 84 85 Sample size 74 (14/19) 28 (9/32) 55 Previous day’s E. coli (MR) 72 (18/25) 30 (18/59) 57 Previous day’s E. coli (all days) 42 (11/26) 10 (6/59) 80 Hunt 2000- 05 Model False negative (number) False positive (number) Correct Percentage of responses Predictive tool For 2006, the Huntington model yielded more correct responses and fewer false positive and false negative re- sponses than did the current method for assessing recre- ational water quality (previous day’s E. coli concentra- tion). This study was done by the USGS in cooperation with the Cuyahoga County Board of Health, the Ohio Lake Erie Office, the Northeast Ohio Regional Sewer District, and the Ohio Water Development Authority Huntington Reservation, Bay Village, Ohio

Nowcasting Bacteria Levels and Beach Advisories at … · Nowcasting Bacteria Levels and Beach Advisories at Lake Erie Beaches Donna S. Francy1, Robert A. Darner1, Erin E. Bertke1,

Embed Size (px)

Citation preview

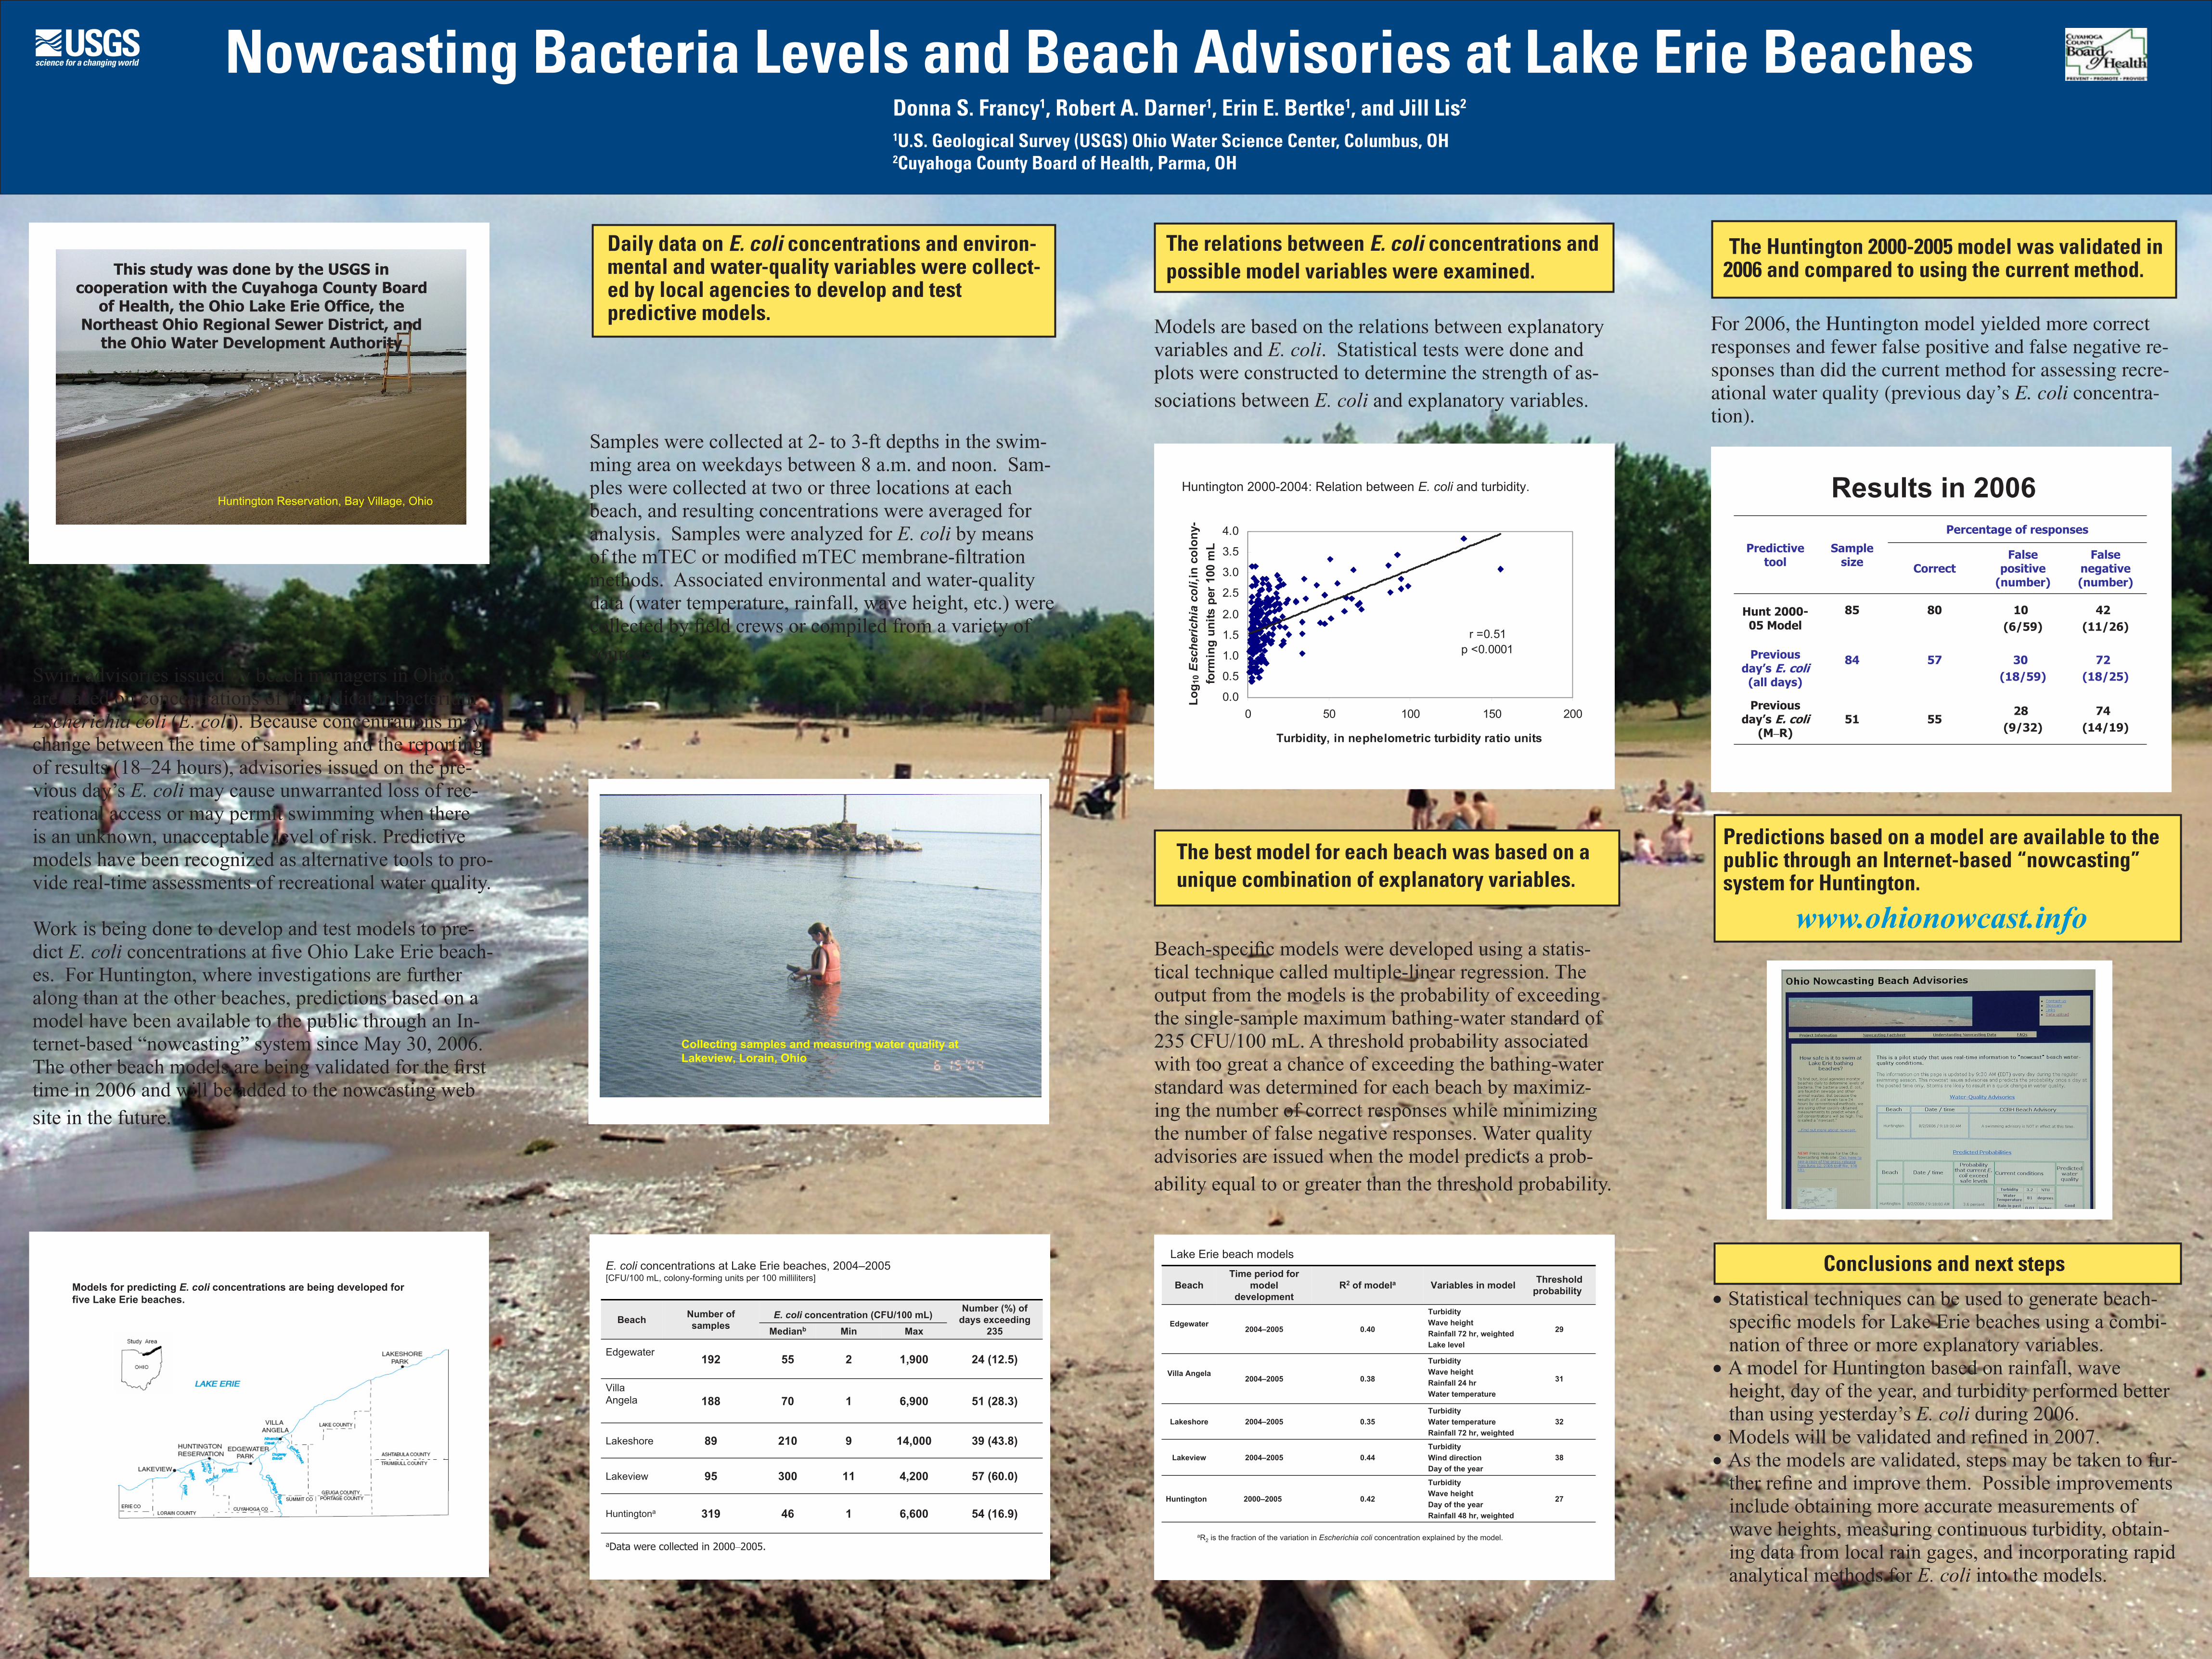
Nowcasting Bacteria Levels and Beach Advisories at Lake Erie BeachesDonna S. Francy1, Robert A. Darner1, Erin E. Bertke1, and Jill Lis2

1U.S. Geological Survey (USGS) Ohio Water Science Center, Columbus, OH2Cuyahoga County Board of Health, Parma, OH

Swim advisories issued by beach managers in Ohio are based on concentrations of the indicator bacterium Escherichia coli (E. coli). Because concentrations may change between the time of sampling and the reporting of results (18–24 hours), advisories issued on the pre-vious day’s E. coli may cause unwarranted loss of rec-reational access or may permit swimming when there is an unknown, unacceptable level of risk. Predictive models have been recognized as alternative tools to pro-vide real-time assessments of recreational water quality.

Work is being done to develop and test models to pre-dict E. coli concentrations at five Ohio Lake Erie beach-es. For Huntington, where investigations are further along than at the other beaches, predictions based on a model have been available to the public through an In-ternet-based “nowcasting” system since May 30, 2006. The other beach models are being validated for the first time in 2006 and will be added to the nowcasting web site in the future.

Models for predicting E. coli concentrations are being developed for five Lake Erie beaches.

Daily data on E. coli concentrations and environ-mental and water-quality variables were collect-ed by local agencies to develop and test predictive models.

Samples were collected at 2- to 3-ft depths in the swim-ming area on weekdays between 8 a.m. and noon. Sam-ples were collected at two or three locations at each beach, and resulting concentrations were averaged for analysis. Samples were analyzed for E. coli by means of the mTEC or modified mTEC membrane-filtration methods. Associated environmental and water-quality data (water temperature, rainfall, wave height, etc.) were collected by field crews or compiled from a variety of sources.

Collecting samples and measuring water quality at Lakeview, Lorain, Ohio

E. coli concentrations at Lake Erie beaches, 2004–2005[CFU/100 mL, colony-forming units per 100 milliliters]

E. coli concentration (CFU/100 mL)

46

300

210

70

55

Medianb

1

11

9

1

2

Min

54 (16.9)6,600319Huntingtona

57 (60.0)4,20095Lakeview

39 (43.8)14,00089Lakeshore

51 (28.3)6,900188VillaAngela

24 (12.5)1,900192Edgewater

Number (%) of days exceeding

235Max

Number of samplesBeach

aData were collected in 2000–2005.

The relations between E. coli concentrations and possible model variables were examined.

Models are based on the relations between explanatory variables and E. coli. Statistical tests were done and plots were constructed to determine the strength of as-sociations between E. coli and explanatory variables.

Huntington 2000-2004: Relation between E. coli and turbidity.

r =0.51p <0.0001

0.0

0.5

1.0

1.5

2.0

2.5

3.0

3.5

4.0

0 50 100 150 200

Turbidity, in nephelometric turbidity ratio units

Log 1

0E

sche

rich

ia c

oli,i

n co

lony

-fo

rmin

g un

its p

er 1

00 m

L

The best model for each beach was based on a unique combination of explanatory variables.

Beach-specific models were developed using a statis-tical technique called multiple-linear regression. The output from the models is the probability of exceeding the single-sample maximum bathing-water standard of 235 CFU/100 mL. A threshold probability associated with too great a chance of exceeding the bathing-water standard was determined for each beach by maximiz-ing the number of correct responses while minimizing the number of false negative responses. Water quality advisories are issued when the model predicts a prob-ability equal to or greater than the threshold probability.

The Huntington 2000-2005 model was validated in 2006 and compared to using the current method.

Lake Erie beach models

Turbidity Wave heightDay of the yearRainfall 48 hr, weighted

Turbidity Wind directionDay of the year

Turbidity Water temperatureRainfall 72 hr, weighted

Turbidity Wave heightRainfall 24 hrWater temperature

TurbidityWave heightRainfall 72 hr, weightedLake level

Variables in model

27

38

32

31

29

Thresholdprobability

0.422000–2005Huntington

0.442004–2005Lakeview

0.352004–2005Lakeshore

0.382004–2005Villa Angela

0.402004–2005Edgewater

R2 of modelaTime period for

modeldevelopment

Beach

aR2 is the fraction of the variation in Escherichia coli concentration explained by the model.

Predictions based on a model are available to the public through an Internet-based “nowcasting” system for Huntington.

www.ohionowcast.info

Conclusions and next steps • Statistical techniques can be used to generate beach- specific models for Lake Erie beaches using a combi- nation of three or more explanatory variables. • A model for Huntington based on rainfall, wave height, day of the year, and turbidity performed better than using yesterday’s E. coli during 2006. • Models will be validated and refined in 2007. • As the models are validated, steps may be taken to fur- ther refine and improve them. Possible improvements include obtaining more accurate measurements of wave heights, measuring continuous turbidity, obtain- ing data from local rain gages, and incorporating rapid analytical methods for E. coli into the models.

Results in 2006

51

84

85

Samplesize

74(14/19)

28(9/32)

55Previous

day’s E. coli(M–R)

72(18/25)

30(18/59)

57Previousday’s E. coli(all days)

42(11/26)

10(6/59)

80Hunt 2000-05 Model

Falsenegative(number)

Falsepositive

(number)Correct

Percentage of responses

Predictivetool

For 2006, the Huntington model yielded more correct responses and fewer false positive and false negative re-sponses than did the current method for assessing recre-ational water quality (previous day’s E. coli concentra-tion).

This study was done by the USGS in cooperation with the Cuyahoga County Board

of Health, the Ohio Lake Erie Office, the Northeast Ohio Regional Sewer District, and

the Ohio Water Development Authority

Huntington Reservation, Bay Village, Ohio