Embed Size (px)
Citation preview
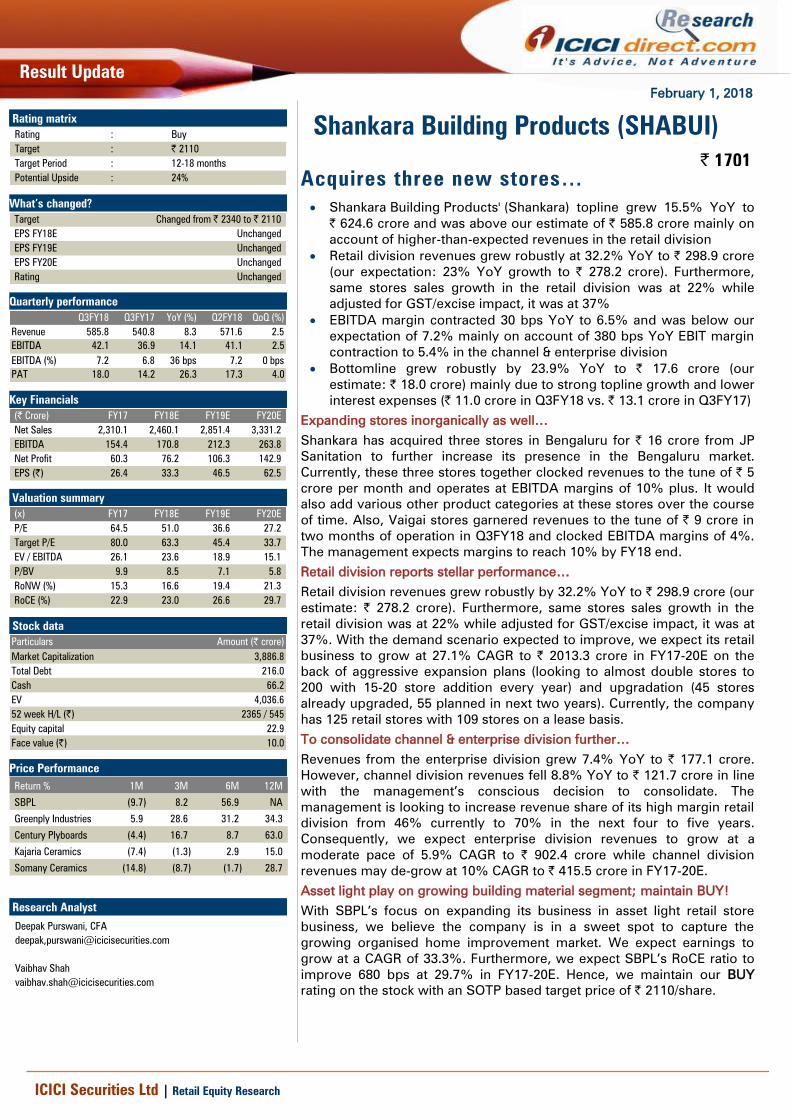
February 1, 2018
Result Update
ICICI Securities Ltd | Retail Equity Research
Acquires three new stores…
Shankara Building Products' ( Shankara) topline grew 15.5% YoY to
| 624.6 crore and was above our estimate of | 585.8 crore mainly on
account of higher-than-expected revenues in the retail division
Retail division revenues grew robustly at 32.2% YoY to | 298.9 crore
(our expectation: 23% YoY growth to | 278.2 crore). Furthermore,
same stores sales growth in the retail division was at 22% while
adjusted for GST/excise impact, it was at 37%
EBITDA margin contracted 30 bps YoY to 6.5% and was below our
expectation of 7.2% mainly on account of 380 bps YoY EBIT margin
contraction to 5.4% in the channel & enterprise division
Bottomline grew robustly by 23.9% YoY to | 17.6 crore (our
estimate: | 18.0 crore) mainly due to strong topline growth and lower
interest expenses (| 11.0 crore in Q3FY18 vs. | 13.1 crore in Q3FY17)
Expanding stores inorganically as well…
Shankara has acquired three stores in Bengaluru for | 16 crore from JP
Sanitation to further increase its presence in the Bengaluru market.
Currently, these three stores together clocked revenues to the tune of | 5
crore per month and operates at EBITDA margins of 10% plus. It would
also add various other product categories at these stores over the course
of time. Also, Vaigai stores garnered revenues to the tune of | 9 crore in
two months of operation in Q3FY18 and clocked EBITDA margins of 4%.
The management expects margins to reach 10% by FY18 end.
Retail division reports stellar performance…
Retail division revenues grew robustly by 32.2% YoY to | 298.9 crore (our
estimate: | 278.2 crore). Furthermore, same stores sales growth in the
retail division was at 22% while adjusted for GST/excise impact, it was at
37%. With the demand scenario expected to improve, we expect its retail
business to grow at 27.1% CAGR to | 2013.3 crore in FY17-20E on the
back of aggressive expansion plans (looking to almost double stores to
200 with 15-20 store addition every year) and upgradation (45 stores
already upgraded, 55 planned in next two years). Currently, the company
has 125 retail stores with 109 stores on a lease basis.
To consolidate channel & enterprise division further…
Revenues from the enterprise division grew 7.4% YoY to | 177.1 crore.
However, channel division revenues fell 8.8% YoY to | 121.7 crore in line
with the management’s conscious decision to consolidate. The
management is looking to increase revenue share of its high margin retail
division from 46% currently to 70% in the next four to five years.
Consequently, we expect enterprise division revenues to grow at a
moderate pace of 5.9% CAGR to | 902.4 crore while channel division
revenues may de-grow at 10% CAGR to | 415.5 crore in FY17-20E.
Asset light play on growing building material segment; maintain BUY !
With SBPL’s focus on expanding its business in asset light retail store
business, we believe the company is in a sweet spot to capture the
growing organised home improvement market. We expect earnings to
grow at a CAGR of 33.3%. Furthermore, we expect SBPL’s RoCE ratio to
improve 680 bps at 29.7% in FY17-20E. Hence, we maintain our BUY
rating on the stock with an SOTP based target price of | 2110/share.
Shankara Building Products (SHABUI)
| 1701
Rating matrix
Rating : Buy
Target : | 2110
Target Period : 12-18 months
Potential Upside : 24%
What’s changed?
Target Changed from | 2340 to | 2110
EPS FY18E Unchanged
EPS FY19E Unchanged
EPS FY20E Unchanged
Rating Unchanged
Quarterly performance
Q3FY18 Q3FY17 YoY (%) Q2FY18 QoQ (%)
Revenue 585.8 540.8 8.3 571.6 2.5
EBITDA 42.1 36.9 14.1 41.1 2.5
EBITDA (%) 7.2 6.8 36 bps 7.2 0 bps
PAT 18.0 14.2 26.3 17.3 4.0
Key Financials
(| Crore) FY17 FY18E FY19E FY20E
Net Sales 2,310.1 2,460.1 2,851.4 3,331.2
EBITDA 154.4 170.8 212.3 263.8
Net Profit 60.3 76.2 106.3 142.9
EPS (|) 26.4 33.3 46.5 62.5
Valuation summary
(x) FY17 FY18E FY19E FY20E
P/E 64.5 51.0 36.6 27.2
Target P/E 80.0 63.3 45.4 33.7
EV / EBITDA 26.1 23.6 18.9 15.1
P/BV 9.9 8.5 7.1 5.8
RoNW (%) 15.3 16.6 19.4 21.3
RoCE (%) 22.9 23.0 26.6 29.7
Stock data
Particulars Amount (| crore)
Market Capitalization 3,886.8
Total Debt 216.0
Cash 66.2
EV 4,036.6
52 week H/L (|) 2365 / 545
Equity capital 22.9
Face value (|) 10.0
Price Performance
Return % 1M 3M 6M 12M
SBPL (9.7) 8.2 56.9 NA
Greenply Industries 5.9 28.6 31.2 34.3
Century Plyboards (4.4) 16.7 8.7 63.0
Kajaria Ceramics (7.4) (1.3) 2.9 15.0
Somany Ceramics (14.8) (8.7) (1.7) 28.7
Research Analyst
Deepak Purswani, CFA
deepak,[email protected]
Vaibhav Shah
Page 2 ICICI Securities Ltd | Retail Equity Research
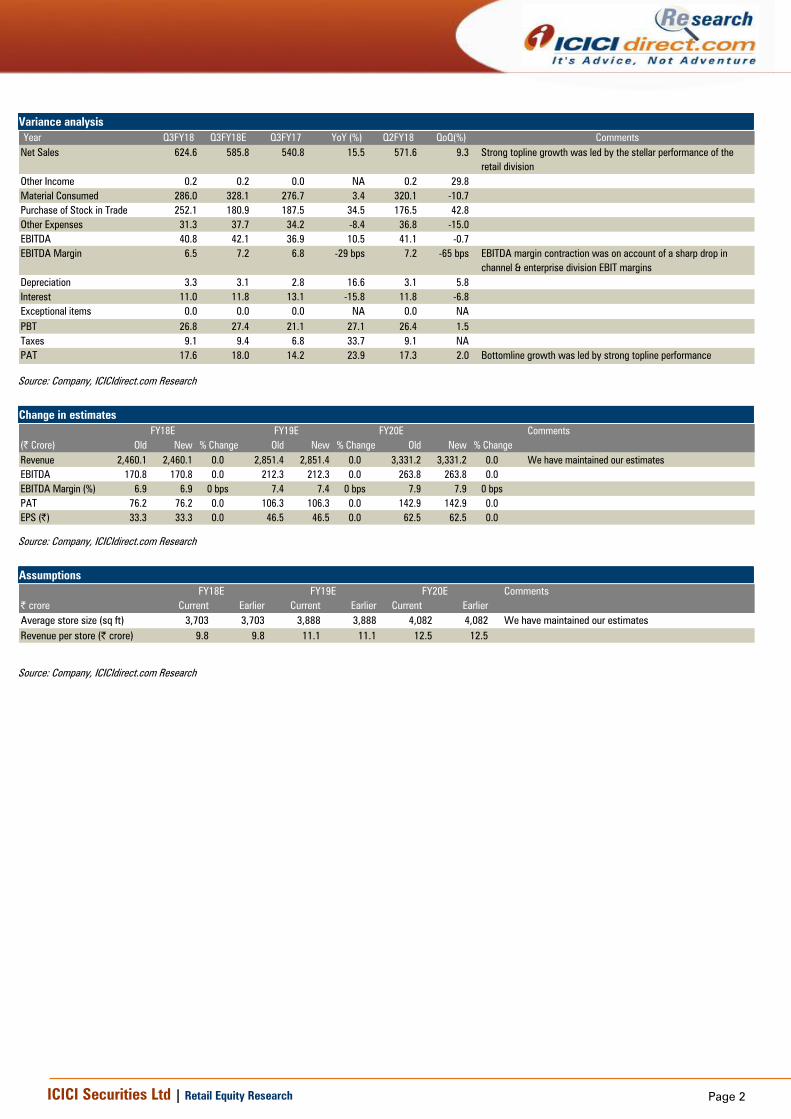
Variance analysis
Year Q3FY18 Q3FY18E Q3FY17 YoY (%) Q2FY18 QoQ(%) Comments
Net Sales 624.6 585.8 540.8 15.5 571.6 9.3 Strong topline growth was led by the stellar performance of the
retail division
Other Income 0.2 0.2 0.0 NA 0.2 29.8
Material Consumed 286.0 328.1 276.7 3.4 320.1 -10.7
Purchase of Stock in Trade 252.1 180.9 187.5 34.5 176.5 42.8
Other Expenses 31.3 37.7 34.2 -8.4 36.8 -15.0
EBITDA 40.8 42.1 36.9 10.5 41.1 -0.7
EBITDA Margin 6.5 7.2 6.8 -29 bps 7.2 -65 bps EBITDA margin contraction was on account of a sharp drop in
channel & enterprise division EBIT margins
Depreciation 3.3 3.1 2.8 16.6 3.1 5.8
Interest 11.0 11.8 13.1 -15.8 11.8 -6.8
Exceptional items 0.0 0.0 0.0 NA 0.0 NA
PBT 26.8 27.4 21.1 27.1 26.4 1.5
Taxes 9.1 9.4 6.8 33.7 9.1 NA
PAT 17.6 18.0 14.2 23.9 17.3 2.0 Bottomline growth was led by strong topline performance
Source: Company, ICICIdirect.com Research
Change in estimates
FY18E FY20E Comments
(| Crore) Old New % Change Old New % Change Old New % Change
Revenue 2,460.1 2,460.1 0.0 2,851.4 2,851.4 0.0 3,331.2 3,331.2 0.0 We have maintained our estimates
EBITDA 170.8 170.8 0.0 212.3 212.3 0.0 263.8 263.8 0.0
EBITDA Margin (%) 6.9 6.9 0 bps 7.4 7.4 0 bps 7.9 7.9 0 bps
PAT 76.2 76.2 0.0 106.3 106.3 0.0 142.9 142.9 0.0
EPS (|) 33.3 33.3 0.0 46.5 46.5 0.0 62.5 62.5 0.0
FY19E
Source: Company, ICICIdirect.com Research
Assumptions
Comments
| crore Current Earlier Current Earlier Current Earlier
Average store size (sq ft) 3,703 3,703 3,888 3,888 4,082 4,082 We have maintained our estimates
Revenue per store (| crore) 9.8 9.8 11.1 11.1 12.5 12.5
FY20EFY18E FY19E
Source: Company, ICICIdirect.com Research
Page 3 ICICI Securities Ltd | Retail Equity Research
Conference Call Highlights
Bengaluru store acquisition: The company has acquired three stores
in Bengaluru for | 16 crore from JP Sanitation to further increase its
presence in the Bengaluru market. Currently, these three stores
together clock revenues to the tune of | 5 crore/month and operate at
EBITDA margins of 10% plus. Shankara aims to improve the revenue
run rate ahead. Shankara would also add various other product
categories at these stores over the course of time
Chennai store acquisition update: Vaigai stores garnered revenues to
the tune of | 9 crore in two months of operation during Q3FY18 and
clocked EBITDA margins of 4%. The management expects margins to
reach 10% by FY18 end
Purchases new website: The company has purchased a website for
| 50 lakh to have an omni-channel presence and boost growth
Revenue break-up: Tier I cities contribute 39%, Tier II cities contribute
25% while Tier III cities contribute 36% of the topline
Capex: The company has spent | 30 crore in capex in 9MFY18 and
has guided for a capex of | 25-30 crore in FY19E inclusive of capex for
new store expansion
Channel & enterprise division: The company continues to maintain its
conscious decision to reduce revenue share of relatively lower margin
Channel & Enterprise division. Consequently, revenues from this
segment declined 11% in 9MFY18 to | 946.1 crore
Page 4 ICICI Securities Ltd | Retail Equity Research
Company Analysis
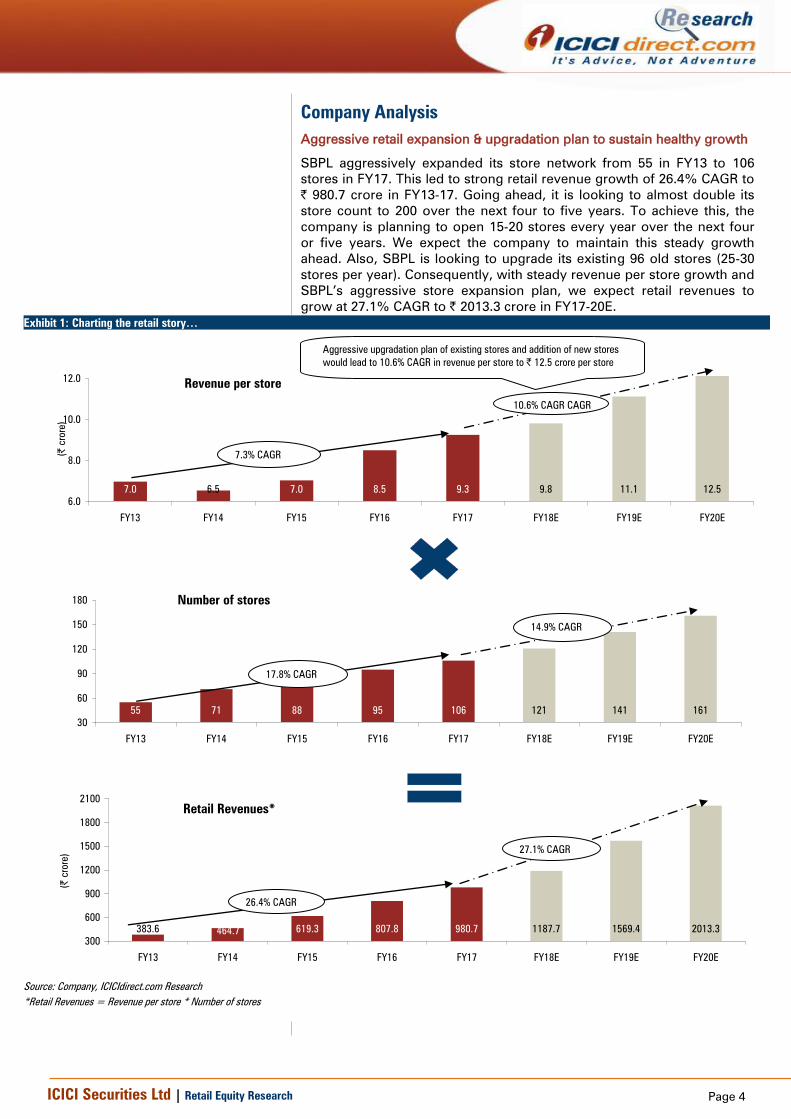
Aggressive retail expansion & upgradation plan to sustain healthy growth
SBPL aggressively expanded its store network from 55 in FY13 to 106
stores in FY17. This led to strong retail revenue growth of 26.4% CAGR to
| 980.7 crore in FY13-17. Going ahead, it is looking to almost double its
store count to 200 over the next four to five years. To achieve this, the
company is planning to open 15-20 stores every year over the next four
or five years. We expect the company to maintain this steady growth
ahead. Also, SBPL is looking to upgrade its existing 96 old stores (25-30
stores per year). Consequently, with steady revenue per store growth and
SBPL’s aggressive store expansion plan, we expect retail revenues to
grow at 27.1% CAGR to | 2013.3 crore in FY17-20E.
Exhibit 1: Charting the retail story…
Retail Revenues*
619.3 807.8 980.7383.6 464.7 1187.7 1569.4 2013.3
300
600
900
1200
1500
1800
2100
FY13 FY14 FY15 FY16 FY17 FY18E FY19E FY20E
(|
crore)
26.4% CAGR
27.1% CAGR
Number of stores
55 71 88 95 106 121 141 161
30
60
90
120
150
180
FY13 FY14 FY15 FY16 FY17 FY18E FY19E FY20E
17.8% CAGR
14.9% CAGR
Revenue per store
7.0 7.0 8.5 9.36.5 9.8 11.1 12.5
6.0
8.0
10.0
12.0
FY13 FY14 FY15 FY16 FY17 FY18E FY19E FY20E
(|
crore)
7.3% CAGR
10.6% CAGR CAGR
Source: Company, ICICIdirect.com Research
*Retail Revenues = Revenue per store * Number of stores
Aggressive upgradation plan of existing stores and addition of new stores
would lead to 10.6% CAGR in revenue per store to | 12.5 crore per store

Page 5 ICICI Securities Ltd | Retail Equity Research
Channel business – Provides better insights for future retail stores…
The company started its channel business in 1999. It caters to dealers &
other retailers where it offers steel based in-house & third party products.
SBPL carries out channel sales through a network of 2000+ dealers,
which are on a non-exclusive basis. The company distributes products
like water tanks, sanitary and CP fittings, steel pipes and tubes, steel
sheets, etc. SBPL’s own brand such as Loha, PriceGalva, Taurus, Ganga,
CenturyRoof, Shankara Solar and Price are also distributed through a
dealer network. The key third party brands carried through the network
include Johnson, Sintex, Uttam Galva, Astral Pipes and APL Apollo.
Exhibit 2: Channel sales trend…
512.9
461.6
415.5
672.8
570.1
569.9
0
250
500
750
FY15 FY16 FY17 FY18E FY19E FY20E
(|
crore)
-20%
-15%
-10%
-5%
0%
5%
Channel YoY growth (%)
Source: Company, ICICIdirect.com Research
The company has been consolidating this business over the years, which
should continue, going ahead. Hence, we expect the revenue share from
the channel division to reduce from 24.7% in FY17 to 12.5% in FY20E.
However, SBPL would not completely ramp down its channel business as
it provides a great insight to understand the market dynamics, consumer
behaviour, products and brand acceptance in a particular area. This, in
turn, provides leads to the company to set up new retail stores for home
improvement and building materials. We expect channel revenues to
reduce from | 569.9 crore in FY17 to | 415.5 crore in FY20E.
Exhibit 3: Share of channel revenues to decline sharply…
0%
15%
30%
45%
FY13 FY14 FY15 FY16 FY17 FY18E FY19E FY20E
Source: Company, ICICIdirect.com Research
Page 6 ICICI Securities Ltd | Retail Equity Research
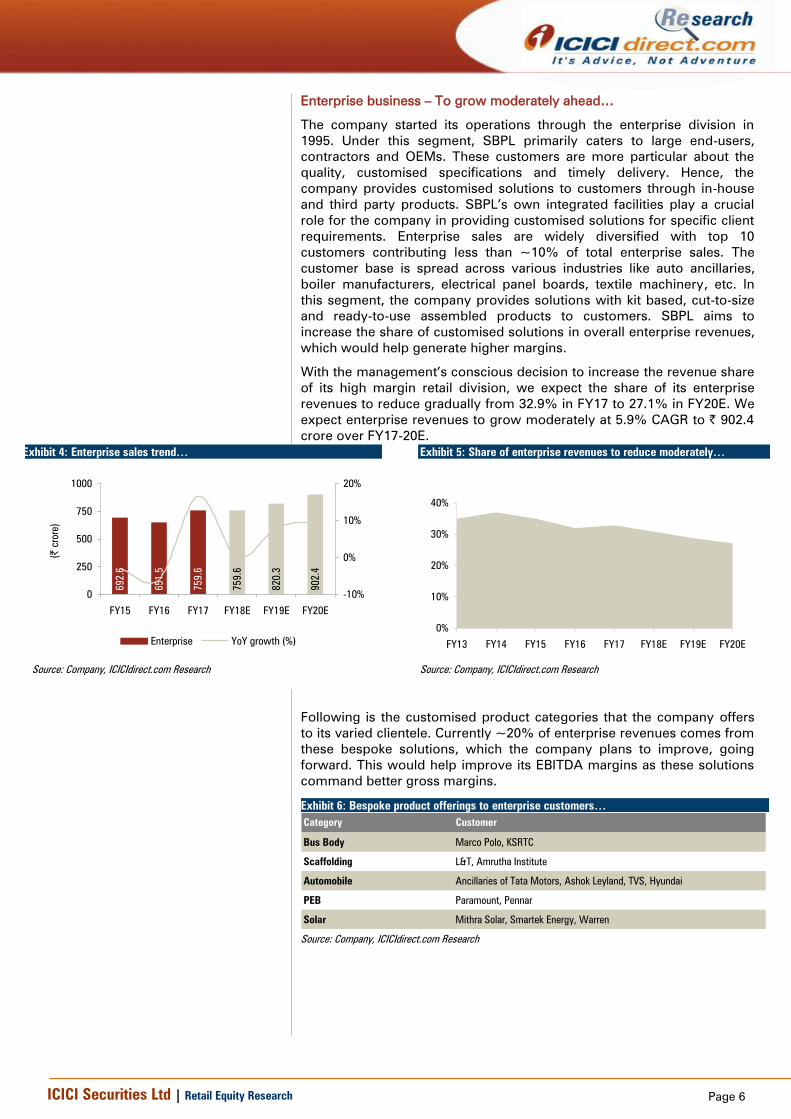
Enterprise business – To grow moderately ahead…
The company started its operations through the enterprise division in
1995. Under this segment, SBPL primarily caters to large end-users,
contractors and OEMs. These customers are more particular about the
quality, customised specifications and timely delivery. Hence, the
company provides customised solutions to customers through in-house
and third party products. SBPL’s own integrated facilities play a crucial
role for the company in providing customised solutions for specific client
requirements. Enterprise sales are widely diversified with top 10
customers contributing less than ~10% of total enterprise sales. The
customer base is spread across various industries like auto ancillaries,
boiler manufacturers, electrical panel boards, textile machinery, etc. In
this segment, the company provides solutions with kit based, cut-to-size
and ready-to-use assembled products to customers. SBPL aims to
increase the share of customised solutions in overall enterprise revenues,
which would help generate higher margins.
With the management’s conscious decision to increase the revenue share
of its high margin retail division, we expect the share of its enterprise
revenues to reduce gradually from 32.9% in FY17 to 27.1% in FY20E. We
expect enterprise revenues to grow moderately at 5.9% CAGR to | 902.4
crore over FY17-20E.
Exhibit 4: Enterprise sales trend…
759.6
820.3
902.4
692.6
651.5
759.6
0
250
500
750
1000
FY15 FY16 FY17 FY18E FY19E FY20E
(|
crore)
-10%
0%
10%
20%
Enterprise YoY growth (%)
Source: Company, ICICIdirect.com Research
Exhibit 5: Share of enterprise revenues to reduce moderately…
0%
10%
20%
30%
40%
FY13 FY14 FY15 FY16 FY17 FY18E FY19E FY20E
Source: Company, ICICIdirect.com Research
Following is the customised product categories that the company offers
to its varied clientele. Currently ~20% of enterprise revenues comes from
these bespoke solutions, which the company plans to improve, going
forward. This would help improve its EBITDA margins as these solutions
command better gross margins.
Exhibit 6: Bespoke product offerings to enterprise customers…
Category Customer
Bus Body Marco Polo, KSRTC
Scaffolding L&T, Amrutha Institute
Automobile Ancillaries of Tata Motors, Ashok Leyland, TVS, Hyundai
PEB Paramount, Pennar
Solar Mithra Solar, Smartek Energy, Warren
Source: Company, ICICIdirect.com Research
Page 7 ICICI Securities Ltd | Retail Equity Research
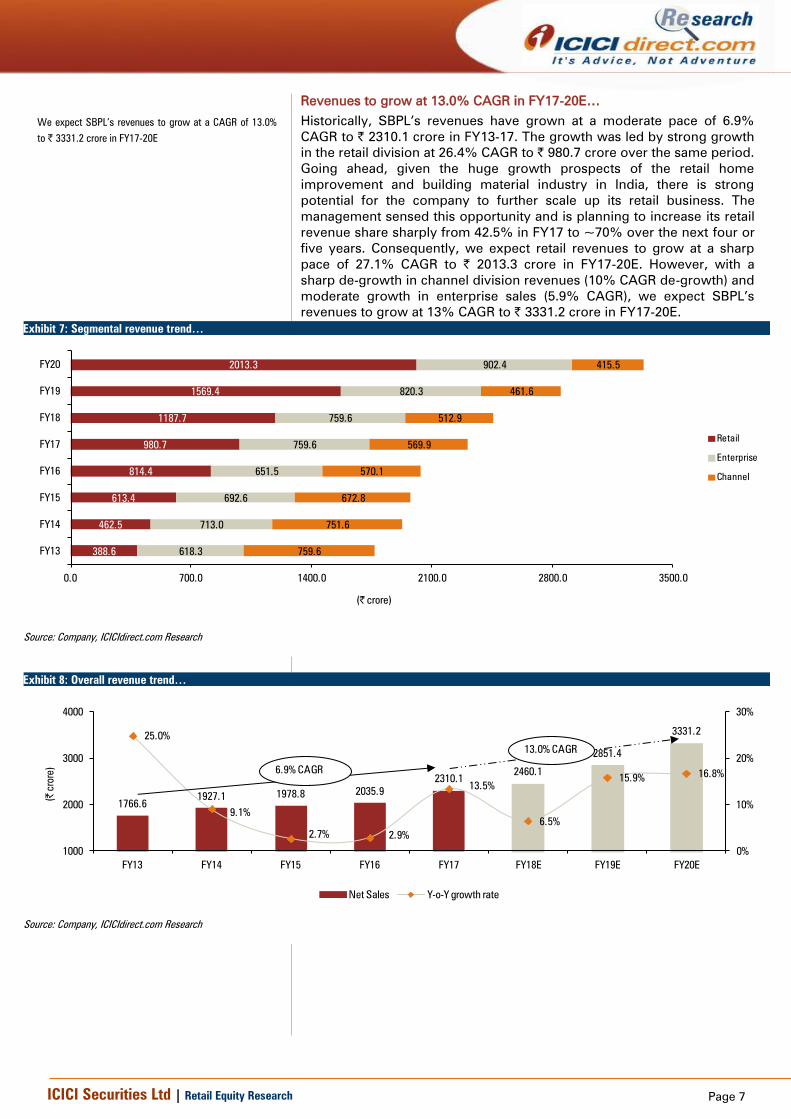
Revenues to grow at 13.0% CAGR in FY17-20E…
Historically, SBPL’s revenues have grown at a moderate pace of 6.9%
CAGR to | 2310.1 crore in FY13-17. The growth was led by strong growth
in the retail division at 26.4% CAGR to | 980.7 crore over the same period.
Going ahead, given the huge growth prospects of the retail home
improvement and building material industry in India, there is strong
potential for the company to further scale up its retail business. The
management sensed this opportunity and is planning to increase its retail
revenue share sharply from 42.5% in FY17 to ~70% over the next four or
five years. Consequently, we expect retail revenues to grow at a sharp
pace of 27.1% CAGR to | 2013.3 crore in FY17-20E. However, with a
sharp de-growth in channel division revenues (10% CAGR de-growth) and
moderate growth in enterprise sales (5.9% CAGR), we expect SBPL’s
revenues to grow at 13% CAGR to | 3331.2 crore in FY17-20E.
Exhibit 7: Segmental revenue trend…
388.6
462.5
613.4
814.4
980.7
1187.7
1569.4
2013.3
618.3
713.0
692.6
651.5
759.6
759.6
820.3
902.4
759.6
751.6
672.8
570.1
569.9
512.9
461.6
415.5
0.0 700.0 1400.0 2100.0 2800.0 3500.0
FY13
FY14
FY15
FY16
FY17
FY18
FY19
FY20
(| crore)
Retail
Enterprise
Channel
Source: Company, ICICIdirect.com Research
Exhibit 8: Overall revenue trend…
1766.6
1927.1 1978.8 2035.9
2310.12460.1
2851.4
3331.225.0%
9.1%
2.7% 2.9%
13.5%
6.5%
15.9%16.8%
0%
10%
20%
30%
1000
2000
3000
4000
FY13 FY14 FY15 FY16 FY17 FY18E FY19E FY20E
(| c
rore)
Net Sales Y-o-Y growth rate
6.9% CAGR
13.0% CAGR
Source: Company, ICICIdirect.com Research
We expect SBPL’s revenues to grow at a CAGR of 13.0%
to | 3331.2 crore in FY17-20E
Page 8 ICICI Securities Ltd | Retail Equity Research
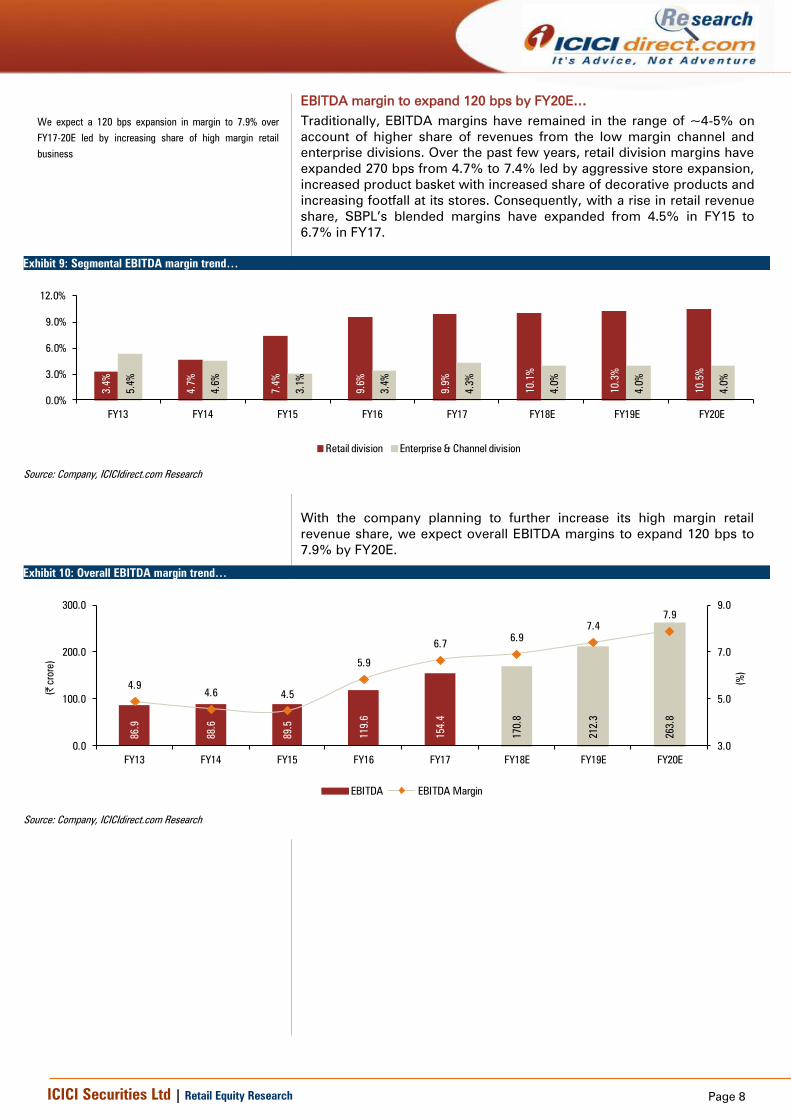
EBITDA margin to expand 120 bps by FY20E…
Traditionally, EBITDA margins have remained in the range of ~4-5% on
account of higher share of revenues from the low margin channel and
enterprise divisions. Over the past few years, retail division margins have
expanded 270 bps from 4.7% to 7.4% led by aggressive store expansion,
increased product basket with increased share of decorative products and
increasing footfall at its stores. Consequently, with a rise in retail revenue
share, SBPL’s blended margins have expanded from 4.5% in FY15 to
6.7% in FY17.
Exhibit 9: Segmental EBITDA margin trend…
3.4%
4.7%
7.4%
9.6%
9.9%
10.1%
10.3%
10.5%
5.4%
4.6%
3.1%
3.4%
4.3%
4.0%
4.0%
4.0%
0.0%
3.0%
6.0%
9.0%
12.0%
FY13 FY14 FY15 FY16 FY17 FY18E FY19E FY20E
Retail division Enterprise & Channel division
Source: Company, ICICIdirect.com Research
With the company planning to further increase its high margin retail
revenue share, we expect overall EBITDA margins to expand 120 bps to
7.9% by FY20E.
Exhibit 10: Overall EBITDA margin trend…
86.9
88.6
89.5
119.6
154.4
170.8
212.3
263.8
4.9
4.6 4.5
5.9
6.76.9
7.4
7.9
3.0
5.0
7.0
9.0
0.0
100.0
200.0
300.0
FY13 FY14 FY15 FY16 FY17 FY18E FY19E FY20E
(%
)
(| c
rore)
EBITDA EBITDA Margin
Source: Company, ICICIdirect.com Research
We expect a 120 bps expansion in margin to 7.9% over
FY17-20E led by increasing share of high margin retail
business
Page 9 ICICI Securities Ltd | Retail Equity Research
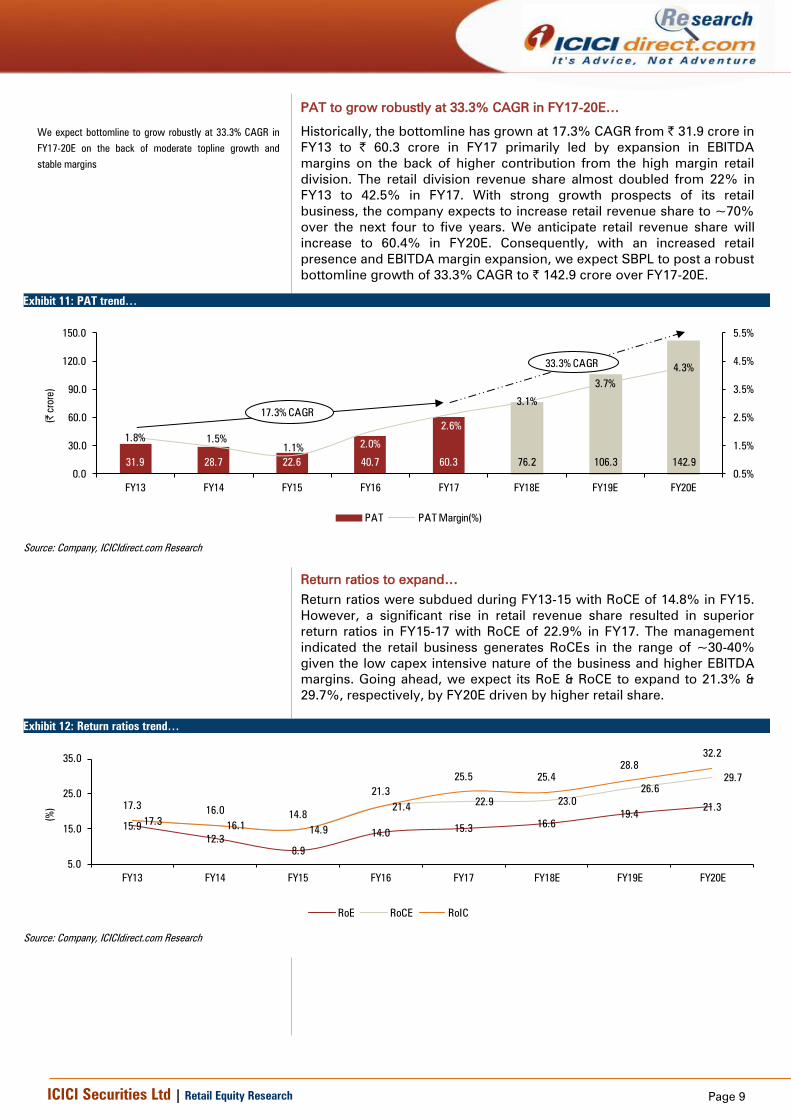
PAT to grow robustly at 33.3% CAGR in FY17-20E…
Historically, the bottomline has grown at 17.3% CAGR from | 31.9 crore in
FY13 to | 60.3 crore in FY17 primarily led by expansion in EBITDA
margins on the back of higher contribution from the high margin retail
division. The retail division revenue share almost doubled from 22% in
FY13 to 42.5% in FY17. With strong growth prospects of its retail
business, the company expects to increase retail revenue share to ~70%
over the next four to five years. We anticipate retail revenue share will
increase to 60.4% in FY20E. Consequently, with an increased retail
presence and EBITDA margin expansion, we expect SBPL to post a robust
bottomline growth of 33.3% CAGR to | 142.9 crore over FY17-20E.
Exhibit 11: PAT trend…
31.9 28.7 22.6 40.7 60.3 76.2 106.3 142.9
1.8% 1.5%
1.1%2.0%
2.6%
3.1%
3.7%
4.3%
0.5%
1.5%
2.5%
3.5%
4.5%
5.5%
0.0
30.0
60.0
90.0
120.0
150.0
FY13 FY14 FY15 FY16 FY17 FY18E FY19E FY20E
(| c
rore)
PAT PAT Margin(%)
17.3% CAGR
33.3% CAGR
Source: Company, ICICIdirect.com Research
Return ratios to expand…
Return ratios were subdued during FY13-15 with RoCE of 14.8% in FY15.
However, a significant rise in retail revenue share resulted in superior
return ratios in FY15-17 with RoCE of 22.9% in FY17. The management
indicated the retail business generates RoCEs in the range of ~30-40%
given the low capex intensive nature of the business and higher EBITDA
margins. Going ahead, we expect its RoE & RoCE to expand to 21.3% &
29.7%, respectively, by FY20E driven by higher retail share.
Exhibit 12: Return ratios trend…
15.9
12.3
8.9
14.015.3
16.6
19.421.3
17.316.1
14.9
21.422.9 23.0
26.6
29.7
17.316.0
14.8
21.3
25.5 25.4
28.8
32.2
5.0
15.0
25.0
35.0
FY13 FY14 FY15 FY16 FY17 FY18E FY19E FY20E
(%
)
RoE RoCE RoIC
Source: Company, ICICIdirect.com Research
We expect bottomline to grow robustly at 33.3% CAGR in
FY17-20E on the back of moderate topline growth and
stable margins
Page 10 ICICI Securities Ltd | Retail Equity Research
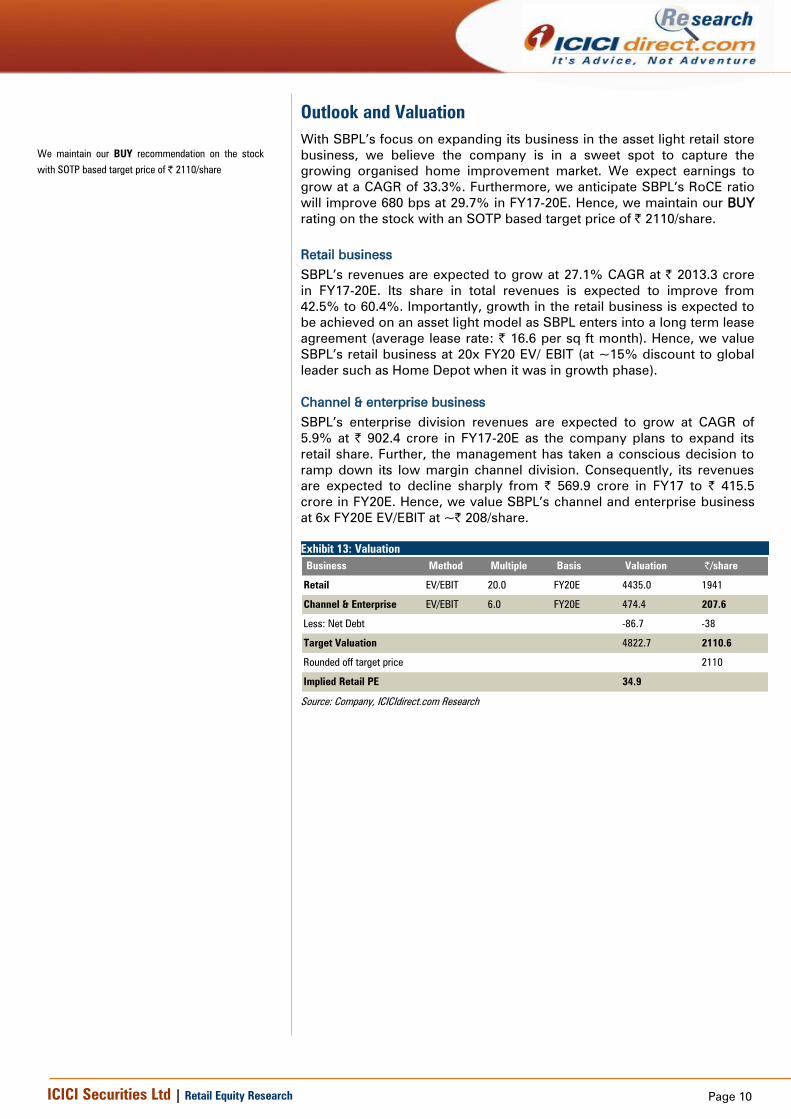
Outlook and Valuation
With SBPL’s focus on expanding its business in the asset light retail store
business, we believe the company is in a sweet spot to capture the
growing organised home improvement market. We expect earnings to
grow at a CAGR of 33.3%. Furthermore, we anticipate SBPL’s RoCE ratio
will improve 680 bps at 29.7% in FY17-20E. Hence, we maintain our BUY
rating on the stock with an SOTP based target price of | 2110/share.
Retail business
SBPL’s revenues are expected to grow at 27.1% CAGR at | 2013.3 crore
in FY17-20E. Its share in total revenues is expected to improve from
42.5% to 60.4%. Importantly, growth in the retail business is expected to
be achieved on an asset light model as SBPL enters into a long term lease
agreement (average lease rate: | 16.6 per sq ft month). Hence, we value
SBPL’s retail business at 20x FY20 EV/ EBIT (at ~15% discount to global
leader such as Home Depot when it was in growth phase).
Channel & enterprise business
SBPL’s enterprise division revenues are expected to grow at CAGR of
5.9% at | 902.4 crore in FY17-20E as the company plans to expand its
retail share. Further, the management has taken a conscious decision to
ramp down its low margin channel division. Consequently, its revenues
are expected to decline sharply from | 569.9 crore in FY17 to | 415.5
crore in FY20E. Hence, we value SBPL’s channel and enterprise business
at 6x FY20E EV/EBIT at ~| 208/share.
Exhibit 13: Valuation
Business Method Multiple Basis Valuation |/share
Retail EV/EBIT 20.0 FY20E 4435.0 1941
Channel & Enterprise EV/EBIT 6.0 FY20E 474.4 207.6
Less: Net Debt -86.7 -38
Target Valuation 4822.7 2110.6
Rounded off target price 2110
Implied Retail PE 34.9
Source: Company, ICICIdirect.com Research
We maintain our BUY recommendation on the stock
with SOTP based target price of | 2110/share
Page 11 ICICI Securities Ltd | Retail Equity Research
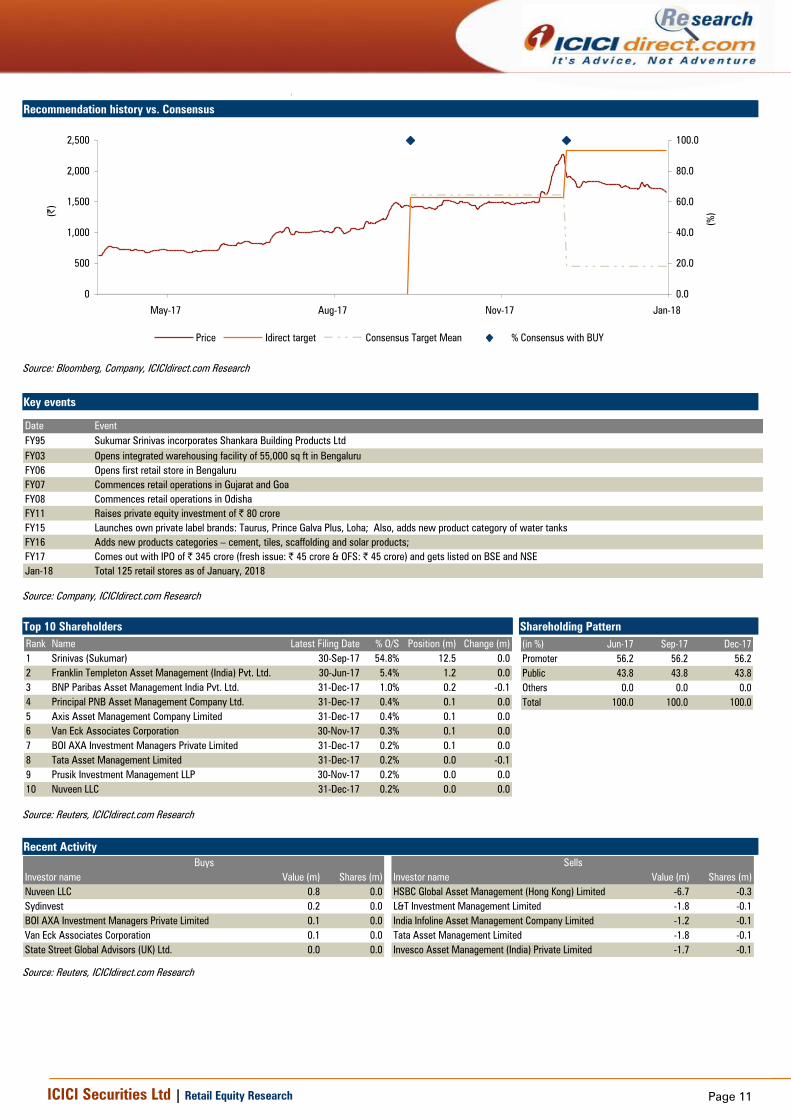
Recommendation history vs. Consensus
0
500
1,000
1,500
2,000
2,500
Jan-18Nov-17Aug-17May-17
(|
)
0.0
20.0
40.0
60.0
80.0
100.0
(%
)
Price Idirect target Consensus Target Mean % Consensus with BUY
Source: Bloomberg, Company, ICICIdirect.com Research
Key events
Date Event
FY95 Sukumar Srinivas incorporates Shankara Building Products Ltd
FY03 Opens integrated warehousing facility of 55,000 sq ft in Bengaluru
FY06 Opens first retail store in Bengaluru
FY07 Commences retail operations in Gujarat and Goa
FY08 Commences retail operations in Odisha
FY11 Raises private equity investment of | 80 crore
FY15 Launches own private label brands: Taurus, Prince Galva Plus, Loha; Also, adds new product category of water tanks
FY16 Adds new products categories – cement, tiles, scaffolding and solar products;
FY17 Comes out with IPO of | 345 crore (fresh issue: | 45 crore & OFS: | 45 crore) and gets listed on BSE and NSE
Jan-18 Total 125 retail stores as of January, 2018
Source: Company, ICICIdirect.com Research
Top 10 Shareholders Shareholding Pattern
Rank Name Latest Filing Date % O/S Position (m) Change (m)
1 Srinivas (Sukumar) 30-Sep-17 54.8% 12.5 0.0
2 Franklin Templeton Asset Management (India) Pvt. Ltd. 30-Jun-17 5.4% 1.2 0.0
3 BNP Paribas Asset Management India Pvt. Ltd. 31-Dec-17 1.0% 0.2 -0.1
4 Principal PNB Asset Management Company Ltd. 31-Dec-17 0.4% 0.1 0.0
5 Axis Asset Management Company Limited 31-Dec-17 0.4% 0.1 0.0
6 Van Eck Associates Corporation 30-Nov-17 0.3% 0.1 0.0
7 BOI AXA Investment Managers Private Limited 31-Dec-17 0.2% 0.1 0.0
8 Tata Asset Management Limited 31-Dec-17 0.2% 0.0 -0.1
9 Prusik Investment Management LLP 30-Nov-17 0.2% 0.0 0.0
10 Nuveen LLC 31-Dec-17 0.2% 0.0 0.0
(in %) Jun-17 Sep-17 Dec-17
Promoter 56.2 56.2 56.2
Public 43.8 43.8 43.8
Others 0.0 0.0 0.0
Total 100.0 100.0 100.0
Source: Reuters, ICICIdirect.com Research
Recent Activity
Investor name Value (m) Shares (m) Investor name Value (m) Shares (m)
Nuveen LLC 0.8 0.0 HSBC Global Asset Management (Hong Kong) Limited -6.7 -0.3
Sydinvest 0.2 0.0 L&T Investment Management Limited -1.8 -0.1
BOI AXA Investment Managers Private Limited 0.1 0.0 India Infoline Asset Management Company Limited -1.2 -0.1
Van Eck Associates Corporation 0.1 0.0 Tata Asset Management Limited -1.8 -0.1
State Street Global Advisors (UK) Ltd. 0.0 0.0 Invesco Asset Management (India) Private Limited -1.7 -0.1
Buys Sells
Source: Reuters, ICICIdirect.com Research
Page 12 ICICI Securities Ltd | Retail Equity Research
Financial summary
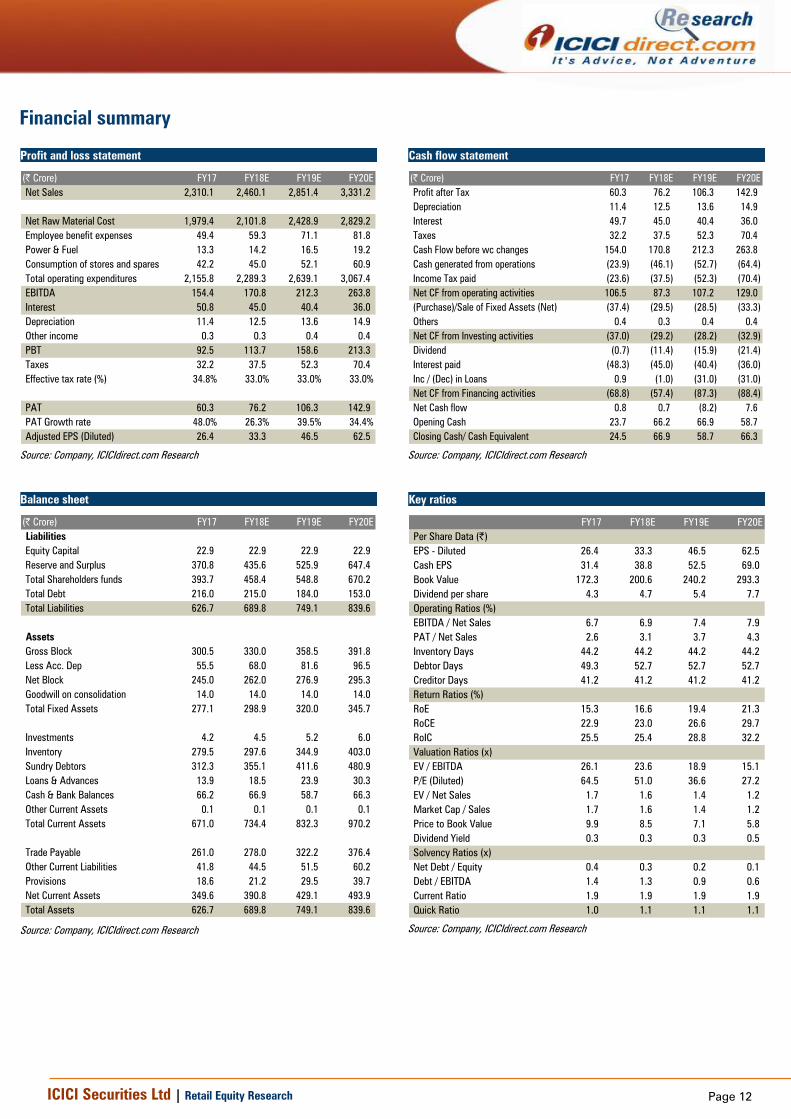
Profit and loss statement
(| Crore) FY17 FY18E FY19E FY20E
Net Sales 2,310.1 2,460.1 2,851.4 3,331.2
Net Raw Material Cost 1,979.4 2,101.8 2,428.9 2,829.2
Employee benefit expenses 49.4 59.3 71.1 81.8
Power & Fuel 13.3 14.2 16.5 19.2
Consumption of stores and spares 42.2 45.0 52.1 60.9
Total operating expenditures 2,155.8 2,289.3 2,639.1 3,067.4
EBITDA 154.4 170.8 212.3 263.8
Interest 50.8 45.0 40.4 36.0
Depreciation 11.4 12.5 13.6 14.9
Other income 0.3 0.3 0.4 0.4
PBT 92.5 113.7 158.6 213.3
Taxes 32.2 37.5 52.3 70.4
Effective tax rate (%) 34.8% 33.0% 33.0% 33.0%
PAT 60.3 76.2 106.3 142.9
PAT Growth rate 48.0% 26.3% 39.5% 34.4%
Adjusted EPS (Diluted) 26.4 33.3 46.5 62.5
Source: Company, ICICIdirect.com Research
Cash flow statement
(| Crore) FY17 FY18E FY19E FY20E
Profit after Tax 60.3 76.2 106.3 142.9
Depreciation 11.4 12.5 13.6 14.9
Interest 49.7 45.0 40.4 36.0
Taxes 32.2 37.5 52.3 70.4
Cash Flow before wc changes 154.0 170.8 212.3 263.8
Cash generated from operations (23.9) (46.1) (52.7) (64.4)
Income Tax paid (23.6) (37.5) (52.3) (70.4)
Net CF from operating activities 106.5 87.3 107.2 129.0
(Purchase)/Sale of Fixed Assets (Net) (37.4) (29.5) (28.5) (33.3)
Others 0.4 0.3 0.4 0.4
Net CF from Investing activities (37.0) (29.2) (28.2) (32.9)
Dividend (0.7) (11.4) (15.9) (21.4)
Interest paid (48.3) (45.0) (40.4) (36.0)
Inc / (Dec) in Loans 0.9 (1.0) (31.0) (31.0)
Net CF from Financing activities (68.8) (57.4) (87.3) (88.4)
Net Cash flow 0.8 0.7 (8.2) 7.6
Opening Cash 23.7 66.2 66.9 58.7
Closing Cash/ Cash Equivalent 24.5 66.9 58.7 66.3
Source: Company, ICICIdirect.com Research
Balance sheet
(| Crore) FY17 FY18E FY19E FY20E
Liabilities
Equity Capital 22.9 22.9 22.9 22.9
Reserve and Surplus 370.8 435.6 525.9 647.4
Total Shareholders funds 393.7 458.4 548.8 670.2
Total Debt 216.0 215.0 184.0 153.0
Total Liabilities 626.7 689.8 749.1 839.6
Assets
Gross Block 300.5 330.0 358.5 391.8
Less Acc. Dep 55.5 68.0 81.6 96.5
Net Block 245.0 262.0 276.9 295.3
Goodwill on consolidation 14.0 14.0 14.0 14.0
Total Fixed Assets 277.1 298.9 320.0 345.7
Investments 4.2 4.5 5.2 6.0
Inventory 279.5 297.6 344.9 403.0
Sundry Debtors 312.3 355.1 411.6 480.9
Loans & Advances 13.9 18.5 23.9 30.3
Cash & Bank Balances 66.2 66.9 58.7 66.3
Other Current Assets 0.1 0.1 0.1 0.1
Total Current Assets 671.0 734.4 832.3 970.2
Trade Payable 261.0 278.0 322.2 376.4
Other Current Liabilities 41.8 44.5 51.5 60.2
Provisions 18.6 21.2 29.5 39.7
Net Current Assets 349.6 390.8 429.1 493.9
Total Assets 626.7 689.8 749.1 839.6
Source: Company, ICICIdirect.com Research
Key ratios
FY17 FY18E FY19E FY20E
Per Share Data (|)
EPS - Diluted 26.4 33.3 46.5 62.5
Cash EPS 31.4 38.8 52.5 69.0
Book Value 172.3 200.6 240.2 293.3
Dividend per share 4.3 4.7 5.4 7.7
Operating Ratios (%)
EBITDA / Net Sales 6.7 6.9 7.4 7.9
PAT / Net Sales 2.6 3.1 3.7 4.3
Inventory Days 44.2 44.2 44.2 44.2
Debtor Days 49.3 52.7 52.7 52.7
Creditor Days 41.2 41.2 41.2 41.2
Return Ratios (%)
RoE 15.3 16.6 19.4 21.3
RoCE 22.9 23.0 26.6 29.7
RoIC 25.5 25.4 28.8 32.2
Valuation Ratios (x)
EV / EBITDA 26.1 23.6 18.9 15.1
P/E (Diluted) 64.5 51.0 36.6 27.2
EV / Net Sales 1.7 1.6 1.4 1.2
Market Cap / Sales 1.7 1.6 1.4 1.2
Price to Book Value 9.9 8.5 7.1 5.8
Dividend Yield 0.3 0.3 0.3 0.5
Solvency Ratios (x)
Net Debt / Equity 0.4 0.3 0.2 0.1
Debt / EBITDA 1.4 1.3 0.9 0.6
Current Ratio 1.9 1.9 1.9 1.9
Quick Ratio 1.0 1.1 1.1 1.1
Source: Company, ICICIdirect.com Research
Page 13 ICICI Securities Ltd | Retail Equity Research
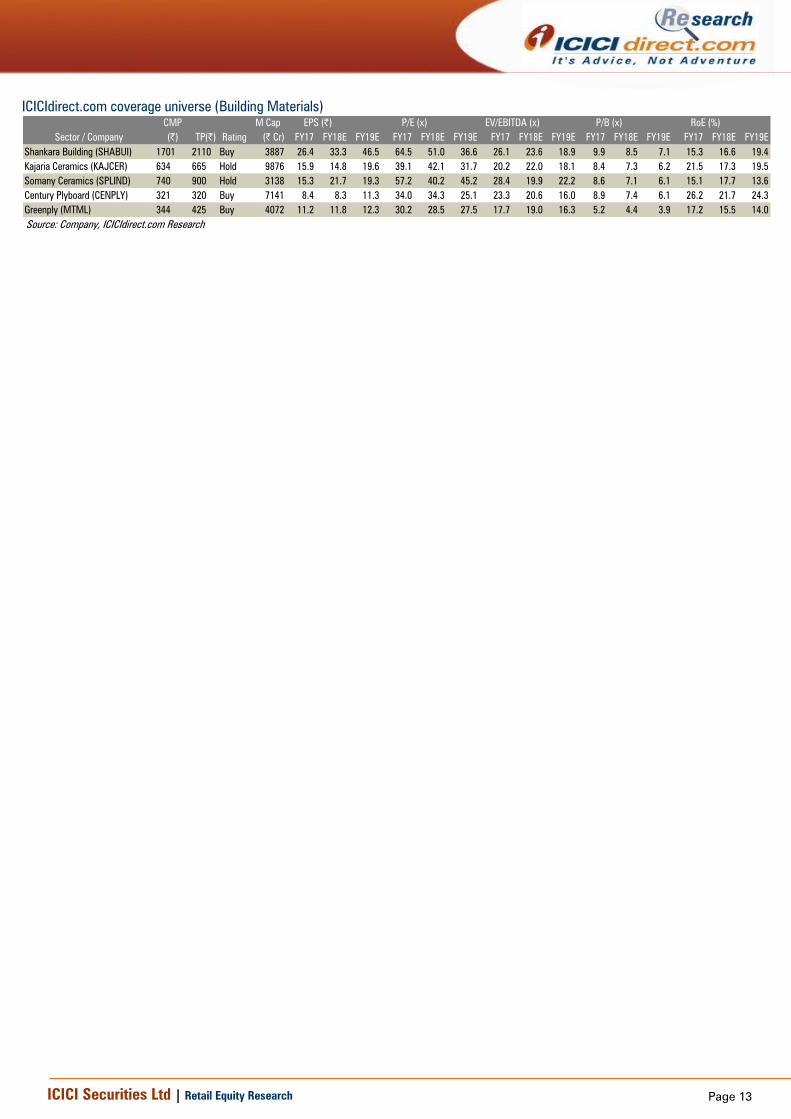
ICICIdirect.com coverage universe (Building Materials)
CMP M Cap
(|) TP(|) Rating (| Cr) FY17 FY18E FY19E FY17 FY18E FY19E FY17 FY18E FY19E FY17 FY18E FY19E FY17 FY18E FY19E
Shankara Building (SHABUI) 1701 2110 Buy 3887 26.4 33.3 46.5 64.5 51.0 36.6 26.1 23.6 18.9 9.9 8.5 7.1 15.3 16.6 19.4
Kajaria Ceramics (KAJCER) 634 665 Hold 9876 15.9 14.8 19.6 39.1 42.1 31.7 20.2 22.0 18.1 8.4 7.3 6.2 21.5 17.3 19.5
Somany Ceramics (SPLIND) 740 900 Hold 3138 15.3 21.7 19.3 57.2 40.2 45.2 28.4 19.9 22.2 8.6 7.1 6.1 15.1 17.7 13.6
Century Plyboard (CENPLY) 321 320 Buy 7141 8.4 8.3 11.3 34.0 34.3 25.1 23.3 20.6 16.0 8.9 7.4 6.1 26.2 21.7 24.3
Greenply (MTML) 344 425 Buy 4072 11.2 11.8 12.3 30.2 28.5 27.5 17.7 19.0 16.3 5.2 4.4 3.9 17.2 15.5 14.0
P/B (x) RoE (%)
Sector / Company
EPS (|) P/E (x) EV/EBITDA (x)
Source: Company, ICICIdirect.com Research

Page 14 ICICI Securities Ltd | Retail Equity Research
RATING RATIONALE
ICICIdirect.com endeavours to provide objective opinions and recommendations. ICICIdirect.com assigns
ratings to its stocks according to their notional target price vs. current market price and then categorises them
as Strong Buy, Buy, Hold and Sell. The performance horizon is two years unless specified and the notional
target price is defined as the analysts' valuation for a stock.
Strong Buy: >15%/20% for large caps/midcaps, respectively, with high conviction;
Buy: >10%/15% for large caps/midcaps, respectively;
Hold: Up to +/-10%;
Sell: -10% or more;
Pankaj Pandey Head – Research [email protected]
ICICIdirect.com Research Desk,
ICICI Securities Limited,
1st Floor, Akruti Trade Centre,
Road No 7, MIDC,
Andheri (East)
Mumbai – 400 093
Page 15 ICICI Securities Ltd | Retail Equity Research
ANALYST CERTIFICATION
We /I, Deepak Purswani, CFA MBA (Finance) and Vaibhav Shah, MBA (Finance) Research Analysts, authors and the names subscribed to this report, hereby certify that all of the views expressed in this
research report accurately reflect our views about the subject issuer(s) or securities. We also certify that no part of our compensation was, is, or will be directly or indirectly related to the specific
recommendation(s) or view(s) in this report.
Terms & conditions and other disclosures:
ICICI Securities Limited (ICICI Securities) is a full-service, integrated investment banking and is, inter alia, engaged in the business of stock brokering and distribution of financial products. ICICI Securities
Limited is a Sebi registered Research Analyst with Sebi Registration Number – INH000000990. ICICI Securities is a wholly-owned subsidiary of ICICI Bank which is India’s largest private sector bank and has
its various subsidiaries engaged in businesses of housing finance, asset management, life insurance, general insurance, venture capital fund management, etc. (“associates”), the details in respect of which
are available on www.icicibank.com.
ICICI Securities is one of the leading merchant bankers/ underwriters of securities and participate in virtually all securities trading markets in India. We and our associates might have investment banking
and other business relationship with a significant percentage of companies covered by our Investment Research Department. ICICI Securities generally prohibits its analysts, persons reporting to analysts
and their relatives from maintaining a financial interest in the securities or derivatives of any companies that the analysts cover.
The information and opinions in this report have been prepared by ICICI Securities and are subject to change without any notice. The report and information contained herein is strictly confidential and
meant solely for the selected recipient and may not be altered in any way, transmitted to, copied or distributed, in part or in whole, to any other person or to the media or reproduced in any form, without
prior written consent of ICICI Securities. While we would endeavour to update the information herein on a reasonable basis, ICICI Securities is under no obligation to update or keep the information current.
Also, there may be regulatory, compliance or other reasons that may prevent ICICI Securities from doing so. Non-rated securities indicate that rating on a particular security has been suspended
temporarily and such suspension is in compliance with applicable regulations and/or ICICI Securities policies, in circumstances where ICICI Securities might be acting in an advisory capacity to this
company, or in certain other circumstances.
This report is based on information obtained from public sources and sources believed to be reliable, but no independent verification has been made nor is its accuracy or completeness guaranteed. This
report and information herein is solely for informational purpose and shall not be used or considered as an offer document or solicitation of offer to buy or sell or subscribe for securities or other financial
instruments. Though disseminated to all the customers simultaneously, not all customers may receive this report at the same time. ICICI Securities will not treat recipients as customers by virtue of their
receiving Deepak Purswani, CFA MBA (Finance) and Vaibhav Shah, MBA (Finance) this report. Nothing in this report constitutes investment, legal, accounting and tax advice or a representation that any
investment or strategy is suitable or appropriate to your specific circumstances. The securities discussed and opinions expressed in this report may not be suitable for all investors, who must make their
own investment decisions, based on their own investment objectives, financial positions and needs of specific recipient. This may not be taken in substitution for the exercise of independent judgment by
any recipient. The recipient should independently evaluate the investment risks. The value and return on investment may vary because of changes in interest rates, foreign exchange rates or any other
reason. ICICI Securities accepts no liabilities whatsoever for any loss or damage of any kind arising out of the use of this report. Past performance is not necessarily a guide to future performance. Investors
are advised to see Risk Disclosure Document to understand the risks associated before investing in the securities markets. Actual results may differ materially from those set forth in projections. Forward-
looking statements are not predictions and may be subject to change without notice.
ICICI Securities or its associates might have managed or co-managed public offering of securities for the subject company or might have been mandated by the subject company for any other assignment
in the past twelve months.
ICICI Securities or its associates might have received any compensation from the companies mentioned in the report during the period preceding twelve months from the date of this report for services in
respect of managing or co-managing public offerings, corporate finance, investment banking or merchant banking, brokerage services or other advisory service in a merger or specific transaction.
ICICI Securities or its associates might have received any compensation for products or services other than investment banking or merchant banking or brokerage services from the companies mentioned
in the report in the past twelve months.
ICICI Securities encourages independence in research report preparation and strives to minimize conflict in preparation of research report. ICICI Securities or its associates or its analysts did not receive any
compensation or other benefits from the companies mentioned in the report or third party in connection with preparation of the research report. Accordingly, neither ICICI Securities nor Research Analysts
and their relatives have any material conflict of interest at the time of publication of this report.
It is confirmed that Deepak Purswani, CFA MBA (Finance) and Vaibhav Shah, MBA (Finance) Research Analysts of this report have not received any compensation from the companies mentioned in the
report in the preceding twelve months.
Compensation of our Research Analysts is not based on any specific merchant banking, investment banking or brokerage service transactions.
ICICI Securities or its subsidiaries collectively or Research Analysts or their relatives do not own 1% or more of the equity securities of the Company mentioned in the report as of the last day of the month
preceding the publication of the research report.
Since associates of ICICI Securities are engaged in various financial service businesses, they might have financial interests or beneficial ownership in various companies including the subject
company/companies mentioned in this report.
It is confirmed that Deepak Purswani, CFA MBA (Finance) and Vaibhav Shah, MBA (Finance), Research Analysts do not serve as an officer, director or employee of the companies mentioned in the report.
ICICI Securities may have issued other reports that are inconsistent with and reach different conclusion from the information presented in this report.
Neither the Research Analysts nor ICICI Securities have been engaged in market making activity for the companies mentioned in the report.
We submit that no material disciplinary action has been taken on ICICI Securities by any Regulatory Authority impacting Equity Research Analysis activities.
This report is not directed or intended for distribution to, or use by, any person or entity who is a citizen or resident of or located in any locality, state, country or other jurisdiction, where such distribution,
publication, availability or use would be contrary to law, regulation or which would subject ICICI Securities and affiliates to any registration or licensing requirement within such jurisdiction. The securities
described herein may or may not be eligible for sale in all jurisdictions or to certain category of investors. Persons in whose possession this document may come are required to inform themselves of and
to observe such restriction.