Embed Size (px)
Citation preview
BuildingAssets,UnlockingAccess:ShelterSolutionsforthePoor
Kenya Housing Market Mapping and Value Chain Analysis
November, 2013
Inpartnershipwith
1
Contents
Acknowledgement .................................................................................................................................. 3
ACRONYMS .............................................................................................................................................. 4
EXECUTIVE SUMMARY ............................................................................................................................ 6
1. INTRODUCTION ............................................................................................................................. 10
2. MARKET MAPPING METHODOLOGY ................................................................................................ 12
3.1 Country Socio Economic Context ............................................................................................... 15
3.2 Overview of the Housing and Property Enabling Environment in Kenya .................................. 17
3.3 Policy and Regulation ................................................................................................................. 21
3.4 Land Tenure in Kenya ................................................................................................................. 22
4. HOUSING VALUE CHAIN MARKET MAPS ........................................................................................... 24
4.1 Acquisition and Tenure of Land ................................................................................................. 24
4.1.1 Community Land Trusts Acquisition and Tenure................................................................. 24
4.1.2 Private Land Holding Acquisition and Tenure ..................................................................... 25
4.1.3 Acquisition of Land through Allotments by Local Authorities ............................................. 25
4.1.4 Securing Title ....................................................................................................................... 26
4.1.5 SWOT Analysis of Acquisition and Tenure .......................................................................... 29
4.2 Provision of Basic Infrastructure at Community Level............................................................... 31
4.2.1 Mapping Provision of Electricity ......................................................................................... 32
4.2.2 SWOT in Electricity .............................................................................................................. 36
4.2.3 Mapping Provision of Water and Sanitation in Kenya ........................................................ 37
4.2.4 SWOT for Water Sector ...................................................................................................... 42
4.3 Housing Construction ................................................................................................................. 43
4.3.1 Overview of Process ............................................................................................................ 43
4.3.2 Detailed Mapping................................................................................................................ 46
4.3.3 SWOT for Low Income Housing Construction ..................................................................... 48
4.4 Microfinance and Housing Finance ............................................................................................ 52
4.4.1 Financial Services Legislation and Regulation .................................................................... 53
4.4.2 Microfinance Sector ............................................................................................................ 54
4.4.3 SACCOs ................................................................................................................................ 55
4.4.4 Summary of Housing Finance ............................................................................................. 56
4.5 Other Support Actors ................................................................................................................. 57
5. HOUSING QUALITY STANDARDS ....................................................................................................... 59
6. HOUSING SUPPORT SERVICES IN KENYA’S HMF MARKET .............................................................. 62
2
6.1 Role and Context of Housing Support Services in Kenya ........................................................... 62
6.2 Access to Land and Security of Tenure ...................................................................................... 62
6.3 Infrastructure ............................................................................................................................. 62
6.4 Construction Assistance ............................................................................................................. 63
7. KENYA LOW INCOME HOUSING MARKET SWOT ANALYSIS ............................................................ 65
8. CONCLUSIONS AND RECOMMENDATIONS ..................................................................................... 66
ANNEX 1 – BIBLIOGRAPHY .................................................................................................................... 70
ANNEX 2 – LIST OF KEY INFORMANTS .................................................................................................. 72
ANNEX 3 ‐ FOCUS GROUP DISCUSSION GUIDE ..................................................................................... 73
ANNEX 4 – ARTISAN INTERVIEW GUIDE ............................................................................................... 75
3
Acknowledgement The Habitat for Humanity International’s Center for Innovation in Shelter and Finance (HFHI’s CISF) would like to acknowledge AYANI as our main consultant for the production of this market mapping and housing value chain analysis; and would like to express our sincere gratitude to the team at Habitat for Humanity Kenya, for its extensive support and input throughout this mapping process. Additionally, we would like to thank Ezekiel Esipisu and Christopher Musoke of Habitat for Humanity International for their overall coordination of this assignment and enriching insights towards the completion of the final report. Special thanks to Ronald Omyonga, and Ruth Odera (HFH Kenya CISF Housing Support Services Specialist and Housing Microfinance Manager), for their field coordination and contacts. Thanks to Voluntary Services Overseas in Kenya for its guidance and support in identifying institutions to participate in our study; and Mary Markaru for her groundwork coordination and mobilization of focus groups. Finally, we would like to thank all sector actors and experts who generously contributed their time and knowledge to inform this study.
4
ABOUT About the MasterCard Foundation The MasterCard Foundation works with visionary organizations to provide greater access to education, skills training and financial services for people living in poverty, primarily in Africa. As one of the largest independent foundations, its work is guided by its mission to advance learning and promote financial inclusion in order to alleviate poverty. Based in Toronto, Canada, The MasterCard Foundation’s independence was established when it was created by MasterCard in 2006. For more information, please visit mastercardfdn.org or follow it on Twitter @MCFoundation.
About the Partnership Habitat for Humanity Canada, Habitat for Humanity International and The MasterCard Foundation are partnering to enable 15,000 households in Ghana, Kenya and Uganda to access housing microfinance products and housing support services to improve their homes and their lives. Over five years, $6.6 million in support will expand microfinance services to make it easier for families to access funds for the progressive building, maintenance and improvement of their homes.
About the Habitat for Humanity Habitat for Humanity International’s vision is a world where everyone has a decent place to live. Anchored by the conviction that safe and affordable housing provides a critical foundation for breaking the cycle of poverty, Habitat has helped more than 5 million people construct, rehabilitate or preserve their homes since 1976. Habitat also advocates to improve access to decent and affordable shelter and supports a variety of funding models that enable families with limited resources to make needed improvements on their homes as their time and resources allow. Habitat for Humanity operates in 15 countries in Sub‐Saharan Africa through a number of housing initiatives. It has witnessed a growing demand for financial services that address housing needs among microfinance institutions and clients. To learn more, donate or volunteer, visit habitat.org.
About the Centre for Innovation in Shelter and Finance This project is implemented by Habitat for Humanity’s Center for Innovation in Shelter and Finance, or CISF. The CISF was established to serve as a place of knowledge, expertise, advice and innovation, enabling low‐ and very‐low‐income families to acquire adequate housing. The CISF team of experts is advancing the development of demand‐driven, scalable housing solutions to low‐income communities. Currently, they are leading efforts to promote and support vibrant housing finance solutions through advisory services, research and knowledge development, and learning exchanges. The goals are:
o To facilitate collaboration among public‐, private‐and third‐sector actors in the market.
o To develop sustainable and innovative housing solutions for those who lack adequate housing.
o To increase access to affordable shelter among lower‐income populations. For more information about CISF visit habitat.org/cisf
5
ACRONYMS
CAHF Centre for Affordable Housing in Africa
CBO Community Based Organization
CISF Center for Innovation in Shelter and Finance
CLTS Community‐Led Total Sanitation
CSO Civil Society Organizations
FGD Focus Group Discussions
FSP Financial Service Providers
GDP Gross Domestic Product
GPOBA Global Partnership on Output‐Based Aid
HFHI Habitat for Humanity International
HMF Housing Microfinance
IPP Independent Power Producer ITDG Intermediate Technology Development Group (Currently Practical Action)
KENGEN Kenya Electricity Generation Company
KENSUP Kenya Slum Upgrading Programme
KETRACO Kenya Electricity Transmission Company
KEWASNET Kenya Water and Sanitation Civil Society Network
KLA Kenya Land Alliance
KPC Kenya Power Company
KSH Kenya Shilling
MEWNR Ministry of Environment, Water and Natural Resources
MFI Microfinance Institution
MOPHS Ministry of Public Health and Sanitation
NACHU National Cooperative Housing Union
NEMA National Environment Management Authority
NGO Non‐Governmental Organization
NWCPC National Water Conservation and Pipeline Corporation
PRA Participatory Rapid Appraisal
REA Rural Electrification Authority
SACCO Savings and Credit Cooperative
SPA Service Provision Agreements
SSP Small Service Providers
UN United Nations
UN‐HABITAT United Nations Human Settlements Programme
USD United States Dollar
VAT Value Added Tax
WASREB Water Services Regulatory Board
WSB Water Service Board
WSH Water, Sanitation and Health
WUA Water User Associations
6
EXECUTIVE SUMMARY Background and Context Habitat for Humanity International (HFHI) with support from MasterCard Foundation has embarked on a program model focused on building capacity of key actors in the market, particularly financial service providers (FSPs), to offer vibrant, viable and scalable housing microfinance (HMF) products for low‐income sectors of Ghana, Uganda, and Kenya. HFHI is implementing this project through its Center for Innovation in Shelter and Finance (CISF). The capacity building activities with the FSPs focuses on developing appropriate HMF products, which requires market knowledge. It is for this reason that HFHI, as part of its methodological approach, implemented a market mapping and housing value chain study in Kenya. The overall purpose of this study is to deepen and strengthen understanding of Kenya’s low income housing sector for FSPs and other stakeholders, in order to increase their ability to provide affordable products that promote access to housing for the low‐income earning communities in Kenya. This market mapping exercise permits the visualization of processes, actors, linkages constraints and opportunities within Kenya’s low‐income housing market, through diagrammatic representations of relevant value chain maps. This provides a starting point for stakeholders to formulate interventions to improve efficiencies and effectiveness1 within the HMF sector in Kenya. The entry point and orientation of this study is enabling the low income earners (earning between US $5and US $ 10 dollars, a day) to have access to decent housing. Thus, the approach used in this study is oriented towards a value chain analysis from the point of view of the poor home owner/end user. Because completion of a house is a process, the mapping process starts with the end user backwards towards the original supplier or producer of materials using a descriptive approach. Ferguson’s Value Chain Framework2 provides the conceptual approach to the study. Ferguson recommends a step by step value chain analysis framework through a five stage process for low income housing construction as follows: a) acquisition of the land, b) up‐grading property tenure (for example acquiring full legal title), c) provision of basic infrastructure at a community level, d) construction of the house, and e) financial and non‐financial support services bases.
Key Highlights of the Mapping Process The patterns of land administration, land ownership and use, right from the colonial days in Kenya, have largely influenced the process, and procedures for land access and security of tenure. British colonial settlement from the late nineteenth century through 1965 had two distinct outcomes in Kenya. First it resulted in imbalanced infrastructural development. Areas that were inhabited by the settlers tended to have better access to education, roads, and so on, as well as potential for commerce. Thus, at independence Central Province had better access to education, health services and transportation infrastructure. Second, colonial settlement in these areas led to the emergence of a class society based largely on land ownership. The history of land relations in Kenya is one characterized by, firstly, foreign
1 Efficiencies in value chain analysis aim at enabling value addition at each component within the chain, at the least cost with ecological positive impact. Effectiveness is about maximizing opportunities for adding value from the perspective of the end user (consumer). Source: Sustainable Value Chain Analysis: An Agriculture / Food Chain Diagnostic by Laurie Bonney 2009. 2 Ferguson, Bruce. “A Value Chain Framework for Affordable Housing In Emerging Countries,” Global Urban Development Magazine, November 2008
7
subjugation and occupation and, secondly, by wanton abuse of legal trust vested in the government in relation to land as well as in the failure to rectify the colonial legacy of injustice by post‐colonial governments 3. It is precisely the historical land injustices that subsequently degenerated into the existing emotive land issues, which the National Land Policy 2009 intends to resolve. Recent legislation redresses past land injustices through the harmonization of the multiple land acts into three, namely Land Act 2012, Land Registration Act 2012 and National Land Commission Act 2012.4 However the extent to which the new and old land regimes are known to the poor is still very shallow, and this is reflected in the high level of engagement of lawyers, brokers, state authorities and estate agents in land transactions within the low income market segment.
For land purchase to be viable for poor households, the physical space needs to be available in plots of a reasonable size at an affordable price in a location that allows the households to earn their livelihood. Kenya’s cities and towns host almost 40% of the national population, and this is likely to increase to 54% in 20305. Further Kenya’s slum dwellings host 71% of Kenya’s urban population6. This high population density in the urban areas has put pressure on the land sizes, and subsequent land prices, leading to subdivisions, albeit informal, in most cities and towns. Informal systems of land delivery are the main channels of housing land supply. The plots are supplied through subdivision and sale of land held under customary tenure by the shareholders in land buying companies. It is highly unlikely that low income poor will be able access land for housing unless the bulk of the land in Kenya falls under the communal land tenure system.
The National Land Policy in 2009 observed that Kenya had not had – until its adoption ‐ a single and clearly defined national land policy since independence7. This, together with the existence of many land laws, some of which are incompatible, has resulted in a complex land management and administration system creating numerous land problems. The land problems manifest themselves in various ways such as land fragmentation, breakdown in land administration, disparities in land ownership, poverty, environmental degradation, squatting and landlessness, disinheritance of some groups and individuals, urban squalor, underutilization and abandonment of some agricultural land, tenure insecurity and increasing land conflicts8.
According to the Housing Strategic Plan 2008‐2013, the housing sector in Kenya is characterized by inadequate affordable and decent housing, low‐level urban home ownership estimated at 16 percent and expansive slums and informal settlements. It is estimated that out of a total 150,000 housing units required annually in urban areas, only 35,000 units are produced. The shortage of housing for low income households is particularly acute in urban areas, with only 20 per cent of houses produced catering for this group.
Low income builders rely on informal sources of income, whose cash flow is seasonal and highly unpredictable. All mortgage finance schemes are long term whose repayments are broken down into equal and predictable instalments and thus exclude access to the low income segment.
Roofing costs constitute nearly 50% of the total building costs, and during the focus group discussions was ranked first in terms of building stage that exerts the most financial pressure. It
3 See Peter Omuodho in “Legal Framework to Deal with Past Misdeeds Related to Land in Kenya. KatibaNews Issue No. 08.08, August ’06 Newsletter; Media Development Association 4 The Land Laws Of Kenya A Summary Of The Changes Compiled by Mona Doshi October 2012 5 The Kenyan Urban Sector Profile UN-Habitat , 2005 6 The Kenyan Urban Sector Profile UN-Habitat , 2005 7 RoK, 2009: p 1 8 Political Economy And Governance Issues Surrounding Policy Interventions In The Land Sector In Kenya Final Report, Pau l M. Sagya and Albert K. Mwenda, 2010
8
is against the background of estimated roofing expenses that the size of rooms will be define at the design stage. Nevertheless, once low income builders have pre‐determined costs of construction, it becomes easier for financial service providers and other partners to prepare the low income builder overcome the challenges of quality construction over the tenure of incremental construction.
The most emerging features in incremental building are that the components of building over time and that each of the stages as a predetermined budget. Low income builders anticipate how much money they need to put up to transit from one stage to another towards completion of their houses. This point to structured targeted savings instruments, where low income builders may be given the option to make pre‐determined small savings into a given fund or account on a regular basis over a period of time leading to a targeted lump sum. The fact that low income houses are built through the perspective of the local artisans, has perpetuated low income households into a cycle of poor quality housing. This is mainly because local artisans lack the proper professional training and skills to build to standards and also inform future innovations towards affordable housing construction.
Key Findings
Security of tenure does not necessarily mean ownership of a land title. In Kenya, the process of acquiring title has always been unclear to low income households. Alternative methods can be used to ascertain security of tenure. This could be related to the practice being used within a community to prove ownership, specifically being able to establish that no evictions shall be made in the near future, or in case of any acquisition by government rightful compensation will be obtained. For financial institutions this could mean that security of tenure could be ascertained to a level of confidence that matches the loan tenure.
Mortgages vs. HMF: The developers in Kenya today offer completed housing units. This does not necessarily resolve the problem of housing the poor, but rather concentrates the right to housing to the landlords. On the other hand HMF focuses on enabling more low income persons to become homeowners rather than being tenants through incremental building. Hence HMF is more likely to support a greater numbers of low income persons to meet their housing goals than mortgages for completed units
Incremental or progressive building is done over a time period: The elements of time and progressive steps or stages characteristic in incremental building are critical components to the design of HMF products. Savings products, like loan products, can be appropriately designed and delivered along the path to a complete house. The fact that roofing and “finishing” a house comprise the largest proportion of the building costs implies that both loan and savings packages could be designed. There are as much opportunities for annuities as well as loan services.
Poor quality housing is a reflection of the low skilled artisans: Local artisans largely influence the purchase process, budgeting and design of low income houses. As much as they are more flexible than professional engineers towards progressive building, their low education, informal approach to building, lack of modern building skills, combined with poor enforcement of building codes, has largely affected the ability to innovate, and recommend better building technologies and materials to their low income clients. This in effect increases the cost of construction and ability to construct decent dwellings.
Value chain support for the housing market is distinct from value chain programming in productive sectors: In contrast with a pro‐poor value chain in sectors such as agriculture, which
9
focuses on improving markets and efficiencies for income generating activities, housing finance is targeted a consumers of housing materials and final construction. As such, the primary objective of the low income housing value chain is to enable delivery of decent housing to the low income segment at the most affordable levels. Hence the value chain processes and actors that interact with low income builders should strive towards delivering quality at the lowest cost possible, which enables the low income households obtain decent shelter. This distinction is important to understand when designing an financial or non‐financial intervention in the housing value chain.
Provision of support services through collaboration: the end users have limited access to building information and less informed on matters of law related to security of tenure. They more often interact with a number of players in search of information just to transit from the need for shelter to actually occupying a complete and decent house. This in effect makes tracing the value chain for the construction of low income end user complex, since there are many players in the housing sector with highly bureaucratic processes. There are thus a combination of obstacles faced by low income households in accessing decent housing in Kenya, that require multi‐dimensional responses, necessitating institutional collaboration or partnerships. Poor infrastructure, lack of quality water, proper sanitation and drainage channels are some the challenges of low income dwellings. The 1970’s low cost Umoja housing estates rightly addressed the issue of drainage, and plumbing connections where the utilities (toilet, shower, and sink) were built in a block outside each cluster. Each family had its own, lockable utilities, but placing them together instead of inside individual units dramatically cut unit costs for plumbing. This is a demonstrable example on affordable infrastructure for low cost housing.
Summary of Recommendations
1. Enhance information dissemination at the local level ‐ particular with regards to new legislation, the processes for accessing tenure and title, and people’s land rights.
2. Advocacy efforts to improve access to land‐ focusing on streamlining contradictory laws and improving regulation of professionals administering land.
3. Improving quality of construction services available to the poor – various approaches from supporting the consideration of incremental building in building codes, establishing micro franchises among artisans and/or independent certifications, and the use of alternative technologies.
4. Improving low income access to quality infrastructure – this may be done in collaboration with private sector, working through cooperatives to improve collective investments and/or infrastructure finance for individual homes.
5. Savings products ‐ fill the existing gap in savings products for housing construction.
6. Credit product ‐: there is room for more HMF credit products, designed to accommodate incremental building in which the most expenses phases are toward the end of construction.
7. Collaboration ‐ deliberate collaboration among actors is more likely to result in better housing.
8. Understand the cultural context ‐ Land problems in Kenya and security of tenure are largely related to ethnicity, and housing requires an understanding of livelihoods.
9. New innovations in financial instrument – tools such as bonds which can attract patient capital allow for affordable financing for institutions seeking to engage in HMF.
10
1. INTRODUCTION HFHI with support from MasterCard Foundation has embarked on a program model of to building capacity of key actors in the market, particularly FSPs, to offer vibrant, viable and scalable HMF products for low‐income sectors of Ghana, Uganda, and Kenya. HFHI is implementing this project through its CISF. The partnership with the FSPs focuses on developing appropriate HMF products, which requires market knowledge. It is for this reason that HFHI commissioned Ayani Inclusive Financial Sector Consultants (Ayani) to carry out a Kenya housing market mapping and housing value chain study in Kenya. The overall purpose of this study is to deepen and strengthen understanding of Kenya’s low income housing sector for FSPs and other stakeholders, in order to increase their ability to provide affordable products that promote access to housing for the low‐income earning communities in Kenya. This market mapping exercise permits the visualization of processes, actors, linkages constraints and opportunities within Kenya’s low‐income housing market, through diagrammatic representations of relevant value chain maps. This provides a starting point for stakeholders to formulate interventions to improve efficiencies and effectiveness9 within the HMF sector in Kenya. The entry point and orientation of this study is enabling the low income earners (earning between US $5and US $ 10 dollars, a day) to have access to decent housing. Thus, the approach used in this study is oriented towards a value chain analysis from the point of view of the poor home owner/end user. Because completion of a house is a process, the mapping process starts with the end user backwards towards the original supplier or producer of materials using a descriptive approach. This report is based on the views obtained through focus group discussions (FGDs) and Participatory Rapid Appraisal (PRA) tools of low income home owners, and artisans selected from the low income settlements of Kisumu, Nairobi and Nakuru. The study also draws its findings from a comprehensive desk review of relevant secondary data on the Kenyan housing sector and selected global publications relevant to the sector. A review of selected global literature was primarily used to guide the analysis, and synthesis of local baseline information and statistics. This study attempts to provide a graphic representation of Kenya’s housing value chain map. The housing value chain is reconstructed backwards to assess the processes, interactions, information flows and linkages that enable the low income poor households acquire their shelter. The ultimate objective for analyzing housing value chain is twofold: first to improve the delivery mechanisms for low income housing shelter through a process that guarantees decency and quality of shelter and second to promote affordable delivery mechanisms for the low income housing shelter, which is clearly relevant to their progressive approach to building. This is quite different from pro poor agriculture value chains whose primary objective is to achieve higher absolute incomes for the poor as well as other actors along the chain. Reorienting value chains for low‐income housing to enable the homeowners to participate and have access to decent shelter is a complex challenge. It requires the analysis of current value chains across heterogeneous market systems and high complex subsectors that include the land market, water and
9 Efficiencies in value chain analysis aim at enabling value addition at each component within the chain, at the least cost with ecological positive impact. Effectiveness is about maximizing opportunities for adding value from the perspective of the end user (consumer). Source: Sustainable Value Chain Analysis: An agricultural / food chain diagnostic by Laurie Bonney 2009.
11
sanitation, household energy and electricity, housing construction and building materials subsector, and the housing business support services that are mainly provided by non‐governmental organizations (NGOs), civil society organizations (CSOs). Additionally, various financial services providers include but are not limited to banks, microfinance institutions (MFIs), cooperatives and savings and credit cooperatives (SACCOs). The process requires a validation of existing laws, governance structures, and update of statistical data relevant to the low income housing market system. The framework for analysis of value chains that informs this report was adopted from Ferguson’s10 Value Chain Framework for Affordable Housing in Emerging Countries, where a model for progressive building has been prescribed, whose components that are not necessarily sequential, typically consist of the following:
Acquisition of the land
Up‐grading property tenure (for example acquiring full legal title)
Provision of basic infrastructure at a community level
Construction of the house
Financial and non‐financial support services. In this report, each of the above steps is separately analyzed for the different processes, actors, supporting systems, and information flows.
10 Ferguson, Bruce. “A Value Chain Framework for Affordable Housing In Emerging Countries,” Global Urban Development Magazine, November 2008.
12
2. MARKET MAPPING METHODOLOGY
A methodological approach in line with the HFHI’s CISF market mapping methodology was used. The mapping of low income housing markets required an assessment of each component of housing acquisition, improvement and security.
While the components were neither sequential nor linear, the housing value chain typically consisted of the following:
Acquisition of the land
Up‐grading property tenure (for example acquiring full legal title)
Provision of basic infrastructure at a community level
Construction of the house
Financial and non‐financial support services.
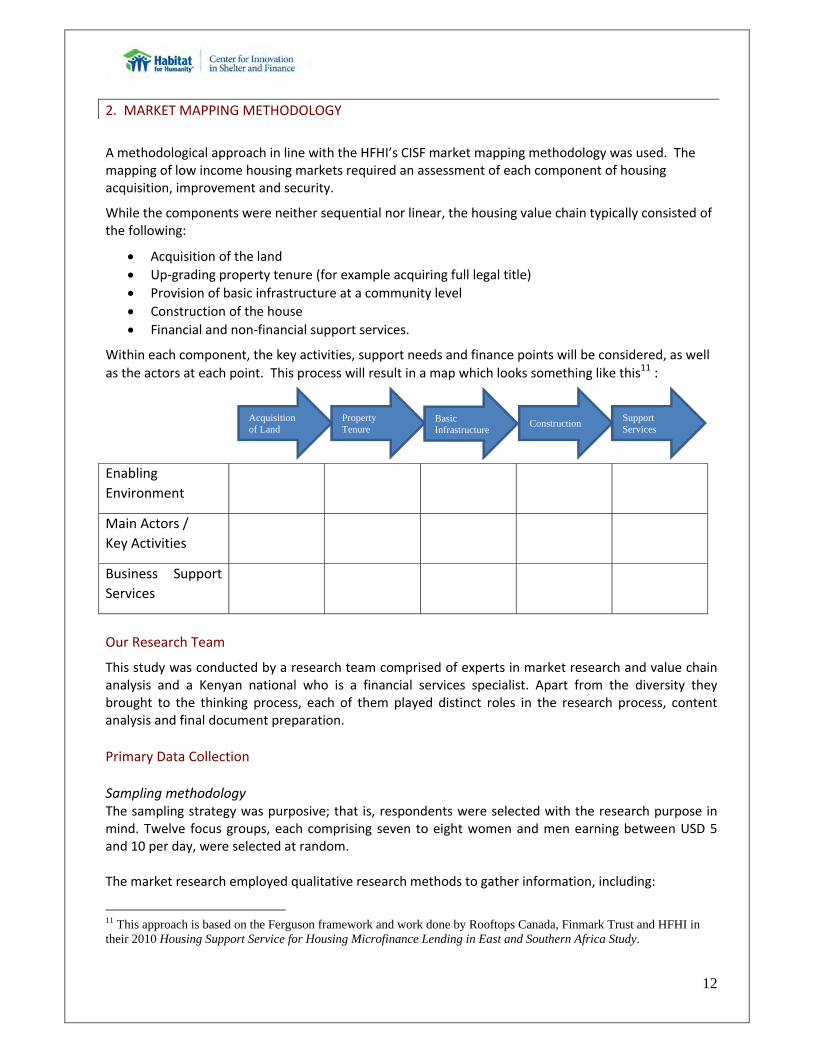
Within each component, the key activities, support needs and finance points will be considered, as well
as the actors at each point. This process will result in a map which looks something like this11 :
Enabling
Environment
Main Actors /
Key Activities
Business Support
Services
Our Research Team
This study was conducted by a research team comprised of experts in market research and value chain analysis and a Kenyan national who is a financial services specialist. Apart from the diversity they brought to the thinking process, each of them played distinct roles in the research process, content analysis and final document preparation.
Primary Data Collection Sampling methodology The sampling strategy was purposive; that is, respondents were selected with the research purpose in mind. Twelve focus groups, each comprising seven to eight women and men earning between USD 5 and 10 per day, were selected at random. The market research employed qualitative research methods to gather information, including:
11 This approach is based on the Ferguson framework and work done by Rooftops Canada, Finmark Trust and HFHI in their 2010 Housing Support Service for Housing Microfinance Lending in East and Southern Africa Study.
Acquisition of Land
Basic Infrastructure
Property Tenure
Support Services
Construction
13
FGD with end users using discussion guides and PRA tools, and
Key informant interviews (KIIs) conducted with discussion guides were administered to 15 respondents within the land, housing, and relevant public administration sectors.
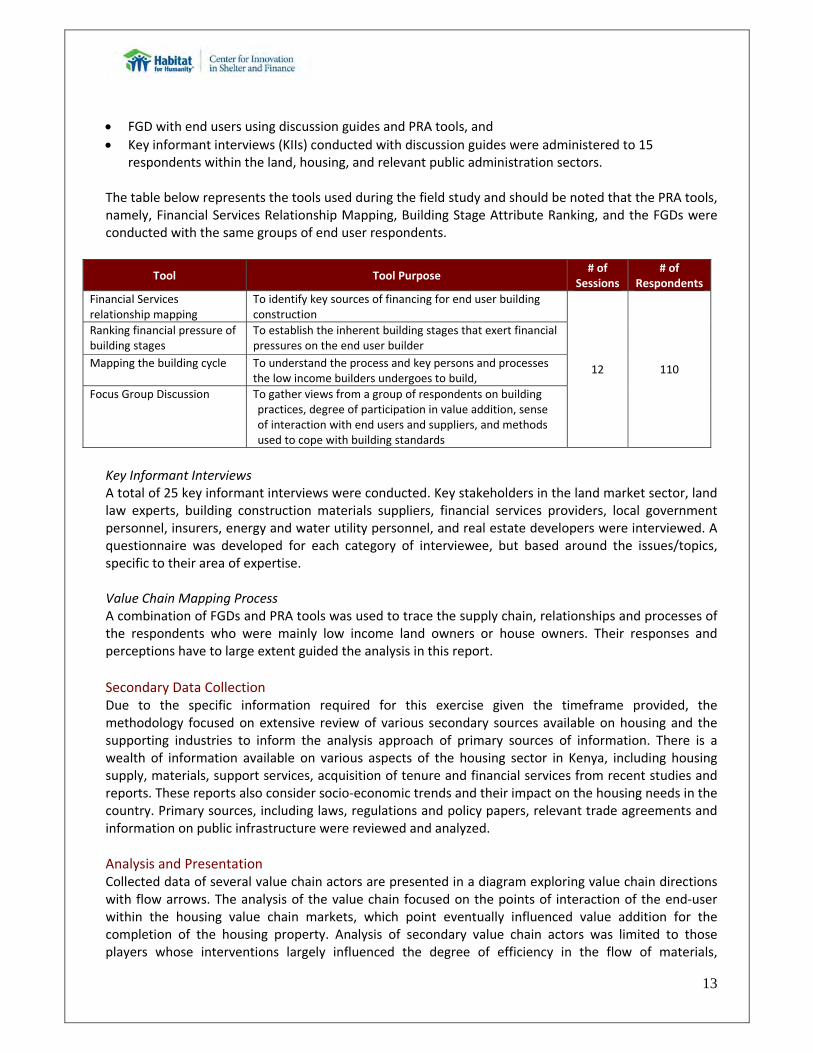
The table below represents the tools used during the field study and should be noted that the PRA tools, namely, Financial Services Relationship Mapping, Building Stage Attribute Ranking, and the FGDs were conducted with the same groups of end user respondents.
Tool Tool Purpose # of
Sessions # of
Respondents
Financial Services relationship mapping
To identify key sources of financing for end user building construction
12 110
Ranking financial pressure of building stages
To establish the inherent building stages that exert financial pressures on the end user builder
Mapping the building cycle To understand the process and key persons and processes the low income builders undergoes to build,
Focus Group Discussion To gather views from a group of respondents on building practices, degree of participation in value addition, sense of interaction with end users and suppliers, and methods used to cope with building standards
Key Informant Interviews A total of 25 key informant interviews were conducted. Key stakeholders in the land market sector, land law experts, building construction materials suppliers, financial services providers, local government personnel, insurers, energy and water utility personnel, and real estate developers were interviewed. A questionnaire was developed for each category of interviewee, but based around the issues/topics, specific to their area of expertise. Value Chain Mapping Process A combination of FGDs and PRA tools was used to trace the supply chain, relationships and processes of the respondents who were mainly low income land owners or house owners. Their responses and perceptions have to large extent guided the analysis in this report.
Secondary Data Collection Due to the specific information required for this exercise given the timeframe provided, the methodology focused on extensive review of various secondary sources available on housing and the supporting industries to inform the analysis approach of primary sources of information. There is a wealth of information available on various aspects of the housing sector in Kenya, including housing supply, materials, support services, acquisition of tenure and financial services from recent studies and reports. These reports also consider socio‐economic trends and their impact on the housing needs in the country. Primary sources, including laws, regulations and policy papers, relevant trade agreements and information on public infrastructure were reviewed and analyzed.
Analysis and Presentation Collected data of several value chain actors are presented in a diagram exploring value chain directions with flow arrows. The analysis of the value chain focused on the points of interaction of the end‐user within the housing value chain markets, which point eventually influenced value addition for the completion of the housing property. Analysis of secondary value chain actors was limited to those players whose interventions largely influenced the degree of efficiency in the flow of materials,
14
information, and level of interaction among the main actors. Most of the facts and figures used in the analysis were derived from secondary data sources.
Limitations of the Methodology The primary limitation to the methodology relates to the sensitive nature of the financial information being provided by the estate developers and financial institutions. However publicly available information was obtained except that it is not very current, but indicative of industrial situations to inform future interventions. Additionally, the time allotted to the analysis, mapping and writing of the report was a challenge for the team. Realistically, a study of this nature is best conducted over a three month period.
15
3. COUNTRY CONTEXT
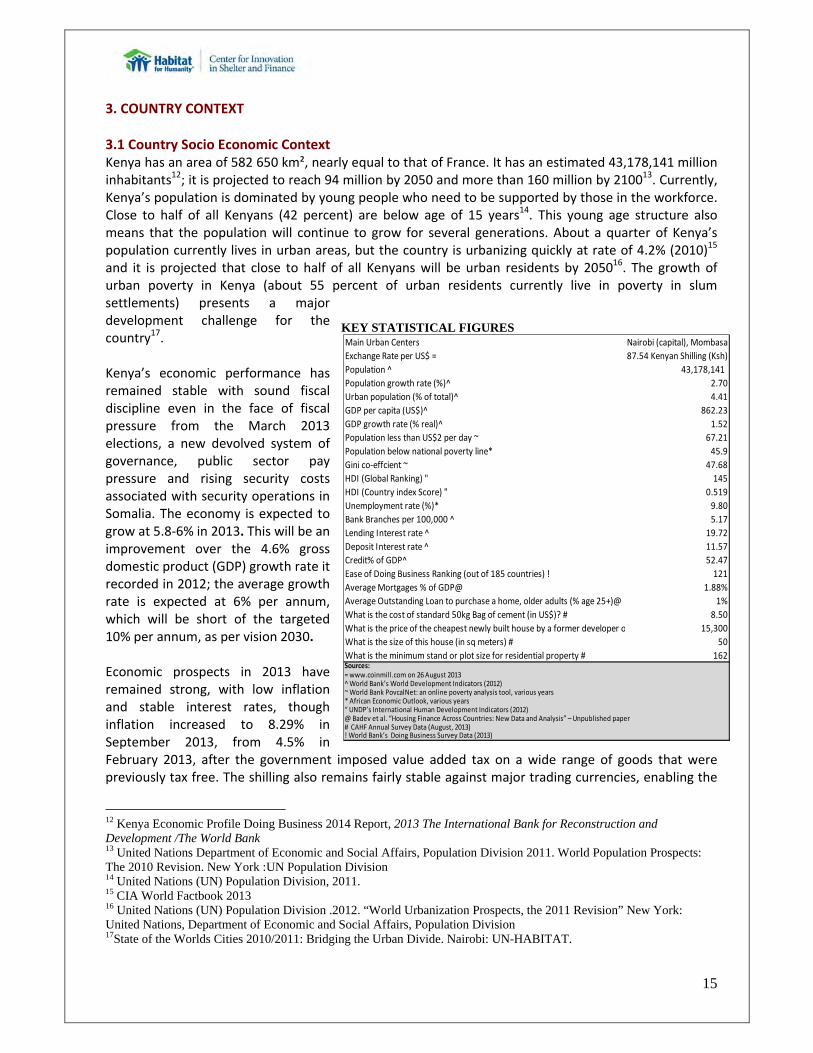
3.1 Country Socio Economic Context Kenya has an area of 582 650 km², nearly equal to that of France. It has an estimated 43,178,141 million inhabitants12; it is projected to reach 94 million by 2050 and more than 160 million by 210013. Currently, Kenya’s population is dominated by young people who need to be supported by those in the workforce. Close to half of all Kenyans (42 percent) are below age of 15 years14. This young age structure also means that the population will continue to grow for several generations. About a quarter of Kenya’s population currently lives in urban areas, but the country is urbanizing quickly at rate of 4.2% (2010)15 and it is projected that close to half of all Kenyans will be urban residents by 205016. The growth of urban poverty in Kenya (about 55 percent of urban residents currently live in poverty in slum settlements) presents a major development challenge for the country17. Kenya’s economic performance has remained stable with sound fiscal discipline even in the face of fiscal pressure from the March 2013 elections, a new devolved system of governance, public sector pay pressure and rising security costs associated with security operations in Somalia. The economy is expected to grow at 5.8‐6% in 2013. This will be an improvement over the 4.6% gross domestic product (GDP) growth rate it recorded in 2012; the average growth rate is expected at 6% per annum, which will be short of the targeted 10% per annum, as per vision 2030. Economic prospects in 2013 have remained strong, with low inflation and stable interest rates, though inflation increased to 8.29% in September 2013, from 4.5% in February 2013, after the government imposed value added tax on a wide range of goods that were previously tax free. The shilling also remains fairly stable against major trading currencies, enabling the
12 Kenya Economic Profile Doing Business 2014 Report, 2013 The International Bank for Reconstruction and Development /The World Bank 13 United Nations Department of Economic and Social Affairs, Population Division 2011. World Population Prospects: The 2010 Revision. New York :UN Population Division 14 United Nations (UN) Population Division, 2011. 15 CIA World Factbook 2013 16 United Nations (UN) Population Division .2012. “World Urbanization Prospects, the 2011 Revision” New York: United Nations, Department of Economic and Social Affairs, Population Division 17State of the Worlds Cities 2010/2011: Bridging the Urban Divide. Nairobi: UN-HABITAT.
KEY STATISTICAL FIGURES Main Urban Centers Nairobi (capital), Mombasa
Exchange Rate per US$ = 87.54 Kenyan Shilling (Ksh)
Population ^ 43,178,141
Population growth rate (%)^ 2.70
Urban population (% of total)^ 4.41
GDP per capita (US$)^ 862.23
GDP growth rate (% real)^ 1.52
Population less than US$2 per day ~ 67.21
Population below national poverty line* 45.9
Gini co‐effcient ~ 47.68
HDI (Global Ranking) " 145
HDI (Country index Score) " 0.519
Unemployment rate (%)* 9.80
Bank Branches per 100,000 ^ 5.17
Lending Interest rate ^ 19.72
Deposit Interest rate ^ 11.57
Credit% of GDP^ 52.47
Ease of Doing Business Ranking (out of 185 countries) ! 121
Average Mortgages % of GDP@ 1.88%
Average Outstanding Loan to purchase a home, older adults (% age 25+)@ 1%
What is the cost of standard 50kg Bag of cement (in US$)? # 8.50
What is the price of the cheapest newly built house by a former developer o 15,300
What is the size of this house (in sq meters) # 50
What is the minimum stand or plot size for residential property # 162Sources:= www.coinmill.com on 26 August 2013^ World Bank’s World Development Indicators (2012)~ World Bank PovcalNet: an online poverty analysis tool, various years* African Economic Outlook, various years“ UNDP’s International Human Development Indicators (2012)@ Badev et al. “Housing Finance Across Countries: New Data and Analysis” – Unpublished paper# CAHF Annual Survey Data (August, 2013)! World Bank’s Doing Business Survey Data (2013)
INTERN
$5
$2
$1
NATIO
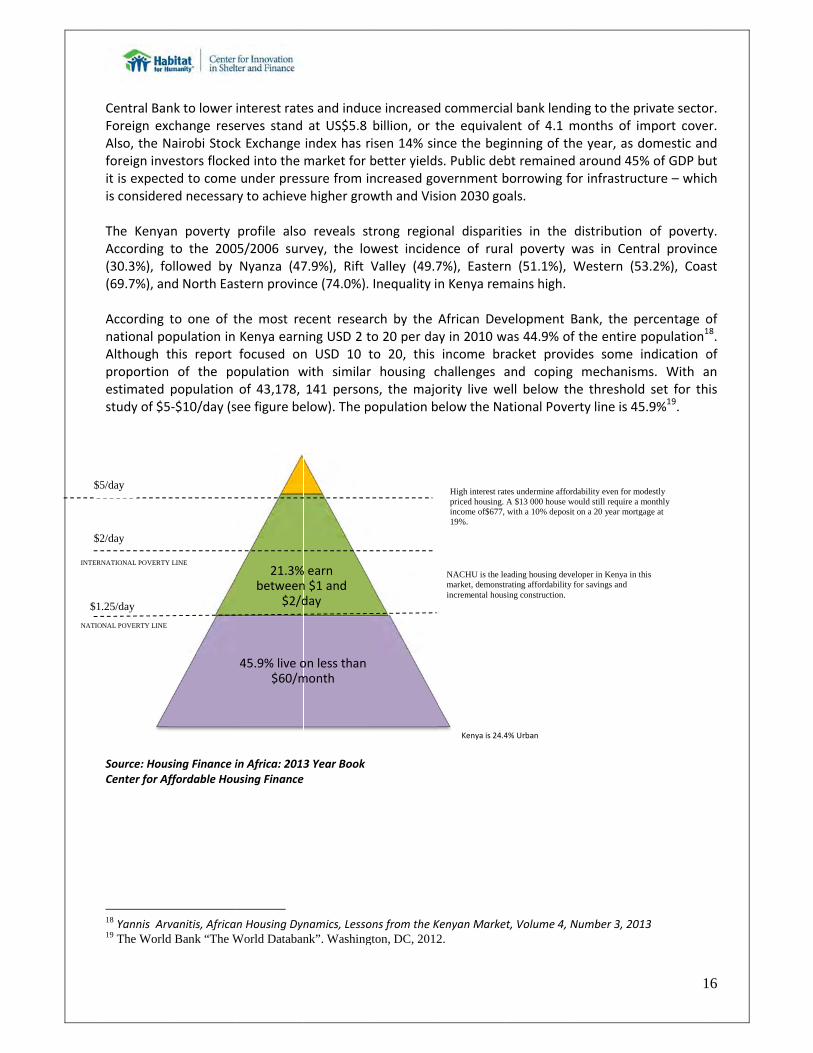
Central BanForeign excAlso, the Nforeign inveit is expectis considere The KenyaAccording (30.3%), fo(69.7%), an According national poAlthough tproportionestimated study of $5
Source: HousCenter for Af
18 Yannis Arv19 The World
NATIONAL POVERTY
5/day
2/day
.25/day
NAL POVERTY LINE
nk to lower change reseNairobi Stockestors flockeed to comeed necessar
an poverty to the 200ollowed by nd North Eas
to one of topulation in this report of the popopulation 5‐$10/day (s
sing Finance iffordable Hou
vanitis, Africad Bank “The W
Y LINE
interest rateerves stand k Exchange ed into the under presry to achieve
profile also05/2006 surNyanza (47stern provin
the most reKenya earnfocused onopulation wof 43,178, ee figure be
in Africa: 2013using Finance
n Housing Dyn
World Databan
21.3%between
$2/d
45.9% live o$60/m
es and inducat US$5.8 index has rmarket for bssure from ine higher grow
o reveals stvey, the lo7.9%), Rift Vce (74.0%).
ecent researning USD 2 tn USD 10 twith similar141 personelow). The p
3 Year Book
namics, Lessonk”. Washing
% earn n $1 and day
on less than month
ce increasedbillion, or tisen 14% sinbetter yieldsncreased gowth and Vis
trong regionwest incideValley (49.7Inequality i
rch by the o 20 per dato 20, this r housing cns, the majoopulation b
ons from the Kgton, DC, 2012
d commerciathe equivalence the begs. Public debovernment bion 2030 go
nal disparitence of rura7%), Easternn Kenya rem
African Devy in 2010 wincome br
challenges aority live weelow the Na
Kenya is 24.4
Kenyan Marke2.
High interest ratpriced housing. income of$677, 19%.
NACHU is the lemarket, demonstrincremental hous
al bank lendent of 4.1 mginning of thbt remainedborrowing fooals.
ies in the al poverty wn (51.1%), mains high.
velopment Bwas 44.9% ofacket proviand copingell below thational Pove
4% Urban
et, Volume 4, N
tes undermine afforA $13 000 house wwith a 10% deposit
eading housing deverating affordability sing construction.
ing to the pmonths of ihe year, as dd around 45%or infrastruc
distributionwas in CenWestern (5
Bank, the pf the entire des some mechanismhe thresholderty line is 45
Number 3, 201
rdability even for mwould still require a t on a 20 year mortg
eloper in Kenya in tfor savings and
1
rivate sectomport covedomestic an% of GDP bucture – whic
n of poverttral provinc53.2%), Coa
percentage opopulation1
indication oms. With ad set for th5.9%19.
13
odestly monthly
gage at
this
16
or. er. nd ut ch
y. ce st
of 18. of an his
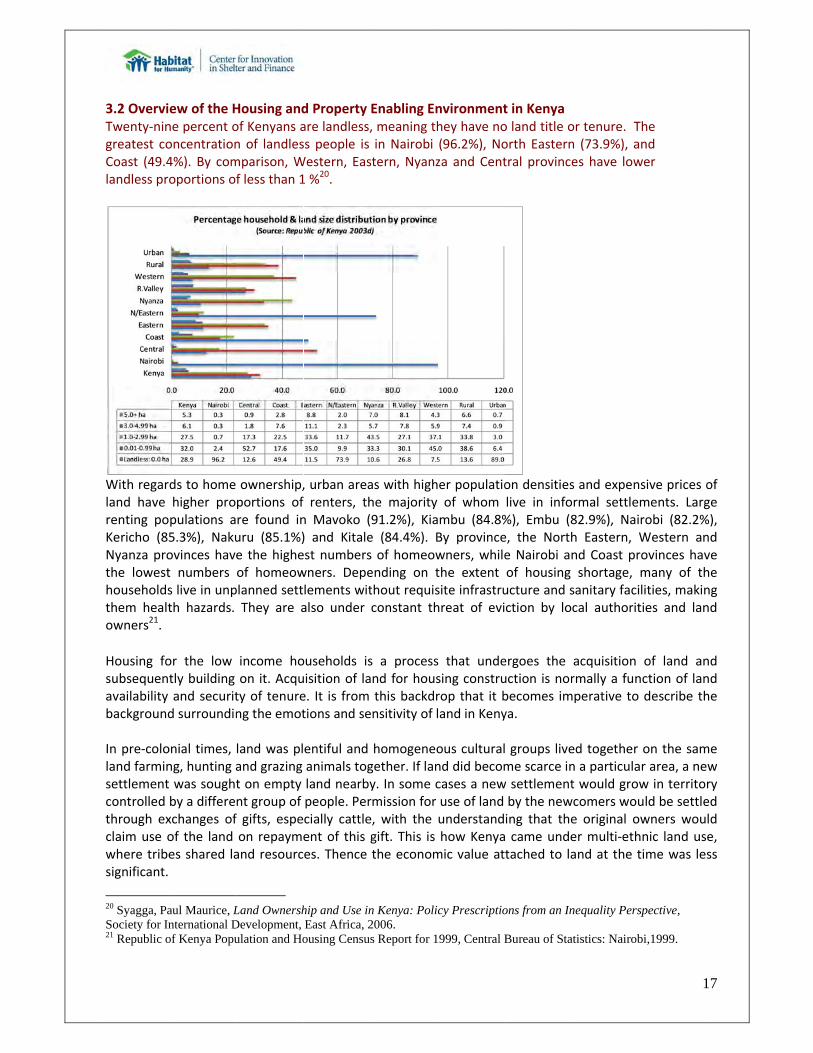
3.2 OverviTwenty‐ningreatest coCoast (49.4landless pro
With regarland have renting poKericho (85Nyanza prothe lowesthouseholdsthem healtowners21.
Housing fosubsequentavailability background In pre‐cololand farminsettlementcontrolled through exclaim use owhere tribesignificant.
20 Syagga, PaSociety for In21 Republic o
ew of the Hne percent ooncentration4%). By comoportions of
ds to home higher propulations a5.3%), Nakuovinces havet numbers s live in unpth hazards.
or the low tly building and securitd surroundin
onial times, ng, hunting a was soughtby a differexchanges ofof the land es shared la
aul Maurice, Lnternational Dof Kenya Popu
Housing andof Kenyans an of landlesmparison, Wf less than 1
ownership,portions of re found inuru (85.1%)e the higheof homeowplanned settThey are a
income hoon it. Acquty of tenureng the emot
land was pland grazing t on empty nt group of f gifts, espeon repaymeand resourc
Land OwnershDevelopment, ulation and Ho
d Property are landless,ss people is Western, Eas1 %20.
, urban arearenters, th
n Mavoko () and Kitaleest numberswners. Depelements witalso under
ouseholds isuisition of lae. It is from tions and se
entiful and animals togland nearbypeople. Percially cattleent of this ges. Thence
hip and Use inEast Africa, 2ousing Census
Enabling En, meaning thin Nairobi
stern, Nyanz
as with highhe majority 91.2%), Kiae (84.4%). Bs of homeowending on tthout requisconstant th
s a processnd for housthis backdrnsitivity of l
homogeneogether. If lany. In some crmission for e, with the gift. This is the econom
n Kenya: Polic2006. s Report for 1
nvironmenthey have no(96.2%), Noza and Cent
er populatioof whom mbu (84.8%By provincewners, whilethe extent site infrastruhreat of evi
s that undesing construrop that it band in Keny
ous culturalnd did becomcases a newuse of land understandhow Kenya
mic value att
cy Prescriptio
999, Central B
t in Kenyao land title oorth Easterntral province
on densitieslive in info%), Embu (8e, the Northe Nairobi anof housing ucture and sction by loc
ergoes the uction is norbecomes imya.
groups liveme scarce inw settlementby the newing that the came undetached to la
ons from an In
Bureau of Sta
or tenure. Tn (73.9%), aes have low
s and expenrmal settlem82.9%), Naih Eastern, Wnd Coast prshortage,
sanitary facical authorit
acquisition rmally a funperative to
ed together n a particulat would growcomers woue original oer multi‐ethand at the t
nequality Pers
tistics: Nairob
1
The nd wer
sive prices oments. Largrobi (82.2%Western anrovinces havmany of thlities, makinties and lan
of land annction of landescribe th
on the samr area, a new in territoruld be settlewners wouhnic land ustime was les
spective,
bi,1999.
17
of ge %), nd ve he ng nd
nd nd he
me w ry ed ld e, ss
18
The advent of the colonial times introduced the restrictive policies of land use, where pastoralists or herders were restricted to specific areas, where the Maasais in the South were restricted to the Maasai Reserve and the herders in the North albeit with more freedom to move restricted to the Northern Frontier District. In the highlands of Kenya, large tracts of land were set aside for European settlers, which at first remained accessible to Kenyan farmers – as they were allowed to graze animals and plant crops. In exchange they paid the Europeans, at first with milk and later by working on European farms. Later the European farmers supported by the legal system then, imposed restrictions of use on the natives. This was the beginning of a paradigm shift from traditional land use and ownership to the current land policy legislative environment that exists today in Kenya. In principle ownership, control and use of land slowly shifted from the hands of the community to a more individualized land regime, highly administered and managed by the state and the agents of the state. European settlement in Kenya largely influenced the land ownership and settlement patterns that exist today. By the 1960s, Kenya inherited a dual system of land administration, one for a small number of European settlers who owned 75 percent of all high potential land, and another for 1subsistence African peasantry largely on marginal land with only 25 percent of high potential land. Today 20 percent of the land in Kenya is high potential, and accommodates about 75% of the population, with densities estimated at 2000 persons per square kilometers in some parts. Land holdings are small and are suffering continuous fragmentation into uneconomic sizes. The result is landlessness and squatting both in rural and urban areas. This has also led to congestion and even to ethnic conflicts particularly in the pastoral areas. As noted above, 29% of Kenyans are landless, and the majority of the remainder own less than 1.0 hectare of land. If the land is too small, then owners are by no means full‐time farmers and the attachment to land becomes more of security for old age rather than an income‐generating asset. It becomes difficult to create a prosperous and contented peasantry. The foregoing scenario thus explains the current emotive nature of land issues in Kenya, and existence of previous and registration management regimes.
THE DIFFERENT REGISTRATIVE REGIMES OF LAND REGISTRATION In this country, one can talk of six different statutory registration regimes which operate side by side. THE DOCUMENTS ACT This particular piece of registration was enacted in 1901 although its history dates back to 1896 when the colonial administration then in place felt the need for a simple registration system. Registration of documents systems was recommended in Kenya based on experiences that the British had had with it in Zanzibar. The Aact created a simple system for registration of deeds which are reflected in the register of documents. LAND TITLES ACT This Act was introduced 1908, with a view to creating a registration system that would be applicable only to the coastal region and this was particular more so given that the hinterland was adequately catered for by the series of the Crown Land Ordinances beginning with the one of 1902. Which ordinances were meant to facilitate white settlement within the interior and did not do much for landowners at the coast. The background to this particular registration regime lies in the doubts and the uncertainties that shrouded the question of individual property ownership within the Coastal Region so the need for individual titles to land at the coast was in effect what led to its enactment. Under purely administrative arrangements between the Sultanate of Zanzibar and the colonial authorities, IBEA part of the sultan’s dominion was ceded to the British
19
under a concession agreement and this was the so called 10 mile coastal strip. The terms of that arrangement bound the British to administer the area but subject to the rights of the inhabitants which included property rights such as the inhabitants may be having. The coastal region was settled by those inhabitants mixture of Arabs and Africans much earlier than the coming of the British so their property preceded the advent of imperialism. The registration regime created under this act was meant to give recognition to those long established claims of ownership and adjudicate them so that claimants would get recognition under the Act. Before this arrangement was put in place there had been a lot of difficulties experienced by property owners and uncertainties about these titles and they worked out adversely in terms of investments it hindered investments and in terms of development it hindered development, as people could not deal with their properties in the market. This is what made it necessary for the Act to be introduced in 1908. GOVERNMENT LANDS ACT This was an adaptation of the previous Crown Lands Ordinance, and in effect replaced the crown ordinance of 1915 that is when it was promulgated. All grants of government land and transactions relating thereto were required to be registered under the Act. REGISTRATION OF TITLES ACT This is a 1920 Act introduced with the purpose of facilitating the process of transfer of land through a registration of transfer system and essentially its purpose was to introduce in Kenya a title registration system based on the Torrens principles. This is a system that was introduced in Australia but which worked there so well that it achieved widespread acceptance in other jurisdictions. This Act is modeled on the 1897 Registration of Titles Act of the Federal Malay States present‐day Malaysia as well as on the 1890 Transfer of Lands Act of the Australian State of Victoria and it gets aspects of both registrations. Any land owner who has had his title registered under the GLA is required under the Act to apply to the registrar to have the same registered under the provisions of the Act and this comes with an advantage as it enables the landowners to enjoy the benefits of state guarantees of the resulting titles. REGISTERED LAND ACT The aim of this Act was to guarantee titles to indigenous people in regard to the land that they occupied. The Act introduces the highly advanced system of indexing of property showing all the registered land within a particular area and all the information including size, title numbers, any claims, encumbrances or burdens which may affect such land. The quest for a unified registration system of course can be argued to have started in earnest with the enactment of this particular statute. It also sought to achieve individualization of title to customary law since in any case the area to which it first applied was with regard to indigenous occupied areas where communal mode of ownership was the rule rather than the exception. So through this Act Kenyan natives and indigenous people were to have their land registered for the first time. Native lands were supposed to be registered and the constitutional arrangement was that the title was vested in the local authorities within whose jurisdictions those lands fell. Under this statute, the land communally occupied by the natives could be declared an “adjudication region,” or a region subject to determination of land ownership rights, where claimants or natives could prove their claims or title to this land, and where consolidation if was desired it would be done, before the land was finally registered. The land consolidated and adjudicated would then be registered to individuals and in any event not to more than 5 persons and absolute ownership is created under the Act. PROPERTIES ACT The Sectional Properties Act NO. 21 of 1987 this is not a distinct and independent registration system because it is clear that any registration carried out under this regime should be deemed to be carried out under a Registered Land Act (RLA) registration. It introduces a vertical dimension to the issue of property. It makes it possible for an owner to own a property on a floor without owning the ground on which the property stands, or air rights, which is property above the ground. There are mutual rights and obligations
20
that arise under such an arrangement because if it is a high‐rise building it will have common stairway, parking, garden pool, and runway and therefore rights and obligations have to be carefully balanced so that everyone can share equally in the common amenities. It is the case that such proprietors would enjoy their own units subject to the rights of all others.
The formal institutions dealing with land in Kenya date back to the colonial period. The office of the Commissioner of Lands has for a long time had the unlimited powers of allocation and administration of land. The institutions dealing with land in Kenya have been identified by the National Land Policy22 as highly centralized, complex and exceedingly bureaucratic. As a result, it is prone to corruption and has not been able to provide efficient services. The shortcomings in the land delivery system23 include: Complexity in the processes, which breeds uncertainty, increases costs and encourages fraud; bureaucratic approval processes for land development applications, leading to indeterminable completion time and costs. This encourages growth of informal markets with major losses of revenue to the government; manual information systems, often characterized by loss of documents, which in some cases requires monetary incentive financed through the private sector. The steady rural urban migration has led to the rapid growth of informal settlements, particularly in Nairobi. The settlements are highly irregular, built without planning, infrastructure, or basic services, including roads, sewers, water, and electricity. The predominant housing construction in the informal settlements is either mud walls built on a wooden frame and plastered over with cement with a corrugated iron roof or corrugated iron walls and roof. The preferred, though much more expensive building material is quarried stone. A one‐room stone structure with a corrugated iron roof currently costs about $900 to $1,100, whereas a mud and wood‐frame construction of the same size costs approximately $350 to $400 to build. Relative to average monthly income of $65 to $78, these construction costs represent five months total income for the mud construction and 14 months total income for the stone structure.
The majority of the structure owners in the informal settlements do not have legal title to the land. However, most have some form of quasi‐legal tenure, typically authorization letters from local government administrators, which were obtained through paying bribes or in return for political patronage. Most of the land was not purchased legally and/or the structures do not conform to government building codes and bylaws, the government does not officially recognize the settlements. It is common to find official maps and plans showing empty blocks of land in places where settlements exist, which makes it easy for the government to sell land that is home to an informal settlement. This leads to displacement of its residents. Most of the population cannot afford housing built by formal developers, and as a result, the majority addresses its housing needs independently and often informally. This contributes to a growth in slum dwellings and poor quality housing. The overall housing backlog is in Kenya estimated to be two million units. Research by a slum dwellers umbrella body, Muungano Wa Wanavijiji, found that 70% of Nairobi’s housing stock comprises single 10m shacks made of wood, mud, tin, galvanized sheets or wattle. Low income slum areas are very densely populated, in a large part due to limited space. Recreational spaces in Nairobi have greater total landmass than the slum settlements. In a move to meet the demand for housing, the government has continued to explore a variety of strategies. Initiatives under way include
22 GOK, 2009 23 Mwangi, 2009
21
the Appropriate Building Technology Programme, the Kenya Slum Upgrading Programme (KENSUP), Civil Servants’ Housing Scheme, Housing Infrastructure and Government Estate Management. NGOs also play an important role in housing delivery, often with the support of international bodies. Homeless International is working with the Pamoja Trust to enable more than 4,000 households to obtain land and/or secure tenure, 172 households to upgrade their homes, and in partnership with the World Bank, relocate 20,000 railway dwelling families to sustainable accommodation. In September 2012, Jamii Bora Makao initiated its second phase of a Ksh 5 billion (USD 58,500) low cost housing project that will deliver 2200 houses. The first phase of 950 houses has been completed and low cost, two‐bedroom units are being sold for USD 18 000 (Ksh 1.58 million) – still out of reach for many. The second phase of 1,250 houses, now initiated, will include housing that costs between USD 30 000 and USD 65 000. The project is 55 km from Nairobi and 20 km from a planned city known as Konza City. HFHI also works in Kenya, and in 2012 offered loans and construction technical assistance to 1,020 families.
3.3 Policy and Regulation Housing is recognized as a basic human right in the Kenyan constitution. The adoption of a national land policy in 2009 was a positive step towards resolving the protracted question of the reliability, accuracy and legitimacy of the land administration system in the country. With the introduction of the Land Registration Act and the Land Act, the land laws have been simplified and harmonized, and have introduced transparency and accountability to land transactions. The laws have also seen the introduction of equitable mortgages which have made lending easier and reduced the conveyance process. To create greater affordability, the stamp duty on property purchases was cut from 25% to 5% of the principal amount, and the tax on mortgages was reduced to 0.1% from 0.2%. To encourage an increase in housing supply, developments of more than 20 low‐ cost units are exempt from VAT. Amendments to the Banking Act have allowed mortgage finance companies to operate current accounts as a way of attracting low cost consumer deposits to expand their lending capacity, and the first company to take advantage of this, Housing Finance Kenya launched its current account offering in March 2012. Housing finance now lends 100% house construction without requesting for a down payment. A new Housing Bill introduced in 2009, proposes the creation of the Kenya Housing Authority with the mandate of monitoring and evaluating the housing sector, conducting research on housing and also driving certain aspects of social housing in Kenya. Through this Housing Bill, the government would be more involved in housing by allocating 5% of the annual budget to housing and infrastructure development. A National Housing Development Fund would also be created with an allocation of about Ksh 10 billion (USD 114 million) annually. It will also raise funds from the capital markets through housing bonds. The bill also provides for a Guaranteed Mortgage Scheme that will protect lenders against risks in housing and make lending more attractive. The bill also recognizes the new building technologies which are cheaper and therefore more affordable to a larger proportion of the population. From a lender’s perspective, the panels which are mainly used to construct such houses can be taken as chattels or mortgages, hence making securitization easier.
22
3.4 Land Tenure in Kenya24
Parliament passed three bills related to land on 25th and 26th of April 2012. The President assented to the bills immediately and the new land laws became effective on 2nd May 2012. The new land laws are:
The National Land Commission Act, 2012;
The Land Registration Act, 2012; and
The Land Act, 2012. The new laws have repealed the following statutes:
The Indian Transfer of Property Act;
The Government Lands Act;
The Registration of Titles Act;
The Land Titles Act;
The Registered Land Act;
The Wayleaves Act; and
The Land Acquisition Act.
The following are some of the laws that have not been repealed:
The Land Control Act;
The Landlord and Tenant (Hotels, Shops and Catering Establishments) Act;
The Sectional Properties Act; and
The Distress for Rent Act.
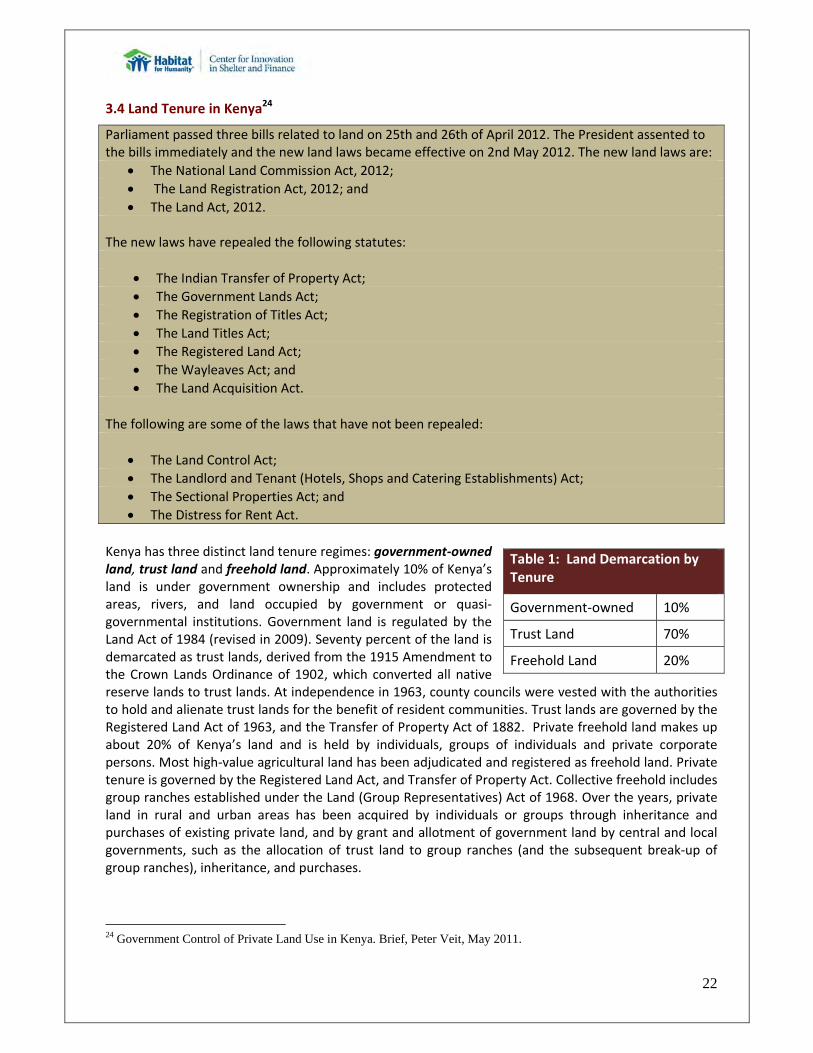
Kenya has three distinct land tenure regimes: government‐owned land, trust land and freehold land. Approximately 10% of Kenya’s land is under government ownership and includes protected areas, rivers, and land occupied by government or quasi‐governmental institutions. Government land is regulated by the Land Act of 1984 (revised in 2009). Seventy percent of the land is demarcated as trust lands, derived from the 1915 Amendment to the Crown Lands Ordinance of 1902, which converted all native reserve lands to trust lands. At independence in 1963, county councils were vested with the authorities to hold and alienate trust lands for the benefit of resident communities. Trust lands are governed by the Registered Land Act of 1963, and the Transfer of Property Act of 1882. Private freehold land makes up about 20% of Kenya’s land and is held by individuals, groups of individuals and private corporate persons. Most high‐value agricultural land has been adjudicated and registered as freehold land. Private tenure is governed by the Registered Land Act, and Transfer of Property Act. Collective freehold includes group ranches established under the Land (Group Representatives) Act of 1968. Over the years, private land in rural and urban areas has been acquired by individuals or groups through inheritance and purchases of existing private land, and by grant and allotment of government land by central and local governments, such as the allocation of trust land to group ranches (and the subsequent break‐up of group ranches), inheritance, and purchases.
24 Government Control of Private Land Use in Kenya. Brief, Peter Veit, May 2011.
Table 1: Land Demarcation by Tenure
Government‐owned 10%
Trust Land 70%
Freehold Land 20%
23
In Kenya, no property rights are absolute. The government has the authority to infringe on those rights, most often in support of national and public interests. Even land held under freehold tenure is held on terms that are subordinate to certain powers of the state. Legislation provides the government with two sets of authorities to extinguish restrict or limit private property rights: 1) eminent domain, the authority to acquire private property in a compulsory manner, and 2) police powers, the authority to limit personal rights including property rights.
24
4. HOUSING VALUE CHAIN MARKET MAPS
4.1 Acquisition and Tenure of Land
4.1.1 Community Land Trusts Acquisition and Tenure
Buyer Seller
Family Members
Land Agents/Local Borkers
Advocate or Lawyer
Land Company
Enabling Environment
Main Actors
Business Support Services
EldersProvincial
AdmnistrationLocal county Councils District Land
CommiteesNational Land Policy
Housing Cooperatives/SACCOs‐NACHU
‐Nakuru Teachers Housing Cooperative
Community Based Land Companies
Land com
panies a
nd SACC
Os offer
subdivide
d land fo
r sale
Price negotiations done by Buyer, Seller and buyer sign agreement
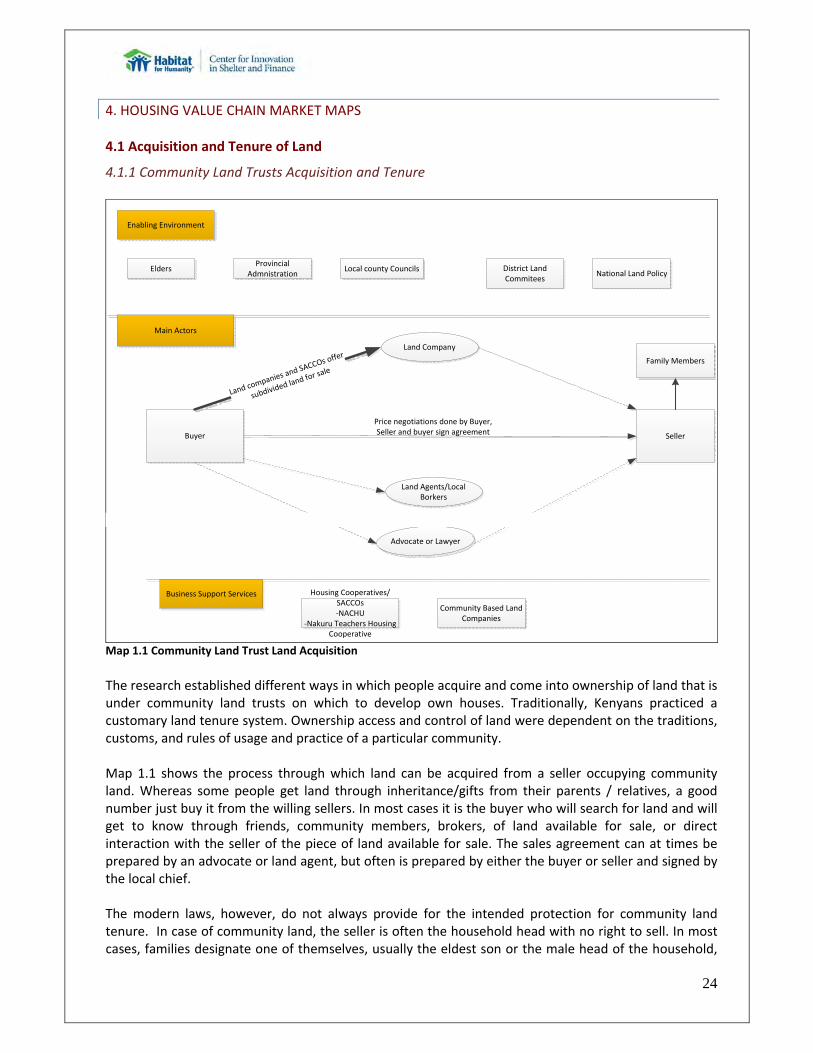
Map 1.1 Community Land Trust Land Acquisition The research established different ways in which people acquire and come into ownership of land that is under community land trusts on which to develop own houses. Traditionally, Kenyans practiced a customary land tenure system. Ownership access and control of land were dependent on the traditions, customs, and rules of usage and practice of a particular community. Map 1.1 shows the process through which land can be acquired from a seller occupying community land. Whereas some people get land through inheritance/gifts from their parents / relatives, a good number just buy it from the willing sellers. In most cases it is the buyer who will search for land and will get to know through friends, community members, brokers, of land available for sale, or direct interaction with the seller of the piece of land available for sale. The sales agreement can at times be prepared by an advocate or land agent, but often is prepared by either the buyer or seller and signed by the local chief. The modern laws, however, do not always provide for the intended protection for community land tenure. In case of community land, the seller is often the household head with no right to sell. In most cases, families designate one of themselves, usually the eldest son or the male head of the household,
25
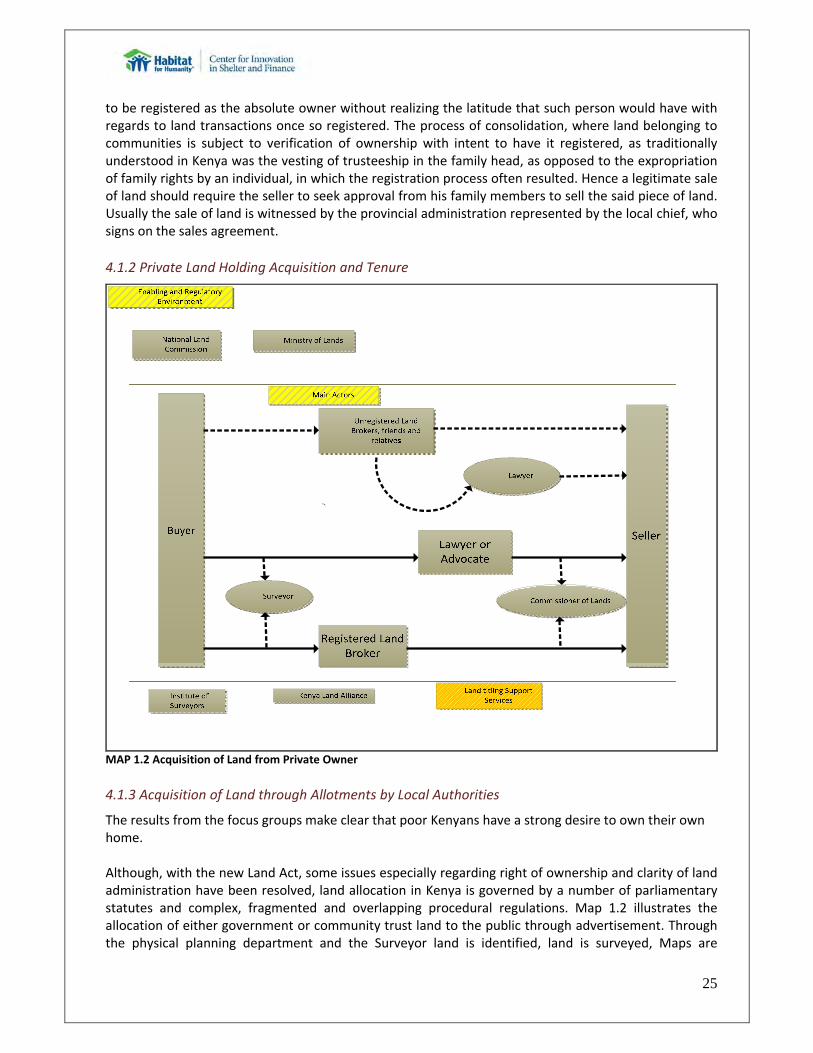
to be registered as the absolute owner without realizing the latitude that such person would have with regards to land transactions once so registered. The process of consolidation, where land belonging to communities is subject to verification of ownership with intent to have it registered, as traditionally understood in Kenya was the vesting of trusteeship in the family head, as opposed to the expropriation of family rights by an individual, in which the registration process often resulted. Hence a legitimate sale of land should require the seller to seek approval from his family members to sell the said piece of land. Usually the sale of land is witnessed by the provincial administration represented by the local chief, who signs on the sales agreement. 4.1.2 Private Land Holding Acquisition and Tenure
MAP 1.2 Acquisition of Land from Private Owner
4.1.3 Acquisition of Land through Allotments by Local Authorities
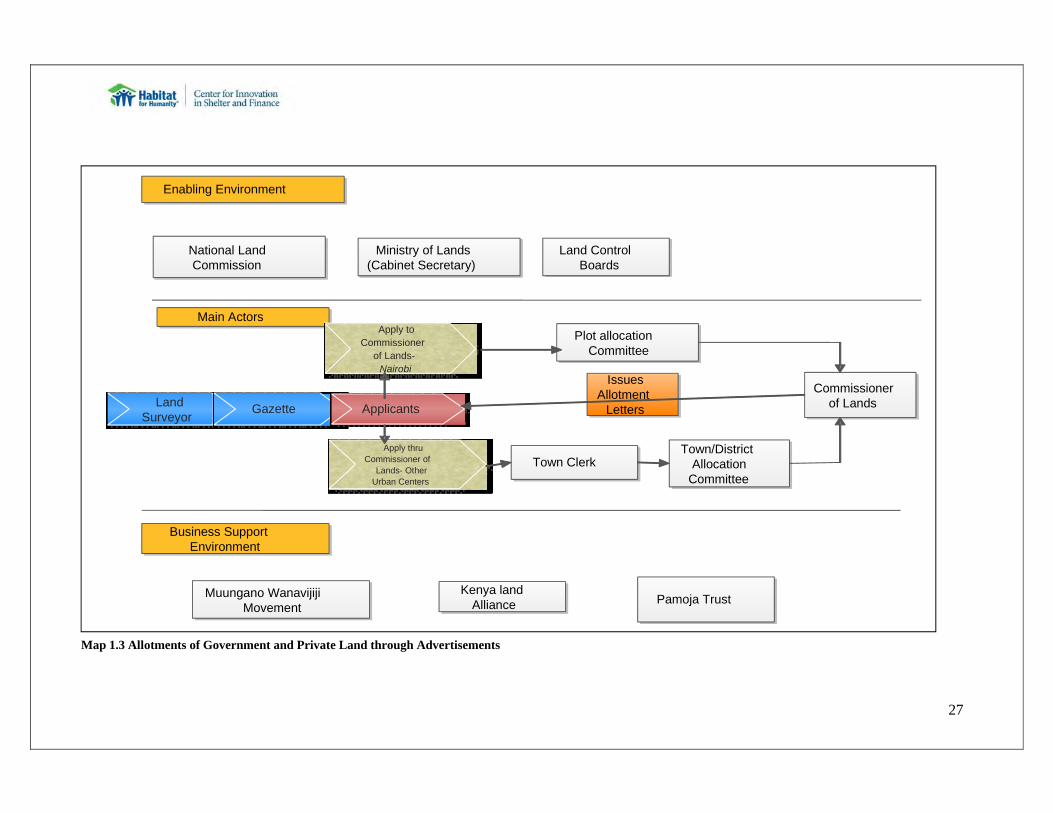
The results from the focus groups make clear that poor Kenyans have a strong desire to own their own home. Although, with the new Land Act, some issues especially regarding right of ownership and clarity of land administration have been resolved, land allocation in Kenya is governed by a number of parliamentary statutes and complex, fragmented and overlapping procedural regulations. Map 1.2 illustrates the allocation of either government or community trust land to the public through advertisement. Through the physical planning department and the Surveyor land is identified, land is surveyed, Maps are
26
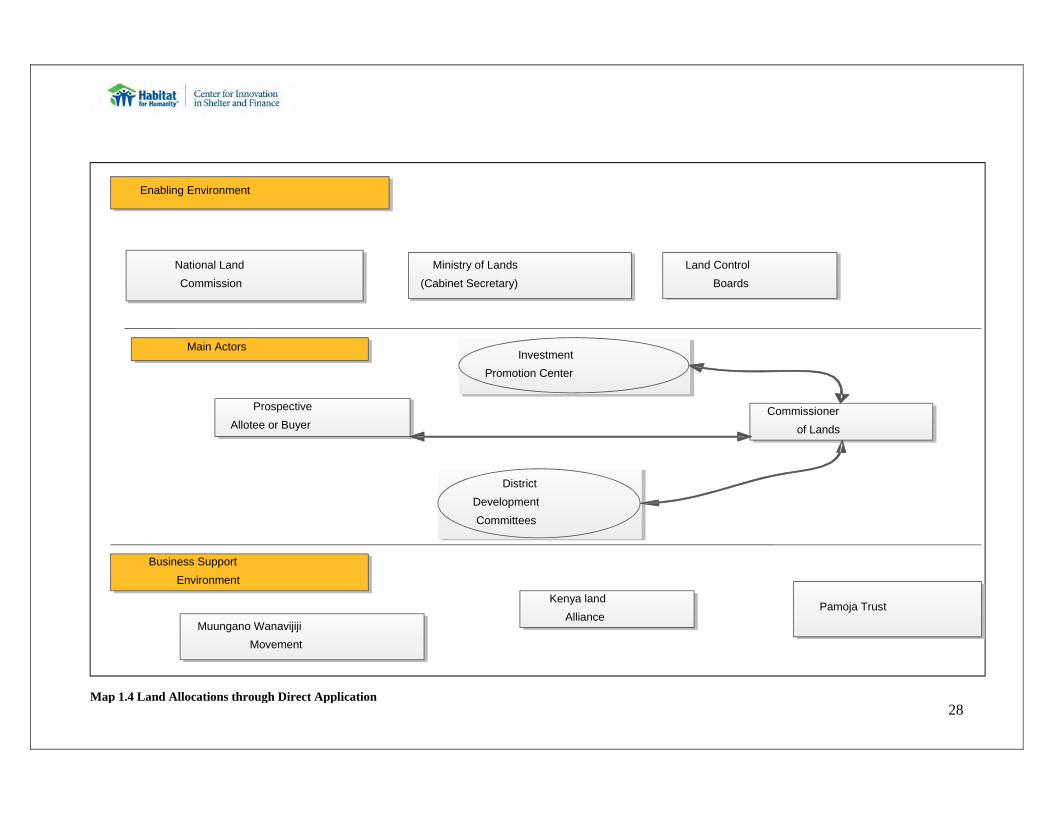
prepared, allotted plot numbers are done, and valuation is finalized. Through a Kenyan Gazette such lands are advertised by the Commissioner of Lands. In Nairobi only, applicants apply to the Commissioner of Lands, while in other urban centers applications are done through the district commissioner. In case of Nairobi, the Commissioner of Lands receives records and registers applications, while in other urban centers this is done by the town clerk. This followed by sorting out applications, conducted by the Commissioner of Lands Plot Allocation Committee for Nairobi, while in other centers it is done by town/district Allocation Committee. Ultimately it is the Commissioner of Lands who receives applicants that qualify, notifies successful applicants and sends allotment letters. Map 1.4 depicts the allocation of land through direct application by interested parties to the Commissioner of Lands, applicable for all types of land tenure. Here an applicant applies to Commissioner of Lands. Applications are then forwarded to District Development Committees, or Investment Promotion Centers, which make their recommendations to the Commissioner of Lands. The Commissioner of Lands, with the advice of the Special Allocations Committee, notifies successful applicants. The land is valued and allotment is made.
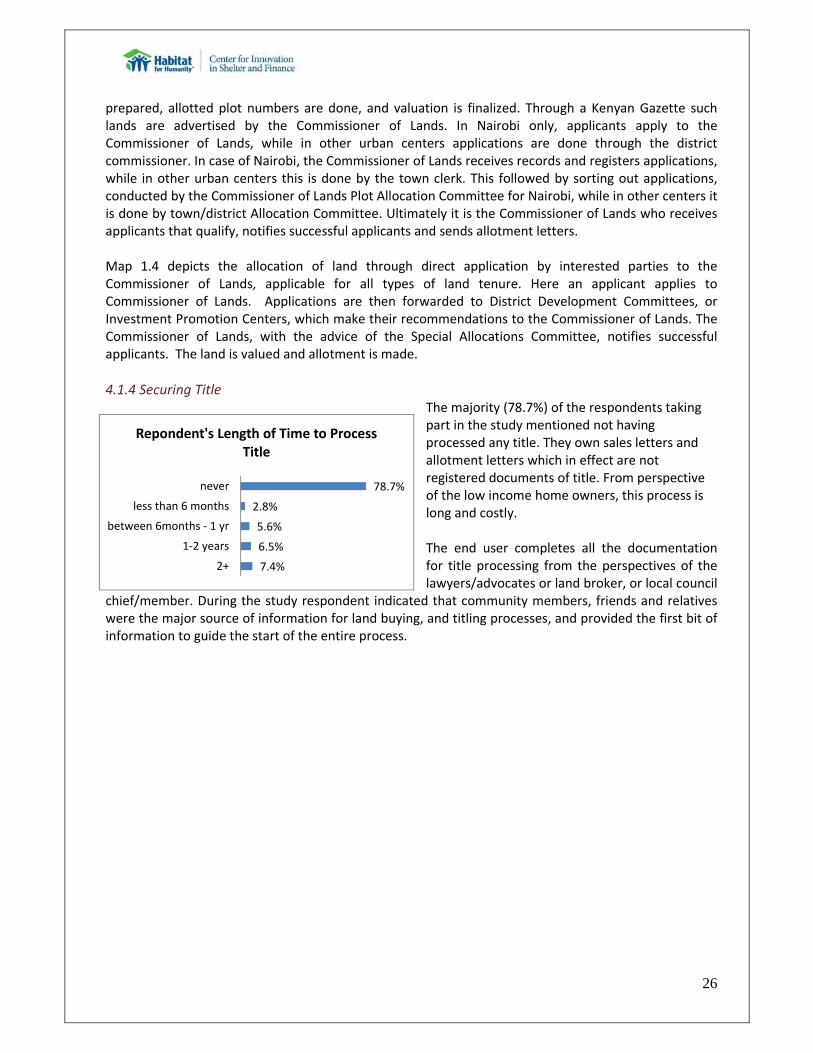
4.1.4 Securing Title The majority (78.7%) of the respondents taking part in the study mentioned not having processed any title. They own sales letters and allotment letters which in effect are not registered documents of title. From perspective of the low income home owners, this process is long and costly. The end user completes all the documentation for title processing from the perspectives of the lawyers/advocates or land broker, or local council
chief/member. During the study respondent indicated that community members, friends and relatives were the major source of information for land buying, and titling processes, and provided the first bit of information to guide the start of the entire process.
7.4%
6.5%
5.6%
2.8%
78.7%
2+
1‐2 years
between 6months ‐ 1 yr
less than 6 months
never
Repondent's Length of Time to Process Title
27
National Land Commission
Ministry of Lands (Cabinet Secretary)
Kenya land Alliance
Enabling Environment
Main Actors
Business Support Environment
Pamoja TrustMuungano Wanavijiji Movement
Land Control Boards
Land Surveyor Gazette Applicants
Apply to Commissioner
of Lands- Nairobi
Apply thru Commissioner of
Lands- Other Urban Centers
Plot allocation Committee
Town ClerkTown/District
Allocation Committee
Commissioner of Lands
Issues Allotment
Letters
Map 1.3 Allotments of Government and Private Land through Advertisements
28
Prospective Allotee or Buyer
Commissioner
of Lands
District
Development
Committees
National Land Commission
Ministry of Lands
(Cabinet Secretary)
Kenya land Alliance
Enabling Environment
Main Actors
Business Support Environment
Investment
Promotion Center
Pamoja Trust
Muungano Wanavijiji Movement
Land Control
Boards
Map 1.4 Land Allocations through Direct Application
29
4.1.5 SWOT Analysis of Acquisition and Tenure
Tribal and cultural issues regarding land as a constraint of access land availability: The spirit behind the laws of the land regarding land ownership and management are more oriented towards registering all land in Kenya, whether communal or otherwise keeping in mind that pastoral communities are clearly regulated and confined to their current areas. Further to the genesis of state control and allocation of land by the state in Kenya led to land grabbing, a situation in which indigenous people became squatters on their own land when the issuance of titles was legally allocated to selected people. This further resulted in displacement of ancestral communities from their native lands25. The chronology of such grievances is the very reason why land issues in Kenya are ethnically emotive. Hence, given the strong tribal and rural roots of most Kenyans, residents in informal settlements may not acquire land in urban areas because of their strong connection to and/or ownership of land in rural areas. Land acquisition constraints: Poor households’ desire to acquire land is frustrated by the lack of available land, high land costs, and/or a cumbersome and expensive process to acquire land (whether by squatting or purchase. Land shortage is largely experienced in urban centers and former British settlement where tracts of land are now privately owned by individuals with commercial ranches. Challenges in purchasing a plot: For land purchase to be viable for poor households, the physical space needs to be available in plots of a reasonable size at an affordable price, and in a location that allows them to continue to earn their livelihood. According to a United Nations (UN) report, 80 percent of residential land in Nairobi is occupied by only 20 per cent of the population, 20 indicating that there is limited land available for the poor majority. To purchase and subdivide a plot of land within the Nairobi city limits, the purchaser has to 1) pay for the land plus all of the associated fees including stamp duties and legal fees, 2) pay for the land to be surveyed, marked, and appraised by government agents, and 3) have a development plan approved by the municipal council. If the land is un‐serviced, the owner also has to install all services to comply with local physical planning guidelines and get approval from various government agencies and offices because the government is not able to cover the cost of installing services. Challenges with land grants: One way to overcome the land availability and cost issues would be for the government to grant plots of land to poor households. In the 1970s, the GOK, with World Bank support26, implemented several schemes that were to provide subsidized, serviced land to poor households. (See box below.) However, most of these schemes were plagued with implementation difficulties, cost overruns, and corruption. In many cases the land went to wealthier families and not the intended beneficiaries.
The One Million Acre Settlement Scheme and Re‐Africanisation programme27 In 1962, the One Million Acre Scheme was designed to accommodate masses of landless families. The main features of the scheme included purchase of one million acres of land, bought in large blocks located in the periphery of the reserves. About 80,000 hectares were to be bought each year over a period of five years. This was the expected provide a market for European settlers who wanted to sell their land. In order to attract the settlers to the scheme, the administration attempted to offer generous and attractive terms. This scheme was funded by the World Bank, together with the British and West German governments.
25 Putting Land Grievances Behind us in Kenya, Sychar Center, 2011. 26 Non-Conventional Approaches to Financing Low-Cost Housing Schemes in Kenya (1988) 27 The Sychar Centre, Putting Land Grievances Behind us in Kenya, CGIAR, Kenya 2011
30
The Urban I and II Projects28 The projects, approved in 1975 and 1978 respectively, took an integrated approach to improving living conditions in three eastern sites in Nairobi. The projects sought to increase the supply of affordable housing to the poor, expand the sewerage system to project sites, and improve social services. A major objective was the promotion of homeownership among transient groups to reduce the proliferation of informal settlements, which the government continually destroyed. The projects followed an incremental self‐help model to promote homeownership. The projects sought first to provide enough serviced small lots to meet rapid growth in demand, thus tempering land‐price increases. The projects would then make loans available for housing construction and renovation. Finally, with beneficiaries paying utility tariffs and municipal fees and making loan repayments, the city government would have the funds needed to operate and maintain infrastructure. Urban I was to be the precursor to other sites and services projects in Kenya, serving as a model for government programs to provide urban shelter and infrastructure to low‐income groups. The projects were complex, both in scope and design, requiring the involvement of different municipal departments with strong management and planning capacities. But unlike the water operations, the urban projects provided little if any technical assistance to strengthen the relevant city departments, even though the projects included technical assistance components. Institutional weakness thus continued, adversely affecting the proper implementation of project components. Moreover, the two projects closely overlapped, leaving little time for implementation experience to pass from one to the other. Umoja Estate:29 In the 1970’s, the Nairobi City Council built Umoja Estate in order to accommodate the growing urban population brought by industrialization. The homes were targeted at low‐income residents and therefore needed to be significantly less expensive than the existing options on the market. In order to cut costs, they developed an innovative design. The Umoja units were clustered in groups of five or six homes, and the utilities (toilet, shower, and sink) were built in a block outside each cluster. Each family had its own, lockable utilities, but placing them together instead of inside individual units dramatically cut unit costs. By not outfitting each home with its own plumbing system, they saved on materials, space, and time. Unfortunately, a clever design does not ensure success, and Umoja’s challenges arose when maintenance and quality control were overlooked. Over time, the Council became budget constrained and thus allowed people to construct or expand their own units, leaving no oversight of the quality of construction. The shared infrastructure was not maintained, and as the years went by the sewage system fell into shambles, taps frequently ran dry, and there was insufficient disposal of solid waste. If the right mechanisms had been put in place for long term maintenance and quality, Umoja could have been a unique success.
Challenges with squatting: In most developing countries, poor households’ final recourse for acquiring land is squatting. Where land is available and government enforcement is lax (and there is a reasonable prospect that the government will recognize the right of possession), squatting often is an effective means for poor households to acquire land. In Kenya, however, even squatting is a challenge. Most unoccupied land in urban areas is either the property of the Government of Kenya or managed in trust for the national government. By law, only the Commissioner of Lands can allocate public land use.
28 The Independent Evaluation Group, The World Bank Group, Improving Urban Services in Nairobi, http://lnweb90.worldbank.org/oed/oeddoclib.nsf/ , The World Bank Group 2012 29 Aden Van Noppen, The ABC’s of Affordable Housing in Kenya, the Acumen Fund, 2012
31
However, in many cases, the local chiefs, who act as representatives of the Commissioner of Lands, illegally allocate land‐usage rights. In exchange for these “rights,” the chiefs receive bribes or favors. Thus, would‐be squatters must pay for the right to squat and even then, these rights are available only to those who have political connections to the chief. Given the substantial income generated by these “usage fees”, the chiefs have a strong incentive to continue this practice and limit squatting to those who can pay. For poor Kenyans seeking to acquire a basic plot of land in urban areas, the prospects are limited. As detailed above, this is a result of three forces: the high cost of available land, the delays and costs of sub‐dividing land, and strong informal controls on squatting. These factors combine to limit the potential demand for HMF. If the growing number of poor households moving to the cities each year are unable to acquire land—even through squatting—access to progressive‐build HMF will be of little use. Even if these households are able to access financing, high land prices and the high cost of installing basic services make most potential plots unaffordable. Land Security
A key issue underlying HMF is land security – the degree of confidence one has in their rights of ownership over a piece of property and their ability to enforce those rights. Households that have land security are more likely to take on debt to improve the value of their property. Land security also affects the supply of credit. Credit institutions need to be confident that a borrower has formal, recognized rights to a property and will not be evicted, abandon the property or default on the loan.
Two factors tend to influence a landowner’s level of land security, the legal rights the household has over the land, and how these rights are commonly enforced. In Kenya, as in other developing countries, land security is determined by the legal documentation that a land‐owner possesses. There are multiple levels of documentation, each providing differing levels of land security. The least secure is a sales agreement and the most secure is a freehold title, followed by a leasehold title. However, the level of security provided by these different rights varies from city to city and on rural/urban lines. In rural areas, where there have been fewer evictions and demolitions, lower levels of documentation seem to provide sufficient security. In these areas, sales agreements are an acceptable form of land security. In urban areas however, residents with stronger forms of legal documentation, such as letters of allotment, are still reluctant to invest in their properties due to real fears of demolition or eviction.
Strength of the cooperative movement in Kenya: Distributed throughout Kenya, SACCOs enable members to pool resources to purchase land and then sub‐divide or sub‐lease (depending on the type of land tenure).
New innovations in financing housing construction: As MFIs start to base new products on the SACCO model and new initiatives such as the Affordable Housing Bond by the Karibu Homes Project indicate opportunities to work with institutions which are trying to tackle the challenges of low income housing through financing
4.2 Provision of Basic Infrastructure at Community Level This stage looks at the process of constructing pit latrines, constructing access roads, obtaining access to water and sanitation, and gaining access to energy. Considering the scope of the study, and the importance placed on water and sanitation, solid waste management and gaining access to electricity, this report presents two market maps for this section. The first is the water market map, and the second the household electricity market map. The key questions examined in the maps are: How do a) water (unprotected or piped water) and b) power reach the acquired land of low‐income households?
32
4.2.1 Mapping Provision of Electricity Globally, Kenya ranks 166 out of 189 economies on the ease of getting electricity. According to the World Bank’s Doing Business report, getting electricity there requires six procedures, takes 158 days and costs 1090.7% of average income per capita. Kenya is classified as energy poor country with a majority of households especially in rural areas struggle to meet their energy expenses. Less than 25% of Kenya’s population has access to modern energy forms. The population’s access to grid electricity is 15% and only 4% of rural population has access. Due to low penetration of modern energy forms, a majority of households (68%) depends on traditional biomass for heating and cooking with kerosene and candles providing lighting.
Governance The Ministry of Energy and Petroleum is responsible for policy formulation, while regulation of the sector is left to Electricity Regulation Commission. Through the Energy Act, the Kenyan government established the Rural Electrification Authority (REA) to focus specifically on the rural areas. The REA plans and builds rural electrification projects through labor and transport contractors or turnkey contracts. For projects that are connected to the grid, the REA retains ownership of the assets while Kenya Power Company (KPC) undertakes the operation and maintenance.
Generation Kenya Electricity Generation Company (KenGen) is the leading electricity generation company producing 75% of Kenya’s power. There are other four independent power producers (IPPs) which generate electricity through thermal oil, and one IPP generating geothermal energy. The rural areas are reached by private sector providers of renewable energy, regulated and supported by the Rural Electrification Authority Agency to some extent.
Transmission and Distribution Prior to the establishment of Kenya Electricity Transmission Company (KETRACO) in 2008, KPC enjoyed the monopoly of both transmission and distribution. KPC is partially owned by government with a stake of 40.430 and thus considered a parastatal or state‐owned enterprise, subject to the requirements of the State Corporations Act of 1987 (as revised in 2009.) In 2010, the government announced its intention to increase its stake in KPC to 51 per cent through a restructuring of the firm’s share capital. KPC’s ownership structure (private and state) presents a potential barrier to raising public and donor funds for the expansion of the transmission grid. KETRACO is a relatively recent entrant to the transmission portion of the industry. Wholly state‐owned, it was established to undertake all new transmission projects. While KETRACO’s mandate is to design, construct, operate and maintain new high‐voltage electricity‐transmission lines, at the time of the present study, it was unclear whether it would also take over KPC’s system operations and planning functions. Either way, KETRACO’s roles and responsibilities need to be clearly demarcated from those of KPC.
30 KPC, 2009
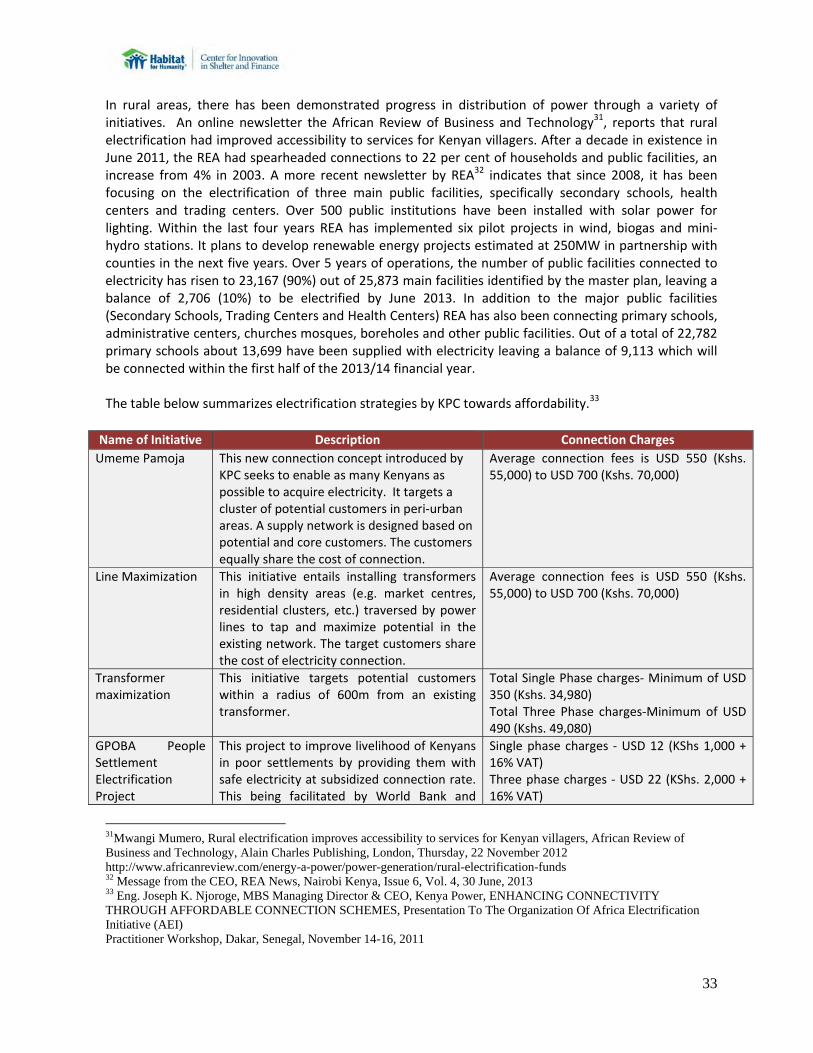
33
In rural areas, there has been demonstrated progress in distribution of power through a variety of initiatives. An online newsletter the African Review of Business and Technology31, reports that rural electrification had improved accessibility to services for Kenyan villagers. After a decade in existence in June 2011, the REA had spearheaded connections to 22 per cent of households and public facilities, an increase from 4% in 2003. A more recent newsletter by REA32 indicates that since 2008, it has been focusing on the electrification of three main public facilities, specifically secondary schools, health centers and trading centers. Over 500 public institutions have been installed with solar power for lighting. Within the last four years REA has implemented six pilot projects in wind, biogas and mini‐hydro stations. It plans to develop renewable energy projects estimated at 250MW in partnership with counties in the next five years. Over 5 years of operations, the number of public facilities connected to electricity has risen to 23,167 (90%) out of 25,873 main facilities identified by the master plan, leaving a balance of 2,706 (10%) to be electrified by June 2013. In addition to the major public facilities (Secondary Schools, Trading Centers and Health Centers) REA has also been connecting primary schools, administrative centers, churches mosques, boreholes and other public facilities. Out of a total of 22,782 primary schools about 13,699 have been supplied with electricity leaving a balance of 9,113 which will be connected within the first half of the 2013/14 financial year. The table below summarizes electrification strategies by KPC towards affordability.33
Name of Initiative Description Connection Charges
Umeme Pamoja This new connection concept introduced by KPC seeks to enable as many Kenyans as possible to acquire electricity. It targets a cluster of potential customers in peri‐urban areas. A supply network is designed based on potential and core customers. The customers equally share the cost of connection.
Average connection fees is USD 550 (Kshs. 55,000) to USD 700 (Kshs. 70,000)
Line Maximization This initiative entails installing transformers in high density areas (e.g. market centres, residential clusters, etc.) traversed by power lines to tap and maximize potential in the existing network. The target customers share the cost of electricity connection.
Average connection fees is USD 550 (Kshs. 55,000) to USD 700 (Kshs. 70,000)
Transformer maximization
This initiative targets potential customers within a radius of 600m from an existing transformer.
Total Single Phase charges‐ Minimum of USD 350 (Kshs. 34,980) Total Three Phase charges‐Minimum of USD 490 (Kshs. 49,080)
GPOBA People Settlement Electrification Project
This project to improve livelihood of Kenyans in poor settlements by providing them with safe electricity at subsidized connection rate. This being facilitated by World Bank and
Single phase charges ‐ USD 12 (KShs 1,000 + 16% VAT) Three phase charges ‐ USD 22 (KShs. 2,000 + 16% VAT)
31Mwangi Mumero, Rural electrification improves accessibility to services for Kenyan villagers, African Review of Business and Technology, Alain Charles Publishing, London, Thursday, 22 November 2012 http://www.africanreview.com/energy-a-power/power-generation/rural-electrification-funds 32 Message from the CEO, REA News, Nairobi Kenya, Issue 6, Vol. 4, 30 June, 2013 33 Eng. Joseph K. Njoroge, MBS Managing Director & CEO, Kenya Power, ENHANCING CONNECTIVITY THROUGH AFFORDABLE CONNECTION SCHEMES, Presentation To The Organization Of Africa Electrification Initiative (AEI) Practitioner Workshop, Dakar, Senegal, November 14-16, 2011
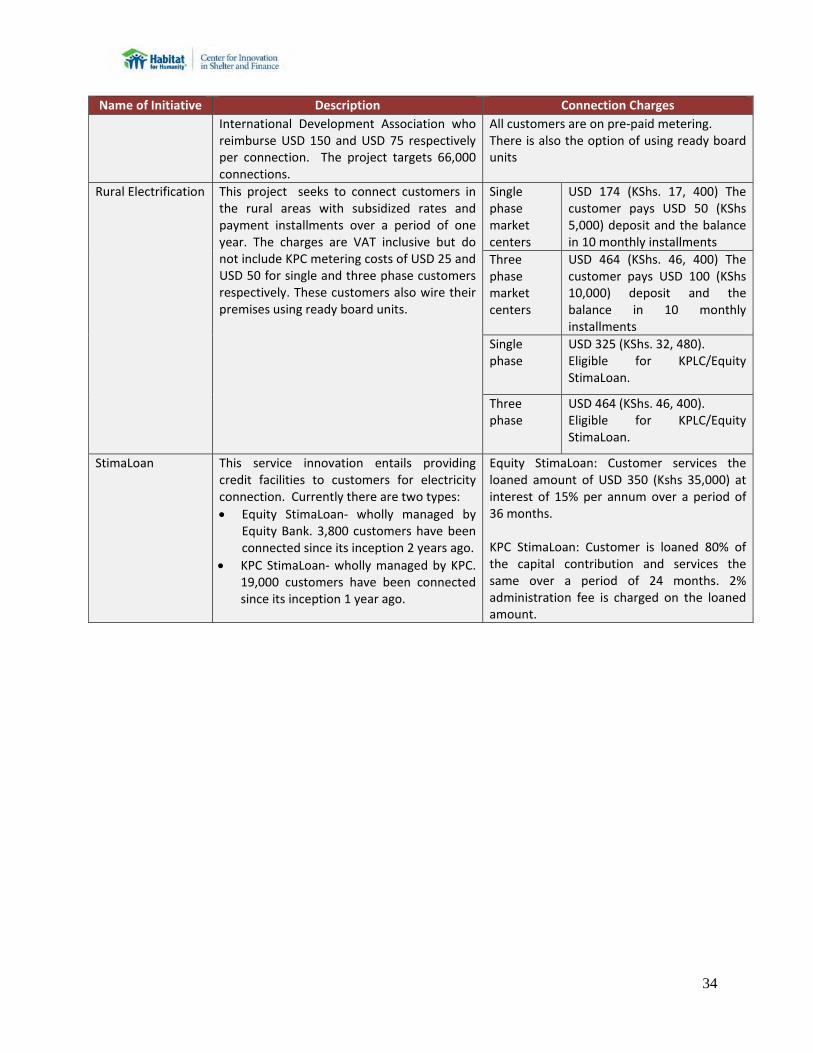
34
Name of Initiative Description Connection Charges
International Development Association who reimburse USD 150 and USD 75 respectively per connection. The project targets 66,000 connections.
All customers are on pre‐paid metering. There is also the option of using ready board units
Rural Electrification This project seeks to connect customers in the rural areas with subsidized rates and payment installments over a period of one year. The charges are VAT inclusive but do not include KPC metering costs of USD 25 and USD 50 for single and three phase customers respectively. These customers also wire their premises using ready board units.
Single phase market centers
USD 174 (KShs. 17, 400) The customer pays USD 50 (KShs 5,000) deposit and the balance in 10 monthly installments
Three phase market centers
USD 464 (KShs. 46, 400) The customer pays USD 100 (KShs 10,000) deposit and the balance in 10 monthly installments
Single phase
USD 325 (KShs. 32, 480).Eligible for KPLC/Equity StimaLoan.
Three phase
USD 464 (KShs. 46, 400).Eligible for KPLC/Equity StimaLoan.
StimaLoan This service innovation entails providing credit facilities to customers for electricity connection. Currently there are two types:
Equity StimaLoan‐ wholly managed by Equity Bank. 3,800 customers have been connected since its inception 2 years ago.
KPC StimaLoan‐ wholly managed by KPC. 19,000 customers have been connected since its inception 1 year ago.
Equity StimaLoan: Customer services the loaned amount of USD 350 (Kshs 35,000) at interest of 15% per annum over a period of 36 months. KPC StimaLoan: Customer is loaned 80% of the capital contribution and services the same over a period of 24 months. 2% administration fee is charged on the loaned amount.
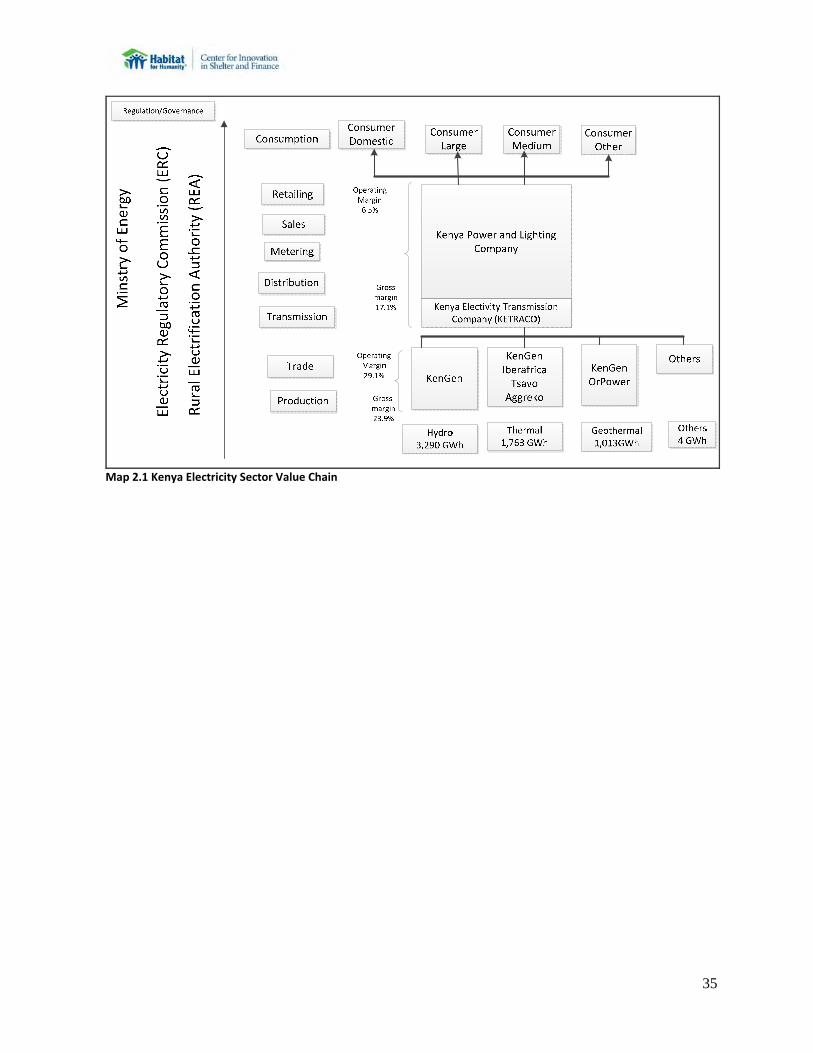
35
Map 2.1 Kenya Electricity Sector Value Chain
36
4.2.2 SWOT in Electricity The gaps in the sector can be analyzed on the basis of energy sources regarding generation capacity and off grid‐parallel systems and household accessibility. Opportunities
Potential for new actors: Electricity Transmission is hitherto, a monopoly of KPC, however there are plans to un‐bundle transmission and distribution, thus providing opportunities for generation companies to supply directly to end users, thereby reducing system losses
Licensing of new generation companies: The extension of licences to various private electricity‐generation companies has been key to expanding the role played by IPPs in Kenya, so the efficiency of this process is crucial to the industry as a whole. In Kenya, efficiency is facilitated by the fact that responsibilities of the different players are clear, and clear timeframes are attached to each stage. Data for 2010 indicates that the ERC had licensed 13 electricity‐generation companies34.
Urbanization: the increase in the proportion of people living in towns and cities is usually brought about by movement of people from the rural to the urban areas, in search of jobs and this usually leads to changes in both production and consumption structures which alter energy usage patterns. Kenya’s urban population is no exception. It is projected that the urban population by 2040 in Kenya will be 45.7%, up from the current level of 23.6%. This is potential for utilization of household electrical connections.
Donor interventions: The World Bank, acting as administrator for the Global Partnership on Output‐Based Aid (GPOBA), has approved a grant of US$5.24 million to increase access to electricity for low‐income households in Kenya. The project will subsidize connections to the electricity grid for around 66,000 households (roughly 265,000 people) in Kenya’s largest slum, Kibera (Nairobi), and informal settlements in the Western, Central, and Coast Provinces. The scheme will be implemented by
KPC.35
Building on success of rural electrification. While much of rural Kenya remains unserved by the electrical grid, REA has been successful in using a variety of initiatives, from creating clusters for connectivity payment, to linkages into nearby lines and transformers, to renewable energies such as solar power. Lessons from these initiatives could be studied and adapted for urban centers.
Constraints
Unequal access to electricity: Provision of electricity is largely confined to high and middle income groups in urban areas, as well as the formal commercial and industrial sectors. The poor, who are the majority and live mostly in rural areas, have limited access to electricity. Household electrification is very low (less than 5% in rural and 51% in urban areas). The national electrification levels in Kenya is alarmingly low and only about 13% of the total population have access36
Continued production of charcoal: In spite of charcoal production being outlawed, it has a very distinct and elaborate distribution network, which ranges from the burning fields to the transporters, to wholesalers, to distributors to the numerous small scale vendors who finally sell it to end users in the households and 82% of the total households in the urban areas use it
34 Ministry of Energy, Kenya (2010) Least-Cost Power-Development Plan Nairobi: Government of Kenya 35 GPOBA, News Release, 2011/02/GPOBA 36 World Bank, 2006, World Bank, 2007
37
Losses in power transmission and distribution: KPC reports transmission and distribution losses of 18 percent, compared to a best practice of 10 percent, and captures only 85 percent of potential revenues37 These losses are an indication of poor maintenance and rehabilitation of the network.
Dependence on imports: Like in other East African countries, dependence of foreign inputs as most materials used in the utility sector are imported. The prices in this sector are not galvanized from external shocks, like currency fluctuations, changes in prices in other countries, and changes in policies of other countries.
4.2.3 Mapping Provision of Water and Sanitation in Kenya Water supply and sanitation in Kenya is characterized by low levels of access, in particular in urban slums and in rural areas, as well as poor service quality in the form of intermittent water supply. Only nine out of 55 water service providers in Kenya provide continuous water supply. Seasonal and regional water scarcity exacerbates the difficulty to improve water supply. Among Kenya’s poorest, 99% live without a flush toilet, 80% share a living space with two or more people, and 64% do not have access to
an improved source of water. Between 1989 and 2009, the share of households without any type of infrastructure that enables access to water fell from 50 percent to 38 percent. These gains were distributed across most geographic regions, with the exception of two counties: Kitui and Wajir where water‐related hardship increased. The share of households without any waste infrastructure declined from 21% in 1989 to 13.8 % in 200938. According to the Joint Monitoring Programme’s 2012 Report39, access to improved sanitation throughout Kenya is 32%. Sanitation reforms are at an earlier stage than the water and sewerage reforms, but there are still important changes taking place in the policy arena. In this context, sanitation encompasses on‐site sanitation (i.e. pit latrines, septic tanks) and solid waste management. Governance Like other sectors, the Water and Sanitation Sector in Kenya has experienced a series of reforms. The Water Act No. 8 of 2002 is the policy instrument through which the Water Sector is governed. Previously service provision had been the responsibility of a single National Water Conservation and Pipeline Corporation as well as of a few local utilities established since 1996. After the passage of the act, service provision was gradually decentralized to 117 Water Service Providers (WSPs). These are linked to 8 regional Water Services Boards (WSBs) in charge of asset management through Service Provision Agreements (SPAs). The act also created a national Water Services Regulatory Board (WASREB) that carries out performance benchmarking and is in charge of approving SPAs and tariff adjustments. The Ministry of Environment, Water and Natural Resources (MEWNR) is in charge of policies for water supply and the Ministry of Public Health and Sanitation oversees policies related to sanitation. Water supply is overseen by the Department for Water Services, whose functions include formulation of policy and strategies for water and sewerage services, sector co‐ordination and monitoring of other water services institutions. MEWNR is also responsible for overall sector investments, planning and resource mobilization. To harmonize the institutional framework for sanitation, MEWNR and the Ministry of
37 Kenya Public Expenditure Review, 2010 38 Kenya Economic Update June 2013, World Bank Report , East Africa 2013. 39 Progress on Drinking Water and Sanitation: 2012 Update, WHO/UNICEF Joint Monitoring Programme for Water Supply and Sanitation. United States of America, 2012
38
Public Health and Sanitation (MoPHS) have developed a common Water Supply and Sanitation Concept with clearly defined sanitation targets. At city level, the Ministry of Local Government, through the elected City Council, oversees public sanitation and on‐site sanitation in urban centres. The Council’s Office of Environment is responsible for the management of solid waste. The Council’s Planning Department is responsible for executing decisions reached by Council resolution in relation to land allocation for public services such as public amenities, landfills and the like. Finally, the Municipal Medical Officer of Health advises the municipality on preventive and curative measures to disease incidence and supervises public health officers, seconded by the Ministry of Health to the local municipalities. Household sanitation is an individual responsibility, although public health officers are responsible for overseeing adherence to standards with wider public health implications.
Regulation The regulation and monitoring of urban and rural water service provision is carried out by the WASREB, a non‐commercial state corporation established in March 2003 on the basis of the 2002 Water Act. Its functions comprise issuing of licenses to water services boards and approval of Service Provision Agreements, developing tariff guidelines and carrying out tariff negotiations, setting standards and developing guidelines for service provision, publishing the results of sector monitoring in the form of comparative reports. Environmental regulation in Kenya is carried out by the National Environment Management Authority (NEMA). NEMA was established under the Environmental Management and Coordination Act Nr. 8 of 1999 and became operational in July 2002. NEMA formulates water quality regulations.
Asset Management Responsibility for water and sanitation service provision has been devolved to eight WSBs: Athi (which serves the capital Nairobi), Coast, Tana, Lake Victoria North, Lake Victoria South, Northern, Rift Valley Water Services Board, and since 2008, Tanathi Water Services Board. Water Services Boards are responsible for asset management that is, for the development and rehabilitation of water and sewerage facilities, for investment planning and implementation.
Service provision Responsibility for water and sanitation service provision is in the hands of Water Services Boards. However, they are not required to provide services directly – they can delegate them to commercially oriented public enterprises, the so‐called Water Service Providers (WSPs). Service provision is regulated by SPAs to ensure compliance with the standards on quality, service levels and performance established by WASREB. There are four types of SPAs:
Category I for medium to large WSPs operative in urban areas – WSPs in this category are limited liability companies owned by one or more local authorities. They provide both water and sewerage services.
Category II for community projects in rural areas – these are community water supplies which are managed by WSPs registered as Water User Associations (WUAs) by the Registrar of Societies.
Category III for private sector providers – there is one SPA in this category (Runda Estate).
Category IV for bulk water supply – this is the responsibility of the National Water Conservation and Pipeline Corporation.
39
Many low income settlements in slums and rural areas depend on water provided by informal small service providers and shallow wells. Informal small service providers (SSPs) provide water in both rural and urban low income settlements. Some of them sell water from tanker trucks or through jerry cans, often at prices that are five to ten times that of piped water supply. Others are self‐help groups, often run by women, who provide piped water supply. The Water Services Trust Fund is making efforts to formalize service provision in low‐income settlements. It has developed two national concepts for service provision for the poor. The first one is the Community Project Cycle, which makes funds available for local communities that are willing to comply with minimum service standards. The second one, the "Urban Poor Concept" has been implemented in low income urban areas since 2007 and has led to the construction of numerous water kiosks that meet sustainability standards. An example of a partnership between a utility and self‐help groups can be found in Nyalenda, a poor neighborhood with about 60,000 inhabitants in Kisumu. The local utility sells water in bulk to self‐help groups that in turn manage networks and water kiosks inside their neighborhoods. Water and Sanitation Management Model
Nyalenda is the largest informal settlement in Kisumu with the population of about 50,000 inhabitants. Prior to any intervention, water supply in Nyalenda was provided primarily by vendors, with few individual customers connected to a single line running along the main road which separates Nyalenda and Milimani neighbourhoods.
In 2004 Kisumu Water and Sewerage Company (KIWASCO), The Water and Sanitation Program Africa (WSP‐AF) and the French Development Agency (AFD) introduced a delegated management model in Nyalenda in partnership with small‐scale providers who are formed within the community. The small scale providers formed under the delegated management model were known as “master operators” based on the fact that the management tasks of the small‐scale providers starts from the master meters.
KIWASCO sells bulk water to agents contracted to operate and manage part of the network in an informal settlement. KIWASCO selects and recruits these master operators through a publicly‐advertised and competitive process. The master operators (in the capacity of private entrepreneurs or CBOs), enter into a contract with the utility to bill customers, revenue and perform minor maintenance in a given area.
The financial arrangement is such that the master operators pay KIWASCO for bulk water delivered to them at an approximate cost of US$ 0.31 per m3. The charge to the master operators is based on master meters. Once the bulk rate for water has been paid to KIWASCO, the master operators can retain any surplus they make on the sale of water to their customers (household connections and kiosk operators). The master operators sell the water to connected customers (at about US$ 0.44 per m3). Kiosk operators pay approximately US$ 0.48 per m3. The kiosk operators in turn sell water from the kiosks to unconnected consumers at US$ 1.25 per m3.
Source: Anthony Sangaa and Klaas Schwartza, Partnerships between Utilities and Small‐scale Providers: Delegated Management in Kisumu, Kenya, IHE Institute for Water Education, Delft, the Netherlands, 2010
Private Sector Participation The private sector plays a limited, but not negligible role in operating water supply systems in Kenya. Since 1975 Runda Water Limited provides piped water to the Executive Residential Housing Estate of Old Runda in Nairobi. In 2008, Runda signed a service provision agreement with the Athi WSB for the provision of water supply to the inhabitants of two residential blocks40. In 1995, a service contract was signed between the National Water Conservation and Pipeline Corporation (NWCPC) and Gauff Consulting Engineers to support local authorities in the coastal town Malindi in billing and revenue
40 Runda Water Limited Website- http://www.rundaestate.com
40
collection. Following the enactment of the Water Act 2002, NWCPC is charged with the role of developing the water infrastructure in Kenya, by expanding bulk water supply, through the development of state schemes, spearheading dam construction, flood control and other multi‐purpose uses, land drainage and construction of dykes; and carrying out ground water recharge using flood water. The contract was extended from seven and a half months to three and a half years. After its conclusion in 1999, a management contract was signed between Malindi Water Company and the private operator for a period of four years to support the company on technical and financial aspects41.The contract was regarded as successful and after it expired responsibility for service provision reverted to the public sector. In the small town of Tala in 1999, the Kangundo county council entered in a 30‐year water provision contract with Romane Agencies Ltd. The contract foresees that 10% of revenues are to be paid to the town council. As of today, small improvements in service quality have been observed, but water coverage still remains a challenge. Civil Society Kenya has an active civil society including a number of local NGOs active in water supply and sanitation. Many of them are members of the Kenya Water and Sanitation Civil Society Network (Kewasnet) founded in 2007. Among other activities, Kewasnet monitors service delivery, especially for the poor, and policy implementation on water sector reforms. It also "provides information to Kenyans to enable them to be engaged and involved in the management and decision‐making mechanisms of the water and sanitation sector". It also "promotes a culture of consumer responsibility that pays for supplied services from utility companies, safeguards water services infrastructure and equipment against vandalism by criminals.42One of the larger Kenyan NGOs active in water and sanitation is Maji Na Ufanisi (Water and Development). It is involved in community development and infrastructure construction in urban slums and in small towns, advocates for improved sector governance and carries out research. It was created in 1998 to take over the Kenya operations of WaterAid UK when the latter decided to close down its operations in Kenya‐43.
Use of Water and Sanitation Services Most of the respondents participating in the study indicated that they use tap water from water kiosks although they also mentioned issues of unreliability in water flow, and where the kiosk could also be closed for a day or two. Although some mentioned that at times the water supplied was too dirty and not‐ tenable for domestic use. Most respondents indicated that they never do in house plumbing for water supply; they usually opt for a single tap within their compounds. It is estimated that 52% of the total drinking water supply comes from rain water during the rainy season. In the dry season, much of the rural population relies on springs, rivers and streams for drinking water. Urban households have water piped into their compound or dwelling or get water from public taps. The majority of Kenyans live within 15 minutes of their water source supply.
The Progress on Sanitation and Drinking Water Update 2013 Report by the Joint Monitoring Programme indicates that 29% of Kenyans in 2011 had access to improved sanitation systems, meaning adequate, separation of human excreta from human contact through use of following facilities: flush toilets, piped sewer systems, septic tanks, pit latrines, and ventilated pit latrines. The remaining population uses various alternatives including open defecation (14%) and shared facilities among 3 or more families (26%) and unimproved sanitation facilities that do not ensure hygienic separation of human excreta from human contact (31%). Unimproved facilities include pit latrines without a slab or platform, hanging
41 Ballance, T. and S. Tremolet: Private sector participation in urban water supply in Sub-Sahara Africa, GTZ, 2005 42 http://www.kewasnet.org/index.php/layout/objectives 43 http://www.kewasnet.org/index.php/layout/objectives
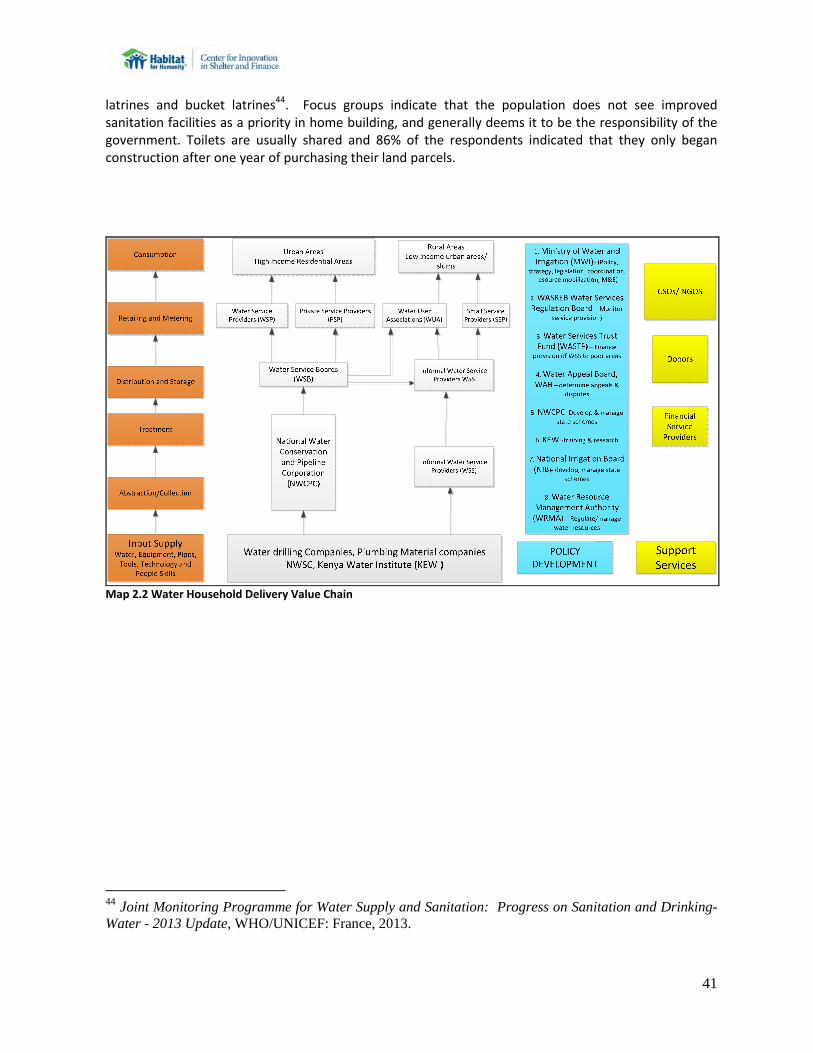
41
latrines and bucket latrines44. Focus groups indicate that the population does not see improved sanitation facilities as a priority in home building, and generally deems it to be the responsibility of the government. Toilets are usually shared and 86% of the respondents indicated that they only began construction after one year of purchasing their land parcels.
Map 2.2 Water Household Delivery Value Chain
44 Joint Monitoring Programme for Water Supply and Sanitation: Progress on Sanitation and Drinking-Water - 2013 Update, WHO/UNICEF: France, 2013.
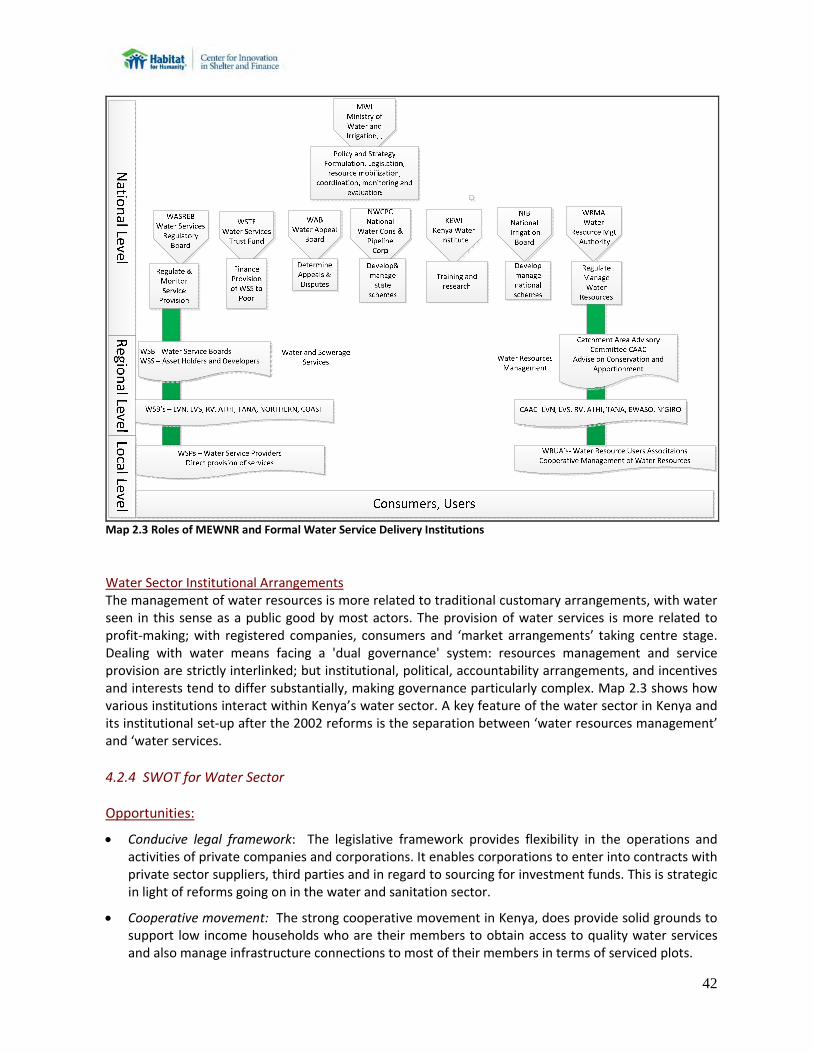
42
Map 2.3 Roles of MEWNR and Formal Water Service Delivery Institutions
Water Sector Institutional Arrangements The management of water resources is more related to traditional customary arrangements, with water seen in this sense as a public good by most actors. The provision of water services is more related to profit‐making; with registered companies, consumers and ‘market arrangements’ taking centre stage. Dealing with water means facing a 'dual governance' system: resources management and service provision are strictly interlinked; but institutional, political, accountability arrangements, and incentives and interests tend to differ substantially, making governance particularly complex. Map 2.3 shows how various institutions interact within Kenya’s water sector. A key feature of the water sector in Kenya and its institutional set‐up after the 2002 reforms is the separation between ‘water resources management’ and ‘water services.
4.2.4 SWOT for Water Sector
Opportunities:
Conducive legal framework: The legislative framework provides flexibility in the operations and activities of private companies and corporations. It enables corporations to enter into contracts with private sector suppliers, third parties and in regard to sourcing for investment funds. This is strategic in light of reforms going on in the water and sanitation sector.
Cooperative movement: The strong cooperative movement in Kenya, does provide solid grounds to support low income households who are their members to obtain access to quality water services and also manage infrastructure connections to most of their members in terms of serviced plots.
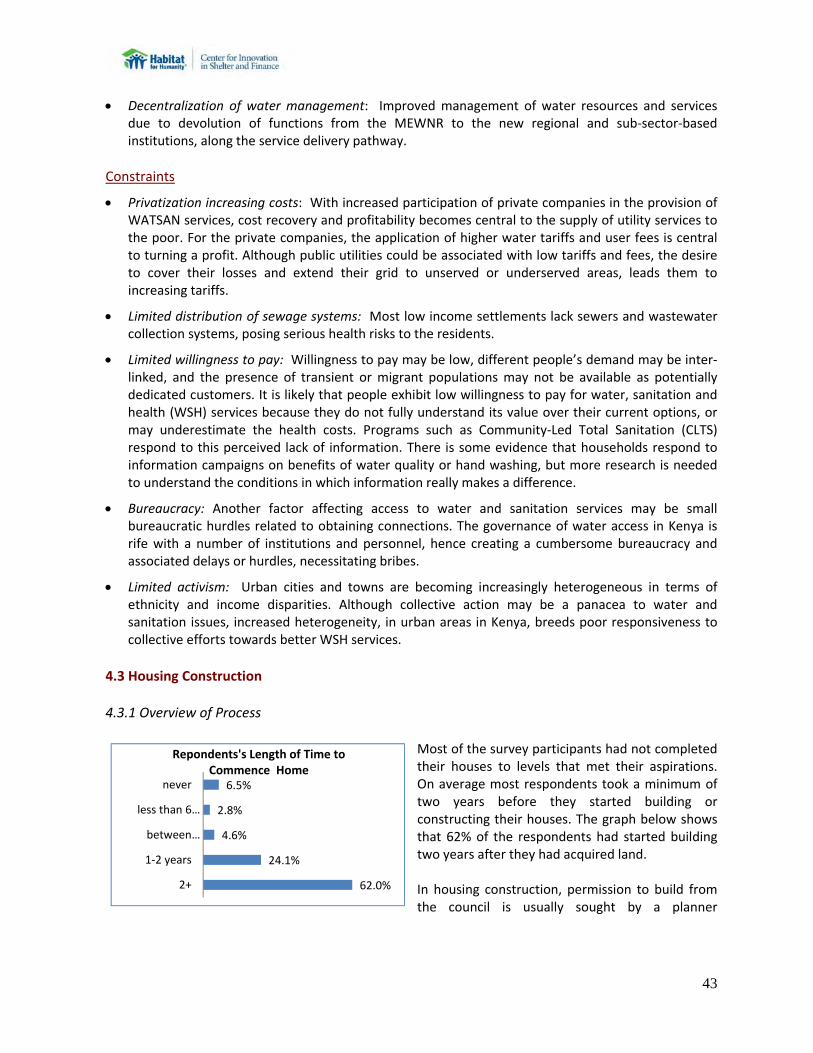
43
Decentralization of water management: Improved management of water resources and services due to devolution of functions from the MEWNR to the new regional and sub‐sector‐based institutions, along the service delivery pathway.
Constraints
Privatization increasing costs: With increased participation of private companies in the provision of WATSAN services, cost recovery and profitability becomes central to the supply of utility services to the poor. For the private companies, the application of higher water tariffs and user fees is central to turning a profit. Although public utilities could be associated with low tariffs and fees, the desire to cover their losses and extend their grid to unserved or underserved areas, leads them to increasing tariffs.
Limited distribution of sewage systems: Most low income settlements lack sewers and wastewater collection systems, posing serious health risks to the residents.
Limited willingness to pay: Willingness to pay may be low, different people’s demand may be inter‐linked, and the presence of transient or migrant populations may not be available as potentially dedicated customers. It is likely that people exhibit low willingness to pay for water, sanitation and health (WSH) services because they do not fully understand its value over their current options, or may underestimate the health costs. Programs such as Community‐Led Total Sanitation (CLTS) respond to this perceived lack of information. There is some evidence that households respond to information campaigns on benefits of water quality or hand washing, but more research is needed to understand the conditions in which information really makes a difference.
Bureaucracy: Another factor affecting access to water and sanitation services may be small bureaucratic hurdles related to obtaining connections. The governance of water access in Kenya is rife with a number of institutions and personnel, hence creating a cumbersome bureaucracy and associated delays or hurdles, necessitating bribes.
Limited activism: Urban cities and towns are becoming increasingly heterogeneous in terms of ethnicity and income disparities. Although collective action may be a panacea to water and sanitation issues, increased heterogeneity, in urban areas in Kenya, breeds poor responsiveness to collective efforts towards better WSH services.
4.3 Housing Construction 4.3.1 Overview of Process
Most of the survey participants had not completed their houses to levels that met their aspirations. On average most respondents took a minimum of two years before they started building or constructing their houses. The graph below shows that 62% of the respondents had started building two years after they had acquired land. In housing construction, permission to build from the council is usually sought by a planner
62.0%
24.1%
4.6%
2.8%
6.5%
2+
1‐2 years
between…
less than 6…
never
Repondents's Length of Time to Commence Home
44
/architect45 engaged by the building owner, who then engages the city engineer. If the building owner sought to pursue a building permit on his/her own, the process frustratingly gets longer, especially in regard to technicalities and compliance to building codes that could easily be handled if a planner (architect) who understands the bureaucracy had been engaged to pursue the permit. Respondents however the appreciate the ease of engaging the planner but do not hesitate to mention that it is costly. Some of the low‐income homeowner‐builders usually started off with semi ‐ permanent shelters and expanded later to more permanent dwellings built in such a way that room extensions could be used for rent. However, the rest of them mentioned accumulation of materials on site sight purchased incrementally, and kept with the neighbors until the time for constructing the foundation. The options available at the beginning are to purchase materials or mobilize friends and neighbors to make blocks over time. Where burnt bricks are used firewood kilns are used. Once sufficient materials have been gathered on site, foundations usually are laid and left on site for an indefinite amount of time. The technical aspects of construction, engagement with the city engineers, operationalization of the building plan with the planner, is usually the domain of the foreman, or chief mason. The builder’s role is that of financing. Walls are also built and left unroofed as resources are gathered for the next step. In areas where the soil does not permit burnt or sun dried bricks, low income households often build with cement blocks. It is a common sight in low income settlements to find and unroofed house, some having remained unroofed for a long time. This period is as a long as an income cycle for a household. Roofing is the most expensive component of the building process. Storage of roofing materials is difficult for most low income people since the roofing materials can easily be resold and thus vulnerable to theft. Once roofing is done in all Focus groups, it was agreed that it is at this stage the family occupies the house. Usually this is one or two rooms with visible extensible structures for future addition of another room. The "finishing method" floors, plaster, ceilings, electricity and other house components are added gradually as the family resides in the house. It is not uncommon for dwellers to occupy their houses before even fixing doors and windows. In such cases, temporary coverings are used or window openings are blocked closed, with the doors and windows being added over time as additional funds become available.
KAJIADO COUNTY COUNCIL Kajiado county council jurisdiction covers areas such as Kitengela, Ongata Rongai, Ngong, Kerarapon, Kiserian, Matasia, Isinya and Kajiado towns. The process at Kaiado county council is as follows:
1. Architect/land owner presents the drawings to Kajiado council Office assistant planner.
2. Assistant planner checks if all documents are there i.e. copy of title, all drawings, site plans, survey plans. Mutation plans, architect’s registration certificate, etc.
3. If all necessary documents are there, assistant planner asks architect/land owner to pay Ksh 500 to the council cashier to get the application form.
4. At the cashier’s office, it’s a mandatory requirement that for architect/land owner to purchase
45 During the course of the present study, some communities used the term “planner” to refer to an architect, while others - particularity in Nairobi - used the word “architect”
45
the forms, he has to have a copy of search or title deed.
5. After purchase of application form and the application is filled appropriately, all the documents are taken to the Planner for checking. If they meet the minimum requirements, the approval application fees can now be paid after the planner gives a Go‐ahead. At this stage, the planner will either ask the architect/land owner to change the drawings to fit the council requirements or will give the go‐ahead to commence the procedures.
6. After the council fees are paid, the drawing now circulates to the necessary personnel to get the approval stamps. This process takes a minimum of 2 weeks to a maximum of 2 months.
7. In large local authorities such as Nairobi, they have all the departments necessary such as structural engineering, public health and land planners. In smaller local authorities such as Kajiado, they outsource these services to the relevant Ministries situated in Kajiado. For public health, architect/land owner is sent to the Ministry of Health representative. For structural/architectural approvals, the architect/land owner is sent to the Ministry of Public works representative. For land planning, the architect/land owner is sent to the Ministry of Lands representative in Kajiado.
8. After the drawings are stamped by all the above representatives, they are returned by the architect/land owner back to the Planner for the final approval stamp accompanied by an approval letter. The final approval stamp plus the letter is what is termed as a building plan approval and will be later used by the banks etc.
9. All the above process will take between 2 weeks to 2 months to complete depending on the intervention of the architect/land owner in each of the above offices. The architect/land owner must be available to promptly answer to each department’s queries.
10. The council fees are in two stages‐ [a] the fees payable directly to the Council for services rendered by the council [b] fees payable directly to the Government Ministries offering other services e.g. Public Works, Health, Land.
11. Where necessary as deemed by the council Planner, a change of user is done by a registered physical planner as an independent consultant. He then lodges it for approval at the council together with the architectural drawings. The land owner enters into an independent agreement with a registered planner for him to offer this service.
According to artisans interviewed, construction technological trends have moved away from use of soil blocks and stones, as stones run out of supply, to the use of burnt bricks. This in effect however increased the consumption of cement from a ratio of one bag to four wheelbarrows of cement to one bag and three wheel barrows of cement. The best brand for building floor foundations is the Blue Triangle Cement by East African Portland Cement Co. due to its “strength and speed in setting” (local terminology for drying quickly), while the most popular is the Simba brand by Bamburi. Interviews with artisans also revealed that most of the artisans at one time or another have personally led low income housing projects and most times have influenced the builder’s technical choice of construction materials and building standards. However most of them have acquired building skills on the job, and new technologies are acquired after participating on bigger projects. Some of the artisans argued that despite building decent shelter for their clients, themselves lived in poor shelter due to poor payment from their clients.
46
4.3.2 Detailed Mapping Every house is a bit different from the next, as each is built to suit individual household needs and budgets. Although some households may try to build their own simple houses, most prefer to defer to the ‘experts’ when it comes to construction. For most households, foreman known as fundis are the main sources of design advice, the main contacts for material purchase, and the final arbiters on construction quality and management. Unfortunately, some fundis take advantage of their position. Households are subject to manipulation, as fundis can over‐charge less knowledgeable customers or cut corners to lower their costs. Since fundis benefit from larger, more costly jobs, they have an incentive to over‐estimate the amount of materials and time it will take to construct a house, leading to over‐engineered (but not necessarily ‘better’) house construction. Depending on the skill level of the fundi, the quality of advice varies greatly.
The Low Income End Consumer The end consumer does not have great access to the construction supply chain and often relies on the fundi to navigate the purchase process. Their role is mainly funding of the project. However in most cases they do take part in negotiations of price for purchase of materials and services, and also ensuring that construction is done as per their preferred design. There is a willingness to pay more for quality, and people tend not to select the cheapest option available. Most people plan for their families to live at their home for a long time, and want to make long‐term investments in their property. Hence, there is some level of brand consciousness. For instance, East Land Portland, cement is preferred for the floor because of its strength, while Bamburi is sought out for wall bonding since it is of lower strength but cheaper. This may vary from place to place, as Bamburi is viewed as the most expensive brand in other locations.
Transport For most people living outside the main market towns, transporting heavy goods like construction materials is very costly. Households transport cement by piki‐piki, if they live nearby the market. For those further away from markets, smaller vehicles such as low cost Lorries, pick‐ups and commuter buses are used to ship materials on to their sites. This is particularly the case for materials required for the foundation and the bricks or stones. In rare cases, group purchases may be used to reduce the transport cost of sand or stones from a quarry. As per the value chain map below, the end user is entirely responsible for their transport from suppliers; however along the chain from the manufacturer through the distributor, to wholesalers, transport is included in the sales price. In small retailers do provide for their own transport from large retailers due the assortment of items they stock.
Fundi: Electrician, Plumber, Building Foreman Fundis are a household’s main technical advisors in the housing supply chain, and are relied upon for their knowledge. The fundis are the ones who work with the local city authorities and/or building planner to process the building permits. It is again their role to procure and manage any casual laborers on site. As noted above, they sometimes use their role as a middle man between the retailers and the households to make extra money. In one of the artisan’s focus group discussions one of the fundis confessed having land but has never built a house of his own. However he mentioned that soon he will build because whenever he has established a network of suppliers of building materials, and whenever he makes a budget for his clients he inflates the required materials, purchasing less items from the stores. He has made a contract with store owners to set aside the extra material for his own use in the near future.
47
Retailer Retailers are the critical link between the manufacturers and households. However, there is potential for many layers of retail (and retail mark‐ups) before a product gets to the final customer. Households (and fundis) will likely bypass some of these layers if the cost/benefit tradeoff regarding pricing and transportation costs is in their favor. Retailers extend credit to customers if they trust them and if they are repeat/regular customers. At the medium‐to‐large retail level, this is limited to large‐scale contractors. At the small retail level, this is generally limited to fundis. The bulk of business is in high‐turnover, low‐margin raw materials. Cement, mabati and reinforcing iron account for the majority of retail revenue, particularly for smaller retail shops, yet the margins on these items are very thin. Plastic water tanks tend to also fall into this category. The highest margins come from the few unique items that a store may sell: plastic plumbing fittings, window glass, specialty paints, etc., though the volume sales of these items tends to be low since these are used at the finishing stage. Most retailers sell exactly the same things as their competition across the street, with a small number of unique products. Competition is based on price (and somewhat on relationships), and customers will shop around to get the best price. Retailers typically do not invest resources in active selling. Most of the customer‐facing staff sits behind a counter and takes orders from customers who already know what they want. Retailers use minimal signage and generally do not advertise. Most of their stock is kept behind the counter, out of sight of the customers. Some shops will put limited stock of high‐turn and recognizable items on the front sidewalk as a sign that it is hardware store. Any product promotion material is provided by manufacturers, and, for their part, retailers do seem willing and eager to put this material on display. Manufacturers will also pay to paint stores with their logos. Retailers will search for and supply most products that customers request. This is probably the most common way that retailers are introduced to new products. Manufacturers also visit retailers to pitch new products to them, though this is typically limited to medium‐to‐larger enterprises. Manufacturers also coordinate with retailers to host product demonstrations and seminars for local fundis. Retailers do not spend time teaching customers how to use their products or providing advice on construction. They will answer simple questions but do not conduct seminars, provide instructions or do demonstrations (unless organized and funded by manufacturers.) Instead, they will offer to connect households to a local fundi who can help them, with the understanding that the fundi sources materials from their shop.
Manufacturers Manufacturers are shielded from much of what happens outside of Nairobi and have little to no contact with their end customers. The main building materials manufacturers are mostly headquartered in Nairobi but have manufacturing sites and distribution that cover nearly all of East Africa. Production capabilities are similar from country‐ to‐country, such that the manufacturing of products could be distributed to decrease transport costs and incorporate any country‐specific variations in products. Nationwide distribution manufacturers have deep distribution networks, and use a variety of channels – retailer shops, commissioned sales agents, women’s groups, MFIs, etc. to reach rural consumers. Manufacturers typically do not charge for transport. New components can easily piggyback onto these existing distribution networks.
Linkages to Financial Service Providers In some instances like provision of water tanks, purchase of cement, financial institutions, like Equity Bank, Real People Finance, and K‐Rep, have made arrangements with hardware stores for their clients to receive their loans in kind in lieu of cash through picking up items from the stores. Such arrangements are often governed by Memoranda of Understanding, typically requiring options for buy back arrangements in case of default for items such as iron sheets, and solar home equipment.
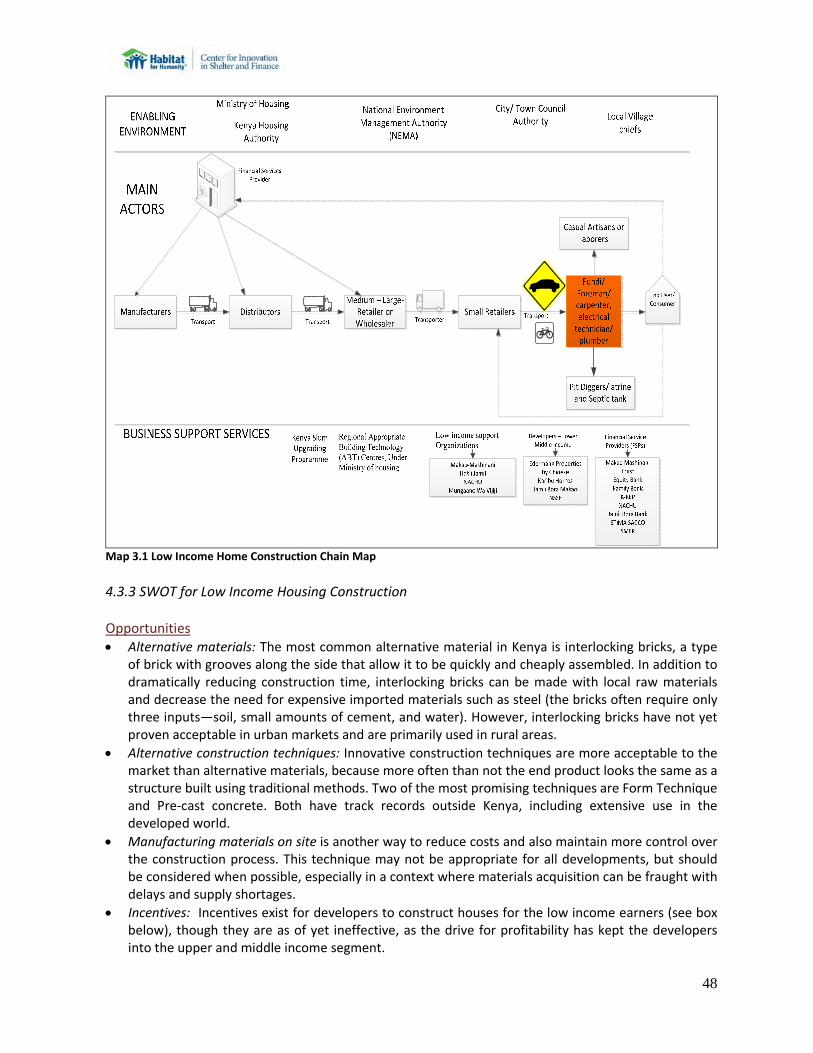
48
Map 3.1 Low Income Home Construction Chain Map
4.3.3 SWOT for Low Income Housing Construction Opportunities Alternative materials: The most common alternative material in Kenya is interlocking bricks, a type
of brick with grooves along the side that allow it to be quickly and cheaply assembled. In addition to dramatically reducing construction time, interlocking bricks can be made with local raw materials and decrease the need for expensive imported materials such as steel (the bricks often require only three inputs—soil, small amounts of cement, and water). However, interlocking bricks have not yet proven acceptable in urban markets and are primarily used in rural areas.
Alternative construction techniques: Innovative construction techniques are more acceptable to the market than alternative materials, because more often than not the end product looks the same as a structure built using traditional methods. Two of the most promising techniques are Form Technique and Pre‐cast concrete. Both have track records outside Kenya, including extensive use in the developed world.
Manufacturing materials on site is another way to reduce costs and also maintain more control over the construction process. This technique may not be appropriate for all developments, but should be considered when possible, especially in a context where materials acquisition can be fraught with delays and supply shortages.
Incentives: Incentives exist for developers to construct houses for the low income earners (see box below), though they are as of yet ineffective, as the drive for profitability has kept the developers into the upper and middle income segment.
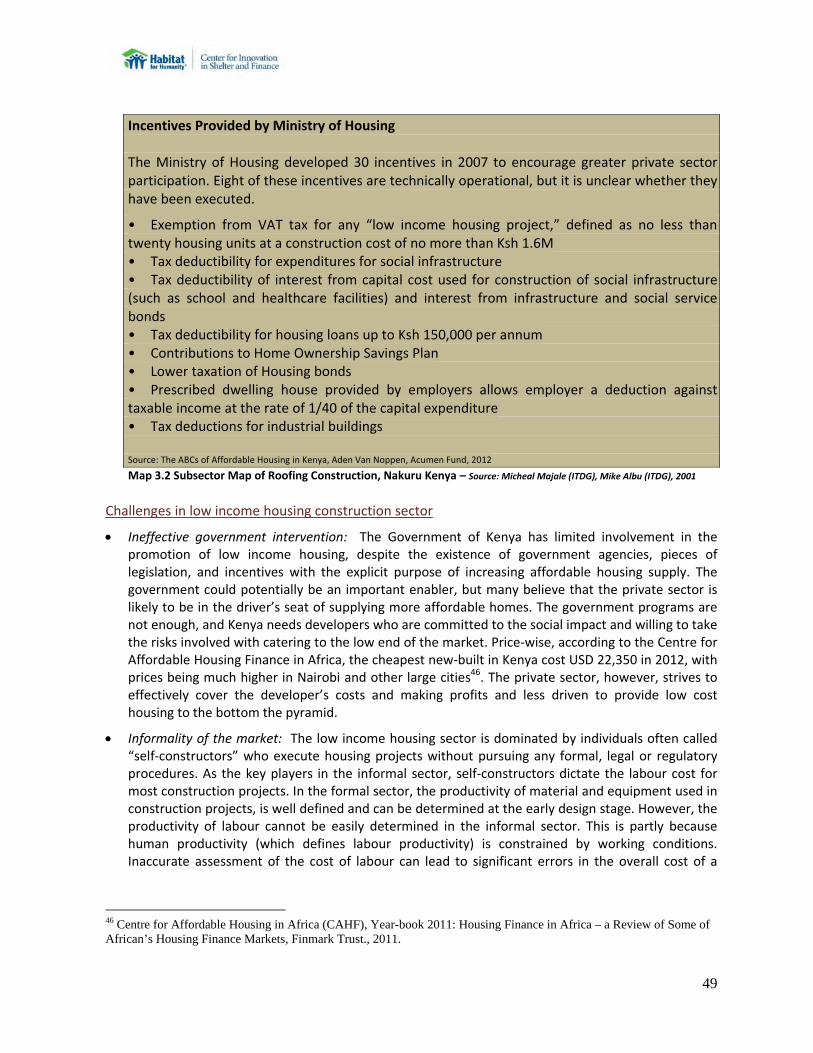
49
Incentives Provided by Ministry of Housing The Ministry of Housing developed 30 incentives in 2007 to encourage greater private sector participation. Eight of these incentives are technically operational, but it is unclear whether they have been executed.
• Exemption from VAT tax for any “low income housing project,” defined as no less than twenty housing units at a construction cost of no more than Ksh 1.6M • Tax deductibility for expenditures for social infrastructure • Tax deductibility of interest from capital cost used for construction of social infrastructure (such as school and healthcare facilities) and interest from infrastructure and social service bonds • Tax deductibility for housing loans up to Ksh 150,000 per annum • Contributions to Home Ownership Savings Plan • Lower taxation of Housing bonds • Prescribed dwelling house provided by employers allows employer a deduction against taxable income at the rate of 1/40 of the capital expenditure • Tax deductions for industrial buildings Source: The ABCs of Affordable Housing in Kenya, Aden Van Noppen, Acumen Fund, 2012
Map 3.2 Subsector Map of Roofing Construction, Nakuru Kenya – Source: Micheal Majale (ITDG), Mike Albu (ITDG), 2001
Challenges in low income housing construction sector
Ineffective government intervention: The Government of Kenya has limited involvement in the promotion of low income housing, despite the existence of government agencies, pieces of legislation, and incentives with the explicit purpose of increasing affordable housing supply. The government could potentially be an important enabler, but many believe that the private sector is likely to be in the driver’s seat of supplying more affordable homes. The government programs are not enough, and Kenya needs developers who are committed to the social impact and willing to take the risks involved with catering to the low end of the market. Price‐wise, according to the Centre for Affordable Housing Finance in Africa, the cheapest new‐built in Kenya cost USD 22,350 in 2012, with prices being much higher in Nairobi and other large cities46. The private sector, however, strives to effectively cover the developer’s costs and making profits and less driven to provide low cost housing to the bottom the pyramid.
Informality of the market: The low income housing sector is dominated by individuals often called “self‐constructors” who execute housing projects without pursuing any formal, legal or regulatory procedures. As the key players in the informal sector, self‐constructors dictate the labour cost for most construction projects. In the formal sector, the productivity of material and equipment used in construction projects, is well defined and can be determined at the early design stage. However, the productivity of labour cannot be easily determined in the informal sector. This is partly because human productivity (which defines labour productivity) is constrained by working conditions. Inaccurate assessment of the cost of labour can lead to significant errors in the overall cost of a
46 Centre for Affordable Housing in Africa (CAHF), Year-book 2011: Housing Finance in Africa – a Review of Some of African’s Housing Finance Markets, Finmark Trust., 2011.
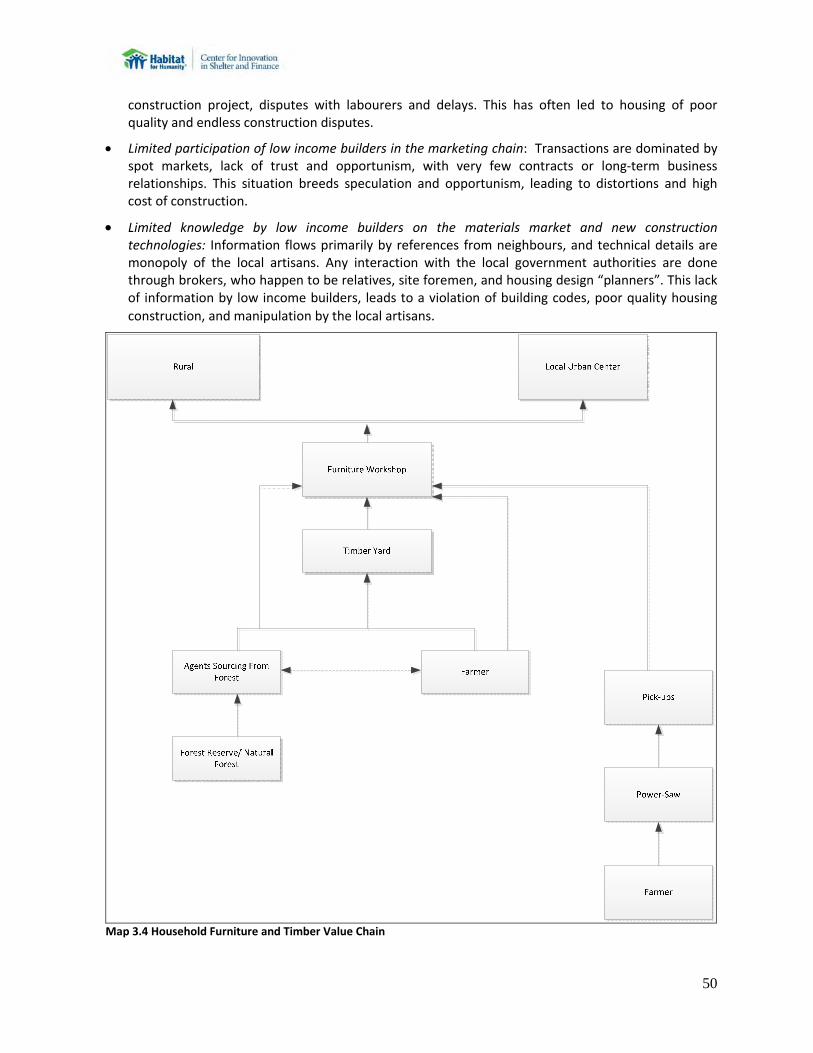
50
construction project, disputes with labourers and delays. This has often led to housing of poor quality and endless construction disputes.
Limited participation of low income builders in the marketing chain: Transactions are dominated by spot markets, lack of trust and opportunism, with very few contracts or long‐term business relationships. This situation breeds speculation and opportunism, leading to distortions and high cost of construction.
Limited knowledge by low income builders on the materials market and new construction technologies: Information flows primarily by references from neighbours, and technical details are monopoly of the local artisans. Any interaction with the local government authorities are done through brokers, who happen to be relatives, site foremen, and housing design “planners”. This lack of information by low income builders, leads to a violation of building codes, poor quality housing
construction, and manipulation by the local artisans.
Map 3.4 Household Furniture and Timber Value Chain
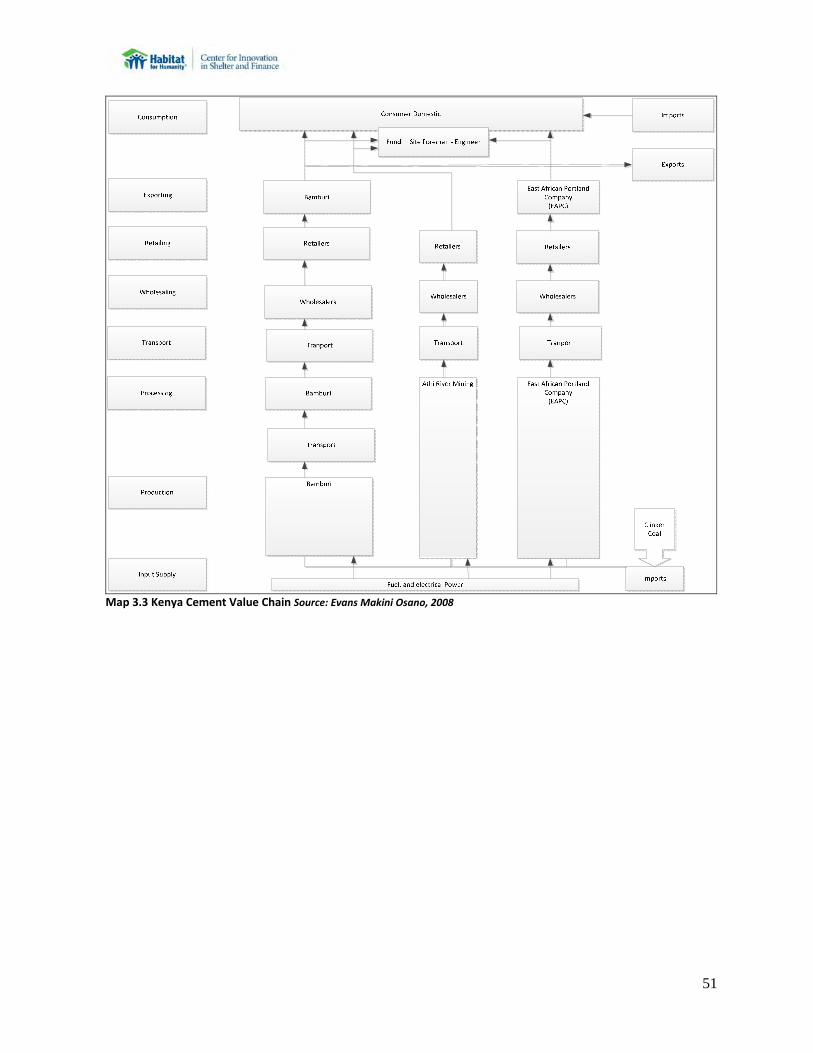
51
Map 3.3 Kenya Cement Value Chain Source: Evans Makini Osano, 2008
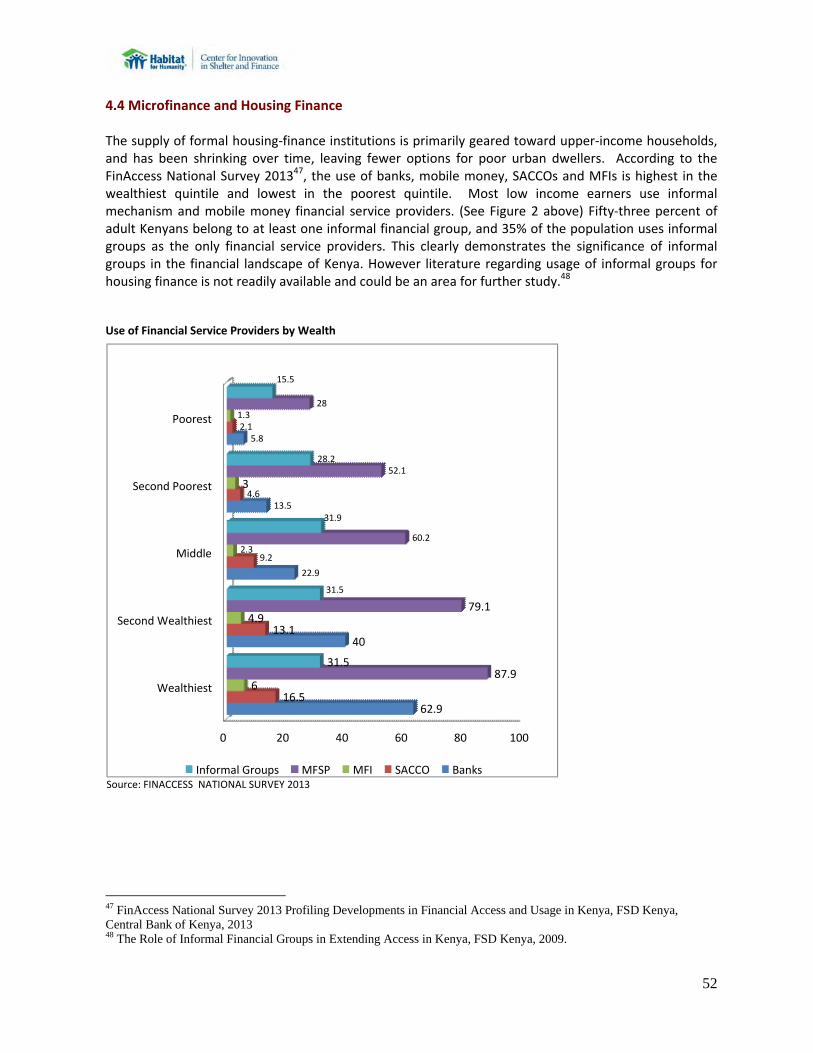
52
4.4 Microfinance and Housing Finance The supply of formal housing‐finance institutions is primarily geared toward upper‐income households, and has been shrinking over time, leaving fewer options for poor urban dwellers. According to the FinAccess National Survey 201347, the use of banks, mobile money, SACCOs and MFIs is highest in the wealthiest quintile and lowest in the poorest quintile. Most low income earners use informal mechanism and mobile money financial service providers. (See Figure 2 above) Fifty‐three percent of adult Kenyans belong to at least one informal financial group, and 35% of the population uses informal groups as the only financial service providers. This clearly demonstrates the significance of informal groups in the financial landscape of Kenya. However literature regarding usage of informal groups for housing finance is not readily available and could be an area for further study.48 Use of Financial Service Providers by Wealth
47 FinAccess National Survey 2013 Profiling Developments in Financial Access and Usage in Kenya, FSD Kenya, Central Bank of Kenya, 2013 48 The Role of Informal Financial Groups in Extending Access in Kenya, FSD Kenya, 2009.
0 20 40 60 80 100
Wealthiest
Second Wealthiest
Middle
Second Poorest
Poorest
62.9
40
22.9
13.5
5.8
16.5
13.1
9.2
4.6
2.1
6
4.9
2.3
3
1.3
87.9
79.1
60.2
52.1
28
31.5
31.5
31.9
28.2
15.5
Informal Groups MFSP MFI SACCO BanksSource: FINACCESS NATIONAL SURVEY 2013
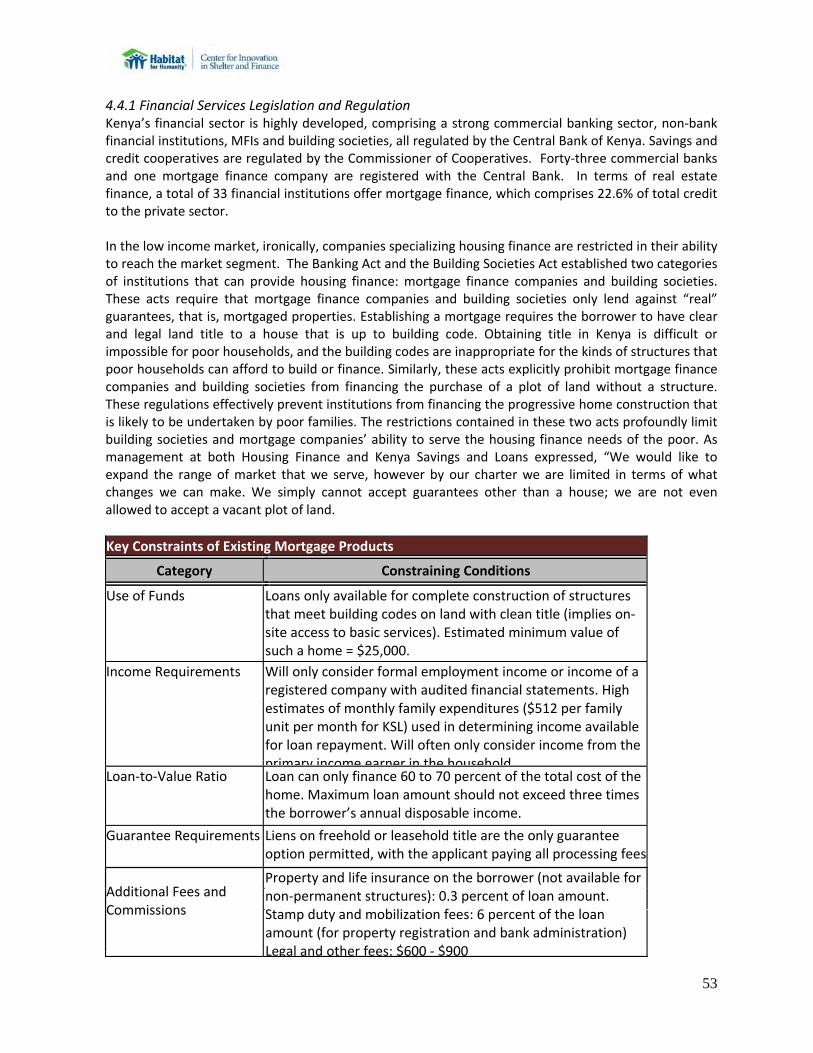
53
4.4.1 Financial Services Legislation and Regulation Kenya’s financial sector is highly developed, comprising a strong commercial banking sector, non‐bank financial institutions, MFIs and building societies, all regulated by the Central Bank of Kenya. Savings and credit cooperatives are regulated by the Commissioner of Cooperatives. Forty‐three commercial banks and one mortgage finance company are registered with the Central Bank. In terms of real estate finance, a total of 33 financial institutions offer mortgage finance, which comprises 22.6% of total credit to the private sector.
In the low income market, ironically, companies specializing housing finance are restricted in their ability to reach the market segment. The Banking Act and the Building Societies Act established two categories of institutions that can provide housing finance: mortgage finance companies and building societies. These acts require that mortgage finance companies and building societies only lend against “real” guarantees, that is, mortgaged properties. Establishing a mortgage requires the borrower to have clear and legal land title to a house that is up to building code. Obtaining title in Kenya is difficult or impossible for poor households, and the building codes are inappropriate for the kinds of structures that poor households can afford to build or finance. Similarly, these acts explicitly prohibit mortgage finance companies and building societies from financing the purchase of a plot of land without a structure. These regulations effectively prevent institutions from financing the progressive home construction that is likely to be undertaken by poor families. The restrictions contained in these two acts profoundly limit building societies and mortgage companies’ ability to serve the housing finance needs of the poor. As management at both Housing Finance and Kenya Savings and Loans expressed, “We would like to expand the range of market that we serve, however by our charter we are limited in terms of what changes we can make. We simply cannot accept guarantees other than a house; we are not even allowed to accept a vacant plot of land.
Key Constraints of Existing Mortgage Products
Category Constraining Conditions
Use of Funds Loans only available for complete construction of structures that meet building codes on land with clean title (implies on‐site access to basic services). Estimated minimum value of such a home = $25,000.
Income Requirements Will only consider formal employment income or income of a registered company with audited financial statements. High estimates of monthly family expenditures ($512 per family unit per month for KSL) used in determining income available for loan repayment. Will often only consider income from the primary income earner in the household
Loan‐to‐Value Ratio Loan can only finance 60 to 70 percent of the total cost of the home. Maximum loan amount should not exceed three times the borrower’s annual disposable income.
Guarantee Requirements Liens on freehold or leasehold title are the only guarantee option permitted, with the applicant paying all processing fees
Additional Fees and Commissions
Property and life insurance on the borrower (not available for non‐permanent structures): 0.3 percent of loan amount. Stamp duty and mobilization fees: 6 percent of the loan amount (for property registration and bank administration) Legal and other fees: $600 ‐ $900
54
The existing financial services legislation and regulation in Kenya, albeit intended to ensure financial discipline, impose an unnecessarily strict system, specifying which institutions can provide which types of products to which types of customers. This is based on a limited view of how residential housing construction occurs. It assumes two primary means of housing construction: 1) developers acquire big tracts of land, build houses, and then sell completed houses to individual buyers; or 2) individuals acquire their own plot of land and build complete homes on that land. Financial services are designed to support these two kinds of construction. Commercial banks are permitted to lend to developers over two to three years to allow them to get through the construction phase. Mortgage companies and building societies are permitted to provide long‐term mortgage loans to individuals to purchase units from developers, or less commonly, to build their own complete units.
The framework that the laws establish is sorely removed from reality. The reality is that poor households most often acquire land without title through squatting, inheritance, or subdivision, and progressively build structures and add services as they acquire sufficient capital. Such variations and improvisation actually require corresponding innovation in housing‐finance products. However, such changes are only possible with flexible legislation and regulations—that do not rigidly define who lends to whom on what terms and conditions. The problem with such regulations is that they have reduced access to financial services, rather than protecting the interests of the public. The banks’ response to the Donde Act is a classic example of a well‐intentioned legislation that was too specific, causing a contraction rather than an improvement in the financial services market.
4.4.2 Microfinance Sector Kenya’s microfinance sector consists of four large microfinance banks (Equity Bank, K‐Rep Bank, Family Bank and Cooperative Bank) which serve the upper end of the microfinance market, and approximately 50 microfinance organizations. Total assets for the sector were over Ksh 220bn (USD 2.59bn) as of Dec 2011. It is worth noting, however, that Equity Bank alone accounts for 80.4% of the sector’s total assets. The size of the sector to GDP is 7.33% as of December 2011. The sector reaches out to nearly 1.5 million borrowers with the value of the outstanding loan book standing at Ksh 138.4bn as of Dec 2011 (USD 1.6 bn). The average loan disbursed is USD 1,649 for the whole sector and USD 464 when commercial banks are excluded. The sector still relies on donations and data from the survey reveals that 73.3% of donations are raised from international partners while only 26.7% from local entities and bodies. The sector largely funds itself with deposits collected from the public, which account for 58.9% of total assets, while total equity accounts for 18.2% of total assets, followed by borrowings accounting for 16.6%. Compulsory deposits account for 22.5% of the structure.
A recent report by HFHI on HMF in Kenya, commercial non‐deposit taking MFIs such as Select Africa have entered the HMF lending space; the MFI offers a home improvement incremental construction product as well as one for new build with amounts ranging from US$600‐US$6,000. A number of pioneering SACCOs and NGOs are using the microfinance lending methodology to provide housing finance for the poor, such as Jamii BoraBank and NACHU. NACHU has seen considerable growth in its loan product offering incremental building loans to improve physical infrastructure of homes, installing electricity, water and sanitation facilities (41%), and loan product for new house construction or house extension (100%) with loan amounts ranging from US$2,300‐US$58,000. However, there is limited documentation on the performance and sustainability of these HMF products.
Approximately 9% of low income households source credit for home construction from MFIs.
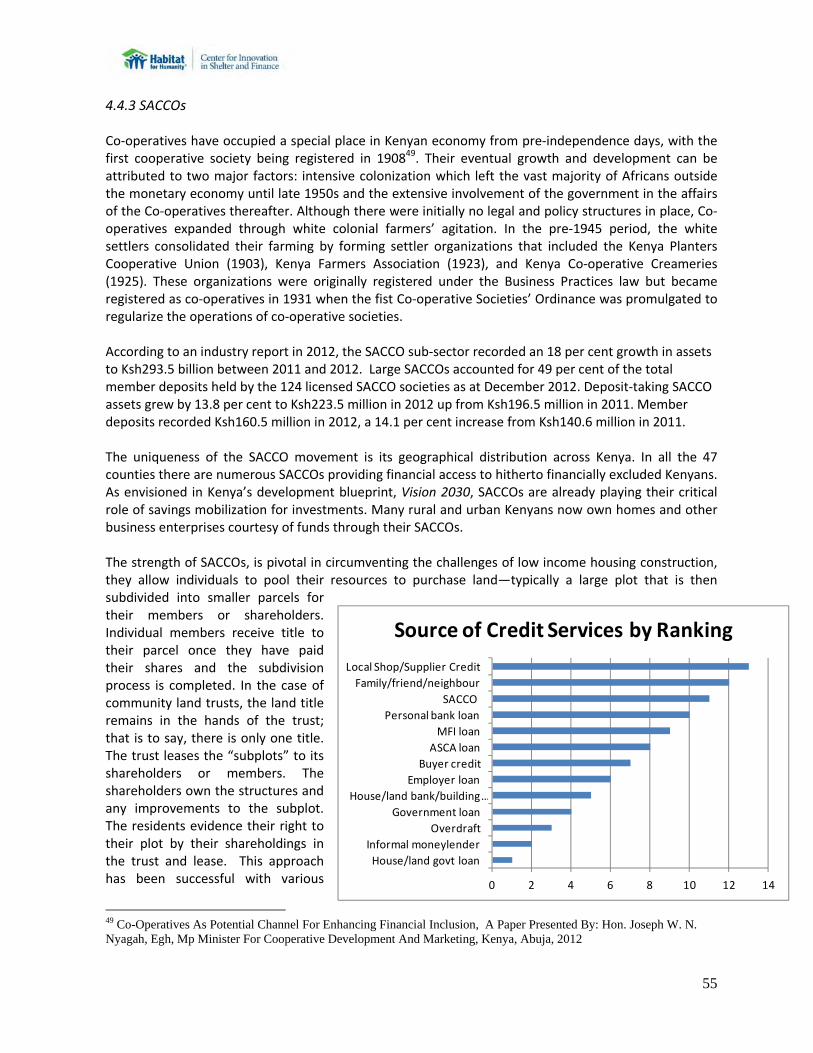
55
4.4.3 SACCOs Co‐operatives have occupied a special place in Kenyan economy from pre‐independence days, with the first cooperative society being registered in 190849. Their eventual growth and development can be attributed to two major factors: intensive colonization which left the vast majority of Africans outside the monetary economy until late 1950s and the extensive involvement of the government in the affairs of the Co‐operatives thereafter. Although there were initially no legal and policy structures in place, Co‐operatives expanded through white colonial farmers’ agitation. In the pre‐1945 period, the white settlers consolidated their farming by forming settler organizations that included the Kenya Planters Cooperative Union (1903), Kenya Farmers Association (1923), and Kenya Co‐operative Creameries (1925). These organizations were originally registered under the Business Practices law but became registered as co‐operatives in 1931 when the fist Co‐operative Societies’ Ordinance was promulgated to regularize the operations of co‐operative societies.
According to an industry report in 2012, the SACCO sub‐sector recorded an 18 per cent growth in assets to Ksh293.5 billion between 2011 and 2012. Large SACCOs accounted for 49 per cent of the total member deposits held by the 124 licensed SACCO societies as at December 2012. Deposit‐taking SACCO assets grew by 13.8 per cent to Ksh223.5 million in 2012 up from Ksh196.5 million in 2011. Member deposits recorded Ksh160.5 million in 2012, a 14.1 per cent increase from Ksh140.6 million in 2011.
The uniqueness of the SACCO movement is its geographical distribution across Kenya. In all the 47 counties there are numerous SACCOs providing financial access to hitherto financially excluded Kenyans. As envisioned in Kenya’s development blueprint, Vision 2030, SACCOs are already playing their critical role of savings mobilization for investments. Many rural and urban Kenyans now own homes and other business enterprises courtesy of funds through their SACCOs.
The strength of SACCOs, is pivotal in circumventing the challenges of low income housing construction, they allow individuals to pool their resources to purchase land—typically a large plot that is then subdivided into smaller parcels for their members or shareholders. Individual members receive title to their parcel once they have paid their shares and the subdivision process is completed. In the case of community land trusts, the land title remains in the hands of the trust; that is to say, there is only one title. The trust leases the “subplots” to its shareholders or members. The shareholders own the structures and any improvements to the subplot. The residents evidence their right to their plot by their shareholdings in the trust and lease. This approach has been successful with various
49 Co-Operatives As Potential Channel For Enhancing Financial Inclusion, A Paper Presented By: Hon. Joseph W. N. Nyagah, Egh, Mp Minister For Cooperative Development And Marketing, Kenya, Abuja, 2012
0 2 4 6 8 10 12 14
House/land govt loan
Informal moneylender
Overdraft
Government loan
House/land bank/building…
Employer loan
Buyer credit
ASCA loan
MFI loan
Personal bank loan
SACCO
Family/friend/neighbour
Local Shop/Supplier Credit
Source of Credit Services by Ranking
56
SACCOs, including Harambee SACCO, NACHU, Stima SACCO and Nakuru Teachers Housing Cooperative. The same approach has been replicated by NGOs, like Pamoja Trust, Hakii Jamii, and Mungaano Wa Vijiji, and Makao Mashinani Trust. Providing more affordable homes and housing finance in Kenya is not impossible and there are a growing number of groups who are making strides in this direction. They are taking risks and testing new models, and many of them need patient capital from impact investors in order to move forward.
Karibu Homes Project has employed a number of creative project financing strategies, including the innovation of an investment facility called the Affordable Housing Bond, in order to mobilize cheap and patient capital from social investors who are committed to the social impact of this project rather than its potential profits. In addition to achieving economies of scale through the sheer size of the Karibu Homes project, through carefully designed contractual agreements, that incentivizes cheaper and more creative building solutions. It is estimated that market price for each unit under this project will be USD 14,000 (Approx. 1 Million Ksh) down from an average of USD $ 40,000 of similar quality. Source: Extract from Ashoka Innovators Profile of Irfan Keshavjee‐ www.ashoka.org/fellow/irfan‐keshavjee
4.4.4 Summary of Housing Finance
The most common credit sources are shopkeepers, suppliers of household items, friends and relatives. SACCOs and personal bank loans (for those who have accessed salary loans) are the next in line as the most popular sources of credit for home construction50. Nevertheless, personal savings from own sources remain by far the largest source of funds for households to commence housing construction. This is also due the fact that most of the people interviewed for this study were “slum” land lords. The choice of financing source is largely influenced by ease of access, flexibility of repayments, and proximity to end user households.
50 Focus group discussions in all location.
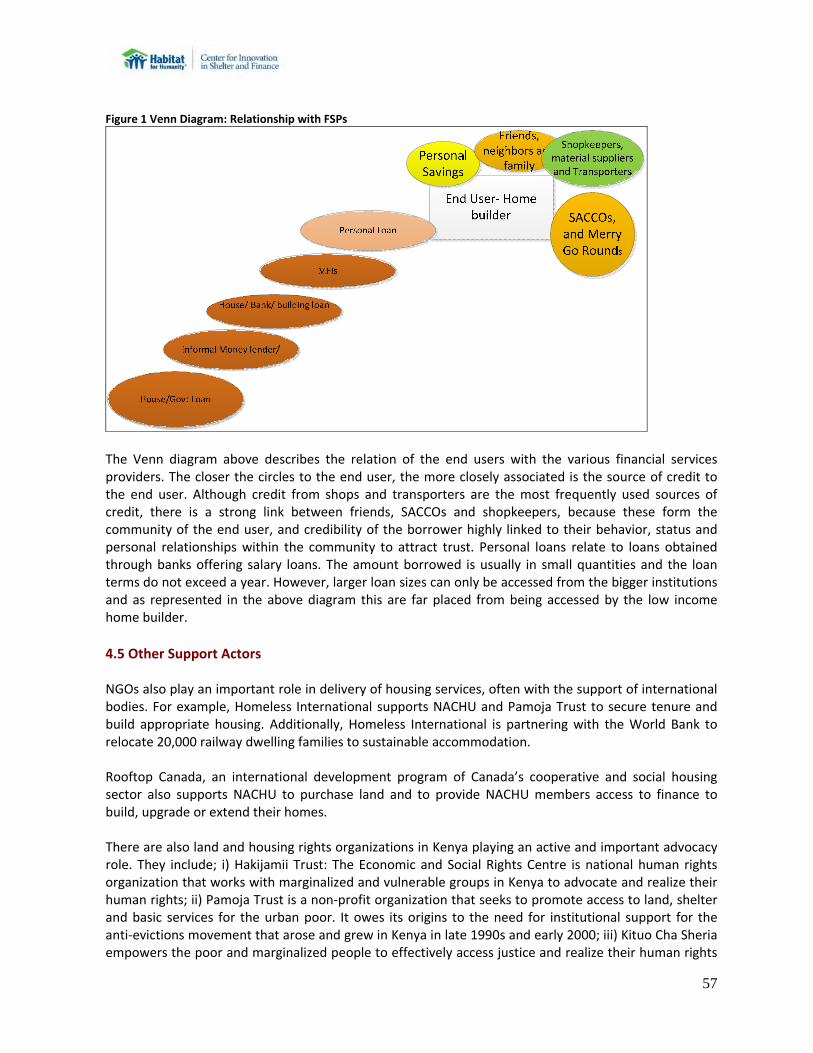
57
Figure 1 Venn Diagram: Relationship with FSPs
The Venn diagram above describes the relation of the end users with the various financial services providers. The closer the circles to the end user, the more closely associated is the source of credit to the end user. Although credit from shops and transporters are the most frequently used sources of credit, there is a strong link between friends, SACCOs and shopkeepers, because these form the community of the end user, and credibility of the borrower highly linked to their behavior, status and personal relationships within the community to attract trust. Personal loans relate to loans obtained through banks offering salary loans. The amount borrowed is usually in small quantities and the loan terms do not exceed a year. However, larger loan sizes can only be accessed from the bigger institutions and as represented in the above diagram this are far placed from being accessed by the low income home builder.
4.5 Other Support Actors
NGOs also play an important role in delivery of housing services, often with the support of international bodies. For example, Homeless International supports NACHU and Pamoja Trust to secure tenure and build appropriate housing. Additionally, Homeless International is partnering with the World Bank to relocate 20,000 railway dwelling families to sustainable accommodation.
Rooftop Canada, an international development program of Canada’s cooperative and social housing sector also supports NACHU to purchase land and to provide NACHU members access to finance to build, upgrade or extend their homes.
There are also land and housing rights organizations in Kenya playing an active and important advocacy role. They include; i) Hakijamii Trust: The Economic and Social Rights Centre is national human rights organization that works with marginalized and vulnerable groups in Kenya to advocate and realize their human rights; ii) Pamoja Trust is a non‐profit organization that seeks to promote access to land, shelter and basic services for the urban poor. It owes its origins to the need for institutional support for the anti‐evictions movement that arose and grew in Kenya in late 1990s and early 2000; iii) Kituo Cha Sheria empowers the poor and marginalized people to effectively access justice and realize their human rights
58
through advocacy, networking, lobbying, legal aid, legal education, representation and research; iv) Akiba Mashinani provides access to sustainable and affordable shelter, infrastructure, and innovative financial and technical housing solutions to urban and rural poor populations in Kenya through community led‐processes; v) Shelter Forum has been actively involved in shelter issues. It endeavours to bring together like‐minded NGOs, Community‐based Organizations (CBOs), other CSOs and communities to champion the course of shelter locally, regionally and internationally.
In 2011, with the help of Akiba Mashinani, 2,000 slum dwellers in Nairobi purchased 23 acres of land in Mukuru slum. These individuals organized themselves into 49 groups of 40 and started saving in 2007. The land was purchased for Ksh 81 million (USD 953,000). Eventually, all 2,000 individuals will have homes there and an additional 1000 middle‐income homes will be built to subsidize the cost.
Since government programs are not sufficient, private sector developers committed to social impact and willing to take the risk in serving the low‐end of the market, play a role in supplying more affordable housing. In 2007, the Ministry of Housing developed 30 incentives to encourage greater private sector participants; eight of these incentives were executed, for example, 1) Exemption from VAT tax for any “low income housing project,” defined as no' less than twenty housing units at a construction cost of no more than Ksh 1.6M; 2) Tax deductibility for expenditures for social infrastructure, 3) Tax deductibility of interest from capital cost used for construction of social infrastructure (such as school and healthcare facilities) and interest from infrastructure and social service bonds.
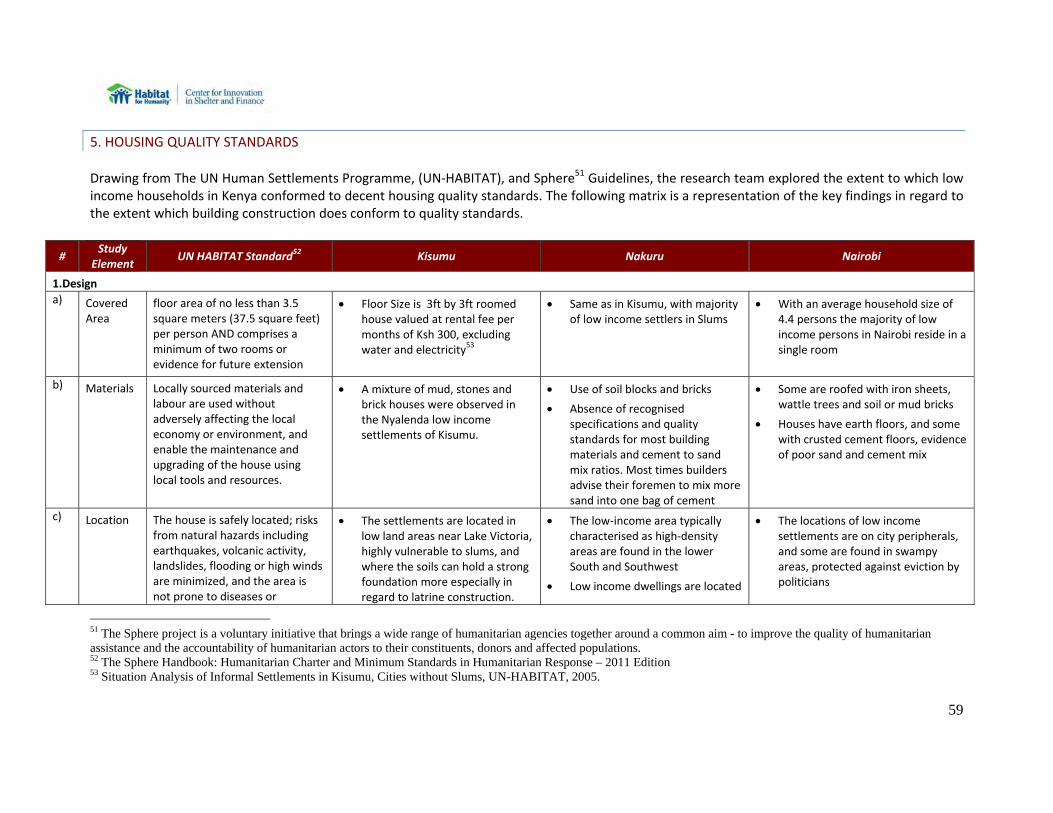
59
5. HOUSING QUALITY STANDARDS Drawing from The UN Human Settlements Programme, (UN‐HABITAT), and Sphere51 Guidelines, the research team explored the extent to which low income households in Kenya conformed to decent housing quality standards. The following matrix is a representation of the key findings in regard to the extent which building construction does conform to quality standards.
# Study
Element UN HABITAT Standard52 Kisumu Nakuru Nairobi
1.Design
a) Covered Area
floor area of no less than 3.5 square meters (37.5 square feet) per person AND comprises a minimum of two rooms or evidence for future extension
Floor Size is 3ft by 3ft roomed house valued at rental fee per months of Ksh 300, excluding water and electricity53
Same as in Kisumu, with majority of low income settlers in Slums
With an average household size of 4.4 persons the majority of low income persons in Nairobi reside in a single room
b) Materials Locally sourced materials and labour are used without adversely affecting the local economy or environment, and enable the maintenance and upgrading of the house using local tools and resources.
A mixture of mud, stones and brick houses were observed in the Nyalenda low income settlements of Kisumu.
Use of soil blocks and bricks
Absence of recognised specifications and quality standards for most building materials and cement to sand mix ratios. Most times builders advise their foremen to mix more sand into one bag of cement
Some are roofed with iron sheets, wattle trees and soil or mud bricks
Houses have earth floors, and some with crusted cement floors, evidence of poor sand and cement mix
c) Location The house is safely located; risks from natural hazards including earthquakes, volcanic activity, landslides, flooding or high winds are minimized, and the area is not prone to diseases or
The settlements are located in low land areas near Lake Victoria, highly vulnerable to slums, and where the soils can hold a strong foundation more especially in regard to latrine construction.
The low‐income area typically characterised as high‐density areas are found in the lower South and Southwest
Low income dwellings are located
The locations of low income settlements are on city peripherals, and some are found in swampy areas, protected against eviction by politicians
51 The Sphere project is a voluntary initiative that brings a wide range of humanitarian agencies together around a common aim - to improve the quality of humanitarian assistance and the accountability of humanitarian actors to their constituents, donors and affected populations. 52 The Sphere Handbook: Humanitarian Charter and Minimum Standards in Humanitarian Response – 2011 Edition 53 Situation Analysis of Informal Settlements in Kisumu, Cities without Slums, UN-HABITAT, 2005.
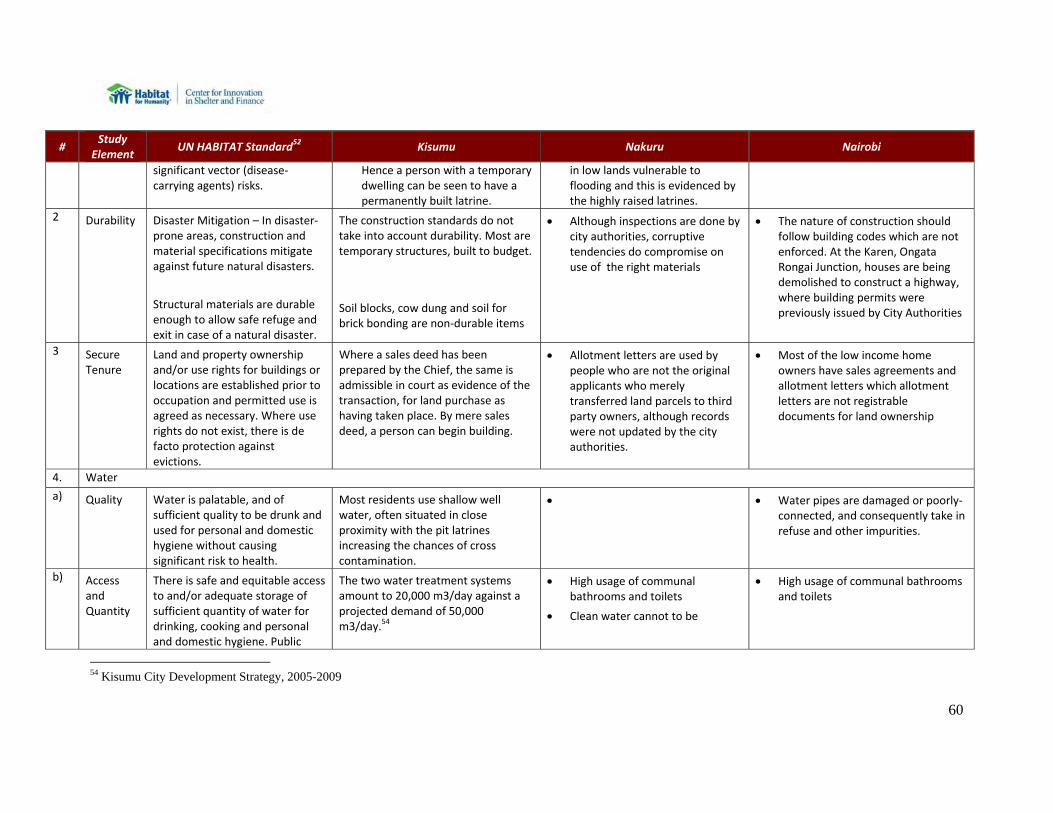
60
# Study
Element UN HABITAT Standard
52 Kisumu Nakuru Nairobi
significant vector (disease‐carrying agents) risks.
Hence a person with a temporary dwelling can be seen to have a permanently built latrine.
in low lands vulnerable to flooding and this is evidenced by the highly raised latrines.
2 Durability
Disaster Mitigation – In disaster‐prone areas, construction and material specifications mitigate against future natural disasters.
Structural materials are durable enough to allow safe refuge and exit in case of a natural disaster.
The construction standards do not take into account durability. Most are temporary structures, built to budget.
Soil blocks, cow dung and soil for brick bonding are non‐durable items
Although inspections are done by city authorities, corruptive tendencies do compromise on use of the right materials
The nature of construction should follow building codes which are not enforced. At the Karen, Ongata Rongai Junction, houses are being demolished to construct a highway, where building permits were previously issued by City Authorities
3 Secure Tenure
Land and property ownership and/or use rights for buildings or locations are established prior to occupation and permitted use is agreed as necessary. Where use rights do not exist, there is de facto protection against evictions.
Where a sales deed has been prepared by the Chief, the same is admissible in court as evidence of the transaction, for land purchase as having taken place. By mere sales deed, a person can begin building.
Allotment letters are used by people who are not the original applicants who merely transferred land parcels to third party owners, although records were not updated by the city authorities.
Most of the low income home owners have sales agreements and allotment letters which allotment letters are not registrable documents for land ownership
4. Water
a) Quality Water is palatable, and of sufficient quality to be drunk and used for personal and domestic hygiene without causing significant risk to health.
Most residents use shallow well water, often situated in close proximity with the pit latrines increasing the chances of cross contamination.
Water pipes are damaged or poorly‐connected, and consequently take in refuse and other impurities.
b) Access and Quantity
There is safe and equitable access to and/or adequate storage of sufficient quantity of water for drinking, cooking and personal and domestic hygiene. Public
The two water treatment systems amount to 20,000 m3/day against a projected demand of 50,000 m3/day.54
High usage of communal bathrooms and toilets
Clean water cannot to be
High usage of communal bathrooms and toilets
54 Kisumu City Development Strategy, 2005-2009
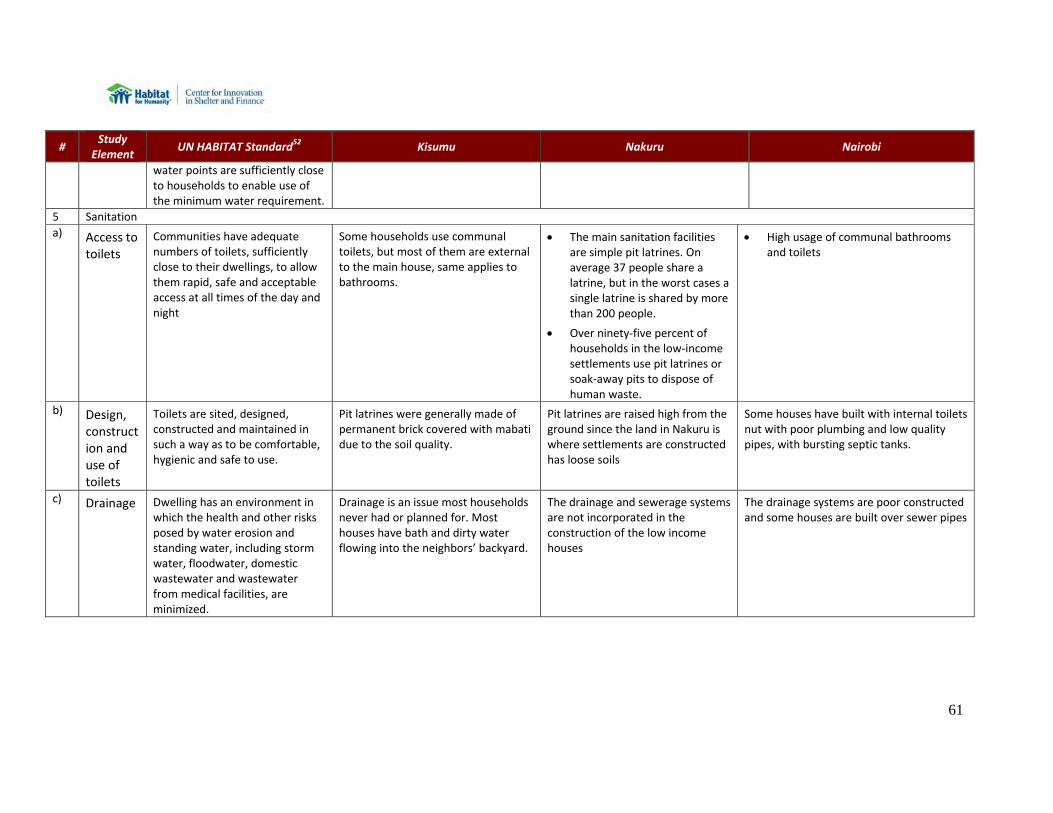
61
# Study
Element UN HABITAT Standard
52 Kisumu Nakuru Nairobi
water points are sufficiently close to households to enable use of the minimum water requirement.
5 Sanitation
a) Access to toilets
Communities have adequate numbers of toilets, sufficiently close to their dwellings, to allow them rapid, safe and acceptable access at all times of the day and night
Some households use communal toilets, but most of them are external to the main house, same applies to bathrooms.
The main sanitation facilities are simple pit latrines. On average 37 people share a latrine, but in the worst cases a single latrine is shared by more than 200 people.
Over ninety‐five percent of households in the low‐income settlements use pit latrines or soak‐away pits to dispose of human waste.
High usage of communal bathrooms and toilets
b) Design, construction and use of toilets
Toilets are sited, designed, constructed and maintained in such a way as to be comfortable, hygienic and safe to use.
Pit latrines were generally made of permanent brick covered with mabati due to the soil quality.
Pit latrines are raised high from the ground since the land in Nakuru is where settlements are constructed has loose soils
Some houses have built with internal toilets nut with poor plumbing and low quality pipes, with bursting septic tanks.
c) Drainage Dwelling has an environment in which the health and other risks posed by water erosion and standing water, including storm water, floodwater, domestic wastewater and wastewater from medical facilities, are minimized.
Drainage is an issue most households never had or planned for. Most houses have bath and dirty water flowing into the neighbors’ backyard.
The drainage and sewerage systems are not incorporated in the construction of the low income houses
The drainage systems are poor constructed and some houses are built over sewer pipes
62
6. HOUSING SUPPORT SERVICES IN KENYA’S HMF MARKET
Housing support services are non‐financial services that assist borrowers to realise quality housing. Whether provided by a lender or by private sector players, NGOs, or other service providers, they offer a range of services. Delivery models for housing support services are varied and largely depend on the extent of involvement as well as leadership and institutional organization. From the perspective of HMF institutions, lenders can either act as the sole providers of support services at every stage of the housing construction and home improvement or can contract or partner with other institutions. All of these service delivery multi‐party arrangements are underlined by memoranda of understanding that clearly define roles, service level agreements but also define levels of risk ownership, or reduction by each of the institutions. By and large, these arrangements also define the extent and frequency of interactions with and proximity to the end‐user and, thus, some housing support services can positively influence both practice and attitudes of value chain actors involved in house construction.
6.1 Role and Context of Housing Support Services in Kenya
HMF support services are based on the underlying concepts of due diligence and monitoring. Due diligence assures that the risk for non‐repayment and diversion of loan funds is adequately mitigated. Monitoring ensures that the borrower uses the loan for the purpose it was borrowed and, optimally, utilised to enable the borrower progress smoothly through the stages of incremental construction. From an organizational standpoint, financial service providers provide construction assistance to its clients in one of two ways. They can build the capacity in‐house by hiring, training and fielding the combination of professionals and skilled workers it believes will get the job done or alternatively, they may decide to outsource the work to a specialized firm, an NGO or a cadre of individuals. Most housing support services are fall in the following categories:
Access to land and secure tenure
Infrastructure, and
Construction support
6.2 Access to Land and Security of Tenure
Families cannot reliably produce formal proof of ownership for the land on which they live. Land and the dwelling built on it constitute the most important asset the family will ever own. In the specific context of product design, land issues affect HMF from a legal and from a risk standpoint. On the legal side, MFIs must determine whether they are able lend to a client without incontrovertible evidence that the client has a legal right to occupy the land. a client enjoys land security when the following conditions exist: (1) he/she has the use of a property at the time the loan application is made; (2) the MFI determines that the client will not be forced to vacate the property during the time it takes to repay the loan; (3) and that determination is supported by usual and customary local practices. In other words, in the absence of legal proof of ownership, the MFI should satisfy itself that potential clients would not be forcibly evicted while the loan is still active. The underlying assumption is that repayment performance will be enhanced if the client has a vested long‐term interest in the property being financed.
6.3 Infrastructure
The provision of infrastructure is a major challenge in Sub‐Saharan Africa where 42% of households lack access to improved sources of drinking water and 51% lack access to improved sanitation facilities
63
according to a study carried out by The UN Children’s Fund and The World Health Organisation in 2008. “Built environment professionals” (e.g. town planners, architects, land surveyors and engineers) and technically competent NGOs are scarce in the countries studied as levels of tertiary education are generally relatively low and only small numbers of these professionals graduate from local universities. Relatively lucrative employment opportunities in the private and public sectors mean that few professionals are accessible to the public at affordable rates. Furthermore, built environment professionals are poorly regulated in the countries studied leaving consumers of their services vulnerable. Due to their scarcity, such professionals are rarely used unless local authority regulations, adverse soil conditions or complex designs (such as multi‐story buildings) make the use of professional services essential.
Skilled and semi‐skilled builders and artisans are more accessible at affordable rates in the countries studied, but there are challenges with supervision of works and quality assurance. NGOs and a few state agencies facilitate access to such skills and support in some countries but they have very limited reach and do not provide support at a significant scale. The severity of the skills deficit varies from place to place and often also between urban and rural settings.
Kihato observes that the institutional actors in the HMF sector are broadening to include materials suppliers and consumer credit companies in locations such as Uganda and South Africa55. Similar partnerships that create hybrid value chains may be possible in Africa where lenders face capacity constraints.
6.4 Construction Assistance
In the case of HMF, such pre‐disbursement assistance can notably include the following activities:
Basic construction design to ensure that the proposed intervention complies with basic safety and legal requirements;
Budget verification to ensure that the proposed cost estimate for the intervention is appropriate and matches the client’s loan request;
Guidance on materials and labor procurement, tapping into the provider’s knowledge of these markets to help clients make cost effective decisions; and
Assistance with permits and other legal requirements.
Within the realm of microenterprise lending, some MFIs also follow up, post‐disbursement, to ensure that clients use the loan for the approved purpose. In the case of HMF, this could be translated into the following activities:
Construction oversight to ensure that the builder/contractor faithfully executes the work for which has been hired; and
Verification that the construction has been completed in accordance with the MFI’s agreement with the client or in compliance with applicable law. If the MFI decides to internalize the provision of construction assistance, the qualification and composition of the relevant staff will depend on the extent of the service it plans to provide. MFIs that decide to contract out the provision of construction assistance should ensure that their contractors are technically competent, reliable, and honest. The client’s relationship is with the MFI, not
55 Kihato 2009
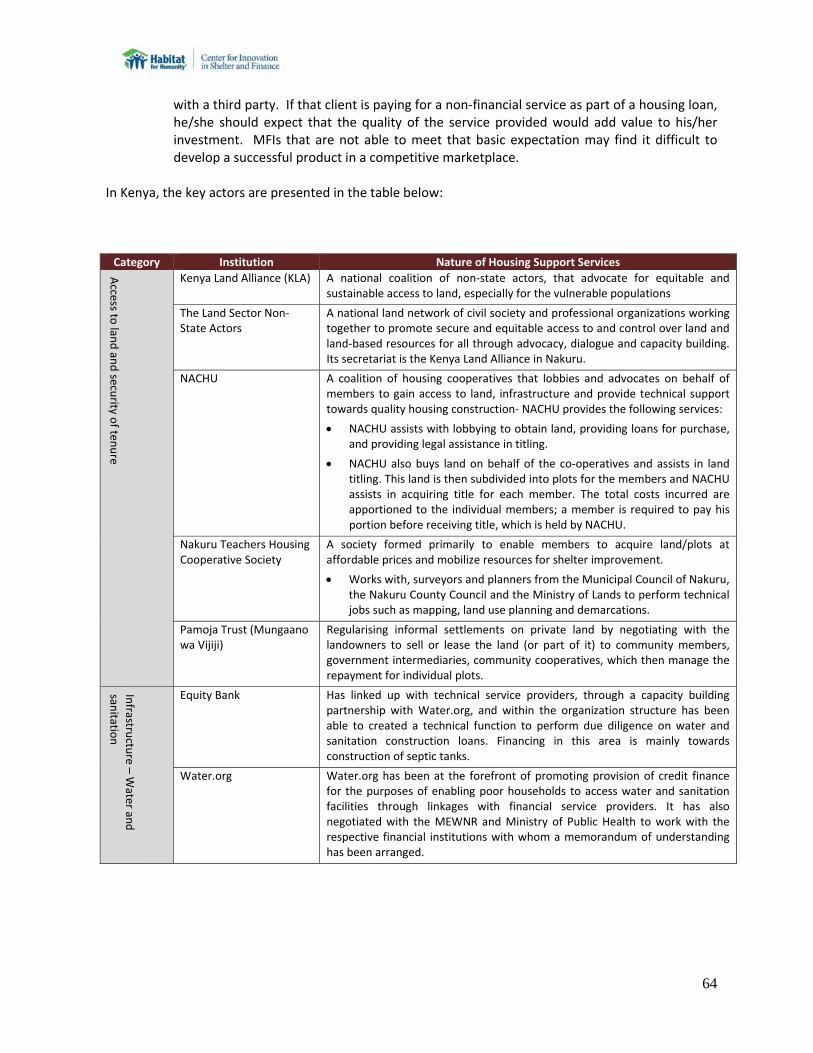
64
with a third party. If that client is paying for a non‐financial service as part of a housing loan, he/she should expect that the quality of the service provided would add value to his/her investment. MFIs that are not able to meet that basic expectation may find it difficult to develop a successful product in a competitive marketplace.
In Kenya, the key actors are presented in the table below:
Category Institution Nature of Housing Support Services
Access to
land an
d secu
rity of ten
ure
Kenya Land Alliance (KLA) A national coalition of non‐state actors, that advocate for equitable and sustainable access to land, especially for the vulnerable populations
The Land Sector Non‐State Actors
A national land network of civil society and professional organizations working together to promote secure and equitable access to and control over land and land‐based resources for all through advocacy, dialogue and capacity building. Its secretariat is the Kenya Land Alliance in Nakuru.
NACHU A coalition of housing cooperatives that lobbies and advocates on behalf of members to gain access to land, infrastructure and provide technical support towards quality housing construction‐ NACHU provides the following services:
NACHU assists with lobbying to obtain land, providing loans for purchase, and providing legal assistance in titling.
NACHU also buys land on behalf of the co‐operatives and assists in land titling. This land is then subdivided into plots for the members and NACHU assists in acquiring title for each member. The total costs incurred are apportioned to the individual members; a member is required to pay his portion before receiving title, which is held by NACHU.
Nakuru Teachers Housing Cooperative Society
A society formed primarily to enable members to acquire land/plots at affordable prices and mobilize resources for shelter improvement.
Works with, surveyors and planners from the Municipal Council of Nakuru, the Nakuru County Council and the Ministry of Lands to perform technical jobs such as mapping, land use planning and demarcations.
Pamoja Trust (Mungaano wa Vijiji)
Regularising informal settlements on private land by negotiating with the landowners to sell or lease the land (or part of it) to community members, government intermediaries, community cooperatives, which then manage the repayment for individual plots.
Infrastru
cture – W
ater and
sanitatio
n
Equity Bank Has linked up with technical service providers, through a capacity building partnership with Water.org, and within the organization structure has been able to created a technical function to perform due diligence on water and sanitation construction loans. Financing in this area is mainly towards construction of septic tanks.
Water.org Water.org has been at the forefront of promoting provision of credit finance for the purposes of enabling poor households to access water and sanitation facilities through linkages with financial service providers. It has also negotiated with the MEWNR and Ministry of Public Health to work with the respective financial institutions with whom a memorandum of understanding has been arranged.
65
7. KENYA LOW INCOME HOUSING MARKET SWOT ANALYSIS Strengths Strong Cooperative Movement and NGOs that over time have enjoyed depth of outreach among the
low income market segment, facilitating access to land and water.
A vibrant and well developed real estate market that has continuously been innovating for new technologies in penetrating the low income market segment
Existence of cement and roofing plants within Kenya, making access to the most expensive building materials cheaper
Various government efforts including revised Land Act, tax incentives for low income construction, decentralization of water management, unbundling of electricity transmission, distribution and generating demonstrates recognition of challenges in the housing sector.
Weaknesses Unequal access to and distribution of land resulting in 20% of the population occupying 80% of
residential land. Similar challenges with regards to electricity, water and sewage.
Multiple, complex land acquisition and tenure procedures and limited legal knowledge on land issues among the low income poor result in limited access, high cost, and tenuous tenure of land.
High degree of dependency on the informal market systems to complete the building process, hence compromising housing quality issues and land purchase and ownership issues
Dependency on local artisans, with limited knowledge of building codes and housing quality standards, thus keeping the low income earners within the cycle of low quality housing
Lack of information amongst the low income poor, thereby providing space for brokers, and artisans to distort the market system by charging highly for the services provided and being source of corruption and bureaucratic delays especially in having access to building permits
Highly speculative property market in Kenya creating inflationary tendencies with the market
Government efforts have largely been ineffective, prone to corruption or bureaucracy.
Opportunities Incremental building is done overtime, and each stage has its own budget. This is indicative of
financing products that match the incremental building time frame taking into consideration the construction stages.
Alternative technologies and techniques in building (such as interlocking bricks) can bring down the cost of construction.
New innovations in housing finance, such as bonds to attract patient capital, could facilitate the offer and reduce the cost of housing finance.
Micro‐franchising delivery systems are alternatives to micro financing. Various models have been tried elsewhere in the area of health (drug purchases) and such could be applied to suppliers of building materials.
Threats Ethnic rivalry more especially concerning access to land and security of tenure impede the rate at
which housing supply issues can be addressed.
Diminishing Community Trust lands through the process of adjudication, where individuals now obtain legal power to own and sell land, is slowly resulting in squatters residing on their own ancestral lands, breeding land‐based hostilities
Urbanization is high in Kenya, thereby slowly compounding the situation of housing shortage in Kenya and especially the cities.
66
8. CONCLUSIONS AND RECOMMENDATIONS
This report assesses the Kenyan HMF market is provided and presents value chains across the four dimensions of access to land and security of tenure, infrastructure (mainly connection to water and sanitation, and energy), housing construction, and access to community services. Also, the demand and supply gap to affordable HMF is analysed. The analysis illustrates the dynamics, impediments and opportunities for the provision of HMF services within the low income Kenyan market. Stemming from this, key conclusions include:
Given the complex nature of the land market in Kenya and related historical injustices combined with the ethnic inclinations, any new entrant in the HMF Market will need to first understand the cultural context within which HMF can be delivered.
Intention to buy a home does not always translate into opportunity for low‐income buyers. Speculators and investors are rampant in the Kenyan real estate market—snatching up homes and reselling them at higher prices. This will continue to be true as long as there is a shortage in the market.
Rapid growth in population and urbanisation and changing socio‐economic patterns in Kenya since the colonial days has resulted in a rapid increase in the demand for decent housing. The increased control of land allocation, ownership and transfers, by state actors at the local level in the past has led to a phenomenal growth of corrupt and uncontrolled development of informal settlements in major cities. These developments though politically recognized, are largely unplanned, and therefore un‐official. Although, being able to solve the problems of basic shelter, they do not constitute adequate housing. Adequate housing means privacy, useful per capita space, physical accessibility, physical security, and security of tenure, transportation within healthy local and citywide environments. Most of these requirements visibly lacking in the informal sector. Within the cities, there is visible deprivation of water supply, sanitation, roads, storm‐water drainage, electricity, public transport and so on.
The attempt to individualize land ownership through land adjudication and registration, originally with the intention of regularizing and controlling land use within a society that largely comprised pastoralists, led to a lot of confusion in a country that was familiar with communal land use. The land market became highly distorted and settlement patterns have been limited to the main urban centres, considered to have arable land. This land was formerly occupied by European settlers and now has large tracts of land owned by private individuals. This form land distribution has created a highly speculative land market characterised by high prices, thus excluding the low income class from land access. Within this context, 28% of the country’s population is landless.
Much focus lately has been in promoting the development of the mortgage market in Kenya, thus making Kenya’s real estate industry one of the most vibrant in East Africa. Government incentives have also done a lot to catalyse real estate development. However little attention has been paid to the low income segment especially in regard to promoting incremental building. City authorities may be reluctant to approve plans that involve piecemeal construction of houses, let alone occupying incomplete dwellings, if they were to enforce building codes to the letter.
Another important area that needs engagement with state authorities is the issue of infrastructure for housing. There have been examples of successfully funded infrastructure for HMF developments, for example Pamoja Trust through Mungaano wa Vijiji, and NACHU.
67
However, the costs of development of such infrastructure, often partly off‐grid, do increase the cost of the final development. Again, ways of working with the local state where the delivery of such infrastructure is part of a negotiated process.
Casual labourers, site porters, artisans, carpenters, plumbers and un‐certified electricians, represent a significant share of the low income home construction informal sector are very crucial in the building process. They make a considerable contribution to progressive building through the provision of technical assistance, guidance to sources of materials, and formulation of the construction budget. A great deal of money flows through this informal sector. Artisans offer convenient goods and services in quantities and fees which the poor can afford. The contracting process and terms of payment are not complicated, making it easy for the incremental builder to engage them. However researchers and policymakers have a limited understanding of the size and contribution of such an informal building labour force to the economy as a whole or of the problems which they face. Public policies, urban plans and local government bodies are often biased against such un‐certified construction labour.
There is a gap in supply of HMF for incremental building, both lending and savings. This is critical especially where roofing and finishing are some of the most expensive stages for the low income builder or end – user.
The most notable challenges in low income housing market is the informal nature of the construction process and the fact that local untrained artisans are pivotal to home construction in this market segment. This perpetuates poor quality and substandard low income houses and settlements. Incentives to ensure compliance to minimum standards of incremental construction need to be designed to enable skill upgrading and building standard upgrading with the informal construction sector. This can range from provision of building equipment like brick casting machines linked to new houses built by a particular and identifiable group of artisans that meet specific minimum quality standards. This could be an arrangement wholesomely spearheaded by the local authorities or partially done with non – state institutions.
Manufacturing materials on site is another way to reduce costs and also maintain more control over the construction process. This technique may not be appropriate for all developments, but should be considered when possible, especially in a context where materials acquisition can be fraught with delays and supply shortages. Construction financing can include provision leasing facilities for construction equipment. The most common alternative material in Kenya is interlocking bricks, a type of brick with grooves along the side that allow it to be quickly and cheaply assembled. Interlocking bricks can be made with local raw materials and decrease the need for expensive imported materials such as steel (the bricks often require only three inputs—soil, small amounts of cement, and water). ITDG through Practical Action are at the forefront in promoting such technologies. It will also be ideal to make available smaller packages of cement, since currently the size of a cement bag is 50 Kg costing nearly USD 8 dollars. Given that this study looked at low income poor within the bracket of USD 5‐10, this package tends to be exclusive.
Emerging from this, the following actions could support improved housing for low income.
1. Enhance information dissemination at the local level ‐ In order to ensure that people understand the changes with the new land legislation and their rights therein, there is need to collaborate with local institutions at grassroots level to interpret, and propagate information on new land laws and their implications regarding land management, conveyance, control, ownership and security of tenure. Once people at grassroots level are empowered it will help reduce
68
dependency on lawyers and “corridor land brokers” in pursuing matters related to land access, and obtaining titles.
2. Advocacy efforts to improve access to land‐ Advocacy messages need to hone in on the most urgent issues affecting access to land for low income homeowners. This includes streamlining contradictory laws and improving regulation of professionals administering land.
3. Improving quality of construction services available to the poor – No single intervention will be able to move the informal market to a standard quality, but there are various opportunities to address such challenges. These range from advocacy efforts to improve understanding among government officials on incremental building practices and adjusting building codes to this reality. It may also include efforts to establish certifications (government or private‐sector led) for artisans who meet minimum standards as well as ensuring that building materials meet certain quality standards. Alternative technologies ‐ such as interlocking bricks – may be promoted. And micro franchising may be an alternative model to ensure greater quality control.
4. Improving low income access to quality infrastructure ‐ This requires a multi‐dimensional approach focused on enabling the poor manage responsibly manage their infrastructure issues. NGO’s operate under the principle that all people have a right to control their own destiny, and this is an indication of potential collaboration towards responsible design of infrastructure facilities, within a neighbourhood, especially where local governments are weak in providing such services. WaterCredit.org focused on promoting access to credit services for water and sanitation facilities by engaging financial service providers to occupy this space. Experience has also indicated that the co‐operative model has advantages of reducing costs by acquiring land collectively, organizing community self‐help constructions, purchasing building materials in bulk and negotiating loans collectively. They can also foster community cohesion by facilitating opportunities to have access to infrastructure facilities at affordable levels. NACHU offers access to infrastructure loans like the Huduma Infrastructure loan that enables NACHU members to improve the physical infrastructure of their homes through installing electricity, water and sanitation facilities, sewerage systems, fencing, and roads.
5. Savings products ‐ Presently, there is a lack of savings products designed to support low income housing construction. Such products would include structured, targeted savings instruments which enable low income home owners to save toward specific stages of housing construction – possibly in coordination with local artisans.
6. Credit product ‐ Given that incremental building involves construction using a staged approach that is related to the budgeted cost of a housing building phase, there is a visible opportunity for designing loan products linked to a particular construction stage. During the study it was not possible to identify financial institutions offering such packages but it is an approach worth exploring. Traditional Group lending mechanisms have always enabled low income clients obtain access to larger loans using accumulated savings, collected through progressive smaller and compulsory amounts overt time, as a basis for graduation to larger loans. Borrowing from this approach, its highly possible stimulates a savings build up mechanism that may be used as a basis’ to access the larger loans related to a particular stage of construction like roofing.
7. Collaboration ‐ Given that there are multiple dimensions to the housing value chain, and multiple actors involved, partnerships and deliberate collaboration among actors is more likely to result in improved housing. In particular, any financial actor getting involved in HMF should be familiar with and involved in the various infrastructure, advocacy and information efforts affecting their investments.
69
8. Understand the cultural context Kenya is a multi‐ethnic and multi‐racial country. Land problems in Kenya and security of tenure are largely related to ethnicity, tribal loyalties and political driven ethnic related interests. Also housing solutions need to consider aspects of livelihood, for instance where affinity to pastoralism is crucial, and the preference for pastoral communities to engage in cattle keeping and nomadism where the solution could be construction of condominiums.
9. New innovations in financial instrument – tools such as bonds which can attract patient capital allow for affordable financing for institutions seeking to engage in HMF.
70
ANNEX 1 – BIBLIOGRAPHY Ashoka Innovators: Profile of Irfan Keshavjee‐ www.ashoka.org/fellow/irfan‐keshavjee
Ballance, T. and S. Tremolet. Private Sector Participation in Urban Water supply in Sub‐Sahara Africa. GTZ, 200.
Bonney, Laurie. Sustainable Value Chain Analysis: An Agri‐food Chain Diagnostic, UTAS, Kent Business School and The University of Queensland, 2009.
CIA World Factbook, 2013.
Doshi , Mona. The Land Laws Of Kenya: A Summary of the Changes, Nairobi: October 2012.
Ferguson, Bruce. Micro‐finance of Housing: A Key to Housing the Low or Moderate‐Income Majority? Environment and Urbanization, Vol. 11, No. 1, April 1999.
Ferguson, Bruce. A Value Chain Framework for Affordable Housing in Emerging Countries, Global Urban Development Magazine, November 2008.
Housing Support Service for Housing Microfinance Lending in East and Southern Africa Study, Rooftops Canada and Finmark Trust, 2010
Joint Monitoring Programme for Water Supply and Sanitation: Progress on Sanitation and Drinking‐Water ‐ 2013 Update, WHO/UNICEF: France, 2013.
Kenya Economic Profile Doing Business 2014 Report. The International Bank for Reconstruction and Development and The World Bank, 2013.
Kenya Population and Housing Census, Nairobi: Kenya National Bureau of Statistics. National Bureau of Statistics: Nairobi, 2009.
Kenya Water and Sanitation CSOs Network Website: www.kewasnet.org
Kihato, C. and Royston, L. Rethinking Emerging Land Markets in Rapidly Growing Southern African Cities, 2012.
Kisumu City Development Strategy, 2005‐2009, Report for the Urban Land Mark.
Annual Report & Financial Statements for the Year Ended 30 June 2009, Kenya Power Limited Company (KPLC): Nairobi, 2010.
Least‐Cost Power‐Development Plan Nairobi: Ministry of Energy, Government of Kenya: Nairobi, 2010.
Majale, Micheal and Mike Albu Livelihoods Among The Roofing Construction Subsector In Nakuru, Kenya (ITDG), 2001.
Mwangi E.. Property Rights and Governance of Africa's Rangelands: A Policy Overview. Natural Resources Forum 33, 160‐170, 2009.
Nyagah, Joseph W. N., Co‐Operatives as Potential Channel for Enhancing Financial Inclusion in Kenya, Abuja, 2012.
Omuodho, Peter. Legal Framework to Deal with Past Misdeeds Related to Land in Kenya. KatibaNews Issue No. 08.08, August ’06 Newsletter; Media Development Association: Nairobi, 2006.
71
Osano, Evans Makini, Value Chain Analysis: Kenya’s Cement and Electricity Sub‐Sectors Mastrict School of Management: Maastricht, Netherlands, 2008.
Paul Maurice Syagga, Land ownership and use in Kenya: Policy prescriptions from an inequality perspective, Society for International Development, East Africa , 2006
Sessional Paper No.3 of 2009 on National Land Policy Nairobi, Government Printer Republic of Kenya, Constitution: Nairobi, 2009.
Runda Water Limited Website‐ http://www.rundaestate.com
Sagya, Paul M. and Albert K. Mwenda. Political Economy and Governance Issues Surrounding Policy Interventions In The Land Sector In Kenya Final Report, 2010.
Situation Analysis of Informal Settlements in Kisumu, Cities without Slums and UN‐HABITAT, 2005.
State of the Worlds Cities 2010/2011: Bridging the Urban Divide. UN‐HABITAT: Nairobi, 2011.
Southall, Roger, The Ndugu Report: Land and Graft in Kenya: Review of African Economy, Volume 32, Issue, 103, pages 142‐151, 2005.
The GPOBA, News Release, 2011/02/GPOBA
The Kenyan Urban Sector Profile. UN‐Habitat, 2005.
The Sphere Handbook: Humanitarian Charter and Minimum Standards in Humanitarian Response, 2011.
The World DataBank. The World Bank: Washington, DC, 2012.
United Nations Children’s Fund and The World Health Organisation, UNICEF, WHO and UNAIDS, Children and AIDS: Country fact sheets: pg 69, United Nations: New York, 2008.
United Nations Population Division. World Urbanization Prospects, the 2011 Revision. United Nations, Department of Economic and Social Affairs, Population Division, New York, 2012.
United Nations Department of Economic and Social Affairs, Population Division 2011. World Population Prospects: The 2010 Revision. New York : United Nations Population Division, 2012
Van Noppen, Aden. The ABCs of Affordable Housing in Kenya, Acumen Fund, 201.
Veit, Peter. Government Control of Private Land Use in Kenya (Brief), May 2011.
Vision 2030, Kenya’s Development Blueprint, Nairobi, Government of Kenya, May, 2011.
Yannis, Arvanitis. African Housing Dynamics, Lessons from the Kenyan Market, Volume 4, Number 3, African Development Bank (ADB), 2013
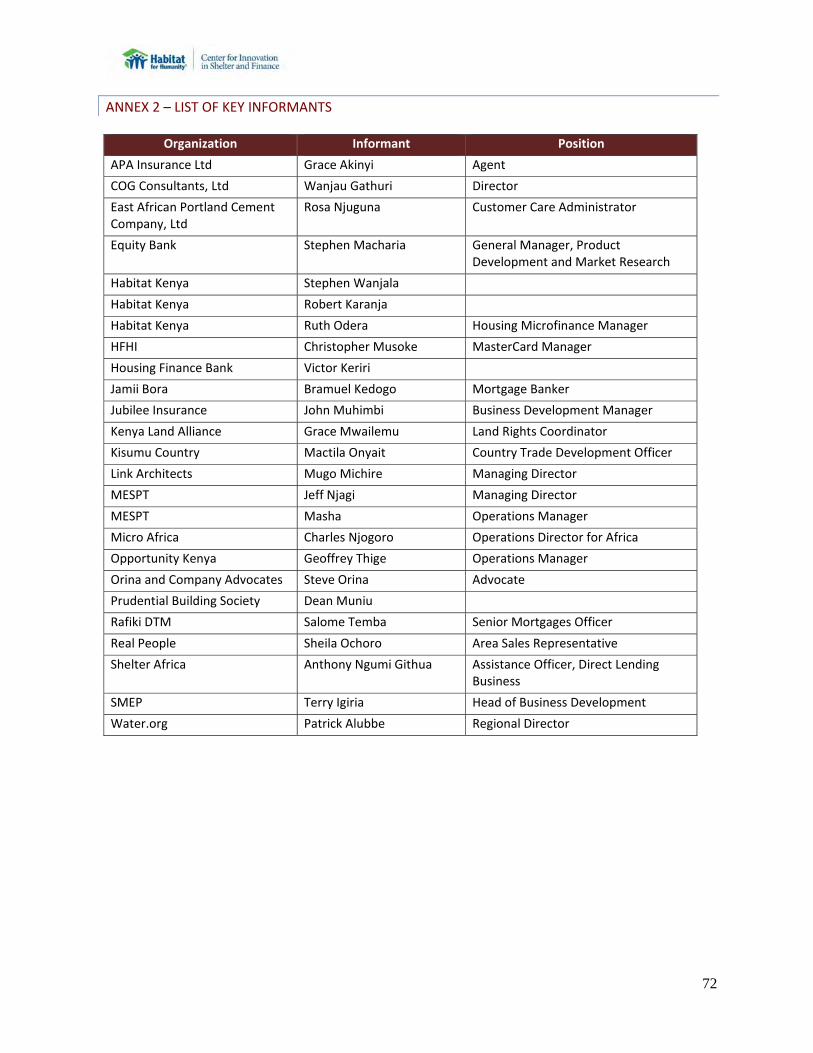
72
ANNEX 2 – LIST OF KEY INFORMANTS
Organization Informant Position
APA Insurance Ltd Grace Akinyi Agent
COG Consultants, Ltd Wanjau Gathuri Director
East African Portland Cement Company, Ltd
Rosa Njuguna Customer Care Administrator
Equity Bank Stephen Macharia General Manager, Product Development and Market Research
Habitat Kenya Stephen Wanjala
Habitat Kenya Robert Karanja
Habitat Kenya Ruth Odera Housing Microfinance Manager
HFHI Christopher Musoke MasterCard Manager
Housing Finance Bank Victor Keriri
Jamii Bora Bramuel Kedogo Mortgage Banker
Jubilee Insurance John Muhimbi Business Development Manager
Kenya Land Alliance Grace Mwailemu Land Rights Coordinator
Kisumu Country Mactila Onyait Country Trade Development Officer
Link Architects Mugo Michire Managing Director
MESPT Jeff Njagi Managing Director
MESPT Masha Operations Manager
Micro Africa Charles Njogoro Operations Director for Africa
Opportunity Kenya Geoffrey Thige Operations Manager
Orina and Company Advocates Steve Orina Advocate
Prudential Building Society Dean Muniu
Rafiki DTM Salome Temba Senior Mortgages Officer
Real People Sheila Ochoro Area Sales Representative
Shelter Africa Anthony Ngumi Githua Assistance Officer, Direct Lending Business
SMEP Terry Igiria Head of Business Development
Water.org Patrick Alubbe Regional Director
73
ANNEX 3 ‐ FOCUS GROUP DISCUSSION GUIDE Greetings! We are from Habitat for Humanity International involved in building for the low income in Kenya. We are interested in understanding the entire market and the people you deal with as you construct a house for an ordinary person. This is a dialogue where we expect your input as you share your experiences with us. The issues for discussion will focus on Land Acquisition, how you upgrade to land title, provision of infrastructure, house construction, other services like finance. We shall begin by introducing ourselves in regard to the business we do, how we acquired the house we live in, at what stage of completion it is, or whether we have land and nature of ownership at the moment, how old we are, and since when we acquired these properties.
A. Housing Construction Question Guide
(Using manila Cards) 1. Before you built your house, which people did you speak with – as in regard to your community Probe:
a. At conception of housing design b. Site preparation – ground breaking c. Confirmation of boundaries d. Purchase of materials e. Suppliers of materials f. Decisions of labour required
2. Tell us more about the other people and institutions apart from those discussed that you
personally have dealt with to have a complete house Probe: Please tell us more on what you think a complete house should have at the basic minimum?
3. We now are very clear of the people and institutions we have had to deal with to build, please
tell us more about the services each of these provide to us. Probe: their Key roles and whether they work directly with end user or through another person. What are the costs of their services?
4. What makes such people/institutions very special to you, as you build?
Probes: a. Are their substitutes? Which are these? When do you use them? b. Why do you regard the above people/institutions very special to you
i. Is it Cost ii. Flexibility in terms iii. Distance iv. Level of knowledge v. Ease of access
5. What rules govern your relationship with these people?
Probe on Terms of engagement – Credit or cash, termination of contract, warranties, technical after sales support etc.
74
6: In your experience, what do you think is not working well as much as you deal with these people or institutions? What is their shortcoming?
Probe:
Of the shortcomings you have mentioned which of them do you think you can personally control and get them to improve and how?
Which of the shortcomings do you think require other people to support you overcome them? Which are these people and how do you think they can help?
B. Financing of Housing construction:
We now would like to understand more about the financing of you housing construction:
i. In your personal experiences, what have been the most critical stages or phases in constructing that have given you the highest financial pressure?
ii. We are now going to request to use these cards to rank the stages in terms of ability to finance them on daily, weekly, monthly, seasonal and annual basis.
iii. For each of these can you kindly tell us what your sources of finance have been?
Probe:
List the financing mechanisms (people/institutions)
Frequency of use
Amount or quantity of funds
Terms of engagement
C. Enabling Environment & Other Support Services
i. Of what importance to you are the government departments and representatives been of use to you as undergo housing construction?
ii. What other institutions have been of help to you? Probe:
Which services do they provide?
Under what terms are these services provided?
How are there services accessed?
What are their shortcomings? Thank you very much and for the next steps we are going to use this information to engage various stakeholders such that we improve the delivery of Housing support services for low income communities in this country. We are indeed grateful for this precious time of yours accorded to us. Do have any questions for us? *‐‐‐‐‐‐‐‐‐‐‐‐‐‐‐‐‐‐‐‐‐‐‐‐‐‐‐‐‐‐‐‐‐‐‐‐‐‐‐‐‐‐‐‐‐‐‐‐‐‐‐‐END‐‐‐‐‐‐‐‐‐‐‐‐‐‐‐‐‐‐‐‐‐‐‐‐‐‐‐‐‐‐‐‐‐‐‐‐‐‐‐‐‐‐‐‐‐‐‐*
75
ANNEX 4 – ARTISAN INTERVIEW GUIDE
Artisan Question Guide For how long have you been in the area and what is your specialty? Are you registered or licensed and what is your level of education? Time trend analysis: Tracing market changes in Building material institutions
Let artisans list dominant institutions providing Building materials for builders in Nakuru
(Screen them according to those that serve the low income segment)
Trace those that existed 5 years ago, 2 years ago and today
What changes have taken place in legal environment that has shifted exit of suppliers,
What changes have led to people’s choices of materials
What changes have led to people’s choice of homes
What changes have led to the building technology
Are there any changes in the target market you serve?
Any demands on your job over time?
To what extent are you still in control of the building process?
What resources are abundant?
What resources are scarce and desired?
Which government organizations/institutions/groups are working in or with the community?
Which institutions/groups do the villagers regard as most important, and why?
Which groups are addressing household construction needs?
Which organizations work together?
What are the busiest months of the year?
What are the key challenges related to you work and what kind of support do you require to
overcome these challenges? Which organizations have you linked up with to support your
work?
What level of education required to do this job?
What kind of registration or license is required to do this job?
Are there any losses you envisage on this job? Which are these and how have been able to
provide remedies for them? Which people or institutions help you to manage such losses?
How often do they occur?