Embed Size (px)
Citation preview
RESEARCH DATA SERVICES, INC. 405 NORTH REO STREET • SUITE 100
TAMPA, FLORIDA 33609 TEL (813) 254-2975 • FAX (813) 254-2986
TOLL FREE (800) 330-6584
November 2006 Visitor Profile – The Beaches of Fort Myers - Sanibel
Sanibel & Captiva Islands, Fort Myers Beach, Fort Myers, Bonita Springs & Estero,
Cape Coral, Pine Island, Boca Grande & Outer Islands, North Fort Myers, Lehigh Acres.
Prepared for:
Lee County Board of County Commissioners and
Lee County Visitor and Convention Bureau
Prepared by:
Walter J. Klages, Ph.D. President
Research Data Services, Inc. www.KlagesGroup.com
January 5, 2006
Lee County November 2006 Visitor Profile
Research Data Services, Inc. Page 1 November 2006 Visitor Profile © Copyright 2006. All Rights Reserved. FCD – T
www.KlagesGroup.com
Executive Summary: November 2006
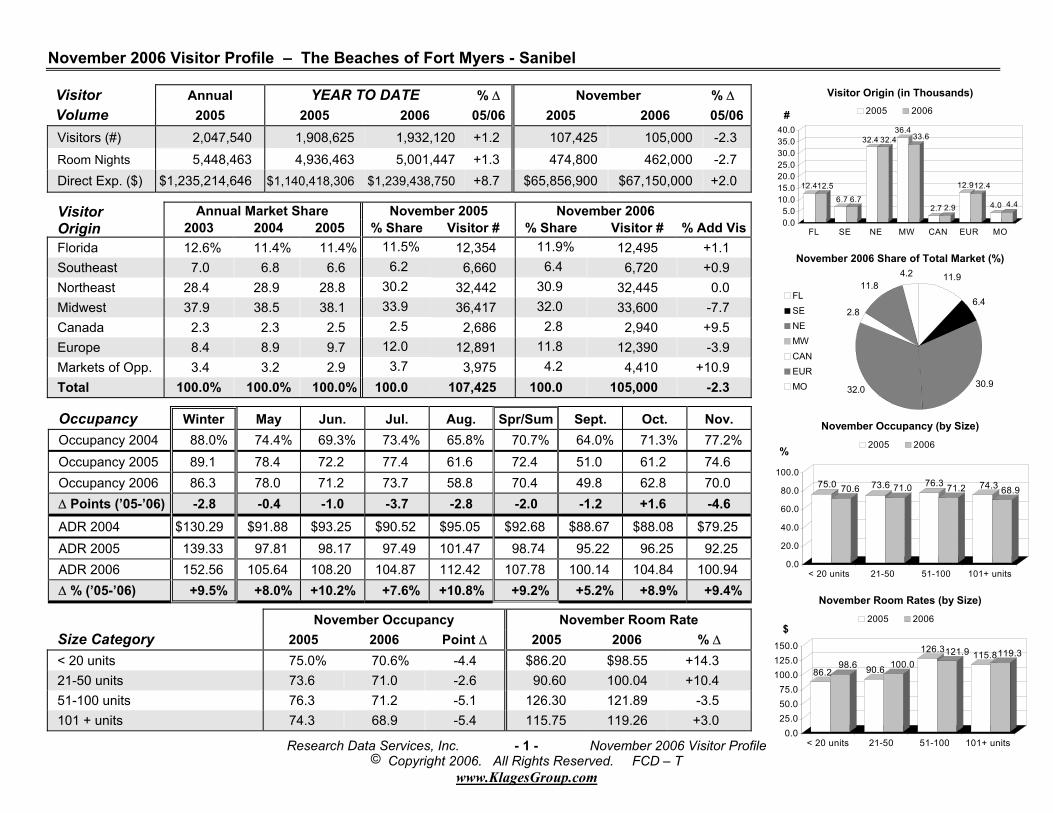
1. The month of November saw occupancy contractions throughout most of Florida’s Gulf Coast beach destinations. In Lee, lodging occupancy dropped by 4.6 points, while ADR surged by 9.4%. Much of this scenario relates to the November national elections, as well as factors such as unseasonably cold weather, water quality issues, and facility renovations. Despite these contractions, compared to November 2005, Lee’s tourism industry added $2.2 million additional dollars to the destination’s economic activity level (Total Economic Impact 2005: $110,619,835; 2006: $112,791,855).
2. November 2006 saw 105,000 visitors staying at commercial lodgings in Lee. The geographic origins of these visitors (by market segment) are as follows:
November 2005 2006 Visitor Segments Visitor # Visitor # % ∆ Florida 12,354 12,495 + 1.1 Southeast 6,660 6,720 + 0.9 Northeast 32,442 32,445 0.0 Midwest 36,417 33,600 - 7.7 Canada 2,686 2,940 + 9.5 Europe 12,891 12,390 - 3.9 Markets of Opportunity 3,975 4,410 +10.9
Total 107,425 105,000 - 2.3
3. This month, fully 68.9% of travelers to Lee County are repeat visitors to the destination (2005: 63.2%) and 49.2% of all visitors say they will come back next year (2005: 49.7%). Consumer loyalty born from prior positive experiences at the Beaches of Fort Myers - Sanibel is a major stabilizing factor for Lee’s tourism industry. Importantly, repeat visitation in this group is driven at better than the 60% level by promotional and Internet information about the destination.
Lee County November 2006 Visitor Profile
Research Data Services, Inc. Page 2 November 2006 Visitor Profile © Copyright 2006. All Rights Reserved. FCD – T
www.KlagesGroup.com
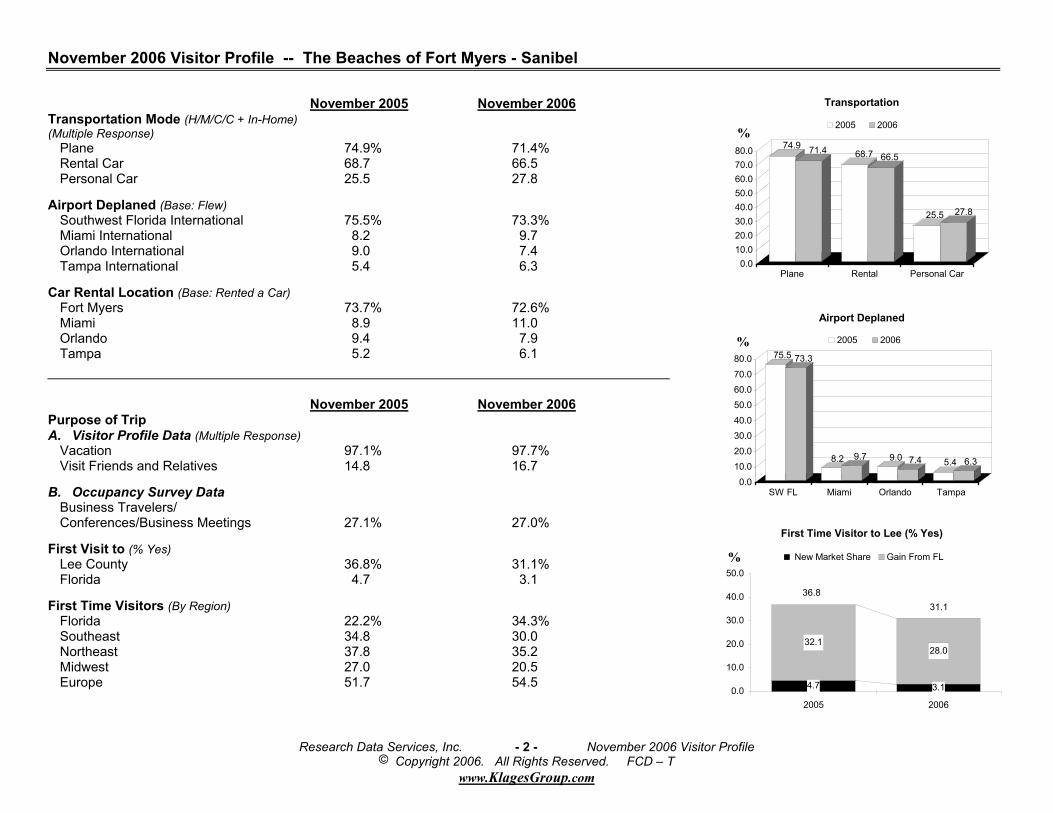
4. While some 27.8% of Lee’s November visitors drove to the destination, air travel remains the primary mode of transportation for the majority (2005: 74.9%; 2006: 71.4%).
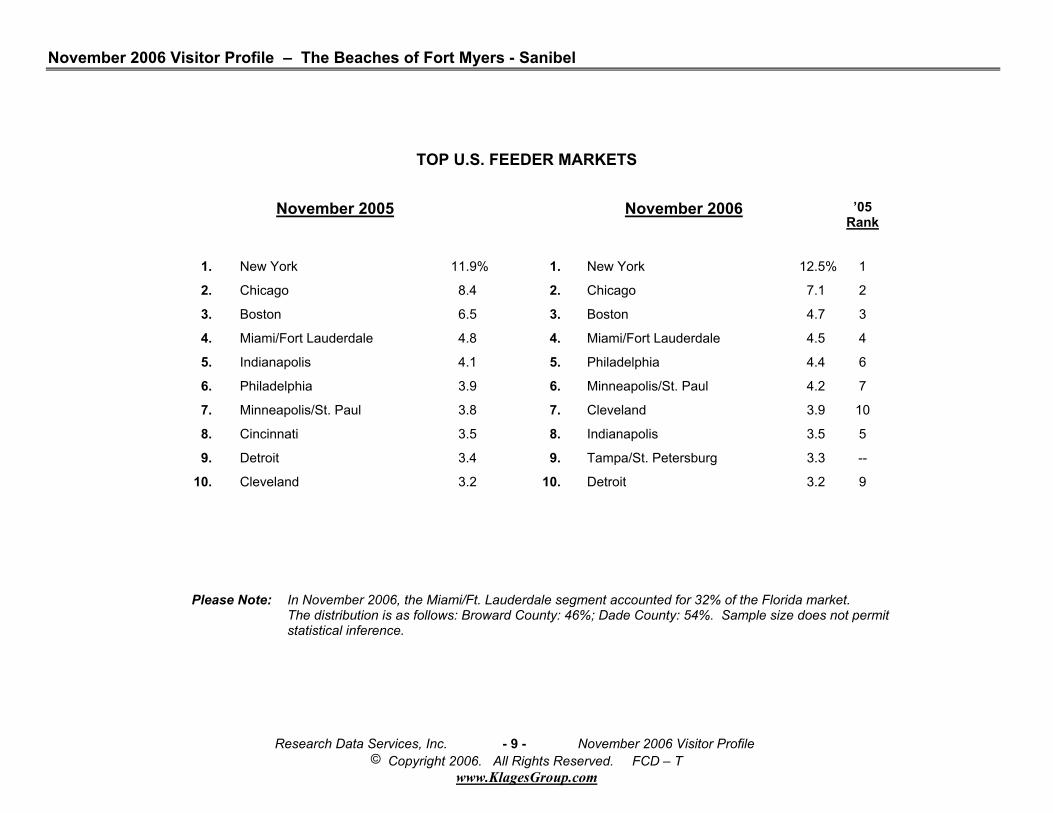
5. Lee’s November visitors were drawn from the following top DMA’s (in rank order):
November 2005 November 2006 ’05 Rank
1. New York 11.9% 1. New York 12.5% 1 2. Chicago 8.4 2. Chicago 7.1 2 3. Boston 6.5 3. Boston 4.7 3 4. Miami/Fort Lauderdale 4.8 4. Miami/Fort Lauderdale 4.5 4 5. Indianapolis 4.1 5. Philadelphia 4.4 6 6. Philadelphia 3.9 6. Minneapolis/St. Paul 4.2 7 7. Minneapolis/St. Paul 3.8 7. Cleveland 3.9 10 8. Cincinnati 3.5 8. Indianapolis 3.5 5 9. Detroit 3.4 9. Tampa/St. Petersburg 3.3 --
10. Cleveland 3.2 10. Detroit 3.2 9
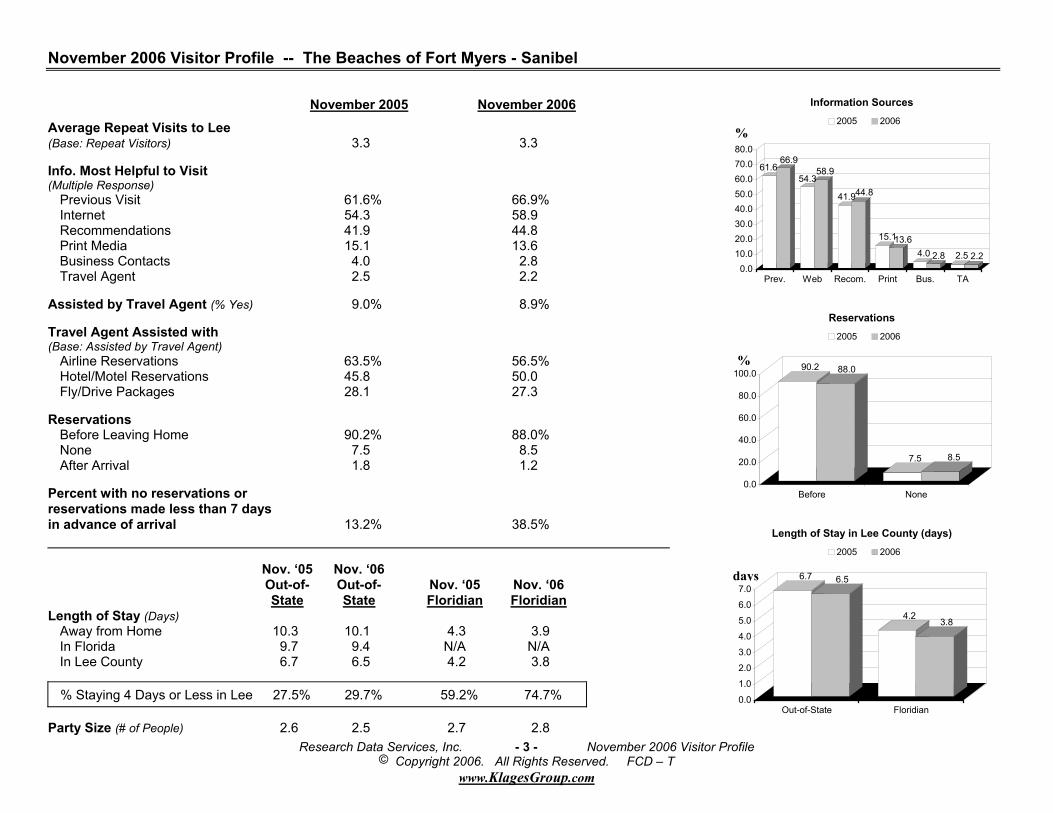
6. The reservation window lead time remains narrow. November’s MANAGEMENT BAROMETER documents
that nearly two of every five visitors (38.5%) had no reservations or made them within seven (7) days of arriving in Lee (2005: 13.5%).
7. This November, almost nine of every ten visitors (89.9%) report Internet access. A majority of these (81.9%)
retrieve travel information. Moreover, some 72.8% of the Internet users buy travel services on the Web, with 48.2% of these saying they are booking lodging via the Internet.
November 2006 Visitor Profile – The Beaches of Fort Myers - Sanibel
Research Data Services, Inc. - * - November 2006 Visitor Profile © Copyright 2006 All Rights Reserved. FCD – T
www.KlagesGroup.com
The Beaches of Fort Myers - Sanibel: 2006 November Visitor Profile
November 2006 Visitor Profile – The Beaches of Fort Myers - Sanibel
Research Data Services, Inc. - 1 - November 2006 Visitor Profile
© Copyright 2006. All Rights Reserved. FCD – T www.KlagesGroup.com
Visitor Origin (in Thousands)
12.412.5
6.7 6.7
32.4 32.436.4
33.6
2.7 2.9
12.912.4
4.0 4.4
0.05.0
10.015.020.025.030.035.040.0
#
FL SE NE MW CAN EUR MO
2005 2006
November Room Rates (by Size)
86.298.6 90.6 100.0
126.3121.9 115.8119.3
0.025.050.075.0
100.0125.0150.0
$
< 20 units 21-50 51-100 101+ units
2005 2006
November Occupancy November Room Rate Size Category 2005 2006 Point ∆ 2005 2006 % ∆ < 20 units 75.0% 70.6% -4.4 $86.20 $98.55 +14.3 21-50 units 73.6 71.0 -2.6 90.60 100.04 +10.4 51-100 units 76.3 71.2 -5.1 126.30 121.89 -3.5 101 + units 74.3 68.9 -5.4 115.75 119.26 +3.0
November 2006 Share of Total Market (%) 11.9
6.4
30.932.0
2.8
11.84.2
FLSENEMWCANEURMO
Occupancy Winter May Jun. Jul. Aug. Spr/Sum Sept. Oct. Nov. Occupancy 2004 88.0% 74.4% 69.3% 73.4% 65.8% 70.7% 64.0% 71.3% 77.2% Occupancy 2005 89.1 78.4 72.2 77.4 61.6 72.4 51.0 61.2 74.6 Occupancy 2006 86.3 78.0 71.2 73.7 58.8 70.4 49.8 62.8 70.0 ∆ Points (’05-’06) -2.8 -0.4 -1.0 -3.7 -2.8 -2.0 -1.2 +1.6 -4.6 ADR 2004 $130.29 $91.88 $93.25 $90.52 $95.05 $92.68 $88.67 $88.08 $79.25 ADR 2005 139.33 97.81 98.17 97.49 101.47 98.74 95.22 96.25 92.25 ADR 2006 152.56 105.64 108.20 104.87 112.42 107.78 100.14 104.84 100.94 ∆ % (’05-’06) +9.5% +8.0% +10.2% +7.6% +10.8% +9.2% +5.2% +8.9% +9.4%
Visitor Annual Market Share November 2005 November 2006 Origin 2003 2004 2005 % Share Visitor # % Share Visitor # % Add VisFlorida 12.6% 11.4% 11.4% 11.5% 12,354 11.9% 12,495 +1.1 Southeast 7.0 6.8 6.6 6.2 6,660 6.4 6,720 +0.9 Northeast 28.4 28.9 28.8 30.2 32,442 30.9 32,445 0.0 Midwest 37.9 38.5 38.1 33.9 36,417 32.0 33,600 -7.7 Canada 2.3 2.3 2.5 2.5 2,686 2.8 2,940 +9.5 Europe 8.4 8.9 9.7 12.0 12,891 11.8 12,390 -3.9 Markets of Opp. 3.4 3.2 2.9 3.7 3,975 4.2 4,410 +10.9 Total 100.0% 100.0% 100.0% 100.0 107,425 100.0 105,000 -2.3
Visitor Annual YEAR TO DATE % ∆ November % ∆ Volume 2005 2005 2006 05/06 2005 2006 05/06Visitors (#) 2,047,540 1,908,625 1,932,120 +1.2 107,425 105,000 -2.3 Room Nights 5,448,463 4,936,463 5,001,447 +1.3 474,800 462,000 -2.7 Direct Exp. ($) $1,235,214,646 $1,140,418,306 $1,239,438,750 +8.7 $65,856,900 $67,150,000 +2.0
November Occupancy (by Size)
75.0 70.6 73.6 71.0 76.3 71.2 74.3 68.9
0.0
20.0
40.0
60.0
80.0
100.0
%
< 20 units 21-50 51-100 101+ units
2005 2006
November 2006 Visitor Profile -- The Beaches of Fort Myers - Sanibel
Research Data Services, Inc. - 2 - November 2006 Visitor Profile © Copyright 2006. All Rights Reserved. FCD – T
www.KlagesGroup.com
November 2005 November 2006 Transportation Mode (H/M/C/C + In-Home) (Multiple Response) Plane 74.9% 71.4% Rental Car 68.7 66.5 Personal Car 25.5 27.8 Airport Deplaned (Base: Flew) Southwest Florida International 75.5% 73.3% Miami International 8.2 9.7 Orlando International 9.0 7.4 Tampa International 5.4 6.3 Car Rental Location (Base: Rented a Car) Fort Myers 73.7% 72.6% Miami 8.9 11.0 Orlando 9.4 7.9 Tampa 5.2 6.1 November 2005 November 2006 Purpose of Trip A. Visitor Profile Data (Multiple Response) Vacation 97.1% 97.7% Visit Friends and Relatives 14.8 16.7 B. Occupancy Survey Data Business Travelers/ Conferences/Business Meetings 27.1% 27.0% First Visit to (% Yes) Lee County 36.8% 31.1% Florida 4.7 3.1 First Time Visitors (By Region) Florida 22.2% 34.3% Southeast 34.8 30.0 Northeast 37.8 35.2 Midwest 27.0 20.5 Europe 51.7 54.5
Transportation
74.9 71.4 68.7 66.5
25.5 27.8
0.010.020.030.040.050.060.070.080.0
Plane Rental Personal Car
2005 2006
Airport Deplaned
75.5 73.3
8.2 9.7 9.0 7.4 5.4 6.3
0.0
10.020.0
30.040.0
50.060.070.0
80.0
SW FL Miami Orlando Tampa
2005 2006
First Time Visitor to Lee (% Yes)
4.7 3.1
28.032.1
0.0
10.0
20.0
30.0
40.0
50.0
2005 2006
New Market Share Gain From FL
31.136.8
%
%
%
November 2006 Visitor Profile -- The Beaches of Fort Myers - Sanibel
Research Data Services, Inc. - 3 - November 2006 Visitor Profile © Copyright 2006. All Rights Reserved. FCD – T
www.KlagesGroup.com
November 2005 November 2006
Average Repeat Visits to Lee (Base: Repeat Visitors) 3.3 3.3 Info. Most Helpful to Visit (Multiple Response) Previous Visit 61.6% 66.9% Internet 54.3 58.9 Recommendations 41.9 44.8 Print Media 15.1 13.6 Business Contacts 4.0 2.8 Travel Agent 2.5 2.2 Assisted by Travel Agent (% Yes) 9.0% 8.9% Travel Agent Assisted with (Base: Assisted by Travel Agent) Airline Reservations 63.5% 56.5% Hotel/Motel Reservations 45.8 50.0 Fly/Drive Packages 28.1 27.3 Reservations Before Leaving Home 90.2% 88.0% None 7.5 8.5 After Arrival 1.8 1.2 Percent with no reservations or reservations made less than 7 days in advance of arrival 13.2% 38.5% Nov. ‘05 Nov. ‘06 Out-of- Out-of- Nov. ‘05 Nov. ‘06 State State Floridian Floridian Length of Stay (Days) Away from Home 10.3 10.1 4.3 3.9 In Florida 9.7 9.4 N/A N/A In Lee County 6.7 6.5 4.2 3.8
% Staying 4 Days or Less in Lee 27.5% 29.7% 59.2% 74.7% Party Size (# of People) 2.6 2.5 2.7 2.8
Information Sources
61.666.9
54.358.9
41.944.8
15.113.64.0 2.8 2.5 2.2
0.010.020.030.040.050.060.070.080.0
Prev. Web Recom. Print Bus. TA
2005 2006
Reservations
90.2 88.0
7.5 8.5
0.0
20.0
40.0
60.0
80.0
100.0
Before None
2005 2006
Length of Stay in Lee County (days)
6.7 6.5
4.23.8
0.0
1.0
2.0
3.0
4.0
5.0
6.0
7.0
Out-of-State Floridian
2005 2006
%
%
days
November 2006 Visitor Profile -- The Beaches of Fort Myers - Sanibel
Research Data Services, Inc. - 4 - November 2006 Visitor Profile © Copyright 2006. All Rights Reserved. FCD – T
www.KlagesGroup.com
November 2005 November 2006 Party Composition Couple (Traveling without Children) 70.9% 72.6% Family 25.2 23.9 Single 4.2 3.6
Where Stay Night Before Lee At Home 71.1% 70.4% In Florida, Not in Lee 23.0 24.6 On the Road, Not in Florida 5.9 5.0
Where Stayed in Florida (Base: Respondents In Florida Night Prior to Lee) Orlando/Disney 21.5% 25.2% Tampa Bay 10.0 14.7 Miami 13.6 9.7 Fort Lauderdale/Palm Beach 7.6 9.5 Sarasota 8.7 8.5 Naples/Marco 4.9 6.9 Florida Keys 5.1 6.5
Attractions Visited (Multiple Response) Kennedy Space Center 6.0% 6.3% Edison Home/Ford Home 5.7 6.1 Ding Darling 5.4 4.2 Sea World 6.2 4.1 EPCOT 4.8 4.0 Universal Studios 5.6 3.8 Disney 3.7 2.4
Satisfaction with Lee County Very Satisfied 82.3% 83.2% Satisfied 17.1 16.6 Satisfaction Level (Very Satisfied + Satisfied) 99.4% 99.8%
Party Composition
70.9 72.6
25.2 23.9
4.2 3.6
0.0
15.0
30.0
45.0
60.0
75.0
90.0
Couple Family Single
2005 2006
Where Stay Night Before Lee
71.1 70.4
23.0 24.6
5.9 5.0
0.010.020.030.040.050.060.070.080.0
At Home In FL Not Lee On Road
2005 2006
Attractions Visited (Top Five)
6.0 6.35.7
6.15.4
4.2
6.2
4.14.8
4.0
0.0
2.0
4.0
6.0
8.0
Kennedy Edison Ding Darling Sea World EPCOT
2005 2006%
%
%
November 2006 Visitor Profile -- The Beaches of Fort Myers - Sanibel
Research Data Services, Inc. - 5 - November 2006 Visitor Profile © Copyright 2006. All Rights Reserved. FCD – T
www.KlagesGroup.com
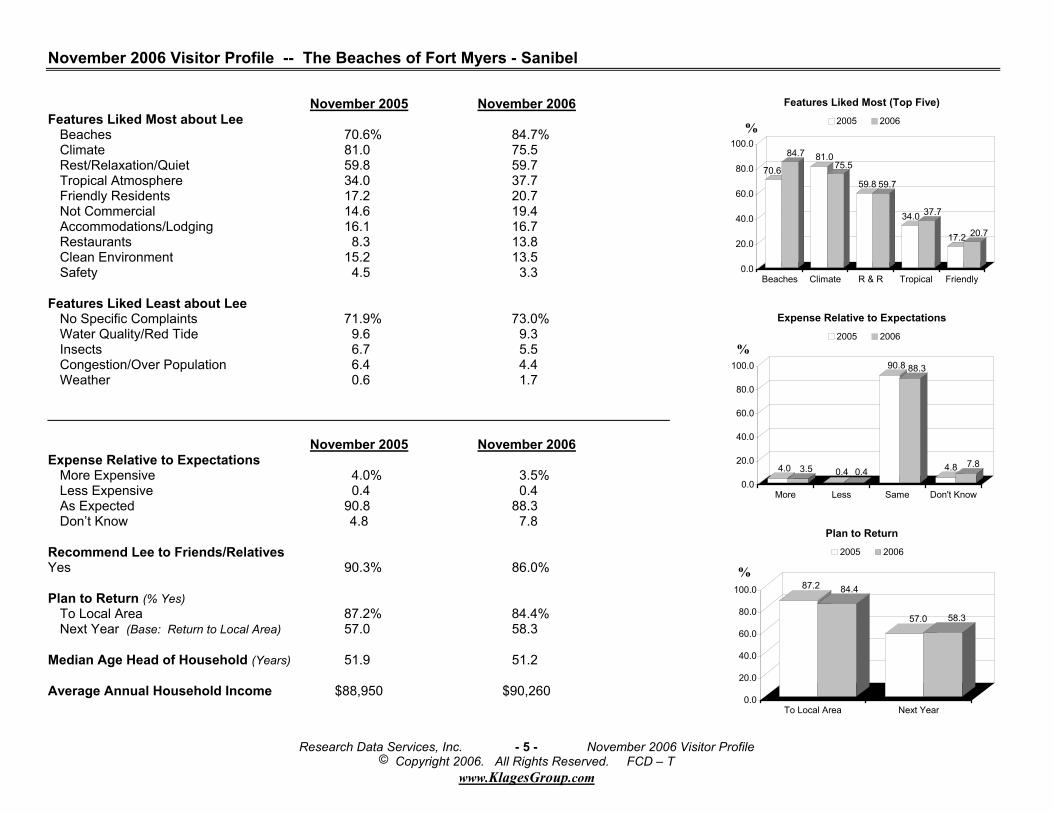
November 2005 November 2006 Features Liked Most about Lee Beaches 70.6% 84.7% Climate 81.0 75.5 Rest/Relaxation/Quiet 59.8 59.7 Tropical Atmosphere 34.0 37.7 Friendly Residents 17.2 20.7 Not Commercial 14.6 19.4 Accommodations/Lodging 16.1 16.7 Restaurants 8.3 13.8 Clean Environment 15.2 13.5 Safety 4.5 3.3 Features Liked Least about Lee No Specific Complaints 71.9% 73.0% Water Quality/Red Tide 9.6 9.3 Insects 6.7 5.5 Congestion/Over Population 6.4 4.4 Weather 0.6 1.7
November 2005 November 2006 Expense Relative to Expectations More Expensive 4.0% 3.5% Less Expensive 0.4 0.4 As Expected 90.8 88.3 Don’t Know 4.8 7.8 Recommend Lee to Friends/Relatives Yes 90.3% 86.0% Plan to Return (% Yes) To Local Area 87.2% 84.4% Next Year (Base: Return to Local Area) 57.0 58.3 Median Age Head of Household (Years) 51.9 51.2 Average Annual Household Income $88,950 $90,260
Features Liked Most (Top Five)
70.6
84.7 81.075.5
59.8 59.7
34.0 37.7
17.2 20.7
0.0
20.0
40.0
60.0
80.0
100.0
Beaches Climate R & R Tropical Friendly
2005 2006
Expense Relative to Expectations
4.0 3.5 0.4 0.4
90.8 88.3
4.8 7.8
0.0
20.0
40.0
60.0
80.0
100.0
More Less Same Don't Know
2005 2006
Plan to Return
87.2 84.4
57.0 58.3
0.0
20.0
40.0
60.0
80.0
100.0
To Local Area Next Year
2005 2006
%
%
%
November 2006 Visitor Profile -- The Beaches of Fort Myers - Sanibel
Research Data Services, Inc. - 6 - November 2006 Visitor Profile © Copyright 2006. All Rights Reserved. FCD – T
www.KlagesGroup.com
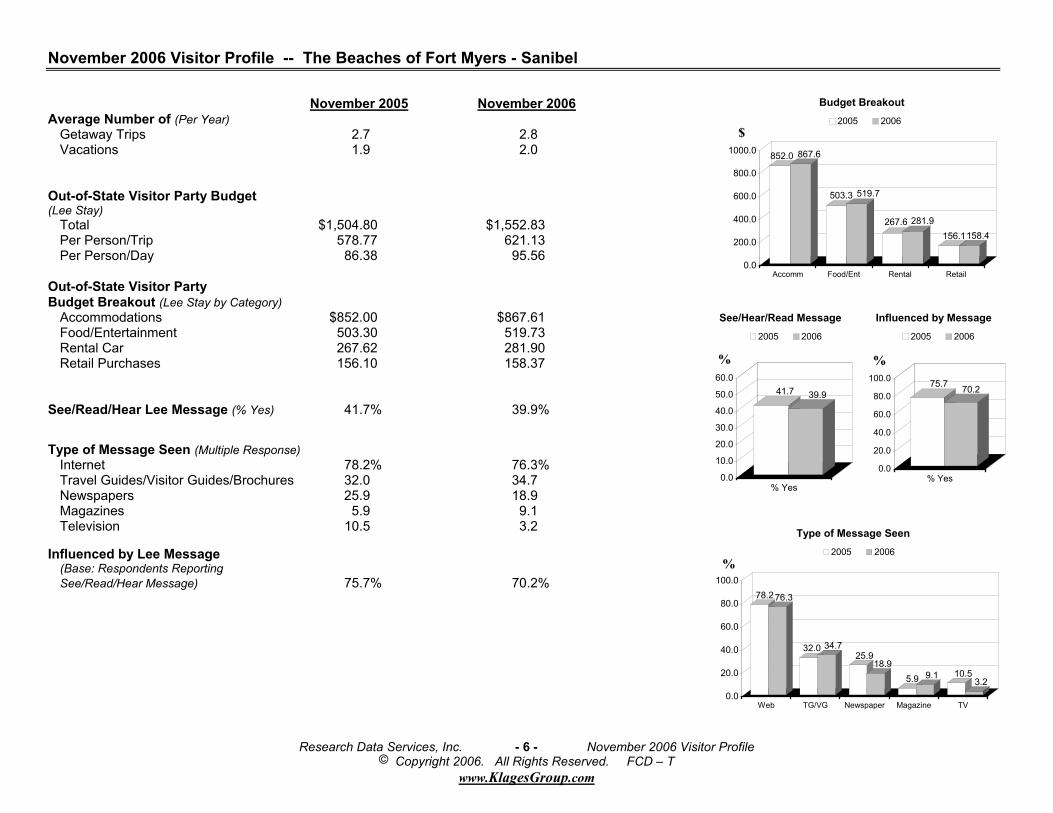
November 2005 November 2006 Average Number of (Per Year) Getaway Trips 2.7 2.8 Vacations 1.9 2.0 Out-of-State Visitor Party Budget (Lee Stay) Total $1,504.80 $1,552.83 Per Person/Trip 578.77 621.13 Per Person/Day 86.38 95.56 Out-of-State Visitor Party Budget Breakout (Lee Stay by Category) Accommodations $852.00 $867.61 Food/Entertainment 503.30 519.73 Rental Car 267.62 281.90 Retail Purchases 156.10 158.37 See/Read/Hear Lee Message (% Yes) 41.7% 39.9% Type of Message Seen (Multiple Response) Internet 78.2% 76.3% Travel Guides/Visitor Guides/Brochures 32.0 34.7 Newspapers 25.9 18.9 Magazines 5.9 9.1 Television 10.5 3.2 Influenced by Lee Message (Base: Respondents Reporting See/Read/Hear Message) 75.7% 70.2%
Budget Breakout
852.0 867.6
503.3 519.7
267.6 281.9156.1158.4
0.0
200.0
400.0
600.0
800.0
1000.0
Accomm Food/Ent Rental Retail
2005 2006
See/Hear/Read Message
41.7 39.9
0.0
10.0
20.0
30.0
40.0
50.0
60.0
% Yes
2005 2006
Influenced by Message
75.7 70.2
0.0
20.0
40.0
60.0
80.0
100.0
% Yes
2005 2006
Type of Message Seen
78.276.3
32.0 34.725.9
18.95.9 9.1 10.5
3.20.0
20.0
40.0
60.0
80.0
100.0
Web TG/VG Newspaper Magazine TV
2005 2006
%%
$
%
November 2006 Visitor Profile -- The Beaches of Fort Myers - Sanibel
Research Data Services, Inc. - 7 - November 2006 Visitor Profile © Copyright 2006. All Rights Reserved. FCD – T
www.KlagesGroup.com
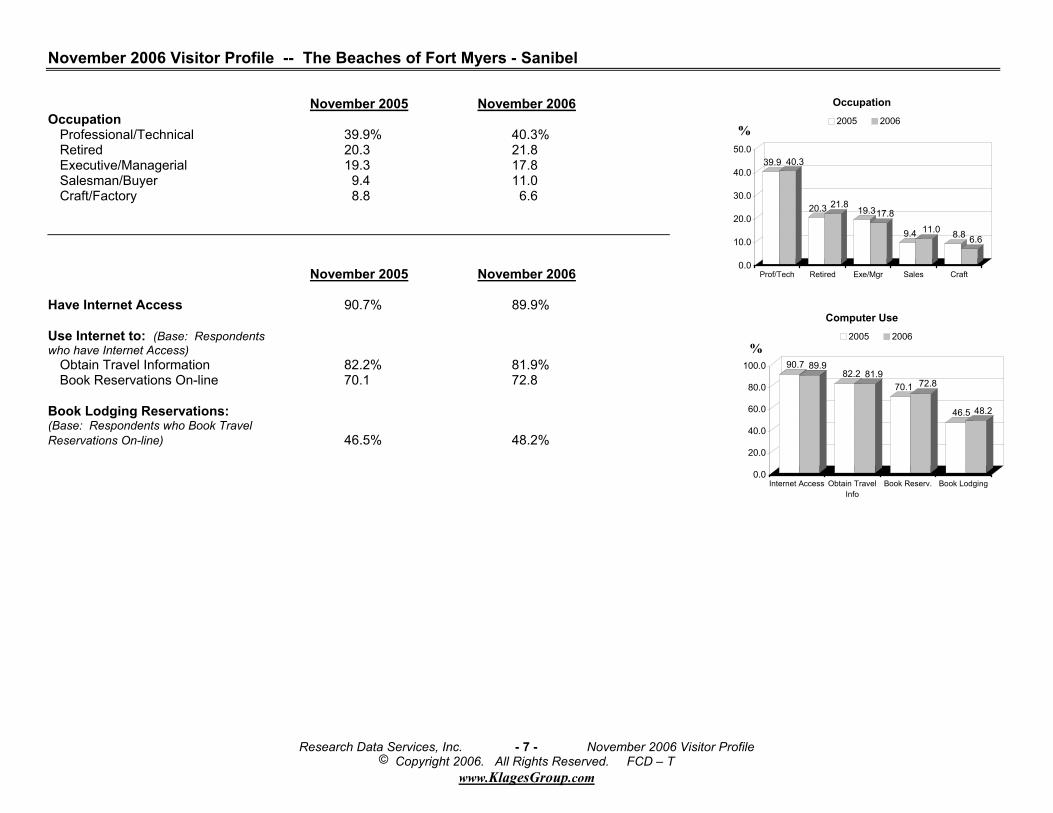
November 2005 November 2006 Occupation Professional/Technical 39.9% 40.3% Retired 20.3 21.8 Executive/Managerial 19.3 17.8 Salesman/Buyer 9.4 11.0 Craft/Factory 8.8 6.6 November 2005 November 2006 Have Internet Access 90.7% 89.9% Use Internet to: (Base: Respondents who have Internet Access) Obtain Travel Information 82.2% 81.9% Book Reservations On-line 70.1 72.8 Book Lodging Reservations: (Base: Respondents who Book Travel Reservations On-line) 46.5% 48.2%
Occupation
39.9 40.3
20.3 21.819.317.8
9.4 11.0 8.8 6.6
0.0
10.0
20.0
30.0
40.0
50.0
Prof/Tech Retired Exe/Mgr Sales Craft
2005 2006
Computer Use
90.7 89.982.2 81.9
70.1 72.8
46.5 48.2
0.0
20.0
40.0
60.0
80.0
100.0
Internet Access Obtain TravelInfo
Book Reserv. Book Lodging
2005 2006%
%
November 2006 Visitor Profile – The Beaches of Fort Myers - Sanibel
Research Data Services, Inc. - 8 - November 2006 Visitor Profile © Copyright 2006. All Rights Reserved. FCD – T
www.KlagesGroup.com
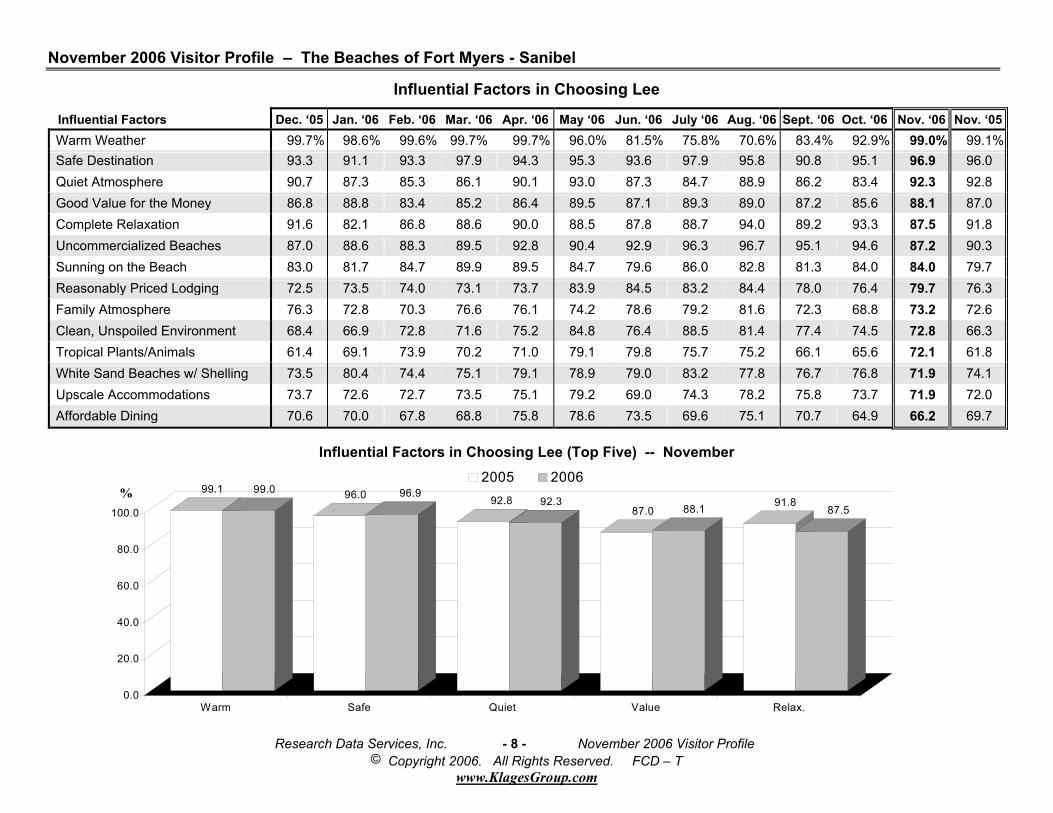
Influential Factors in Choosing Lee
Influential Factors Dec. ‘05 Jan. ‘06 Feb. ‘06 Mar. ‘06 Apr. ‘06 May ‘06 Jun. ‘06 July ‘06 Aug. ‘06 Sept. ‘06 Oct. ‘06 Nov. ‘06 Nov. ‘05 Warm Weather 99.7% 98.6% 99.6% 99.7% 99.7% 96.0% 81.5% 75.8% 70.6% 83.4% 92.9% 99.0% 99.1% Safe Destination 93.3 91.1 93.3 97.9 94.3 95.3 93.6 97.9 95.8 90.8 95.1 96.9 96.0 Quiet Atmosphere 90.7 87.3 85.3 86.1 90.1 93.0 87.3 84.7 88.9 86.2 83.4 92.3 92.8 Good Value for the Money 86.8 88.8 83.4 85.2 86.4 89.5 87.1 89.3 89.0 87.2 85.6 88.1 87.0 Complete Relaxation 91.6 82.1 86.8 88.6 90.0 88.5 87.8 88.7 94.0 89.2 93.3 87.5 91.8 Uncommercialized Beaches 87.0 88.6 88.3 89.5 92.8 90.4 92.9 96.3 96.7 95.1 94.6 87.2 90.3 Sunning on the Beach 83.0 81.7 84.7 89.9 89.5 84.7 79.6 86.0 82.8 81.3 84.0 84.0 79.7 Reasonably Priced Lodging 72.5 73.5 74.0 73.1 73.7 83.9 84.5 83.2 84.4 78.0 76.4 79.7 76.3 Family Atmosphere 76.3 72.8 70.3 76.6 76.1 74.2 78.6 79.2 81.6 72.3 68.8 73.2 72.6 Clean, Unspoiled Environment 68.4 66.9 72.8 71.6 75.2 84.8 76.4 88.5 81.4 77.4 74.5 72.8 66.3 Tropical Plants/Animals 61.4 69.1 73.9 70.2 71.0 79.1 79.8 75.7 75.2 66.1 65.6 72.1 61.8 White Sand Beaches w/ Shelling 73.5 80.4 74.4 75.1 79.1 78.9 79.0 83.2 77.8 76.7 76.8 71.9 74.1 Upscale Accommodations 73.7 72.6 72.7 73.5 75.1 79.2 69.0 74.3 78.2 75.8 73.7 71.9 72.0 Affordable Dining 70.6 70.0 67.8 68.8 75.8 78.6 73.5 69.6 75.1 70.7 64.9 66.2 69.7
Influential Factors in Choosing Lee (Top Five) -- November
99.1 99.0 96.0 96.992.8 92.3
87.0 88.1 91.887.5
0.0
20.0
40.0
60.0
80.0
100.0
Warm Safe Quiet Value Relax.
2005 2006
%
November 2006 Visitor Profile – The Beaches of Fort Myers - Sanibel
Research Data Services, Inc. - 9 - November 2006 Visitor Profile © Copyright 2006. All Rights Reserved. FCD – T
www.KlagesGroup.com
TOP U.S. FEEDER MARKETS
November 2005
November 2006
’05 Rank
1. New York 11.9% 1. New York 12.5% 1
2. Chicago 8.4 2. Chicago 7.1 2
3. Boston 6.5 3. Boston 4.7 3
4. Miami/Fort Lauderdale 4.8 4. Miami/Fort Lauderdale 4.5 4
5. Indianapolis 4.1 5. Philadelphia 4.4 6
6. Philadelphia 3.9 6. Minneapolis/St. Paul 4.2 7
7. Minneapolis/St. Paul 3.8 7. Cleveland 3.9 10
8. Cincinnati 3.5 8. Indianapolis 3.5 5
9. Detroit 3.4 9. Tampa/St. Petersburg 3.3 --
10. Cleveland 3.2 10. Detroit 3.2 9
Please Note: In November 2006, the Miami/Ft. Lauderdale segment accounted for 32% of the Florida market. The distribution is as follows: Broward County: 46%; Dade County: 54%. Sample size does not permit statistical inference.
November 2006 Visitor Profile – The Beaches of Fort Myers - Sanibel
Research Data Services, Inc. - 10 - November 2006 Visitor Profile © Copyright 2006. All Rights Reserved. FCD – T
www.KlagesGroup.com
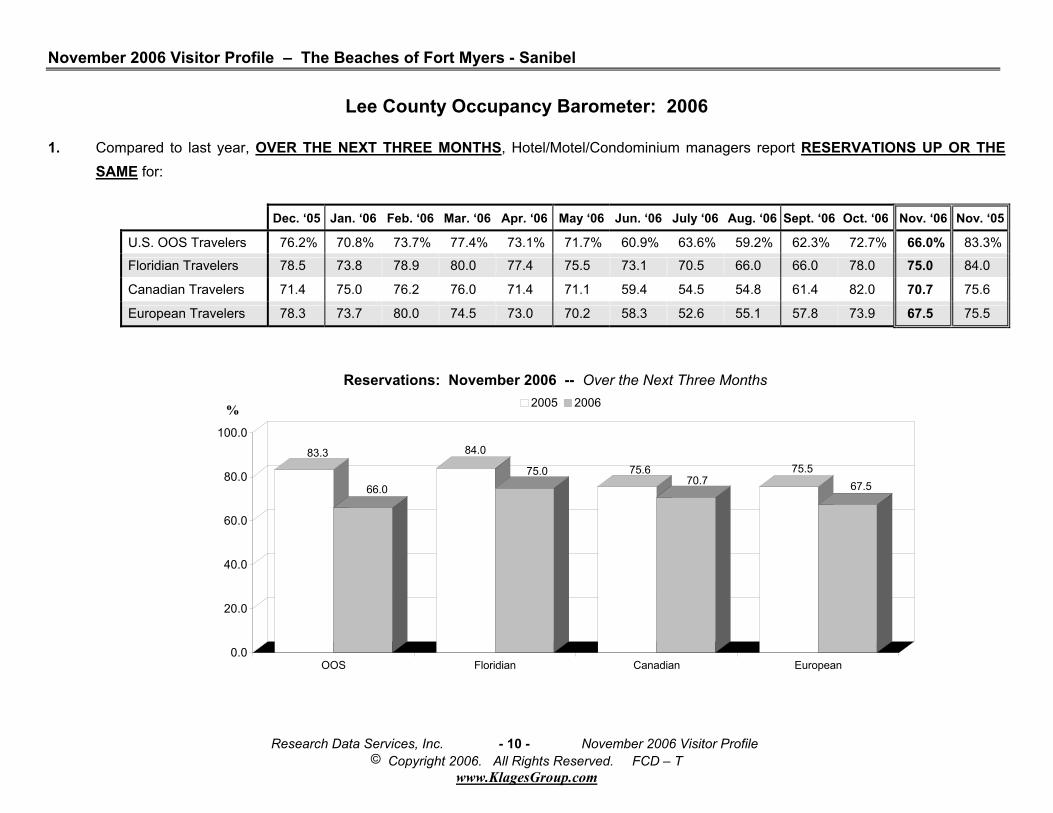
Lee County Occupancy Barometer: 2006
1. Compared to last year, OVER THE NEXT THREE MONTHS, Hotel/Motel/Condominium managers report RESERVATIONS UP OR THE SAME for:
Dec. ‘05 Jan. ‘06 Feb. ‘06 Mar. ‘06 Apr. ‘06 May ‘06 Jun. ‘06 July ‘06 Aug. ‘06 Sept. ‘06 Oct. ‘06 Nov. ‘06 Nov. ‘05
U.S. OOS Travelers 76.2% 70.8% 73.7% 77.4% 73.1% 71.7% 60.9% 63.6% 59.2% 62.3% 72.7% 66.0% 83.3%
Floridian Travelers 78.5 73.8 78.9 80.0 77.4 75.5 73.1 70.5 66.0 66.0 78.0 75.0 84.0
Canadian Travelers 71.4 75.0 76.2 76.0 71.4 71.1 59.4 54.5 54.8 61.4 82.0 70.7 75.6
European Travelers 78.3 73.7 80.0 74.5 73.0 70.2 58.3 52.6 55.1 57.8 73.9 67.5 75.5
Reservations: November 2006 -- Over the Next Three Months
83.3
66.0
84.0
75.0 75.670.7
75.567.5
0.0
20.0
40.0
60.0
80.0
100.0
%
OOS Floridian Canadian European
2005 2006
%
November 2006 Visitor Profile – The Beaches of Fort Myers - Sanibel
Research Data Services, Inc. - 11 - November 2006 Visitor Profile © Copyright 2006. All Rights Reserved. FCD – T
www.KlagesGroup.com
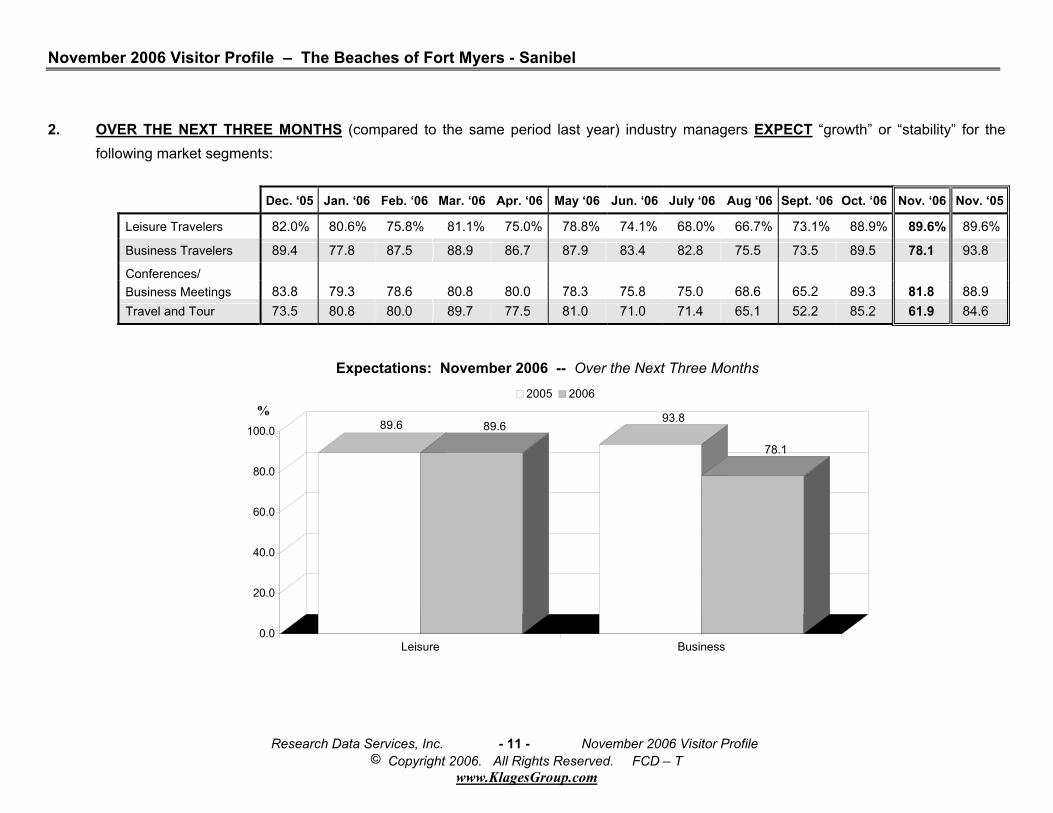
2. OVER THE NEXT THREE MONTHS (compared to the same period last year) industry managers EXPECT “growth” or “stability” for the following market segments:
Dec. ‘05 Jan. ‘06 Feb. ‘06 Mar. ‘06 Apr. ‘06 May ‘06 Jun. ‘06 July ‘06 Aug ‘06 Sept. ‘06 Oct. ‘06 Nov. ‘06 Nov. ‘05
Leisure Travelers 82.0% 80.6% 75.8% 81.1% 75.0% 78.8% 74.1% 68.0% 66.7% 73.1% 88.9% 89.6% 89.6%
Business Travelers 89.4 77.8 87.5 88.9 86.7 87.9 83.4 82.8 75.5 73.5 89.5 78.1 93.8
Conferences/ Business Meetings 83.8 79.3 78.6 80.8 80.0 78.3 75.8 75.0 68.6 65.2 89.3 81.8 88.9 Travel and Tour 73.5 80.8 80.0 89.7 77.5 81.0 71.0 71.4 65.1 52.2 85.2 61.9 84.6
Expectations: November 2006 -- Over the Next Three Months
89.6 89.693.8
78.1
0.0
20.0
40.0
60.0
80.0
100.0%
Leisure Business
2005 2006
%
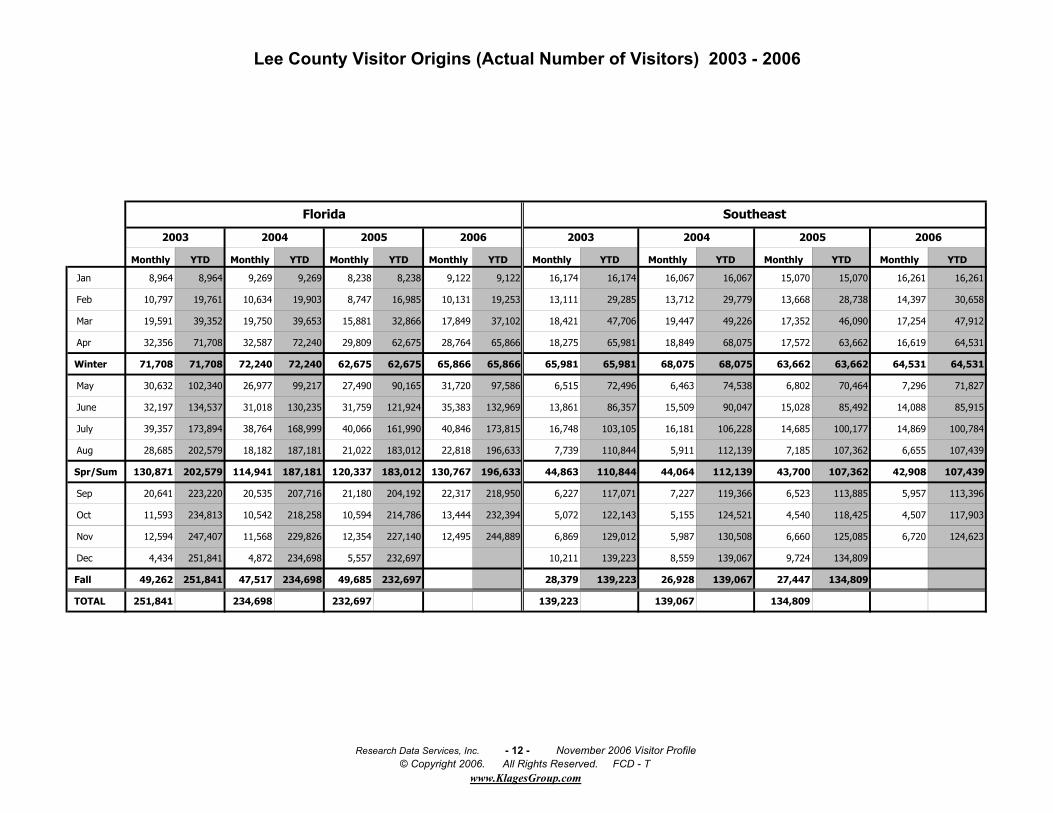
Lee County Visitor Origins (Actual Number of Visitors) 2003 - 2006
Monthly YTD Monthly YTD Monthly YTD Monthly YTD Monthly YTD Monthly YTD Monthly YTD Monthly YTD
Jan 8,964 8,964 9,269 9,269 8,238 8,238 9,122 9,122 16,174 16,174 16,067 16,067 15,070 15,070 16,261 16,261
Feb 10,797 19,761 10,634 19,903 8,747 16,985 10,131 19,253 13,111 29,285 13,712 29,779 13,668 28,738 14,397 30,658
Mar 19,591 39,352 19,750 39,653 15,881 32,866 17,849 37,102 18,421 47,706 19,447 49,226 17,352 46,090 17,254 47,912
Apr 32,356 71,708 32,587 72,240 29,809 62,675 28,764 65,866 18,275 65,981 18,849 68,075 17,572 63,662 16,619 64,531
Winter 71,708 71,708 72,240 72,240 62,675 62,675 65,866 65,866 65,981 65,981 68,075 68,075 63,662 63,662 64,531 64,531
May 30,632 102,340 26,977 99,217 27,490 90,165 31,720 97,586 6,515 72,496 6,463 74,538 6,802 70,464 7,296 71,827
June 32,197 134,537 31,018 130,235 31,759 121,924 35,383 132,969 13,861 86,357 15,509 90,047 15,028 85,492 14,088 85,915
July 39,357 173,894 38,764 168,999 40,066 161,990 40,846 173,815 16,748 103,105 16,181 106,228 14,685 100,177 14,869 100,784
Aug 28,685 202,579 18,182 187,181 21,022 183,012 22,818 196,633 7,739 110,844 5,911 112,139 7,185 107,362 6,655 107,439
Spr/Sum 130,871 202,579 114,941 187,181 120,337 183,012 130,767 196,633 44,863 110,844 44,064 112,139 43,700 107,362 42,908 107,439
Sep 20,641 223,220 20,535 207,716 21,180 204,192 22,317 218,950 6,227 117,071 7,227 119,366 6,523 113,885 5,957 113,396
Oct 11,593 234,813 10,542 218,258 10,594 214,786 13,444 232,394 5,072 122,143 5,155 124,521 4,540 118,425 4,507 117,903
Nov 12,594 247,407 11,568 229,826 12,354 227,140 12,495 244,889 6,869 129,012 5,987 130,508 6,660 125,085 6,720 124,623
Dec 4,434 251,841 4,872 234,698 5,557 232,697 10,211 139,223 8,559 139,067 9,724 134,809
Fall 49,262 251,841 47,517 234,698 49,685 232,697 28,379 139,223 26,928 139,067 27,447 134,809
TOTAL 251,841 234,698 232,697 139,223 139,067 134,809
2005
Florida Southeast
2004 200620062003 200320052004
Research Data Services, Inc. - 12 - November 2006 Visitor Profile© Copyright 2006. All Rights Reserved. FCD - T
www.KlagesGroup.com
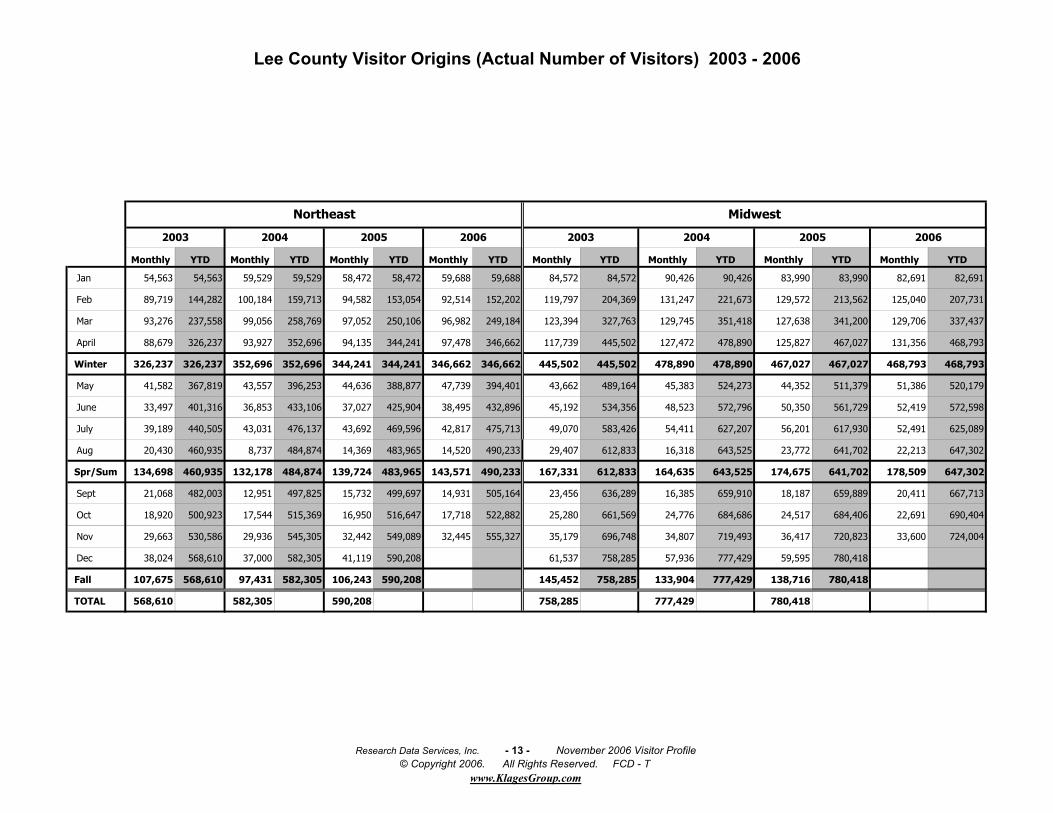
Lee County Visitor Origins (Actual Number of Visitors) 2003 - 2006
Monthly YTD Monthly YTD Monthly YTD Monthly YTD Monthly YTD Monthly YTD Monthly YTD Monthly YTD
Jan 54,563 54,563 59,529 59,529 58,472 58,472 59,688 59,688 84,572 84,572 90,426 90,426 83,990 83,990 82,691 82,691
Feb 89,719 144,282 100,184 159,713 94,582 153,054 92,514 152,202 119,797 204,369 131,247 221,673 129,572 213,562 125,040 207,731
Mar 93,276 237,558 99,056 258,769 97,052 250,106 96,982 249,184 123,394 327,763 129,745 351,418 127,638 341,200 129,706 337,437
April 88,679 326,237 93,927 352,696 94,135 344,241 97,478 346,662 117,739 445,502 127,472 478,890 125,827 467,027 131,356 468,793
Winter 326,237 326,237 352,696 352,696 344,241 344,241 346,662 346,662 445,502 445,502 478,890 478,890 467,027 467,027 468,793 468,793
May 41,582 367,819 43,557 396,253 44,636 388,877 47,739 394,401 43,662 489,164 45,383 524,273 44,352 511,379 51,386 520,179
June 33,497 401,316 36,853 433,106 37,027 425,904 38,495 432,896 45,192 534,356 48,523 572,796 50,350 561,729 52,419 572,598
July 39,189 440,505 43,031 476,137 43,692 469,596 42,817 475,713 49,070 583,426 54,411 627,207 56,201 617,930 52,491 625,089
Aug 20,430 460,935 8,737 484,874 14,369 483,965 14,520 490,233 29,407 612,833 16,318 643,525 23,772 641,702 22,213 647,302
Spr/Sum 134,698 460,935 132,178 484,874 139,724 483,965 143,571 490,233 167,331 612,833 164,635 643,525 174,675 641,702 178,509 647,302
Sept 21,068 482,003 12,951 497,825 15,732 499,697 14,931 505,164 23,456 636,289 16,385 659,910 18,187 659,889 20,411 667,713
Oct 18,920 500,923 17,544 515,369 16,950 516,647 17,718 522,882 25,280 661,569 24,776 684,686 24,517 684,406 22,691 690,404
Nov 29,663 530,586 29,936 545,305 32,442 549,089 32,445 555,327 35,179 696,748 34,807 719,493 36,417 720,823 33,600 724,004
Dec 38,024 568,610 37,000 582,305 41,119 590,208 61,537 758,285 57,936 777,429 59,595 780,418
Fall 107,675 568,610 97,431 582,305 106,243 590,208 145,452 758,285 133,904 777,429 138,716 780,418
TOTAL 568,610 582,305 590,208 758,285 777,429 780,418
2004 2005
Northeast
2006
Midwest
2003 2004 20062005 2003
Research Data Services, Inc. - 13 - November 2006 Visitor Profile© Copyright 2006. All Rights Reserved. FCD - T
www.KlagesGroup.com
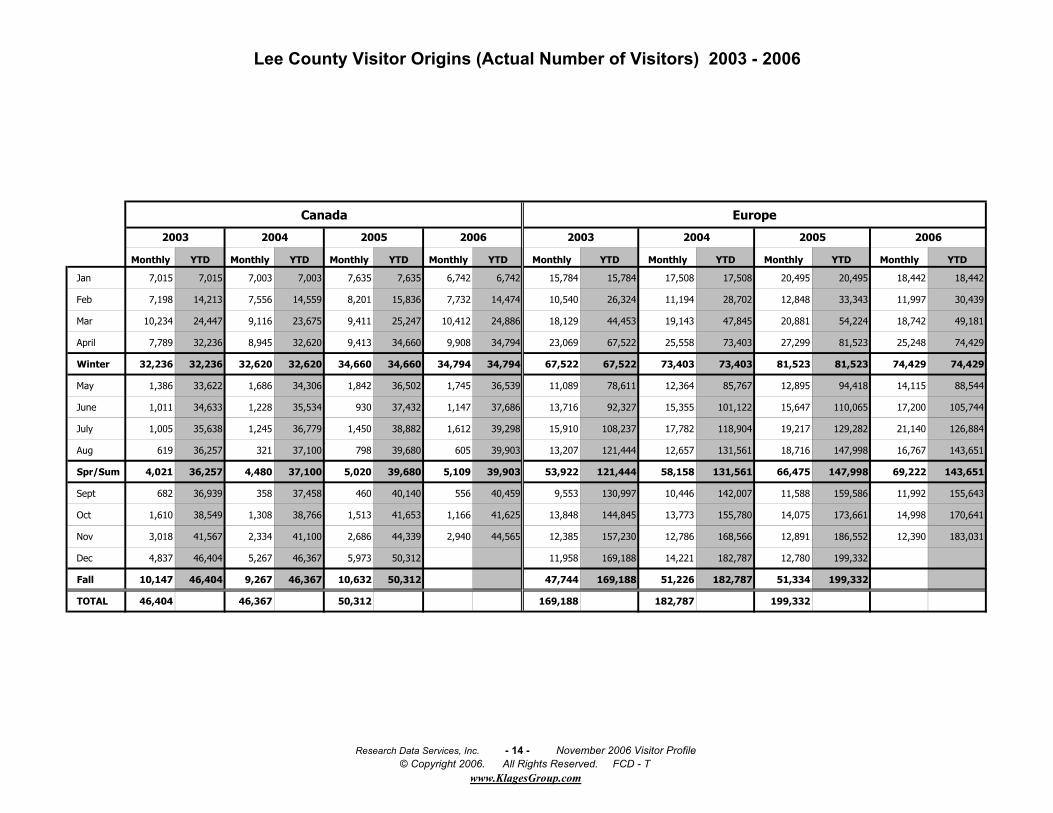
Lee County Visitor Origins (Actual Number of Visitors) 2003 - 2006
Canada Europe
Monthly YTD Monthly YTD Monthly YTD Monthly YTD Monthly YTD Monthly YTD Monthly YTD Monthly YTD
Jan 7,015 7,015 7,003 7,003 7,635 7,635 6,742 6,742 15,784 15,784 17,508 17,508 20,495 20,495 18,442 18,442
Feb 7,198 14,213 7,556 14,559 8,201 15,836 7,732 14,474 10,540 26,324 11,194 28,702 12,848 33,343 11,997 30,439
Mar 10,234 24,447 9,116 23,675 9,411 25,247 10,412 24,886 18,129 44,453 19,143 47,845 20,881 54,224 18,742 49,181
April 7,789 32,236 8,945 32,620 9,413 34,660 9,908 34,794 23,069 67,522 25,558 73,403 27,299 81,523 25,248 74,429
Winter 32,236 32,236 32,620 32,620 34,660 34,660 34,794 34,794 67,522 67,522 73,403 73,403 81,523 81,523 74,429 74,429
May 1,386 33,622 1,686 34,306 1,842 36,502 1,745 36,539 11,089 78,611 12,364 85,767 12,895 94,418 14,115 88,544
June 1,011 34,633 1,228 35,534 930 37,432 1,147 37,686 13,716 92,327 15,355 101,122 15,647 110,065 17,200 105,744
July 1,005 35,638 1,245 36,779 1,450 38,882 1,612 39,298 15,910 108,237 17,782 118,904 19,217 129,282 21,140 126,884
Aug 619 36,257 321 37,100 798 39,680 605 39,903 13,207 121,444 12,657 131,561 18,716 147,998 16,767 143,651
Spr/Sum 4,021 36,257 4,480 37,100 5,020 39,680 5,109 39,903 53,922 121,444 58,158 131,561 66,475 147,998 69,222 143,651
Sept 682 36,939 358 37,458 460 40,140 556 40,459 9,553 130,997 10,446 142,007 11,588 159,586 11,992 155,643
Oct 1,610 38,549 1,308 38,766 1,513 41,653 1,166 41,625 13,848 144,845 13,773 155,780 14,075 173,661 14,998 170,641
Nov 3,018 41,567 2,334 41,100 2,686 44,339 2,940 44,565 12,385 157,230 12,786 168,566 12,891 186,552 12,390 183,031
Dec 4,837 46,404 5,267 46,367 5,973 50,312 11,958 169,188 14,221 182,787 12,780 199,332
Fall 10,147 46,404 9,267 46,367 10,632 50,312 47,744 169,188 51,226 182,787 51,334 199,332
TOTAL 46,404 46,367 50,312 169,188 182,787 199,332
200520032005 200620042003 2004 2006
Research Data Services, Inc. - 14 - November 2006 Visitor Profile© Copyright 2006. All Rights Reserved. FCD - T
www.KlagesGroup.com
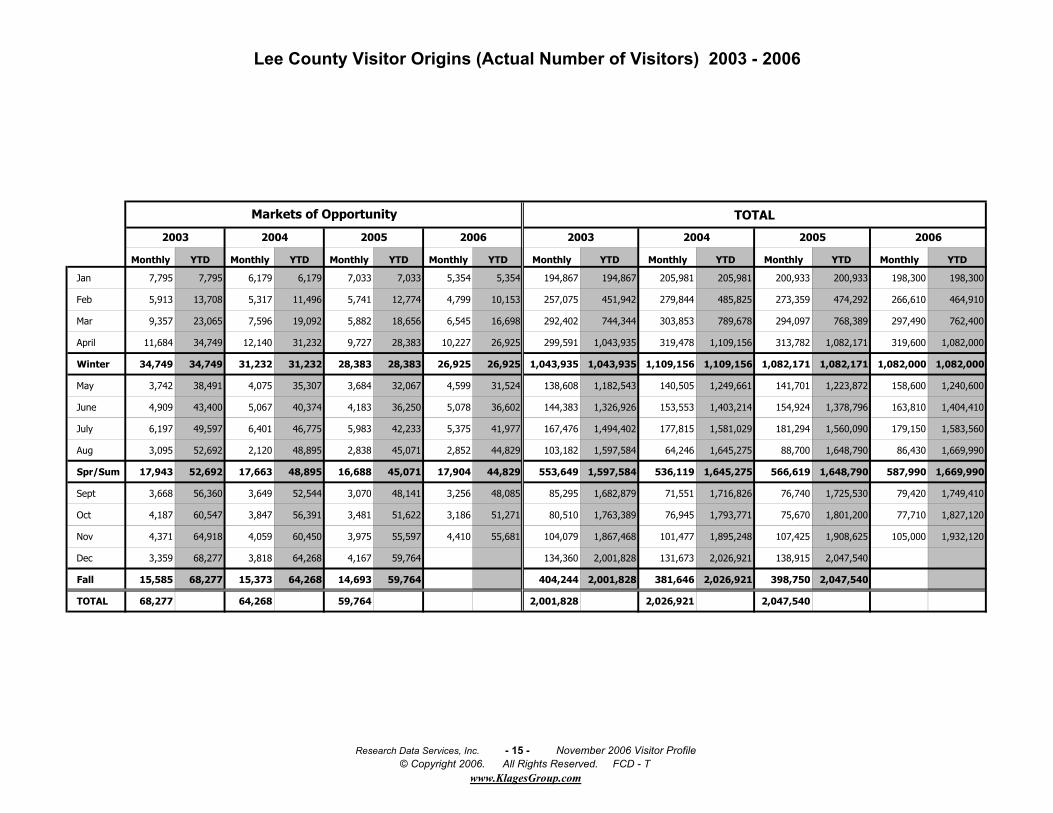
Lee County Visitor Origins (Actual Number of Visitors) 2003 - 2006
TOTAL
Monthly YTD Monthly YTD Monthly YTD Monthly YTD Monthly YTD Monthly YTD Monthly YTD Monthly YTD
Jan 7,795 7,795 6,179 6,179 7,033 7,033 5,354 5,354 194,867 194,867 205,981 205,981 200,933 200,933 198,300 198,300
Feb 5,913 13,708 5,317 11,496 5,741 12,774 4,799 10,153 257,075 451,942 279,844 485,825 273,359 474,292 266,610 464,910
Mar 9,357 23,065 7,596 19,092 5,882 18,656 6,545 16,698 292,402 744,344 303,853 789,678 294,097 768,389 297,490 762,400
April 11,684 34,749 12,140 31,232 9,727 28,383 10,227 26,925 299,591 1,043,935 319,478 1,109,156 313,782 1,082,171 319,600 1,082,000
Winter 34,749 34,749 31,232 31,232 28,383 28,383 26,925 26,925 1,043,935 1,043,935 1,109,156 1,109,156 1,082,171 1,082,171 1,082,000 1,082,000
May 3,742 38,491 4,075 35,307 3,684 32,067 4,599 31,524 138,608 1,182,543 140,505 1,249,661 141,701 1,223,872 158,600 1,240,600
June 4,909 43,400 5,067 40,374 4,183 36,250 5,078 36,602 144,383 1,326,926 153,553 1,403,214 154,924 1,378,796 163,810 1,404,410
July 6,197 49,597 6,401 46,775 5,983 42,233 5,375 41,977 167,476 1,494,402 177,815 1,581,029 181,294 1,560,090 179,150 1,583,560
Aug 3,095 52,692 2,120 48,895 2,838 45,071 2,852 44,829 103,182 1,597,584 64,246 1,645,275 88,700 1,648,790 86,430 1,669,990
Spr/Sum 17,943 52,692 17,663 48,895 16,688 45,071 17,904 44,829 553,649 1,597,584 536,119 1,645,275 566,619 1,648,790 587,990 1,669,990
Sept 3,668 56,360 3,649 52,544 3,070 48,141 3,256 48,085 85,295 1,682,879 71,551 1,716,826 76,740 1,725,530 79,420 1,749,410
Oct 4,187 60,547 3,847 56,391 3,481 51,622 3,186 51,271 80,510 1,763,389 76,945 1,793,771 75,670 1,801,200 77,710 1,827,120
Nov 4,371 64,918 4,059 60,450 3,975 55,597 4,410 55,681 104,079 1,867,468 101,477 1,895,248 107,425 1,908,625 105,000 1,932,120
Dec 3,359 68,277 3,818 64,268 4,167 59,764 134,360 2,001,828 131,673 2,026,921 138,915 2,047,540
Fall 15,585 68,277 15,373 64,268 14,693 59,764 404,244 2,001,828 381,646 2,026,921 398,750 2,047,540
TOTAL 68,277 64,268 59,764 2,001,828 2,026,921 2,047,540
2003 2004 20052005 20062003 2004 2006
Markets of Opportunity
Research Data Services, Inc. - 15 - November 2006 Visitor Profile© Copyright 2006. All Rights Reserved. FCD - T
www.KlagesGroup.com


![Diversity of kala- azar treatment in different regions and ... · azar treatment in different regions and disease niches ... 3.0 [1.1, 4.9] Bhattacharya 2007 India 1132 81.9 [79.6,](https://img.pdfslide.us/doc/110x75/5cc895ee88c993103f8da9c6/diversity-of-kala-azar-treatment-in-different-regions-and-azar-treatment.jpg)