Embed Size (px)
Citation preview
C O N S O L I D A T E D F I N A N C I A L S T A T E M E N T S ,
S U P P L E M E N T A R Y I N F O R M A T I O N , A U D I T R E P O R T S
A N D S C H E D U L E S R E L A T E D T O T H E U N I F O R M
G U I D A N C E
Northwell Health, Inc. Year Ended December 31, 2016 With Reports of Independent Auditors
Ernst & Young LLP
Northwell Health, Inc.
Consolidated Financial Statements, Supplementary Information, Audit Reports and Schedules Related to the Uniform Guidance
Year Ended December 31, 2016
Contents
Report of Independent Auditors.......................................................................................................1
Consolidated Financial Statements
Consolidated Statements of Financial Position ................................................................................3 Consolidated Statements of Operations ...........................................................................................4 Consolidated Statements of Changes in Net Assets ........................................................................5 Consolidated Statements of Cash Flows ..........................................................................................6 Notes to Consolidated Financial Statements ....................................................................................7
Supplementary Information, Audit Reports and Schedules Related to the Uniform Guidance
Schedule of Expenditures of Federal Awards ................................................................................72 Notes to Schedule of Expenditures of Federal Awards .................................................................80 Report of Independent Auditors on Internal Control Over Financial Reporting and on
Compliance and Other Matters Based on an Audit of Financial Statements Performed in Accordance With Government Auditing Standards ..............................................82
Report of Independent Auditors on Compliance for Each Major Federal Program and Report on Internal Control Over Compliance Required by the Uniform Guidance ...................84
Schedule of Findings and Questioned Costs ..................................................................................86
1
Report of Independent Auditors
Management and the Board of Trustees Northwell Health, Inc.
Report on the Financial Statements
We have audited the accompanying consolidated financial statements of Northwell Health, Inc. and its member corporations and other affiliated entities (collectively, Northwell), which comprise the consolidated statements of financial position as of December 31, 2016 and 2015, and the related consolidated statements of operations, changes in net assets and cash flows for the years then ended, and the related notes to the consolidated financial statements.
Management’s Responsibility for the Financial Statements
Management is responsible for the preparation and fair presentation of these financial statements in conformity with U.S. generally accepted accounting principles; this includes the design, implementation, and maintenance of internal control relevant to the preparation and fair presentation of financial statements that are free of material misstatement, whether due to fraud or error.
Auditor’s Responsibility
Our responsibility is to express an opinion on these financial statements based on our audits. We conducted our audits in accordance with auditing standards generally accepted in the United States and the standards applicable to financial audits contained in Government Auditing Standards, issued by the Comptroller General of the United States. Those standards require that we plan and perform the audit to obtain reasonable assurance about whether the financial statements are free of material misstatement.
An audit involves performing procedures to obtain audit evidence about the amounts and disclosures in the financial statements. The procedures selected depend on the auditor’s judgment, including the assessment of the risks of material misstatement of the financial statements, whether due to fraud or error. In making those risk assessments, the auditor considers internal control relevant to the entity’s preparation and fair presentation of the financial statements in order to design audit procedures that are appropriate in the circumstances, but not for the purpose of expressing an opinion on the effectiveness of the entity’s internal control. Accordingly, we express no such opinion. An audit also includes evaluating the appropriateness of accounting policies used and the reasonableness of significant accounting estimates made by management, as well as evaluating the overall presentation of the financial statements.
We believe that the audit evidence we have obtained is sufficient and appropriate to provide a basis for our audit opinion.
A member firm of Ernst & Young Global Limited
Ernst & Young LLP One Jericho Plaza Suite 105 Jericho, NY 11753
Tel: +1 516 336 0100 ey.com
2
Opinion
In our opinion, the financial statements referred to above present fairly, in all material respects, the consolidated financial position of Northwell Health, Inc. and its member corporations and other affiliated entities at December 31, 2016 and 2015, and the consolidated results of their operations, changes in their net assets and their cash flows for the years then ended in conformity with U.S. generally accepted accounting principles.
Supplementary Information
Our audits were conducted for the purpose of forming an opinion on the consolidated financial statements as a whole. The accompanying Schedule of Expenditures of Federal Awards for the year ended December 31, 2016, as required by Title 2 U.S. Code of Federal Regulations Part 200, Uniform Administrative Requirements, Cost Principles, and Audit Requirements for Federal Awards, is presented for purposes of additional analysis and is not a required part of the consolidated financial statements. Such information is the responsibility of management and was derived from and relates directly to the underlying accounting and other records used to prepare the consolidated financial statements. The information has been subjected to the auditing procedures applied in the audits of the consolidated financial statements and certain additional procedures, including comparing and reconciling such information directly to the underlying accounting and other records used to prepare the consolidated financial statements or to the consolidated financial statements themselves, and other additional procedures in accordance with auditing standards generally accepted in the United States. In our opinion, the information is fairly stated in all material respects, in relation to the consolidated financial statements as a whole.
Other Reporting Required by Government Auditing Standards
In accordance with Government Auditing Standards, we also have issued our report dated April 28, 2017 on our consideration of Northwell’s internal control over financial reporting and on our tests of its compliance with certain provisions of laws, regulations, contracts, and grant agreements and other matters. The purpose of that report is to describe the scope of our testing of internal control over financial reporting and compliance and the results of that testing, and not to provide an opinion on internal control over financial reporting or on compliance. That report is an integral part of an audit performed in accordance with Government Auditing Standards in considering Northwell’s internal control over financial reporting and compliance.
EY April 28, 2017, except for the schedule of expenditures of federal awards for which the date is September 29, 2017.
A member firm of Ernst & Young Global Limited
3
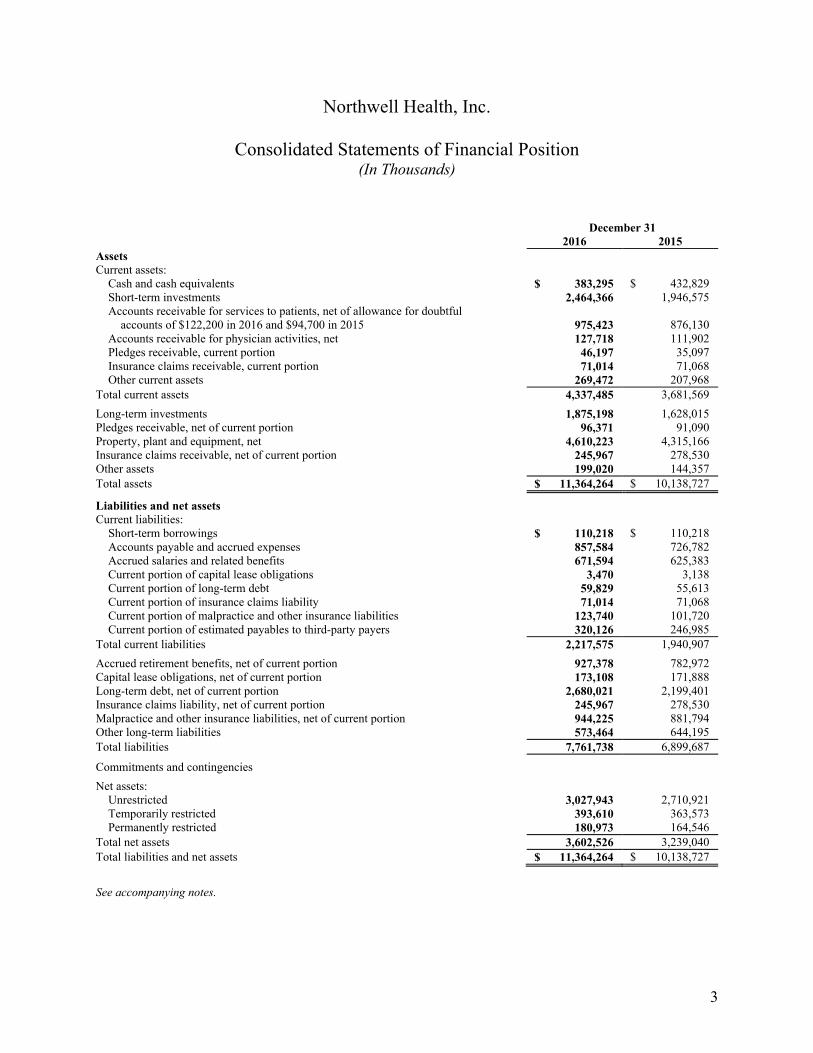
Northwell Health, Inc.
Consolidated Statements of Financial Position (In Thousands)
December 31 2016 2015 Assets Current assets:
Cash and cash equivalents $ 383,295 $ 432,829 Short-term investments 2,464,366 1,946,575 Accounts receivable for services to patients, net of allowance for doubtful
accounts of $122,200 in 2016 and $94,700 in 2015 975,423 876,130 Accounts receivable for physician activities, net 127,718 111,902 Pledges receivable, current portion 46,197 35,097 Insurance claims receivable, current portion 71,014 71,068 Other current assets 269,472 207,968
Total current assets 4,337,485 3,681,569
Long-term investments 1,875,198 1,628,015 Pledges receivable, net of current portion 96,371 91,090 Property, plant and equipment, net 4,610,223 4,315,166 Insurance claims receivable, net of current portion 245,967 278,530 Other assets 199,020 144,357 Total assets $ 11,364,264 $ 10,138,727
Liabilities and net assets Current liabilities:
Short-term borrowings $ 110,218 $ 110,218 Accounts payable and accrued expenses 857,584 726,782 Accrued salaries and related benefits 671,594 625,383 Current portion of capital lease obligations 3,470 3,138 Current portion of long-term debt 59,829 55,613 Current portion of insurance claims liability 71,014 71,068 Current portion of malpractice and other insurance liabilities 123,740 101,720 Current portion of estimated payables to third-party payers 320,126 246,985
Total current liabilities 2,217,575 1,940,907
Accrued retirement benefits, net of current portion 927,378 782,972 Capital lease obligations, net of current portion 173,108 171,888 Long-term debt, net of current portion 2,680,021 2,199,401 Insurance claims liability, net of current portion 245,967 278,530 Malpractice and other insurance liabilities, net of current portion 944,225 881,794 Other long-term liabilities 573,464 644,195 Total liabilities 7,761,738 6,899,687
Commitments and contingencies
Net assets: Unrestricted 3,027,943 2,710,921 Temporarily restricted 393,610 363,573 Permanently restricted 180,973 164,546
Total net assets 3,602,526 3,239,040 Total liabilities and net assets $ 11,364,264 $ 10,138,727
See accompanying notes.
4
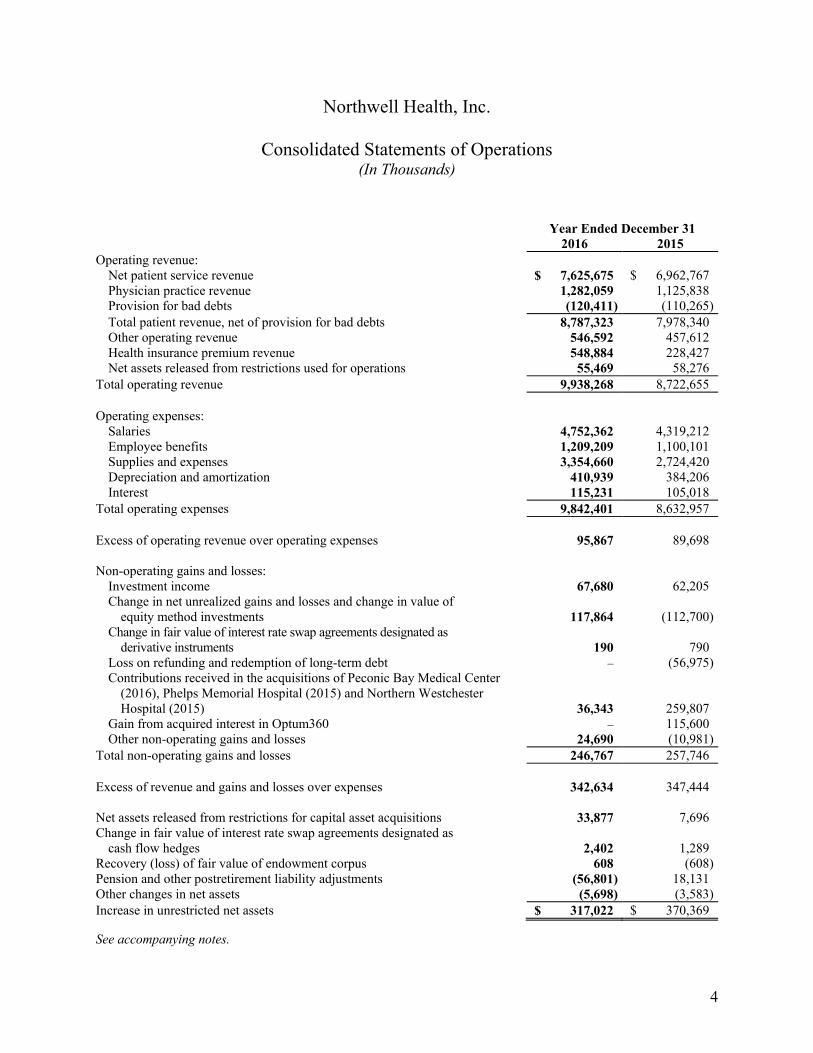
Northwell Health, Inc.
Consolidated Statements of Operations (In Thousands)
Year Ended December 31 2016 2015 Operating revenue:
Net patient service revenue $ 7,625,675 $ 6,962,767 Physician practice revenue 1,282,059 1,125,838 Provision for bad debts (120,411) (110,265)Total patient revenue, net of provision for bad debts 8,787,323 7,978,340 Other operating revenue 546,592 457,612 Health insurance premium revenue 548,884 228,427 Net assets released from restrictions used for operations 55,469 58,276
Total operating revenue 9,938,268 8,722,655 Operating expenses:
Salaries 4,752,362 4,319,212 Employee benefits 1,209,209 1,100,101 Supplies and expenses 3,354,660 2,724,420 Depreciation and amortization 410,939 384,206 Interest 115,231 105,018
Total operating expenses 9,842,401 8,632,957 Excess of operating revenue over operating expenses 95,867 89,698 Non-operating gains and losses:
Investment income 67,680 62,205 Change in net unrealized gains and losses and change in value of
equity method investments 117,864 (112,700)Change in fair value of interest rate swap agreements designated as
derivative instruments 190 790 Loss on refunding and redemption of long-term debt – (56,975)Contributions received in the acquisitions of Peconic Bay Medical Center
(2016), Phelps Memorial Hospital (2015) and Northern Westchester Hospital (2015) 36,343 259,807
Gain from acquired interest in Optum360 – 115,600 Other non-operating gains and losses 24,690 (10,981)
Total non-operating gains and losses 246,767 257,746 Excess of revenue and gains and losses over expenses 342,634 347,444 Net assets released from restrictions for capital asset acquisitions 33,877 7,696 Change in fair value of interest rate swap agreements designated as
cash flow hedges 2,402 1,289 Recovery (loss) of fair value of endowment corpus 608 (608)Pension and other postretirement liability adjustments (56,801) 18,131 Other changes in net assets (5,698) (3,583)Increase in unrestricted net assets $ 317,022 $ 370,369
See accompanying notes.
5
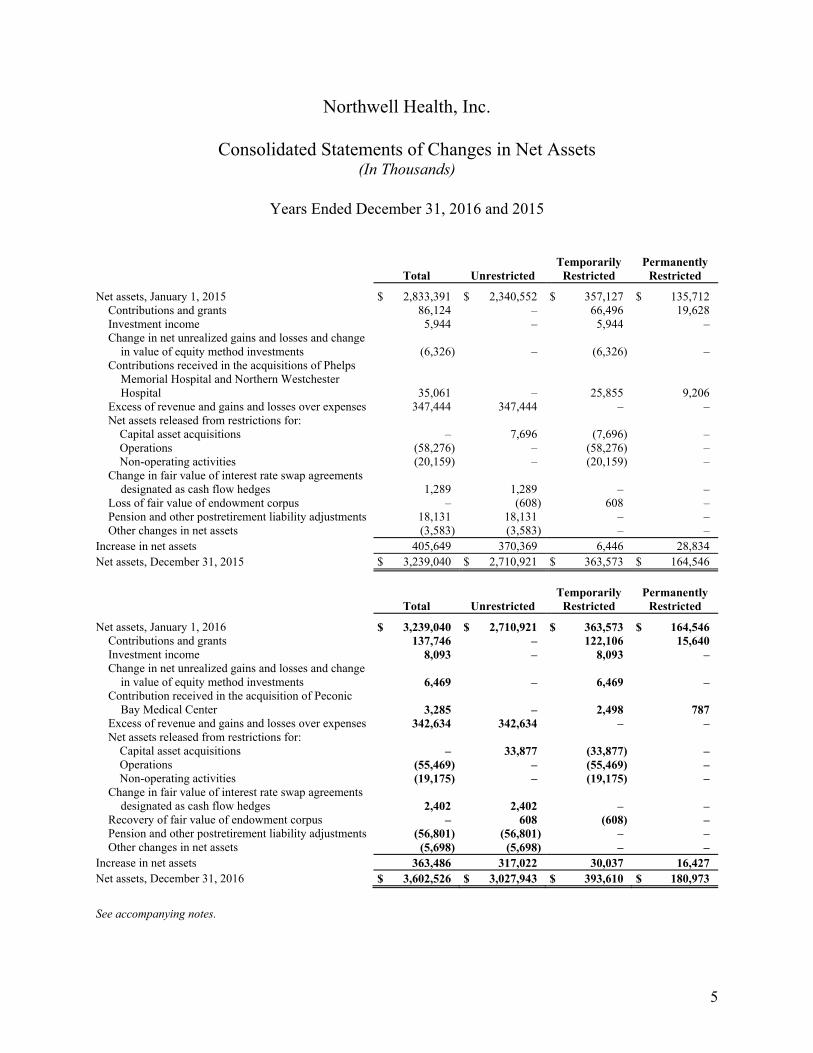
Northwell Health, Inc.
Consolidated Statements of Changes in Net Assets (In Thousands)
Years Ended December 31, 2016 and 2015
Total Unrestricted Temporarily
Restricted Permanently
Restricted Net assets, January 1, 2015 $ 2,833,391 $ 2,340,552 $ 357,127 $ 135,712
Contributions and grants 86,124 – 66,496 19,628 Investment income 5,944 – 5,944 – Change in net unrealized gains and losses and change
in value of equity method investments (6,326) – (6,326) – Contributions received in the acquisitions of Phelps
Memorial Hospital and Northern Westchester Hospital 35,061 – 25,855 9,206
Excess of revenue and gains and losses over expenses 347,444 347,444 – – Net assets released from restrictions for:
Capital asset acquisitions – 7,696 (7,696) – Operations (58,276) – (58,276) – Non-operating activities (20,159) – (20,159) –
Change in fair value of interest rate swap agreements designated as cash flow hedges 1,289 1,289 – –
Loss of fair value of endowment corpus – (608) 608 – Pension and other postretirement liability adjustments 18,131 18,131 – – Other changes in net assets (3,583) (3,583) – –
Increase in net assets 405,649 370,369 6,446 28,834 Net assets, December 31, 2015 $ 3,239,040 $ 2,710,921 $ 363,573 $ 164,546
Total Unrestricted Temporarily
Restricted Permanently
Restricted Net assets, January 1, 2016 $ 3,239,040 $ 2,710,921 $ 363,573 $ 164,546
Contributions and grants 137,746 – 122,106 15,640 Investment income 8,093 – 8,093 – Change in net unrealized gains and losses and change
in value of equity method investments 6,469 – 6,469 – Contribution received in the acquisition of Peconic
Bay Medical Center 3,285 – 2,498 787 Excess of revenue and gains and losses over expenses 342,634 342,634 – – Net assets released from restrictions for:
Capital asset acquisitions – 33,877 (33,877) – Operations (55,469) – (55,469) – Non-operating activities (19,175) – (19,175) –
Change in fair value of interest rate swap agreements designated as cash flow hedges 2,402 2,402 – –
Recovery of fair value of endowment corpus – 608 (608) – Pension and other postretirement liability adjustments (56,801) (56,801) – – Other changes in net assets (5,698) (5,698) – –
Increase in net assets 363,486 317,022 30,037 16,427 Net assets, December 31, 2016 $ 3,602,526 $ 3,027,943 $ 393,610 $ 180,973
See accompanying notes.
6
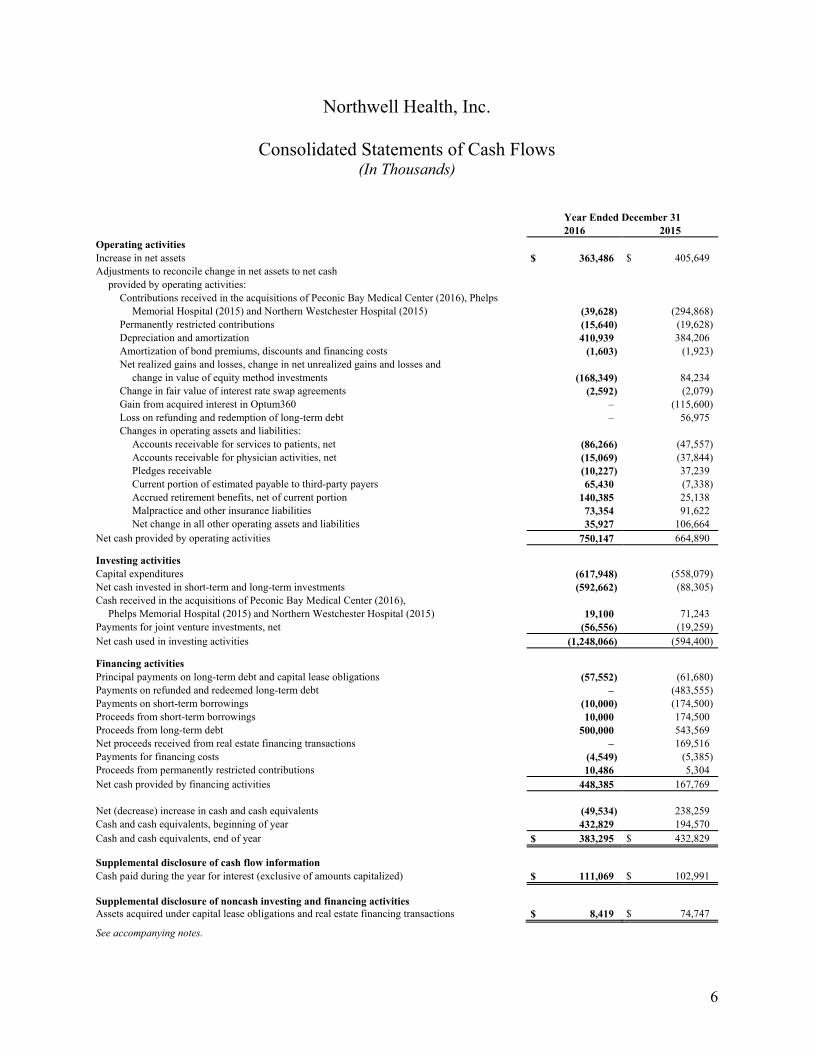
Northwell Health, Inc.
Consolidated Statements of Cash Flows (In Thousands)
Year Ended December 31 2016 2015 Operating activities Increase in net assets $ 363,486 $ 405,649 Adjustments to reconcile change in net assets to net cash
provided by operating activities: Contributions received in the acquisitions of Peconic Bay Medical Center (2016), Phelps
Memorial Hospital (2015) and Northern Westchester Hospital (2015) (39,628) (294,868)Permanently restricted contributions (15,640) (19,628)Depreciation and amortization 410,939 384,206 Amortization of bond premiums, discounts and financing costs (1,603) (1,923)Net realized gains and losses, change in net unrealized gains and losses and
change in value of equity method investments (168,349) 84,234 Change in fair value of interest rate swap agreements (2,592) (2,079)Gain from acquired interest in Optum360 – (115,600)Loss on refunding and redemption of long-term debt – 56,975 Changes in operating assets and liabilities:
Accounts receivable for services to patients, net (86,266) (47,557)Accounts receivable for physician activities, net (15,069) (37,844)Pledges receivable (10,227) 37,239 Current portion of estimated payable to third-party payers 65,430 (7,338)Accrued retirement benefits, net of current portion 140,385 25,138 Malpractice and other insurance liabilities 73,354 91,622 Net change in all other operating assets and liabilities 35,927 106,664
Net cash provided by operating activities 750,147 664,890 Investing activities Capital expenditures (617,948) (558,079)Net cash invested in short-term and long-term investments (592,662) (88,305)Cash received in the acquisitions of Peconic Bay Medical Center (2016),
Phelps Memorial Hospital (2015) and Northern Westchester Hospital (2015) 19,100 71,243 Payments for joint venture investments, net (56,556) (19,259)Net cash used in investing activities (1,248,066) (594,400) Financing activities Principal payments on long-term debt and capital lease obligations (57,552) (61,680)Payments on refunded and redeemed long-term debt – (483,555)Payments on short-term borrowings (10,000) (174,500)Proceeds from short-term borrowings 10,000 174,500 Proceeds from long-term debt 500,000 543,569 Net proceeds received from real estate financing transactions – 169,516 Payments for financing costs (4,549) (5,385)Proceeds from permanently restricted contributions 10,486 5,304 Net cash provided by financing activities 448,385 167,769 Net (decrease) increase in cash and cash equivalents (49,534) 238,259 Cash and cash equivalents, beginning of year 432,829 194,570 Cash and cash equivalents, end of year $ 383,295 $ 432,829 Supplemental disclosure of cash flow information Cash paid during the year for interest (exclusive of amounts capitalized) $ 111,069 $ 102,991 Supplemental disclosure of noncash investing and financing activities Assets acquired under capital lease obligations and real estate financing transactions $ 8,419 $ 74,747
See accompanying notes.
7
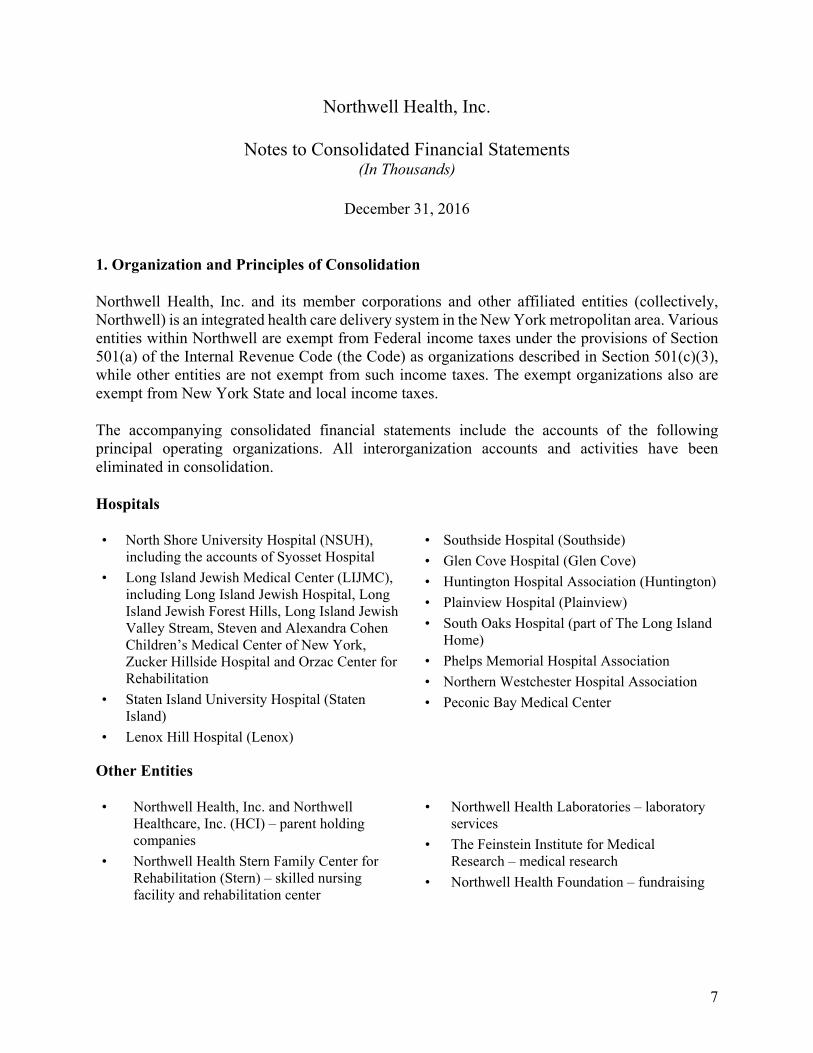
Northwell Health, Inc.
Notes to Consolidated Financial Statements (In Thousands)
December 31, 2016
1. Organization and Principles of Consolidation
Northwell Health, Inc. and its member corporations and other affiliated entities (collectively, Northwell) is an integrated health care delivery system in the New York metropolitan area. Various entities within Northwell are exempt from Federal income taxes under the provisions of Section 501(a) of the Internal Revenue Code (the Code) as organizations described in Section 501(c)(3), while other entities are not exempt from such income taxes. The exempt organizations also are exempt from New York State and local income taxes.
The accompanying consolidated financial statements include the accounts of the following principal operating organizations. All interorganization accounts and activities have been eliminated in consolidation.
Hospitals
• North Shore University Hospital (NSUH), including the accounts of Syosset Hospital
• Long Island Jewish Medical Center (LIJMC), including Long Island Jewish Hospital, Long Island Jewish Forest Hills, Long Island Jewish Valley Stream, Steven and Alexandra Cohen Children’s Medical Center of New York, Zucker Hillside Hospital and Orzac Center for Rehabilitation
• Staten Island University Hospital (Staten Island)
• Lenox Hill Hospital (Lenox)
• Southside Hospital (Southside)
• Glen Cove Hospital (Glen Cove)
• Huntington Hospital Association (Huntington)
• Plainview Hospital (Plainview)
• South Oaks Hospital (part of The Long Island Home)
• Phelps Memorial Hospital Association
• Northern Westchester Hospital Association
• Peconic Bay Medical Center
Other Entities
• Northwell Health, Inc. and Northwell Healthcare, Inc. (HCI) – parent holding companies
• Northwell Health Stern Family Center for Rehabilitation (Stern) – skilled nursing facility and rehabilitation center
• Northwell Health Laboratories – laboratory services
• The Feinstein Institute for Medical Research – medical research
• Northwell Health Foundation – fundraising
Northwell Health, Inc.
Notes to Consolidated Financial Statements (continued) (In Thousands)
8
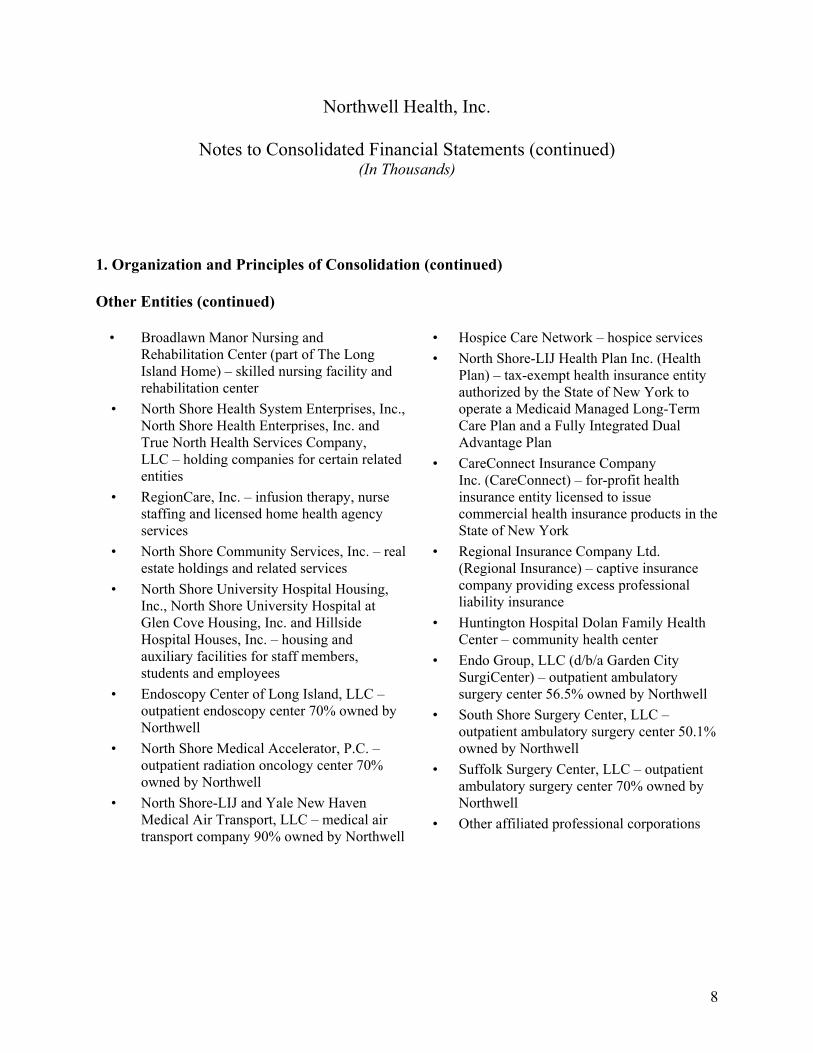
1. Organization and Principles of Consolidation (continued)
Other Entities (continued)
• Broadlawn Manor Nursing and Rehabilitation Center (part of The Long Island Home) – skilled nursing facility and rehabilitation center
• North Shore Health System Enterprises, Inc., North Shore Health Enterprises, Inc. and True North Health Services Company, LLC – holding companies for certain related entities
• RegionCare, Inc. – infusion therapy, nurse staffing and licensed home health agency services
• North Shore Community Services, Inc. – real estate holdings and related services
• North Shore University Hospital Housing, Inc., North Shore University Hospital at Glen Cove Housing, Inc. and Hillside Hospital Houses, Inc. – housing and auxiliary facilities for staff members, students and employees
• Endoscopy Center of Long Island, LLC – outpatient endoscopy center 70% owned by Northwell
• North Shore Medical Accelerator, P.C. – outpatient radiation oncology center 70% owned by Northwell
• North Shore-LIJ and Yale New Haven Medical Air Transport, LLC – medical air transport company 90% owned by Northwell
• Hospice Care Network – hospice services
• North Shore-LIJ Health Plan Inc. (Health Plan) – tax-exempt health insurance entity authorized by the State of New York to operate a Medicaid Managed Long-Term Care Plan and a Fully Integrated Dual Advantage Plan
• CareConnect Insurance Company Inc. (CareConnect) – for-profit health insurance entity licensed to issue commercial health insurance products in the State of New York
• Regional Insurance Company Ltd. (Regional Insurance) – captive insurance company providing excess professional liability insurance
• Huntington Hospital Dolan Family Health Center – community health center
• Endo Group, LLC (d/b/a Garden City SurgiCenter) – outpatient ambulatory surgery center 56.5% owned by Northwell
• South Shore Surgery Center, LLC – outpatient ambulatory surgery center 50.1% owned by Northwell
• Suffolk Surgery Center, LLC – outpatient ambulatory surgery center 70% owned by Northwell
• Other affiliated professional corporations
Northwell Health, Inc.
Notes to Consolidated Financial Statements (continued) (In Thousands)
9
1. Organization and Principles of Consolidation (continued)
Certain members of Northwell (the Obligated Group) are jointly and severally liable for obligations under bond indentures (see Note 6). The Obligated Group consists of HCI, NSUH, LIJMC, Staten Island, Lenox, Southside, Huntington, Glen Cove, Plainview and Stern.
Effective January 14, 2016, Forest Hills Hospital and Franklin Hospital merged into LIJMC. In conjunction with the merger, the names of the hospitals were changed to Long Island Jewish Forest Hills and Long Island Jewish Valley Stream, respectively.
Northwell maintains a controlling ownership in various entities whose results of operations are included in the accompanying consolidated financial statements. Northwell’s non-controlling interest in these entities at December 31, 2016 and 2015 is immaterial, both individually and in the aggregate, to Northwell’s net assets and excess of revenue and gains and losses over expenses as reported in the accompanying consolidated financial statements.
In September 2016, Northwell, through a supporting organization, True North Health Services Company, LLC (TNHS), invested approximately $53,500 to acquire a 40.6% minority equity interest in a company established as a joint venture between Northwell and a private equity sponsor. The joint venture offers physician revenue cycle management services and patient access services to unrelated entities through its acquisition of an existing company providing such services and the expertise of the management team from Northwell and its partner. TNHS will account for its investment in the joint venture using the equity method of accounting, and it is reported within long-term investments in the accompanying consolidated statements of financial position. The purchase price approximates the investment value at December 31, 2016.
Northwell Health, Inc.
Notes to Consolidated Financial Statements (continued) (In Thousands)
10
1. Organization and Principles of Consolidation (continued)
In April 2015, Northwell entered into an agreement with Optum360, LLC (Optum360), a provider of revenue cycle management solutions and technology, for Optum360 to provide end-to-end revenue cycle services for most of Northwell’s hospitals, effective July 2015. As part of the agreement, Northwell contributed certain intellectual property related to its internal revenue cycle management functions in exchange for an 8% ownership interest in Optum360. A non-cash gain on the transaction of $115,600, representing the difference between the fair value of the interest in Optum360 received in the transaction and the value of the assets contributed, was recorded within non-operating gains and losses in the accompanying consolidated statement of operations for the year ended December 31, 2015. Northwell accounts for this investment using the equity method of accounting. At December 31, 2016 and 2015, $123,976 and $119,983, respectively, is reported within long-term investments in the accompanying consolidated statements of financial position for this investment. Northwell paid management fees of $113,938 and $37,015 to Optum360 for revenue cycle services for the years ended December 31, 2016 and 2015, respectively.
Acquisitions
On January 15, 2016 (the 2016 Acquisition Date), Northwell acquired Peconic Bay Medical Center (Peconic), a not-for-profit corporation that operates a 140 bed acute care hospital and a skilled nursing/rehabilitation center located in eastern Suffolk County, New York. Northwell acquired Peconic by means of an inherent contribution where no consideration was transferred by Northwell. Northwell accounted for the business combination by applying the acquisition method, and accordingly, the inherent contribution received was valued as the excess of Peconic’s assets over liabilities. In determining the inherent contribution received, all assets and liabilities were measured at fair value as of the 2016 Acquisition Date. The results of Peconic’s operations have been included in the consolidated financial statements since the 2016 Acquisition Date. Peconic is not a member of the Obligated Group.
Northwell Health, Inc.
Notes to Consolidated Financial Statements (continued) (In Thousands)
11
1. Organization and Principles of Consolidation (continued)
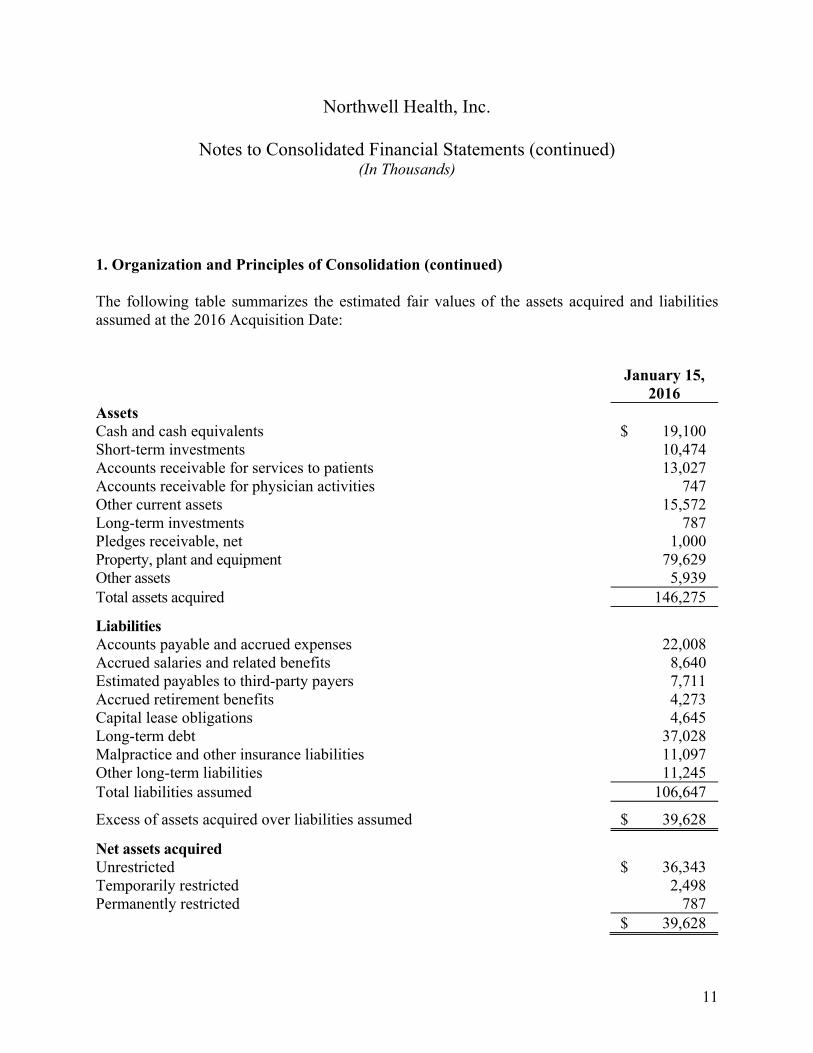
The following table summarizes the estimated fair values of the assets acquired and liabilities assumed at the 2016 Acquisition Date:
January 15,
2016 Assets Cash and cash equivalents $ 19,100 Short-term investments 10,474 Accounts receivable for services to patients 13,027 Accounts receivable for physician activities 747 Other current assets 15,572 Long-term investments 787 Pledges receivable, net 1,000 Property, plant and equipment 79,629 Other assets 5,939 Total assets acquired 146,275 Liabilities Accounts payable and accrued expenses 22,008 Accrued salaries and related benefits 8,640 Estimated payables to third-party payers 7,711 Accrued retirement benefits 4,273 Capital lease obligations 4,645 Long-term debt 37,028 Malpractice and other insurance liabilities 11,097 Other long-term liabilities 11,245 Total liabilities assumed 106,647 Excess of assets acquired over liabilities assumed $ 39,628 Net assets acquired Unrestricted $ 36,343 Temporarily restricted 2,498 Permanently restricted 787
$ 39,628
Northwell Health, Inc.
Notes to Consolidated Financial Statements (continued) (In Thousands)
12
1. Organization and Principles of Consolidation (continued)
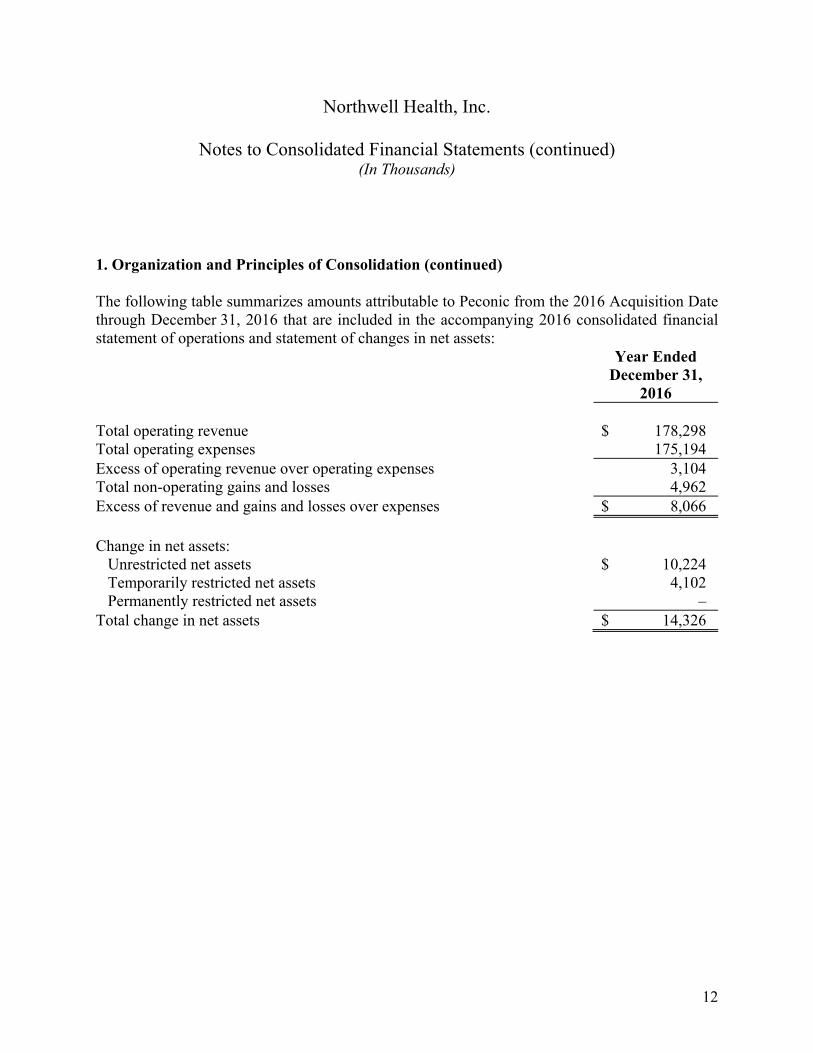
The following table summarizes amounts attributable to Peconic from the 2016 Acquisition Date through December 31, 2016 that are included in the accompanying 2016 consolidated financial statement of operations and statement of changes in net assets: Year Ended
December 31,
2016 Total operating revenue $ 178,298 Total operating expenses 175,194 Excess of operating revenue over operating expenses 3,104 Total non-operating gains and losses 4,962 Excess of revenue and gains and losses over expenses $ 8,066 Change in net assets:
Unrestricted net assets $ 10,224 Temporarily restricted net assets 4,102 Permanently restricted net assets –
Total change in net assets $ 14,326
Northwell Health, Inc.
Notes to Consolidated Financial Statements (continued) (In Thousands)
13
1. Organization and Principles of Consolidation (continued)
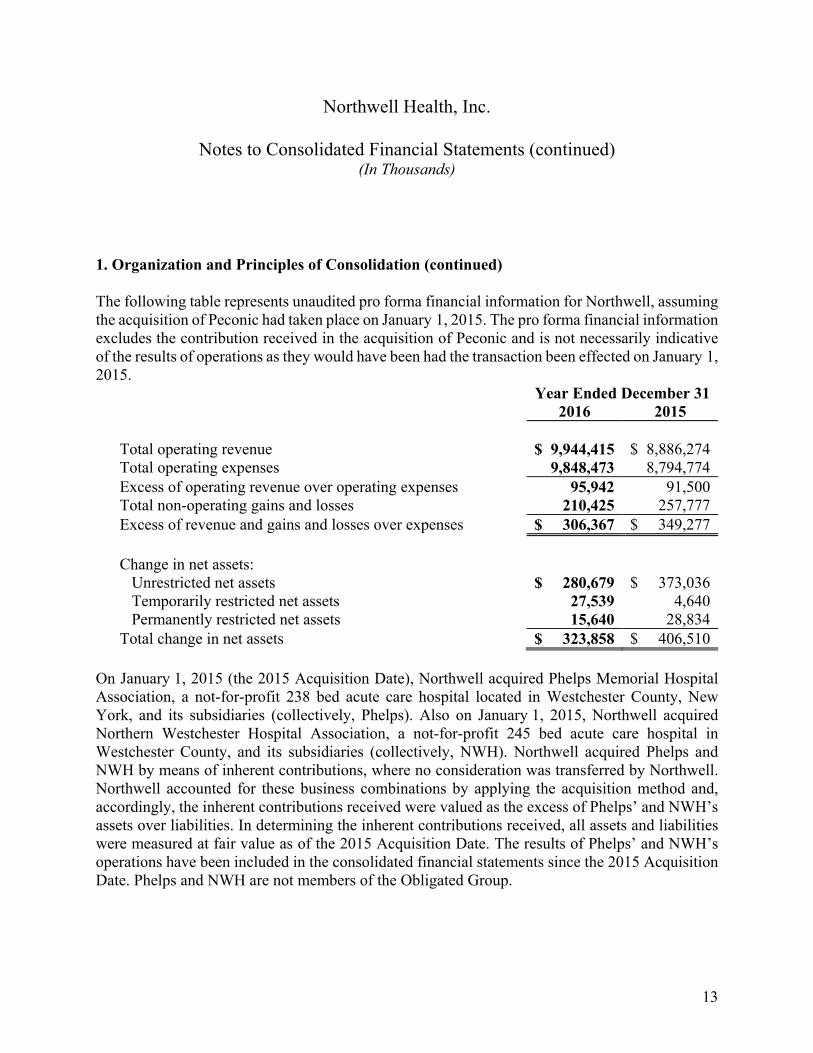
The following table represents unaudited pro forma financial information for Northwell, assuming the acquisition of Peconic had taken place on January 1, 2015. The pro forma financial information excludes the contribution received in the acquisition of Peconic and is not necessarily indicative of the results of operations as they would have been had the transaction been effected on January 1, 2015.
Year Ended December 31 2016 2015 Total operating revenue $ 9,944,415 $ 8,886,274 Total operating expenses 9,848,473 8,794,774 Excess of operating revenue over operating expenses 95,942 91,500 Total non-operating gains and losses 210,425 257,777 Excess of revenue and gains and losses over expenses $ 306,367 $ 349,277 Change in net assets:
Unrestricted net assets $ 280,679 $ 373,036 Temporarily restricted net assets 27,539 4,640 Permanently restricted net assets 15,640 28,834
Total change in net assets $ 323,858 $ 406,510 On January 1, 2015 (the 2015 Acquisition Date), Northwell acquired Phelps Memorial Hospital Association, a not-for-profit 238 bed acute care hospital located in Westchester County, New York, and its subsidiaries (collectively, Phelps). Also on January 1, 2015, Northwell acquired Northern Westchester Hospital Association, a not-for-profit 245 bed acute care hospital in Westchester County, and its subsidiaries (collectively, NWH). Northwell acquired Phelps and NWH by means of inherent contributions, where no consideration was transferred by Northwell. Northwell accounted for these business combinations by applying the acquisition method and, accordingly, the inherent contributions received were valued as the excess of Phelps’ and NWH’s assets over liabilities. In determining the inherent contributions received, all assets and liabilities were measured at fair value as of the 2015 Acquisition Date. The results of Phelps’ and NWH’s operations have been included in the consolidated financial statements since the 2015 Acquisition Date. Phelps and NWH are not members of the Obligated Group.
Northwell Health, Inc.
Notes to Consolidated Financial Statements (continued) (In Thousands)
14
1. Organization and Principles of Consolidation (continued)
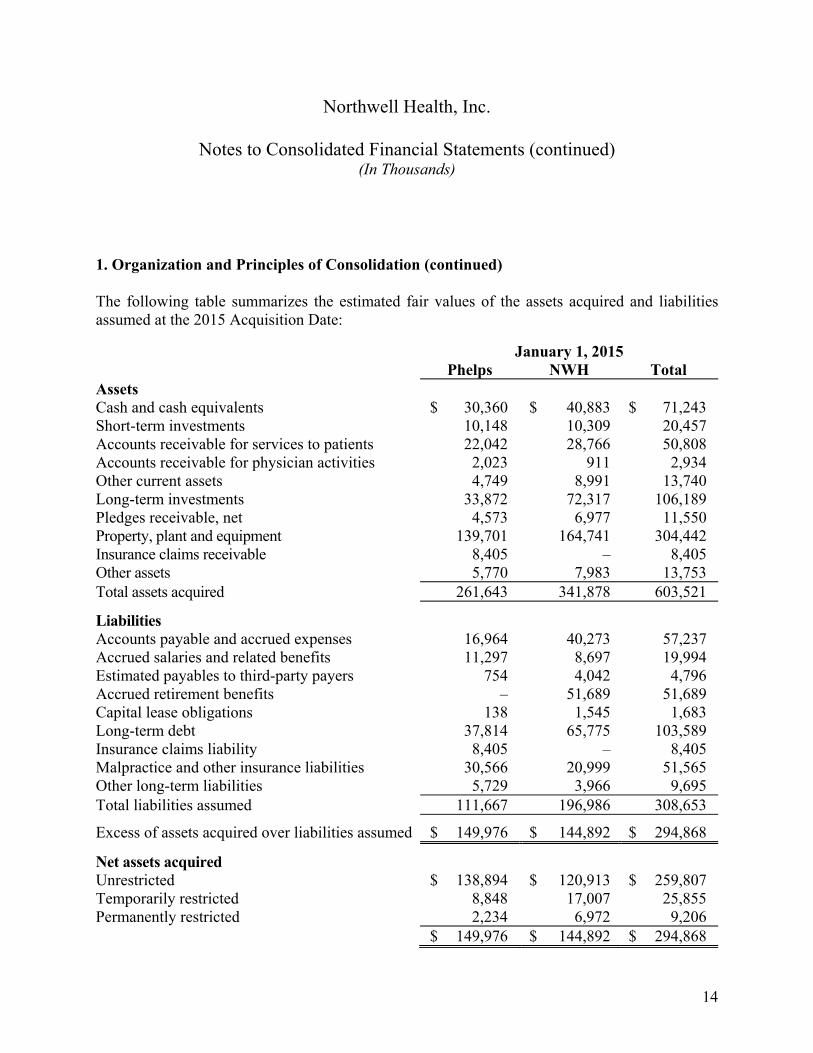
The following table summarizes the estimated fair values of the assets acquired and liabilities assumed at the 2015 Acquisition Date:
January 1, 2015 Phelps NWH Total Assets Cash and cash equivalents $ 30,360 $ 40,883 $ 71,243 Short-term investments 10,148 10,309 20,457 Accounts receivable for services to patients 22,042 28,766 50,808 Accounts receivable for physician activities 2,023 911 2,934 Other current assets 4,749 8,991 13,740 Long-term investments 33,872 72,317 106,189 Pledges receivable, net 4,573 6,977 11,550 Property, plant and equipment 139,701 164,741 304,442 Insurance claims receivable 8,405 – 8,405 Other assets 5,770 7,983 13,753 Total assets acquired 261,643 341,878 603,521 Liabilities Accounts payable and accrued expenses 16,964 40,273 57,237 Accrued salaries and related benefits 11,297 8,697 19,994 Estimated payables to third-party payers 754 4,042 4,796 Accrued retirement benefits – 51,689 51,689 Capital lease obligations 138 1,545 1,683 Long-term debt 37,814 65,775 103,589 Insurance claims liability 8,405 – 8,405 Malpractice and other insurance liabilities 30,566 20,999 51,565 Other long-term liabilities 5,729 3,966 9,695 Total liabilities assumed 111,667 196,986 308,653 Excess of assets acquired over liabilities assumed $ 149,976 $ 144,892 $ 294,868 Net assets acquired Unrestricted $ 138,894 $ 120,913 $ 259,807 Temporarily restricted 8,848 17,007 25,855 Permanently restricted 2,234 6,972 9,206
$ 149,976 $ 144,892 $ 294,868
Northwell Health, Inc.
Notes to Consolidated Financial Statements (continued) (In Thousands)
15
1. Organization and Principles of Consolidation (continued)
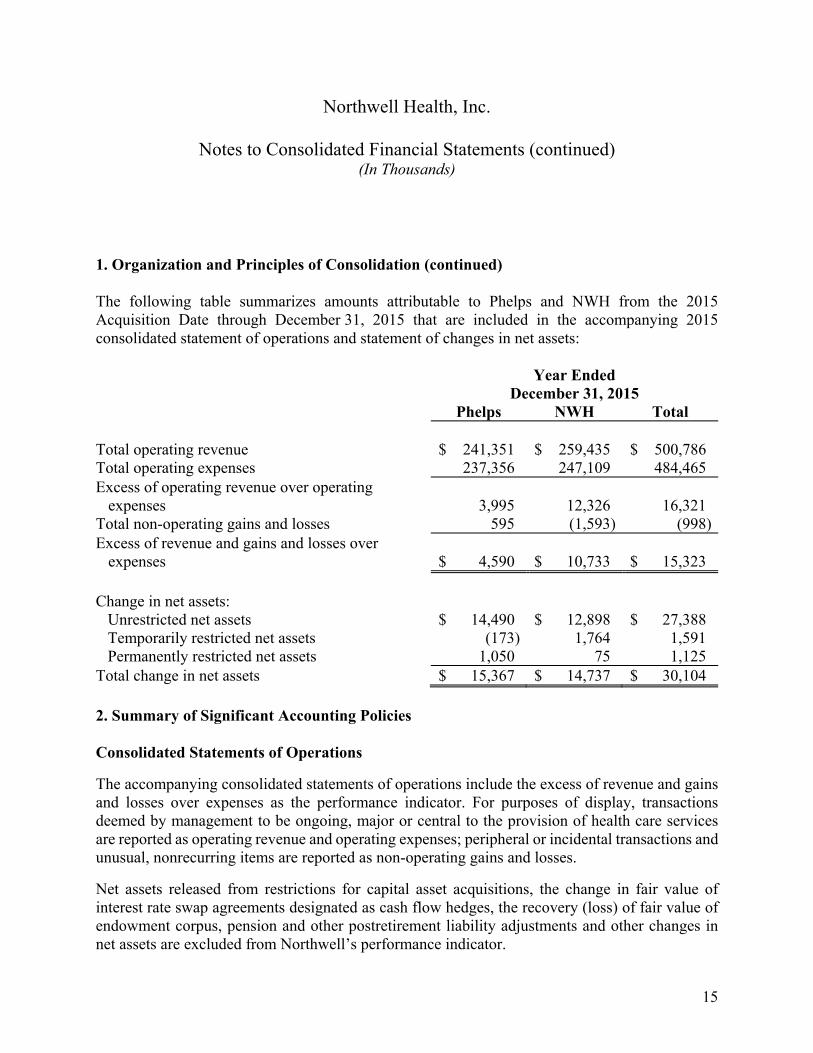
The following table summarizes amounts attributable to Phelps and NWH from the 2015 Acquisition Date through December 31, 2015 that are included in the accompanying 2015 consolidated statement of operations and statement of changes in net assets:
Year Ended
December 31, 2015 Phelps NWH Total Total operating revenue $ 241,351 $ 259,435 $ 500,786 Total operating expenses 237,356 247,109 484,465 Excess of operating revenue over operating
expenses 3,995 12,326 16,321 Total non-operating gains and losses 595 (1,593) (998)Excess of revenue and gains and losses over
expenses $ 4,590 $ 10,733 $ 15,323 Change in net assets:
Unrestricted net assets $ 14,490 $ 12,898 $ 27,388 Temporarily restricted net assets (173) 1,764 1,591 Permanently restricted net assets 1,050 75 1,125
Total change in net assets $ 15,367 $ 14,737 $ 30,104 2. Summary of Significant Accounting Policies
Consolidated Statements of Operations
The accompanying consolidated statements of operations include the excess of revenue and gains and losses over expenses as the performance indicator. For purposes of display, transactions deemed by management to be ongoing, major or central to the provision of health care services are reported as operating revenue and operating expenses; peripheral or incidental transactions and unusual, nonrecurring items are reported as non-operating gains and losses.
Net assets released from restrictions for capital asset acquisitions, the change in fair value of interest rate swap agreements designated as cash flow hedges, the recovery (loss) of fair value of endowment corpus, pension and other postretirement liability adjustments and other changes in net assets are excluded from Northwell’s performance indicator.
Northwell Health, Inc.
Notes to Consolidated Financial Statements (continued) (In Thousands)
16
2. Summary of Significant Accounting Policies (continued)
Recent Accounting Standards
In May 2014, the Financial Accounting Standards Board (FASB) issued Accounting Standards Update No. (ASU) 2014-09, Revenue from Contracts with Customers. The core principle of ASU 2014-09 is that an entity should recognize revenue to depict the transfer of promised goods or services to customers in an amount that reflects the consideration to which the entity expects to be entitled in exchange for those goods or services. The guidance in ASU 2014-09 supersedes the FASB’s current revenue recognition requirements and most industry-specific guidance. The provisions of ASU 2014-09, as amended by ASU 2015-14, are effective for Northwell for annual reporting periods beginning after December 15, 2017, including interim reporting periods within that reporting period. Early application is permitted only as of annual reporting periods beginning after December 15, 2016, including interim reporting periods within that reporting period. Northwell has not completed the process of evaluating the impact of ASU 2014-09 on its consolidated financial statements.
In August 2014, the FASB issued ASU 2014-15, Presentations of Financial Statements – Going Concern, that requires management of public and nonpublic companies to evaluate and disclose where there is substantial doubt about an entity’s ability to continue as a going concern. Northwell adopted ASU 2014-15 as of December 31, 2016. The adoption did not impact Northwell’s consolidated financial statements.
In April 2015, the FASB issued ASU 2015-05, Customer’s Accounting for Fees Paid in a Cloud Computing Arrangement. ASU 2015-05 provides guidance to customers about whether a cloud computing arrangement includes a software license. If certain criteria are met, an entity may account for such an arrangement under the internal use software guidance included in Accounting Standards Codification (ASC) 350-40, Internal Use Software, whereby amounts are capitalized. If such criteria are not met, the cloud computing arrangement is considered a service contract and the related costs are expensed as incurred. The provisions of ASU 2015-05 became effective for Northwell on January 1, 2016. The adoption of ASU 2015-05 did not have a significant impact on Northwell’s consolidated financial statements.
In February 2016, the FASB issued ASU 2016-02, Leases, that will require lessees to report most leases on their statements of financial position but recognize expenses on their income statements in a manner similar to current accounting. The guidance also eliminates current real estate-specific provisions. The provisions of ASU 2016-02 are effective for Northwell for annual periods beginning after December 15, 2018 and interim periods within those years. Early adoption is permitted. Northwell has not completed the process of evaluating the impact of ASU 2016-02 on its consolidated financial statements.
Northwell Health, Inc.
Notes to Consolidated Financial Statements (continued) (In Thousands)
17
2. Summary of Significant Accounting Policies (continued)
In August 2016, the FASB issued ASU 2016-14, Not-for-Profit Financial Statement Presentation, which eliminates the requirement for not-for profits (NFPs) to classify net assets as unrestricted, temporarily restricted and permanently restricted. Instead, NFPs will be required to classify net assets as net assets with donor restrictions or without donor restrictions. Entities that use the direct method of presenting operating cash flows will no longer be required to provide a reconciliation of the change in net assets to operating cash flows. The guidance also modifies required disclosures and reporting related to net assets, investment expenses and qualitative information regarding liquidity. NFPs will also be required to report all expenses by both functional and natural classification in one location. The provisions of ASU 2016-14 are effective for Northwell for annual periods beginning after December 15, 2017, and interim periods thereafter. Early adoption is permitted. Northwell is in the process of evaluating the impact of ASU 2016-14 on its consolidated financial statements.
In March 2017, the FASB issued ASU 2017-07, Compensation—Retirement Benefits: Improving the Presentation of Net Periodic Pension Cost and Net Periodic Postretirement Benefit Cost. ASU 2017-07 addresses how employers that sponsor defined benefit pension and/or other postretirement benefit plans present the net periodic benefit cost in the statement of operations. Employers will be required to present the service cost component of net periodic benefit cost in the same statement of operations line item as other employee compensation costs arising from services rendered during the period. Employers will present the other components of the net periodic benefit cost separately from the line item that includes the service cost and outside of any subtotal of operating income, if one is presented. The standard is effective for Northwell for fiscal years beginning after December 15, 2018, and interim periods within fiscal years beginning after December 15, 2019. Early adoption is permitted. The adoption of ASU 2017-07 will require Northwell to retain the service cost component of net periodic benefit cost related to its defined benefit pension plans and other postretirement benefit plans (approximately $73,000 for 2016) within employee benefits on the consolidated statements of operations and to present all other components (approximately $40,000 for 2016) as a separate line item excluded from the subtotal for excess of operating revenue over operating expenses. Net periodic benefit cost is recorded currently as a component of employee benefits on the consolidated statements of operations.
Northwell Health, Inc.
Notes to Consolidated Financial Statements (continued) (In Thousands)
18
2. Summary of Significant Accounting Policies (continued)
Use of Estimates
The preparation of financial statements in conformity with U.S. generally accepted accounting principles requires management to make estimates and assumptions that affect the reported amounts of assets, including accounts receivable for services to patients, and liabilities, including estimated payables to third-party payers, accrued retirement benefits and malpractice and other insurance liabilities, and disclosures of contingent assets and liabilities at the date of the financial statements. Estimates also affect the reported amounts of revenue and expenses during the period. Actual results could differ from those estimates.
During 2016 and 2015, Northwell revised certain estimates made in prior years to reflect the passage of time and the availability of more recent information. For the year ended December 31, 2016, the net change in estimates related to prior years resulted in a decrease in liabilities by approximately $45,000, primarily due to a reduction in estimated payables to third-party payers related to modifications made by the Centers for Medicare and Medicaid Services (CMS) in 2016 to the Medicare recovery audit contractor program. For the year ended December 31, 2015, the net change in estimates affecting the reported amounts of assets and liabilities related to prior years was not significant.
Cash and Cash Equivalents
Northwell classifies all highly liquid financial instruments purchased with a maturity of three months or less, other than those held in the investment portfolio, as cash equivalents. Northwell maintains cash on deposit with major banks and invests in money market securities with financial institutions which exceed federally-insured limits. Management believes the credit risk related to these deposits is minimal. Northwell does not hold any money market funds with significant liquidity restrictions that would be required to be excluded from cash equivalents.
Accounts Receivable and Patient Revenue
Net patient service revenue and physician practice revenue (collectively, patient revenue) are reported at estimated net realizable amounts due from patients and third-party payers for services rendered and include estimated retroactive revenue adjustments due to ongoing and future audits, reviews and investigations. Retroactive adjustments are considered in the recognition of revenue on an estimated basis in the period the related services are provided and are adjusted in future periods as adjustments become known or as years are no longer subject to such audits, reviews and investigations.
Northwell Health, Inc.
Notes to Consolidated Financial Statements (continued) (In Thousands)
19
2. Summary of Significant Accounting Policies (continued)
Northwell recognizes accounts receivable and patient revenue associated with services provided to patients who have third-party payer coverage on the basis of contractual rates, governmental rates or established charges for the services rendered. For uninsured patients who are ineligible for any government assistance program, Northwell provides services without charge or at amounts less than its established rates for patients who meet the criteria of its charity care policy. Because Northwell does not pursue collection of amounts determined to qualify as charity care, such services are not reported as patient revenue. For patients who were determined by Northwell to have the ability to pay but do not, the estimated uncollectible amounts are recorded as the provision for bad debts. In distinguishing charity care from the provision for bad debts, a number of factors are considered, certain of which require a high degree of judgment.
Patient revenue, net of contractual and charity care allowances, but before the provision for bad debts, from insured and self-pay patients was approximately $8,825,000 and $83,000, respectively, for the year ended December 31, 2016, and approximately $7,995,000 and $94,000, respectively, for the year ended December 31, 2015. Deductibles and copayments due from patients under third-party payment programs are included in the insured amount above.
The allowance for doubtful accounts represents Northwell’s estimate of the uncollectible accounts receivable related to bad debts. Additions to the allowance for doubtful accounts result from the provision for bad debts. Accounts written off as uncollectible are deducted from the allowance for doubtful accounts. The allowance for doubtful accounts is based upon Northwell’s assessment of historical and expected net collections, business and economic conditions, trends in health care coverage and other collection indicators.
For receivables associated with services provided to patients who have third-party payer coverage, Northwell analyzes amounts due from third-parties and provides an allowance for doubtful accounts and a provision for bad debts, if necessary (for example, for third-party payers who are known to be having financial difficulties that make the realization of amounts due unlikely). For receivables associated with self-pay balances, which includes amounts for patients without insurance, patients with deductible and copayment balances due after third-party coverage and balances for services not covered by insurance, Northwell records an allowance for doubtful accounts and a provision for bad debts in the period of service based on past experience. The allowances for both doubtful accounts and anticipated charity care for self-pay patients aggregated to approximately 84% and 87% of the gross self-pay accounts receivable balance as of December 31, 2016 and 2015, respectively.
Northwell Health, Inc.
Notes to Consolidated Financial Statements (continued) (In Thousands)
20
2. Summary of Significant Accounting Policies (continued)
Northwell’s allowance for doubtful accounts relating to accounts receivable for services to patients and accounts receivable for physician activities totaled approximately $124,600 and $106,900 at December 31, 2016 and 2015, respectively.
Northwell has agreements with third-party payers that provide for payment for services rendered at amounts different from its established charges. A summary of the payment arrangements with major third-party payers follows:
Non-Medicare Reimbursement
In New York State, hospitals and all non-Medicare payers, except Medicaid, workers’ compensation and no-fault insurance programs, negotiate payment rates. If negotiated rates are not established, payers are billed at hospitals’ established charges. Medicaid, workers’ compensation and no-fault payers pay hospital rates promulgated by the New York State Department of Health (NYSDOH). Effective December 1, 2009, the New York State prospective payment methodology was updated such that payments to hospitals for Medicaid, workers’ compensation and no-fault inpatient services are based on a statewide rate, with retroactive adjustments for certain rate components paid concurrently with the settlement of the final rate. Outpatient services also are paid based on a statewide prospective system that was effective December 1, 2008. Medicaid rate methodologies are subject to approval at the Federal level by CMS, which may routinely request information about such methodologies prior to approval. Revenue related to specific rate components that have not been approved by CMS is not recognized until Northwell is reasonably assured that such amounts are realizable. Adjustments to the current and prior years’ payment rates for those payers will continue to be made in future years.
Medicare Reimbursement
Hospitals are paid for most Medicare inpatient and outpatient services under the national prospective payment system and other methodologies of the Medicare program for certain other services. Federal regulations provide for certain adjustments to current and prior years’ payment rates, based on industry-wide and Northwell-specific data.
Northwell Health, Inc.
Notes to Consolidated Financial Statements (continued) (In Thousands)
21
2. Summary of Significant Accounting Policies (continued)
Northwell has established estimates, based on information presently available, of amounts due to or from Medicare and non-Medicare payers for adjustments to current and prior years’ payment rates, based on industry-wide and Northwell-specific data. The current Medicaid, Medicare and other third-party payer programs are based upon extremely complex laws and regulations that are subject to interpretation. Noncompliance with such laws and regulations could result in fines, penalties and exclusion from such programs. Northwell is not aware of any allegations of noncompliance that could have a material adverse effect on the accompanying consolidated financial statements and believes that it is in compliance with all applicable laws and regulations. Medicare cost reports, which are filed individually by the applicable Northwell entities and serve as the basis for final settlement with the Medicare program, have been audited by the Medicare fiscal intermediary and settled through years ranging from 2000 to 2014. Other years remain open for audit and settlement, as do certain issues related to the New York State Medicaid program for prior years. As a result, there is at least a reasonable possibility that recorded estimates will change by a material amount when open years are settled and additional information is obtained.
There are various proposals at the Federal and State levels that could, among other things, significantly reduce payment rates or modify payment methods. The ultimate outcome of these proposals and other market changes, including the potential effects of revisions to health care regulations that may be enacted by the Federal and State governments, cannot presently be determined. Future changes in the Medicare and Medicaid programs and any reduction of funding could have an adverse impact on Northwell. Additionally, certain payers’ payment rates for various years have been appealed by certain members of Northwell. If the appeals are successful, additional income applicable to those years might be realized.
Northwell grants credit without collateral to its patients, most of whom are insured under various third-party agreements. Government payer programs account for a significant portion of net patient service revenue. For the years ended December 31, 2016 and 2015, revenue from the Medicare and Medicaid programs, including Medicare and Medicaid managed care programs, accounted for approximately 50% of Northwell’s net patient service revenue.
Northwell Health, Inc.
Notes to Consolidated Financial Statements (continued) (In Thousands)
22
2. Summary of Significant Accounting Policies (continued)
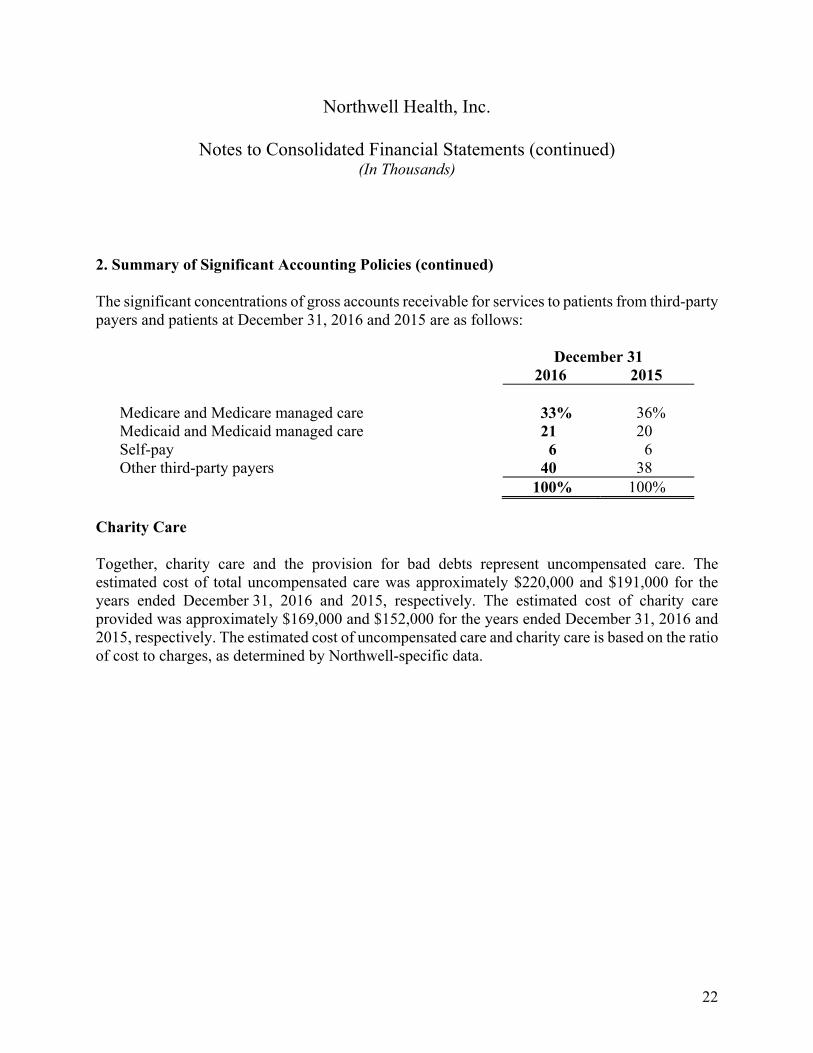
The significant concentrations of gross accounts receivable for services to patients from third-party payers and patients at December 31, 2016 and 2015 are as follows:
December 31 2016 2015 Medicare and Medicare managed care 33% 36% Medicaid and Medicaid managed care 21 20 Self-pay 6 6 Other third-party payers 40 38 100% 100%
Charity Care
Together, charity care and the provision for bad debts represent uncompensated care. The estimated cost of total uncompensated care was approximately $220,000 and $191,000 for the years ended December 31, 2016 and 2015, respectively. The estimated cost of charity care provided was approximately $169,000 and $152,000 for the years ended December 31, 2016 and 2015, respectively. The estimated cost of uncompensated care and charity care is based on the ratio of cost to charges, as determined by Northwell-specific data.
Northwell Health, Inc.
Notes to Consolidated Financial Statements (continued) (In Thousands)
23
2. Summary of Significant Accounting Policies (continued)
The NYSDOH Hospital Indigent Care Pool (the Pool) was established to provide funds to hospitals for the provision of uncompensated care and is funded, in part, by a 1% assessment on hospital net inpatient service revenue. For the years ended December 31, 2016 and 2015, Northwell received $76,240 and $88,823, respectively, in Pool distributions, of which approximately $59,000 and $72,000 was related to charity care. Northwell made payments into the Pool of $48,767 and $46,620 for the years ended December 31, 2016 and 2015, respectively, for the 1% assessment.
Pledges Receivable
Pledges (promises to give), less an allowance for uncollectible amounts, are recorded as receivables in the year made at net present value and are recorded as temporarily or permanently restricted net assets. Pledges receivable that are due more than one year from the statement of financial position date are discounted to reflect the present value of future cash flows.
Short-term and Long-term Investments
Short-term and long-term investments include marketable securities and other investments. Marketable securities are classified as trading securities. Investments in debt securities, equity securities and mutual funds with readily determinable fair values are reported at fair value, based on quoted market prices.
Northwell has also invested in investment funds of hedge funds (funds of hedge funds), hedge funds, private equity funds and private real estate funds. These other investments are not readily marketable and are reported under the equity method of accounting, which approximates fair value. The equity method reflects Northwell’s share of the net asset value of the respective funds.
Northwell Health, Inc.
Notes to Consolidated Financial Statements (continued) (In Thousands)
24
2. Summary of Significant Accounting Policies (continued)
Individual investment holdings of the funds of hedge funds, hedge funds, private equity funds and private real estate funds may include investments in both nonmarketable and market-traded securities. Valuations of these investments, and therefore Northwell’s holdings, may be determined by the investment managers or general partners. Values may be based on estimates that require varying degrees of judgment. Recorded estimates may change by a material amount in the near term. The investments may indirectly expose Northwell to securities lending, short sales of securities and trading in futures and forwards contracts, options and other derivative products. However, Northwell’s risk is limited to its amounts invested. The financial statements of the funds of hedge funds, hedge funds, private equity funds and private real estate funds are audited annually by independent auditors. At December 31, 2016, Northwell has future commitments of $101,733 and $11,277 to invest in private equity and private real estate funds for pension and restricted assets, respectively.
Other investments also include certain direct equity method investments, as well as investments in commingled fixed income, equity and risk-parity funds. Direct equity method investments are non-controlling interests in joint ventures held by Northwell for investment purposes and include the investment in Optum360 and the TNHS investment, disclosed in Note 1. The underlying investment holdings of the commingled funds are predominantly marketable securities. These investments are reported under the equity method of accounting, which approximates fair value. The equity method reflects Northwell’s share of the net asset value of these investments. The financial statements of the commingled fixed income, equity and risk-parity funds are audited annually by independent auditors.
Included in investments are assets limited as to use, which include funds held pursuant to debt financing arrangements, internally designated funds (including internally designated malpractice and other self-insurance assets), deferred employee compensation plans and temporarily and permanently restricted assets. Amounts required to meet current liabilities are reported as short-term investments.
Investment income (including realized gains and losses on investments, interest and dividends) and the change in net unrealized gains and losses and change in value of equity method investments are included in the performance indicator, unless the income or loss is restricted by donor or law. Interest and dividend income earned on Northwell’s internally designated malpractice and other self-insurance assets is recorded in other operating revenue.
Northwell Health, Inc.
Notes to Consolidated Financial Statements (continued) (In Thousands)
25
2. Summary of Significant Accounting Policies (continued)
Inventory of Supplies
Inventory, included in other current assets, is stated at the lower of cost (first-in, first-out method) or market.
Insurance Claims Receivable and Liability
For medical malpractice and similar contingent liabilities, Northwell does not net insurance recoveries against related claims liabilities and determines such claims liabilities without consideration of insurance recoveries. Accordingly, Northwell recognizes insurance receivables at the same time that it recognizes the liabilities, measured on the same basis as the liabilities, subject to the need for a valuation allowance for uncollectible amounts in the accompanying consolidated statements of financial position. Such amounts represent the actuarially determined present value of medical malpractice and other claims that are anticipated to be covered by insurance, discounted at a rate of 2.0%.
Property, Plant and Equipment
Property, plant and equipment is stated at cost or, in the case of gifts, at fair value at the date of the gift, less accumulated depreciation and amortization. Property, plant and equipment of The Long Island Home, Phelps, NWH, Peconic and Lenox that existed at their respective acquisition dates was recorded at fair value based upon an independent valuation. Depreciation and amortization of land improvements, buildings, fixed equipment and major movable equipment is computed by the straight-line method based upon the estimated useful lives of the assets, ranging from three to forty years.
Equipment under capital lease obligations and leasehold improvements are amortized using the straight-line method over the lesser of the estimated useful life of the asset or the lease term. Such amortization is included in depreciation and amortization in the accompanying consolidated financial statements.
Northwell Health, Inc.
Notes to Consolidated Financial Statements (continued) (In Thousands)
26
2. Summary of Significant Accounting Policies (continued)
During the period of construction of capital assets, interest costs are capitalized as a component of the cost of assets. When assets are disposed of, the carrying amounts of the assets and the related accumulated depreciation are removed from the accounts, and any resulting gain or loss on disposal is included in the performance indicator. When assets become fully depreciated, the carrying amounts of such assets and the related accumulated depreciation are removed from the accounts (see Note 5).
Long-Lived Assets
Gifts of long-lived assets are reported at fair value established at the date of contribution as changes in unrestricted net assets, excluded from the performance indicator, unless explicit donor stipulations specify how the donated asset must be used.
Long-lived assets are reviewed for impairment whenever events or changes in circumstances indicate that the carrying amount of an asset may not be recoverable. If long-lived assets are deemed to be impaired, the impairment to be recognized is measured as the amount by which the carrying amount of the assets exceeds the fair value. Assets to be disposed of are reported at the lower of the carrying amount or the fair value, less costs to sell.
Other Assets
Other assets included in the accompanying consolidated statements of financial position primarily consist of intangible assets and investments in clinical joint ventures.
In connection with various acquisitions, Northwell has recognized certain indefinite-lived intangible assets totaling approximately $93,000 and $73,000 at December 31, 2016 and 2015, respectively. The intangible assets are subject to impairment testing on an annual basis. At December 31, 2016 and 2015, Northwell determined that there has been no impairment of these intangible assets.
Northwell Health, Inc.
Notes to Consolidated Financial Statements (continued) (In Thousands)
27
2. Summary of Significant Accounting Policies (continued)
Deferred Financing Costs
Deferred financing costs, included in long-term debt and capital lease obligations, represent costs incurred to obtain financing for various Northwell projects and initiatives. Amortization of these costs is provided over the term of the applicable indebtedness.
Interest Rate Swap Agreements
Interest rate swap agreements are reported at fair value. Fair value is estimated using discounted cash flow analyses based on current and projected interest rates with consideration of the risk of non-performance. Changes in fair value of interest rate swap agreements designated as derivative instruments are recognized in Northwell’s performance indicator. Changes in fair value of interest rate swap agreements designated as cash flow hedges are excluded from the performance indicator.
Other Long-Term Liabilities
Other long-term liabilities included in the accompanying consolidated statements of financial position primarily consist of the long-term portion of estimated payables to third-party payers, deferred rent payable, asset retirement obligations, deferred revenue, and the fair value of the interest rate swap agreements.
Temporarily and Permanently Restricted Net Assets
Temporarily restricted net assets are restricted by donors or other external parties to be used for designated purposes or over specified time periods. When donor restrictions expire, that is, when a time restriction ends or a purpose restriction is accomplished, temporarily restricted net assets are reclassified to unrestricted net assets and reported as net assets released from restrictions.
Permanently restricted net assets have been restricted by donors to be maintained in perpetuity. Income from these net assets is available to support certain teaching, research and training programs.
Northwell Health, Inc.
Notes to Consolidated Financial Statements (continued) (In Thousands)
28
2. Summary of Significant Accounting Policies (continued)
Donor Gifts
Gifts of cash and other assets, including unconditional promises to give cash and other assets (pledges), are reported at fair value when the gift is received (or promise is made). Donor-restricted contributions whose restrictions are met within the same year as received are classified as unrestricted contributions in the accompanying consolidated financial statements. Northwell receives conditional pledges, which are not reflected in the accompanying consolidated financial statements. The conditional pledges primarily relate to the establishment of certain programs. As the conditions of the pledges are met, the pledges are recognized. At December 31, 2016 and 2015, $18,471 and $11,305, respectively, of conditional pledges have not been recognized in the consolidated statements of financial position.
Contributions and pledges raised through fundraising efforts for the years ended December 31, 2016 and 2015 are summarized as follows:
2016 2015 Unrestricted $ 2,987 $ 3,894 Temporarily restricted 93,752 39,934 Permanently restricted 15,640 19,628 $ 112,379 $ 63,456
Health Insurance Premium Revenue
Health insurance premium revenue for Health Plan and CareConnect (collectively, the Health Insurance Companies) is earned over the term of the related insurance policies and recorded in the month for which members are entitled to health care services at estimated net realizable value. Unearned premium reserves, which are established to cover the unexpired portion of premiums written and are included in accounts payable and accrued expenses in the accompanying consolidated statements of financial position, totaled $25,522 and $7,977 for the years ended December 31, 2016 and 2015, respectively. Included in other current assets in the accompanying consolidated statements of financial position at December 31, 2016 and 2015 is $10,361 and $8,005, respectively, of health insurance premium receivables.
Northwell Health, Inc.
Notes to Consolidated Financial Statements (continued) (In Thousands)
29
2. Summary of Significant Accounting Policies (continued)
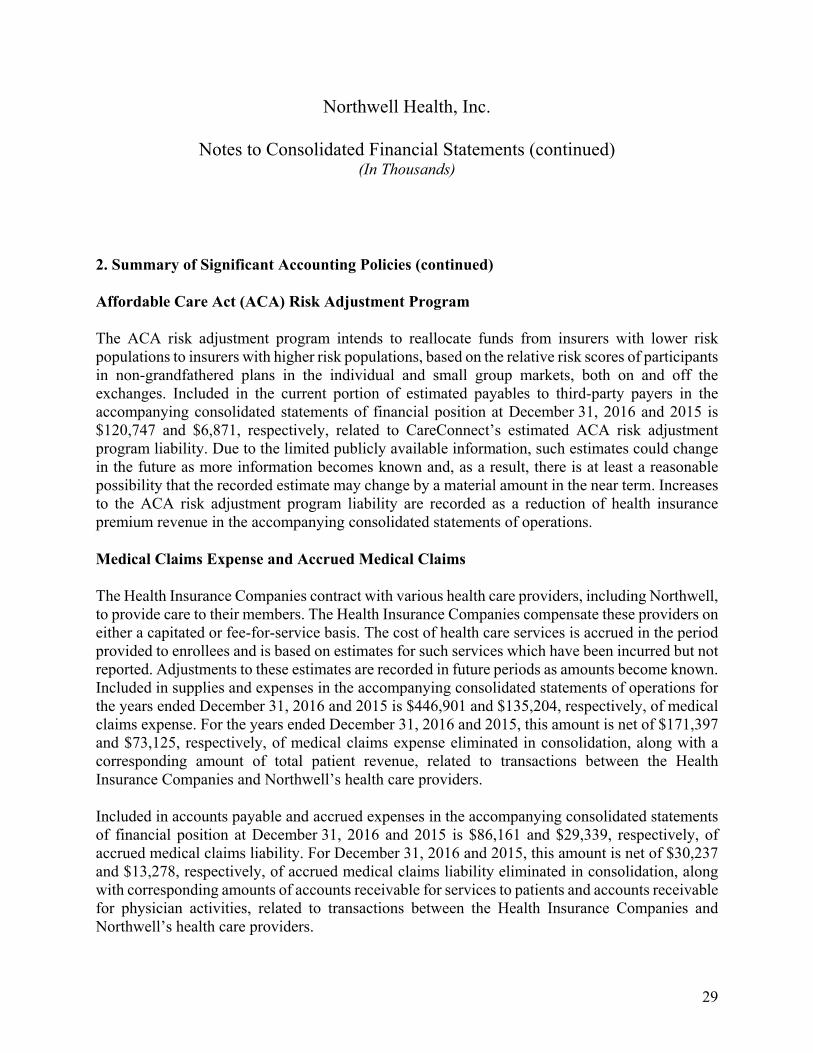
Affordable Care Act (ACA) Risk Adjustment Program
The ACA risk adjustment program intends to reallocate funds from insurers with lower risk populations to insurers with higher risk populations, based on the relative risk scores of participants in non-grandfathered plans in the individual and small group markets, both on and off the exchanges. Included in the current portion of estimated payables to third-party payers in the accompanying consolidated statements of financial position at December 31, 2016 and 2015 is $120,747 and $6,871, respectively, related to CareConnect’s estimated ACA risk adjustment program liability. Due to the limited publicly available information, such estimates could change in the future as more information becomes known and, as a result, there is at least a reasonable possibility that the recorded estimate may change by a material amount in the near term. Increases to the ACA risk adjustment program liability are recorded as a reduction of health insurance premium revenue in the accompanying consolidated statements of operations.
Medical Claims Expense and Accrued Medical Claims
The Health Insurance Companies contract with various health care providers, including Northwell, to provide care to their members. The Health Insurance Companies compensate these providers on either a capitated or fee-for-service basis. The cost of health care services is accrued in the period provided to enrollees and is based on estimates for such services which have been incurred but not reported. Adjustments to these estimates are recorded in future periods as amounts become known. Included in supplies and expenses in the accompanying consolidated statements of operations for the years ended December 31, 2016 and 2015 is $446,901 and $135,204, respectively, of medical claims expense. For the years ended December 31, 2016 and 2015, this amount is net of $171,397 and $73,125, respectively, of medical claims expense eliminated in consolidation, along with a corresponding amount of total patient revenue, related to transactions between the Health Insurance Companies and Northwell’s health care providers.
Included in accounts payable and accrued expenses in the accompanying consolidated statements of financial position at December 31, 2016 and 2015 is $86,161 and $29,339, respectively, of accrued medical claims liability. For December 31, 2016 and 2015, this amount is net of $30,237 and $13,278, respectively, of accrued medical claims liability eliminated in consolidation, along with corresponding amounts of accounts receivable for services to patients and accounts receivable for physician activities, related to transactions between the Health Insurance Companies and Northwell’s health care providers.
Northwell Health, Inc.
Notes to Consolidated Financial Statements (continued) (In Thousands)
30
2. Summary of Significant Accounting Policies (continued)
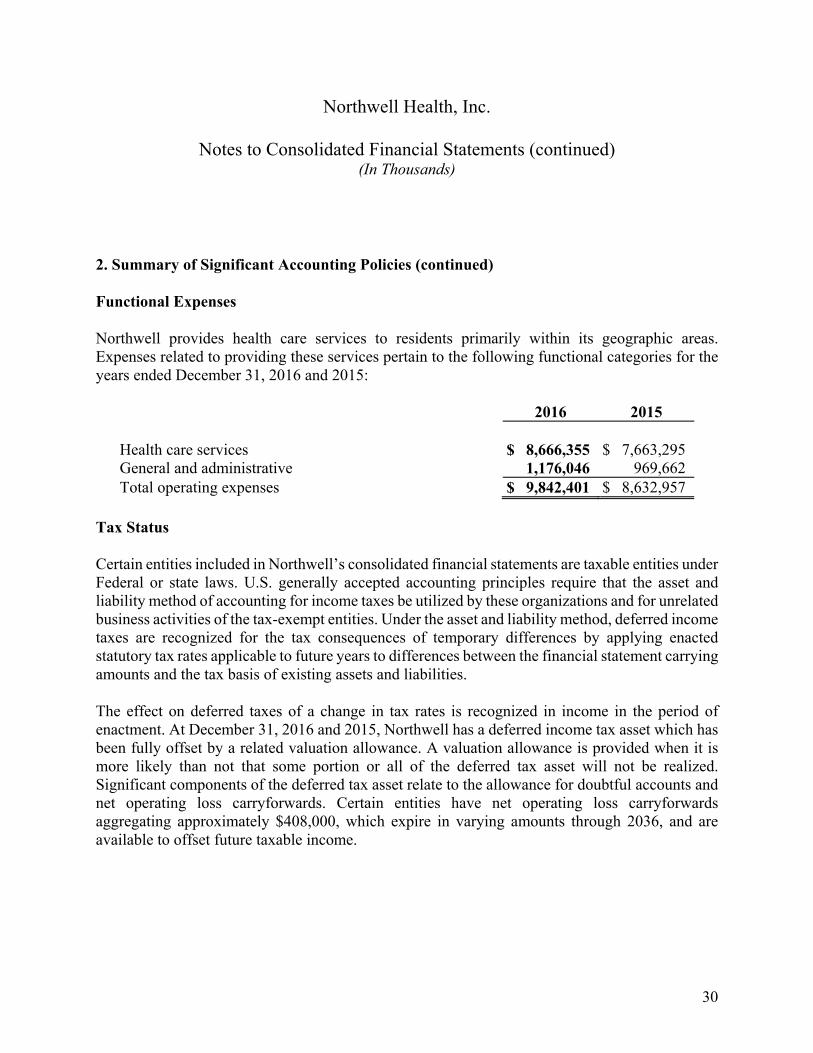
Functional Expenses
Northwell provides health care services to residents primarily within its geographic areas. Expenses related to providing these services pertain to the following functional categories for the years ended December 31, 2016 and 2015:
2016 2015 Health care services $ 8,666,355 $ 7,663,295 General and administrative 1,176,046 969,662 Total operating expenses $ 9,842,401 $ 8,632,957
Tax Status
Certain entities included in Northwell’s consolidated financial statements are taxable entities under Federal or state laws. U.S. generally accepted accounting principles require that the asset and liability method of accounting for income taxes be utilized by these organizations and for unrelated business activities of the tax-exempt entities. Under the asset and liability method, deferred income taxes are recognized for the tax consequences of temporary differences by applying enacted statutory tax rates applicable to future years to differences between the financial statement carrying amounts and the tax basis of existing assets and liabilities.
The effect on deferred taxes of a change in tax rates is recognized in income in the period of enactment. At December 31, 2016 and 2015, Northwell has a deferred income tax asset which has been fully offset by a related valuation allowance. A valuation allowance is provided when it is more likely than not that some portion or all of the deferred tax asset will not be realized. Significant components of the deferred tax asset relate to the allowance for doubtful accounts and net operating loss carryforwards. Certain entities have net operating loss carryforwards aggregating approximately $408,000, which expire in varying amounts through 2036, and are available to offset future taxable income.
Northwell Health, Inc.
Notes to Consolidated Financial Statements (continued) (In Thousands)
31
2. Summary of Significant Accounting Policies (continued)
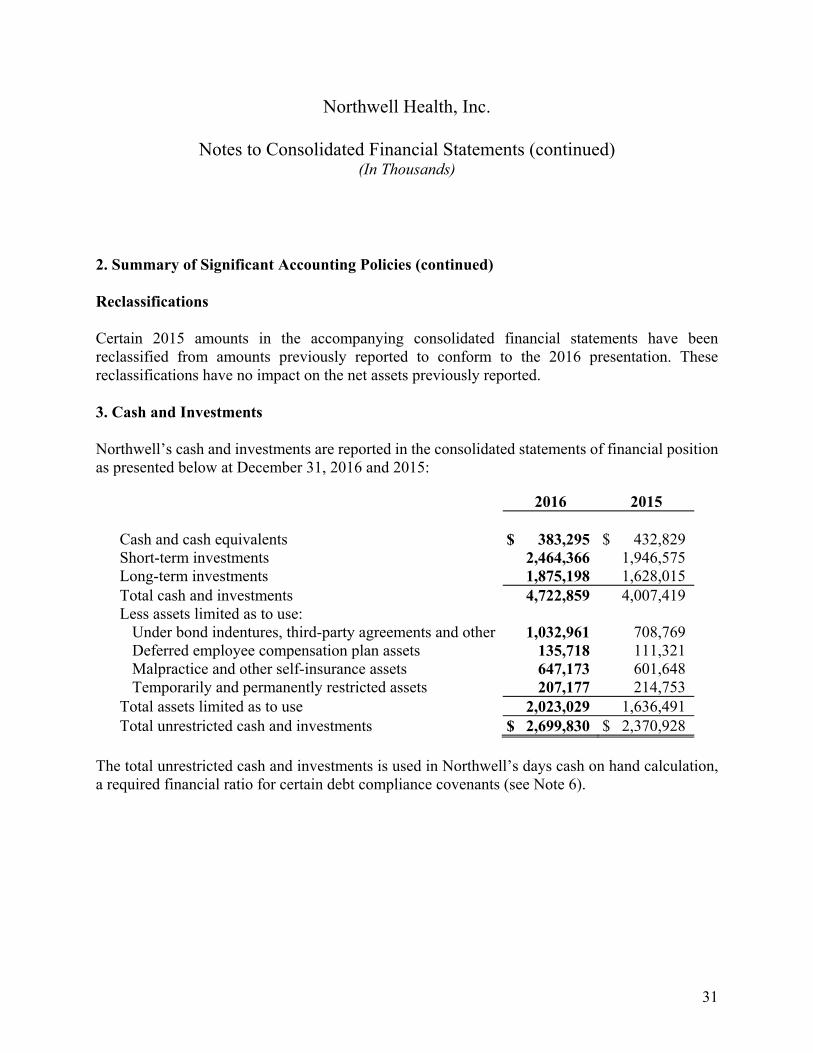
Reclassifications
Certain 2015 amounts in the accompanying consolidated financial statements have been reclassified from amounts previously reported to conform to the 2016 presentation. These reclassifications have no impact on the net assets previously reported.
3. Cash and Investments
Northwell’s cash and investments are reported in the consolidated statements of financial position as presented below at December 31, 2016 and 2015:
2016 2015 Cash and cash equivalents $ 383,295 $ 432,829 Short-term investments 2,464,366 1,946,575 Long-term investments 1,875,198 1,628,015 Total cash and investments 4,722,859 4,007,419 Less assets limited as to use:
Under bond indentures, third-party agreements and other 1,032,961 708,769 Deferred employee compensation plan assets 135,718 111,321 Malpractice and other self-insurance assets 647,173 601,648 Temporarily and permanently restricted assets 207,177 214,753
Total assets limited as to use 2,023,029 1,636,491 Total unrestricted cash and investments $ 2,699,830 $ 2,370,928
The total unrestricted cash and investments is used in Northwell’s days cash on hand calculation, a required financial ratio for certain debt compliance covenants (see Note 6).
Northwell Health, Inc.
Notes to Consolidated Financial Statements (continued) (In Thousands)
32
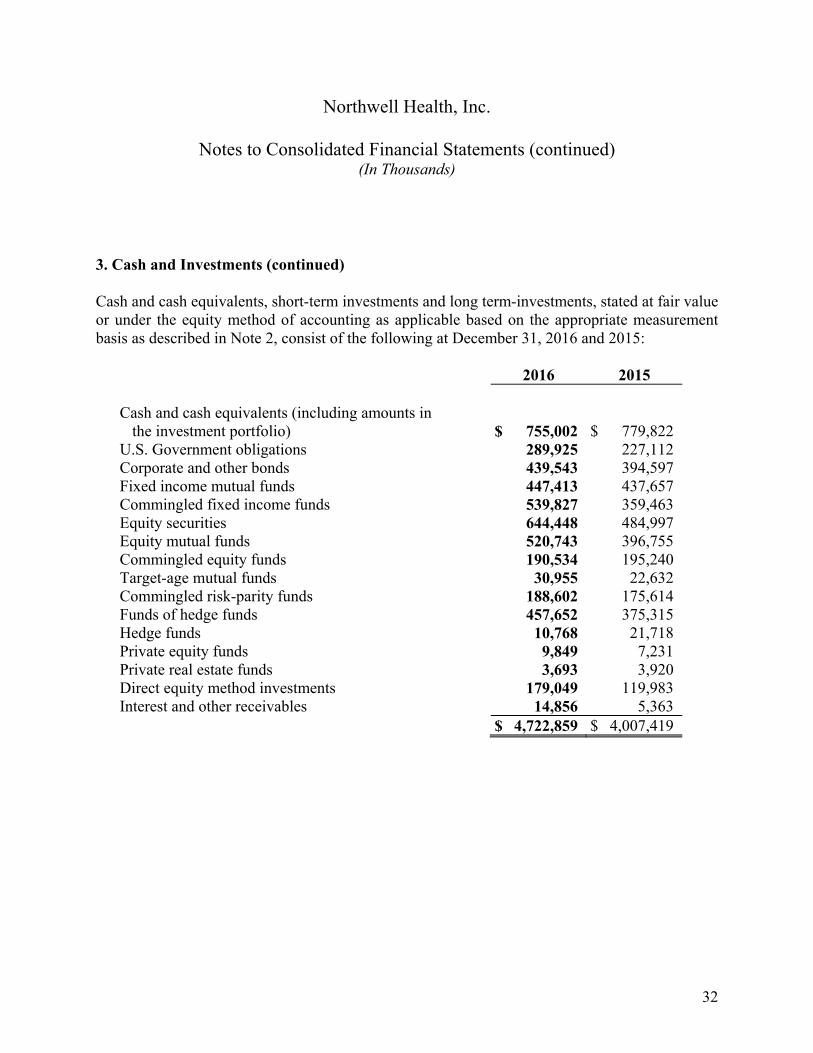
3. Cash and Investments (continued)
Cash and cash equivalents, short-term investments and long term-investments, stated at fair value or under the equity method of accounting as applicable based on the appropriate measurement basis as described in Note 2, consist of the following at December 31, 2016 and 2015:
2016 2015 Cash and cash equivalents (including amounts in
the investment portfolio) $ 755,002 $ 779,822 U.S. Government obligations 289,925 227,112 Corporate and other bonds 439,543 394,597 Fixed income mutual funds 447,413 437,657 Commingled fixed income funds 539,827 359,463 Equity securities 644,448 484,997 Equity mutual funds 520,743 396,755 Commingled equity funds 190,534 195,240 Target-age mutual funds 30,955 22,632 Commingled risk-parity funds 188,602 175,614 Funds of hedge funds 457,652 375,315 Hedge funds 10,768 21,718 Private equity funds 9,849 7,231 Private real estate funds 3,693 3,920 Direct equity method investments 179,049 119,983 Interest and other receivables 14,856 5,363 $ 4,722,859 $ 4,007,419
Northwell Health, Inc.
Notes to Consolidated Financial Statements (continued) (In Thousands)
33
3. Cash and Investments (continued)
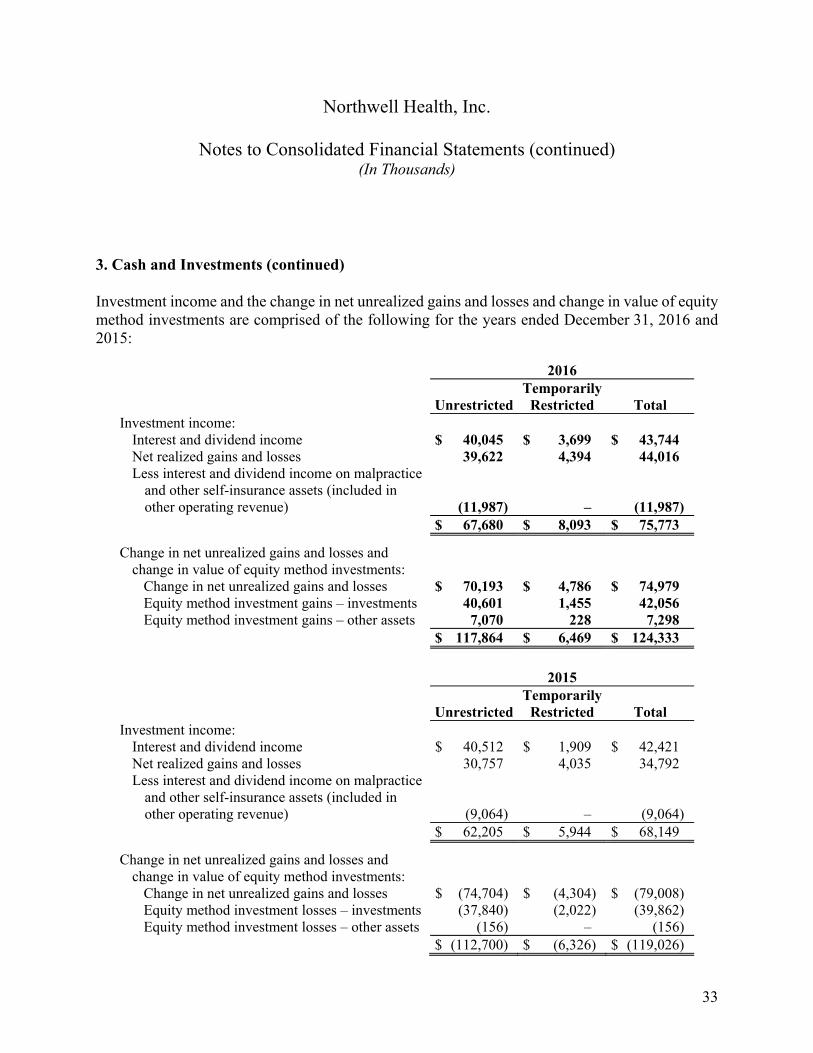
Investment income and the change in net unrealized gains and losses and change in value of equity method investments are comprised of the following for the years ended December 31, 2016 and 2015:
2016
UnrestrictedTemporarily
Restricted Total Investment income:
Interest and dividend income $ 40,045 $ 3,699 $ 43,744 Net realized gains and losses 39,622 4,394 44,016 Less interest and dividend income on malpractice
and other self-insurance assets (included in other operating revenue) (11,987) – (11,987)
$ 67,680 $ 8,093 $ 75,773 Change in net unrealized gains and losses and
change in value of equity method investments: Change in net unrealized gains and losses $ 70,193 $ 4,786 $ 74,979 Equity method investment gains – investments 40,601 1,455 42,056 Equity method investment gains – other assets 7,070 228 7,298
$ 117,864 $ 6,469 $ 124,333
2015
UnrestrictedTemporarily
Restricted Total Investment income:
Interest and dividend income $ 40,512 $ 1,909 $ 42,421 Net realized gains and losses 30,757 4,035 34,792 Less interest and dividend income on malpractice
and other self-insurance assets (included in other operating revenue) (9,064) – (9,064)
$ 62,205 $ 5,944 $ 68,149 Change in net unrealized gains and losses and
change in value of equity method investments: Change in net unrealized gains and losses $ (74,704) $ (4,304) $ (79,008) Equity method investment losses – investments (37,840) (2,022) (39,862) Equity method investment losses – other assets (156) – (156)
$ (112,700) $ (6,326) $ (119,026)
Northwell Health, Inc.
Notes to Consolidated Financial Statements (continued) (In Thousands)
34
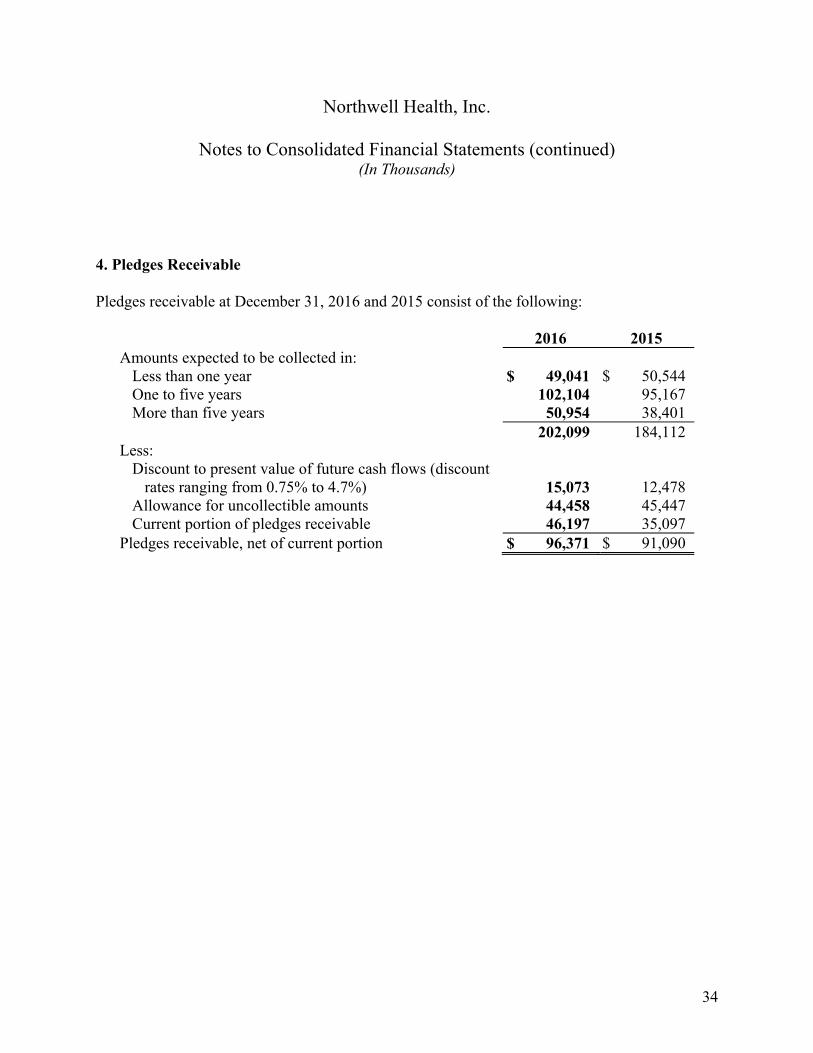
4. Pledges Receivable
Pledges receivable at December 31, 2016 and 2015 consist of the following:
2016 2015 Amounts expected to be collected in:
Less than one year $ 49,041 $ 50,544 One to five years 102,104 95,167 More than five years 50,954 38,401
202,099 184,112 Less:
Discount to present value of future cash flows (discount rates ranging from 0.75% to 4.7%) 15,073 12,478
Allowance for uncollectible amounts 44,458 45,447 Current portion of pledges receivable 46,197 35,097
Pledges receivable, net of current portion $ 96,371 $ 91,090
Northwell Health, Inc.
Notes to Consolidated Financial Statements (continued) (In Thousands)
35
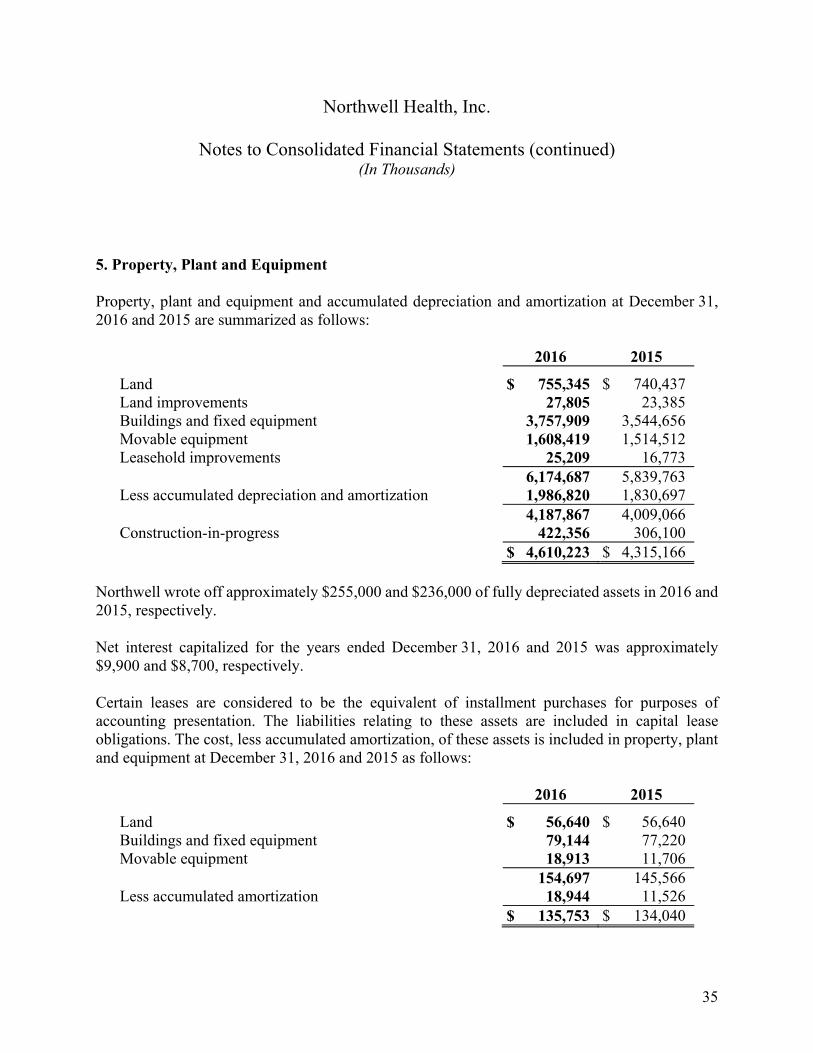
5. Property, Plant and Equipment
Property, plant and equipment and accumulated depreciation and amortization at December 31, 2016 and 2015 are summarized as follows:
2016 2015 Land $ 755,345 $ 740,437 Land improvements 27,805 23,385 Buildings and fixed equipment 3,757,909 3,544,656 Movable equipment 1,608,419 1,514,512 Leasehold improvements 25,209 16,773 6,174,687 5,839,763 Less accumulated depreciation and amortization 1,986,820 1,830,697 4,187,867 4,009,066 Construction-in-progress 422,356 306,100 $ 4,610,223 $ 4,315,166
Northwell wrote off approximately $255,000 and $236,000 of fully depreciated assets in 2016 and 2015, respectively.
Net interest capitalized for the years ended December 31, 2016 and 2015 was approximately $9,900 and $8,700, respectively.
Certain leases are considered to be the equivalent of installment purchases for purposes of accounting presentation. The liabilities relating to these assets are included in capital lease obligations. The cost, less accumulated amortization, of these assets is included in property, plant and equipment at December 31, 2016 and 2015 as follows:
2016 2015
Land $ 56,640 $ 56,640 Buildings and fixed equipment 79,144 77,220 Movable equipment 18,913 11,706 154,697 145,566 Less accumulated amortization 18,944 11,526 $ 135,753 $ 134,040
Northwell Health, Inc.
Notes to Consolidated Financial Statements (continued) (In Thousands)
36
6. Debt
Long-Term Debt
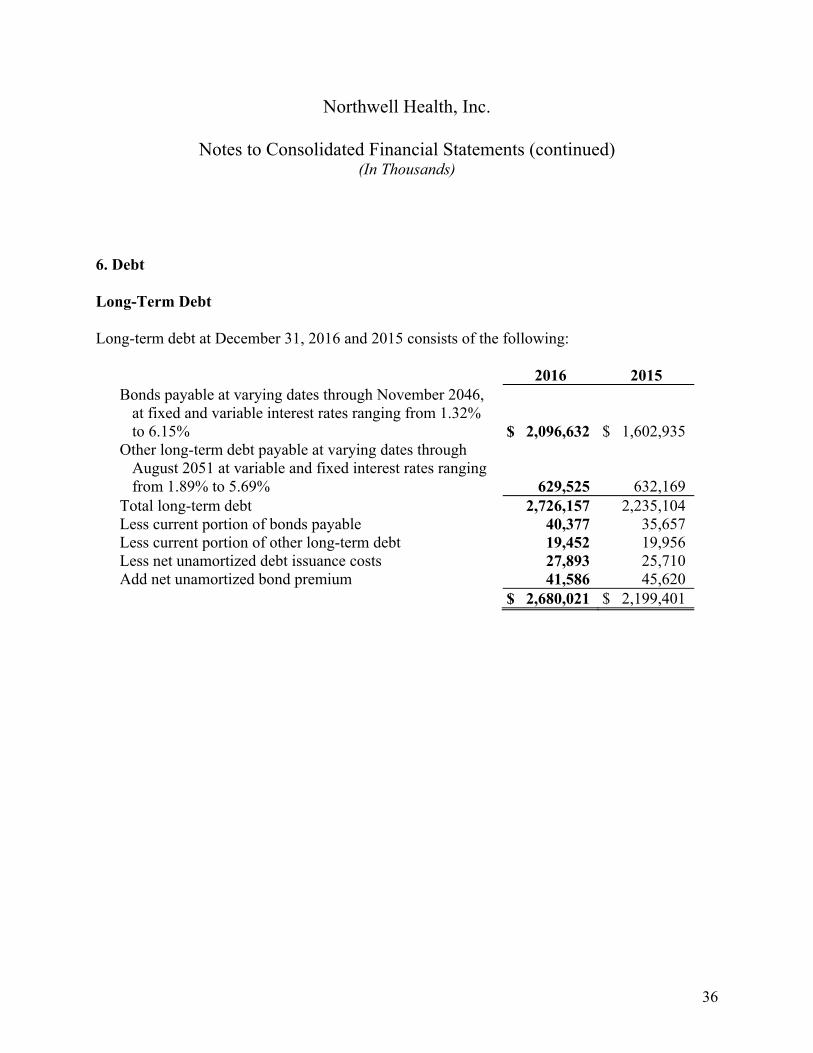
Long-term debt at December 31, 2016 and 2015 consists of the following:
2016 2015 Bonds payable at varying dates through November 2046,
at fixed and variable interest rates ranging from 1.32% to 6.15% $ 2,096,632 $ 1,602,935
Other long-term debt payable at varying dates through August 2051 at variable and fixed interest rates ranging from 1.89% to 5.69% 629,525 632,169
Total long-term debt 2,726,157 2,235,104 Less current portion of bonds payable 40,377 35,657 Less current portion of other long-term debt 19,452 19,956 Less net unamortized debt issuance costs 27,893 25,710 Add net unamortized bond premium 41,586 45,620 $ 2,680,021 $ 2,199,401
Northwell Health, Inc.
Notes to Consolidated Financial Statements (continued) (In Thousands)
37
6. Debt (continued)
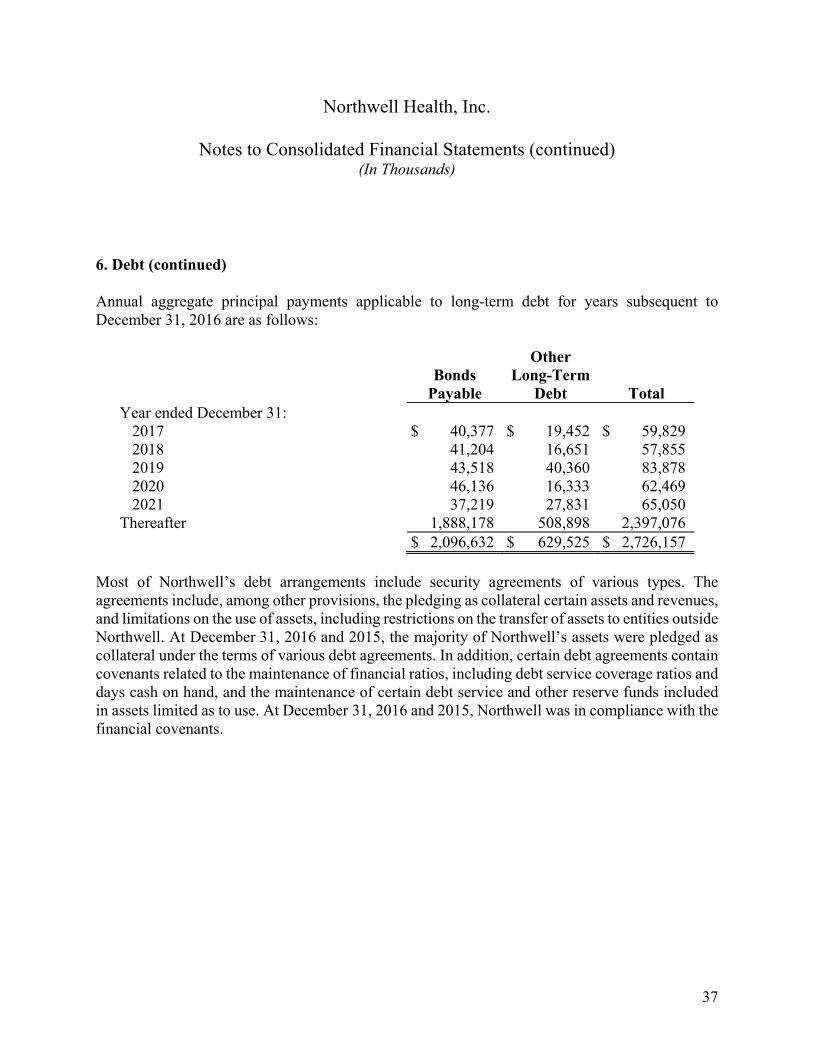
Annual aggregate principal payments applicable to long-term debt for years subsequent to December 31, 2016 are as follows:
Bonds
Payable
Other Long-Term
Debt Total Year ended December 31:
2017 $ 40,377 $ 19,452 $ 59,829 2018 41,204 16,651 57,855 2019 43,518 40,360 83,878 2020 46,136 16,333 62,469 2021 37,219 27,831 65,050
Thereafter 1,888,178 508,898 2,397,076 $ 2,096,632 $ 629,525 $ 2,726,157
Most of Northwell’s debt arrangements include security agreements of various types. The agreements include, among other provisions, the pledging as collateral certain assets and revenues, and limitations on the use of assets, including restrictions on the transfer of assets to entities outside Northwell. At December 31, 2016 and 2015, the majority of Northwell’s assets were pledged as collateral under the terms of various debt agreements. In addition, certain debt agreements contain covenants related to the maintenance of financial ratios, including debt service coverage ratios and days cash on hand, and the maintenance of certain debt service and other reserve funds included in assets limited as to use. At December 31, 2016 and 2015, Northwell was in compliance with the financial covenants.
Northwell Health, Inc.
Notes to Consolidated Financial Statements (continued) (In Thousands)
38
6. Debt (continued)
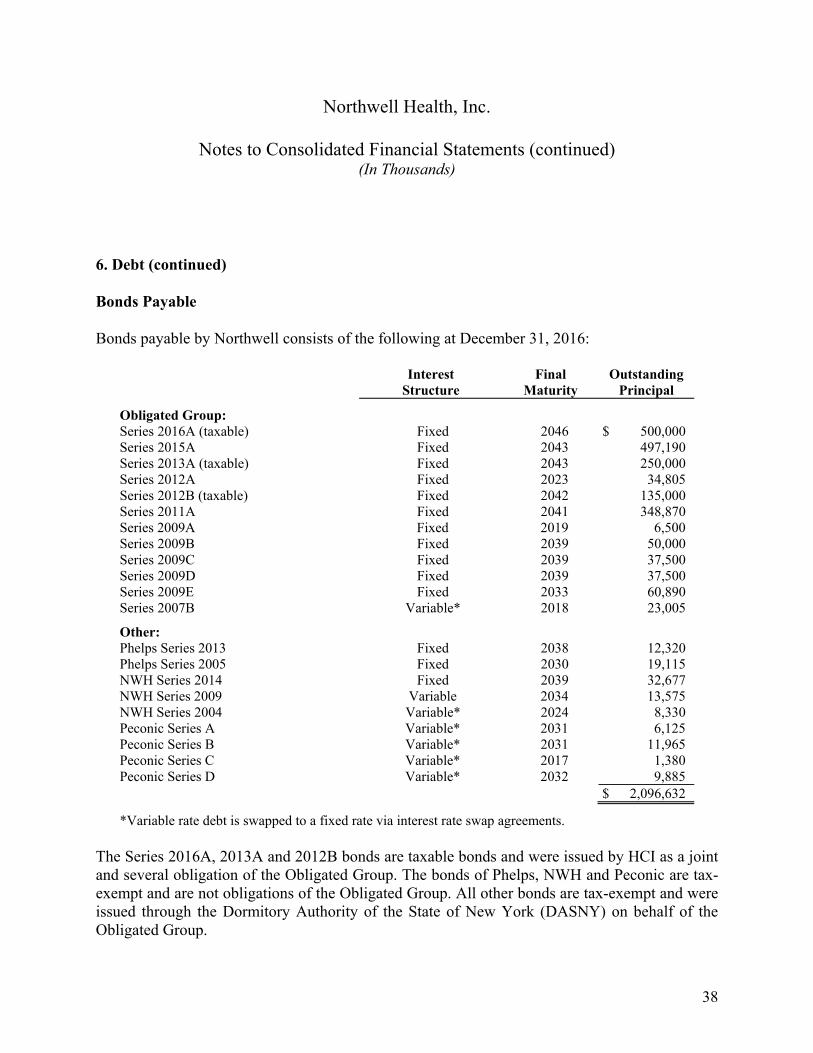
Bonds Payable
Bonds payable by Northwell consists of the following at December 31, 2016:
Interest
Structure Final
Maturity Outstanding
Principal Obligated Group: Series 2016A (taxable) Fixed 2046 $ 500,000 Series 2015A Fixed 2043 497,190 Series 2013A (taxable) Fixed 2043 250,000 Series 2012A Fixed 2023 34,805 Series 2012B (taxable) Fixed 2042 135,000 Series 2011A Fixed 2041 348,870 Series 2009A Fixed 2019 6,500 Series 2009B Fixed 2039 50,000 Series 2009C Fixed 2039 37,500 Series 2009D Fixed 2039 37,500 Series 2009E Fixed 2033 60,890 Series 2007B Variable* 2018 23,005 Other: Phelps Series 2013 Fixed 2038 12,320 Phelps Series 2005 Fixed 2030 19,115 NWH Series 2014 Fixed 2039 32,677 NWH Series 2009 Variable 2034 13,575 NWH Series 2004 Variable* 2024 8,330 Peconic Series A Variable* 2031 6,125 Peconic Series B Variable* 2031 11,965 Peconic Series C Variable* 2017 1,380 Peconic Series D Variable* 2032 9,885 $ 2,096,632
*Variable rate debt is swapped to a fixed rate via interest rate swap agreements.
The Series 2016A, 2013A and 2012B bonds are taxable bonds and were issued by HCI as a joint and several obligation of the Obligated Group. The bonds of Phelps, NWH and Peconic are tax-exempt and are not obligations of the Obligated Group. All other bonds are tax-exempt and were issued through the Dormitory Authority of the State of New York (DASNY) on behalf of the Obligated Group.
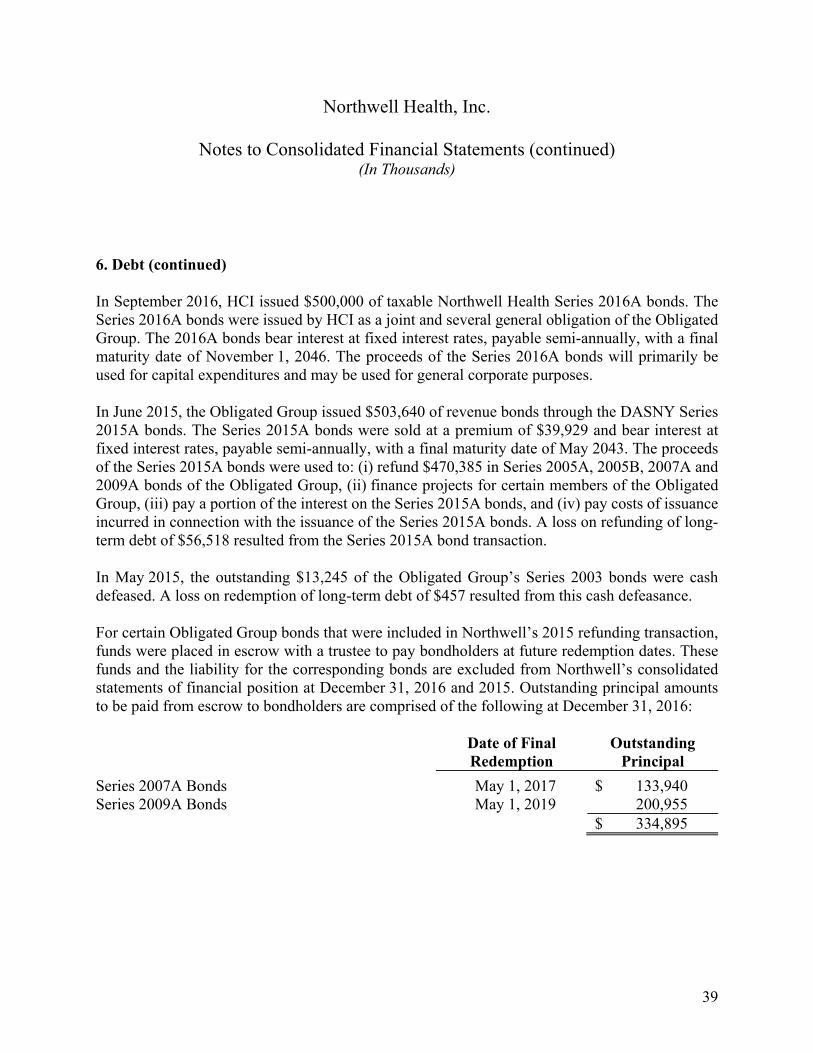
Northwell Health, Inc.
Notes to Consolidated Financial Statements (continued) (In Thousands)
39
6. Debt (continued)
In September 2016, HCI issued $500,000 of taxable Northwell Health Series 2016A bonds. The Series 2016A bonds were issued by HCI as a joint and several general obligation of the Obligated Group. The 2016A bonds bear interest at fixed interest rates, payable semi-annually, with a final maturity date of November 1, 2046. The proceeds of the Series 2016A bonds will primarily be used for capital expenditures and may be used for general corporate purposes.
In June 2015, the Obligated Group issued $503,640 of revenue bonds through the DASNY Series 2015A bonds. The Series 2015A bonds were sold at a premium of $39,929 and bear interest at fixed interest rates, payable semi-annually, with a final maturity date of May 2043. The proceeds of the Series 2015A bonds were used to: (i) refund $470,385 in Series 2005A, 2005B, 2007A and 2009A bonds of the Obligated Group, (ii) finance projects for certain members of the Obligated Group, (iii) pay a portion of the interest on the Series 2015A bonds, and (iv) pay costs of issuance incurred in connection with the issuance of the Series 2015A bonds. A loss on refunding of long-term debt of $56,518 resulted from the Series 2015A bond transaction.
In May 2015, the outstanding $13,245 of the Obligated Group’s Series 2003 bonds were cash defeased. A loss on redemption of long-term debt of $457 resulted from this cash defeasance.
For certain Obligated Group bonds that were included in Northwell’s 2015 refunding transaction, funds were placed in escrow with a trustee to pay bondholders at future redemption dates. These funds and the liability for the corresponding bonds are excluded from Northwell’s consolidated statements of financial position at December 31, 2016 and 2015. Outstanding principal amounts to be paid from escrow to bondholders are comprised of the following at December 31, 2016:
Date of Final Redemption
Outstanding Principal
Series 2007A Bonds May 1, 2017 $ 133,940 Series 2009A Bonds May 1, 2019 200,955 $ 334,895
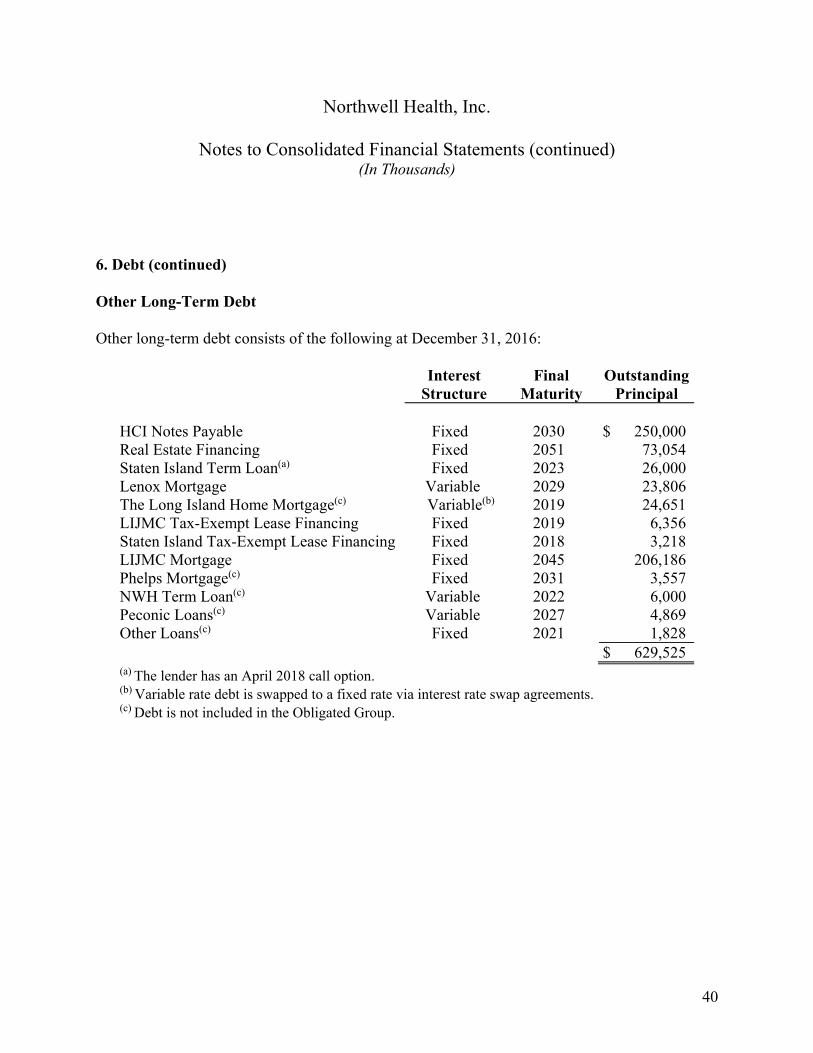
Northwell Health, Inc.
Notes to Consolidated Financial Statements (continued) (In Thousands)
40
6. Debt (continued)
Other Long-Term Debt
Other long-term debt consists of the following at December 31, 2016:
Interest
Structure Final
Maturity Outstanding
Principal HCI Notes Payable Fixed 2030 $ 250,000 Real Estate Financing Fixed 2051 73,054 Staten Island Term Loan(a) Fixed 2023 26,000 Lenox Mortgage Variable 2029 23,806 The Long Island Home Mortgage(c) Variable(b) 2019 24,651 LIJMC Tax-Exempt Lease Financing Fixed 2019 6,356 Staten Island Tax-Exempt Lease Financing Fixed 2018 3,218 LIJMC Mortgage Fixed 2045 206,186 Phelps Mortgage(c) Fixed 2031 3,557 NWH Term Loan(c) Variable 2022 6,000 Peconic Loans(c) Variable 2027 4,869 Other Loans(c) Fixed 2021 1,828 $ 629,525
(a) The lender has an April 2018 call option. (b) Variable rate debt is swapped to a fixed rate via interest rate swap agreements. (c) Debt is not included in the Obligated Group.
Northwell Health, Inc.
Notes to Consolidated Financial Statements (continued) (In Thousands)
41
6. Debt (continued)
In September 2016, Northwell closed on a real estate financing transaction for a building and land that was accounted for as long-term debt, valued at approximately $6,800. Payments of principal and interest are due monthly and extend through 2051.
In November 2015, Northwell amended an existing real estate lease which was previously accounted for as a capital lease obligation. The modification terminated the lease and provided Northwell with ownership of leasehold condominiums relating to the property. In conjunction with purchasing the leasehold condominiums, Northwell recorded $30,000 of debt under a promissory note, with principal and interest payable in monthly installments through September 2045, at a fixed interest rate of 2.0%. As a result of the transaction, capital lease obligations of approximately $22,000 were removed from Northwell’s consolidated statement of financial position.
In March 2015, LIJMC entered into a real estate transaction to purchase a building and land that it previously occupied under a capital lease agreement. In conjunction with the transaction, LIJMC obtained a mortgage for $211,000, with principal and interest payable in monthly installments through March 2045, at a fixed interest rate of 4.47%. The proceeds of the mortgage were primarily used to purchase the property, with the remaining funds put into escrow to be used to fund capital improvements. As a result of the transaction, capital lease obligations of approximately $70,000 were removed from Northwell’s consolidated statement of financial position.
Northwell Health, Inc.
Notes to Consolidated Financial Statements (continued) (In Thousands)
42
6. Debt (continued)
Capital Lease Obligations
Northwell has entered into various capital lease agreements for land, buildings and equipment. Capital lease obligations at December 31, 2016 and 2015 consist of the following:
2016 2015 Minimum lease payments $ 382,869 $ 389,054 Less interest 205,179 212,851 Less current portion at net present value 3,470 3,138 Present value of net minimum long-term lease payments 174,220 173,065 Less net unamortized issuance costs 1,112 1,177 $ 173,108 $ 171,888
Future minimum lease payments under capital lease obligations as of December 31, 2016 are as follows:
Year ending December 31: 2017 $ 13,513 2018 12,958 2019 12,572 2020 12,387 2021 12,656
Thereafter 318,783 Total minimum lease payments $ 382,869
In December 2015, Northwell entered into a real estate lease for a building and land that was accounted for as a capital lease obligation, valued at approximately $67,000. Payments of principal and interest are due monthly and extend through 2045.
Northwell Health, Inc.
Notes to Consolidated Financial Statements (continued) (In Thousands)
43
6. Debt (continued)
Short-Term Borrowings
Certain members of Northwell have entered into several unsecured revolving credit facilities with commercial banks with commitment availability through dates ranging from August 31, 2017 to July 23, 2020. Borrowings under these credit facilities are short-term and are primarily used to provide interim financing for capital improvement projects, with repayment to be provided from bond proceeds and/or the receipt of fundraising proceeds from capital campaigns. Additionally, amounts can be used to provide backup financing for the support of the certificate of need process as required by the NYSDOH and short-term working capital to support the monthly operating cash conversion cycle. Interest options include prime-based rates, LIBOR-based rates and bank cost of funds rates. Total credit available under such arrangements is $288,000. Balances outstanding from these borrowings are $110,218 at December 31, 2016 and 2015.
7. Fair Values of Financial Instruments
For assets and liabilities required to be measured at fair value, Northwell measures fair value based on the price that would be received to sell an asset or paid to transfer a liability in an orderly transaction between market participants at the measurement date. Fair value measurements are applied based on the unit of account from Northwell’s perspective. The unit of account determines what is being measured by reference to the level at which the asset or liability is aggregated (or disaggregated) for purposes of applying other accounting pronouncements.
Northwell follows a valuation hierarchy that prioritizes observable and unobservable inputs used to measure fair value into three broad levels, which are described below:
Level 1: Quoted prices (unadjusted) in active markets that are accessible at the measurement date for identical assets or liabilities.
Level 2: Observable inputs that are based on inputs not quoted in active markets, but corroborated by market data.
Level 3: Unobservable inputs are used when little or no market data is available.
Northwell Health, Inc.
Notes to Consolidated Financial Statements (continued) (In Thousands)
44
7. Fair Values of Financial Instruments (continued)
A financial instrument’s categorization within the valuation hierarchy is based upon the lowest level of input that is significant to the fair value measurement. In determining fair value, Northwell uses valuation techniques that maximize the use of observable inputs and minimize the use of unobservable inputs to the extent possible and considers nonperformance risk in its assessment of fair value.
A financial instrument’s categorization within the three levels of the valuation hierarchy is not indicative of the investment risk associated with the underlying assets.
Financial assets and liabilities carried at fair value as of December 31, 2016 are classified in the following table in one of the three categories described previously:
2016 Level 1 Level 2 Level 3 Total Assets Cash and cash equivalents
(including amounts in the investment portfolio) $ 755,002 $ – $ – $ 755,002
Fixed income obligations: U.S. Government obligations 171,403 118,522 – 289,925 Corporate and other bonds – 439,543 – 439,543 Fixed income mutual funds 447,413 – – 447,413
Equity securities: Value 283,791 – – 283,791 Small cap 100,389 – – 100,389 Global 177,922 – – 177,922 Growth 82,346 – – 82,346
Equity mutual funds 520,743 – – 520,743 Target-age mutual funds 30,955 – – 30,955 Interest and other receivables 14,856 – – 14,856 Liabilities Interest rate swap agreements – (7,866) – (7,866) $ 2,584,820 $ 550,199 $ – $ 3,135,019
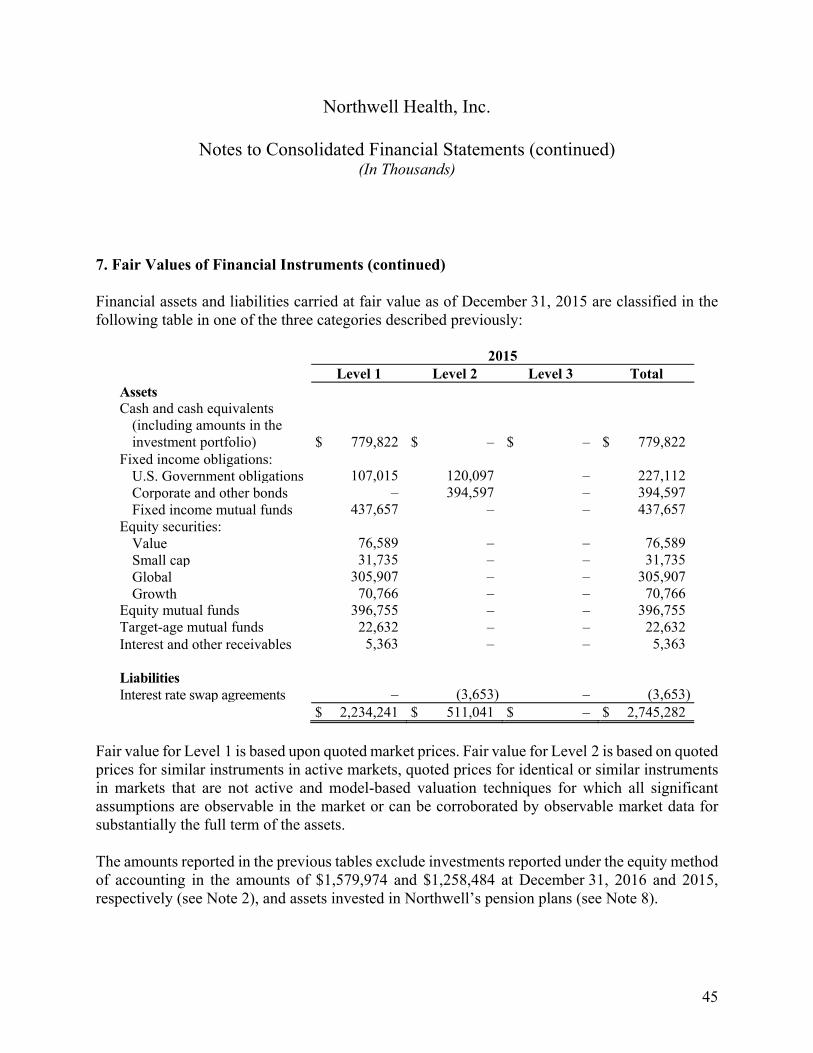
Northwell Health, Inc.
Notes to Consolidated Financial Statements (continued) (In Thousands)
45
7. Fair Values of Financial Instruments (continued)
Financial assets and liabilities carried at fair value as of December 31, 2015 are classified in the following table in one of the three categories described previously:
2015 Level 1 Level 2 Level 3 Total Assets Cash and cash equivalents
(including amounts in the investment portfolio) $ 779,822 $ – $ – $ 779,822
Fixed income obligations: U.S. Government obligations 107,015 120,097 – 227,112 Corporate and other bonds – 394,597 – 394,597 Fixed income mutual funds 437,657 – – 437,657
Equity securities: Value 76,589 – – 76,589 Small cap 31,735 – – 31,735 Global 305,907 – – 305,907 Growth 70,766 – – 70,766
Equity mutual funds 396,755 – – 396,755 Target-age mutual funds 22,632 – – 22,632 Interest and other receivables 5,363 – – 5,363 Liabilities Interest rate swap agreements – (3,653) – (3,653) $ 2,234,241 $ 511,041 $ – $ 2,745,282
Fair value for Level 1 is based upon quoted market prices. Fair value for Level 2 is based on quoted prices for similar instruments in active markets, quoted prices for identical or similar instruments in markets that are not active and model-based valuation techniques for which all significant assumptions are observable in the market or can be corroborated by observable market data for substantially the full term of the assets.
The amounts reported in the previous tables exclude investments reported under the equity method of accounting in the amounts of $1,579,974 and $1,258,484 at December 31, 2016 and 2015, respectively (see Note 2), and assets invested in Northwell’s pension plans (see Note 8).
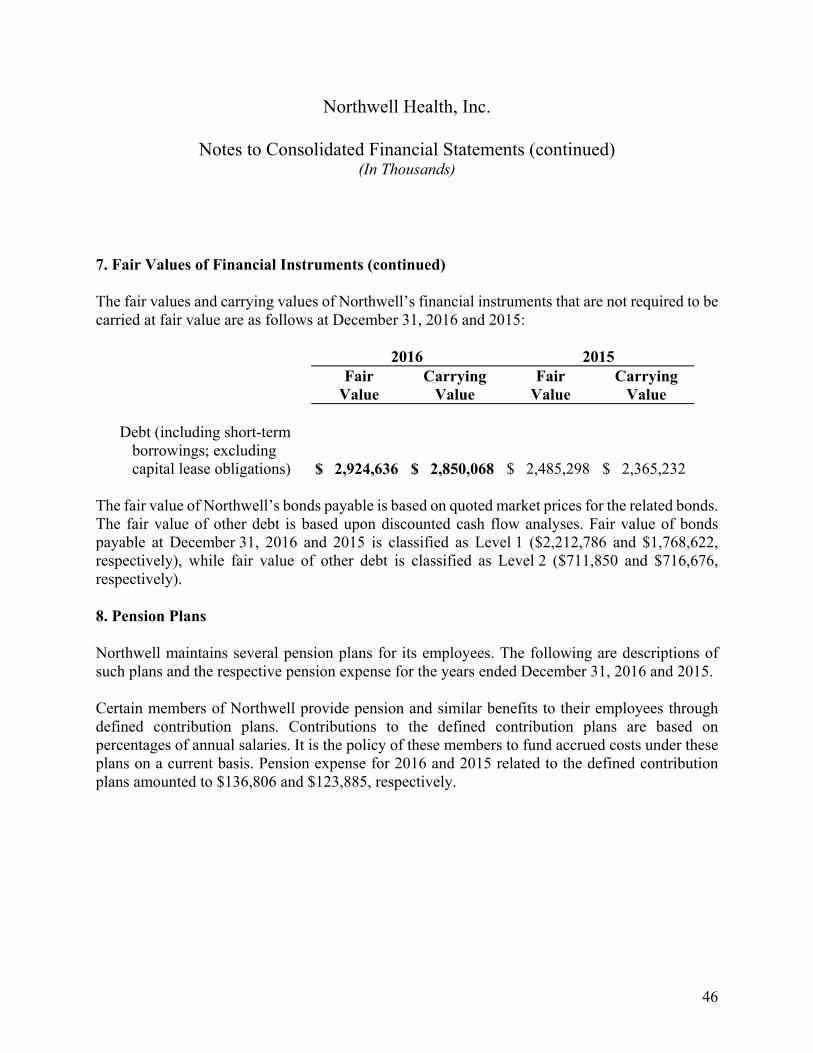
Northwell Health, Inc.
Notes to Consolidated Financial Statements (continued) (In Thousands)
46
7. Fair Values of Financial Instruments (continued)
The fair values and carrying values of Northwell’s financial instruments that are not required to be carried at fair value are as follows at December 31, 2016 and 2015:
2016 2015 Fair
Value Carrying
Value Fair
Value Carrying
Value Debt (including short-term
borrowings; excluding capital lease obligations) $ 2,924,636 $ 2,850,068 $ 2,485,298 $ 2,365,232
The fair value of Northwell’s bonds payable is based on quoted market prices for the related bonds. The fair value of other debt is based upon discounted cash flow analyses. Fair value of bonds payable at December 31, 2016 and 2015 is classified as Level 1 ($2,212,786 and $1,768,622, respectively), while fair value of other debt is classified as Level 2 ($711,850 and $716,676, respectively).
8. Pension Plans
Northwell maintains several pension plans for its employees. The following are descriptions of such plans and the respective pension expense for the years ended December 31, 2016 and 2015.
Certain members of Northwell provide pension and similar benefits to their employees through defined contribution plans. Contributions to the defined contribution plans are based on percentages of annual salaries. It is the policy of these members to fund accrued costs under these plans on a current basis. Pension expense for 2016 and 2015 related to the defined contribution plans amounted to $136,806 and $123,885, respectively.
Northwell Health, Inc.
Notes to Consolidated Financial Statements (continued) (In Thousands)
47
8. Pension Plans (continued)
Certain members of Northwell contribute to various multiemployer defined benefit pension plans under the terms of collective-bargaining agreements that cover union-represented employees. The risks of participating in these multiemployer plans are different from single-employer plans in the following aspects:
a. Assets contributed to the multiemployer plan by one employer may be used to provide benefits to employees of other participating employers.
b. If a participating employer stops contributing to the plan, the unfunded obligations of the plan may be borne by the remaining participating employers.
c. If Northwell stops participating in any of its multiemployer plans, it may be required to pay those plans an amount based on the underfunded status of the plan, referred to as a withdrawal liability.
Northwell’s significant participation in certain plans for the annual period ended December 31, 2016 is outlined in the following table. The following information for the 1199SEIU Health Care Employees Pension Fund (the 1199 Plan) and the New York State Nurses Association Pension Plan (the NYSNA Plan) is included within the table:
a. The “EIN/Pension Plan Number” column provides the plans’ Employee Identification Number (EIN) and the three-digit plan number.
b. The “Pension Protection Act Zone Status” is based on information that Northwell received from the plans and is certified by the plans’ actuaries. Among other factors, plans in the red zone are generally less than 65% funded, plans in the yellow zone are less than 80% funded and plans in the green zone are at least 80% funded.
c. The “FIP/RP Status Pending/Implemented” column indicates plans for which a financial improvement plan (FIP) or a rehabilitation plan (RP) is either pending or has been implemented.
d. The last column lists the expiration dates of the collective bargaining agreements to which the plans are subject.
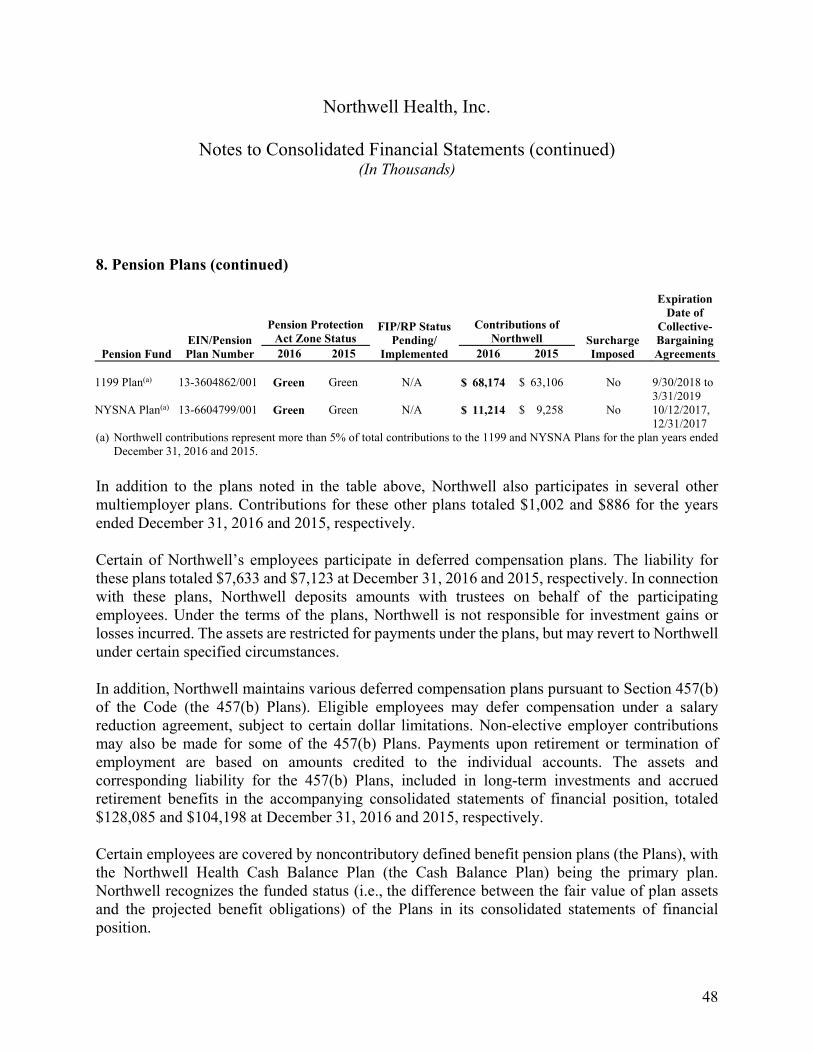
Northwell Health, Inc.
Notes to Consolidated Financial Statements (continued) (In Thousands)
48
8. Pension Plans (continued)
Pension Fund EIN/Pension Plan Number
Pension Protection Act Zone Status
FIP/RP Status Pending/
Implemented
Contributions of Northwell Surcharge
Imposed
Expiration Date of
Collective-Bargaining Agreements2016 2015 2016 2015
1199 Plan(a) 13-3604862/001 Green Green N/A $ 68,174 $ 63,106 No 9/30/2018 to
3/31/2019 NYSNA Plan(a) 13-6604799/001 Green Green N/A $ 11,214 $ 9,258 No 10/12/2017,
12/31/2017 (a) Northwell contributions represent more than 5% of total contributions to the 1199 and NYSNA Plans for the plan years ended
December 31, 2016 and 2015.
In addition to the plans noted in the table above, Northwell also participates in several other multiemployer plans. Contributions for these other plans totaled $1,002 and $886 for the years ended December 31, 2016 and 2015, respectively.
Certain of Northwell’s employees participate in deferred compensation plans. The liability for these plans totaled $7,633 and $7,123 at December 31, 2016 and 2015, respectively. In connection with these plans, Northwell deposits amounts with trustees on behalf of the participating employees. Under the terms of the plans, Northwell is not responsible for investment gains or losses incurred. The assets are restricted for payments under the plans, but may revert to Northwell under certain specified circumstances.
In addition, Northwell maintains various deferred compensation plans pursuant to Section 457(b) of the Code (the 457(b) Plans). Eligible employees may defer compensation under a salary reduction agreement, subject to certain dollar limitations. Non-elective employer contributions may also be made for some of the 457(b) Plans. Payments upon retirement or termination of employment are based on amounts credited to the individual accounts. The assets and corresponding liability for the 457(b) Plans, included in long-term investments and accrued retirement benefits in the accompanying consolidated statements of financial position, totaled $128,085 and $104,198 at December 31, 2016 and 2015, respectively.
Certain employees are covered by noncontributory defined benefit pension plans (the Plans), with the Northwell Health Cash Balance Plan (the Cash Balance Plan) being the primary plan. Northwell recognizes the funded status (i.e., the difference between the fair value of plan assets and the projected benefit obligations) of the Plans in its consolidated statements of financial position.
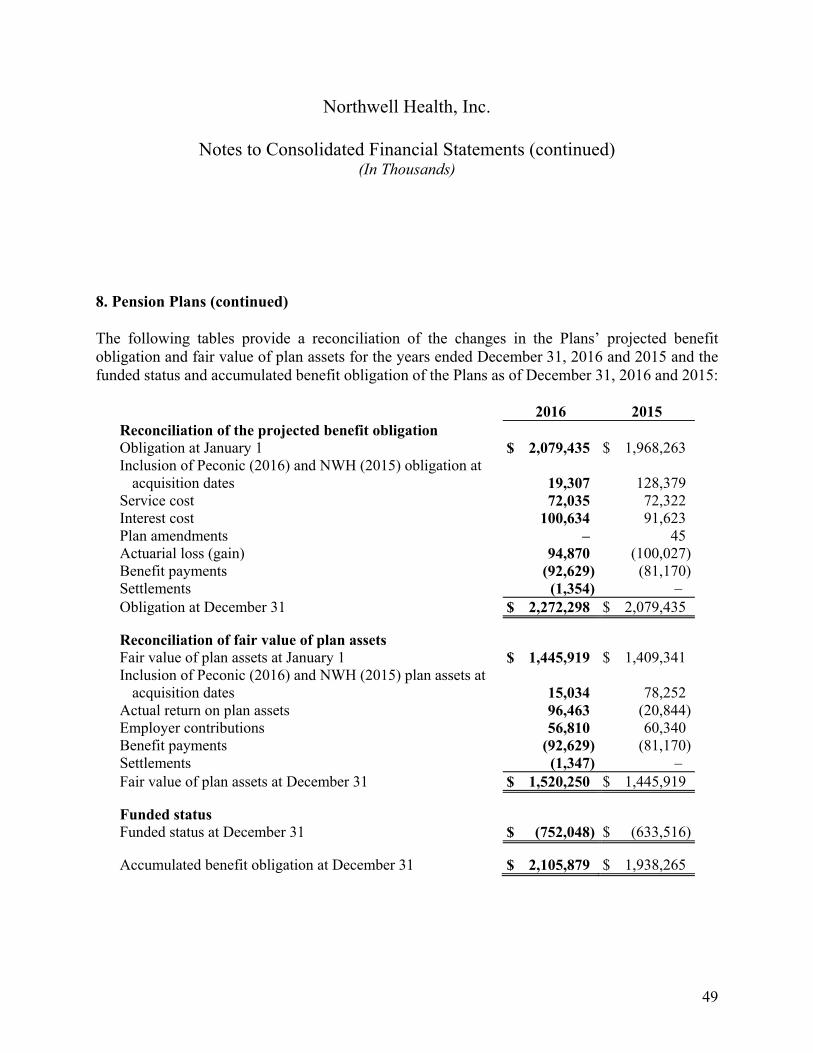
Northwell Health, Inc.
Notes to Consolidated Financial Statements (continued) (In Thousands)
49
8. Pension Plans (continued)
The following tables provide a reconciliation of the changes in the Plans’ projected benefit obligation and fair value of plan assets for the years ended December 31, 2016 and 2015 and the funded status and accumulated benefit obligation of the Plans as of December 31, 2016 and 2015:
2016 2015 Reconciliation of the projected benefit obligation Obligation at January 1 $ 2,079,435 $ 1,968,263 Inclusion of Peconic (2016) and NWH (2015) obligation at
acquisition dates 19,307 128,379 Service cost 72,035 72,322 Interest cost 100,634 91,623 Plan amendments – 45 Actuarial loss (gain) 94,870 (100,027)Benefit payments (92,629) (81,170)Settlements (1,354) – Obligation at December 31 $ 2,272,298 $ 2,079,435
Reconciliation of fair value of plan assets Fair value of plan assets at January 1 $ 1,445,919 $ 1,409,341 Inclusion of Peconic (2016) and NWH (2015) plan assets at
acquisition dates 15,034 78,252 Actual return on plan assets 96,463 (20,844)Employer contributions 56,810 60,340 Benefit payments (92,629) (81,170)Settlements (1,347) – Fair value of plan assets at December 31 $ 1,520,250 $ 1,445,919
Funded status Funded status at December 31 $ (752,048) $ (633,516)
Accumulated benefit obligation at December 31 $ 2,105,879 $ 1,938,265
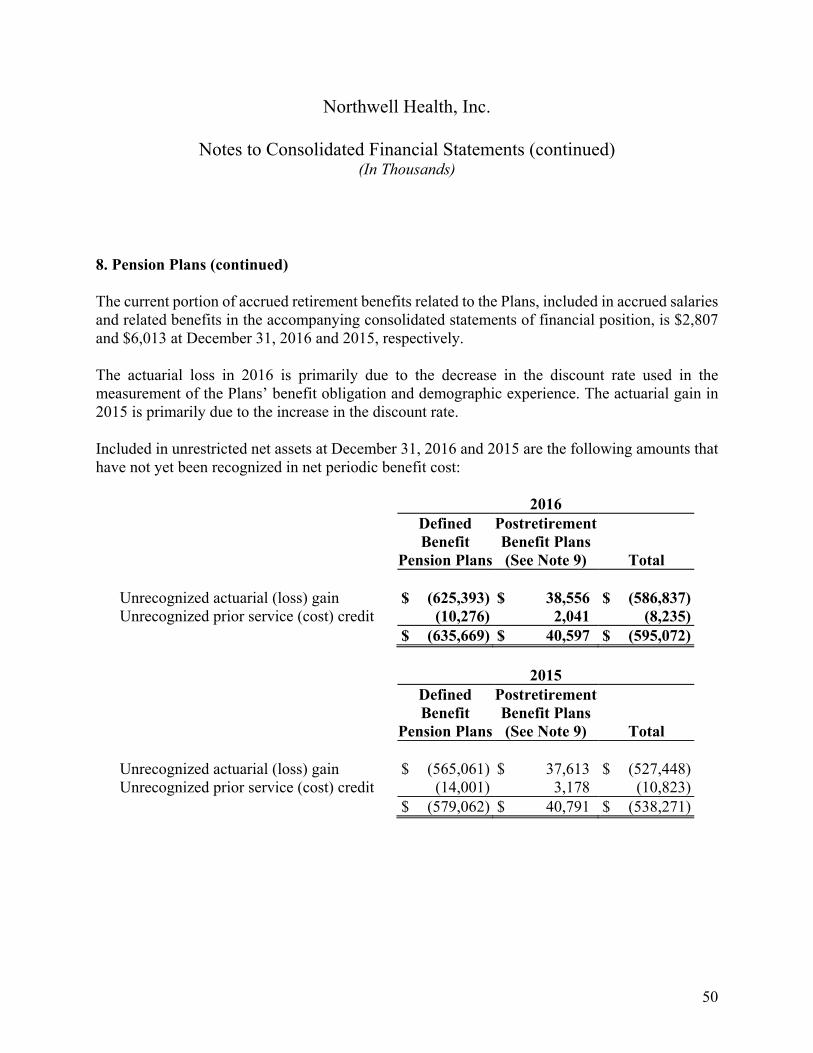
Northwell Health, Inc.
Notes to Consolidated Financial Statements (continued) (In Thousands)
50
8. Pension Plans (continued)
The current portion of accrued retirement benefits related to the Plans, included in accrued salaries and related benefits in the accompanying consolidated statements of financial position, is $2,807 and $6,013 at December 31, 2016 and 2015, respectively.
The actuarial loss in 2016 is primarily due to the decrease in the discount rate used in the measurement of the Plans’ benefit obligation and demographic experience. The actuarial gain in 2015 is primarily due to the increase in the discount rate.
Included in unrestricted net assets at December 31, 2016 and 2015 are the following amounts that have not yet been recognized in net periodic benefit cost:
2016
Defined Benefit
Pension Plans
Postretirement Benefit Plans (See Note 9) Total
Unrecognized actuarial (loss) gain $ (625,393) $ 38,556 $ (586,837)Unrecognized prior service (cost) credit (10,276) 2,041 (8,235) $ (635,669) $ 40,597 $ (595,072)
2015
Defined Benefit
Pension Plans
Postretirement Benefit Plans (See Note 9) Total
Unrecognized actuarial (loss) gain $ (565,061) $ 37,613 $ (527,448)Unrecognized prior service (cost) credit (14,001) 3,178 (10,823) $ (579,062) $ 40,791 $ (538,271)
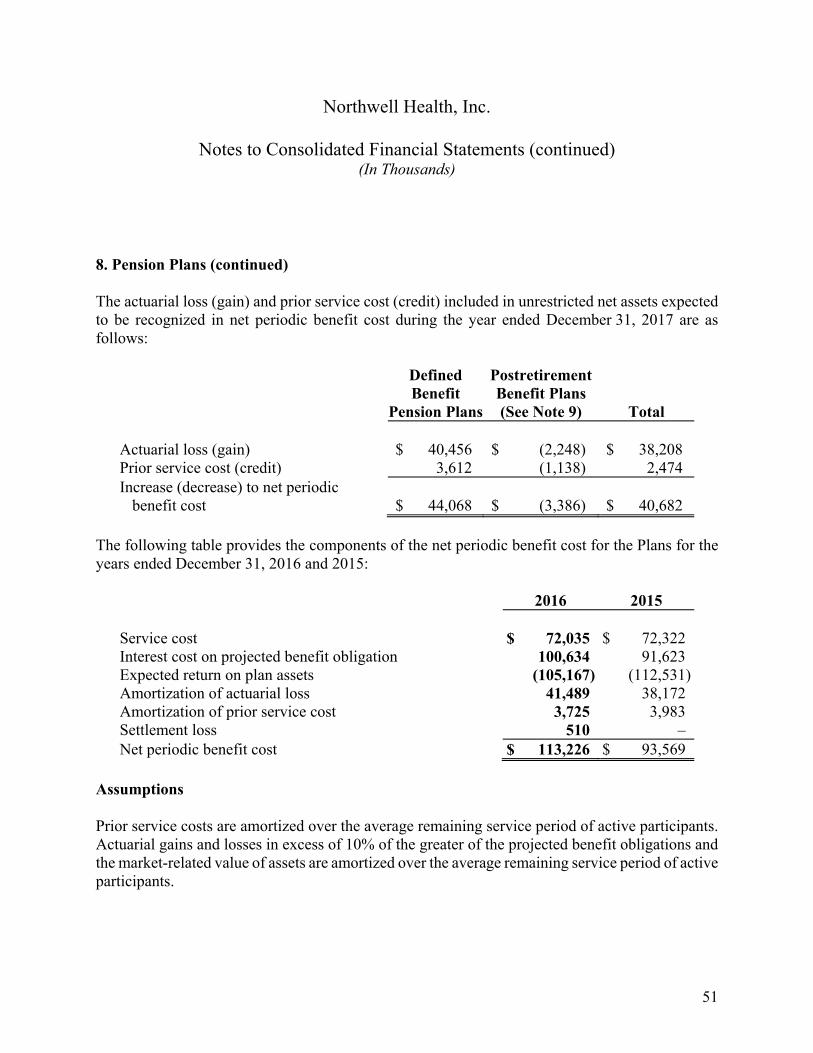
Northwell Health, Inc.
Notes to Consolidated Financial Statements (continued) (In Thousands)
51
8. Pension Plans (continued)
The actuarial loss (gain) and prior service cost (credit) included in unrestricted net assets expected to be recognized in net periodic benefit cost during the year ended December 31, 2017 are as follows:
Defined Benefit
Pension Plans
Postretirement Benefit Plans (See Note 9) Total
Actuarial loss (gain) $ 40,456 $ (2,248) $ 38,208 Prior service cost (credit) 3,612 (1,138) 2,474 Increase (decrease) to net periodic
benefit cost $ 44,068 $ (3,386) $ 40,682 The following table provides the components of the net periodic benefit cost for the Plans for the years ended December 31, 2016 and 2015:
2016 2015 Service cost $ 72,035 $ 72,322 Interest cost on projected benefit obligation 100,634 91,623 Expected return on plan assets (105,167) (112,531)Amortization of actuarial loss 41,489 38,172 Amortization of prior service cost 3,725 3,983 Settlement loss 510 – Net periodic benefit cost $ 113,226 $ 93,569
Assumptions
Prior service costs are amortized over the average remaining service period of active participants. Actuarial gains and losses in excess of 10% of the greater of the projected benefit obligations and the market-related value of assets are amortized over the average remaining service period of active participants.
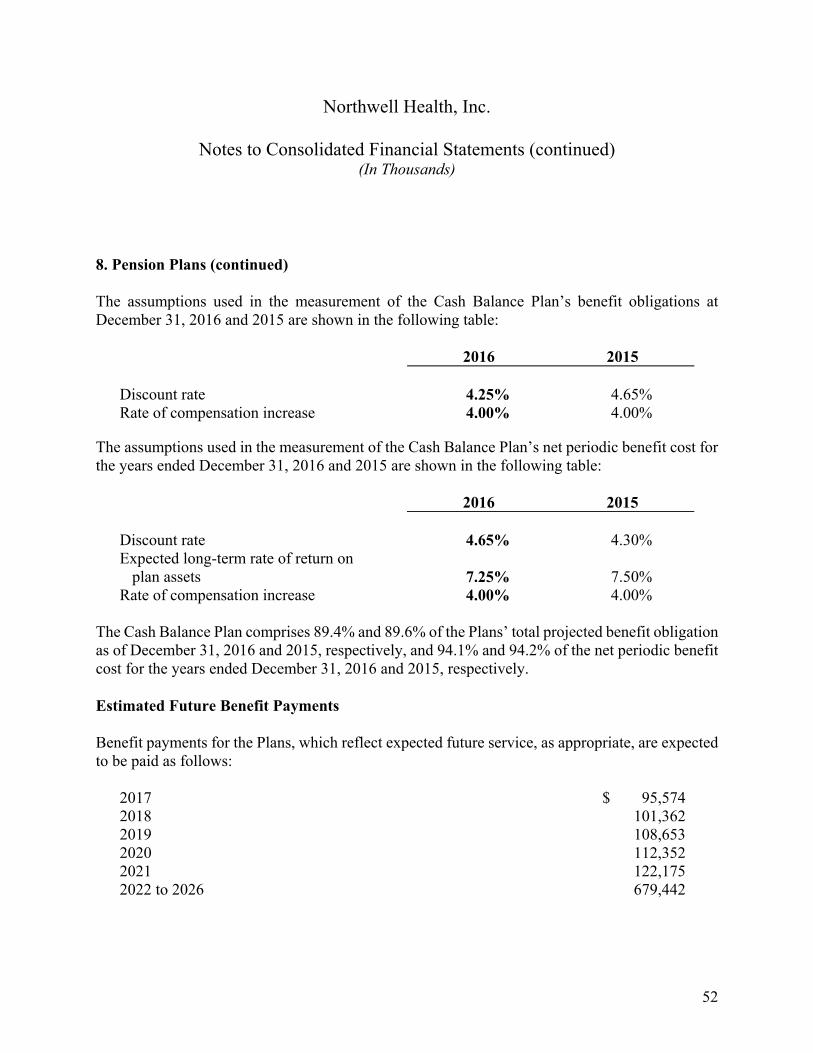
Northwell Health, Inc.
Notes to Consolidated Financial Statements (continued) (In Thousands)
52
8. Pension Plans (continued)
The assumptions used in the measurement of the Cash Balance Plan’s benefit obligations at December 31, 2016 and 2015 are shown in the following table:
2016 2015 Discount rate 4.25% 4.65% Rate of compensation increase 4.00% 4.00%
The assumptions used in the measurement of the Cash Balance Plan’s net periodic benefit cost for the years ended December 31, 2016 and 2015 are shown in the following table:
2016 2015 Discount rate 4.65% 4.30% Expected long-term rate of return on
plan assets 7.25% 7.50% Rate of compensation increase 4.00% 4.00%
The Cash Balance Plan comprises 89.4% and 89.6% of the Plans’ total projected benefit obligation as of December 31, 2016 and 2015, respectively, and 94.1% and 94.2% of the net periodic benefit cost for the years ended December 31, 2016 and 2015, respectively.
Estimated Future Benefit Payments
Benefit payments for the Plans, which reflect expected future service, as appropriate, are expected to be paid as follows:
2017 $ 95,574 2018 101,362 2019 108,653 2020 112,352 2021 122,175 2022 to 2026 679,442
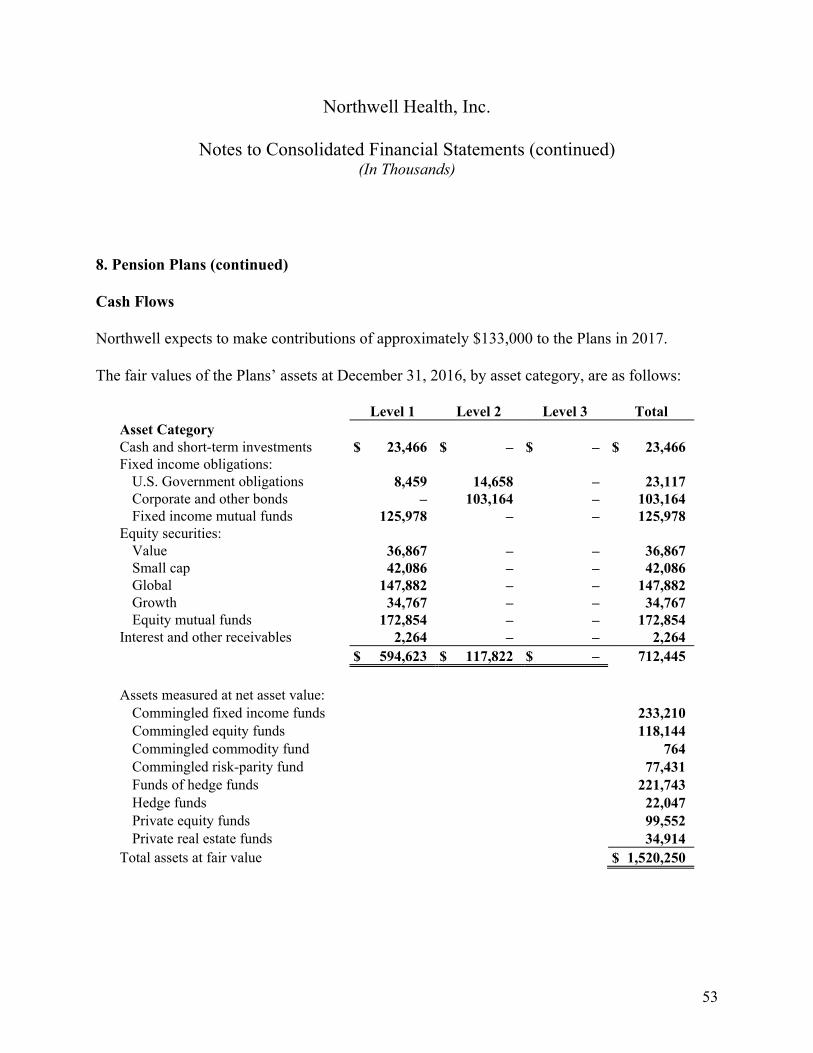
Northwell Health, Inc.
Notes to Consolidated Financial Statements (continued) (In Thousands)
53
8. Pension Plans (continued)
Cash Flows
Northwell expects to make contributions of approximately $133,000 to the Plans in 2017.
The fair values of the Plans’ assets at December 31, 2016, by asset category, are as follows:
Level 1 Level 2 Level 3 Total Asset Category Cash and short-term investments $ 23,466 $ – $ – $ 23,466 Fixed income obligations:
U.S. Government obligations 8,459 14,658 – 23,117 Corporate and other bonds – 103,164 – 103,164 Fixed income mutual funds 125,978 – – 125,978
Equity securities: Value 36,867 – – 36,867 Small cap 42,086 – – 42,086 Global 147,882 – – 147,882 Growth 34,767 – – 34,767 Equity mutual funds 172,854 – – 172,854
Interest and other receivables 2,264 – – 2,264 $ 594,623 $ 117,822 $ – 712,445
Assets measured at net asset value:
Commingled fixed income funds 233,210 Commingled equity funds 118,144 Commingled commodity fund 764 Commingled risk-parity fund 77,431 Funds of hedge funds 221,743 Hedge funds 22,047 Private equity funds 99,552 Private real estate funds 34,914
Total assets at fair value $ 1,520,250
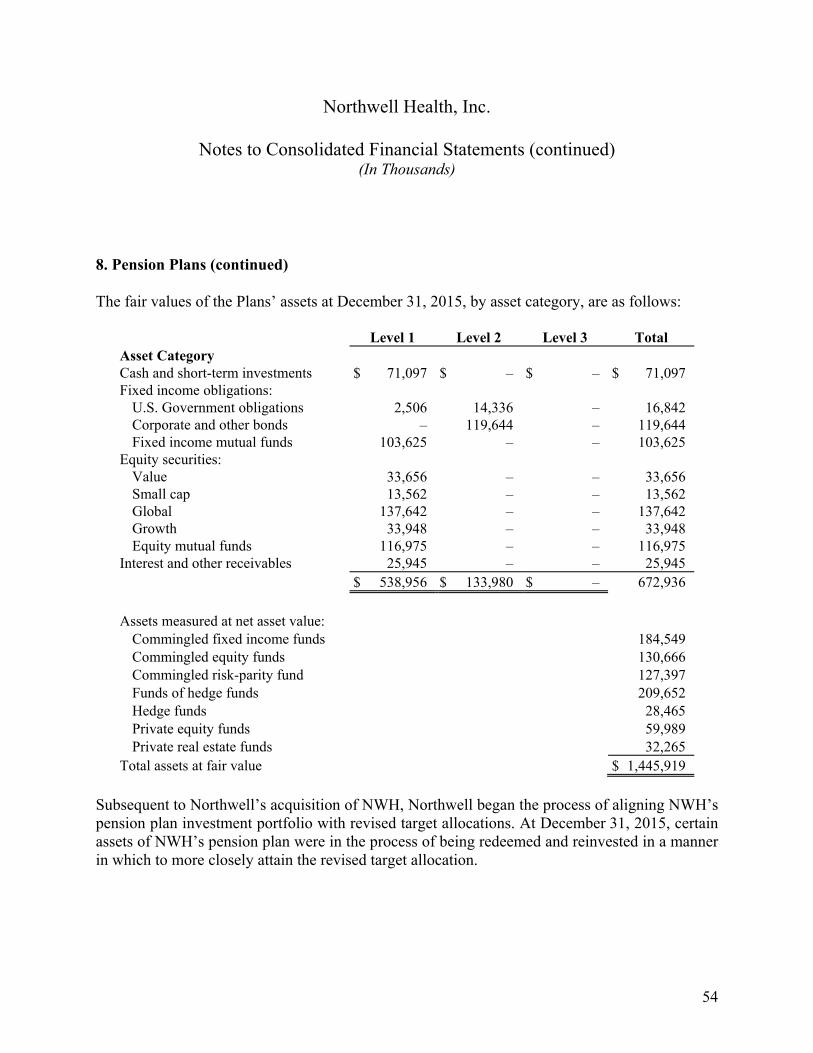
Northwell Health, Inc.
Notes to Consolidated Financial Statements (continued) (In Thousands)
54
8. Pension Plans (continued)
The fair values of the Plans’ assets at December 31, 2015, by asset category, are as follows:
Level 1 Level 2 Level 3 Total Asset Category Cash and short-term investments $ 71,097 $ – $ – $ 71,097 Fixed income obligations:
U.S. Government obligations 2,506 14,336 – 16,842 Corporate and other bonds – 119,644 – 119,644 Fixed income mutual funds 103,625 – – 103,625
Equity securities: Value 33,656 – – 33,656 Small cap 13,562 – – 13,562 Global 137,642 – – 137,642 Growth 33,948 – – 33,948 Equity mutual funds 116,975 – – 116,975
Interest and other receivables 25,945 – – 25,945 $ 538,956 $ 133,980 $ – 672,936
Assets measured at net asset value:
Commingled fixed income funds 184,549 Commingled equity funds 130,666 Commingled risk-parity fund 127,397 Funds of hedge funds 209,652 Hedge funds 28,465 Private equity funds 59,989 Private real estate funds 32,265
Total assets at fair value $ 1,445,919
Subsequent to Northwell’s acquisition of NWH, Northwell began the process of aligning NWH’s pension plan investment portfolio with revised target allocations. At December 31, 2015, certain assets of NWH’s pension plan were in the process of being redeemed and reinvested in a manner in which to more closely attain the revised target allocation.
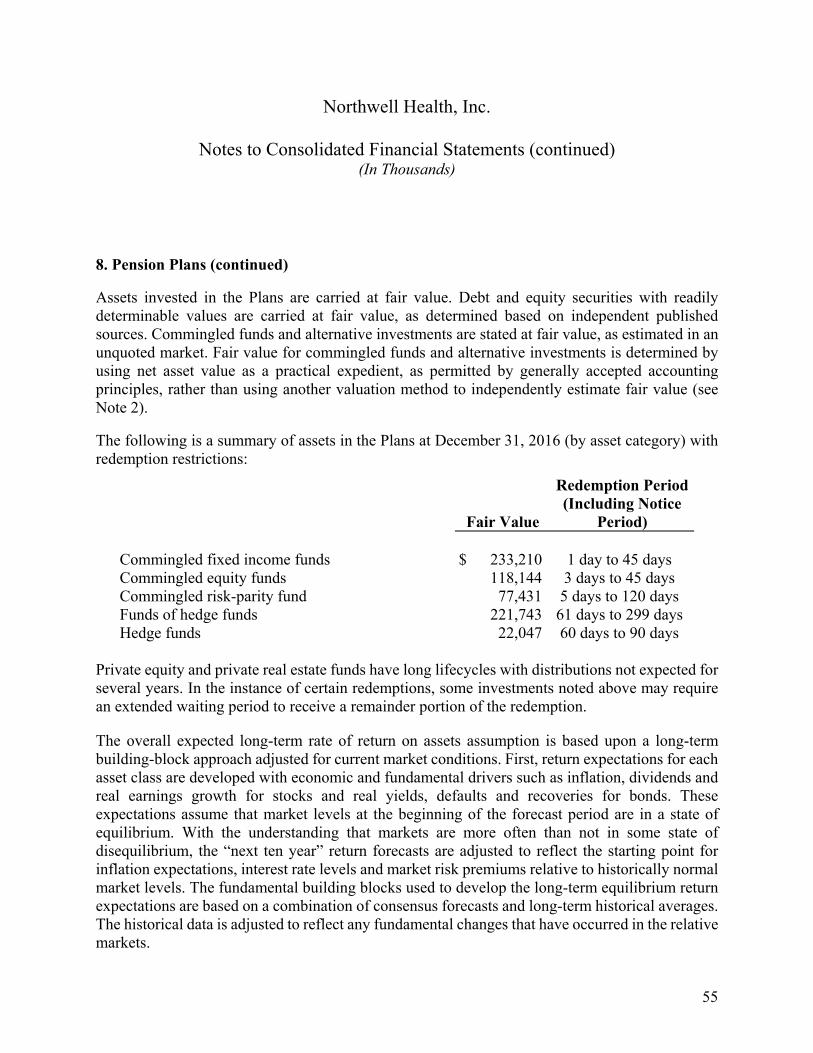
Northwell Health, Inc.
Notes to Consolidated Financial Statements (continued) (In Thousands)
55
8. Pension Plans (continued)
Assets invested in the Plans are carried at fair value. Debt and equity securities with readily determinable values are carried at fair value, as determined based on independent published sources. Commingled funds and alternative investments are stated at fair value, as estimated in an unquoted market. Fair value for commingled funds and alternative investments is determined by using net asset value as a practical expedient, as permitted by generally accepted accounting principles, rather than using another valuation method to independently estimate fair value (see Note 2).
The following is a summary of assets in the Plans at December 31, 2016 (by asset category) with redemption restrictions:
Fair Value
Redemption Period (Including Notice
Period) Commingled fixed income funds $ 233,210 1 day to 45 days Commingled equity funds 118,144 3 days to 45 days Commingled risk-parity fund 77,431 5 days to 120 days Funds of hedge funds 221,743 61 days to 299 days Hedge funds 22,047 60 days to 90 days
Private equity and private real estate funds have long lifecycles with distributions not expected for several years. In the instance of certain redemptions, some investments noted above may require an extended waiting period to receive a remainder portion of the redemption.
The overall expected long-term rate of return on assets assumption is based upon a long-term building-block approach adjusted for current market conditions. First, return expectations for each asset class are developed with economic and fundamental drivers such as inflation, dividends and real earnings growth for stocks and real yields, defaults and recoveries for bonds. These expectations assume that market levels at the beginning of the forecast period are in a state of equilibrium. With the understanding that markets are more often than not in some state of disequilibrium, the “next ten year” return forecasts are adjusted to reflect the starting point for inflation expectations, interest rate levels and market risk premiums relative to historically normal market levels. The fundamental building blocks used to develop the long-term equilibrium return expectations are based on a combination of consensus forecasts and long-term historical averages. The historical data is adjusted to reflect any fundamental changes that have occurred in the relative markets.
Northwell Health, Inc.
Notes to Consolidated Financial Statements (continued) (In Thousands)
56
8. Pension Plans (continued)
Basis Used to Determine the Expected Long-Term Rate of Return on Assets
Once long-term equilibrium forecasts are developed, returns are adjusted for the next ten years to reflect the current environment as it relates to the key economic variables that influence returns across the capital markets. In doing so, the expected path for breakeven inflation, real interest rates and investment grade corporate bond spreads are modeled for the next ten years. In this framework, the investment grade corporate spreads are used as a proxy for the risk premium priced broadly into all asset classes within the capital markets.
While the precise expected return derived using the above approach will fluctuate somewhat from year to year, the Plans’ policy is to hold this long-term assumption constant as long as it remains within a reasonable tolerance from the derived rate.
Description of Investment Policies and Strategies
The Plans’ overall investment strategy is to achieve wide diversification of asset types, fund strategies, and fund managers. Equity securities include investments in domestic, international, global and emerging markets equities. Fixed income securities include corporate bonds of companies from diversified industries, mortgage-backed securities, emerging markets debt and U.S. Treasuries. Other types of investments include investments in commingled commodity funds and alternative investments that follow several different strategies.
There are specific guidelines and diversification standards for each investment manager. Eligible investments are specifically outlined. Each manager must disclose its strategies and report that it abides by the Employee Retirement Income Security Act of 1974 (ERISA) rules, where applicable.
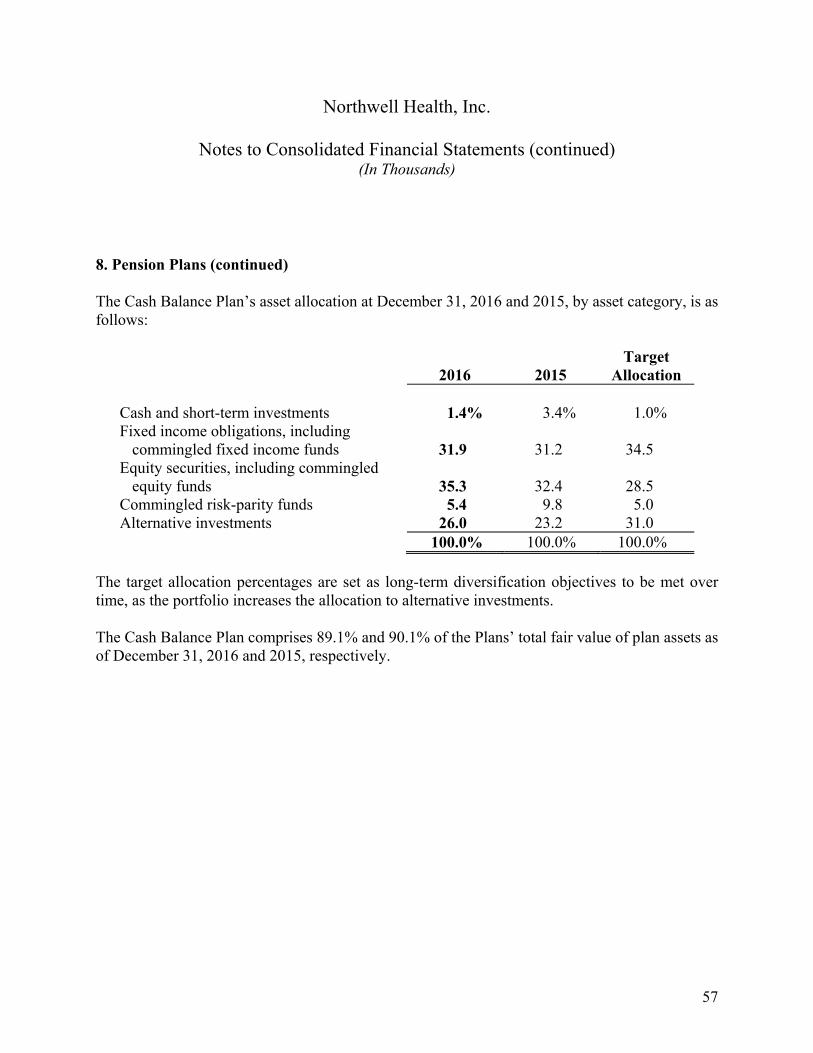
Northwell Health, Inc.
Notes to Consolidated Financial Statements (continued) (In Thousands)
57
8. Pension Plans (continued)
The Cash Balance Plan’s asset allocation at December 31, 2016 and 2015, by asset category, is as follows:
2016 2015 Target
Allocation Cash and short-term investments 1.4% 3.4% 1.0% Fixed income obligations, including
commingled fixed income funds 31.9 31.2 34.5 Equity securities, including commingled
equity funds 35.3 32.4 28.5 Commingled risk-parity funds 5.4 9.8 5.0 Alternative investments 26.0 23.2 31.0 100.0% 100.0% 100.0%
The target allocation percentages are set as long-term diversification objectives to be met over time, as the portfolio increases the allocation to alternative investments.
The Cash Balance Plan comprises 89.1% and 90.1% of the Plans’ total fair value of plan assets as of December 31, 2016 and 2015, respectively.
Northwell Health, Inc.
Notes to Consolidated Financial Statements (continued) (In Thousands)
58
9. Postretirement Benefits Other Than Pensions
Certain employees are covered by the Northwell Health Retiree Medical and Life Insurance Plan (the Northwell Plan) and other postretirement benefit plans other than pensions.
The Northwell Plan is contributory with a 2% per year service subsidy up to 30 years (maximum 60%) for non-union employees hired prior to January 1, 2001. The subsidy for future retirees is as follows: for pre-65 retirees, a 2% per year service subsidy for years of service through 2000 and a 1% per year service subsidy for years of service for 2001 and thereafter, up to 30 years. For post-65 retirees, a 1% per year service subsidy for years of service through 2000 and a 0.5% per year service subsidy for years of service for 2001 and thereafter, up to 30 years. For non-union employees hired after January 1, 2001, the Northwell Plan provides a defined dollar benefit subsidy of $2,500 per year prior to age 65 and $1,000 per year age 65 and later. To be eligible for the medical benefits, the employee must be at least 55 years old and be employed for at least fifteen years or after age 65, be employed for at least five years. Only pre-1994 retirees are eligible for the life insurance benefits. The life insurance benefit is not available to active employees. The Northwell Plan is unfunded.
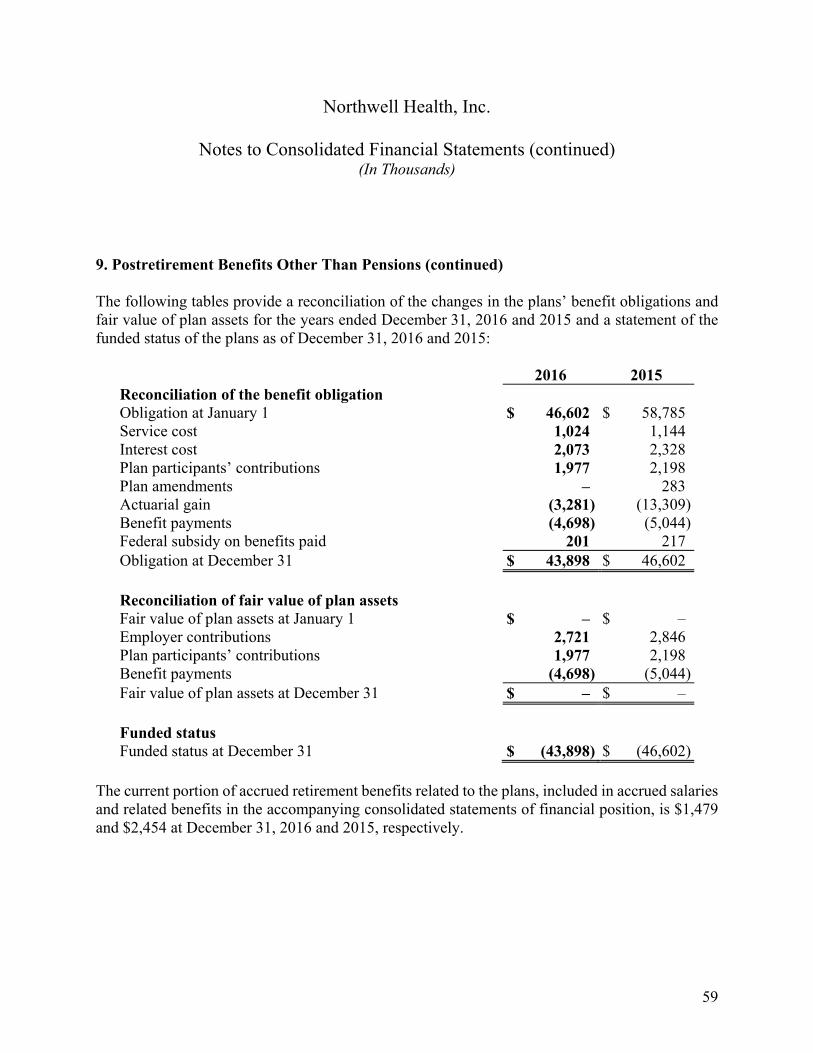
Northwell Health, Inc.
Notes to Consolidated Financial Statements (continued) (In Thousands)
59
9. Postretirement Benefits Other Than Pensions (continued)
The following tables provide a reconciliation of the changes in the plans’ benefit obligations and fair value of plan assets for the years ended December 31, 2016 and 2015 and a statement of the funded status of the plans as of December 31, 2016 and 2015:
2016 2015 Reconciliation of the benefit obligation Obligation at January 1 $ 46,602 $ 58,785 Service cost 1,024 1,144 Interest cost 2,073 2,328 Plan participants’ contributions 1,977 2,198 Plan amendments – 283 Actuarial gain (3,281) (13,309)Benefit payments (4,698) (5,044)Federal subsidy on benefits paid 201 217 Obligation at December 31 $ 43,898 $ 46,602 Reconciliation of fair value of plan assets Fair value of plan assets at January 1 $ – $ – Employer contributions 2,721 2,846 Plan participants’ contributions 1,977 2,198 Benefit payments (4,698) (5,044)Fair value of plan assets at December 31 $ – $ – Funded status Funded status at December 31 $ (43,898) $ (46,602)
The current portion of accrued retirement benefits related to the plans, included in accrued salaries and related benefits in the accompanying consolidated statements of financial position, is $1,479 and $2,454 at December 31, 2016 and 2015, respectively.
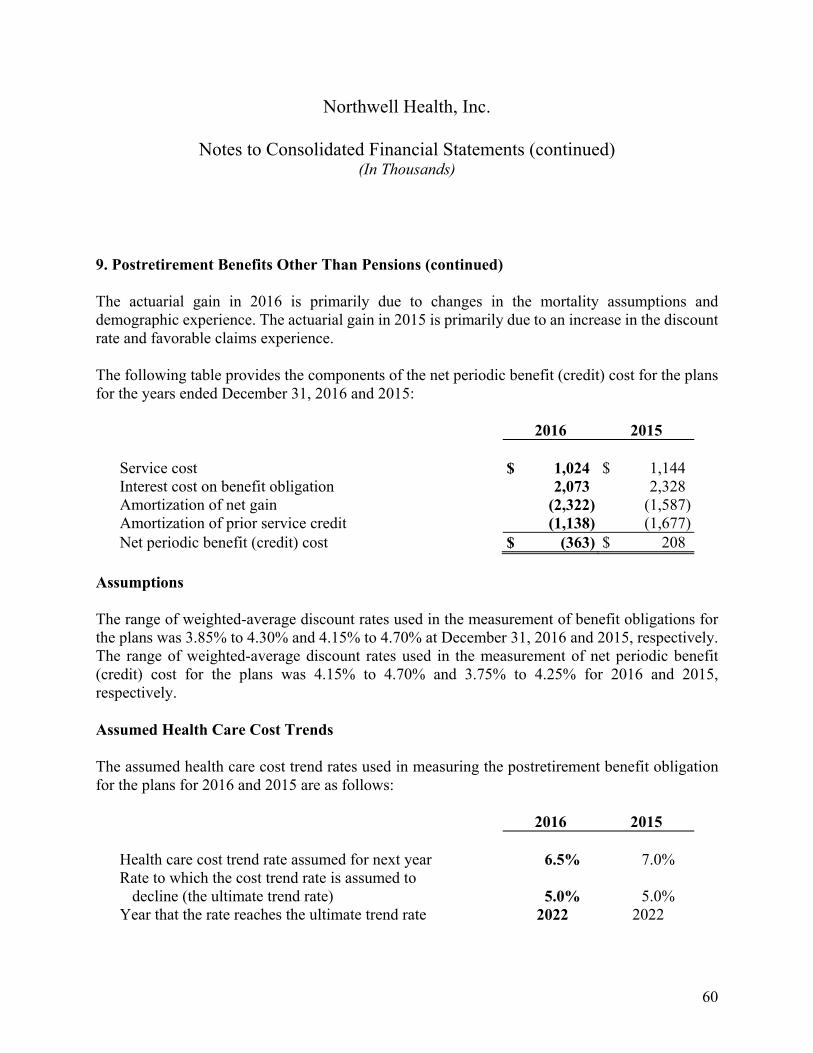
Northwell Health, Inc.
Notes to Consolidated Financial Statements (continued) (In Thousands)
60
9. Postretirement Benefits Other Than Pensions (continued)
The actuarial gain in 2016 is primarily due to changes in the mortality assumptions and demographic experience. The actuarial gain in 2015 is primarily due to an increase in the discount rate and favorable claims experience.
The following table provides the components of the net periodic benefit (credit) cost for the plans for the years ended December 31, 2016 and 2015:
2016 2015 Service cost $ 1,024 $ 1,144 Interest cost on benefit obligation 2,073 2,328 Amortization of net gain (2,322) (1,587)Amortization of prior service credit (1,138) (1,677)Net periodic benefit (credit) cost $ (363) $ 208
Assumptions
The range of weighted-average discount rates used in the measurement of benefit obligations for the plans was 3.85% to 4.30% and 4.15% to 4.70% at December 31, 2016 and 2015, respectively. The range of weighted-average discount rates used in the measurement of net periodic benefit (credit) cost for the plans was 4.15% to 4.70% and 3.75% to 4.25% for 2016 and 2015, respectively.
Assumed Health Care Cost Trends
The assumed health care cost trend rates used in measuring the postretirement benefit obligation for the plans for 2016 and 2015 are as follows:
2016 2015 Health care cost trend rate assumed for next year 6.5% 7.0% Rate to which the cost trend rate is assumed to
decline (the ultimate trend rate) 5.0% 5.0% Year that the rate reaches the ultimate trend rate 2022 2022
Northwell Health, Inc.
Notes to Consolidated Financial Statements (continued) (In Thousands)
61
9. Postretirement Benefits Other Than Pensions (continued)
Assumed health care cost trend rates have an effect on the amounts reported. A 1% change in assumed health care cost trend rates would have the following effects on the plans:
2016 2015
1%
Increase 1%
Decrease 1%
Increase 1%
Decrease Effect on total of service and
interest cost components of net periodic postretirement benefit cost $ 171 $ (145) $ 245 $ (204)
Effect on the health care component of the postretirement benefit obligation 2,843 (2,415) 3,619 (2,879)
Estimated Future Benefit Payments
Benefit payments, which reflect expected future service, as appropriate, are expected to be paid as follows:
2017 $ 1,808 2018 1,962 2019 2,071 2020 2,141 2021 2,254 2022 to 2026 12,554
Prescription Drug Benefits
The Medicare Prescription Drug, Improvement and Modernization Act of 2003 provides for a prescription drug benefit under Medicare (Medicare Part D), as well as a federal subsidy to sponsors of retiree health care benefit plans that provide a benefit that is at least actuarially equivalent to Medicare Part D. The subsidy did not have a material impact on net postretirement benefit cost for the 2016 and 2015 plan years.
Northwell Health, Inc.
Notes to Consolidated Financial Statements (continued) (In Thousands)
62
9. Postretirement Benefits Other Than Pensions (continued)
Expected federal subsidies to be received in future years for the plans are as follows:
2017 $ 328 2018 141 2019 138 2020 133 2021 128 2022 to 2026 541
10. Malpractice and Other Insurance Liabilities
Malpractice
Northwell provides for potential medical malpractice losses through a combination of a self-insurance program and purchased primary and excess insurance, on both a claims-made and occurrence basis, as follows:
Primary Insurance Coverage
Since January 2003, Northwell purchases primary malpractice insurance on an occurrence basis, covering most hospitals. The policy provides coverage with limits of $1,000 per claim and a $50,000 annual policy in the aggregate through 2009. Effective January 2010, the program retained $750 of the primary coverage per indemnity claim, while aggregate limits increased to $60,000. Effective January 2013, the retention level increased to $900 per claim.
From January 1, 1997 to December 31, 2002, Northwell’s hospitals primarily participated in a combined insurance program, which provided coverage on a claims-made basis. In December 2002, Northwell purchased a tail insurance policy to cover unreported occurrences from these prior claims-made policy periods.
Northwell Health, Inc.
Notes to Consolidated Financial Statements (continued) (In Thousands)
63
10. Malpractice and Other Insurance Liabilities (continued)
The estimated undiscounted liability for the retained primary coverage and losses in excess of the primary aggregate for the hospitals at December 31, 2016 and 2015 is $543,237 and $493,523, respectively. At December 31, 2016 and 2015, the liability is recorded at the actuarially determined present value of $501,956 and $455,245, respectively, based on a discount rate of 2.0%. Malpractice and other insurance liabilities are discounted based on the expected timing of the actuarially estimated future claim payments under the programs, using a risk-free rate. Such estimates are reviewed and updated on an annual basis.
Excess Insurance Coverage
Regional Insurance covers certain excess malpractice losses above the primary per claim limit, on a claims-made basis. Additional commercial excess malpractice insurance is purchased on a claims-made basis for excess coverage layers above the Regional Insurance per claim limit.
Regional Insurance’s estimated undiscounted reserves for losses and loss expenses outstanding at December 31, 2016 and 2015 are $212,293 and $271,389, respectively, and are recorded at the actuarially determined present value of $201,447 and $256,189, respectively, based on a discount rate of 2.0%.
Effective January 1, 2015, the aggregate excess coverage provided by Regional Insurance was reduced to $6,500 per year, which resulted in an undiscounted liability for the hospitals for estimated losses in excess of the aggregate at December 31, 2016 and 2015 of $118,079 and $52,497, respectively, recorded at the actuarially determined present value of $107,526 and $47,081, respectively, based on a 2% discount rate.
The estimated undiscounted incurred but not reported liability for claims in excess of primary insurance layers at December 31, 2016 and 2015 is $96,186 and $96,944, respectively, and is recorded at the actuarially determined present value of $83,566 and $84,242, respectively, based on a discount rate of 2.0%.
Northwell Health, Inc.
Notes to Consolidated Financial Statements (continued) (In Thousands)
64
10. Malpractice and Other Insurance Liabilities (continued)
Self-Insurance Coverage
For certain years, certain Northwell hospitals, including Phelps, NWH and Peconic, are covered for malpractice claims under various other self-insured arrangements. For self-insured claims and incidents, Northwell has accrued $42,393 and $33,889 at December 31, 2016 and 2015, respectively, based on actuarial determinations and a discount rate of 2%, as its best estimates of the ultimate cost of such losses.
Malpractice claims have been asserted against Northwell by various claimants. These claims are in various stages of processing, and some may ultimately be brought to trial. There are known incidents that have occurred through December 31, 2016 that may result in the assertion of additional claims, and other claims may be asserted arising from services provided to patients in the past. It is the opinion of Northwell’s management that adequate insurance, including self-insurance, and malpractice reserves are being maintained to cover potential malpractice losses.
Workers’ Compensation
In June 2013, Northwell changed its workers’ compensation insurance program from a guaranteed cost program to a high deductible program with a $1,000 per claim retention level. Effective July 2013, the employees of Lenox and The Long Island Home became covered under Northwell’s high deductible program, and the employees of Phelps, NWH and Peconic became covered during 2016. At December 31, 2016 and 2015, the liability for retained losses under this program is recorded at the actuarially determined present value of $119,158 and $92,095, respectively, based on a discount rate of 2.0%. The estimated undiscounted liability is $135,200 and $104,688 at December 31, 2016 and 2015, respectively.
Prior to joining Northwell’s high deductible program, Lenox, The Long Island Home, Phelps and NWH had various self-insured programs for workers’ compensation claims. At December 31, 2016 and 2015, the liability for these self-insured losses is recorded at the actuarially determined present value of $10,815 and $14,000, respectively, based on a discount rate of 2.0%.
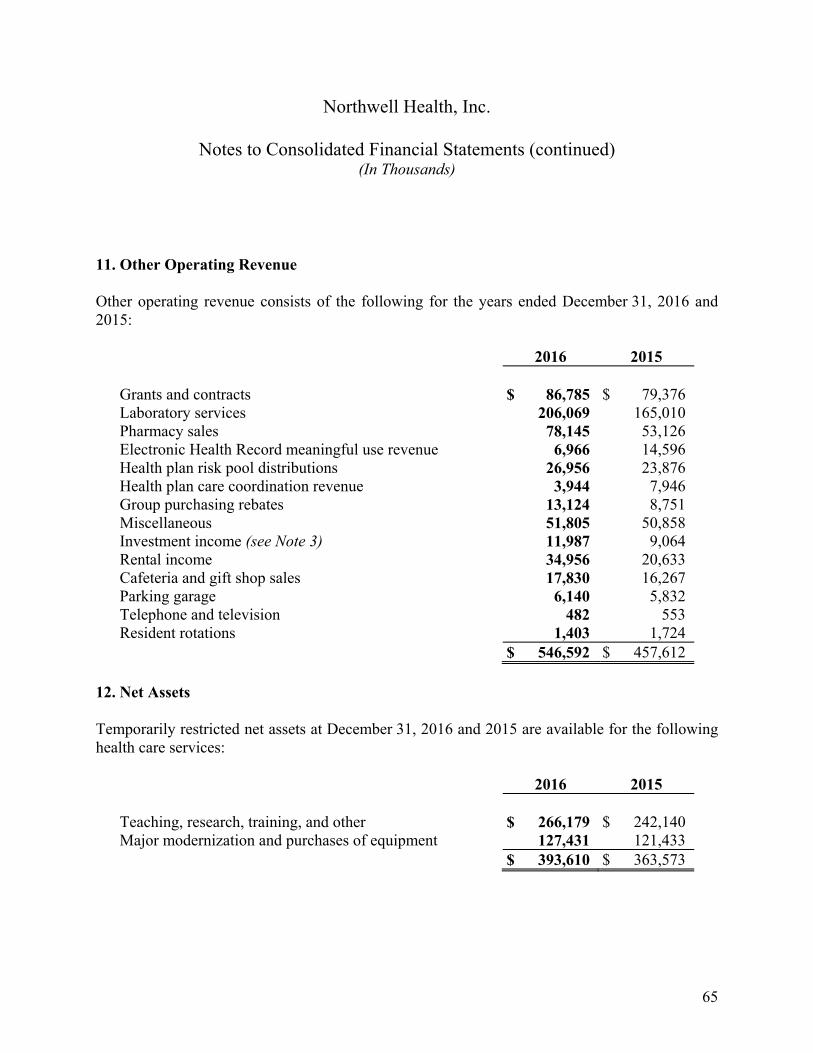
Northwell Health, Inc.
Notes to Consolidated Financial Statements (continued) (In Thousands)
65
11. Other Operating Revenue
Other operating revenue consists of the following for the years ended December 31, 2016 and 2015:
2016 2015 Grants and contracts $ 86,785 $ 79,376 Laboratory services 206,069 165,010 Pharmacy sales 78,145 53,126 Electronic Health Record meaningful use revenue 6,966 14,596 Health plan risk pool distributions 26,956 23,876 Health plan care coordination revenue 3,944 7,946 Group purchasing rebates 13,124 8,751 Miscellaneous 51,805 50,858 Investment income (see Note 3) 11,987 9,064 Rental income 34,956 20,633 Cafeteria and gift shop sales 17,830 16,267 Parking garage 6,140 5,832 Telephone and television 482 553 Resident rotations 1,403 1,724 $ 546,592 $ 457,612
12. Net Assets
Temporarily restricted net assets at December 31, 2016 and 2015 are available for the following health care services:
2016 2015 Teaching, research, training, and other $ 266,179 $ 242,140 Major modernization and purchases of equipment 127,431 121,433 $ 393,610 $ 363,573
Northwell Health, Inc.
Notes to Consolidated Financial Statements (continued) (In Thousands)
66
12. Net Assets (continued)
Northwell follows the requirements of the New York Prudent Management of Institutional Funds Act (NYPMIFA) as they relate to its permanently restricted endowments. Northwell has interpreted NYPMIFA as requiring the preservation of the fair value of the original gift, as of the gift date, of the donor-restricted endowment funds absent explicit donor stipulations to the contrary. As a result of this interpretation, Northwell classifies as permanently restricted net assets the original value of gifts donated to the permanent endowment funds.
Northwell’s endowments consist of donor-restricted funds established for a variety of purposes. As required by U.S. generally accepted accounting principles, net assets associated with endowment funds are classified and reported based on the existence or absence of donor-imposed restrictions.
Northwell requires the preservation of the fair value of the original gift as of the gift date of the donor-restricted endowment funds absent explicit donor stipulations to the contrary. As a result of this interpretation, Northwell classifies as permanently restricted net assets (a) the original value of gifts donated to the permanent endowment, (b) the original value of subsequent gifts to the permanent endowment, and (c) accumulations to the permanent endowment made in accordance with the direction of the applicable donor gift instrument at the time the accumulation is added to the fund. The remaining portion of the donor-restricted endowment funds that is not classified in permanently restricted net assets is classified as temporarily restricted net assets until those amounts are appropriated for expenditure. Northwell considers the following factors in making a determination to appropriate or accumulate donor-restricted endowment funds: (1) the duration and preservation of the fund, (2) the purpose of the donor-restricted endowment fund, (3) general economic conditions, (4) the possible effect of inflation and deflation, (5) the expected total return from income and the appreciation of investments, and (6) the investment policies of Northwell.
Northwell’s investment and spending policies for endowment assets seek to provide a predictable stream of funding to programs supported by its endowment, while seeking to maintain the purchasing power of the endowment assets. Endowment assets include those assets of donor-restricted funds that Northwell must hold in perpetuity or for a donor-specified term. Under this policy, as approved by the Board of Trustees, the endowment assets are invested in a manner that expects to generate an average annual return over time in excess of 5.0%. Actual returns in any given year may vary from this amount.
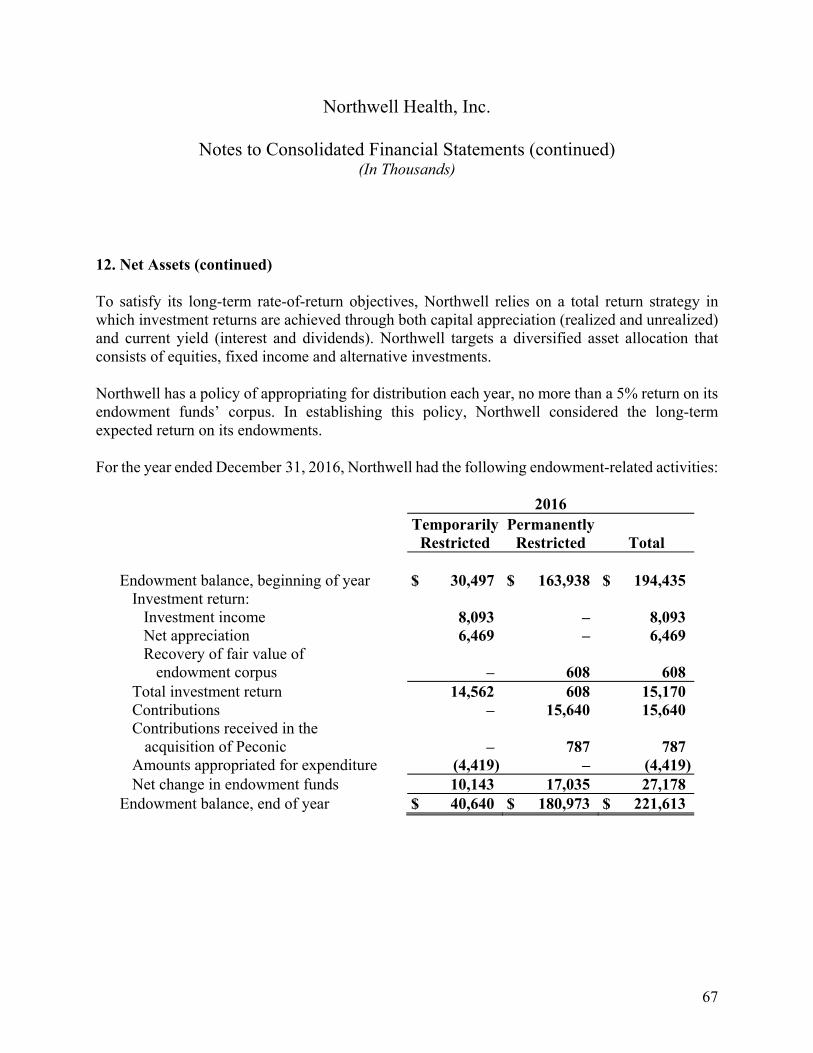
Northwell Health, Inc.
Notes to Consolidated Financial Statements (continued) (In Thousands)
67
12. Net Assets (continued)
To satisfy its long-term rate-of-return objectives, Northwell relies on a total return strategy in which investment returns are achieved through both capital appreciation (realized and unrealized) and current yield (interest and dividends). Northwell targets a diversified asset allocation that consists of equities, fixed income and alternative investments.
Northwell has a policy of appropriating for distribution each year, no more than a 5% return on its endowment funds’ corpus. In establishing this policy, Northwell considered the long-term expected return on its endowments.
For the year ended December 31, 2016, Northwell had the following endowment-related activities:
2016
Temporarily
Restricted Permanently
Restricted Total Endowment balance, beginning of year $ 30,497 $ 163,938 $ 194,435
Investment return: Investment income 8,093 – 8,093 Net appreciation 6,469 – 6,469 Recovery of fair value of
endowment corpus – 608 608 Total investment return 14,562 608 15,170 Contributions – 15,640 15,640 Contributions received in the
acquisition of Peconic – 787 787 Amounts appropriated for expenditure (4,419) – (4,419)Net change in endowment funds 10,143 17,035 27,178
Endowment balance, end of year $ 40,640 $ 180,973 $ 221,613
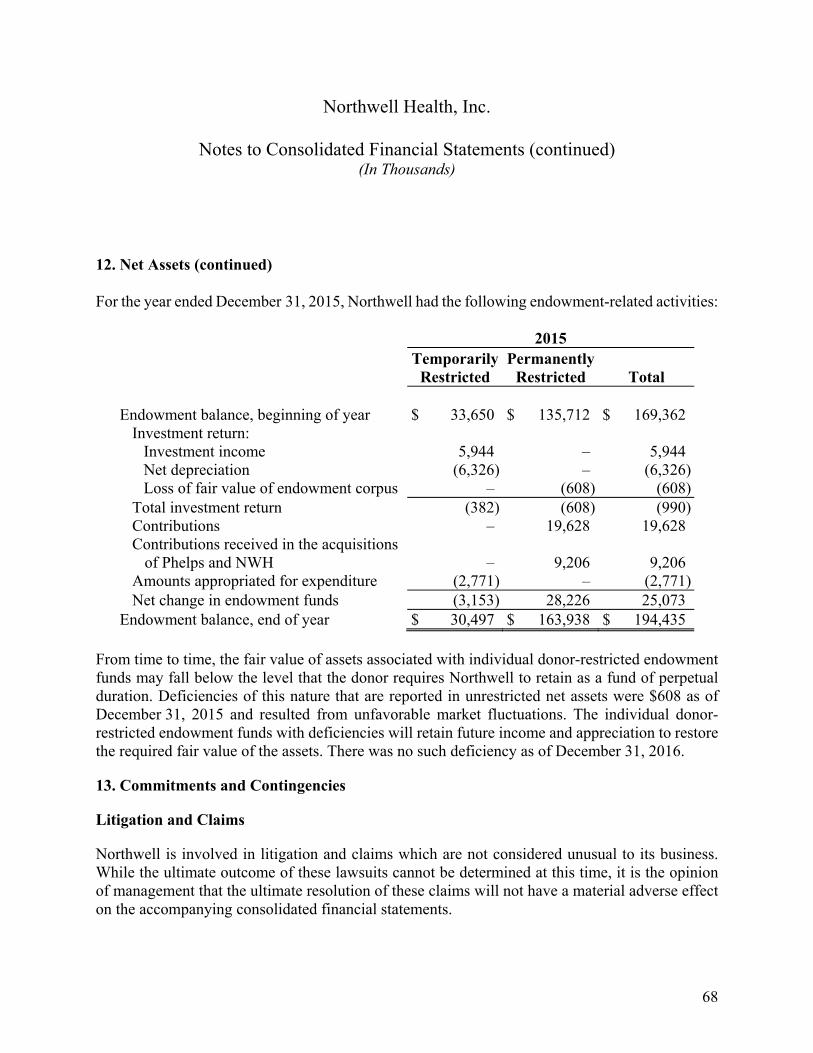
Northwell Health, Inc.
Notes to Consolidated Financial Statements (continued) (In Thousands)
68
12. Net Assets (continued)
For the year ended December 31, 2015, Northwell had the following endowment-related activities:
2015
Temporarily
Restricted Permanently
Restricted Total Endowment balance, beginning of year $ 33,650 $ 135,712 $ 169,362
Investment return: Investment income 5,944 – 5,944 Net depreciation (6,326) – (6,326)Loss of fair value of endowment corpus – (608) (608)
Total investment return (382) (608) (990)Contributions – 19,628 19,628 Contributions received in the acquisitions
of Phelps and NWH – 9,206 9,206 Amounts appropriated for expenditure (2,771) – (2,771)Net change in endowment funds (3,153) 28,226 25,073
Endowment balance, end of year $ 30,497 $ 163,938 $ 194,435 From time to time, the fair value of assets associated with individual donor-restricted endowment funds may fall below the level that the donor requires Northwell to retain as a fund of perpetual duration. Deficiencies of this nature that are reported in unrestricted net assets were $608 as of December 31, 2015 and resulted from unfavorable market fluctuations. The individual donor-restricted endowment funds with deficiencies will retain future income and appreciation to restore the required fair value of the assets. There was no such deficiency as of December 31, 2016.
13. Commitments and Contingencies
Litigation and Claims
Northwell is involved in litigation and claims which are not considered unusual to its business. While the ultimate outcome of these lawsuits cannot be determined at this time, it is the opinion of management that the ultimate resolution of these claims will not have a material adverse effect on the accompanying consolidated financial statements.
Northwell Health, Inc.
Notes to Consolidated Financial Statements (continued) (In Thousands)
69
13. Commitments and Contingencies (continued)
Operating Leases
Northwell leases certain office facility space, patient care facility space and equipment under operating leases that have initial or remaining noncancelable terms in excess of one year. Aggregate minimum operating lease payments are amortized on the straight-line basis over the terms of the respective leases. Rent expense under such leases was $108,548 and $93,547 for 2016 and 2015, respectively.
Future minimum lease payments under noncancelable operating leases with terms of one year or more are as follows:
2017 $ 100,5302018 89,634 2019 83,204 2020 74,432 2021 68,189 Thereafter 376,865
Collective Bargaining Agreements
At December 31, 2016, approximately 35% of Northwell’s employees are union employees who are covered under the terms of various collective bargaining agreements. Certain collective bargaining agreements, which represent approximately 17% of union employees (6% of total employees), have expired, or will expire, within the next year and are currently being renegotiated.
Letters of Credit
At December 31, 2016, $18,816 in secured irrevocable direct-pay letters of credit were maintained with two commercial banks, replacing various debt service reserve funds for certain Obligated Group bond issues. A $22,314 commitment from one commercial bank remains available for future letters of credit.
Northwell Health, Inc.
Notes to Consolidated Financial Statements (continued) (In Thousands)
70
13. Commitments and Contingencies (continued)
Four commercial banks are providing a total of $233,000 in commitments, solely to support letters of credit required for Northwell’s high deductible workers’ compensation insurance program. At December 31, 2016, $89,973 in secured irrevocable direct-pay letters of credit were maintained with two of the banks, and $143,027 of the commitments remain available for future letters of credit.
Other Commitments
In 2008, Hofstra University (the University) and Northwell entered into a joint academic agreement to work in close collaboration in the development of a medical school, now known as the Hofstra Northwell School of Medicine (the Medical School), at the University, while remaining as separate corporations with separate governance. In 2010, the Medical School received preliminary accreditation from the Liaison Committee on Medical Education and in February 2015 was granted full accreditation. Northwell has agreed to reimburse the University for a portion of the Medical School’s annual costs each year through June 30, 2017 in an aggregate amount of up to $50,000. Reimbursement payments after June 30, 2017 will be a minimum of $5,000 for each academic year, with amounts indexed to the Medical School tuition. Reimbursement payments are contingent upon annual approval by the Boards of Northwell and the University. Northwell shall not advance funds to the University that have not yet been spent in connection with the Medical School. To date, Northwell has recorded approximately $47,500 of these costs related to the Medical School. Northwell also provides approximately $2,000 annually for funding of Medical School scholarships and approximately $2,000 annually for funding of student loans, with amounts indexed to the Medical School tuition.
In April 2015, Northwell entered into a strategic affiliation with Cold Spring Harbor Laboratory (CSHL). Under the terms of this affiliation, Northwell and CSHL will continue as independent organizations governed by their respective Boards of Trustees. The institutions appointed a committee with responsibility for the oversight, staffing and implementation of the affiliation. The goals of the affiliation include advancing cancer diagnostic and therapeutic research, developing a new clinical cancer research unit at Northwell to support early-phase clinical studies of new cancer therapies, and recruiting and training more clinician-scientists in oncology. Pursuant to the agreement, Northwell is committed to pay CSHL $5,000 in year one, $10,000 in year two and $15,000 annually thereafter, throughout the term of the affiliation.
Northwell Health, Inc.
Notes to Consolidated Financial Statements (continued) (In Thousands)
71
13. Commitments and Contingencies (continued)
In August 2015, Northwell entered into a clinical affiliation and collaboration agreement with Maimonides Medical Center (Maimonides), a not-for-profit acute care hospital located in Brooklyn, New York. The purpose of the affiliation is to pursue collaborative activities, such as clinical integration initiatives and ambulatory services joint ventures, as well as service agreements that may generate operational efficiencies. Under the terms of the affiliation agreement, Northwell and Maimonides will remain independent organizations governed by their respective Boards of Trustees. Pursuant to the affiliation agreement, the parties have also entered into an unsecured loan agreement, whereby Northwell has loaned a total of $81,250 to Maimonides as of December 31, 2016, with an additional $25,000 in February 2017 and a commitment to loan a total increasing to $125,000 by August 2017. Payments on the loan and accrued interest thereon would not commence until the termination or expiration of the affiliation agreement. However, if Northwell becomes the sole member and corporate parent of Maimonides, outstanding amounts borrowed under the loan agreement, including accrued interest, will be forgiven.
In June 2016, Northwell executed a long-term lease for the site of the former Victory Memorial Hospital in the Bay Ridge section of Brooklyn. However, the lease will not become effective until certain contingencies and regulatory approvals are met. Plans are being developed to potentially use the site for a variety of health care programs to be delivered by Northwell, its strategic affiliate, Maimonides, and possibly other partners as part of Northwell’s expansion plans into Brooklyn.
In the normal course of business, Northwell enters into multi-year contracts with vendors, suppliers and service providers for goods or services to be provided to Northwell. Under the terms of such agreements, Northwell may be contingently liable for termination or other fees in the event of contract termination or default. Northwell does not believe that such contingent liabilities, should they become due, would have a material impact on its consolidated financial statements.
14. Subsequent Events
Management has evaluated the impact of subsequent events through April 28, 2017 representing the date at which the consolidated financial statements were issued. No events, aside from the additional loan to Maimonides disclosed in Note 13, have occurred that require disclosure in, or adjustment to, the consolidated financial statements.
Supplementary Information, Audit Reports and Schedules Related to the Uniform Guidance
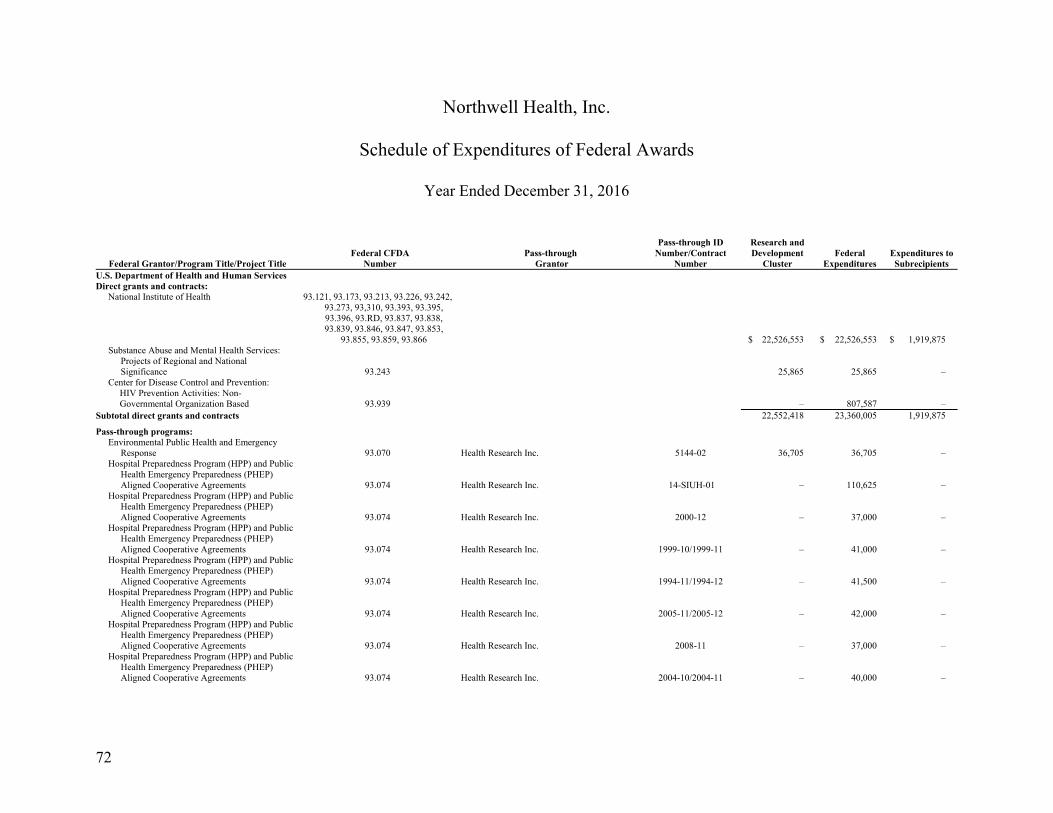
72
Northwell Health, Inc.
Schedule of Expenditures of Federal Awards
Year Ended December 31, 2016
Federal Grantor/Program Title/Project Title Federal CFDA
Number Pass-through
Grantor
Pass-through ID Number/Contract
Number
Research and Development
Cluster Federal
Expenditures Expenditures to Subrecipients
U.S. Department of Health and Human Services Direct grants and contracts:
National Institute of Health 93.121, 93.173, 93.213, 93.226, 93.242, 93.273, 93,310, 93.393, 93.395, 93.396, 93.RD, 93.837, 93.838, 93.839, 93.846, 93.847, 93.853,
93.855, 93.859, 93.866 $ 22,526,553 $ 22,526,553 $ 1,919,875 Substance Abuse and Mental Health Services:
Projects of Regional and National Significance 93.243 25,865 25,865 –
Center for Disease Control and Prevention: HIV Prevention Activities: Non-Governmental Organization Based 93.939 – 807,587 –
Subtotal direct grants and contracts 22,552,418 23,360,005 1,919,875 Pass-through programs:
Environmental Public Health and Emergency Response 93.070 Health Research Inc. 5144-02 36,705 36,705 –
Hospital Preparedness Program (HPP) and Public Health Emergency Preparedness (PHEP) Aligned Cooperative Agreements 93.074 Health Research Inc. 14-SIUH-01 – 110,625 –
Hospital Preparedness Program (HPP) and Public Health Emergency Preparedness (PHEP) Aligned Cooperative Agreements 93.074 Health Research Inc. 2000-12 – 37,000 –
Hospital Preparedness Program (HPP) and Public Health Emergency Preparedness (PHEP) Aligned Cooperative Agreements 93.074 Health Research Inc. 1999-10/1999-11 – 41,000 –
Hospital Preparedness Program (HPP) and Public Health Emergency Preparedness (PHEP) Aligned Cooperative Agreements 93.074 Health Research Inc. 1994-11/1994-12 – 41,500 –
Hospital Preparedness Program (HPP) and Public Health Emergency Preparedness (PHEP) Aligned Cooperative Agreements 93.074 Health Research Inc. 2005-11/2005-12 – 42,000 –
Hospital Preparedness Program (HPP) and Public Health Emergency Preparedness (PHEP) Aligned Cooperative Agreements 93.074 Health Research Inc. 2008-11 – 37,000 –
Hospital Preparedness Program (HPP) and Public Health Emergency Preparedness (PHEP) Aligned Cooperative Agreements 93.074 Health Research Inc. 2004-10/2004-11 – 40,000 –
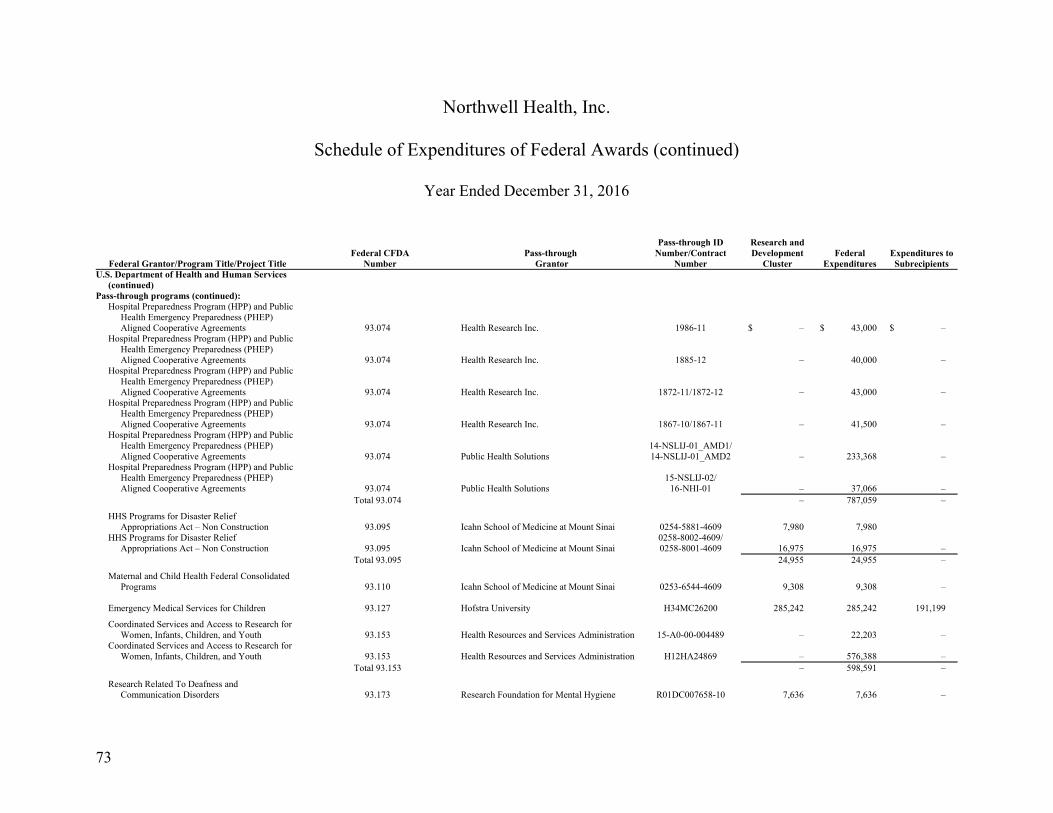
Northwell Health, Inc.
Schedule of Expenditures of Federal Awards (continued)
Year Ended December 31, 2016
73
Federal Grantor/Program Title/Project Title Federal CFDA
Number Pass-through
Grantor
Pass-through ID Number/Contract
Number
Research and Development
Cluster Federal
Expenditures Expenditures to Subrecipients
U.S. Department of Health and Human Services (continued)
Pass-through programs (continued): Hospital Preparedness Program (HPP) and Public
Health Emergency Preparedness (PHEP) Aligned Cooperative Agreements 93.074 Health Research Inc. 1986-11 $ – $ 43,000 $ –
Hospital Preparedness Program (HPP) and Public Health Emergency Preparedness (PHEP) Aligned Cooperative Agreements 93.074 Health Research Inc. 1885-12 – 40,000 –
Hospital Preparedness Program (HPP) and Public Health Emergency Preparedness (PHEP) Aligned Cooperative Agreements 93.074 Health Research Inc. 1872-11/1872-12 – 43,000 –
Hospital Preparedness Program (HPP) and Public Health Emergency Preparedness (PHEP) Aligned Cooperative Agreements 93.074 Health Research Inc. 1867-10/1867-11 – 41,500 –
Hospital Preparedness Program (HPP) and Public Health Emergency Preparedness (PHEP) Aligned Cooperative Agreements 93.074 Public Health Solutions
14-NSLIJ-01_AMD1/14-NSLIJ-01_AMD2 – 233,368 –
Hospital Preparedness Program (HPP) and Public Health Emergency Preparedness (PHEP) Aligned Cooperative Agreements 93.074 Public Health Solutions
15-NSLIJ-02/ 16-NHI-01 – 37,066 –
Total 93.074 – 787,059 –
HHS Programs for Disaster Relief Appropriations Act – Non Construction 93.095 Icahn School of Medicine at Mount Sinai 0254-5881-4609 7,980 7,980
HHS Programs for Disaster Relief Appropriations Act – Non Construction 93.095 Icahn School of Medicine at Mount Sinai
0258-8002-4609/ 0258-8001-4609 16,975 16,975 –
Total 93.095 24,955 24,955 –
Maternal and Child Health Federal Consolidated Programs 93.110 Icahn School of Medicine at Mount Sinai 0253-6544-4609 9,308 9,308 –
Emergency Medical Services for Children 93.127 Hofstra University H34MC26200 285,242 285,242 191,199
Coordinated Services and Access to Research for
Women, Infants, Children, and Youth 93.153 Health Resources and Services Administration 15-A0-00-004489 – 22,203 – Coordinated Services and Access to Research for
Women, Infants, Children, and Youth 93.153 Health Resources and Services Administration H12HA24869 – 576,388 – Total 93.153 – 598,591 –
Research Related To Deafness and Communication Disorders 93.173 Research Foundation for Mental Hygiene R01DC007658-10 7,636 7,636 –
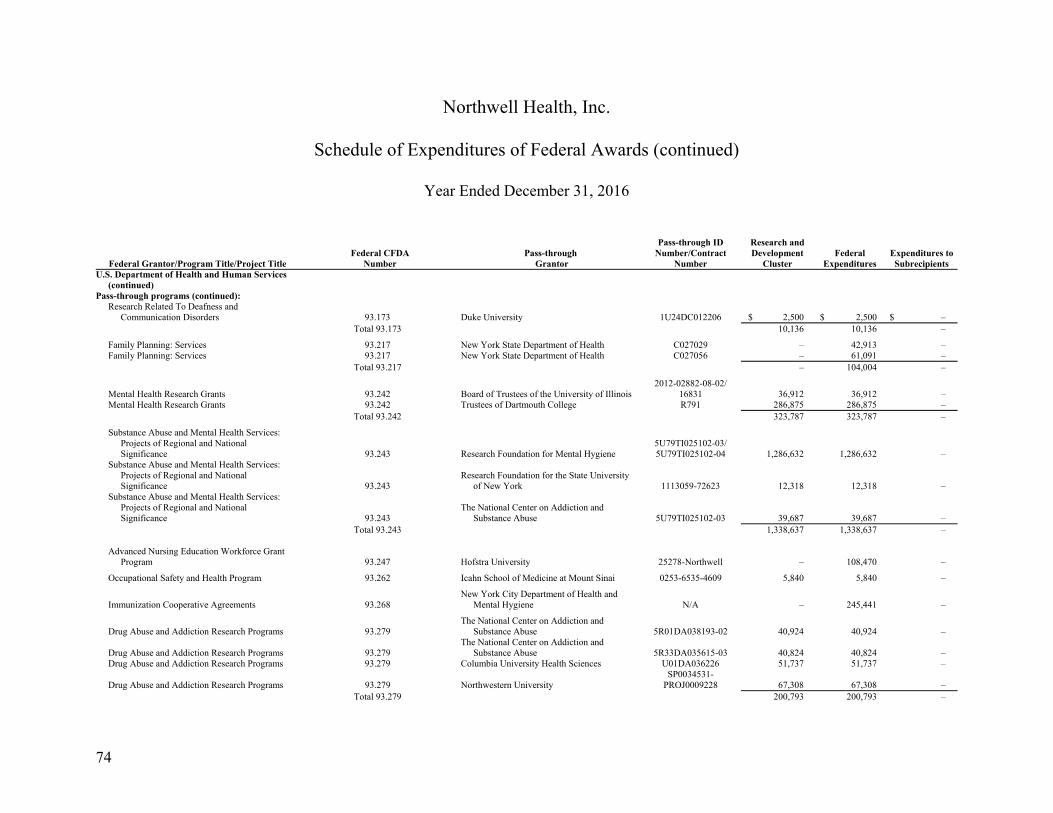
Northwell Health, Inc.
Schedule of Expenditures of Federal Awards (continued)
Year Ended December 31, 2016
74
Federal Grantor/Program Title/Project Title Federal CFDA
Number Pass-through
Grantor
Pass-through ID Number/Contract
Number
Research and Development
Cluster Federal
Expenditures Expenditures to Subrecipients
U.S. Department of Health and Human Services (continued)
Pass-through programs (continued): Research Related To Deafness and
Communication Disorders 93.173 Duke University 1U24DC012206 $ 2,500 $ 2,500 $ – Total 93.173 10,136 10,136 –
Family Planning: Services 93.217 New York State Department of Health C027029 – 42,913 – Family Planning: Services 93.217 New York State Department of Health C027056 – 61,091 –
Total 93.217 – 104,004 –
Mental Health Research Grants 93.242 Board of Trustees of the University of Illinois 2012-02882-08-02/
16831 36,912 36,912 – Mental Health Research Grants 93.242 Trustees of Dartmouth College R791 286,875 286,875 –
Total 93.242 323,787 323,787 –
Substance Abuse and Mental Health Services: Projects of Regional and National Significance 93.243 Research Foundation for Mental Hygiene
5U79TI025102-03/ 5U79TI025102-04 1,286,632 1,286,632 –
Substance Abuse and Mental Health Services: Projects of Regional and National Significance 93.243
Research Foundation for the State University of New York 1113059-72623 12,318 12,318 –
Substance Abuse and Mental Health Services: Projects of Regional and National Significance 93.243
The National Center on Addiction and Substance Abuse 5U79TI025102-03 39,687 39,687 –
Total 93.243 1,338,637 1,338,637 –
Advanced Nursing Education Workforce Grant Program 93.247 Hofstra University 25278-Northwell – 108,470 –
Occupational Safety and Health Program 93.262 Icahn School of Medicine at Mount Sinai 0253-6535-4609 5,840 5,840 –
Immunization Cooperative Agreements 93.268 New York City Department of Health and
Mental Hygiene N/A – 245,441 –
Drug Abuse and Addiction Research Programs 93.279 The National Center on Addiction and
Substance Abuse 5R01DA038193-02 40,924 40,924 –
Drug Abuse and Addiction Research Programs 93.279 The National Center on Addiction and
Substance Abuse 5R33DA035615-03 40,824 40,824 – Drug Abuse and Addiction Research Programs 93.279 Columbia University Health Sciences U01DA036226 51,737 51,737 –
Drug Abuse and Addiction Research Programs 93.279 Northwestern University SP0034531-
PROJ0009228 67,308 67,308 – Total 93.279 200,793 200,793 –
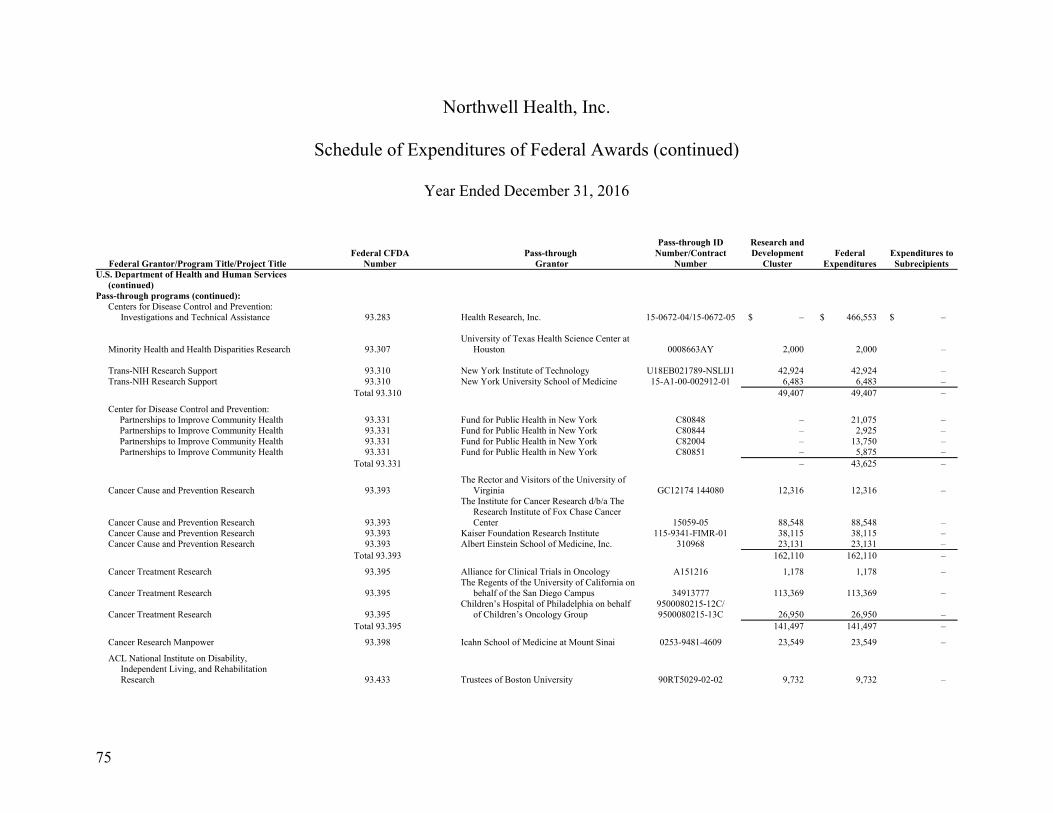
Northwell Health, Inc.
Schedule of Expenditures of Federal Awards (continued)
Year Ended December 31, 2016
75
Federal Grantor/Program Title/Project Title Federal CFDA
Number Pass-through
Grantor
Pass-through ID Number/Contract
Number
Research and Development
Cluster Federal
Expenditures Expenditures to Subrecipients
U.S. Department of Health and Human Services (continued)
Pass-through programs (continued): Centers for Disease Control and Prevention:
Investigations and Technical Assistance 93.283 Health Research, Inc. 15-0672-04/15-0672-05 $ – $ 466,553 $ –
Minority Health and Health Disparities Research 93.307 University of Texas Health Science Center at
Houston 0008663AY 2,000 2,000 – Trans-NIH Research Support 93.310 New York Institute of Technology U18EB021789-NSLIJ1 42,924 42,924 – Trans-NIH Research Support 93.310 New York University School of Medicine 15-A1-00-002912-01 6,483 6,483 – Total 93.310 49,407 49,407 –
Center for Disease Control and Prevention:
Partnerships to Improve Community Health 93.331 Fund for Public Health in New York C80848 – 21,075 – Partnerships to Improve Community Health 93.331 Fund for Public Health in New York C80844 – 2,925 – Partnerships to Improve Community Health 93.331 Fund for Public Health in New York C82004 – 13,750 – Partnerships to Improve Community Health 93.331 Fund for Public Health in New York C80851 – 5,875 –
Total 93.331 – 43,625 –
Cancer Cause and Prevention Research 93.393 The Rector and Visitors of the University of
Virginia GC12174 144080 12,316 12,316 –
Cancer Cause and Prevention Research 93.393
The Institute for Cancer Research d/b/a The Research Institute of Fox Chase Cancer Center 15059-05 88,548 88,548 –
Cancer Cause and Prevention Research 93.393 Kaiser Foundation Research Institute 115-9341-FIMR-01 38,115 38,115 – Cancer Cause and Prevention Research 93.393 Albert Einstein School of Medicine, Inc. 310968 23,131 23,131 –
Total 93.393 162,110 162,110 –
Cancer Treatment Research 93.395 Alliance for Clinical Trials in Oncology A151216 1,178 1,178 –
Cancer Treatment Research 93.395 The Regents of the University of California on
behalf of the San Diego Campus 34913777 113,369 113,369 –
Cancer Treatment Research 93.395 Children’s Hospital of Philadelphia on behalf
of Children’s Oncology Group 9500080215-12C/ 9500080215-13C 26,950 26,950 –
Total 93.395 141,497 141,497 –
Cancer Research Manpower 93.398 Icahn School of Medicine at Mount Sinai 0253-9481-4609 23,549 23,549 – ACL National Institute on Disability,
Independent Living, and Rehabilitation Research 93.433 Trustees of Boston University 90RT5029-02-02 9,732 9,732 –
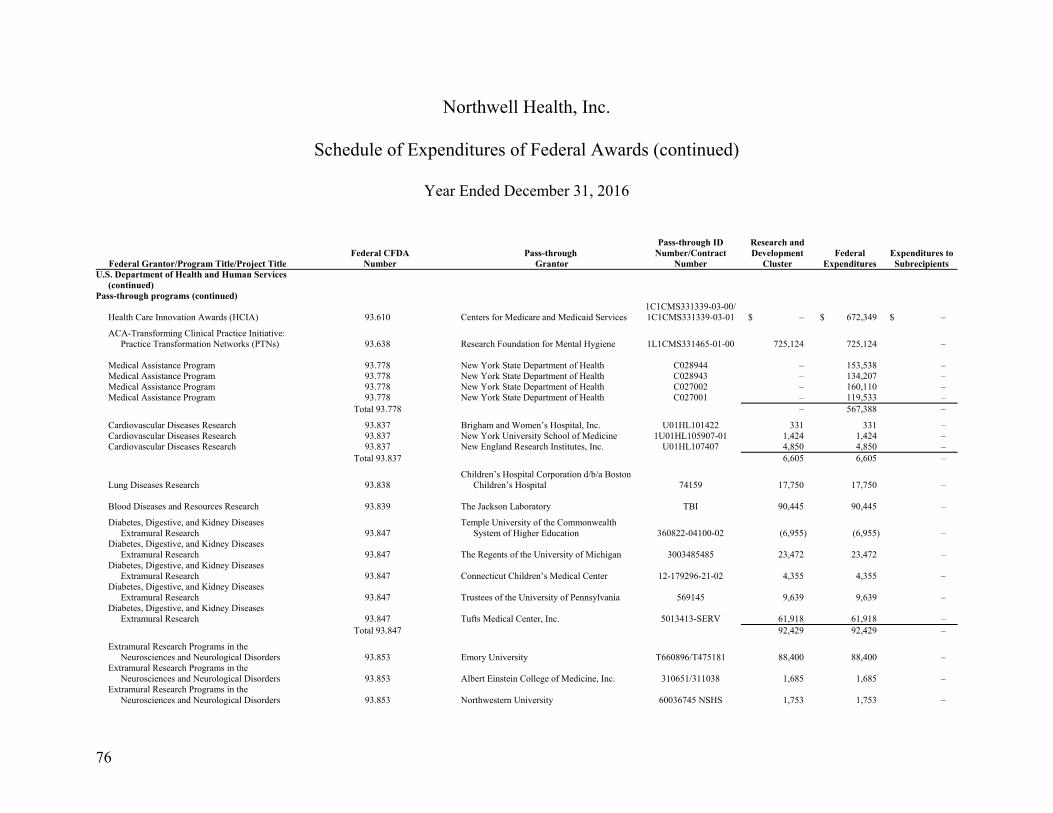
Northwell Health, Inc.
Schedule of Expenditures of Federal Awards (continued)
Year Ended December 31, 2016
76
Federal Grantor/Program Title/Project Title Federal CFDA
Number Pass-through
Grantor
Pass-through ID Number/Contract
Number
Research and Development
Cluster Federal
Expenditures Expenditures to Subrecipients
U.S. Department of Health and Human Services (continued)
Pass-through programs (continued)
Health Care Innovation Awards (HCIA) 93.610 Centers for Medicare and Medicaid Services 1C1CMS331339-03-00/ 1C1CMS331339-03-01 $ – $ 672,349 $ –
ACA-Transforming Clinical Practice Initiative:
Practice Transformation Networks (PTNs) 93.638 Research Foundation for Mental Hygiene 1L1CMS331465-01-00 725,124 725,124 – Medical Assistance Program 93.778 New York State Department of Health C028944 – 153,538 – Medical Assistance Program 93.778 New York State Department of Health C028943 – 134,207 – Medical Assistance Program 93.778 New York State Department of Health C027002 – 160,110 – Medical Assistance Program 93.778 New York State Department of Health C027001 – 119,533 – Total 93.778 – 567,388 – Cardiovascular Diseases Research 93.837 Brigham and Women’s Hospital, Inc. U01HL101422 331 331 – Cardiovascular Diseases Research 93.837 New York University School of Medicine 1U01HL105907-01 1,424 1,424 – Cardiovascular Diseases Research 93.837 New England Research Institutes, Inc. U01HL107407 4,850 4,850 – Total 93.837 6,605 6,605 –
Lung Diseases Research 93.838 Children’s Hospital Corporation d/b/a Boston
Children’s Hospital 74159 17,750 17,750 – Blood Diseases and Resources Research 93.839 The Jackson Laboratory TBI 90,445 90,445 – Diabetes, Digestive, and Kidney Diseases
Extramural Research 93.847 Temple University of the Commonwealth
System of Higher Education 360822-04100-02 (6,955) (6,955) – Diabetes, Digestive, and Kidney Diseases
Extramural Research 93.847 The Regents of the University of Michigan 3003485485 23,472 23,472 – Diabetes, Digestive, and Kidney Diseases
Extramural Research 93.847 Connecticut Children’s Medical Center 12-179296-21-02 4,355 4,355 – Diabetes, Digestive, and Kidney Diseases
Extramural Research 93.847 Trustees of the University of Pennsylvania 569145 9,639 9,639 – Diabetes, Digestive, and Kidney Diseases
Extramural Research 93.847 Tufts Medical Center, Inc. 5013413-SERV 61,918 61,918 – Total 93.847 92,429 92,429 – Extramural Research Programs in the
Neurosciences and Neurological Disorders 93.853 Emory University T660896/T475181 88,400 88,400 – Extramural Research Programs in the
Neurosciences and Neurological Disorders 93.853 Albert Einstein College of Medicine, Inc. 310651/311038 1,685 1,685 – Extramural Research Programs in the
Neurosciences and Neurological Disorders 93.853 Northwestern University 60036745 NSHS 1,753 1,753 –
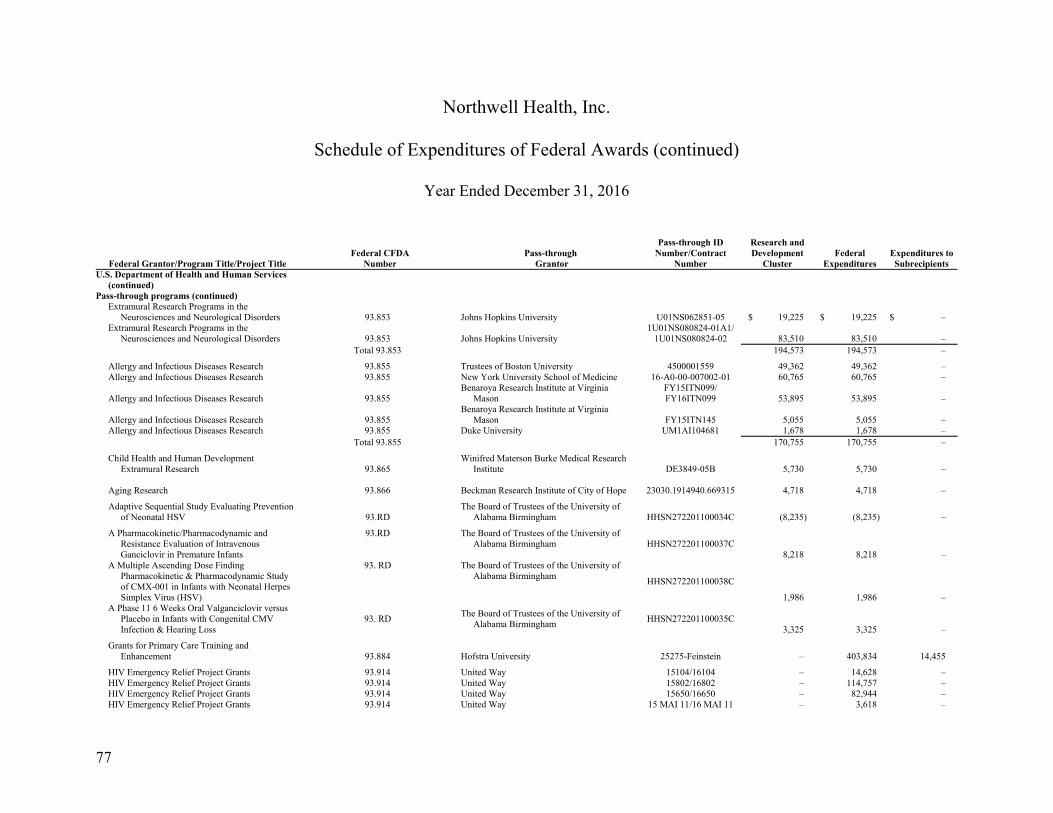
Northwell Health, Inc.
Schedule of Expenditures of Federal Awards (continued)
Year Ended December 31, 2016
77
Federal Grantor/Program Title/Project Title Federal CFDA
Number Pass-through
Grantor
Pass-through ID Number/Contract
Number
Research and Development
Cluster Federal
Expenditures Expenditures to Subrecipients
U.S. Department of Health and Human Services (continued)
Pass-through programs (continued) Extramural Research Programs in the
Neurosciences and Neurological Disorders 93.853 Johns Hopkins University U01NS062851-05 $ 19,225 $ 19,225 $ – Extramural Research Programs in the
Neurosciences and Neurological Disorders 93.853 Johns Hopkins University 1U01NS080824-01A1/
1U01NS080824-02 83,510 83,510 – Total 93.853 194,573 194,573 –
Allergy and Infectious Diseases Research 93.855 Trustees of Boston University 4500001559 49,362 49,362 – Allergy and Infectious Diseases Research 93.855 New York University School of Medicine 16-A0-00-007002-01 60,765 60,765 –
Allergy and Infectious Diseases Research 93.855 Benaroya Research Institute at Virginia
Mason FY15ITN099/ FY16ITN099 53,895 53,895 –
Allergy and Infectious Diseases Research 93.855 Benaroya Research Institute at Virginia
Mason FY15ITN145 5,055 5,055 – Allergy and Infectious Diseases Research 93.855 Duke University UM1AI104681 1,678 1,678 –
Total 93.855 170,755 170,755 –
Child Health and Human Development Extramural Research 93.865
Winifred Materson Burke Medical Research Institute DE3849-05B 5,730 5,730 –
Aging Research 93.866 Beckman Research Institute of City of Hope 23030.1914940.669315 4,718 4,718 – Adaptive Sequential Study Evaluating Prevention
of Neonatal HSV 93.RD The Board of Trustees of the University of
Alabama Birmingham HHSN272201100034C (8,235) (8,235) – A Pharmacokinetic/Pharmacodynamic and
Resistance Evaluation of Intravenous Ganciclovir in Premature Infants
93.RD The Board of Trustees of the University of Alabama Birmingham HHSN272201100037C
8,218 8,218 – A Multiple Ascending Dose Finding
Pharmacokinetic & Pharmacodynamic Study of CMX-001 in Infants with Neonatal Herpes Simplex Virus (HSV)
93. RD The Board of Trustees of the University of Alabama Birmingham
HHSN272201100038C
1,986 1,986 – A Phase 11 6 Weeks Oral Valganciclovir versus
Placebo in Infants with Congenital CMV Infection & Hearing Loss
93. RD The Board of Trustees of the University of
Alabama Birmingham HHSN272201100035C
3,325 3,325 – Grants for Primary Care Training and
Enhancement 93.884 Hofstra University 25275-Feinstein – 403,834 14,455 HIV Emergency Relief Project Grants 93.914 United Way 15104/16104 – 14,628 – HIV Emergency Relief Project Grants 93.914 United Way 15802/16802 – 114,757 – HIV Emergency Relief Project Grants 93.914 United Way 15650/16650 – 82,944 – HIV Emergency Relief Project Grants 93.914 United Way 15 MAI 11/16 MAI 11 – 3,618 –
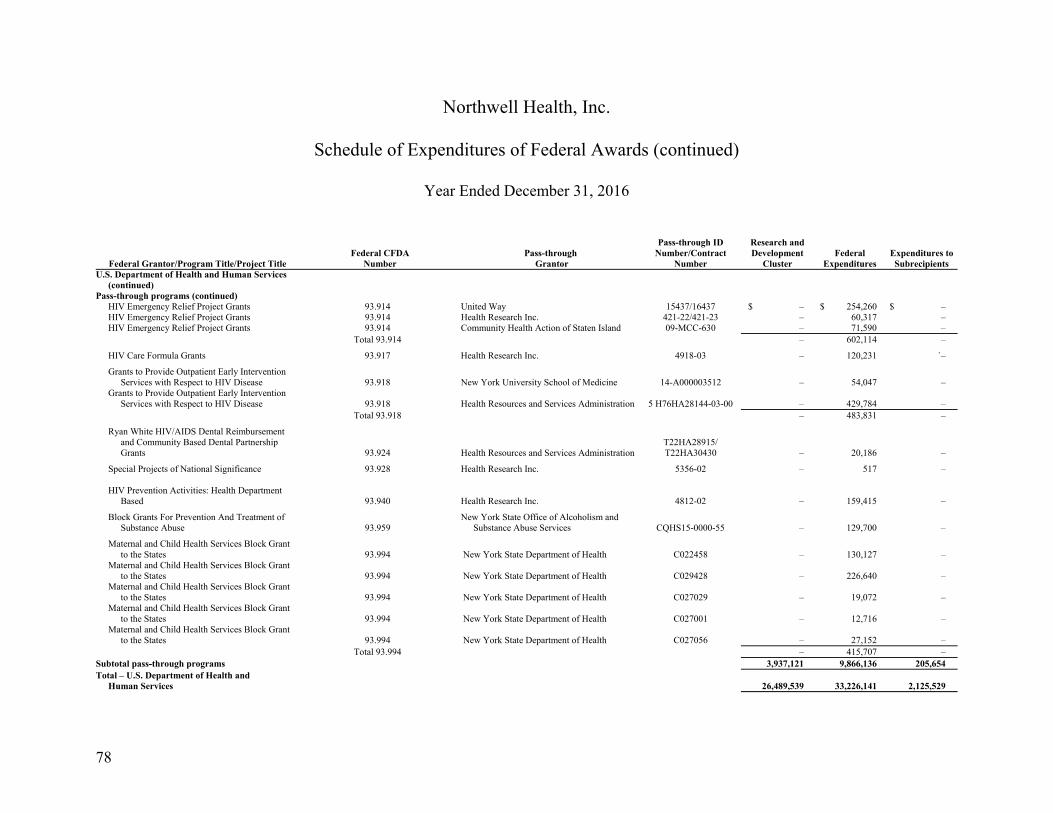
Northwell Health, Inc.
Schedule of Expenditures of Federal Awards (continued)
Year Ended December 31, 2016
78
Federal Grantor/Program Title/Project Title Federal CFDA
Number Pass-through
Grantor
Pass-through ID Number/Contract
Number
Research and Development
Cluster Federal
Expenditures Expenditures to Subrecipients
U.S. Department of Health and Human Services (continued)
Pass-through programs (continued) HIV Emergency Relief Project Grants 93.914 United Way 15437/16437 $ – $ 254,260 $ – HIV Emergency Relief Project Grants 93.914 Health Research Inc. 421-22/421-23 – 60,317 – HIV Emergency Relief Project Grants 93.914 Community Health Action of Staten Island 09-MCC-630 – 71,590 –
Total 93.914 – 602,114 –
HIV Care Formula Grants 93.917 Health Research Inc. 4918-03 – 120,231 `–
Grants to Provide Outpatient Early Intervention Services with Respect to HIV Disease 93.918 New York University School of Medicine 14-A000003512 – 54,047 –
Grants to Provide Outpatient Early Intervention Services with Respect to HIV Disease 93.918 Health Resources and Services Administration 5 H76HA28144-03-00 – 429,784 –
Total 93.918 – 483,831 – Ryan White HIV/AIDS Dental Reimbursement
and Community Based Dental Partnership Grants 93.924 Health Resources and Services Administration
T22HA28915/ T22HA30430 – 20,186 –
Special Projects of National Significance 93.928 Health Research Inc. 5356-02 – 517 – HIV Prevention Activities: Health Department
Based 93.940 Health Research Inc. 4812-02 – 159,415 – Block Grants For Prevention And Treatment of
Substance Abuse 93.959 New York State Office of Alcoholism and
Substance Abuse Services CQHS15-0000-55 – 129,700 – Maternal and Child Health Services Block Grant
to the States 93.994 New York State Department of Health C022458 – 130,127 – Maternal and Child Health Services Block Grant
to the States 93.994 New York State Department of Health C029428 – 226,640 – Maternal and Child Health Services Block Grant
to the States 93.994 New York State Department of Health C027029 – 19,072 – Maternal and Child Health Services Block Grant
to the States 93.994 New York State Department of Health C027001 – 12,716 – Maternal and Child Health Services Block Grant
to the States 93.994 New York State Department of Health C027056 – 27,152 – Total 93.994 – 415,707 –Subtotal pass-through programs 3,937,121 9,866,136 205,654 Total – U.S. Department of Health and
Human Services 26,489,539 33,226,141 2,125,529
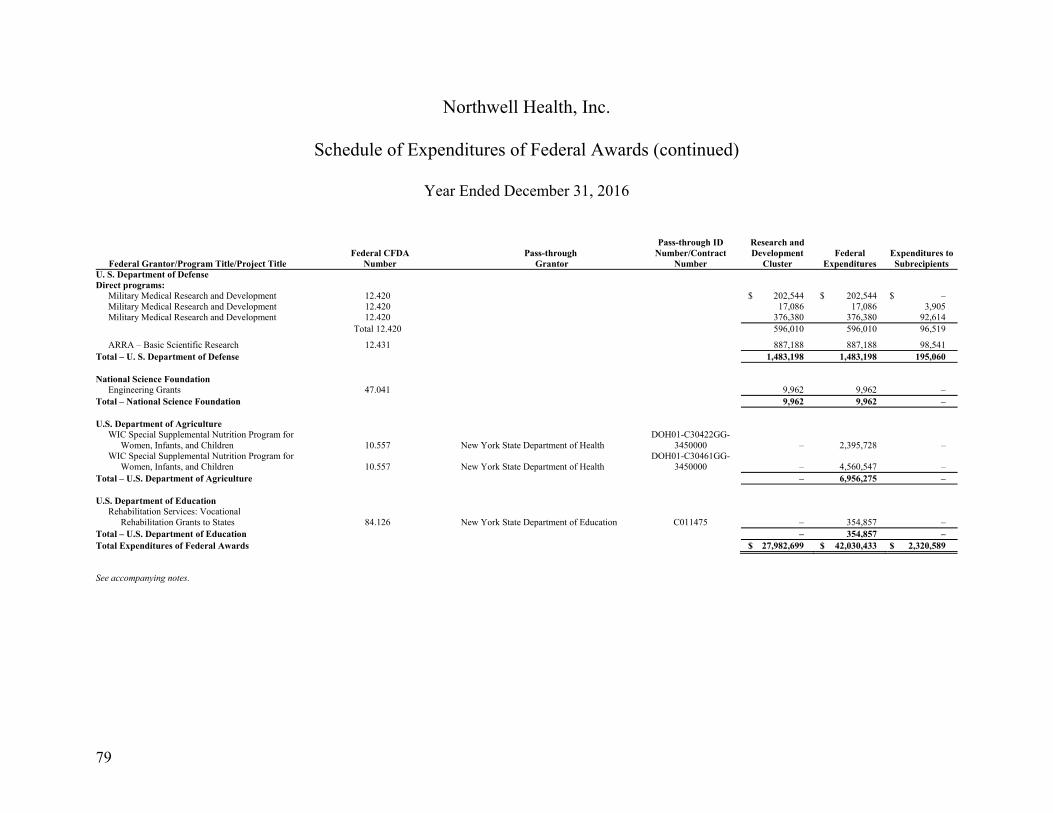
Northwell Health, Inc.
Schedule of Expenditures of Federal Awards (continued)
Year Ended December 31, 2016
79
Federal Grantor/Program Title/Project Title Federal CFDA
Number Pass-through
Grantor
Pass-through ID Number/Contract
Number
Research and Development
Cluster Federal
Expenditures Expenditures to Subrecipients
U. S. Department of Defense Direct programs:
Military Medical Research and Development 12.420 $ 202,544 $ 202,544 $ – Military Medical Research and Development 12.420 17,086 17,086 3,905 Military Medical Research and Development 12.420 376,380 376,380 92,614 Total 12.420 596,010 596,010 96,519
ARRA – Basic Scientific Research 12.431 887,188 887,188 98,541
Total – U. S. Department of Defense 1,483,198 1,483,198 195,060
National Science Foundation Engineering Grants 47.041 9,962 9,962 –
Total – National Science Foundation 9,962 9,962 – U.S. Department of Agriculture
WIC Special Supplemental Nutrition Program for Women, Infants, and Children 10.557 New York State Department of Health
DOH01-C30422GG-3450000 – 2,395,728 –
WIC Special Supplemental Nutrition Program for Women, Infants, and Children 10.557 New York State Department of Health
DOH01-C30461GG-3450000 – 4,560,547 –
Total – U.S. Department of Agriculture – 6,956,275 –
U.S. Department of Education Rehabilitation Services: Vocational
Rehabilitation Grants to States 84.126 New York State Department of Education C011475 – 354,857 – Total – U.S. Department of Education – 354,857 – Total Expenditures of Federal Awards $ 27,982,699 $ 42,030,433 $ 2,320,589
See accompanying notes.
80
Northwell Health, Inc.
Notes to Schedule of Expenditures of Federal Awards
Year Ended December 31, 2016
1. Basis of Presentation
The accompanying Schedule of Expenditures of Federal Awards (the Schedule) includes the federal grant activities of Northwell Health, Inc. and its member corporations and other affiliated entities (collectively, Northwell) and is presented on the accrual basis of accounting. The information on the Schedule is presented in accordance with the requirements of Title 2 U.S. Code of Federal Regulations Part 200, Uniform Administrative Requirements, Cost Principles, and Audit Requirements for Federal Awards (the Uniform Guidance). Therefore, some amounts presented in this Schedule may differ from amounts presented in, or used in the preparation of, the consolidated financial statements.
For purposes of the Schedule, federal awards include assistance provided by a federal agency directly or indirectly in the form of grants, contracts, cooperative agreements, loans and loan guarantees, or other non-cash assistance.
Direct and indirect costs are charged to awards in accordance with cost principles contained in the United States Department of Health and Human Services Cost Principles for Hospitals at 45 CFR Part 74 Appendix E for awards not subject to the Uniform Guidance and 45 CFR Part 75 Appendix IX for awards subject to the Uniform Guidance. Under these cost principles, certain types of expenditures are not allowable or are limited as to reimbursement. The Uniform Guidance provides for a 10% de minimis indirect cost rate election; however, Northwell did not make this election and uses a negotiated indirect cost rate.
The Schedule includes Federal awards subject to the requirements of the Uniform Guidance, as well as Federal awards that were funded prior to the Uniform Guidance effective date of December 26, 2014.
2. Food and Nutrition Awards
During the year ended December 31, 2016, Northwell participated in the New York State Department of Health, Special Supplemental Nutrition Program for Women, Infants, and Children (WIC) through the provision of nutritional counseling and the distribution of food vouchers. The United States Department of Agriculture, the federal agency that sponsors the WIC program under CFDA number 10.557, has determined that WIC food instruments are considered “property in lieu of money” and, therefore, should be reported as federal awards received by Northwell.
81
Northwell Health, Inc.
Notes to Schedule of Expenditures of Federal Awards
Year Ended December 31, 2016
2. Food and Nutrition Awards (continued)
The total amount reported as federal awards on the Schedule represents the value of food vouchers redeemed in the amount of $5,477,821 plus administrative costs of $1,478,454 for the year ended December 31, 2016. As New York State funds are commingled with federal funds, federal funding percentages were applied to determine the total amount of federal funds to be reported above. These percentages were supplied by the New York State Department of Health as follows:
Federal Percentage October 1, 2015 to
September 30, 2016 October 1, 2014 to
September 30, 2015 Administrative costs 94.9% 91.51% Food vouchers redeemed 98.3 98.56
3. Vaccines for Children Program
During the year ended December 31, 2016, Northwell participated in the New York City Department of Health and Mental Hygiene Vaccines for Children Program (CFDA 93.268) through the provision of vaccinations. The United States Department of Health and Human Services, the federal agency that sponsors this program, has determined that the vaccines administered are considered “property in lieu of money” and, therefore, should be reported as federal awards received by Northwell.
82
Report of Independent Auditors on Internal Control Over Financial Reporting and on Compliance and Other Matters Based on an Audit of Financial Statements
Performed in Accordance with Government Auditing Standards
Management and the Board of Trustees Northwell Health, Inc.
We have audited, in accordance with auditing standards generally accepted in the United States and the standards applicable to financial audits contained in Government Auditing Standards issued by the Comptroller General of the United States, the financial statements of Northwell Health, Inc. and its member corporations and other affiliated entities (collectively, Northwell), which comprise the consolidated statement of financial position as of December 31, 2016, and the related consolidated statements of operations, changes in net assets, and cash flows for the year then ended, and the related notes to the financial statements, and have issued our report thereon dated April 28, 2017.
Internal Control Over Financial Reporting
In planning and performing our audit of the financial statements, we considered Northwell’s internal control over financial reporting (internal control) to determine the audit procedures that are appropriate in the circumstances for the purpose of expressing our opinion on the financial statements, but not for the purpose of expressing an opinion on the effectiveness of Northwell’s internal control. Accordingly, we do not express an opinion on the effectiveness of Northwell’s internal control.
A deficiency in internal control exists when the design or operation of a control does not allow management or employees, in the normal course of performing their assigned functions, to prevent, or detect and correct misstatements on a timely basis. A material weakness is a deficiency, or combination of deficiencies, in internal control, such that there is a reasonable possibility that a material misstatement of the entity’s financial statements will not be prevented, or detected and corrected on a timely basis. A significant deficiency is a deficiency, or a combination of deficiencies, in internal control that is less severe than a material weakness, yet important enough to merit attention by those charged with governance.
Our consideration of internal control was for the limited purpose described in the first paragraph of this section and was not designed to identify all deficiencies in internal control that might be material weaknesses or significant deficiencies. Given these limitations, during our audit we did not identify any deficiencies in internal control that we consider to be material weaknesses. However, material weaknesses may exist that have not been identified.
A member firm of Ernst & Young Global Limited
Ernst & Young LLP One Jericho Plaza Suite 105 Jericho, NY 11753
Tel: +1 516 336 0100 ey.com
83
Compliance and Other Matters
As part of obtaining reasonable assurance about whether Northwell’s financial statements are free of material misstatement, we performed tests of its compliance with certain provisions of laws, regulations, contracts and grant agreements, noncompliance with which could have a direct and material effect on the determination of financial statement amounts. However, providing an opinion on compliance with those provisions was not an objective of our audit, and accordingly, we do not express such an opinion. The results of our tests disclosed no instances of noncompliance or other matters that are required to be reported under Government Auditing Standards.
Purpose of this Report
The purpose of this report is solely to describe the scope of our testing of internal control and compliance and the result of that testing, and not to provide an opinion on the entity’s internal control or on compliance. This report is an integral part of an audit performed in accordance with Government Auditing Standards in considering the entity’s internal control and compliance. Accordingly, this communication is not suitable for any other purpose.
EY April 28, 2017
A member firm of Ernst & Young Global Limited
84
Report of Independent Auditors on Compliance for Each Major Federal Program and Report on Internal Control Over Compliance
Required by the Uniform Guidance
Management and the Board of Trustees Northwell Health, Inc.
Report on Compliance for Each Major Federal Program
We have audited Northwell Health, Inc. and its member corporations and other affiliated entities’ (collectively, Northwell) compliance with the types of compliance requirements described in the US Office of Management and Budget (OMB) Compliance Supplement that could have a direct and material effect on each of Northwell’s major federal programs for the year ended December 31, 2016. Northwell’s major federal programs are identified in the summary of auditor’s results section of the accompanying schedule of findings and questioned costs.
Management’s Responsibility
Management is responsible for compliance with federal statutes, regulations and the terms and conditions of its federal awards applicable to its federal programs.
Auditor’s Responsibility
Our responsibility is to express an opinion on compliance for each of Northwell’s major federal programs based on our audit of the types of compliance requirements referred to above.
We conducted our audit of compliance in accordance with auditing standards generally accepted in the United States; the standards applicable to financial audits contained in Government Auditing Standards, issued by the Comptroller General of the United States; and the audit requirements of Title 2 U.S. Code of Federal Regulations Part 200, Uniform Administrative Requirements, Cost Principles, and Audit Requirements for Federal Awards (Uniform Guidance). Those standards and the Uniform Guidance require that we plan and perform the audit to obtain reasonable assurance about whether noncompliance with the types of compliance requirements referred to above that could have a direct and material effect on a major federal program occurred. An audit includes examining, on a test basis, evidence about Northwell’s compliance with those requirements and performing such other procedures as we considered necessary in the circumstances.
We believe that our audit provides a reasonable basis for our opinion on compliance for each major federal program. However, our audit does not provide a legal determination of Northwell’s compliance.
A member firm of Ernst & Young Global Limited
Ernst & Young LLP One Jericho Plaza Suite 105 Jericho, NY 11753
Tel: +1 516 336 0100 ey.com
85
Opinion on Each Major Federal Program
In our opinion, Northwell complied, in all material respects, with the types of compliance requirements referred to above that could have a direct and material effect on each of its major federal programs for the year ended December 31, 2016.
Report on Internal Control Over Compliance
Management of Northwell is responsible for establishing and maintaining effective internal control over compliance with the types of compliance requirements referred to above. In planning and performing our audit of compliance, we considered Northwell’s internal control over compliance with the types of requirements that could have a direct and material effect on each major federal program to determine the auditing procedures that are appropriate in the circumstances for the purpose of expressing an opinion on compliance for each major federal program and to test and report on internal control over compliance in accordance with the Uniform Guidance, but not for the purpose of expressing an opinion on the effectiveness of internal control over compliance. Accordingly, we do not express an opinion on the effectiveness of Northwell’s internal control over compliance.
A deficiency in internal control over compliance exists when the design or operation of a control over compliance does not allow management or employees, in the normal course of performing their assigned functions, to prevent, or detect and correct, noncompliance with a type of compliance requirement of a federal program on a timely basis. A material weakness in internal control over compliance is a deficiency, or combination of deficiencies, in internal control over compliance, such that there is a reasonable possibility that material noncompliance with a type of compliance requirement of a federal program will not be prevented, or detected and corrected, on a timely basis. A significant deficiency in internal control over compliance is a deficiency, or a combination of deficiencies, in internal control over compliance with a type of compliance requirement of a federal program that is less severe than a material weakness in internal control over compliance, yet important enough to merit attention by those charged with governance.
Our consideration of internal control over compliance was for the limited purpose described in the first paragraph of this section and was not designed to identify all deficiencies in internal control over compliance that might be material weaknesses or significant deficiencies. We did not identify any deficiencies in internal control over compliance that we consider to be material weaknesses. However, material weaknesses may exist that have not been identified.
The purpose of this report on internal control over compliance is solely to describe the scope of our testing of internal control over compliance and the results of that testing based on the requirements of the Uniform Guidance. Accordingly, this report is not suitable for any other purpose.
EY September 29, 2017
A member firm of Ernst & Young Global Limited
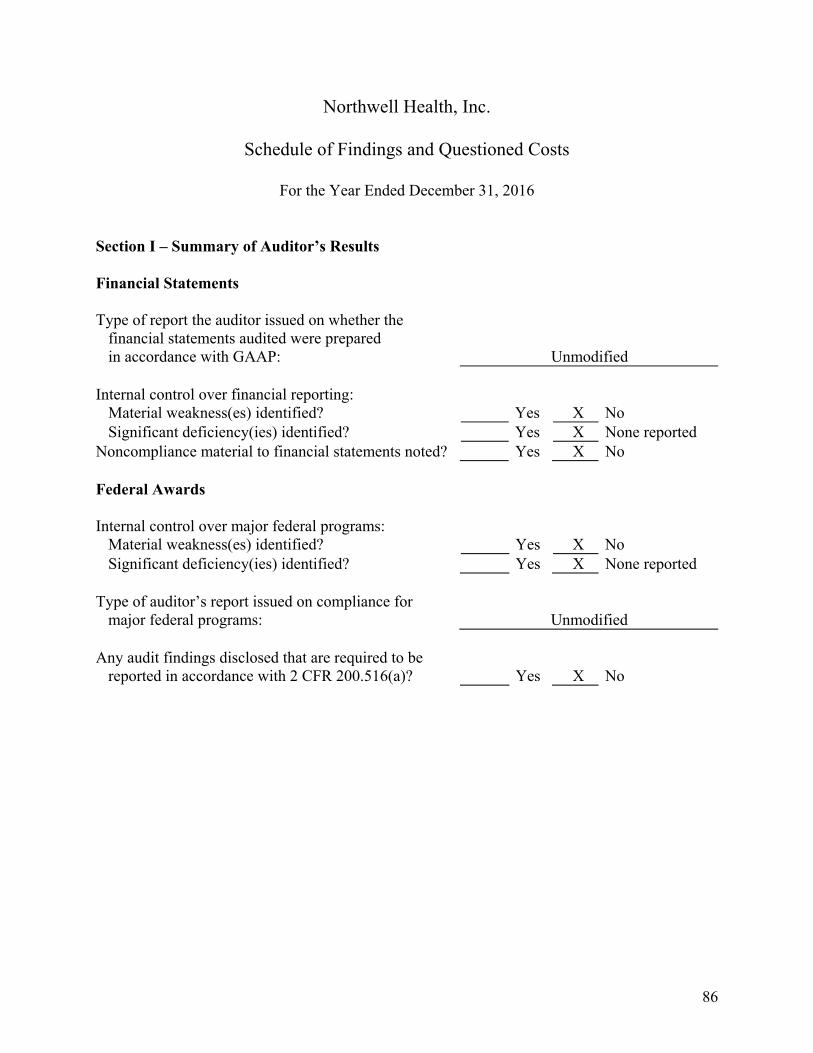
86
Northwell Health, Inc.
Schedule of Findings and Questioned Costs
For the Year Ended December 31, 2016
Section I – Summary of Auditor’s Results
Financial Statements
Type of report the auditor issued on whether the financial statements audited were prepared in accordance with GAAP: Unmodified
Internal control over financial reporting:
Material weakness(es) identified? Yes X No Significant deficiency(ies) identified? Yes X None reported
Noncompliance material to financial statements noted? Yes X No Federal Awards
Internal control over major federal programs: Material weakness(es) identified? Yes X No Significant deficiency(ies) identified? Yes X None reported
Type of auditor’s report issued on compliance for
major federal programs: Unmodified Any audit findings disclosed that are required to be
reported in accordance with 2 CFR 200.516(a)? Yes X No
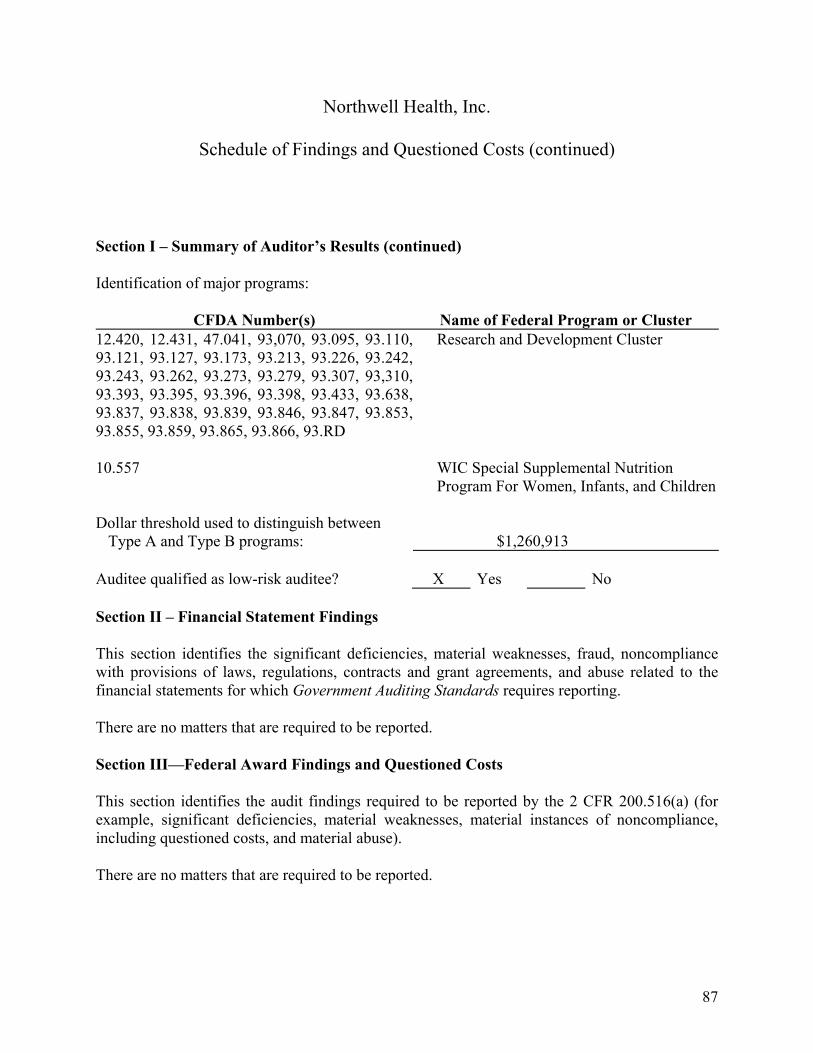
Northwell Health, Inc.
Schedule of Findings and Questioned Costs (continued)
87
Section I – Summary of Auditor’s Results (continued)
Identification of major programs:
CFDA Number(s) Name of Federal Program or Cluster 12.420, 12.431, 47.041, 93,070, 93.095, 93.110,93.121, 93.127, 93.173, 93.213, 93.226, 93.242,93.243, 93.262, 93.273, 93.279, 93.307, 93,310, 93.393, 93.395, 93.396, 93.398, 93.433, 93.638, 93.837, 93.838, 93.839, 93.846, 93.847, 93.853,93.855, 93.859, 93.865, 93.866, 93.RD
Research and Development Cluster
10.557 WIC Special Supplemental Nutrition
Program For Women, Infants, and Children Dollar threshold used to distinguish between
Type A and Type B programs: $1,260,913
Auditee qualified as low-risk auditee? X Yes No Section II – Financial Statement Findings
This section identifies the significant deficiencies, material weaknesses, fraud, noncompliance with provisions of laws, regulations, contracts and grant agreements, and abuse related to the financial statements for which Government Auditing Standards requires reporting.
There are no matters that are required to be reported.
Section III—Federal Award Findings and Questioned Costs
This section identifies the audit findings required to be reported by the 2 CFR 200.516(a) (for example, significant deficiencies, material weaknesses, material instances of noncompliance, including questioned costs, and material abuse).
There are no matters that are required to be reported.
88
Summary Schedule of Prior Audit Findings
Year Ended December 31, 2016
Finding Reference Number: 2014-001
Federal Program
Information: 93.914 HIV Emergency Relief Project Grants
Condition: Northwell did not maintain the appropriate patient files
evidencing its evaluation of each patient’s satisfaction of the eligibility requirements under the program passed-through by United Way.
Status: Corrective action has been taken and is in place. The
pass-through entity has informed Northwell that it is satisfied with the actions taken and is no longer following up with Northwell on the prior audit finding.
* No audit assurance has been provided on this schedule. This schedule is not subject to the auditor’s report on compliance for each major program and report on internal control over compliance required by the Uniform Guidance.
EY | Assurance | Tax | Transactions | Advisory
About EYEY is a global leader in assurance, tax, transaction and advisory services. The insights and quality services we deliver help build trust and confidence in the capital markets and in economies the world over. We develop outstanding leaders who team to deliver on our promises to all of our stakeholders. In so doing, we play a critical role in building a better working world for our people, for our clients and for our communities.
EY refers to the global organization and may refer to one or more of the member firms of Ernst & Young Global Limited, each of which is a separate legal entity. Ernst & Young Global Limited, a UK company limited by guarantee, does not provide services to clients. For more information about our organization, please visit ey.com.
© 2017 Ernst & Young LLP. All Rights Reserved.
ey.com