Embed Size (px)
Citation preview

STATE OF NEW YORK PUBLIC HEALTH AND HEALTH PLANNING COUNCIL
COMMITTEE DAY
AGENDA
May 16, 2019
10:00 a.m.
New York State Department of Health Offices 90 Church Street, 4th Floor, Rooms 4A/4B, NYC
I. COMMITTEE ON ESTABLISHMENT AND PROJECT REVIEW Gary Kalkut, M.D., Vice Chair
A. Applications for Construction of Health Care Facilities/Agencies
Ambulatory Surgery Centers – Construction Exhibit # 1
Number Applicant/Facility
1. 191083 C Staten Island University Hospital (Richmond County)
2. 191120 C The Northway Surgery and Pain Center (Saratoga County)
Residential Health Care Facility – Construction Exhibit # 2
Number Applicant/Facility
1. 172351 C Bronx Center for Rehabilitation & Health Care (Bronx County)
B. Applications for Establishment and Construction of Health Care Facilities/Agencies
Ambulatory Surgery Centers - Establish/Construct Exhibit # 3
Number Applicant/Facility
1. 181259 E Mohawk Valley Eye Surgery Center (Montgomery County)
2. 182326 B Triborough ASC, LLC d/b/a Triborough Ambulatory Surgery Center (Bronx County)
3. 191019 E Bronx SC, LLC d/b/a Empire State Ambulatory Surgery Center (Bronx County)
2
4. 191027 E North Queens Surgical Center
(Queens County)
5. 191060 E Long Island Ambulatory Surgery Center (Suffolk County)
Diagnostic and Treatment Center - Establish/Construct Exhibit # 4
Number Applicant/Facility
1. 191107 E City Wide Health Facility Inc.
(Kings County)
Dialysis Center - Establish/Construct Exhibit # 5
Number Applicant/Facility
1. 182068 B Freedom Dialysis of Riverdale, LLC (Bronx County)
2. 182140 E DSI Newburgh, LLC (Orange County)
3. 191136 E Cowley Dialysis, LLC d/b/a Hutchinson River Dialysis (Bronx County)
Residential Health Care Facilities - Establish/Construct Exhibit # 6
Number Applicant/Facility
1. 181151 E Saratoga Care and Rehabilitation Center LLC
(Saratoga County)
Certified Home Health Agency - Establish/Construct Exhibit # 7
Number Applicant/Facility
1. 181319 E Tri-Borough Certified Health Systems of the Hudson Valley LLC (Westchester County)
C. Home Health Agency Licensures Exhibit # 8
Changes of Ownership with Consolidation
Number
Applicant/Facility
1. 191080 E Always Compassionate Home Care, Inc. (Suffolk County)
3
Serious Concern/Access
1. 182247 E Aides at Home, Inc. (Nassau County)
D. Certificates Exhibit # 9
Certificate of Dissolution
Applicant
F.E.G.S. ProCare Health Services, Inc.
F.E.G.S. Home Care Services, Inc.
M.J.G.N.H.C., Inc.
Mount Sinai Diagnostic & Treatment Center
Certificate of Amendment of the Certificate of Incorporation
Applicant
HQ-WCHN Health System, Inc.
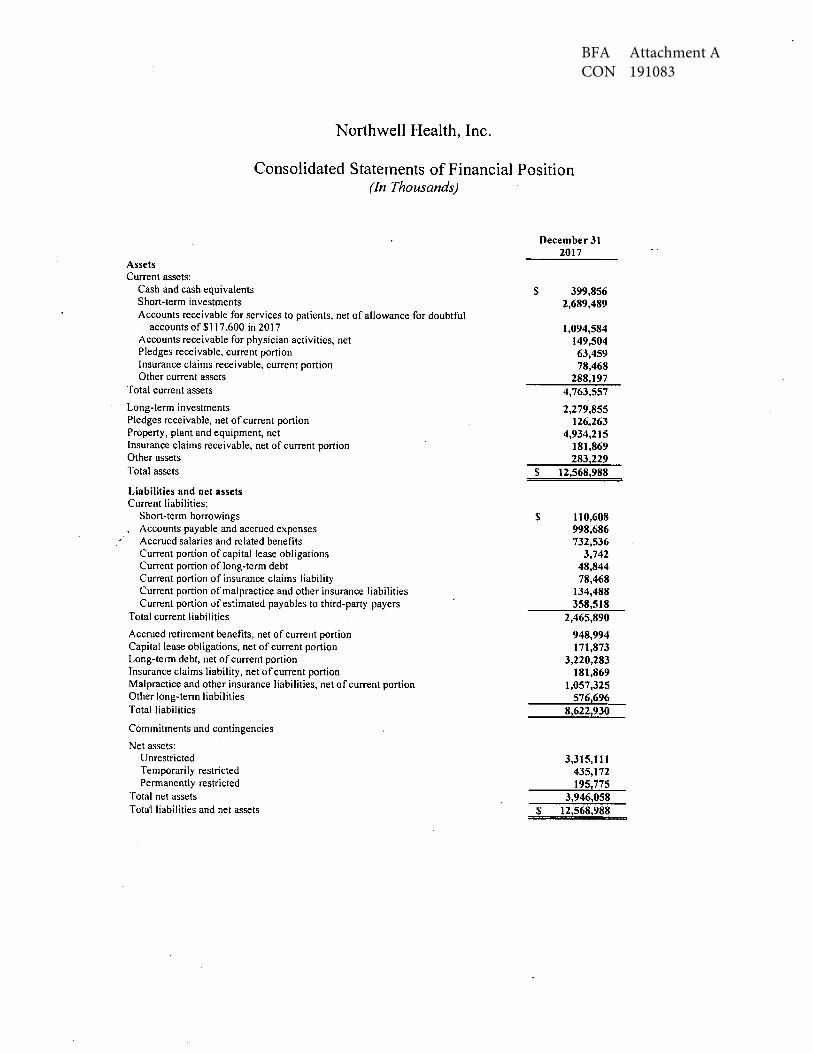
BFA Attachment A CON 191083
Northwell Health, Inc.
Consolidated Statements of Financial Position (In Thousands)
Assets Current assets:
Cash and cash equivalents Short-term investments Accounts receivable for services to patients, net of allowance for doubtful
accounts of $117,600 in 20 I 7 Accounts receivable for physician activities, net Pledges receivable, current portion Insurance claims receivable, current portion Other current assets
Total current assets
Long-term investments Pledges receivable, net of current portion Property, plant and equipment, net Insurance claims receivable, net of current portion Other assets Total assets
Liabilities and net assets Current liabilities:
Short-term borrowings Accounts payable and accrued expenses Accrued salaries and related benefits Current portion of capital lease obligations Current portion of long-term debt Current portion of insurance claims liability Current portion of malpractice and other insurance liabilities Current portion of estimated payables to third-party payers
Total current liabilities
Accrued retirement benefits, net of current portion Capital lease obligations, net of current portion Long-term debt, net of current portion Insurance claims liability, net of current portion Malpractice and other insurance liabilities, net of current portion Other long-term liabilities Total liabilities
Commitments and contingencies
Net assets: Unrestricted Temporarily restricted Permanently restricted
Total net assets Tota1 liabilities and net assets
December31 2017
$ 399,856 2,689,489
1,094,584 149,504 63,459 78,468
288,197 4,763,557
2,279,855 126.263
4,934,215 181,869 283,229
$ 12,568,988
$ 110,608 998,686 732,536
3,742 48,844 78,468
134,488 358,518
2,465,890
948,994 171,873
3,220,283 181,869
1,057,325 576,696
8,622,930
3,315,111 435,172 195,775
3,946,058 $ 12,568,988
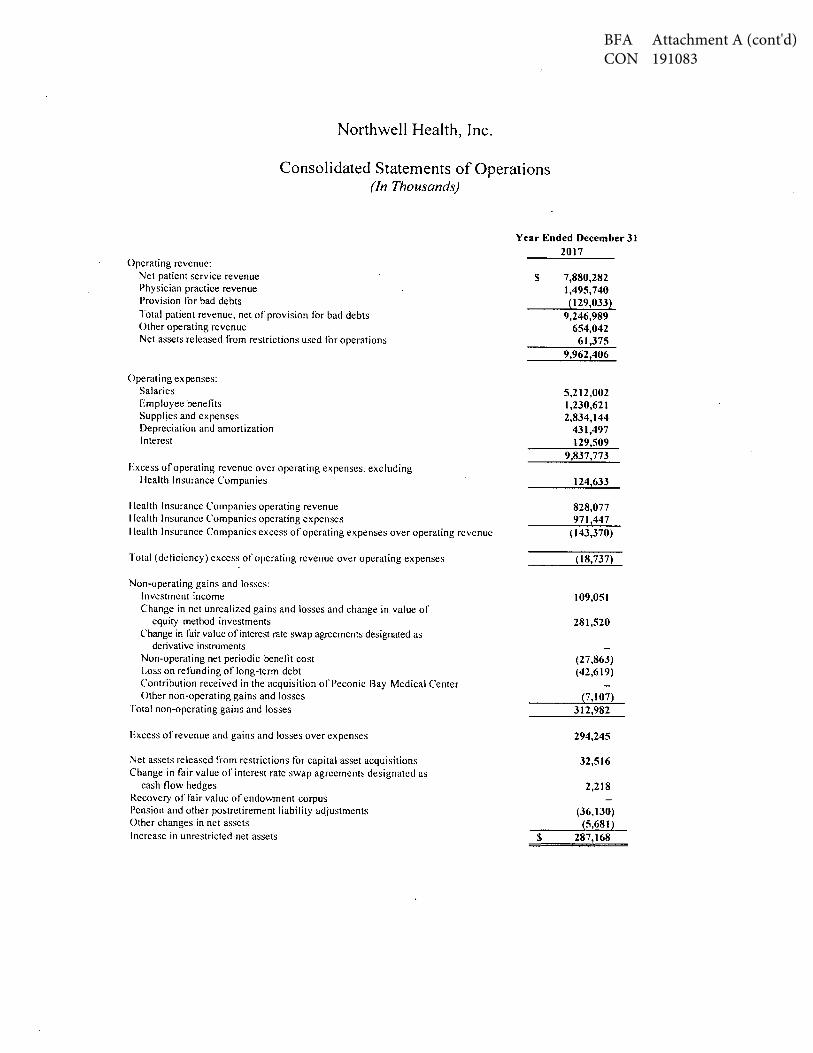
BFA Attachment A (cont'd) CON 191083
Northwell Health, Inc.
Consolidated Statements of Operations (In Thousands)
Year Ended December 31
Operating revenue: Net patient service revenue Physician practice revenue Provision for bad debts Total patient revenue, net of provision for bad debts Other operating revenue Net assets released from restrictions used for operations
Operating expt:nses: Salaries Employee benefits Supplies and expenses Depreciation and amortization Interest
Excess of operating revenue over operating expenses, excluding Health Insurance Companies
Health Insurance Companies operating revenue I lcalth Insurance Companies operating expenses I !ealth Insurance Companies excess of operating expenses over operating revenue
Total (deliciency) excess of operating revenue over operating expenses
Non-operating gains and losses: Investment income Change in net unrealized gains and losses and change in value of
equity method investments Change in fair value of interest rate swap agreements designated as
derivative instruments Non-operating net periodic benefit cost Loss on refunding of long-term debt Contribution received in the acquisition of Peconic Bay Medical Center Other non-operating gains and losses
Total non-operating gains and losses
Excess of revenue and gains and losses over expenses
Net assets released from restrictions for capital asset acquisitions Change in fair value of interest rate swap agreements designated as
cash now hedges Recovery of fair value of endowment corpus Pension and other postrctirement liability adjustments Other changes in net assets Increase in unrestricted net assets
2017
$ 7,880,282 1,495,740 (129,033~
9,246,989 654,042
61,375 9,962,406
5,212,002 1,230,621 2,834,144
431,497 129,509
9,837,773
124,633
828,077 971,447
(143,370)
(18,737)
109,051
281,520
(27,863) (42,619)
(7,107) 312,982
294,245
32,516
2,218
(36,130) 5,681) _
$ 287,168
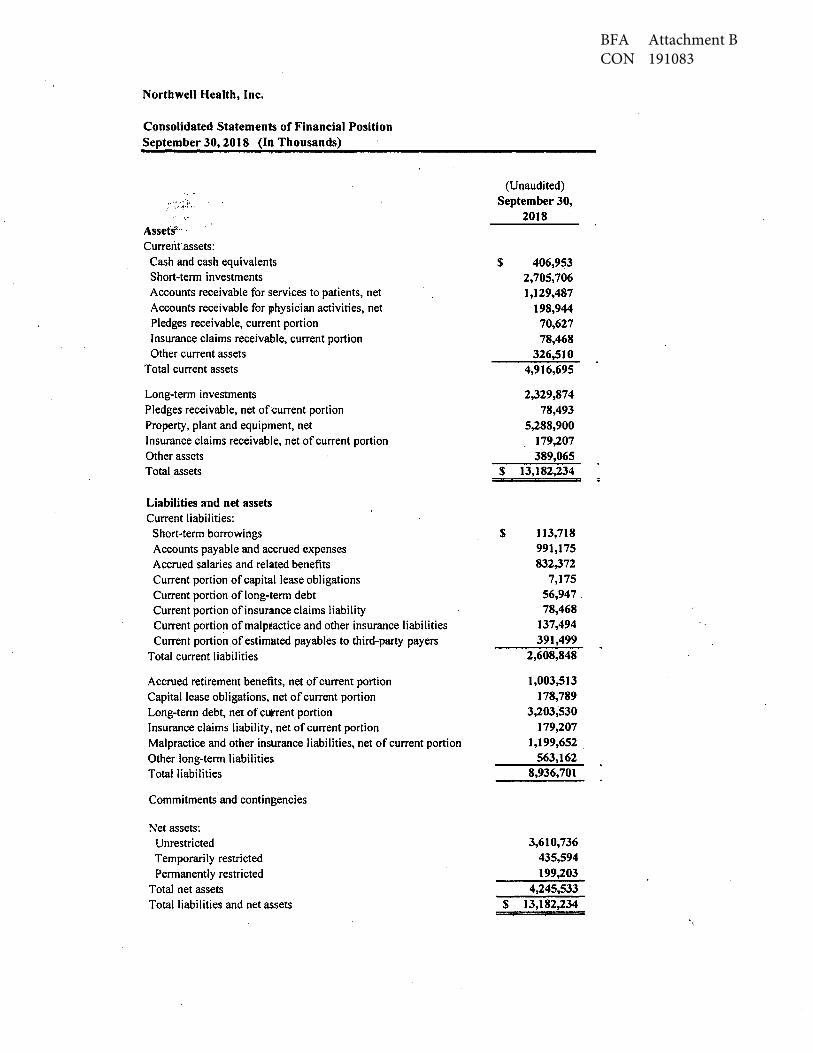
BFA Attachment B CON 191083
Northwell Health, Inc.
Consolidated Statements of Financial Position September 30, 2018 (In Thousands)
,.··· ,-,:; . . ·,··-'!··
Assets'·· Currerir.assets:
Cash and cash equivalents Short-term investments Accounts receivable for services to patients, net Accounts receivable for physician activities, net Pledges receivable, current portion Insurance claims receivable, current portion Other current assets
Total current assets
Long-term investments Pledges receivable, net of.current portion Property, plant and equipment, net Insurance claims receivable, net of current portion Other assets Total assets
Liabilities and net assets Current liabilities:
Short-term borrowings Accounts payable and accrued expenses Accrued salaries and related benefits Current portion of capital lease obligations Current portion of long-term debt Current portion of insurance claims liability Current portion of malpractice and other insurance liabilities Current portion of estimated payables to third-party payers
Total current liabilities
Accrued retirement benefits, net of current portion Capital lease obligations, net of current portion Long-term debt, net of current portion Insurance claims liability, net of current portion Malpractice and other insurance liabilities, net of current portion Other long-tem1 liabilities Total liabilities
Commitments and contingencies
Net assets: Unrestricted Temporarily restricted Permanently restricted
Total net assets Total liabilities and net assets
(Unaudited) September 30,
$
$
$
2018
406,953 2,705,706 1,129,487
198,944 70,627 78,468
326,510 4,916,695
2,329,874 78,493
5,288,900 . 179,207
389,065 13,182,234
113,718 991,175 832,372
7,175 56,947. 78,468
137,494 391,499
2,608,848
1,003,513 178,789
3,203,530 179,207
1,199,652 563,162
8,936,701
3,610,736 435,594 199,203
4,245,533 $ 13,182,234
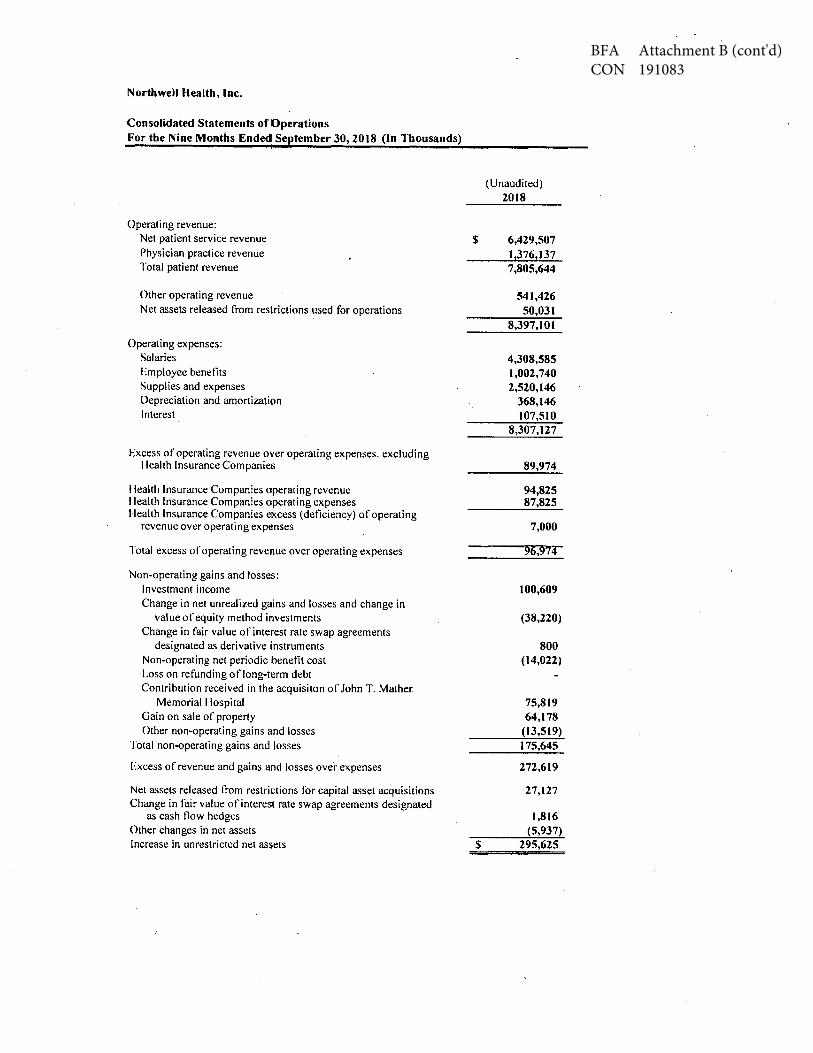
BFA Attachment B (cont'd) CON 191083
Northwell Health, Inc.
Consolidated Statements of Operations For the Nine Months Ended September 30, 2018 (In Thousands)
Operating revenue: Net patient service revenue Physician practice revenue Total patient revenue
Other operating revenue Net assets released from restrictions used for operations
Operating expenses: Salaries Employee benefits Supplies and expenses Depreciation and amortization Interest
Excess of operating revenue over operating expenses. excluding 1 lealth Insurance Companies
I lealth Insurance Companies operating revenue Health Insurance Companies operating expenses I lealth Insurance Companies excess (deficiency) of operating
revenue over operating expenses
Total excess of operating revenue over operating expenses
Non-operating gains and losses: Investment income Change in net unrealiz.ed gains and losses and change in
value of equity method investments Change in fair value of interest rate swap agreements
designated as derivative instruments Non-operating net periodic benefit cost Loss on refunding of long-term debt Contribution received in the acquisiton of John T. Mather
Memorial I lospital Gain on sale of property Other non-operating gains and losses
Total non-operating gains and losses
Excess of revenue and gains and losses ove·r expenses
Net assets released from restrictions for capital asset acquisitions Change in fair value of interest rate swap agreements designated
as cash !low hedges Other changes in net assets Increase in unrestricted net assets
(Unaudited) 2018
$ 6,429,507 113761137 7,805,644
541,426 50,031
8,397,101
4,308,585 1,002,740 2,520,146
368,146 107,510
8,307,127
89,974
94,825 87,825
7,000
91,,974
100,609
(38,220)
800 (14,022)
75,819 64,178
(13,519) 175,645
272,619
27,127
1,816 (5,937)
$ 295,625
BFA
Attachm
ent CC
ON
191083
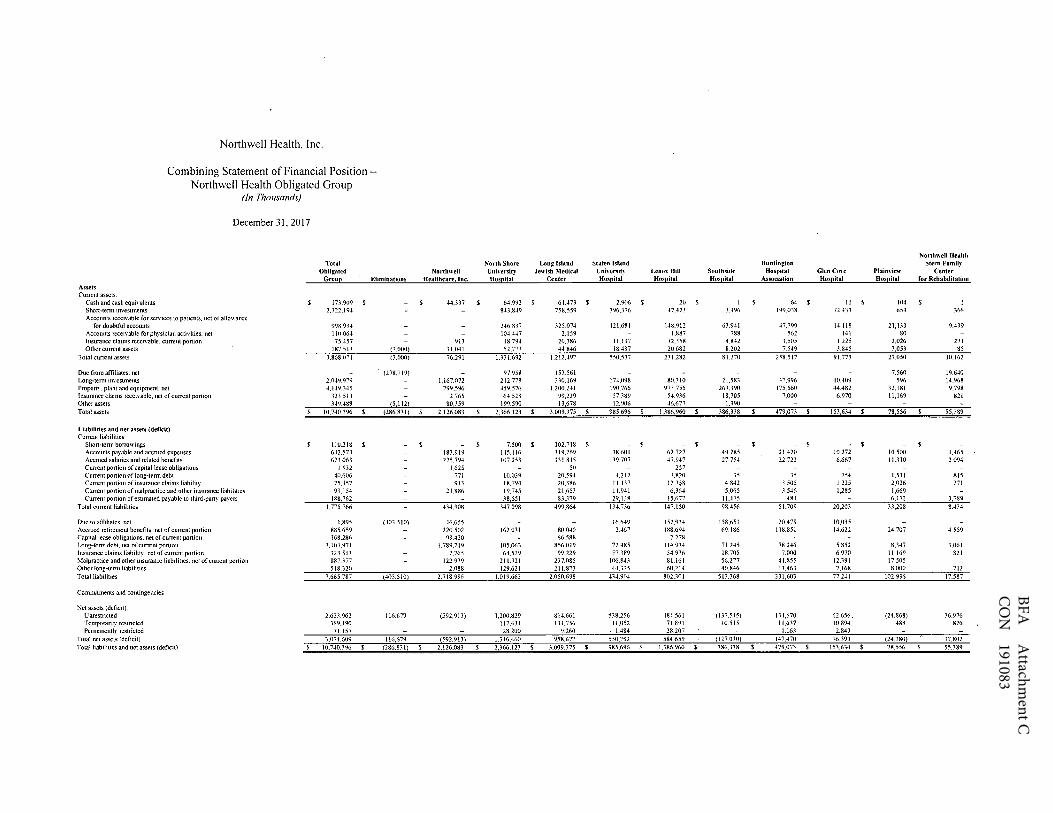
Northwell Health, Inc.
Combining Statement of Financial Position -Northwell Health Obligated Group
(In Thousands)
December 3 I, 20 I 7
Tot.11 Obligated
Groue Eliminations Assets Current assets
Cash and cash equi, alents $ 173.909 $ Short•lenn mvestments 2.U2.\9-I-Accounts rece1\'able for sernces to patients, net of allowance
for doubtful accounts 998.934 Accounts recei\'ablc for physician actiYities. net 110064 Insurance claims rcceh·able. currcnl portion 75.457 Other current assets 187.51] (',000)
Total current assets 3.868.0"I 0.(XJ(J)
Due from affiliates. ne1 (278.719) Long•tem1 investments 2.049.979 Property. plalll and equipment. net -l.1-P,U-15 Insurance claims reccirnblc, net of current pomon 321.511 Other assets 349.488 (5,112) Total assets $ l-0,740.396 $ (286.831)
Li;1bilities and net assets (deficit) Current liabilities·
Short•lenn borrowmgs $ II0.218 $ Accounts payable and accrued expenses 6.U.57-i Accrued salanes and related benefits 62:t063 Currcul ponion of capital lease obligations 1.932 Current ponion of long•tem1 debt 40.606 Current portion of insurance claims liabilit) 75.-1-57 Current portion of malpractice and other insurance liabilities 9'.U54 Current portion of estimated payable to thud.party pavers 188.762
Total current liab1h1ies 1.775.766
Due to affiliates. net 1,895 (401,510) Accrued retuement benefits. net of current por11on 885.659 Capital lease obligations. net of currem portion 168.286 Long-tenn debt. net of current porllon 1.104.971 Insurance clamIS liabihl). net of current portion 123 513 Malpracuce and other insurance liabtlit1es. net of current portion 887.377 Other long-tem1 liabili1ies 518.320 Tola! liabiliues 7,665.787 (403.5!0)
Commitments and contingencies
Net assets (deficu) Unresmcted 2.633.962 116.679 Temporanly restncted 169.-190 Pennanently restricted 7U57
Total netassets(deficitJ 3.{17-1-.609 116.679 Total liabiliues and net assets (dcfic1l) $ 10.740.396 $ (286.83l)
North Shore Long Island No11hwell Uni\/ersity Jewish Medical
Healthcare, Inc. Hoseital Center
$ -1-U17 s 6-1.992 $ 61An $ 8-13.8-19 758,559
2-16.!137 HS,074 !04.447 2.159
9D 18.794 20J86 31.041 52.773 44JU6 76.291 1.331.692 1.212.49'
97.958 1S3.56l 1,167.072 212.778 3.:Hl.169
799.596 459.576 1.200.2-1-1 2,765 64,52() 99,229
80,359 199.590 13,678
$ 2,126,083 $ 2,]66.123 $ 3.009.375 $
$ $ 7.500 $ l02,718 $ 183.919 1-1-5.116 119.269 225.794 !07.253 131.815
1,625 50 771 IOJJ39 20.594 913 18,794 20.386
21,886 19,745 21,653 38,651 83,379
434.908 347.098 499,864
46,655 220.502 162.031 80.040
99.420 66588 1.789.719 \OS.063 856.019
2.765 64.529 99,229 122.939 211.321 2J7.085
2,088 129,621 211,873
2.718.996 1.019.663 2.05(),698
(592,913) 1,200,829 81-1-,661 117.431 134,756 28.200 9.26()
(592,913) 1.3-16,460 958,677
$ 2.126.083 $ 2.366.123 $ 3.009.375 $
Northwell Health Staten Island Huntington Stem Famil~
Uni\/crsit) Lenox Hill Southside Hospital Glen Co,e Plaim·iew Center Hoseital Hoseital Hos11ital Association Hoseital HOS)!ital for Rehabilitation
2.906 $ 2() $ $ 64 $ 11 $ !04 396,376 -17_.-12.1 .1A% 199.038 72,-D'.l 654 366
121,681 148.912 63.941 ➔ 7.799 14,118 21,UJ 9,-D9 l.887 788 562 141 80
11.131 12.158 4.842 3.505 1.225 2.026 271 18.437 20.682 8.202 7.549 3.845 3.053 85
550.53'7 n1.2s2 81.270 258.517 91.773 27.050 I0.162
7,560 19.640 174.098 80.310 21.583 3?.996 10.409 596 1-1.968 190.766 973.75S 263.390 175.560 -1-4.482 32,181 9.798 57,389 54.'B6 18,705 7,000 6.970 11.169 821 12,906 46.677 1)90
985,696 $ I.J86.960 $ 386,338 $ 479,073 $ 153,634 $ 78,556 $ 55,389
- $ - $ $ - $ - $ 38.601 62 727 49.285 21.420 10.272 10.500 1.465 19.707 47.947 27.754 22.722 6.667 11.310 2.094
257 4.212 1.820 35 35 754 1,531 815
Jl.Ji7 12.358 4.842 3.505 1.225 2,026 271 11.9-il 6,364 5,065 J,546 1.185 1,669 29,IJ8 15.677 11,-175 481 6,172 J,789
134,736 1-17.150 98.-156 51.709 20,203 33,208 8.434
16.649 152,934 158.653 20,479 10,03S 2.467 188.694 69.186 118.851 14.622 24.707 4 559
2 278 72.48S 114.934 71.245 78.2-16 5.852 SJ-17 1.061 57.)89 54.936 18.705 7,000 6.970 11.169 821
106.843 81.161 56.277 41,855 12.391 17,505 44.3)5 60.214 40.846 13.463 7.168 8.000 712
4)4.904 802.101 511.368 331.603 77.2-1-1 102.936 17,587
538,256 -18-1,561 {137.S-15) 134,670 62,656. (24,868) 36,976 11,052 71.891 l0.515 11.637 I0,894 488 826
1.48-1 28.207 1.163 2.843 550.792 584.659 (127.030) 147,470 76.393 (24.380) "l,7,802 985.696 $ 1.386.960 $ 186.338 $ 479.073 $ 153.634 $ 78.556 $ SSJ89

BFA A
ttachment C
(cont'd)C
ON
191083
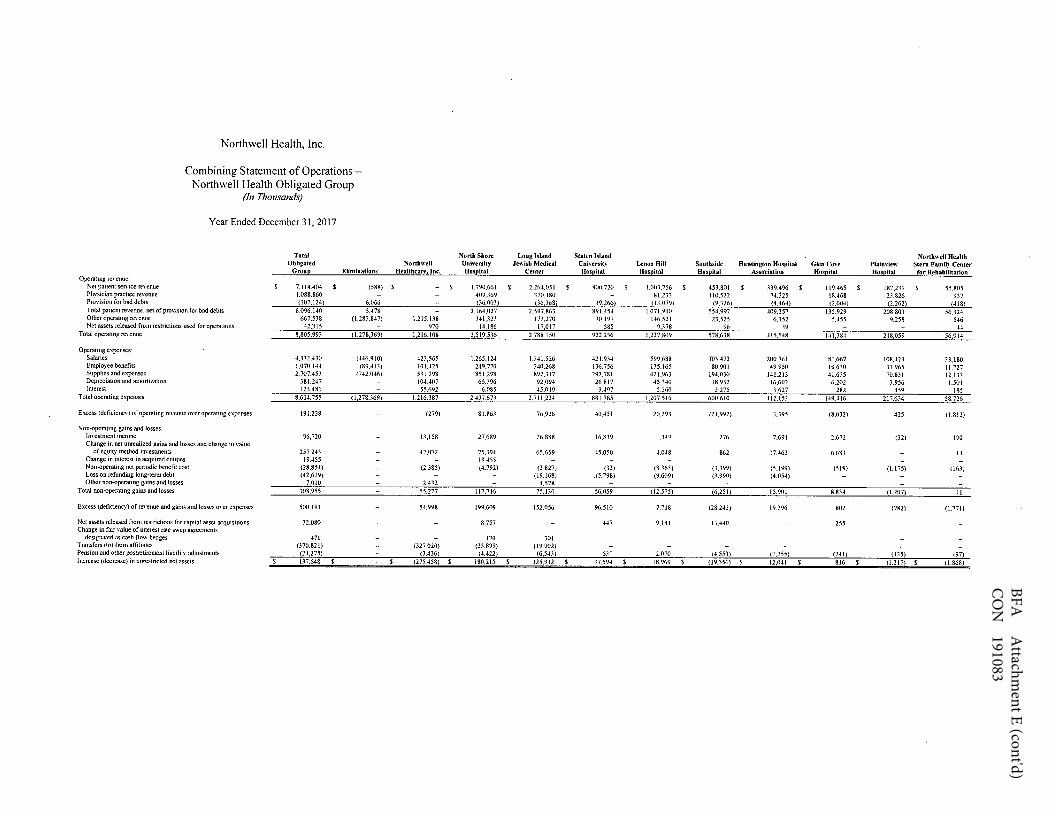
Northwell Health, Inc.
Combining Statement of Operations -Northwell Health Obligated Group
(In Thousands)
Year Ended December 3 I, 201 7
Total Oblig.ated
Groue Eliminations Operatmg re,·enue
Net patient service rennue $ 7.114.404 $ (588) Physician pracllce re, enuc 1.088.860 Provision for bad debts (107,124) 6.066 Total paliem revenue. net of provision for bad debts 8,096.140 5A78 Olher operatmg revenue 667.5)8 (1,283,847) Net assets released from restnctions used for operations 42,31S
Tola.l operating re,·enue 8,805.993 (1,278.369)
Operatmg expenses Salanes 4,332.430 (446,910) Emplo;i-ee benefits 1,070.144 (89.413) Supplies and expenses 2.707.453 (742.(146) Depreciation and amort1:mtion 381.247 Interest 123.481
Total operating expenses 8.614.755 (1,278,369)
Excess (deficiency) of operating revenue mu operating expenses 191.238
Non-operating gains and losses. lnYestment income 96,720 Change III ne1 unreahzed gams and losses and change in Yalue
of equity method investments 257.243 Change in i111eres1 in acqmred entitles 19.-155 Non-operating net periodic benefil cost (28.854) Loss on refunding long-tem1 debt (42.619) Other norH>perating gains and losses 7,0!0
Total non-Operating gains and losses 308.955
Excess (deficiency) of reYenue and gains and losses o\·er expenses 500,193
Net assets released from restnctions for capital assel acqu1S1lions 32,080 Change in fair Yalue of interest rate SY.ap agreements
designated as cash flow hedges 471 Transfers Ito) from affiliates (370.821) Pension and other postretiremeut liability adjustments !24.275) Increase (decrease) in unrestricted net assets $ 137.648 $ -
North Shore Long Island Northwell Unh·ersitv Jewish Medical
Healthcare, Inc. Hoseitai Center
$ - $ 1.790.661 $ 2,264,051 $ 409.369 170.180 (36.(JOJ) (36,368)
2.16-L027 2.597.863 Ul5,138 J4U23 17\270
970 14,186 17,017 1,216,108 2,519,536 2,788.150
423,565 1.265,124 1}41.S26 101.425 249.770 340,268 531.298 851.298 892.317 104.407 65.396 92,094 55,692 6,085 45.019
1.216.387 2.437,673 2,711.224
(279) 81,863 76.926
13,158 27,689 26,888
-12.072 75,39-1 65.659 19.455
(2.385) (4.792) (2.827J (19.168)
2,432 4,578 55.277 117.746 75.130
S4.998 199,609 151.056
8,757
170 301 (32i.020) (23.899) (19.902)
(3.436) (4.422) (6,543) $ (275.458) $ 180.215 $ 125.~I_L $
Staten Island No11hwell Health Universit~· Lenox Hill Southside Huntington Hospital Glen Col-·e Plain,·iew Stem Family Center Hosl!ital Hoseital Hoseital Association ffOS)!ital Hospital for Rehabilitation
900.720 $ l.001.756 s 453.S0I $ 339.496 s 119.465 $ 187,237 $ 55.805 81,233 110.512 74.325 18,468 23.826 937
(9.266) (IHl79) (9.)26) (4.464) (2.004) (2,262) (418) 89L45-l L07L9IO 554.997 -109.357 135.929 208,801 56,324
l0,197 U6,52I 23.S2S 6,152 5.455 9,258 5'6 585 9J78 96 19 44
922.236 1.227,809 578,618 415.548 141,384 218,059 56,914
421.934 599,688 303,472 200.761 81.667 !08,423 B,180 136.756 135.165 80.901 49.950 19.630 33.965 11.727 292.781 421.963 194.030 141.213 41.635 70,831 12.DJ
26.817 45.3-10 18.932 16.602 6.202 3.956 1.501 3,-197 5.360 3.275 3.627 282 459 185
881.785 1.207.516 600,610 412.153 149.416 217,634 58,726
40.451 20.293 (21,992) \395 (8.032) 425 (1.812)
16,839 1,349 276 7,691 2,672 (12) 190
45.050 4.048 862 17.463 6.681 14
(S2) (8.363) (J.199) (5.199) (519) (1.175) (163) ,(5.798) (9.609) (3.99()) (4,054)
56.()59 !12.575) (6,251) l5.9fJI 8.834 il,207) 41
96.510 7,718 (28.243) 19.296 802 (782) (1.771)
4'7 9,181 13.-140 155
637 2.070 (4,553) (7.255) (241) (435) (97) 97.594 $ 18.969 $ (19.356) $ 12.041 816 $ (l.217) $ (1.868)

Nor
thw
ell H
ealt
h, I
nc.
Com
bini
ng S
tate
men
t of
Fina
ncia
l Pos
ition
-N
orth
wel
l Hea
lth
Obl
igat
ed G
roup
S
e pte
mbe
r 30
, 201
8 (U
naud
ited
and
In T
hous
ands
)
Ass
ets
Cur
rent
ass
ets:
Cas
h an
d ca
sh e
quin
dent
s Sh
ort-t
enn
inve
stm
ents
A
ccou
nls
rece
ivab
le fo
r ser
vice
s to
pat
ient
s, ne
t of
allo
wanc
e fo
r dou
btful
acc
ount
s A
ccou
nts
rece
ivab
le fo
r phy
sicia
n ac
ti\il
tes.
net
Insu
ranc
e cla
ims r
ecei
,·abl
e, c
urre
nt po
rtion
O
ther
curr
ent a
sset
s To
tal c
urrC
nt a
sset
s
Due
from
affilia
tes,
net
Long
-term
inve
stmen
ts
Prope
rty, p
lant
and
equ
ipm
ent,
net
Insu
ranc
e cl
aim
s rec
ei\"a
ble,
net
of c
urre
nt po
rtion
O
ther
ass
ets
Tota
l ass
ets
Lia
bilit
ies
and
net a
sset
s (de
ficit)
C
urre
nt li
abili
ties;
Short
-tenn
bor
rowi
ngs
Acc
ount
s pay
able
and
ac.cru
ed e
xpens
es
Acc
rued
sal
arie
s an
d re
late
d be
nefit
s C
urre
nt p
ortio
n of
capi
tal l
ease
obl
igat
ions
C
urre
nt p
ortio
n of
long
-term
deb
t C
WTen
l porti
on o
f ins
uran
ce cl
aim
s lia
bilil
) · C
urre
nt p
ortio
n of
mal
prac
tice
and
othe
r ins
uran
ce li
abili
ties
Cur
rent
porti
on o
f est
imat
ed p
ayab
le to
third
-par
ty p
ayer
s T
otal
curr
ent l
iabi
litie
s
Due
to a
ffilia
tes.
net
Acc
rued
retir
emen
t bene
fits.
net o
f cur
rent
porti
on
Cap
ital l
ease
obl
igat
ions
, net
of c
urre
nt po
rtion
Lo
ng-te
rm d
ebt,
net o
f cur
rent
porti
on
Insu
ranc
e cl
aims l
iabi
lity,
net
of c
urre
nt p
ortio
n M
alpr
actic
e an
d ot
her i
nsur
ance
liab
ilitie
s. ne
t of c
urre
nt p
ortio
n O
ther
long
�tenn
liab
ilitie
s To
tal l
iabi
litie
s
Com
mitm
ents
and
cont
inge
ncie
s
Net
ass
ets (
defic
it):
Unr
estri
cted
T
empo
raril
y re
stric
ted
Perm
anen
tly re
stric
ted
Tota
l net
ass
ets (
defic
it)
Tota
l lia
bilit
ies a
nd n
et a
sset
s {de
ficit)
Tot
al
Obl
igat
ed
Gro
u[!
$171
.633
2,
190.
062
973,
0IO
13
2.67
1 75
.457
21
5,93
7 3,
758,
770
380,
600
2,04
8,93
9 4.
316.
390
300,
789
357,
255
$11,
162,
743
SI 1
0,21
8 70
1.44
2 69
6,65
5 2,
200
46.6
70
75.4
57
93,1
54
235,
120
1.96
0.91
6
902.
682
169,
040
3,06
0,53
8 30
0,78
9 l.
018,
455
519,
365
7.93
1,78
5
2,79
8,31
2 35
9,51
1 73
,135
3,
230,
958
$11,
162,
743
Long
Isla
nd
Nor
th S
hore
Je
wis
h N
o11h
" ·el
l U
nive
rsit
r M
edic
al
Elim
inat
ions
H
eaiHh
ure,
Inc.
li
OS(!i
tal
Cen
ter
$-$1
37.1
26
$25,
357
$1.1
83
9.62
6 7 5
0.92
9 68
5,03
8
242,
158
322.
933
117.
360
2.27
9 91
3 18
,794
20
,386
(3
,000
) 41
.143
55
.331
55
,895
(3.0
00)
188,
808
1,20
9,92
9 1.
087,
714
(187
,019
) 97
,655
17
0,35
8 27
3,56
1
1,09
2,78
3 24
8,25
8 36
9,54
6 93
3,93
1 45
3,87
4 1.
223,
855
2,48
5 59
,966
94
,361
(5,1
15)
90,8
45
209,
500
13,6
24
($19
5.13
4)
$2,4
06,5
07
$2,3
51,8
85
$3.0
62,6
61
s-
$-
$7,5
00
$102
,718
22
8.70
8 14
1.8
96
136.
835
259,
935
109,
736
147.
416
1,62
5 15
4 50
5,
486
10.0
44
22.1
00
91'3
18,7
94
20,3
86
21.8
86
19,7
45
21.6
53
65,6
96
110,
345
518,
553
373.
565
561.
503
(311
.813
) 23
8,22
9 17
0.38
5 83
.834
98,2
53
969
66,5
52
1,78
5,24
7 94
,641
83
4.15
4 2,
485
59,9
66
94,3
61
145.
008
242.
379
268,
981
l.58
0 12
9,57
1 20
9,84
5 (3
11,8
13)
2,78
9,35
5 l,
0?l,
476
2,11
9,23
0
116,
679
(382
,848
) 1,
133,
397
800.
135
118,
808
134,
036
28,2
04
9,26
0 11
6,67
9 (3
82,8
48)
1,28
0,40
9 94
3,43
L ($
195,
134)
$2
,406
,507
$2
,351
,885
$3
,062
.661
Nor
thw
ell H
ealt
h St
aten
bla
nd
Hun
ting
ton
Stem
Fam
ily
Unh
•ers
ity
Leno
x H
ill
Sout
hsid
e H
ospi
tal
Gle
nCov
t Pl
aip,
·iew
C
ente
r fo
r H
osei
tal
Hos
pita
l H
OS[!i
tal
Ass
ocia
tion
HOS
[!ita
l H
os[!i
tal
Reh
abili
tati
on
$1.4
49
$3,4
05
$2,2
22
$53
$267
$5
70
$1
418.
910
48.5
16
2.89
1 21
4.38
2 59
.026
48
8 25
6
105.
180
149,
666
56,8
56
49.7
81
14,1
71
21.7
89
10.4
76
11.5
36
945
348
131
72
11.1
37
12,3
58
4,84
2 3.
505
1,22
5 2,
026
271
20.0
41
21.2
69
9,88
9 8.
547
3.84
0 2.
900
82
55
6,1
11
24
6,75
0 77
.645
27
6,61
6 78
,660
27
,845
11
,086
7,39
2 2,
185
16,4
68
183.
283
80.4
38
16,9
43
31,1
18
10,7
04
647
15,2
19
192.
342
971,
629
273.
875
181.
544
42.6
89
33.6
61
8,99
0 54
,692
H
,476
17
,527
6,
140
6.67
2 10
,649
82
1 12
,907
34
,104
1,
390
$1,0
07,3
33
$1,3
80,3
97
$387
.380
$4
95,4
18
$138
,725
$7
4,98
7 $5
2,58
4
$-$ -
$-$-
$-$-
$ -43
.633
66
.760
35
,827
25
.139
l0
,471
to
.703
1.
470
45.8
71
54,4
69
33,0
09
23,6
52
6,87
8 13
,538
2,
151
109
262
4.00
0 1,
820
45
45
763
1.54
2 82
5 11
,137
12
,358
4.
842
3.50
5 1,
225
2,02
6 27
1 11
.941
6,
364
5.06
5 3.
5�6
1,28
5 1.
669
15,8
74
19,7
83
13,9
60
2,58
3 93
3 2,
152
3,79
4 13
2,56
5 16
1,81
6 92
,748
58
.470
21
.555
31
.630
8.
511
115,
247
175.
908
20.3
25
333
5.61
7 17
8.44
1 67
.124
11
6.35
4 14
.009
24
.251
4,
438
541
2,08
1 64
4 69
,499
11
3.59
2 71
.176
78
.178
5,
060
6,77
1 2.
220
54,6
92
47,4
76
17,5
27
6,14
0 6,
672
10,6
49
821
126,
083
93,9
40
64,4
51
47.6
22
13.4
16
16.5
75
44,8
60
60,4
00
43.7
65
13.4
63
7.16
9 8,
000
712
433,
857
772,
993
532,
699
341,
196
68,2
14
97,8
76
16,7
02
561,
595
511,
006
(150
,360
) 14
0.65
9 56
,478
(2
3,42
8)
34,9
99
10.3
97
66,2
17
5,04
1 12
.400
11
,190
53
9 88
3 1,4
84
30,1
81
1,16
3 2,
843
573,
476
607.
404
(145
,319
) 15
4,22
2 70
,511
(2
2,88
9)
35,8
82
$1,0
07,3
33
$1,3
80,3
97
$387
,380
$4
95,4
18
$138
,725
$7
4.98
7 -
�5
84
BFA Attachment DCON 191083

BFA
Attachm
ent D (cont'd)
CO
N
191083
Sorthwell Health, Inc,
Combining Stat,menl or Operations - Sorthwell Health Obligated Group For the Sine Months Ended September 30, 2018 (Unaudited and !11 Thousands)
Long Island Northwell Health Total North Shore Jewish Staten lsJand Huntington Stern Family
Obligated Northwell University Medital University UnoxHm Southside Hospital Glen Cove Plain,iew Center fo1· Groue Eliminations. Healthrar~-,, Jnc. Hos~ital Center Hoseital Hoseital Hospital Ass-0dation Hoseital Hos2itaJ Rehabllltarion
Opemtmg re,;enue Net pattent serv1te reYenue $5..171.830 {$2811 $- $1.346,416 $1,794,358 $679.029 $7K2,41 I $337,<)19 $260.051 $87A33 $142.922 $42.472
Ph~s1c1an practice revenue -l15.l56 338.367 289.715 93.594 94.138 65,823 14.767 l7.8l I 941 To!al pallenl re,enue 6.386.98(, (281) 1.684.783 2.084.073 679.029 876J)(}5 431,157 325,874 lll2,21Xl 160.733 43.413
Other opcrattng re\enue 577.443 (1.001.1311 954,802 281,565 152.183 27.885 I 17.631 25.968 5,09() 3,91(, 8.919 615 Net assets released from restrictions used for operations 37.374 942 11.382 17.8!0 294 6.85.l 62 31
Tota! optmmng r-e\·enue 7.001.80] (l,0(1!.412) 955.744 1.977.730 :U54.066 707.208 Ulil{).489 457.187 330.9'-JS 106.11(, 169,652 44,028
Operating expenses: Salanes 3,447.730 (330Jll) 324,886 987.900 1.043,688 352.686 498.292 240.926 158,121 62.529 82.984 26.035 Empl0:ee benefils 843-721 166.911) 71.108 1%,473 267.547 !07.026 107.165 (,2.Jn 4\1.%0 15.701 21,006 9.684 Supplies and e:'\penses 2.l1Hl2 (604,124) 4fi0,286 676,153 733,687 215.037 333.617 151,221 112.234 30.550 54,360 9,<>91
Depreciauon and amortization 312.596 97,364 50,599 61.718 19,658 36.246 17,852 14.442 4,663 2,887 l,!67 Interest 102.659 54, I IO 4.665 32.845 2,124 3549 Z,253 2.501 192 303 117
Total operatmg expenses 6,818.818 (1,001,412) 954,354 1,915,790 2.145.485 696.531 978,869 414.574 327,358 111.635 167,540 4G,094
Excess (de[kiency} of operating revenue m·er i)peratmg e-:-..penses 182.985 1.390 61.940 108,581 10.677 21.(120 (17,387) 3.637 (7519} 2.112 (2.066)
Non-operatmg gams and losses (nvestmenl income 95,585 13,435 24.920 28,753 17,286 1.302 3% 7.076 2,270 (21) 2U&
Change in net unreahzed gains and losses and change in \alue of eqmty method inveslmeols (37.8(,-l) (ll.438) (7.782) (8.150) (5,444) (240) (91) (2.()(,1) (621) (37)
Change m interesl in acquired entitles 9.900 9,900 Non•operatmg net perlod1<: benefit cost (16.868) (2.656) (2699) (1.643) (71) (4.303) (1.792) (2.663) (308) (651) (82)
Con1ribuuoo received in the acquisition of John T Mal.her Memorial Hosptt.a! 75.819 75,819
Gam on sale of propeny 6-1,178 6-1.178 Total non-operalmg gains and losses 190.750 137.338 24,339 18,960 11.771 (3.241) Jl.527) 2.152 l.341 (672) 89
Excess (deficiency) of re\enue and gains and losses over expenses 373.735 138.718 86,279 127.541 22.44~ IR.379 (18 9141 5.989 (6.178) 1.440 (1.977)
Net assets reltased from restrictions for capital asset acquisitions 25.541 2 767 9.725 891 8.057 6.099
Change m fair u.lue of in1erest rate swap agreements d,esignate<l as cash flO\\ hedges 140 50 90
Transfers (to) from affiliai:es (1~9.247) 147.154 (154,52i) 1~1.812) Increase (decrease) in unrestricted net assets $2<0.169 $0 S2!5-!i4 ($67,<32) ($14.526) $23.339 $26.445 ($12.115) $5.989 (S6.17~L ____ $1.<40 ($1,977)
BFA
Attachm
ent E C
ON
191083
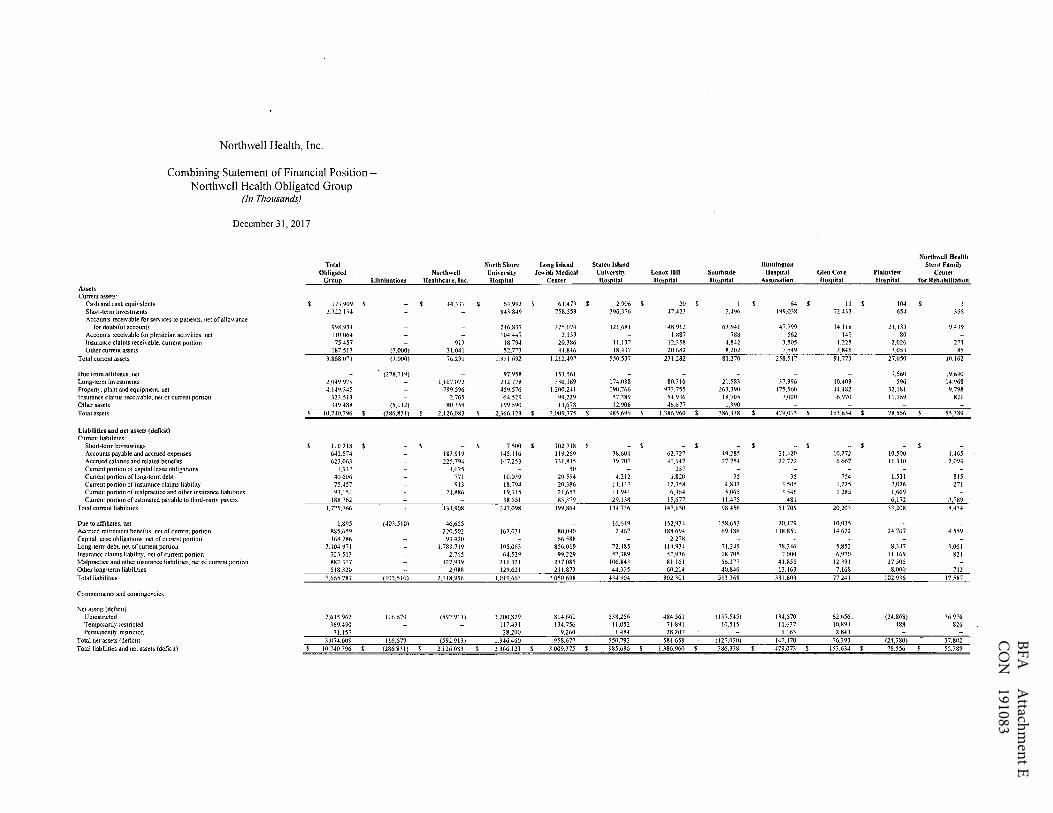
Northwell Health, Inc.
Combining Statement of Financial Position -Northwell Health Obligated Group
(In Thousands)
December 3 I, 20 I 7
Tot.11 Obligated
Groue Eliminations Assets Current assets
Cash and cash equi, alents $ 173.909 $ Short•lenn mvestments 2.U2.\9-I-Accounts rece1\'able for sernces to patients, net of allowance
for doubtful accounts 998.934 Accounts recei\'ablc for physician actiYities. net 110064 Insurance claims rcceh·able. currcnl portion 75.457 Other current assets 187.51] (',000)
Total current assets 3.868.0"I 0.(XJ(J)
Due from affiliates. ne1 (278.719) Long•tem1 investments 2.049.979 Property. plalll and equipment. net -l.1-P,U-15 Insurance claims reccirnblc, net of current pomon 321.511 Other assets 349.488 (5,112) Total assets $ l-0,740.396 $ (286.831)
Li;1bilities and net assets (deficit) Current liabilities·
Short•lenn borrowmgs $ II0.218 $ Accounts payable and accrued expenses 6.U.57-i Accrued salanes and related benefits 62:t063 Currcul ponion of capital lease obligations 1.932 Current portion of long•tem1 debt -l-0.606 Current portion of insurance claims liabilit) 75.-1-57 Current portion of malpractice and other insurance liabilities 9'.U54 Current portion of estimated payable to thud.party pavers 188.762
Total current liab1h1ies 1.775.766
Due to affiliates. net 1,895 (401,510) Accrued retuement benefits. net of current por11on 885.659 Capital lease obligations. net of currem portion 168.286 Long-tenn debt. net of current port.Jon 1.104.971 Insurance clamIS liabihl). net of current portion 123 513 Malpracuce and other insurance liabtlit1es. net of current portion 887.377 Other long-tem1 liabilities 518.320 Tola! liabiliues 7,665.787 (403.5!0)
Commitments and contingencies
Net assets (deficu) Unrestncted 2.633.962 116.679 Temporanly restncted 169.-190 Pennanently restricted 7U57
Total netassets(deficitJ 3.{174.609 116.679 Total liabiliues and net assets (dcfic1l) $ 10.740.396 $ (286.83l)
North Shore Long Island No11hwell Uni\/ersity Jewish Medical
Healthcare, Inc. Hoseital Center
$ -1-U17 s 6-1.992 $ 61An $ 8-13.8-19 758,559
2-16.!137 HS,074 !04.447 2.159
9D 18.794 20J86 31.041 52.773 44JU6 76.291 1.331.692 1.212.49'
97.958 1S3.56l 1,167.072 212.778 3.:Hl.169
799.596 459.576 1.200.2-1-1 2,765 64,52() 99,229
80,359 199.590 13,678
$ 2,126,083 $ 2,]66.123 $ 3.009.375 $
$ $ 7.500 $ l02,718 $ 183.919 1-1-5.116 119.269 225.794 !07.253 131.815
1,625 50 771 IOJJ39 20.594 913 18,794 20.386
21,886 19,745 21,653 38,651 83,379
434.908 347.098 499,864
46,655 220.502 162.031 80.040
99.420 66588 1.789.719 \OS.063 856.019
2.765 64.529 99,229 122.939 211.321 2J7.085
2,088 129,621 211,873
2.718.996 1.019.663 2.05(),698
(592,913) 1,200,829 81-1-,661 117.431 134,756 28.200 9.26()
(592,913) 1.3-16,460 958,677
$ 2.126.083 $ 2.366.123 $ 3.009.375 $
Northwell Health Staten Island Huntington Stem Famil~
Uni\/crsit) Lenox Hill Southside Hospital Glen Co,e Plaim·iew Center Hoseital Hoseital Hos11ital Association Hoseital HOS)!ital for Rehabilitation
2.906 $ 2() $ $ 64 $ 11 $ !04 396,376 -17_.-12.1 .1A% 199.038 72,-D'.l 654 366
121,681 148.912 63.941 ➔ 7.799 14,118 21,UJ 9,-D9 l.887 788 562 141 80
11.131 12.158 4.842 3.505 1.225 2.026 271 18.437 20.682 8.202 7.549 3.845 3.053 85
550.53'7 n1.2s2 81.270 258.517 91.773 27.050 I0.162
7,560 19.640 174.098 80.310 21.583 3?.996 10.409 596 1-1.968 190.766 973.75S 263.390 175.560 -1-4.482 32,181 9.798 57,389 54.'B6 18,705 7,000 6.970 11.169 821 12,906 46.677 1)90
985,696 $ I.J86.960 $ 386,338 $ 479,073 $ 153,634 $ 78,556 $ 55,389
- $ - $ $ - $ - $ 38.601 62 727 49.285 21.420 10.272 10.500 1.465 19.707 47.947 27.754 22.722 6.667 11.310 2.094
257 4.212 1.820 35 35 754 1,531 815
Jl.Ji7 12.358 4.842 3.505 1.225 2,026 271 11.9-il 6,364 5,065 J,546 1.185 1,669 29,IJ8 15.677 11,-175 481 6,172 J,789
134,736 1-17.150 98.-156 51.709 20,203 33,208 8.43-l-
16.649 152,934 158.653 20,479 10,03S 2.467 188.69-1- 69.186 118.851 14.622 24.707 4 559
2 278 72.48S 114.934 71.245 78.2-16 5.852 8.J-17 1.061 57.)89 54.936 18.705 7,000 6.970 11.169 821
106.843 81.161 56.277 41,855 12.391 17,505 44.3)5 60.214 40.846 13.463 7.168 8.000 712
4)4.904 802.101 511.368 331.603 77.2-1-1 102.936 17,587
538,256 -18-1,561 {137.S-l-5) 134,670 62,656. (24,868) 36,976 11,052 71.891 l0.515 11.637 I0,894 488 826
1.48-1 28.207 1.163 2.843 550.792 584.659 (127.030) 147,470 76.393 (24.380) "l,7,802 985.696 $ 1.386.960 $ 186.338 $ 479.073 $ 153.634 $ 78.556 $ SSJ89
BFA
Attachm
ent E (cont'd) C
ON
191083
Northwell Health, Inc.
Combining Statement of Operations -Northwell Health Obligated Group
(In Thousands)
Year Ended December 3 I, 201 7
Total Oblig.ated
Groue Eliminations Operatmg re,·enue
Net patient service rennue $ 7.114.404 $ (588) Physician pracllce re, enuc 1.088.860 Provision for bad debts (107,124) 6.066 Total paliem revenue. net of provision for bad debts 8,096.140 5A78 Olher operatmg revenue 667.5)8 (1,283,847) Net assets released from restnctions used for operations 42,31S
Tola.l operating re,·enue 8,805.993 (1,278.369)
Operatmg expenses Salanes 4,332.430 (446,910) Emplo;i-ee benefits 1,070.144 (89.413) Supplies and expenses 2.707.453 (742.(146) Depreciation and amort1:mtion 381.247 Interest 123.481
Total operating expenses 8.614.755 (1,278,369)
Excess (deficiency) of operating revenue mu operating expenses 191.238
Non-operating gains and losses. lnYestment income 96,720 Change III ne1 unreahzed gams and losses and change in Yalue
of equity method investments 257.243 Change in i111eres1 in acqmred entitles 19.-155 Non-operating net periodic benefil cost (28.854) Loss on refunding long-tem1 debt (42.619) Other norH>perating gains and losses 7,0!0
Total non-Operating gains and losses 308.955
Excess (deficiency) of reYenue and gains and losses o\·er expenses 500,193
Net assets released from restnctions for capital assel acqu1S1lions 32,080 Change in fair Yalue of interest rate SY.ap agreements
designated as cash flow hedges 471 Transfers Ito) from affiliates (370.821) Pension and other postretiremeut liability adjustments !24.275) Increase (decrease) in unrestricted net assets $ 137.648 $ -
North Shore Long Island Northwell Unh·ersitv Jewish Medical
Healthcare, Inc. Hoseitai Center
$ - $ 1.790.661 $ 2,264,051 $ 409.369 170.180 (36.(JOJ) (36,368)
2.16-L027 2.597.863 Ul5,138 J4U23 17\270
970 14,186 17,017 1,216,108 2,519,536 2,788.150
423,565 1.265,124 1}41.S26 101.425 249.770 340,268 531.298 851.298 892.317 104.407 65.396 92,094 55,692 6,085 45.019
1.216.387 2.437,673 2,711.224
(279) 81,863 76.926
13,158 27,689 26,888
-12.072 75,39-1 65.659 19.455
(2.385) (4.792) (2.827J (19.168)
2,432 4,578 55.277 117.746 75.130
S4.998 199,609 151.056
8,757
170 301 (32i.020) (23.899) (19.902)
(3.436) (4.422) (6,543) $ (275.458) $ 180.215 $ 125.~I_L $
Staten Island No11hwell Health Universit~· Lenox Hill Southside Huntington Hospital Glen Col-·e Plain,·iew Stem Family Center Hosl!ital Hoseital Hoseital Association ffOS)!ital Hospital for Rehabilitation
900.720 $ l.001.756 s 453.S0I $ 339.496 s 119.465 $ 187,237 $ 55.805 81,233 110.512 74.325 18,468 23.826 937
(9.266) (IHl79) (9.)26) (4.464) (2.004) (2,262) (418) 89L45-l L07L9IO 554.997 -109.357 135.929 208,801 56,324
l0,197 U6,52I 23.S2S 6,152 5.455 9,258 5'6 585 9J78 96 19 44
922.236 1.227,809 578,618 415.548 141,384 218,059 56,914
421.934 599,688 303,472 200.761 81.667 !08,423 B,180 136.756 135.165 80.901 49.950 19.630 33.965 11.727 292.781 421.963 194.030 141.213 41.635 70,831 12.DJ
26.817 45.3-10 18.932 16.602 6.202 3.956 1.501 3,-197 5.360 3.275 3.627 282 459 185
881.785 1.207.516 600,610 412.153 149.416 217,634 58,726
40.451 20.293 (21,992) \395 (8.032) 425 (1.812)
16,839 1,349 276 7,691 2,672 (12) 190
45.050 4.048 862 17.463 6.681 14
(S2) (8.363) (J.199) (5.199) (519) (1.175) (163) ,(5.798) (9.609) (3.99()) (4,054)
56.()59 !12.575) (6,251) l5.9fJI 8.834 il,207) 41
96.510 7,718 (28.243) 19.296 802 (782) (1.771)
4'7 9,181 13.-140 155
637 2.070 (4,553) (7.255) (241) (435) (97) 97.594 $ 18.969 $ (19.356) $ 12.041 816 $ (l.217) $ (1.868)

BFA
Attachm
ent F C
ON
191083
Northwell Health, Inc.
Combining Statement of Financial Position w Nortbwell Health Obligated Group September 30, 2013 (Unaudlted and In Thousands!
Long Island Northwell Health
Total North Shore Jtwtsh Staten bland Huntington Stem Family
Obligakd Northwdl Univenity Medical Unh•trsity UOO:xHHI Southside Hospital Glen Cove l'laiJniew Ctnterfor
Groul! Eliminations Healthcare. Inc. llos[!ital Center Hoseltru Hospital HOS(!ital Auodation Hospital Hoseihll Rehab iii.tat ion
Assets Current a5$ClS:
Cash and cash equh1tlents $171.633 $· $137.126 $25.357 $1.183 $1.449 $3,405 $1.212 $53 $167 $570 $!
Shott.oterm investments 2.190.062 9.626 750.929 685.038 418.910 48.516 2.891 214.382 59.026 488 256 Aeoounls receiYable for services to patients, net of
allowance for doubtful acoounts 973.0IO 242.158 322.933 105.180 149.666 56.856 49.781 14.171 21.789 I0.476 Accounts recei\!.able for physician acti\·itie$, net 132.671 117.360 2).79 11.536 945 348 131 12 Insurance claims recei'l·able, cunent portion 75.457 913 18.794 20.386 IU37 12.358 4.842 3.505 1,225 2.026 271 Other current assets 215,937 (3.000) 41.143 55.33! 55.895 10.041 21.269 9.889 8.547 3.840 2.900 82
Total currl!nt ·assets 3.758,770 (3.000) 188,808 1.209,929 l.087.714 55G,7l7 246,750 77.645 276.616 78,660 27.845 11.086
Due from affiliates, net 380,600 (187,019) 97.655 170.358 273,561 7.392 2,185 16.468 Long.-term investments 2,048.939 l,092.7lll 248.258 369,546 183.283 80.438 !6.943 31.118 I0.704 647 15,219 Property, plant and equipment, m:t 4.316,390 933,931 453.874 l,2.B.855 192.342 971.629 173.875 181.544 42.689 33.661 8.990 Insurance claims rccei,·abk, net of current portton 300,789 2.485 59.966 94.361 54.692 47.476 17.527 6,140 6,672 10,649 821 Other assets 357.255 (5,115) 9-0,845 209.500 13,624 12,907 34.104 1.390 Tota1 assets SI 1,162.743 (5195.134! $2,406.507_ S2.3ll.885 $3.062.661 $1,007,lJJ $1,380,397 $387,380 $495,418 $138,725 $74,987 $52,584
Liabilities and net asset, (dtfidt) Current liabilities:
Short.o.term borrowings Sll0.218 5. $· $7,500 $102,718 s- S· $· s- $- $- $-
A«.ounts P3Yabl¢: and a«rocd expenses 701.442 228.708 141.896 136.835 43.633 66.760 35.827 25.139 10.471 I0.703 l.470 Accrued salarit:s and related benefits 696,655 119,935 109,736 147.416 45.871 54.469 33,009 23,652 6,878 13,538 2,151 Current ponion of capital lease obligations 2.200 1,625 154 50 I09 262 Cunent portion of long-<enn debt 4U70 5.486 10.044 22.100 4.000 1.820 45 45 763 1.542 825 Current portion of insurance claims 1iabl1i1y 75.457 9t3 18,794 20.386 11.137 12,358 4.842 3.505 1,225 2,026 271 Current portion of malpractice and other in.surance liabjlities 93,t:54 21.886 19,745 21.653 11.941 6,364 5.065 3.5~6 1.285 l.669 Current portion of estimated payable to thir<l-parl)' payers 235,120 65,6% 110,345 15,874 19,783 13.%0 2583 933 2.152 3.794
Total-cwrent liabilities 1,960.916 518.553 373.565 561.503 132.565 161.816 92.748 58.470 21.555 31.6.30 8.5ll
Due to affiliates, net (311.813) 115,247 175.908 20.325 333 Accrued retirement benefits. nel of current portion 902.682 238.229 170.385 83.834 5.617 178.441 67.124 116.354 14.00!I 24.251 4.438 Capital Ji:ase obligations, net of current potttOn 169,lMO 98.253 969 66,552 541 2.0"1 644 Long..ienn debt, net of current portion 3,060,538 l.785.247 94,641 834.154 69,499 113.592 7U76 78.178 5,060 6.771 2.220 Insurance claims Ii.ability, net of current portion 300.789 2,485 59.966 94.361 54,692 41,41(; 17,527 6.140 6,672 10,649 821 Malpractice and olher insuranee liabilities, net of current portion 1.018.455 145.11-08 242.379 268.981 126,083 93.940 64,451 47.622 13.416 16.575 Other long--tenn iiabmties 519,365 1580 129.571 209 845 44.860 60,400 43,765 13.463 7.169 8 000 712 Total liabilities 7,931785 (Jll,813! 2,789,355 1,071.476 2.119,230 433.857 11li}93 532,699_ 341,196 68,214 97,876 16.702
Commitments and contingencies
Net assets {deficit): Unrestricted 2,798.312 ll6,679 (382,848) 1.133.397 800.135 561.595 511.006 (150.360) 140.659 56,478 (23,428) 34,999 Temporarily restricted 359.511 ll8.808 134.036 HJ.397 66,217 5.{l4I l2.4UO 11.190 539 883 Permanently restricted 73,135 28,204 9,260 1,484 30,181 1,163 2.843
Totel net assets {deficit) 3,230.958 116.679 !382.848) 1.280,409 943,431 573.476 607,404 (145,319) 154,222 70.511 (22.889l 35,882 Total liabilities .and net assets {deficit) $11,162.743 ($195.134) $2,406,507 _______g3_5_l,885 $3,062.661 $1,007,333 $1,380.397 $387.380 -- $495.418 $138.725 $74.987 ·-- $52.584
BFA
Attachm
ent F (cont'd) C
ON
191083
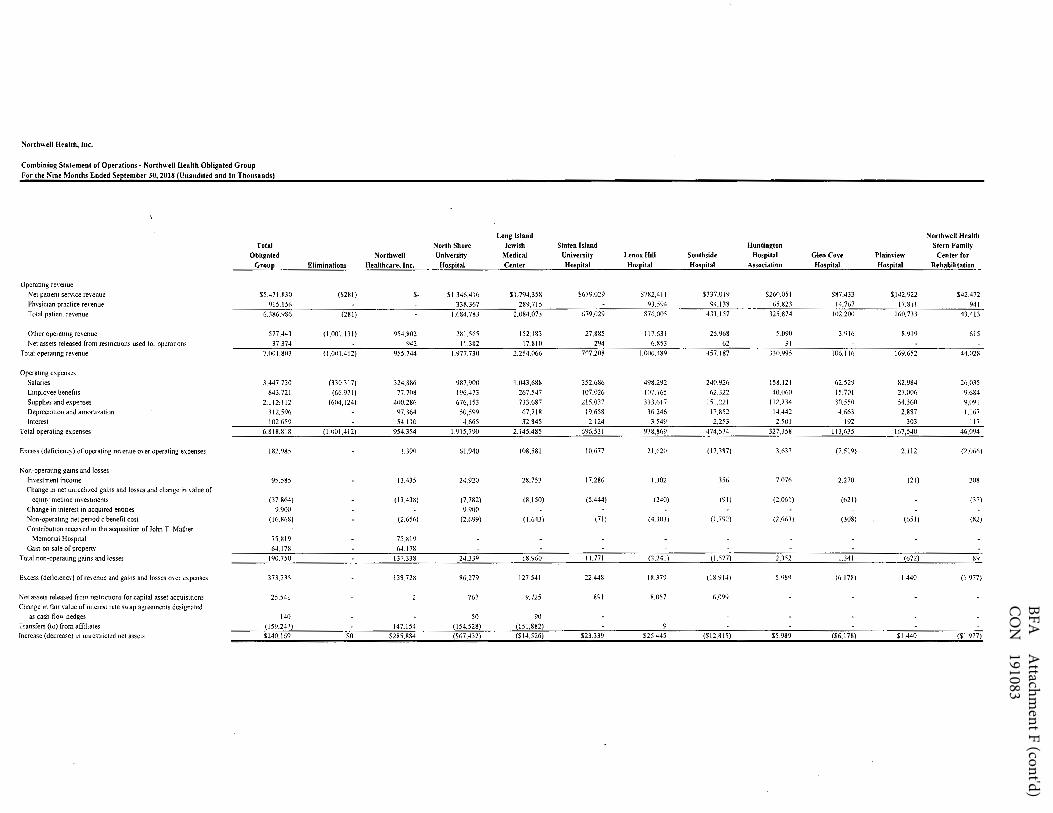
Northwtll Health, Inc.
Combining Sl•t<meut of Operations - Northwell Health Obligattd Group For th• Nine Months Ended September 30, 2018 (Unaudited and In Thousands)
Long Island Nortbwell Health Total North Shore Jewish Stattn Island Huntington Stern Family
Obligated Northwell University Medical Uni~rsity Lenox Hill Southside Hosplllll Glen C-0ve PlainYicw Center for· Groue Eliminations Healthtare, Inc. Hospital Center Hospilal Ho.~pital Hoseital Assodatfon Hoseital llmpital Rehabilitation
Operating revenue Net patient serv1ce rcYenue $5,471.830 ($281) $- $LJ46,416 $1,794.358 $679.029 $7K2.4! ! $337.019 $2W.0Sl $87.4H $142.922 $42.472
Ph~sic1an practice re\'enue 915.156 338J!,7 289,715 93.594 94.138 65.823 14.767 11.811 941 Tola! patient rerenue 6.386,986 (2811 1.684.783 2,084.07] 679.1129 &7Ci.005 431.157 325.874 IH2.21J<l 160.733 43.413
Other operatmg re\enue 577.443 (1.001.131) 954.802 281,565 152.!83 27.885 117.631 25.968 5.090 3.'H6 8.919 615 Nc-1 assets released from restnct1ons used for operations 37.374 942 11.382 17.810 294 6.853 (,2 31
Total operating H~\enue 7.0/ll.803 (l,()(11.412) 955.744 1.977.730 2.254.066 707.208 IJJ(}{l.489 457.187 330.995 106.11,, 169.652 44.028
Operating expenses Salruies 3,447.730 (JJO 311) 324.886 987.9(1{) 1.043,688 352.686 498.292 240.926 158,121 62.529 82.984 26,035 Employee benefits 843.721 (66.9711 77.708 1%.473 261.547 107,026 107. 165 62.322 40J)60 15.7lll 27.006 9.684 Supplies and e:-;;peoses 2.112'.ll2 (6(14,124) 400,286 676,153 733,687 215.(1]7 333.617 151,221 I 12.234 30,550 54.36() 9,091 Deprecrnuon and amortization 312.596 97,364 50,599 67.718 19,658 36.246 17,852 14.442 4,663 2.887 1.161 lntcresi 102Ji59 54. l iO 4.665 32.845 2,124 3.549 2,253 2501 192 303 117
Total operaHng exixnses 6.818.818 (1,001,412) 954,354 1,915,790 2.14;.4g5 6%.531 978,869 -474.574 327.358 113,635 167,540 46,0()4
Excess (deficiency) of operatmg revenue m'er operating expenses 182.985 1,39'1 61.940 !08,581 10,677 21.(,20 [11,387) lJ,31 (7.519) 2.112 (2.fJ66)
Non-operating gams and los~ lnvestment incorne 9:\5S5 13.435 24.920 28,753 17,286 1.302 356 7 076 2,270 (21) 20& Change in net unrealized gains and losses and change in \l'.liue of
e<11u1y meth<ld invesunents (37.864) (13.438) (7.782) (8.150) (5.444) (240) (91) (2.0(,!) {621) (31)
Change m interest in acquired entmes 9.900 9.900 Non•operaimg net penod1c benefit cos! (16.868) (2.656) {2699) (l.643) (71) (4.3031 (!.792) (2.6631 (308) (651) (82)
Contribution received m the acqumtmn of John T Malher Memonal Hospttal 75JH9 75,819
Gain on sale or proper~ 64,178 64.178 101.aJ non-operatmg gams and losses 190.750 137.338 24.339 18.960 I l.771 (3,241) (!.527) 2.)52 1.341 (672) 89
Excess (deficlency) of revenue and gains: and losses o\·er expenses 373.735 138.728 86.279 127541 22.448 18.379 (18.914) 5.989 (6.178) l.440 (l.917)
Net assets released from restrict1ons for capital asset acquisitions 25.541 2 767 9.125 891 8.057 6Jl99
Change m fair \aJue of interest ra1e swap agreements designated as cash flo;.\ hedges 140 50 90
Transfers {lo) from affihates (159.247) 147.154 (154,528) 151.882) lncrease (decrease) in Wlrestricted net assets $240.169 $0 $285.884 {$6_7.432) _......_JIB5.2(;) $23,339 $26.445 ($12.815) $5.989 ($6.178) $1.440 ($1.977)

Nor
thw
ell H
ealth
La
bora
torie
s
North
well H
ealth
, Inc.
North
well H
ealth
care
, Inc.
Nor
thw
ell H
ealth
, Inc
. Pr
opos
ed C
o-op
erat
or T
able
of O
rgan
izat
ion
Subm
itted
Apr
il 3,
201
9
Not-f
or-P
rofit
Corp
orat
ion
Divis
ion
Plain
view
Hosp
ital
Long
Isl
and
Jewi
sh
Medi
cal
Cent
er
Orza
cCt
rfor
Ex
tend
ed
Care
&
Reha
b
Cohe
n Ch
ildre
n's
Medi
cal
Cent
er
The
Zuck
erHi
llsid
e Ho
spita
l
Long
Isl
and
Jewi
sh
Hosp
ital
Long
Isl
and
Jewi
sh
CHHA
Hunt
ingt
onHo
spita
lSo
uths
ide
Hosp
ital
Syos
set
Hosp
ital
North
Sh
ore
CHHA
North
well
Healt
h St
ern
Fam
ilyCe
nter
for
Reha
bilit
atio
n
Hosp
ice
Care
Net
wor
k
SIUH
Hosp
ice
Regi
onCa
re,
Inc.
Long
Isla
nd
Hom
e
North
Sh
ore
LTHH
CP
Long
Isl
and
Jewi
sh
Valle
y St
ream
Long
Isl
and
Jewi
shFo
rest
Hi
lls
Glen
Cov
e Ho
spita
lLe
nox H
ill Ho
spita
lPe
coni
c Ba
y Me
dica
l Ce
nter
Peco
nic
Bay
Skille
d Nu
rsin
g Fa
cilityFo
r Pro
fitCo
rpor
atio
n
North
wellQ
ualit
y and
Medi
cal A
ffairs
, Inc.
(NQM
A)*
Phelp
s Ho
spita
l
Leno
x He
alth
Gree
nwich
Vi
llage
1 N
orth
wel
l Hea
lthca
re, I
nc. i
s the
pro
pose
d Ac
tive
Pare
nt a
nd C
o-op
erat
or p
endi
ng D
OH
appr
oval
of C
ON
# 18
2124
-E
Stat
en Is
land
Unive
rsity
Ho
spita
l
North
ern
Wes
tche
ster
Ho
spita
l
North
Sh
ore
Unive
rsity
Ho
spita
l
Entit
ies D
elega
ting
Auth
ority
to
NQMA
*
John
T.
Math
erHo
spita
l 1
CON 191083BFA Attachment G
L
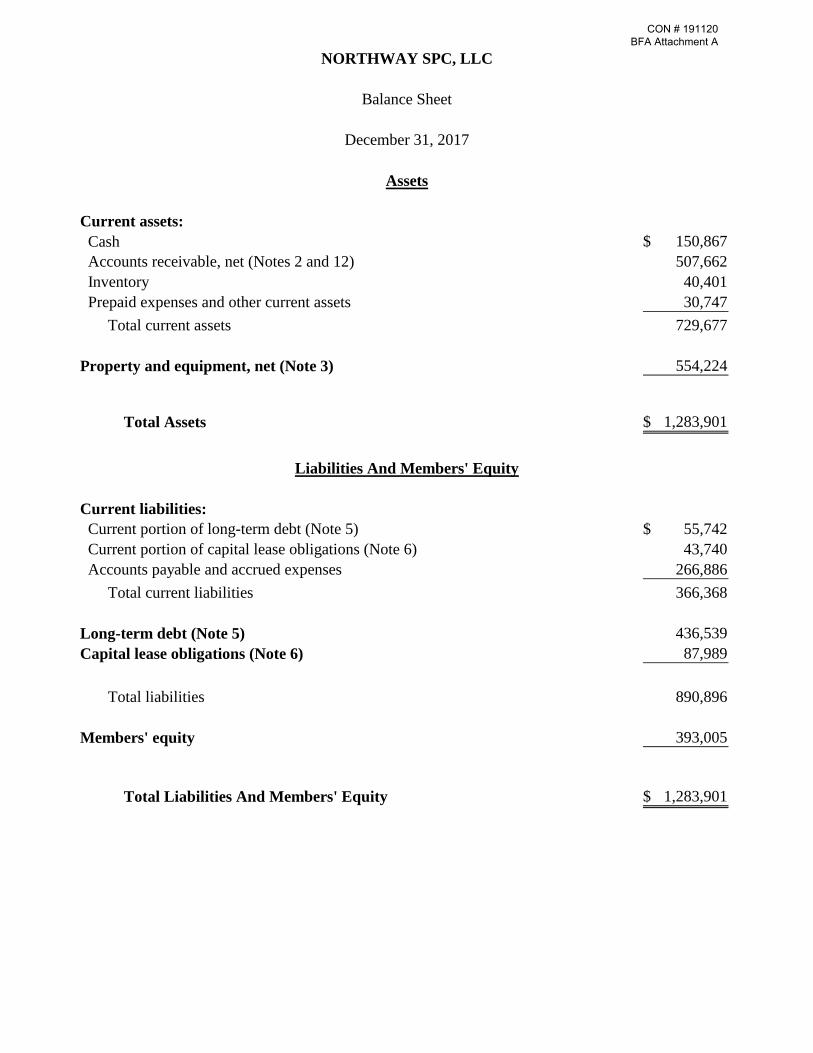
Current assets:
Cash 150,867$
Accounts receivable, net (Notes 2 and 12) 507,662
Inventory 40,401
Prepaid expenses and other current assets 30,747
Total current assets 729,677
Property and equipment, net (Note 3) 554,224
Total Assets 1,283,901$
Current liabilities:
Current portion of long-term debt (Note 5) 55,742$
Current portion of capital lease obligations (Note 6) 43,740
Accounts payable and accrued expenses 266,886
Total current liabilities 366,368
Long-term debt (Note 5) 436,539
Capital lease obligations (Note 6) 87,989
Total liabilities 890,896
Members' equity 393,005
Total Liabilities And Members' Equity 1,283,901$
Liabilities And Members' Equity
NORTHWAY SPC, LLC
Balance Sheet
December 31, 2017
Assets
CON # 191120 BFA Attachment A

%
Revenues 5,594,452$ 100.0
Expenses:
Patient care salaries 895,039 16.0
Medical supplies 613,293 11.0
Rent (Notes 7 and 8) 300,000 5.4
Administrative 207,781 3.7
Management fees (Note 8) 150,000 2.7
Depreciation 142,131 2.5
Fringe benefits (Note 9) 121,429 2.2
Housekeeping/plant 114,224 2.0
Taxes - property and school 83,354 1.5
Other medical costs 39,840 0.7
Interest 34,942 0.6
Total expenses 2,702,033 48.3
Operating income 2,892,419 51.7
Other income 73 -
Net income 2,892,492 51.7
Members' equity - beginning 770,013
Members' distributions (3,269,500)
Members' Equity - Ending 393,005$
NORTHWAY SPC, LLC
Statement Of Income And Changes In Members' Equity
For The Year Ended December 31, 2017
CON # 191120 BFA Attachment A
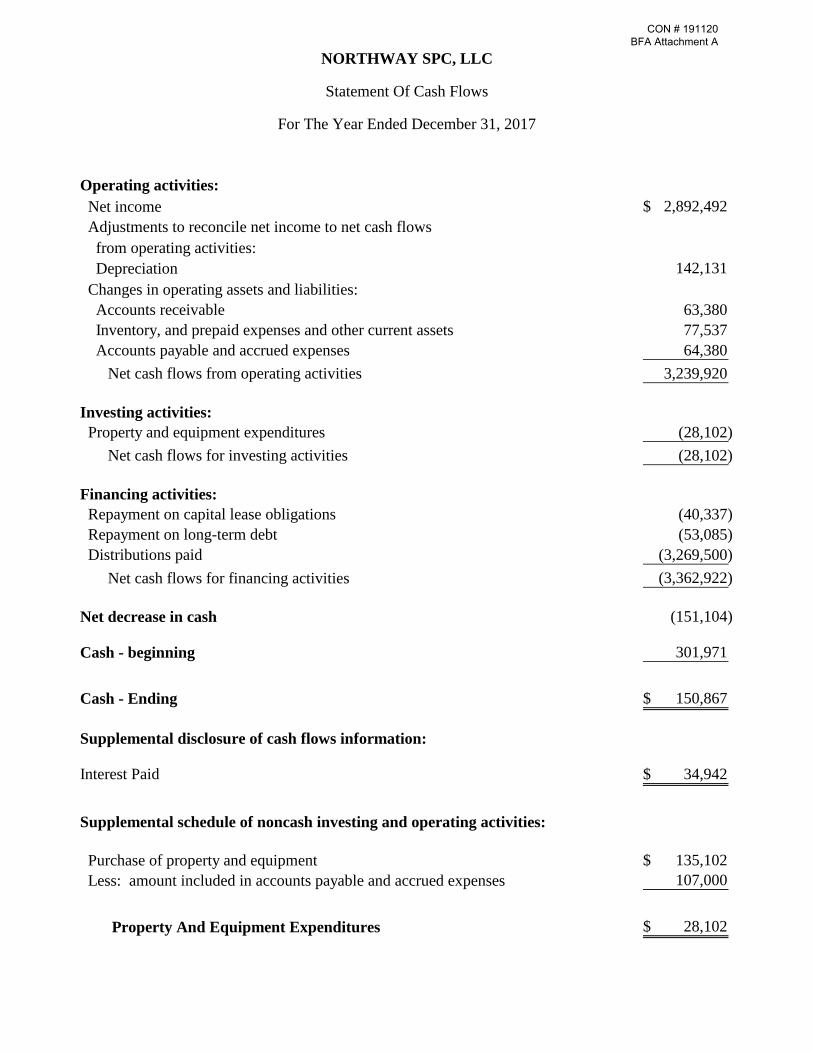
Operating activities:
Net income 2,892,492$
Adjustments to reconcile net income to net cash flows
from operating activities:
Depreciation 142,131
Changes in operating assets and liabilities:
Accounts receivable 63,380
Inventory, and prepaid expenses and other current assets 77,537
Accounts payable and accrued expenses 64,380
Net cash flows from operating activities 3,239,920
Investing activities:
Property and equipment expenditures (28,102)
Net cash flows for investing activities (28,102)
Financing activities:
Repayment on capital lease obligations (40,337)
Repayment on long-term debt (53,085)
Distributions paid (3,269,500)
Net cash flows for financing activities (3,362,922)
Net decrease in cash (151,104)
Cash - beginning 301,971
Cash - Ending 150,867$
Supplemental disclosure of cash flows information:
Interest Paid 34,942$
Supplemental schedule of noncash investing and operating activities:
Purchase of property and equipment 135,102$
Less: amount included in accounts payable and accrued expenses 107,000
Property And Equipment Expenditures 28,102$
NORTHWAY SPC, LLC
Statement Of Cash Flows
For The Year Ended December 31, 2017
CON # 191120 BFA Attachment A
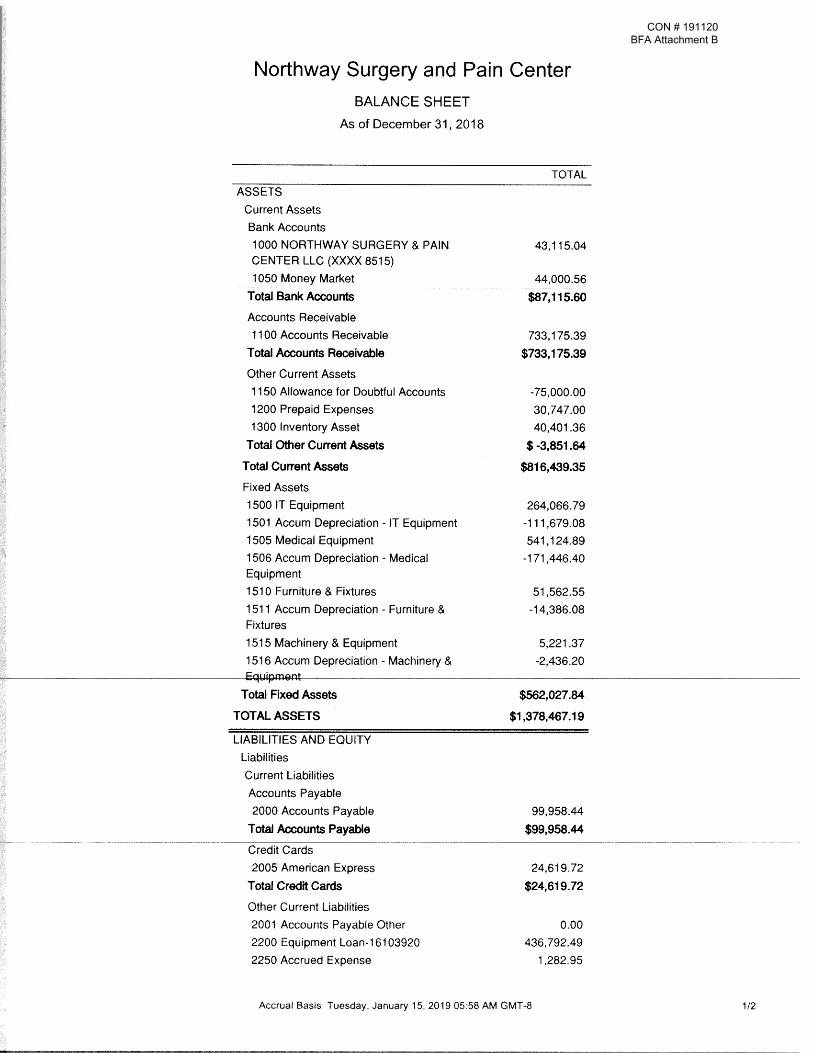
CON # 191120 BFA Attachment B

CON # 191120 BFA Attachment B

Accrual Basis Tuesday, January 15, 2019 05:59 AM GMT-8 1/2
Northway Surgery and Pain CenterPROFIT AND LOSS
January - December 2018
TOTAL
Income
4000 Medical Revenue 6,378,621.76
4015 Fee Refunds -43,675.48
4035 Medical Records Fees 15.00
Total Income $6,334,961.28
GROSS PROFIT $6,334,961.28
Expenses
5000 Advertising/Promotional. 2,238.14
5005 Bank Charges 707.91
5010 Cleaning 39,433.82
5020 Disposal Fees 17,518.47
5021 Document Destruction 128.40
Total 5020 Disposal Fees 17,646.87
5025 Dues & Subscriptions 222.09
5030 Insurance 478.74
5035 Insurance- Disability 1,580.96
5036 Insurance - Employee Health 16,228.26
Total 5030 Insurance 18,287.96
5031 Property Taxes 22,698.03
5032 School Taxes 61,145.95
5040 Insurance - Liability 14,816.11
5045 Insurance - Malpractice 15,123.03
5046 Interest Expense 20,030.62
5050 IT Maintenance Fees 34,106.69
5055 Legal & Professional Fees 49,652.49
5056 Pharmacy Consulting Services 1,000.00
5057 Public Goods Pool 4,610.00
5059 Billing Services SOCS 237,500.00
5060 License Expense 14,538.00
5065 Linen 24,372.08
5075 Medical & Surgical Supplies 617,634.70
5077 Stim Trial Leads 35,584.84
Total 5075 Medical & Surgical Supplies 653,219.54
5076 Payroll Services 8,081.63
5080 Office Expenses 17,288.81
5085 Billing Expenses 13,361.59
5090 Payroll Expenses 1,001,744.45
5091 Payroll Tax - Social Security 60,875.98
5092 Payroll Tax - Medicare 14,215.00
5093 Payroll Tax - Fed Unemployment 1,372.13
5094 Payroll Tax - NYS Unemployment 8,662.58
5095 Postage 1,554.60
5105 Rent or Lease 325,000.00
CON # 191120 BFA Attachment B
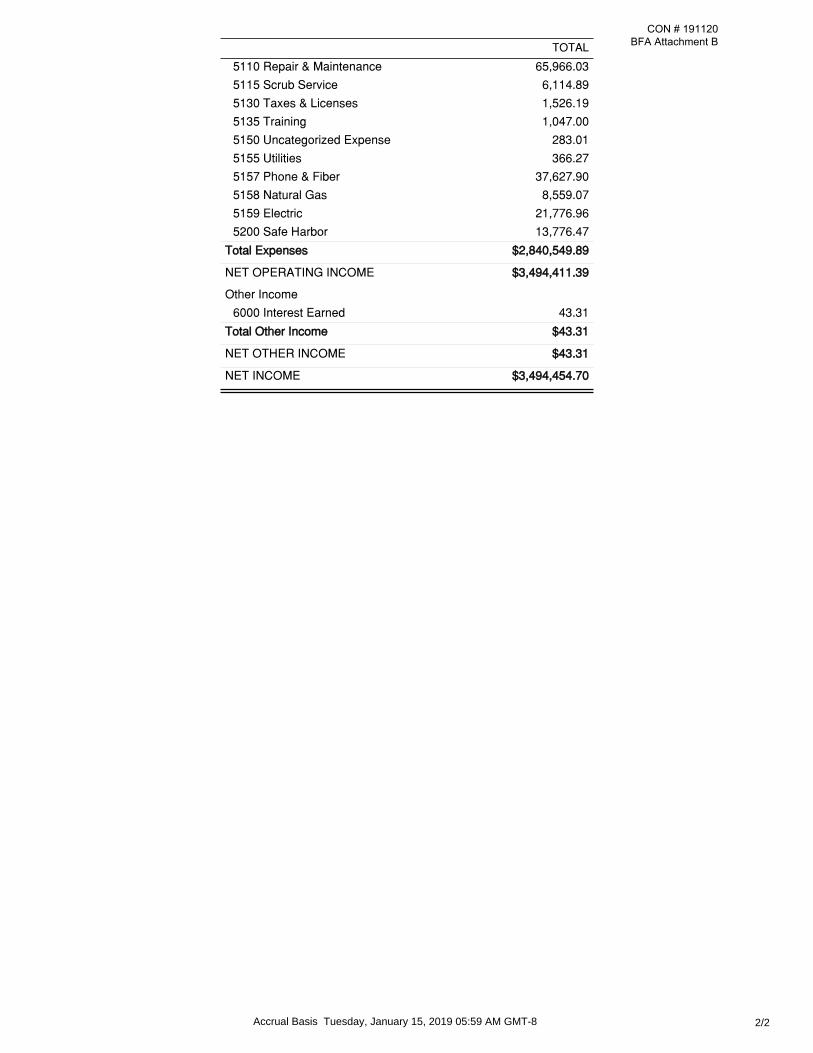
Accrual Basis Tuesday, January 15, 2019 05:59 AM GMT-8 2/2
TOTAL
5110 Repair & Maintenance 65,966.03
5115 Scrub Service 6,114.89
5130 Taxes & Licenses 1,526.19
5135 Training 1,047.00
5150 Uncategorized Expense 283.01
5155 Utilities 366.27
5157 Phone & Fiber 37,627.90
5158 Natural Gas 8,559.07
5159 Electric 21,776.96
5200 Safe Harbor 13,776.47
Total Expenses $2,840,549.89
NET OPERATING INCOME $3,494,411.39
Other Income
6000 Interest Earned 43.31
Total Other Income $43.31
NET OTHER INCOME $43.31
NET INCOME $3,494,454.70
CON # 191120 BFA Attachment B
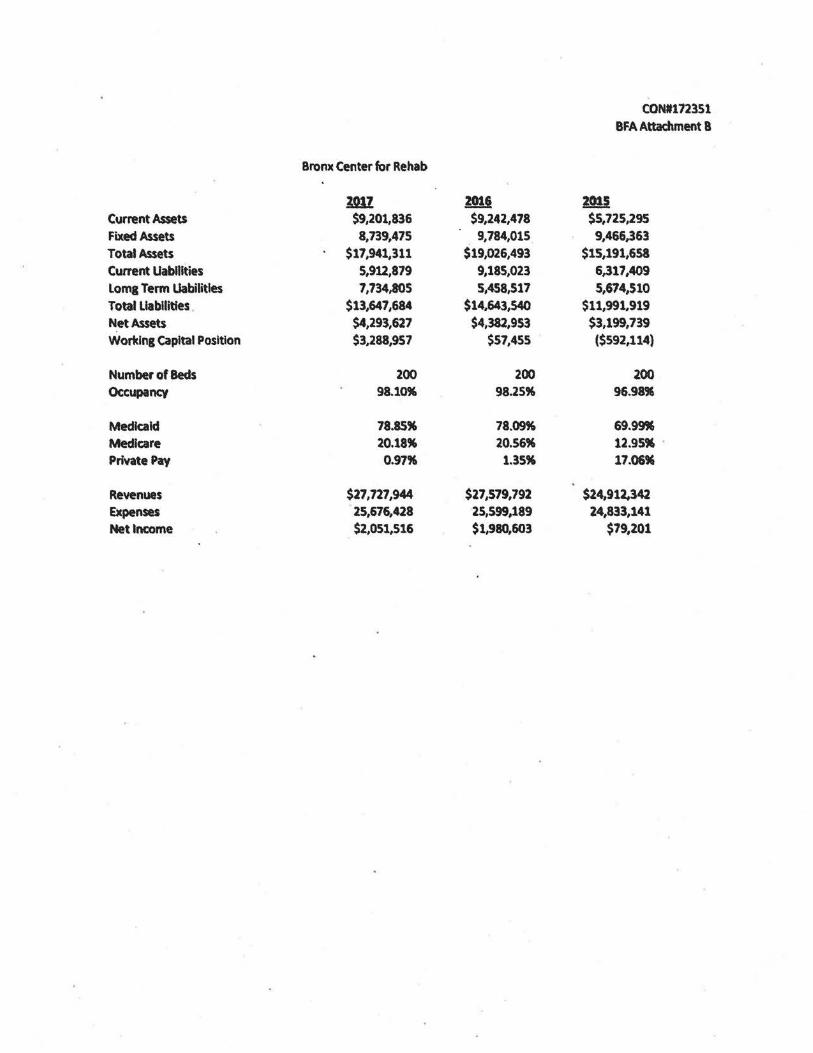
CON#1723S1 BFA Attachment 8
Brome Center for Rehab
lUZ mi 2015 Current Assets $9,201,836 $9,242,478 $5,725,295 Fixed Assets 8,739,475 9,784,015 9,466,363 Total Assets $17,941,311 $19,026,493 $15,191,658 Current Uablllties 5,912,879 9,185,023 6,317,409 Lomg Term Uabilitles 7,734,805 5,458,517 5,674,510 Total llabllitfes . $13,647,684 $14,643,540 $11,991,919 Net Assets $4,293,627 $4,382,953 $3,199,739 Working capital Position $3,288,957 $57,455 ($592,114)
Number of Beds 200 200 200 Occupancy 98.109' 98.25% 96.989'
Medicaid 78.85" 78.09% 69.9996 Medicare 20.18" 20.56" 12.95" · Private Pay 0.97" 1.35% 17.069'
Revenues $27,727,944 $27,579,792 $24,912,342 Expenses 25,676,428 25,599,189 24,833,141 Net Income $2,051,516 $1,980,603 $79,201
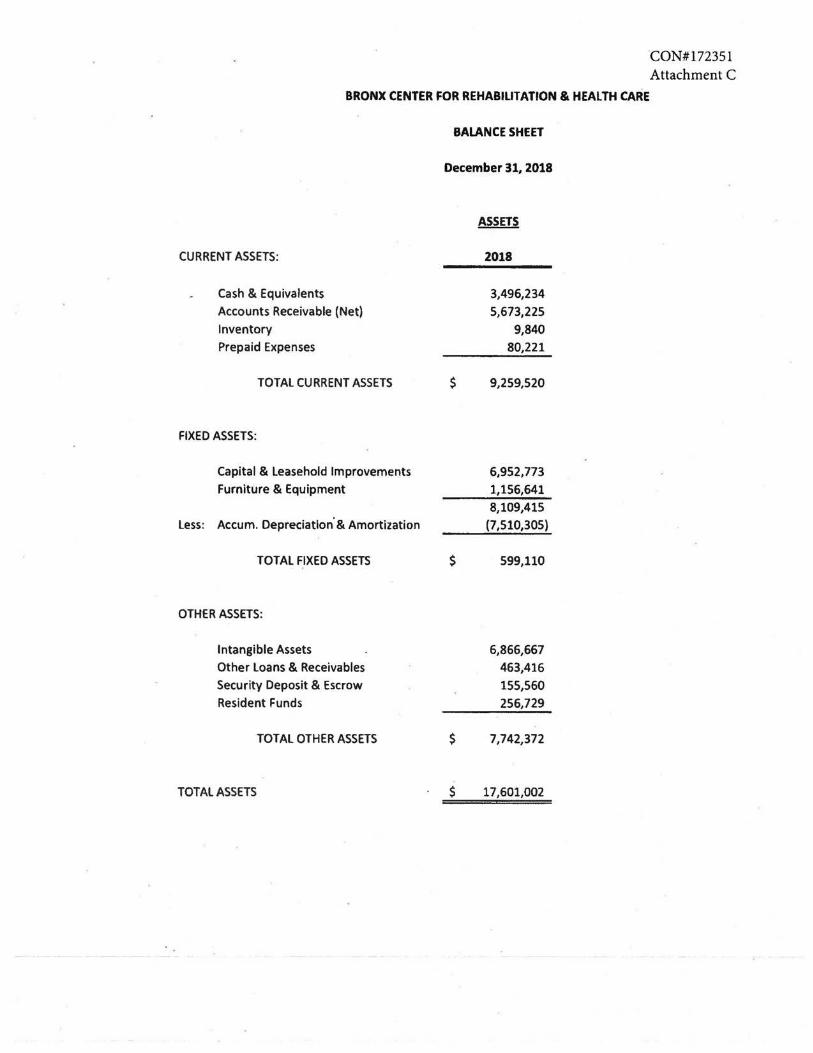
·coN#l723Sl Attachment C
BRONX CENTER FOR REHABILITATION & HEALTH CARE
CURRENT ASSETS:
Cash & Equivalents Accounts Receivable (Net) Inventory Prepaid Expenses
TOTAL CURRENT ASSETS
FIXED ASSETS:
Capital & Leasehold Improvements Furniture & Equipment
Less: Accum. Depreciation· & Amortization
TOT AL FIXED ASSETS
OTHER ASSETS:
Intangible Assets Other Loans & Receivables Security Deposit & Escrow Resident Funds
TOT AL OTHER ASSETS
TOTAL ASSETS
BALANCE SHEET
December 31, 2018
ASSETS
2018
3,496,234 5,673,225
9,840 80,221
s 9,259,520
6,952,773 1,156,641 8,109,415
(7,510,305)
s 599,110
6,866,667 463,416 155,560 256,729
$ 7,742,372
s 17,601,002
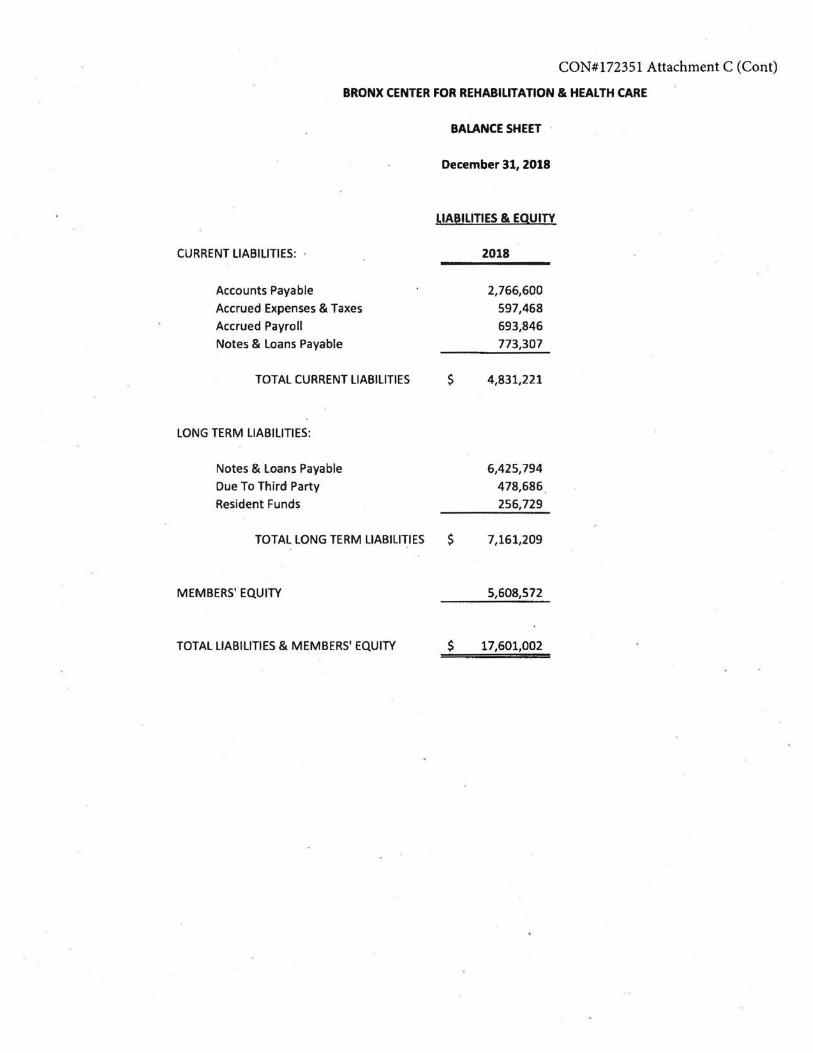
CON#l72351 Attachment C (Cont)
BRONX CENTER FOR REHABILITATION & HEALTH CARE
CURRENT LIABILITIES: ·
Accounts Payable
Accrued Expenses & Taxes
Accrued Payroll
Notes & Loans Payable
TOTAL CURRENT LIABILITIES
LONG TERM LIABILITIES:
Notes & Loans Payable
Due To Third Party
Resident Funds
BALANCE SHEET
December31,2018
LIABILITIES & EQUITY
2018
$
2,766,600
597,468
693,846
773,307
4,831,221
6,425,794
478,686 , 256,729
TOTAL LONG TERM LIABILITIES $ 7,161,209
MEMBERS' EQUITY 5,608,572
TOTAL LIABILITIES & MEMBERS' EQUITY $ 17,601,002

BRONX CENTER FOR REHABILITATION & HEALTH CARE
STATEMENT OF OPERATIONS
CON#l72351 Attachment C (Cont)
For the Year Ended December 31, 2018
2018
TOTAL REVENUE FROM PATIENTS: $ 28,426,268
OPERATING EXPENSES:
Cleanliness and Safety 424,539
Food and Nutrition 1,894,326
General and Administrative 10,175,917
Housekeeping and Maintenance 1,041,842
Leisure Time Activities 389,445
Non Comparables 591,881
Nursing and Medical 7,549,167
Property 2,855,150
Social Services 406,542
Therapy and Ancillaries 1,833,828
TOTAL OPERATING EXPENSES $ 27,162,637
INCOME FRa°M OPERATIONS $ 1,263,632
OTHER INCOME 98,965
INCOME BEFORE TAXES $ 1,362,597
Less: TAXES 47,652
NET INCOME $ 1,314,945

lmtcl:m !c.lDllt li2~ beds\ l<Jnga <i!YDSY 2015 Cumnt Assets $6,339,109 Fi.ed Assets/Other Assets ll~H3.12H Total Assets $20.320,877 Current Uabllftles $7,979,548 1.ona Term Uabllitle.s HJll,885 Total Uabilitlts $14,198,213 Net Assets $6,122,464 Workln1 Capital Position ($2,640,439) Operating Revenues $25,982,219 OperaUn1 Expanses w,oag,994 Operating Net Income $1,961,225 Kennelh ROllflbe,o-91%
IJnlumlt¥ fjymlrlB Hom1l4111ec1a,
an1nxcountv aoJJ Current Assets $1,244,003 Fixed AsaelslO!h...- Anatl QS79.lU TotalASHts $4,823,156 Current Uallltltlts $2,550,042 Lona Term Uablfftles $847,627 Total Uabffltlu $3,197,889 Net Assets $1.626,486 Worlclna capital Position ($1,308.039) Operating Revenues $8,121,802 Operatlna Expenses ~Zl5,3~ Operatin1 Net Income $406,278 Kenn8'h Roaenbera•tft Bath Rozenbere 51lfi
ml $5,489,484
ll §.5l l ,§gfi $21,980,990
$9.445,983 1§.IUHi,Z~§
$15.341,719 $6,639,271
($3,976,499) $26.734-031 U§,lM,!11
$1,570,620
ml $1,748,769 l~.499.G7 $5,248,306 $1,774,471 ll.IQZ.090 $3,481,581 $1,788,745
($25,702) $5,983,187
H.~aam $530,328
CQN1172lS1 8FA Attadvneat D
11l31lailj7 $7,802,000
12§.9~ 1.zga $35,643,788
$7,578,793 12Qi§l§,§Dl $28,394,294
$7,249,474 $23,207
$27,795,402 :&2:i,ia~.a~
$1,842,149
21Qll31U $2,225,035 1a.~1.;m1 $5,688,394 $1,442,788 0 12041843 $3,647,431 $2,018,963
$782,247 $6,310,984 111.ZH.09&
$554,865

coNnnu1 Attachment D (Contln11ed)
BlfllmlsltC..fuB ..... ■1~1111 ll1I u Hl11llSHZ CurrentAIMII IU91,603 $9,S8S.344 $10,527,714 FlxeclAuelllQtherAISell D,OOOJlll llll.UJ.sso SB.028,00Q TotllAs.seta $17,282.219 $1"878,874 $20,718,427 Cunent ~ $15,655,696 $15.407,610 $14,888,484 t.an1 T4trm Uablll\111 S49J1m m1.im1 S,.;y§.§6§ T-' llabllltiel $18,147,171 $15,795,718 $18.212,119 NetAIMls $1,148,048 $3,880,985 $4,504.308 Wcntdftl Cepltll Mtkln ($7,384.092) ($8,842,288) ($4,338,750) OPlflllna Rwenues $30,462.397 $32,838.888 $33.731,976 Operadna tiipemas S30.338.BZ 13).3§4.988 m.aAl.588 Operatlfll Nit tnmne $126,010 $461.900 $1,380,388 KenmtlllR~
WllllwlllldartllWal blda) .
ml ml jnt,agiz CumlntAIHtl $2,412-297 $3,030,288 $3.101,054 Flied~--- M.Gl,9.13 ltJlll.llD S§.313,307 TotllAIHII $7.244.230 S7,6t7,339 $8.414-361 Cummt Unllhl• $4,202.382 14.980,388 $4,382.460 l.ofll Tena Ulbllltla . IJ.M8.MO 1iaJ,!IOO u.am TatallllbllllMt se.148,402 $8.801,780 $6,781,731 NetAIMU $1,098,828 189&,559 $1,832.6:SO WGtWa1 Capital PGsldoft ($1,790.086) ($1,8!0,122) ($1.281,388) Operatllll..._.. $8.930,714 Sl,872.870 $9,063.2B8 Opllrltlftg--- u.w1z1 a.Jam sz.g,110 OINntlftl Net lftcome S1,24Q.738 $613,792 $1,232,746 IC""'9\h ....._ _..
BlthRo&a"'9ft
111■ e...11111111~em.---.11 ml &UI 12131'20,Z
CUrnnl Alaell NIA $6.295,321 $7,488,031 PlltedAslllllOlhwAINII &329.383 M,Uo,812 TCll81Alltll $10,824-704 111,868.843 cumantUllblllll 13.088,189 $3,606,268 1.ont Term UabilRM u.m.ao., 13.028.751 Tolal l.llblihs $8,--972 $8,833,019 NelMlell $4,829.732 $6,226,624 WQsldngCap1111 Po8llloft 12.227,162 $3.861,783 Operating Revenues $10,450,814 $10,630,419 Oparalmg eipensu H,083.=1!5 $9,134.§0R Opnllng Nat Income $2,387,199 $1,495,810 Kwsntlll R011111btfg-W4 8elh Ronnlalrg ftt
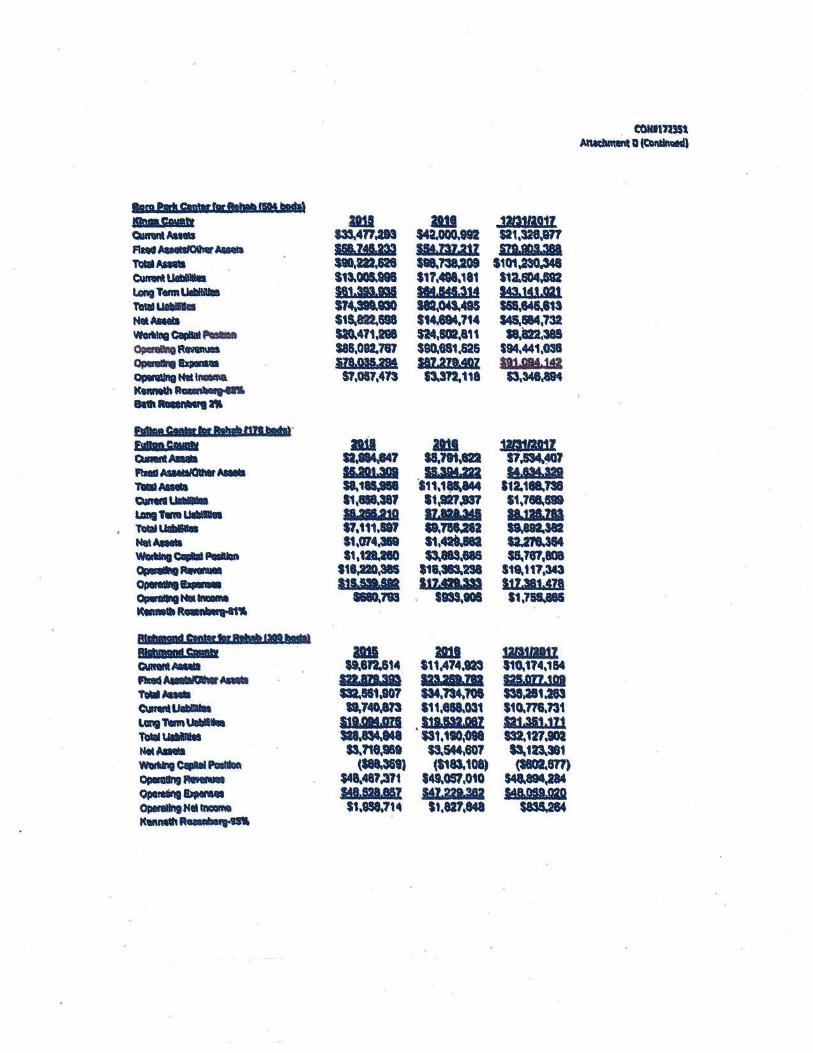
1111111111tt SifntBfaBIWttrm • AaRme'! ml CUnnlAIIIIS $33,477,113 ftMAuatlfOltiw......, ssazam TQIIIAAell $90,122,628 QmW\\Uebllllls S13.00S.991S la'9 Tenn IJallllillll 111.m.m 1'11111Ullllla S14tMl30 NetMIG $16.812.698 Wclll"'8C..-PllsllDD Sl0.471,198 Opll;l:111114 RMlllm $85,082.787 ~--- IDJlll.a& 0pa19111,aHllllalM. S1,0l7,473 Klftflllh.............,. 8d.R1tnllalft
fllMC: II 1111..._.IIII--'· EYDa s;.,,,,,, ma Q....tAIUII S1.t1M.147 ..... ~-- ··-,,_MRIII S8.1IUII o,n_.1.111a11 11,811.387 l.mlflrftll.!IIIIIIII ••.121
' ,,_~ $7,111.181 Net .... $1,014.-Wtdlng c.-PaalUr&n 11,121.aeo ~--- 118.220,31S ~--- .,, .. °"" .......... --.m ---~· Bll"ll■llle.wlll..._..lmll Ill I ,..,,,. 91MDII 1111 QIMIIIMIIII 19,811.614 .. , ... :oswr'\111111 .... .,..,.... aa.ss1,n1 QanllllU...-.. 19,740.813 lang Ttlm Ulllllla IJlaJUI TOIIIIMIQlfll ....... Net-- $3.718,989 ~c..-...... (181.369) 0plnllng .... _ $48.487.371 Opattlin9&,peM'9 ••••z ~NII._.. $1,998,714 l<liftndlltwl b1111-tft
ml $42.000.992 wmz.aJZ Sll.738.209 $17,488,111 •.• ~~ -043.495 $14.694,714 SZ4,B02,811 $90.681,626 az.aIUDz 13.372,118
B.11 ss.m,m .a.am 111,,-.844 11,127.137 U.IIIMI 19.?IUl2 11,GUII $3.883,686
11,-.ne IJttn.W
sm,a
1111 111,47◄-P!!D?R SM,734,lOI $11.ell.031 1Jfl.!m.a87
' $S1.1I0,098 S3.544i807 (1183.108)
S49.0S7,010 uz.m,m 11.827,848
llQllll!Z $21,328,877 1Dl-9l'll..-
S101~.341 S12.604Ji9Z 143.J~l.lal -~813 MS.&84,732 .... $94,441,038 llllU.J!I
S:,.MS,194
1n,11a1z S7.5K~7 y"w·m
112.188.n& S1,7ISl.691 U.lal.Zl1 ---SU71.3S4 ss.m,a
S19. 111,:Ma S1lJ81,f78 $1,75S.88S
3mt1111tz 110.174,1&4 sn,gn.,qa S3S.at1.283 $10.771.731 ai.ai.:111 S32,127,9Dl 13.123.381 (SeOl,ffl)
$48.894.284 ~D
$8.18,284
. CONllmst ~ Q (Cltlllmald)
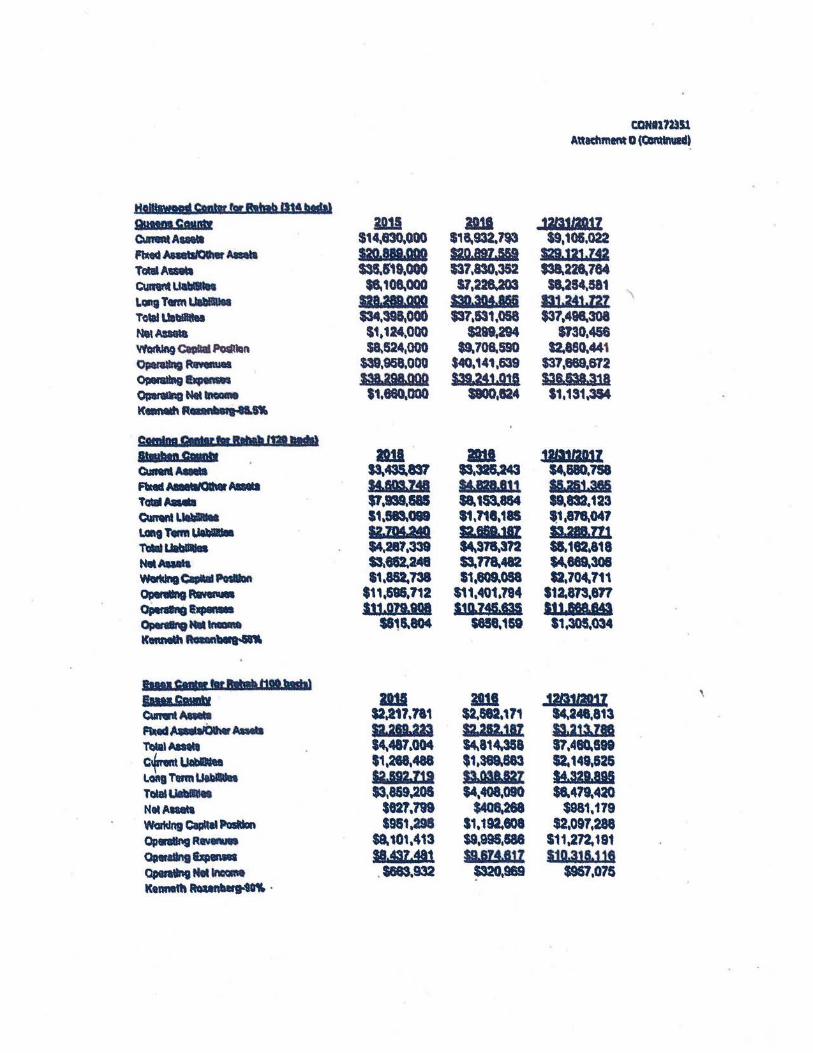
tllllllnlll c-tar !K •hab Ill! bad•I 9WDI c;.,,. ml B.11 J21311!13Z 0.IMMAIIIII $14.830.000 $18-932.7'3 $9,105,022 PtaeclAA8111011wMllll S20 •• ,aoo no.m.m 121.ia:i.az TOIIIA_. $35.119,000 $37,830,352 138.2-764 C\ln'IIUiZl81sc $8.108.000 $7,228-203 $8.294.581 LCIIII Ttrm I IIWIIII 128..289.0DO lill.SCM.IU 113.2~].727 Tolll U.'8lllel $34,391.000 $37,$11,058 $37.498.308 ~Aaala $1,124,000 sa&l.294 $130,458 WQdllftg QlslllllPM\lln la624,000 19.708.590 12.880.441 ~~ S.,858.000 $40,141,639 $37,889,872 OpnllftglllfltlMI S38 a.98.000 S39.2,4J .g31 lilf.A8311 OpweaNel ..... $1,860.000 II00,124 11,131,354 KeaMlhR ...... &n.
1111 11111 31&'1IJIJZ CunN.-.. 13.435.837 '3,315.243 14.680,758 FlndMIIIIIOIMtAIIIII H.&D.1. .,. lf.828.IU 11.113,386 TalllMltlll $1, •• S8.1S3.884 19.832,123 ClnwllLIIIIIIIII ,, .... '1,711,185 $.1,878.047 l.clfttTemtUlllllllle g.'7114140 s:t&M,JIZ n•.ZIJ "Nlll.tabllllla $4,281,339 ~378.312 SS.182,818 NllAIUla 13-tu.2• 53.178.482 14-889.308 WcnlnlCIIIIIIPoslbt 11,8&2.738 11.809.098 12,704.711 °""""I--- $11,696,712 $11,◄01,794 112.873,877 0pltallna&...- 1u.11n.-. 131Z46..835 112..w.M.1 Oplrtllrv ....... $816.804 sese.1n 11,305.034 KINIIIIIRollll ......
ltua•S,.., .. bl•t19badal INISMW ml 1111 2m1111JZ CunwllAIN 12.217,711 $2.682,171 14.ae,a13 FIIIN~MMII a.aam a212.i1z u.a3i1aa TQIIIA&ttll $4.417.004 ~814-358 S'l,48C».589 C~Ulb8lel S1,2t8,488 $1,369.883 U.149,&26 t.ong Tlfffl Utll ... 1a.u2.Il1 IJaM&.127 M.UIIII TQla&Ulbllltl $3,869.208 ~.408.090 $8.479.420 NIIAlletl $827,799 $408.268 $981,179 WGtdng Cipltll ~ 1981,298 11,192.908 $2,097,288 ~R- sa.101,413 $9,995,588 S11,272.191 Olltrdr,a ...... B.QZ,9l ILII!.llZ 1ia.ai1.221 ~-~ .1683.932 ~.- $967,076 Ktandl Rounlalrg-tDtt ·
.................... 011111•~
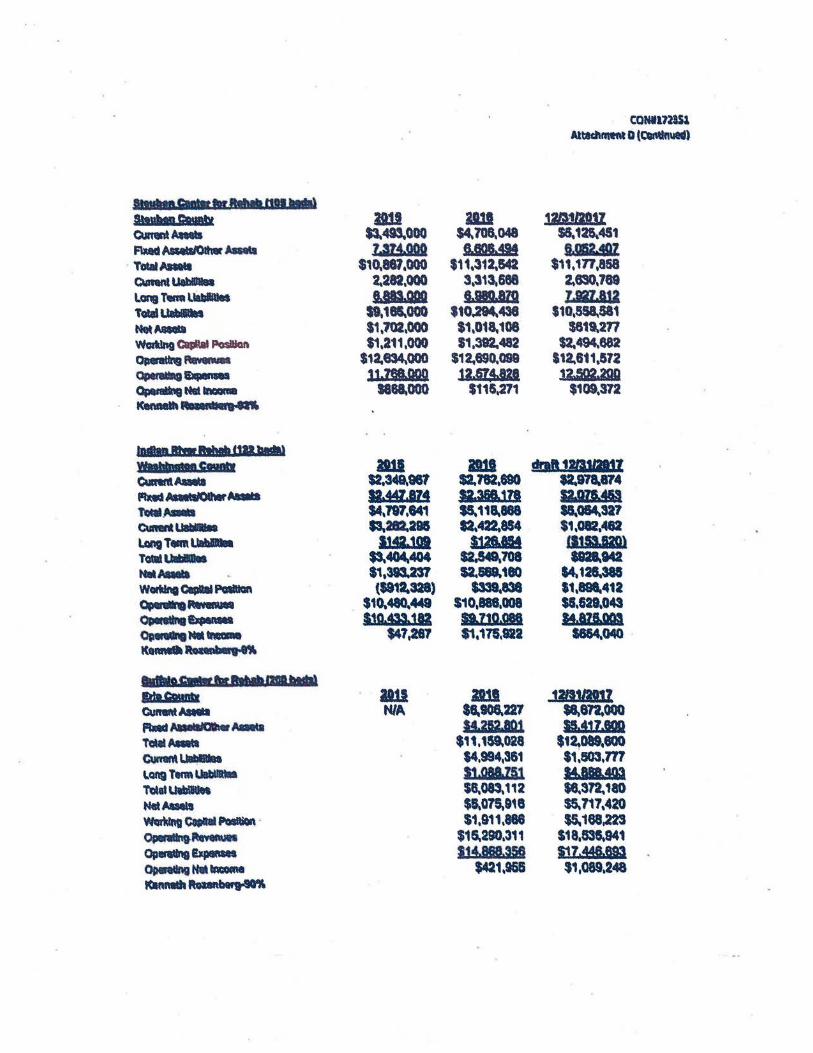
.... Paete mt ml z111iz eun91lAlllls ~-000 $4.706.048 SS.126.451 FIMd~MN\a Z,IM-000 g.aoa..m , •.•
· TotatAIIIII $10-887.000 $11,312.642 $11,177,858 QmntUabllet 2.282,000 3,313.668 2.630,789 lcqfeffllllllalillel UIID 11111.8m z.m.132 T.SUlilllltln S9,18l000 lt0,294-438 $10,SSB_S81 _,__
11,702,QQO $1,018.108 S811U77 ~ ClslltatPosllkln $1,211,000 11.392.482 $2.494.682 ~ ~ $12.834.000 $12.690.099 $12,611,572 OpltlllllQ8-119S 3J.788.Q09 ia,.sa,a 12.502.agg ~-lnOala 1888.000 $116,271 $109.372 ~- ...... lndllln ._ .... a2■ 1111111 'Nfltt r a rrrer 1111 1111 draft 1m112a1z Cunnt.-. $2,349.987 $2.782,690 12.978.874 PIMAIL.,.._--. 11.w.lZ~ 1&3&8.JZI S2.07S.483 ,..AaMI $4,197,141 •111s.aea -~311 c:un.•--- ss.212.aas 12,422.854 $1,082,4'82 LQIIITelPllllblDee IJSZ.llll l:J2&.IM ,ain.uo\ TGlll•llllall $3.--404 $U49.708 saa.142 Na&AIIIII $1,393.237 $2.588t'l80 14.121.381 WGlldnlClpltllPCllllllcln ($912.•> $339.838 11,881,412
Osa••·--- S10.48C).449 S10,888,008 $8,629,043 C,Willtl11 ..... l1D.ffl311 D.ZJDW l!.IU.lm ~--- $47(1.87 $1,175,921 1864.CMO . K__.ll..mlaaw-ft
w..c ••111,-.nm111111l lt'IGIMnb D.11 J.111 :12111120JZ Cutl'IMMIIII NIA SS.900.221 $8.871.QOO flaldAQ11.a.Aa111 u.m.1122 u.43z.aao ~~ $11,1S9.028 $12.Dlt,800 Cumin\l.lltllllftla $4,994,381 11,803,m 1.angTlmUlbllllll Jl.088.z:iJ M.BBB.4M
TdatU.... $"'083, 112 $9.312.180 NelMMII $1.075.918 SS-717,420 werklnte..alllPGlftiOI\ · $1,911,888 $5-1e8,22S ~~ $15.290,311 $18,839.941 Op .... Eapaftlll 13~888.H§ llZ.448.89.1
$421,96& ,,,089,248
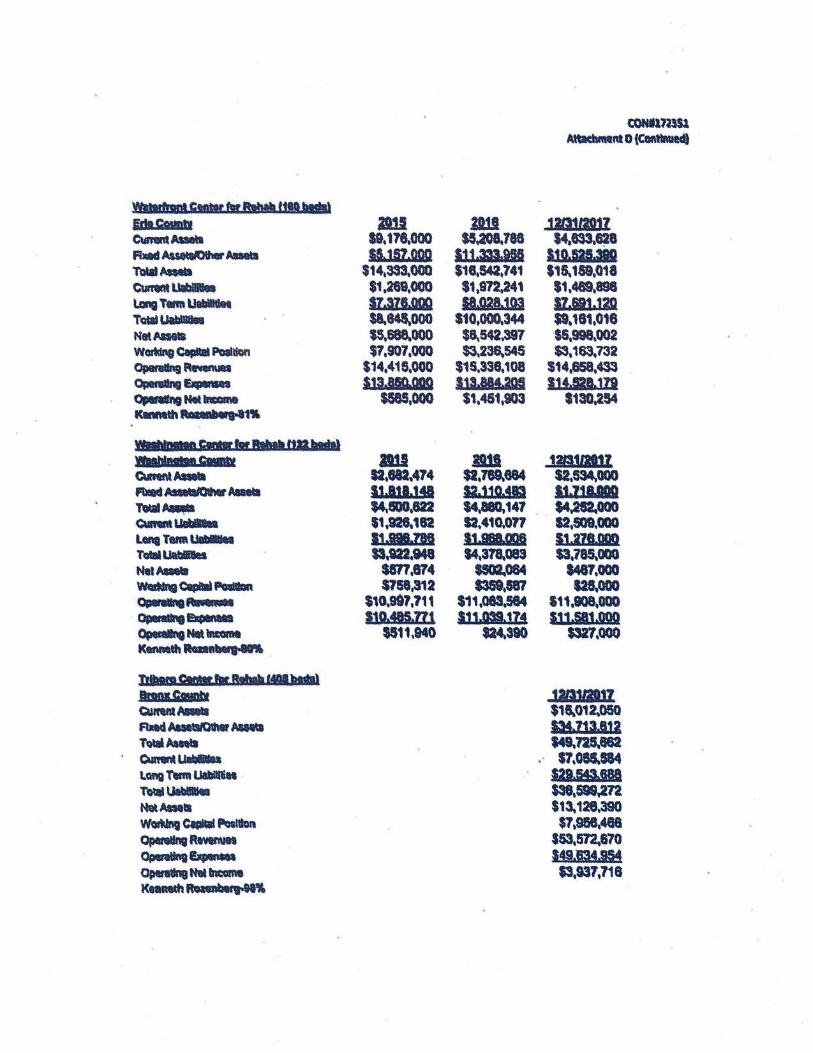
w.1ac••• 1i•tu f!ltllahall 11f.O ,.., ldtCAWdl am ClfflntAltMI $9,119.000 Fi...S~Aaala 11.la?.ooo l'Qlat~ $14,333.000 Qmlnllllbllllel $1,269,000 l.an;TtlmUalllllllll u.az1a TGIIIUllllllla S&,84'000 NatAIHa $5,688.000 W~CapllalPoallilln $7,907,000 0panlllng ~ $14,415,000 Opetallrig&pwa lll,850..0GO ~ NIIIN:IDIM $585,000 ~ n1,.....,.1s
~• ac..•• ,_..._uaa...w """"'" CiPMDN
1111 Qmnt,... sa.ea,414 FbledAsWIIOIMrAlaell 12.121.ig TN ... 14.a,m ~•lablllll S1,9H.182 LqTlftl\9111D•11 IJ.RIIJI§ TalllLlallllllel 13,122,941 NelAIIIII urt,874 W-.Clrlll!llPollllDII $758,312 ~-••:• $10.991,111 ~--- ll!L48S.ZtS ~-._ SS11,840 KennelhRollll .......
JllpgC....flrB,lp(-Mdal
"'"'""" t::un'lftlMIIII FtJlldAau\WOIMt--TolllAIM ~ Ual •11 LcmQ Tenft Ulbllltill ~Uablllltl NetAIIIII WGtlllngtlllllllftirattlon OplNllngRMn\1111 Operalll'9----Opn"'9Nlllhtalle KtaMdl~91%
D1I SS.ao&.788
l:U.333.ffl S18.542,741 $1,972,241 B.1121,lll
110,000.344 $~542,397 $3,236.545
$15,338,108 lll•M•.aGI $1,461,903
ml $2,789-51 12.231483 14.880.147 U,410,077 IJ.rm..ODB 14,378.083
SS02.084 S3S9,187
$11,083,584 llJ,OS9.JZ~
$24-380
CONft1~U1 Alllchffllnt O (COl\tlm.led)
22ml201Z 14.933.~
ljQ,SH.380 s1s.1sa.a1a $1,469,898 IZ,lil,lZQ $9,181,018 $5,998,002 $3,163.732
$14,658,433 ll!1llllD
1130.254
im11111z sa,534.000 11.i:,tcm 14.292.000 12.a.oao 11.aze.000 $3,785.000
1487,000 128.000
111,I08,0QO 13l JilJ.000
$327,000
321S112Dll $16.012.050 w.ZlilJl22 149-728.662 S7,0KS84
121,54.1.688 $39,598.272 $13.126,390 $1'.SH.498
$63,572,670 H.1.834.954 $3,937,718
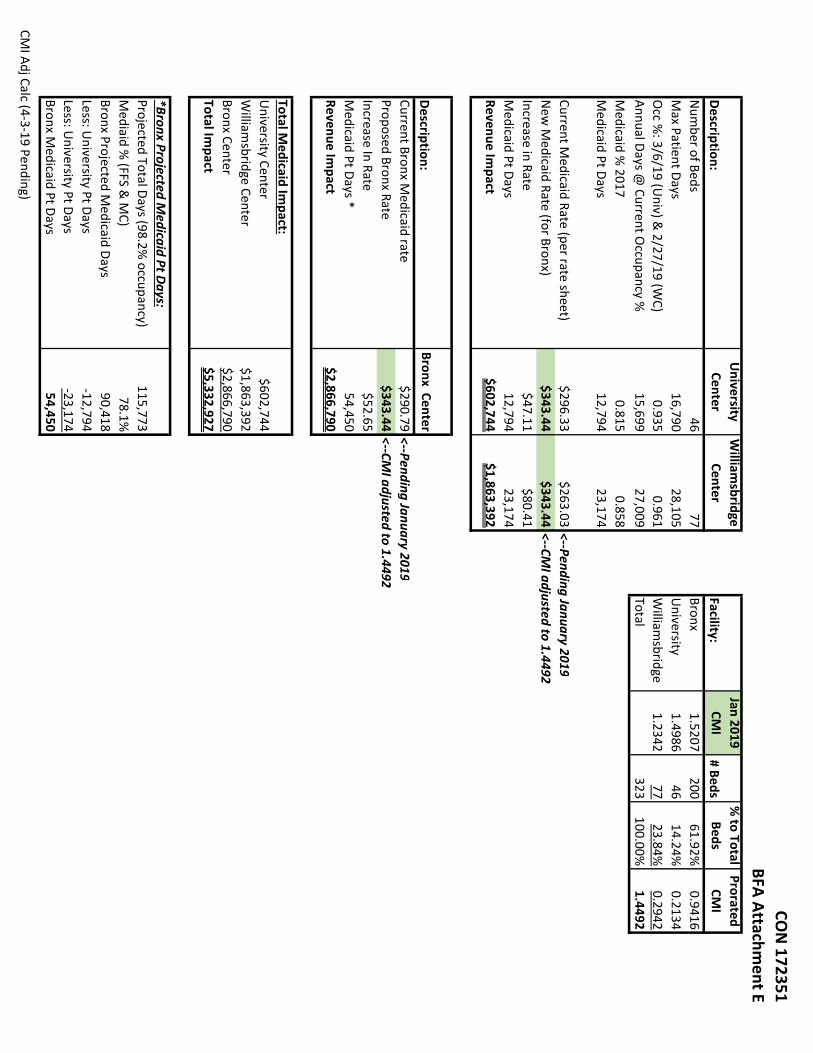
CON 172351
BFA Attachment E
Description:
University Center
William
sbridge Center
Facility:Jan 2019 CM
I# Beds
% to Total Beds
Prorated CM
INum
ber of Beds46
77Bronx
1.5207200
61.92%0.9416
Max Patient Days
16,79028,105
University
1.498646
14.24%0.2134
Occ %
: 3/6/19 (Univ) &
2/27/19 (WC)
0.9350.961
William
sbridge1.2342
7723.84%
0.2942Annual Days @
Current Occupancy %
15,69927,009
Total323
100.00%1.4492
Medicaid %
20170.815
0.858Medicaid Pt Days
12,79423,174
Current Medicaid Rate (per rate sheet)
$296.33$263.03
<‐‐Pending January 2019New
Medicaid Rate (for Bronx)
$343.44$343.44
<‐‐CMI adjusted to 1.4492
Increase in Rate$47.11
$80.41Medicaid Pt Days
12,79423,174
Revenue Impact
$602,744$1,863,392
Description:
Bronx CenterCurrent Bronx M
edicaid rate$290.79
<‐‐Pending January 2019Proposed Bronx Rate
$343.44<‐‐CM
I adjusted to 1.4492Increase In Rate
$52.65Medicaid Pt Days *
54,450Revenue Im
pact $2,866,790
Total Medicaid Im
pact:University Center
$602,744William
sbridge Center$1,863,392
Bronx Center$2,866,790
Total Impact
$5,332,927
*Bronx Projected Medicaid Pt D
ays:Projected Total Days (98.2%
occupancy)115,773
Mediaid %
(FFS & M
C)78.1%
Bronx Projected Medicaid Days
90,418Less: U
niversity Pt Days‐12,794
Less: University Pt Days
‐23,174Bronx M
edicaid Pt Days54,450
CMI Adj Calc (4‐3‐19 Pending)
2017 2016
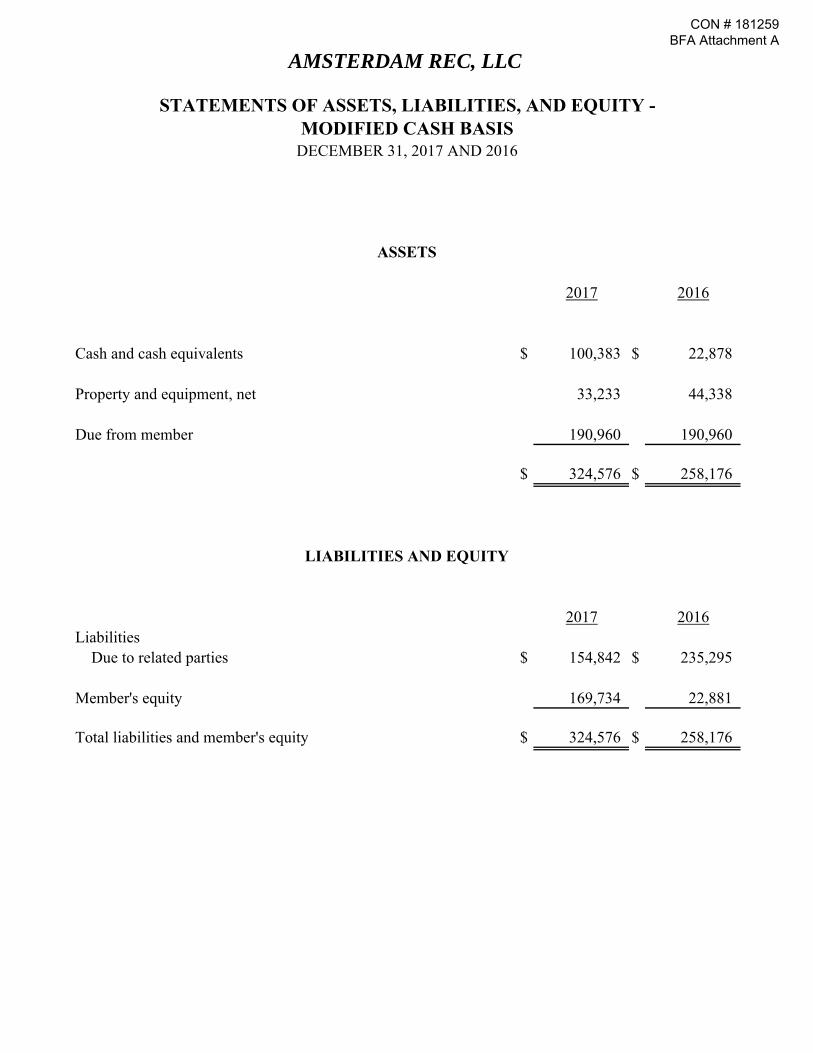
Cash and cash equivalents $ 100,383 $ 22,878
Property and equipment, net 33,233 44,338
Due from member 190,960 190,960
$ 324,576 $ 258,176
2017 2016Liabilities
Due to related parties $ 154,842 $ 235,295
Member's equity 169,734 22,881
Total liabilities and member's equity $ 324,576 $ 258,176
LIABILITIES AND EQUITY
STATEMENTS OF ASSETS, LIABILITIES, AND EQUITY -
DECEMBER 31, 2017 AND 2016
ASSETS
AMSTERDAM REC, LLC
MODIFIED CASH BASIS
CON # 181259 BFA Attachment A
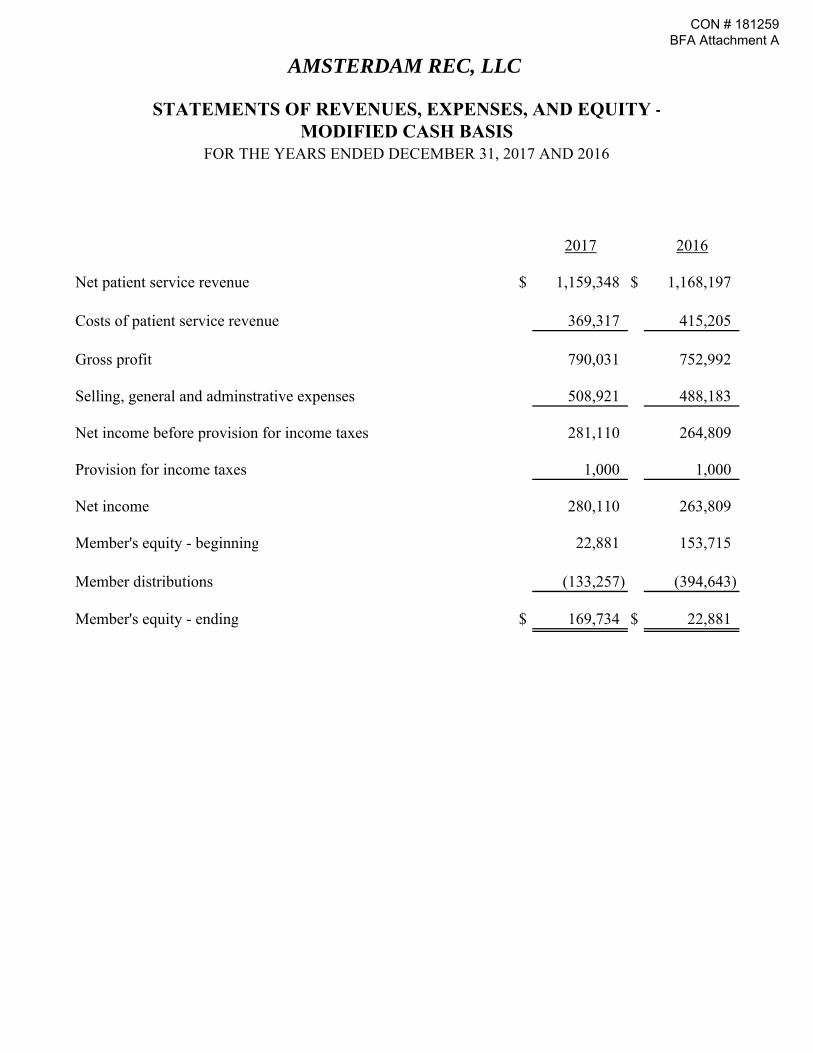
2017 2016
Net patient service revenue $ 1,159,348 $ 1,168,197
Costs of patient service revenue 369,317 415,205
Gross profit 790,031 752,992
Selling, general and adminstrative expenses 508,921 488,183
Net income before provision for income taxes 281,110 264,809
Provision for income taxes 1,000 1,000
Net income 280,110 263,809
Member's equity - beginning 22,881 153,715
Member distributions (133,257) (394,643)
Member's equity - ending $ 169,734 $ 22,881
STATEMENTS OF REVENUES, EXPENSES, AND EQUITY -
AMSTERDAM REC, LLC
FOR THE YEARS ENDED DECEMBER 31, 2017 AND 2016MODIFIED CASH BASIS
CON # 181259 BFA Attachment A
2017 2016
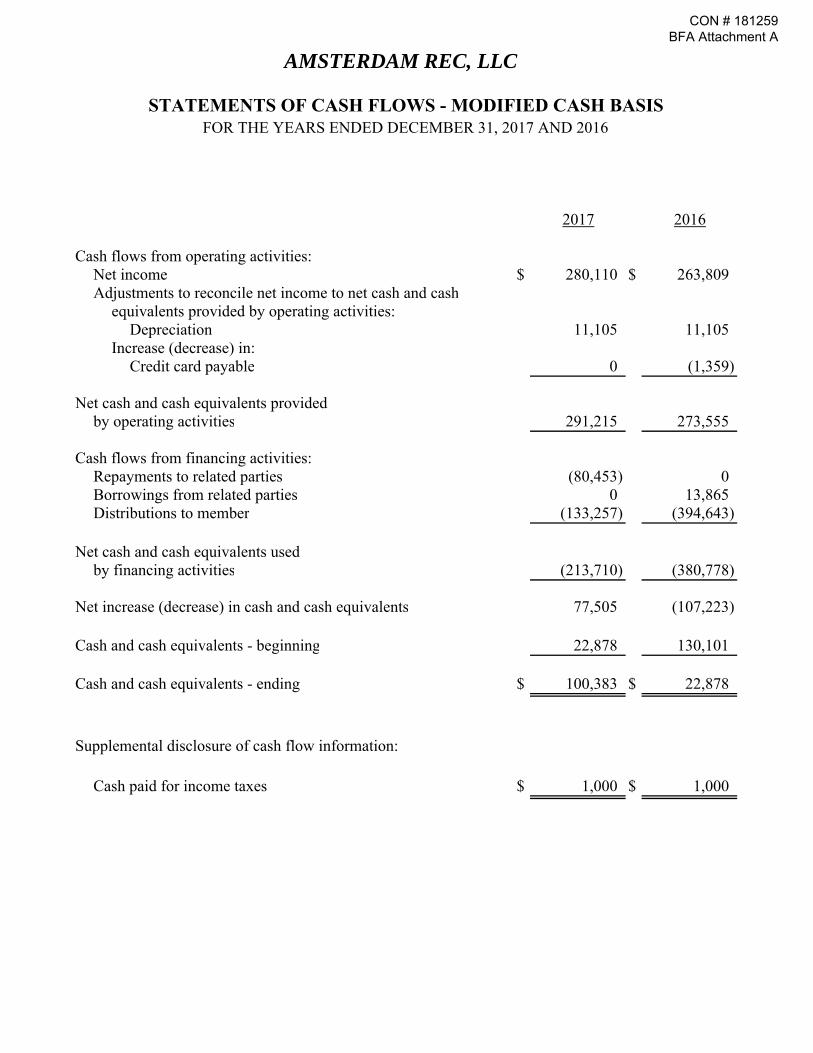
Cash flows from operating activities:Net income $ 280,110 $ 263,809Adjustments to reconcile net income to net cash and cash
equivalents provided by operating activities:Depreciation 11,105 11,105
Increase (decrease) in:Credit card payable 0 (1,359)
Net cash and cash equivalents provided by operating activities 291,215 273,555
Cash flows from financing activities:Repayments to related parties (80,453) 0Borrowings from related parties 0 13,865Distributions to member (133,257) (394,643)
Net cash and cash equivalents used by financing activities (213,710) (380,778)
Net increase (decrease) in cash and cash equivalents 77,505 (107,223)
Cash and cash equivalents - beginning 22,878 130,101
Cash and cash equivalents - ending $ 100,383 $ 22,878
Supplemental disclosure of cash flow information:
Cash paid for income taxes $ 1,000 $ 1,000
AMSTERDAM REC, LLC
STATEMENTS OF CASH FLOWS - MODIFIED CASH BASISFOR THE YEARS ENDED DECEMBER 31, 2017 AND 2016
CON # 181259 BFA Attachment A
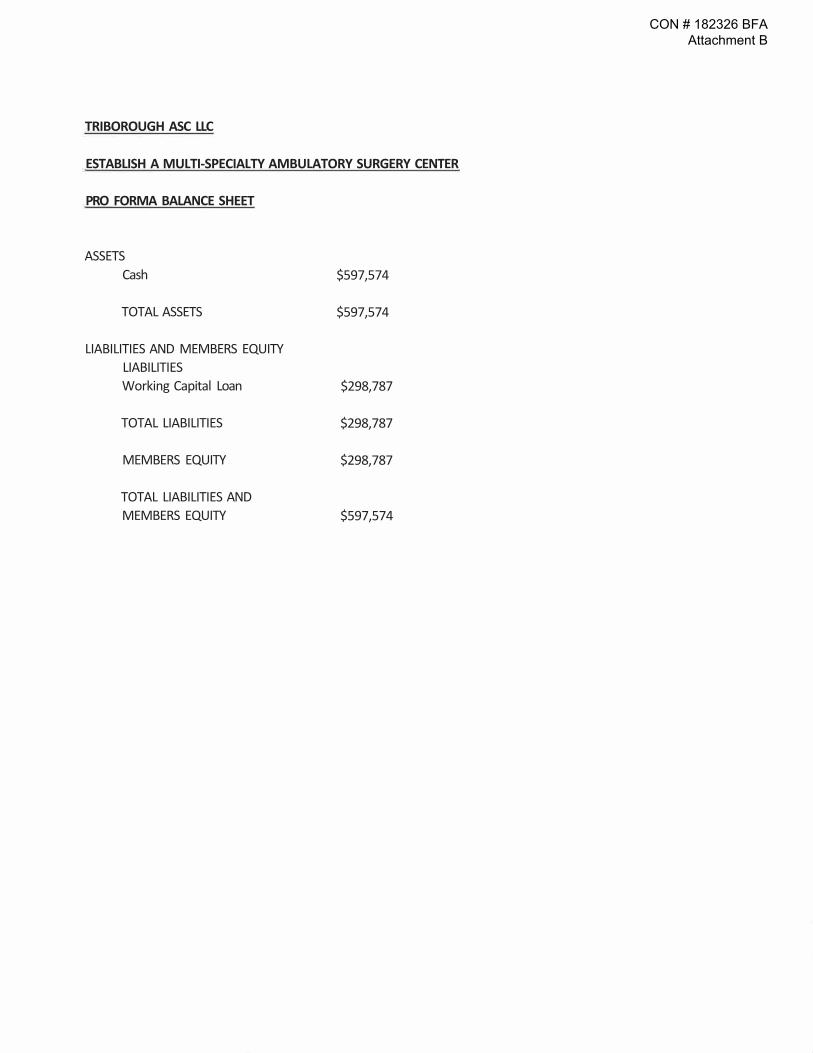
TRIBOROUGH ASC LLC
ESTABLISH A MULTI-SPECIALTY AMBULATORY SURGERY CENTER
PRO FORMA BALANCE SHEET
ASSETS Cash $597,574
TOTAL ASSETS $597,574
LIABILITIES AND MEMBERS EQUITY LIABILITIES Working Capital Loan $298,787
TOTAL LIABILITIES $298,787
MEMBERS EQUITY $298,787
TOTAL LIABILITIES AND MEMBERS EQUITY $597,574
CON # 182326 BFA Attachment B
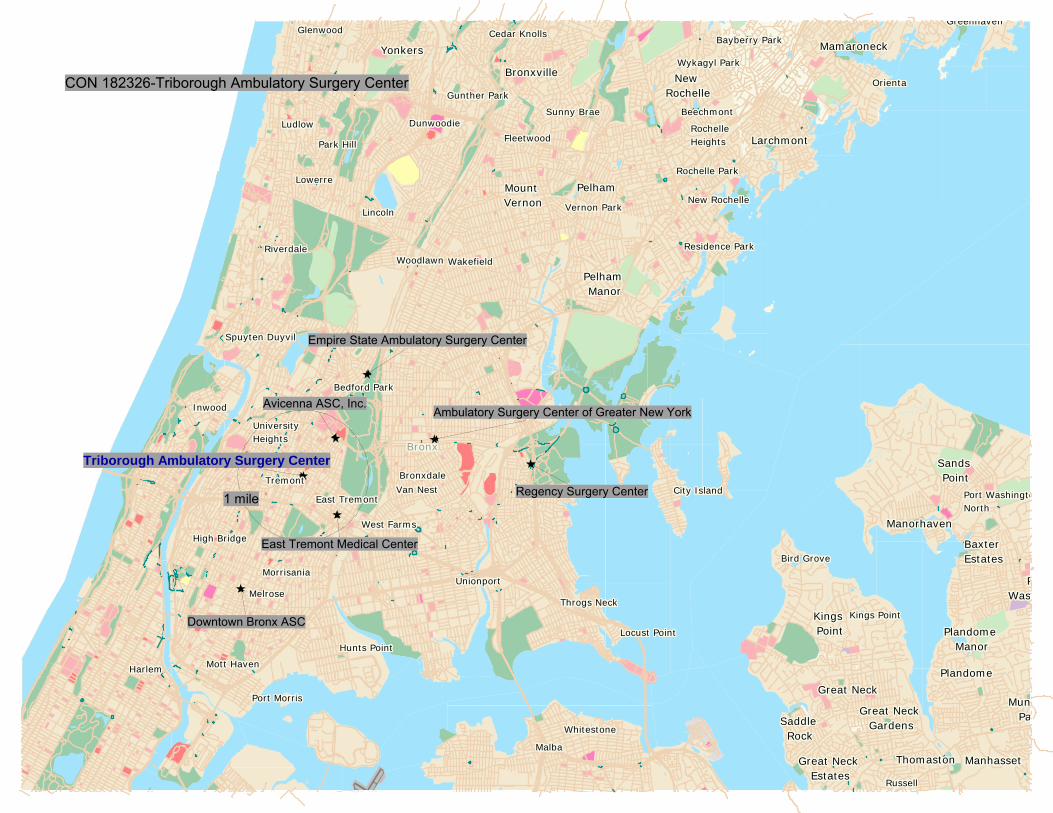
1 mile
CON 182326-Triborough Ambulatory Surgery Center
Van NestVan NestVan NestVan NestVan NestVan NestVan NestVan NestVan NestVan NestVan NestVan NestVan NestVan NestVan NestVan NestVan NestVan NestVan NestVan NestVan NestVan NestVan NestVan NestVan NestVan NestVan NestVan NestVan NestVan NestVan NestVan NestVan NestVan NestVan NestVan NestVan NestVan NestVan NestVan NestVan NestVan NestVan NestVan NestVan NestVan NestVan NestVan NestVan Nest
ManhattanManhattanManhattanManhattanManhattanManhattanManhattanManhattanManhattanManhattanManhattanManhattanManhattanManhattan
Downtown Bronx ASC
East Tremont Medical Center
Empire State Ambulatory Surgery Center
Avicenna ASC, Inc.
Triborough Ambulatory Surgery Center
Ambulatory Surgery Center of Greater New York
Regency Surgery Center
Baxter Baxter Baxter Baxter Baxter Baxter Baxter Baxter Baxter Baxter Baxter Baxter Baxter Baxter Baxter Baxter Baxter Baxter Baxter Baxter Baxter Baxter Baxter Baxter Baxter Baxter Baxter Baxter Baxter Baxter Baxter Baxter Baxter Baxter Baxter Baxter Baxter Baxter Baxter Baxter Baxter Baxter Baxter Baxter Baxter Baxter Baxter Baxter Baxter
EstatesEstatesEstatesEstatesEstatesEstatesEstatesEstatesEstatesEstatesEstatesEstatesEstatesEstatesEstatesEstatesEstatesEstatesEstatesEstatesEstatesEstatesEstatesEstatesEstatesEstatesEstatesEstatesEstatesEstatesEstatesEstatesEstatesEstatesEstatesEstatesEstatesEstatesEstatesEstatesEstatesEstatesEstatesEstatesEstatesEstatesEstatesEstatesEstates
Great NeckGreat NeckGreat NeckGreat NeckGreat NeckGreat NeckGreat NeckGreat NeckGreat NeckGreat NeckGreat NeckGreat NeckGreat NeckGreat NeckGreat NeckGreat NeckGreat NeckGreat NeckGreat NeckGreat NeckGreat NeckGreat NeckGreat NeckGreat NeckGreat NeckGreat NeckGreat NeckGreat NeckGreat NeckGreat NeckGreat NeckGreat NeckGreat NeckGreat NeckGreat NeckGreat NeckGreat NeckGreat NeckGreat NeckGreat NeckGreat NeckGreat NeckGreat NeckGreat NeckGreat NeckGreat NeckGreat NeckGreat NeckGreat Neck
Great Neck Great Neck Great Neck Great Neck Great Neck Great Neck Great Neck Great Neck Great Neck Great Neck Great Neck Great Neck Great Neck Great Neck Great Neck Great Neck Great Neck Great Neck Great Neck Great Neck Great Neck Great Neck Great Neck Great Neck Great Neck Great Neck Great Neck Great Neck Great Neck Great Neck Great Neck Great Neck Great Neck Great Neck Great Neck Great Neck Great Neck Great Neck Great Neck Great Neck Great Neck Great Neck Great Neck Great Neck Great Neck Great Neck Great Neck Great Neck Great Neck
EstatesEstatesEstatesEstatesEstatesEstatesEstatesEstatesEstatesEstatesEstatesEstatesEstatesEstatesEstatesEstatesEstatesEstatesEstatesEstatesEstatesEstatesEstatesEstatesEstatesEstatesEstatesEstatesEstatesEstatesEstatesEstatesEstatesEstatesEstatesEstatesEstatesEstatesEstatesEstatesEstatesEstatesEstatesEstatesEstatesEstatesEstatesEstatesEstates
Great Neck Great Neck Great Neck Great Neck Great Neck Great Neck Great Neck Great Neck Great Neck Great Neck Great Neck Great Neck Great Neck Great Neck Great Neck Great Neck Great Neck Great Neck Great Neck Great Neck Great Neck Great Neck Great Neck Great Neck Great Neck Great Neck Great Neck Great Neck Great Neck Great Neck Great Neck Great Neck Great Neck Great Neck Great Neck Great Neck Great Neck Great Neck Great Neck Great Neck Great Neck Great Neck Great Neck Great Neck Great Neck Great Neck Great Neck Great Neck Great Neck
GardensGardensGardensGardensGardensGardensGardensGardensGardensGardensGardensGardensGardensGardensGardensGardensGardensGardensGardensGardensGardensGardensGardensGardensGardensGardensGardensGardensGardensGardensGardensGardensGardensGardensGardensGardensGardensGardensGardensGardensGardensGardensGardensGardensGardensGardensGardensGardensGardens
Kings Kings Kings Kings Kings Kings Kings Kings Kings Kings Kings Kings Kings Kings Kings Kings Kings Kings Kings Kings Kings Kings Kings Kings Kings Kings Kings Kings Kings Kings Kings Kings Kings Kings Kings Kings Kings Kings Kings Kings Kings Kings Kings Kings Kings Kings Kings Kings Kings
PointPointPointPointPointPointPointPointPointPointPointPointPointPointPointPointPointPointPointPointPointPointPointPointPointPointPointPointPointPointPointPointPointPointPointPointPointPointPointPointPointPointPointPointPointPointPointPointPoint
ManhassetManhassetManhassetManhassetManhassetManhassetManhassetManhassetManhassetManhassetManhassetManhassetManhassetManhassetManhassetManhassetManhassetManhassetManhassetManhassetManhassetManhassetManhassetManhassetManhassetManhassetManhassetManhassetManhassetManhassetManhassetManhassetManhassetManhassetManhassetManhassetManhassetManhassetManhassetManhassetManhassetManhassetManhassetManhassetManhassetManhassetManhassetManhassetManhasset
ManorhavenManorhavenManorhavenManorhavenManorhavenManorhavenManorhavenManorhavenManorhavenManorhavenManorhavenManorhavenManorhavenManorhavenManorhavenManorhavenManorhavenManorhavenManorhavenManorhavenManorhavenManorhavenManorhavenManorhavenManorhavenManorhavenManorhavenManorhavenManorhavenManorhavenManorhavenManorhavenManorhavenManorhavenManorhavenManorhavenManorhavenManorhavenManorhavenManorhavenManorhavenManorhavenManorhavenManorhavenManorhavenManorhavenManorhavenManorhavenManorhaven
Munsey Munsey Munsey Munsey Munsey Munsey Munsey Munsey Munsey Munsey Munsey Munsey Munsey Munsey Munsey Munsey Munsey Munsey Munsey Munsey Munsey Munsey Munsey Munsey Munsey Munsey Munsey Munsey Munsey Munsey Munsey Munsey Munsey Munsey Munsey Munsey Munsey Munsey Munsey Munsey Munsey Munsey Munsey Munsey Munsey Munsey Munsey Munsey Munsey
ParkParkParkParkParkParkParkParkParkParkParkParkParkParkParkParkParkParkParkParkParkParkParkParkParkParkParkParkParkParkParkParkParkParkParkParkParkParkParkParkParkParkParkParkParkParkParkParkPark
North North North North North North North North North North North North North North
PlandomePlandomePlandomePlandomePlandomePlandomePlandomePlandomePlandomePlandomePlandomePlandomePlandomePlandomePlandomePlandomePlandomePlandomePlandomePlandomePlandomePlandomePlandomePlandomePlandomePlandomePlandomePlandomePlandomePlandomePlandomePlandomePlandomePlandomePlandomePlandomePlandomePlandomePlandomePlandomePlandomePlandomePlandomePlandomePlandomePlandomePlandomePlandomePlandome
Plandome Plandome Plandome Plandome Plandome Plandome Plandome Plandome Plandome Plandome Plandome Plandome Plandome Plandome Plandome Plandome Plandome Plandome Plandome Plandome Plandome Plandome Plandome Plandome Plandome Plandome Plandome Plandome Plandome Plandome Plandome Plandome Plandome Plandome Plandome Plandome Plandome Plandome Plandome Plandome Plandome Plandome Plandome Plandome Plandome Plandome Plandome Plandome Plandome
ManorManorManorManorManorManorManorManorManorManorManorManorManorManorManorManorManorManorManorManorManorManorManorManorManorManorManorManorManorManorManorManorManorManorManorManorManorManorManorManorManorManorManorManorManorManorManorManorManor
Port Port Port Port Port Port Port Port Port Port Port Port Port Port Port Port Port Port Port Port Port Port Port Port Port Port Port Port Port Port Port Port Port Port Port Port Port Port Port Port Port Port Port Port Port Port Port Port Port
WashingtonWashingtonWashingtonWashingtonWashingtonWashingtonWashingtonWashingtonWashingtonWashingtonWashingtonWashingtonWashingtonWashingtonWashingtonWashingtonWashingtonWashingtonWashingtonWashingtonWashingtonWashingtonWashingtonWashingtonWashingtonWashingtonWashingtonWashingtonWashingtonWashingtonWashingtonWashingtonWashingtonWashingtonWashingtonWashingtonWashingtonWashingtonWashingtonWashingtonWashingtonWashingtonWashingtonWashingtonWashingtonWashingtonWashingtonWashingtonWashington
Saddle Saddle Saddle Saddle Saddle Saddle Saddle Saddle Saddle Saddle Saddle Saddle Saddle Saddle Saddle Saddle Saddle Saddle Saddle Saddle Saddle Saddle Saddle Saddle Saddle Saddle Saddle Saddle Saddle Saddle Saddle Saddle Saddle Saddle Saddle Saddle Saddle Saddle Saddle Saddle Saddle Saddle Saddle Saddle Saddle Saddle Saddle Saddle Saddle
RockRockRockRockRockRockRockRockRockRockRockRockRockRockRockRockRockRockRockRockRockRockRockRockRockRockRockRockRockRockRockRockRockRockRockRockRockRockRockRockRockRockRockRockRockRockRockRockRock
Sands Sands Sands Sands Sands Sands Sands Sands Sands Sands Sands Sands Sands Sands Sands Sands Sands Sands Sands Sands Sands Sands Sands Sands Sands Sands Sands Sands Sands Sands Sands Sands Sands Sands Sands Sands Sands Sands Sands Sands Sands Sands Sands Sands Sands Sands Sands Sands Sands
PointPointPointPointPointPointPointPointPointPointPointPointPointPointPointPointPointPointPointPointPointPointPointPointPointPointPointPointPointPointPointPointPointPointPointPointPointPointPointPointPointPointPointPointPointPointPointPointPoint
ThomastonThomastonThomastonThomastonThomastonThomastonThomastonThomastonThomastonThomastonThomastonThomastonThomastonThomastonThomastonThomastonThomastonThomastonThomastonThomastonThomastonThomastonThomastonThomastonThomastonThomastonThomastonThomastonThomastonThomastonThomastonThomastonThomastonThomastonThomastonThomastonThomastonThomastonThomastonThomastonThomastonThomastonThomastonThomastonThomastonThomastonThomastonThomastonThomaston
BronxvilleBronxvilleBronxvilleBronxvilleBronxvilleBronxvilleBronxvilleBronxvilleBronxvilleBronxvilleBronxvilleBronxvilleBronxvilleBronxvilleBronxvilleBronxvilleBronxvilleBronxvilleBronxvilleBronxvilleBronxvilleBronxvilleBronxvilleBronxvilleBronxvilleBronxvilleBronxvilleBronxvilleBronxvilleBronxvilleBronxvilleBronxvilleBronxvilleBronxvilleBronxvilleBronxvilleBronxvilleBronxvilleBronxvilleBronxvilleBronxvilleBronxvilleBronxvilleBronxvilleBronxvilleBronxvilleBronxvilleBronxvilleBronxville
LarchmontLarchmontLarchmontLarchmontLarchmontLarchmontLarchmontLarchmontLarchmontLarchmontLarchmontLarchmontLarchmontLarchmontLarchmontLarchmontLarchmontLarchmontLarchmontLarchmontLarchmontLarchmontLarchmontLarchmontLarchmontLarchmontLarchmontLarchmontLarchmontLarchmontLarchmontLarchmontLarchmontLarchmontLarchmontLarchmontLarchmontLarchmontLarchmontLarchmontLarchmontLarchmontLarchmontLarchmontLarchmontLarchmontLarchmontLarchmontLarchmont
MamaroneckMamaroneckMamaroneckMamaroneckMamaroneckMamaroneckMamaroneckMamaroneckMamaroneckMamaroneckMamaroneckMamaroneckMamaroneckMamaroneckMamaroneckMamaroneckMamaroneckMamaroneckMamaroneckMamaroneckMamaroneckMamaroneckMamaroneckMamaroneckMamaroneckMamaroneckMamaroneckMamaroneckMamaroneckMamaroneckMamaroneckMamaroneckMamaroneckMamaroneckMamaroneckMamaroneckMamaroneckMamaroneckMamaroneckMamaroneckMamaroneckMamaroneckMamaroneckMamaroneckMamaroneckMamaroneckMamaroneckMamaroneckMamaroneck
Mount Mount Mount Mount Mount Mount Mount Mount Mount Mount Mount Mount Mount Mount Mount Mount Mount Mount Mount Mount Mount Mount Mount Mount Mount Mount Mount Mount Mount Mount Mount Mount Mount Mount Mount Mount Mount Mount Mount Mount Mount Mount Mount Mount Mount Mount Mount Mount Mount
VernonVernonVernonVernonVernonVernonVernonVernonVernonVernonVernonVernonVernonVernonVernonVernonVernonVernonVernonVernonVernonVernonVernonVernonVernonVernonVernonVernonVernonVernonVernonVernonVernonVernonVernonVernonVernonVernonVernonVernonVernonVernonVernonVernonVernonVernonVernonVernonVernon
New New New New New New New New New New New New New New New New New New New New New New New New New New New New New New New New New New New New New New New New New New New New New New New New New
RochelleRochelleRochelleRochelleRochelleRochelleRochelleRochelleRochelleRochelleRochelleRochelleRochelleRochelleRochelleRochelleRochelleRochelleRochelleRochelleRochelleRochelleRochelleRochelleRochelleRochelleRochelleRochelleRochelleRochelleRochelleRochelleRochelleRochelleRochelleRochelleRochelleRochelleRochelleRochelleRochelleRochelleRochelleRochelleRochelleRochelleRochelleRochelleRochelle
PelhamPelhamPelhamPelhamPelhamPelhamPelhamPelhamPelhamPelhamPelhamPelhamPelhamPelhamPelhamPelhamPelhamPelhamPelhamPelhamPelhamPelhamPelhamPelhamPelhamPelhamPelhamPelhamPelhamPelhamPelhamPelhamPelhamPelhamPelhamPelhamPelhamPelhamPelhamPelhamPelhamPelhamPelhamPelhamPelhamPelhamPelhamPelhamPelham
Pelham Pelham Pelham Pelham Pelham Pelham Pelham Pelham Pelham Pelham Pelham Pelham Pelham Pelham Pelham Pelham Pelham Pelham Pelham Pelham Pelham Pelham Pelham Pelham Pelham Pelham Pelham Pelham Pelham Pelham Pelham Pelham Pelham Pelham Pelham Pelham Pelham Pelham Pelham Pelham Pelham Pelham Pelham Pelham Pelham Pelham Pelham Pelham Pelham
ManorManorManorManorManorManorManorManorManorManorManorManorManorManorManorManorManorManorManorManorManorManorManorManorManorManorManorManorManorManorManorManorManorManorManorManorManorManorManorManorManorManorManorManorManorManorManorManorManor
YonkersYonkersYonkersYonkersYonkersYonkersYonkersYonkersYonkersYonkersYonkersYonkersYonkersYonkersYonkersYonkersYonkersYonkersYonkersYonkersYonkersYonkersYonkersYonkersYonkersYonkersYonkersYonkersYonkersYonkersYonkersYonkersYonkersYonkersYonkersYonkersYonkersYonkersYonkersYonkersYonkersYonkersYonkersYonkersYonkersYonkersYonkersYonkersYonkers
Port MorrisPort MorrisPort MorrisPort MorrisPort MorrisPort MorrisPort MorrisPort MorrisPort MorrisPort MorrisPort MorrisPort MorrisPort MorrisPort MorrisPort MorrisPort MorrisPort MorrisPort MorrisPort MorrisPort MorrisPort MorrisPort MorrisPort MorrisPort MorrisPort MorrisPort MorrisPort MorrisPort MorrisPort MorrisPort MorrisPort MorrisPort MorrisPort MorrisPort MorrisPort MorrisPort MorrisPort MorrisPort MorrisPort MorrisPort MorrisPort MorrisPort MorrisPort MorrisPort MorrisPort MorrisPort MorrisPort MorrisPort MorrisPort Morris
Spuyten DuyvilSpuyten DuyvilSpuyten DuyvilSpuyten DuyvilSpuyten DuyvilSpuyten DuyvilSpuyten DuyvilSpuyten DuyvilSpuyten DuyvilSpuyten DuyvilSpuyten DuyvilSpuyten DuyvilSpuyten DuyvilSpuyten DuyvilSpuyten DuyvilSpuyten DuyvilSpuyten DuyvilSpuyten DuyvilSpuyten DuyvilSpuyten DuyvilSpuyten DuyvilSpuyten DuyvilSpuyten DuyvilSpuyten DuyvilSpuyten DuyvilSpuyten DuyvilSpuyten DuyvilSpuyten DuyvilSpuyten DuyvilSpuyten DuyvilSpuyten DuyvilSpuyten DuyvilSpuyten DuyvilSpuyten DuyvilSpuyten DuyvilSpuyten DuyvilSpuyten DuyvilSpuyten DuyvilSpuyten DuyvilSpuyten DuyvilSpuyten DuyvilSpuyten DuyvilSpuyten DuyvilSpuyten DuyvilSpuyten DuyvilSpuyten DuyvilSpuyten DuyvilSpuyten DuyvilSpuyten Duyvil
TremontTremontTremontTremontTremontTremontTremontTremontTremontTremontTremontTremontTremontTremontTremontTremontTremontTremontTremontTremontTremontTremontTremontTremontTremontTremontTremontTremontTremontTremontTremontTremontTremontTremontTremontTremontTremontTremontTremontTremontTremontTremontTremontTremontTremontTremontTremontTremontTremont
University University University University University University University University University University University University University University University University University University University University University University University University University University University University University University University University University University University University University University University University University University University University University University University University University
HeightsHeightsHeightsHeightsHeightsHeightsHeightsHeightsHeightsHeightsHeightsHeightsHeightsHeightsHeightsHeightsHeightsHeightsHeightsHeightsHeightsHeightsHeightsHeightsHeightsHeightsHeightsHeightsHeightsHeightsHeightsHeightsHeightsHeightsHeightsHeightsHeightsHeightsHeightsHeightsHeightsHeightsHeightsHeightsHeightsHeightsHeightsHeightsHeights
RiverdaleRiverdaleRiverdaleRiverdaleRiverdaleRiverdaleRiverdaleRiverdaleRiverdaleRiverdaleRiverdaleRiverdaleRiverdaleRiverdaleRiverdaleRiverdaleRiverdaleRiverdaleRiverdaleRiverdaleRiverdaleRiverdaleRiverdaleRiverdaleRiverdaleRiverdaleRiverdaleRiverdaleRiverdaleRiverdaleRiverdaleRiverdaleRiverdaleRiverdaleRiverdaleRiverdaleRiverdaleRiverdaleRiverdaleRiverdaleRiverdaleRiverdaleRiverdaleRiverdaleRiverdaleRiverdaleRiverdaleRiverdaleRiverdale Residence ParkResidence ParkResidence ParkResidence ParkResidence ParkResidence ParkResidence ParkResidence ParkResidence ParkResidence ParkResidence ParkResidence ParkResidence ParkResidence ParkResidence ParkResidence ParkResidence ParkResidence ParkResidence ParkResidence ParkResidence ParkResidence ParkResidence ParkResidence ParkResidence ParkResidence ParkResidence ParkResidence ParkResidence ParkResidence ParkResidence ParkResidence ParkResidence ParkResidence ParkResidence ParkResidence ParkResidence ParkResidence ParkResidence ParkResidence ParkResidence ParkResidence ParkResidence ParkResidence ParkResidence ParkResidence ParkResidence ParkResidence ParkResidence Park
Throgs NeckThrogs NeckThrogs NeckThrogs NeckThrogs NeckThrogs NeckThrogs NeckThrogs NeckThrogs NeckThrogs NeckThrogs NeckThrogs NeckThrogs NeckThrogs NeckThrogs NeckThrogs NeckThrogs NeckThrogs NeckThrogs NeckThrogs NeckThrogs NeckThrogs NeckThrogs NeckThrogs NeckThrogs NeckThrogs NeckThrogs NeckThrogs NeckThrogs NeckThrogs NeckThrogs NeckThrogs NeckThrogs NeckThrogs NeckThrogs NeckThrogs NeckThrogs NeckThrogs NeckThrogs NeckThrogs NeckThrogs NeckThrogs NeckThrogs NeckThrogs NeckThrogs NeckThrogs NeckThrogs NeckThrogs NeckThrogs Neck
UnionportUnionportUnionportUnionportUnionportUnionportUnionportUnionportUnionportUnionportUnionportUnionportUnionportUnionportUnionportUnionportUnionportUnionportUnionportUnionportUnionportUnionportUnionportUnionportUnionportUnionportUnionportUnionportUnionportUnionportUnionportUnionportUnionportUnionportUnionportUnionportUnionportUnionportUnionportUnionportUnionportUnionportUnionportUnionportUnionportUnionportUnionportUnionportUnionport
Vernon ParkVernon ParkVernon ParkVernon ParkVernon ParkVernon ParkVernon ParkVernon ParkVernon ParkVernon ParkVernon ParkVernon ParkVernon ParkVernon ParkVernon ParkVernon ParkVernon ParkVernon ParkVernon ParkVernon ParkVernon ParkVernon ParkVernon ParkVernon ParkVernon ParkVernon ParkVernon ParkVernon ParkVernon ParkVernon ParkVernon ParkVernon ParkVernon ParkVernon ParkVernon ParkVernon ParkVernon ParkVernon ParkVernon ParkVernon ParkVernon ParkVernon ParkVernon ParkVernon ParkVernon ParkVernon ParkVernon ParkVernon ParkVernon Park
WakefieldWakefieldWakefieldWakefieldWakefieldWakefieldWakefieldWakefieldWakefieldWakefieldWakefieldWakefieldWakefieldWakefieldWakefieldWakefieldWakefieldWakefieldWakefieldWakefieldWakefieldWakefieldWakefieldWakefieldWakefieldWakefieldWakefieldWakefieldWakefieldWakefieldWakefieldWakefieldWakefieldWakefieldWakefieldWakefieldWakefieldWakefieldWakefieldWakefieldWakefieldWakefieldWakefieldWakefieldWakefieldWakefieldWakefieldWakefieldWakefield
West FarmsWest FarmsWest FarmsWest FarmsWest FarmsWest FarmsWest FarmsWest FarmsWest FarmsWest FarmsWest FarmsWest FarmsWest FarmsWest FarmsWest FarmsWest FarmsWest FarmsWest FarmsWest FarmsWest FarmsWest FarmsWest FarmsWest FarmsWest FarmsWest FarmsWest FarmsWest FarmsWest FarmsWest FarmsWest FarmsWest FarmsWest FarmsWest FarmsWest FarmsWest FarmsWest FarmsWest FarmsWest FarmsWest FarmsWest FarmsWest FarmsWest FarmsWest FarmsWest FarmsWest FarmsWest FarmsWest FarmsWest FarmsWest Farms
WhitestoneWhitestoneWhitestoneWhitestoneWhitestoneWhitestoneWhitestoneWhitestoneWhitestoneWhitestoneWhitestoneWhitestoneWhitestoneWhitestoneWhitestoneWhitestoneWhitestoneWhitestoneWhitestoneWhitestoneWhitestoneWhitestoneWhitestoneWhitestoneWhitestoneWhitestoneWhitestoneWhitestoneWhitestoneWhitestoneWhitestoneWhitestoneWhitestoneWhitestoneWhitestoneWhitestoneWhitestoneWhitestoneWhitestoneWhitestoneWhitestoneWhitestoneWhitestoneWhitestoneWhitestoneWhitestoneWhitestoneWhitestoneWhitestone
WoodlawnWoodlawnWoodlawnWoodlawnWoodlawnWoodlawnWoodlawnWoodlawnWoodlawnWoodlawnWoodlawnWoodlawnWoodlawnWoodlawnWoodlawnWoodlawnWoodlawnWoodlawnWoodlawnWoodlawnWoodlawnWoodlawnWoodlawnWoodlawnWoodlawnWoodlawnWoodlawnWoodlawnWoodlawnWoodlawnWoodlawnWoodlawnWoodlawnWoodlawnWoodlawnWoodlawnWoodlawnWoodlawnWoodlawnWoodlawnWoodlawnWoodlawnWoodlawnWoodlawnWoodlawnWoodlawnWoodlawnWoodlawnWoodlawn
Rochelle Rochelle Rochelle Rochelle Rochelle Rochelle Rochelle Rochelle Rochelle Rochelle Rochelle Rochelle Rochelle Rochelle Rochelle Rochelle Rochelle Rochelle Rochelle Rochelle Rochelle Rochelle Rochelle Rochelle Rochelle Rochelle Rochelle Rochelle Rochelle Rochelle Rochelle Rochelle Rochelle Rochelle Rochelle Rochelle Rochelle Rochelle Rochelle Rochelle Rochelle Rochelle Rochelle Rochelle Rochelle Rochelle Rochelle Rochelle Rochelle
HeightsHeightsHeightsHeightsHeightsHeightsHeightsHeightsHeightsHeightsHeightsHeightsHeightsHeightsHeightsHeightsHeightsHeightsHeightsHeightsHeightsHeightsHeightsHeightsHeightsHeightsHeightsHeightsHeightsHeightsHeightsHeightsHeightsHeightsHeightsHeightsHeightsHeightsHeightsHeightsHeightsHeightsHeightsHeightsHeightsHeightsHeightsHeightsHeights
Rochelle ParkRochelle ParkRochelle ParkRochelle ParkRochelle ParkRochelle ParkRochelle ParkRochelle ParkRochelle ParkRochelle ParkRochelle ParkRochelle ParkRochelle ParkRochelle ParkRochelle ParkRochelle ParkRochelle ParkRochelle ParkRochelle ParkRochelle ParkRochelle ParkRochelle ParkRochelle ParkRochelle ParkRochelle ParkRochelle ParkRochelle ParkRochelle ParkRochelle ParkRochelle ParkRochelle ParkRochelle ParkRochelle ParkRochelle ParkRochelle ParkRochelle ParkRochelle ParkRochelle ParkRochelle ParkRochelle ParkRochelle ParkRochelle ParkRochelle ParkRochelle ParkRochelle ParkRochelle ParkRochelle ParkRochelle ParkRochelle Park
Sunny BraeSunny BraeSunny BraeSunny BraeSunny BraeSunny BraeSunny BraeSunny BraeSunny BraeSunny BraeSunny BraeSunny BraeSunny BraeSunny BraeSunny BraeSunny BraeSunny BraeSunny BraeSunny BraeSunny BraeSunny BraeSunny BraeSunny BraeSunny BraeSunny BraeSunny BraeSunny BraeSunny BraeSunny BraeSunny BraeSunny BraeSunny BraeSunny BraeSunny BraeSunny BraeSunny BraeSunny BraeSunny BraeSunny BraeSunny BraeSunny BraeSunny BraeSunny BraeSunny BraeSunny BraeSunny BraeSunny BraeSunny BraeSunny Brae
Wykagyl ParkWykagyl ParkWykagyl ParkWykagyl ParkWykagyl ParkWykagyl ParkWykagyl ParkWykagyl ParkWykagyl ParkWykagyl ParkWykagyl ParkWykagyl ParkWykagyl ParkWykagyl ParkWykagyl ParkWykagyl ParkWykagyl ParkWykagyl ParkWykagyl ParkWykagyl ParkWykagyl ParkWykagyl ParkWykagyl ParkWykagyl ParkWykagyl ParkWykagyl ParkWykagyl ParkWykagyl ParkWykagyl ParkWykagyl ParkWykagyl ParkWykagyl ParkWykagyl ParkWykagyl ParkWykagyl ParkWykagyl ParkWykagyl ParkWykagyl ParkWykagyl ParkWykagyl ParkWykagyl ParkWykagyl ParkWykagyl ParkWykagyl ParkWykagyl ParkWykagyl ParkWykagyl ParkWykagyl ParkWykagyl Park
HarlemHarlemHarlemHarlemHarlemHarlemHarlemHarlemHarlemHarlemHarlemHarlemHarlemHarlemHarlemHarlemHarlemHarlemHarlemHarlemHarlemHarlemHarlemHarlemHarlemHarlemHarlemHarlemHarlemHarlemHarlemHarlemHarlemHarlemHarlemHarlemHarlemHarlemHarlemHarlemHarlemHarlemHarlemHarlemHarlemHarlemHarlemHarlemHarlemMott HavenMott HavenMott HavenMott HavenMott HavenMott HavenMott HavenMott HavenMott HavenMott HavenMott HavenMott HavenMott HavenMott HavenMott HavenMott HavenMott HavenMott HavenMott HavenMott HavenMott HavenMott HavenMott HavenMott HavenMott HavenMott HavenMott HavenMott HavenMott HavenMott HavenMott HavenMott HavenMott HavenMott HavenMott HavenMott HavenMott HavenMott HavenMott HavenMott HavenMott HavenMott HavenMott HavenMott HavenMott HavenMott HavenMott HavenMott HavenMott Haven
BronxdaleBronxdaleBronxdaleBronxdaleBronxdaleBronxdaleBronxdaleBronxdaleBronxdaleBronxdaleBronxdaleBronxdaleBronxdaleBronxdaleBronxdaleBronxdaleBronxdaleBronxdaleBronxdaleBronxdaleBronxdaleBronxdaleBronxdaleBronxdaleBronxdaleBronxdaleBronxdaleBronxdaleBronxdaleBronxdaleBronxdaleBronxdaleBronxdaleBronxdaleBronxdaleBronxdaleBronxdaleBronxdaleBronxdaleBronxdaleBronxdaleBronxdaleBronxdaleBronxdaleBronxdaleBronxdaleBronxdaleBronxdaleBronxdale
Bedford ParkBedford ParkBedford ParkBedford ParkBedford ParkBedford ParkBedford ParkBedford ParkBedford ParkBedford ParkBedford ParkBedford ParkBedford ParkBedford ParkBedford ParkBedford ParkBedford ParkBedford ParkBedford ParkBedford ParkBedford ParkBedford ParkBedford ParkBedford ParkBedford ParkBedford ParkBedford ParkBedford ParkBedford ParkBedford ParkBedford ParkBedford ParkBedford ParkBedford ParkBedford ParkBedford ParkBedford ParkBedford ParkBedford ParkBedford ParkBedford ParkBedford ParkBedford ParkBedford ParkBedford ParkBedford ParkBedford ParkBedford ParkBedford Park
High BridgeHigh BridgeHigh BridgeHigh BridgeHigh BridgeHigh BridgeHigh BridgeHigh BridgeHigh BridgeHigh BridgeHigh BridgeHigh BridgeHigh BridgeHigh BridgeHigh BridgeHigh BridgeHigh BridgeHigh BridgeHigh BridgeHigh BridgeHigh BridgeHigh BridgeHigh BridgeHigh BridgeHigh BridgeHigh BridgeHigh BridgeHigh BridgeHigh BridgeHigh BridgeHigh BridgeHigh BridgeHigh BridgeHigh BridgeHigh BridgeHigh BridgeHigh BridgeHigh BridgeHigh BridgeHigh BridgeHigh BridgeHigh BridgeHigh BridgeHigh BridgeHigh BridgeHigh BridgeHigh BridgeHigh BridgeHigh Bridge
InwoodInwoodInwoodInwoodInwoodInwoodInwoodInwoodInwoodInwoodInwoodInwoodInwoodInwoodInwoodInwoodInwoodInwoodInwoodInwoodInwoodInwoodInwoodInwoodInwoodInwoodInwoodInwoodInwoodInwoodInwoodInwoodInwoodInwoodInwoodInwoodInwoodInwoodInwoodInwoodInwoodInwoodInwoodInwoodInwoodInwoodInwoodInwoodInwood
LincolnLincolnLincolnLincolnLincolnLincolnLincolnLincolnLincolnLincolnLincolnLincolnLincolnLincolnLincolnLincolnLincolnLincolnLincolnLincolnLincolnLincolnLincolnLincolnLincolnLincolnLincolnLincolnLincolnLincolnLincolnLincolnLincolnLincolnLincolnLincolnLincolnLincolnLincolnLincolnLincolnLincolnLincolnLincolnLincolnLincolnLincolnLincolnLincoln
LowerreLowerreLowerreLowerreLowerreLowerreLowerreLowerreLowerreLowerreLowerreLowerreLowerreLowerreLowerreLowerreLowerreLowerreLowerreLowerreLowerreLowerreLowerreLowerreLowerreLowerreLowerreLowerreLowerreLowerreLowerreLowerreLowerreLowerreLowerreLowerreLowerreLowerreLowerreLowerreLowerreLowerreLowerreLowerreLowerreLowerreLowerreLowerreLowerre
LudlowLudlowLudlowLudlowLudlowLudlowLudlowLudlowLudlowLudlowLudlowLudlowLudlowLudlowLudlowLudlowLudlowLudlowLudlowLudlowLudlowLudlowLudlowLudlowLudlowLudlowLudlowLudlowLudlowLudlowLudlowLudlowLudlowLudlowLudlowLudlowLudlowLudlowLudlowLudlowLudlowLudlowLudlowLudlowLudlowLudlowLudlowLudlowLudlow
Park HillPark HillPark HillPark HillPark HillPark HillPark HillPark HillPark HillPark HillPark HillPark HillPark HillPark HillPark HillPark HillPark HillPark HillPark HillPark HillPark HillPark HillPark HillPark HillPark HillPark HillPark HillPark HillPark HillPark HillPark HillPark HillPark HillPark HillPark HillPark HillPark HillPark HillPark HillPark HillPark HillPark HillPark HillPark HillPark HillPark HillPark HillPark HillPark Hill
Gunther ParkGunther ParkGunther ParkGunther ParkGunther ParkGunther ParkGunther ParkGunther ParkGunther ParkGunther ParkGunther ParkGunther ParkGunther ParkGunther ParkGunther ParkGunther ParkGunther ParkGunther ParkGunther ParkGunther ParkGunther ParkGunther ParkGunther ParkGunther ParkGunther ParkGunther ParkGunther ParkGunther ParkGunther ParkGunther ParkGunther ParkGunther ParkGunther ParkGunther ParkGunther ParkGunther ParkGunther ParkGunther ParkGunther ParkGunther ParkGunther ParkGunther ParkGunther ParkGunther ParkGunther ParkGunther ParkGunther ParkGunther ParkGunther Park
Locust PointLocust PointLocust PointLocust PointLocust PointLocust PointLocust PointLocust PointLocust PointLocust PointLocust PointLocust PointLocust PointLocust PointLocust PointLocust PointLocust PointLocust PointLocust PointLocust PointLocust PointLocust PointLocust PointLocust PointLocust PointLocust PointLocust PointLocust PointLocust PointLocust PointLocust PointLocust PointLocust PointLocust PointLocust PointLocust PointLocust PointLocust PointLocust PointLocust PointLocust PointLocust PointLocust PointLocust PointLocust PointLocust PointLocust PointLocust PointLocust Point
Hunts PointHunts PointHunts PointHunts PointHunts PointHunts PointHunts PointHunts PointHunts PointHunts PointHunts PointHunts PointHunts PointHunts PointHunts PointHunts PointHunts PointHunts PointHunts PointHunts PointHunts PointHunts PointHunts PointHunts PointHunts PointHunts PointHunts PointHunts PointHunts PointHunts PointHunts PointHunts PointHunts PointHunts PointHunts PointHunts PointHunts PointHunts PointHunts PointHunts PointHunts PointHunts PointHunts PointHunts PointHunts PointHunts PointHunts PointHunts PointHunts Point
MalbaMalbaMalbaMalbaMalbaMalbaMalbaMalbaMalbaMalbaMalbaMalbaMalbaMalbaMalbaMalbaMalbaMalbaMalbaMalbaMalbaMalbaMalbaMalbaMalbaMalbaMalbaMalbaMalbaMalbaMalbaMalbaMalbaMalbaMalbaMalbaMalbaMalbaMalbaMalbaMalbaMalbaMalbaMalbaMalbaMalbaMalbaMalbaMalba
MelroseMelroseMelroseMelroseMelroseMelroseMelroseMelroseMelroseMelroseMelroseMelroseMelroseMelroseMelroseMelroseMelroseMelroseMelroseMelroseMelroseMelroseMelroseMelroseMelroseMelroseMelroseMelroseMelroseMelroseMelroseMelroseMelroseMelroseMelroseMelroseMelroseMelroseMelroseMelroseMelroseMelroseMelroseMelroseMelroseMelroseMelroseMelroseMelrose
MorrisaniaMorrisaniaMorrisaniaMorrisaniaMorrisaniaMorrisaniaMorrisaniaMorrisaniaMorrisaniaMorrisaniaMorrisaniaMorrisaniaMorrisaniaMorrisaniaMorrisaniaMorrisaniaMorrisaniaMorrisaniaMorrisaniaMorrisaniaMorrisaniaMorrisaniaMorrisaniaMorrisaniaMorrisaniaMorrisaniaMorrisaniaMorrisaniaMorrisaniaMorrisaniaMorrisaniaMorrisaniaMorrisaniaMorrisaniaMorrisaniaMorrisaniaMorrisaniaMorrisaniaMorrisaniaMorrisaniaMorrisaniaMorrisaniaMorrisaniaMorrisaniaMorrisaniaMorrisaniaMorrisaniaMorrisaniaMorrisania
BeechmontBeechmontBeechmontBeechmontBeechmontBeechmontBeechmontBeechmontBeechmontBeechmontBeechmontBeechmontBeechmontBeechmontBeechmontBeechmontBeechmontBeechmontBeechmontBeechmontBeechmontBeechmontBeechmontBeechmontBeechmontBeechmontBeechmontBeechmontBeechmontBeechmontBeechmontBeechmontBeechmontBeechmontBeechmontBeechmontBeechmontBeechmontBeechmontBeechmontBeechmontBeechmontBeechmontBeechmontBeechmontBeechmontBeechmontBeechmontBeechmont
Bayberry ParkBayberry ParkBayberry ParkBayberry ParkBayberry ParkBayberry ParkBayberry ParkBayberry ParkBayberry ParkBayberry ParkBayberry ParkBayberry ParkBayberry ParkBayberry ParkBayberry ParkBayberry ParkBayberry ParkBayberry ParkBayberry ParkBayberry ParkBayberry ParkBayberry ParkBayberry ParkBayberry ParkBayberry ParkBayberry ParkBayberry ParkBayberry ParkBayberry ParkBayberry ParkBayberry ParkBayberry ParkBayberry ParkBayberry ParkBayberry ParkBayberry ParkBayberry ParkBayberry ParkBayberry ParkBayberry ParkBayberry ParkBayberry ParkBayberry ParkBayberry ParkBayberry ParkBayberry ParkBayberry ParkBayberry ParkBayberry Park
OrientaOrientaOrientaOrientaOrientaOrientaOrientaOrientaOrientaOrientaOrientaOrientaOrientaOrientaOrientaOrientaOrientaOrientaOrientaOrientaOrientaOrientaOrientaOrientaOrientaOrientaOrientaOrientaOrientaOrientaOrientaOrientaOrientaOrientaOrientaOrientaOrientaOrientaOrientaOrientaOrientaOrientaOrientaOrientaOrientaOrientaOrientaOrientaOrienta
Cedar KnollsCedar KnollsCedar KnollsCedar KnollsCedar KnollsCedar KnollsCedar KnollsCedar KnollsCedar KnollsCedar KnollsCedar KnollsCedar KnollsCedar KnollsCedar KnollsCedar KnollsCedar KnollsCedar KnollsCedar KnollsCedar KnollsCedar KnollsCedar KnollsCedar KnollsCedar KnollsCedar KnollsCedar KnollsCedar KnollsCedar KnollsCedar KnollsCedar KnollsCedar KnollsCedar KnollsCedar KnollsCedar KnollsCedar KnollsCedar KnollsCedar KnollsCedar KnollsCedar KnollsCedar KnollsCedar KnollsCedar KnollsCedar KnollsCedar KnollsCedar KnollsCedar KnollsCedar KnollsCedar KnollsCedar KnollsCedar Knolls
DunwoodieDunwoodieDunwoodieDunwoodieDunwoodieDunwoodieDunwoodieDunwoodieDunwoodieDunwoodieDunwoodieDunwoodieDunwoodieDunwoodieDunwoodieDunwoodieDunwoodieDunwoodieDunwoodieDunwoodieDunwoodieDunwoodieDunwoodieDunwoodieDunwoodieDunwoodieDunwoodieDunwoodieDunwoodieDunwoodieDunwoodieDunwoodieDunwoodieDunwoodieDunwoodieDunwoodieDunwoodieDunwoodieDunwoodieDunwoodieDunwoodieDunwoodieDunwoodieDunwoodieDunwoodieDunwoodieDunwoodieDunwoodieDunwoodie
FleetwoodFleetwoodFleetwoodFleetwoodFleetwoodFleetwoodFleetwoodFleetwoodFleetwoodFleetwoodFleetwoodFleetwoodFleetwoodFleetwoodFleetwoodFleetwoodFleetwoodFleetwoodFleetwoodFleetwoodFleetwoodFleetwoodFleetwoodFleetwoodFleetwoodFleetwoodFleetwoodFleetwoodFleetwoodFleetwoodFleetwoodFleetwoodFleetwoodFleetwoodFleetwoodFleetwoodFleetwoodFleetwoodFleetwoodFleetwoodFleetwoodFleetwoodFleetwoodFleetwoodFleetwoodFleetwoodFleetwoodFleetwoodFleetwood
GlenwoodGlenwoodGlenwoodGlenwoodGlenwoodGlenwoodGlenwoodGlenwoodGlenwoodGlenwoodGlenwoodGlenwoodGlenwoodGlenwoodGlenwoodGlenwoodGlenwoodGlenwoodGlenwoodGlenwoodGlenwoodGlenwoodGlenwoodGlenwoodGlenwoodGlenwoodGlenwoodGlenwoodGlenwoodGlenwoodGlenwoodGlenwoodGlenwoodGlenwoodGlenwoodGlenwoodGlenwoodGlenwoodGlenwoodGlenwoodGlenwoodGlenwoodGlenwoodGlenwoodGlenwoodGlenwoodGlenwoodGlenwoodGlenwood
City IslandCity IslandCity IslandCity IslandCity IslandCity IslandCity IslandCity IslandCity IslandCity IslandCity IslandCity IslandCity IslandCity IslandCity IslandCity IslandCity IslandCity IslandCity IslandCity IslandCity IslandCity IslandCity IslandCity IslandCity IslandCity IslandCity IslandCity IslandCity IslandCity IslandCity IslandCity IslandCity IslandCity IslandCity IslandCity IslandCity IslandCity IslandCity IslandCity IslandCity IslandCity IslandCity IslandCity IslandCity IslandCity IslandCity IslandCity IslandCity IslandEast TremontEast TremontEast TremontEast TremontEast TremontEast TremontEast TremontEast TremontEast TremontEast TremontEast TremontEast TremontEast TremontEast TremontEast TremontEast TremontEast TremontEast TremontEast TremontEast TremontEast TremontEast TremontEast TremontEast TremontEast TremontEast TremontEast TremontEast TremontEast TremontEast TremontEast TremontEast TremontEast TremontEast TremontEast TremontEast TremontEast TremontEast TremontEast TremontEast TremontEast TremontEast TremontEast TremontEast TremontEast TremontEast TremontEast TremontEast TremontEast Tremont
New RochelleNew RochelleNew RochelleNew RochelleNew RochelleNew RochelleNew RochelleNew RochelleNew RochelleNew RochelleNew RochelleNew RochelleNew RochelleNew RochelleNew RochelleNew RochelleNew RochelleNew RochelleNew RochelleNew RochelleNew RochelleNew RochelleNew RochelleNew RochelleNew RochelleNew RochelleNew RochelleNew RochelleNew RochelleNew RochelleNew RochelleNew RochelleNew RochelleNew RochelleNew RochelleNew RochelleNew RochelleNew RochelleNew RochelleNew RochelleNew RochelleNew RochelleNew RochelleNew RochelleNew RochelleNew RochelleNew RochelleNew RochelleNew Rochelle
Russell Russell Russell Russell Russell Russell Russell Russell Russell Russell Russell Russell Russell Russell Russell Russell Russell Russell Russell Russell Russell Russell Russell Russell Russell Russell Russell Russell Russell Russell Russell Russell Russell Russell Russell Russell Russell Russell Russell Russell Russell Russell Russell Russell Russell Russell Russell Russell Russell
GardensGardensGardensGardensGardensGardensGardensGardensGardensGardensGardensGardensGardensGardensGardensGardensGardensGardensGardensGardensGardensGardensGardensGardensGardensGardensGardensGardens
Bird GroveBird GroveBird GroveBird GroveBird GroveBird GroveBird GroveBird GroveBird GroveBird GroveBird GroveBird GroveBird GroveBird GroveBird GroveBird GroveBird GroveBird GroveBird GroveBird GroveBird GroveBird GroveBird GroveBird GroveBird GroveBird GroveBird GroveBird GroveBird GroveBird GroveBird GroveBird GroveBird GroveBird GroveBird GroveBird GroveBird GroveBird GroveBird GroveBird GroveBird GroveBird GroveBird GroveBird GroveBird GroveBird GroveBird GroveBird GroveBird Grove
Port Washington Port Washington Port Washington Port Washington Port Washington Port Washington Port Washington Port Washington Port Washington Port Washington Port Washington Port Washington Port Washington Port Washington Port Washington Port Washington Port Washington Port Washington Port Washington Port Washington Port Washington Port Washington Port Washington Port Washington Port Washington Port Washington Port Washington Port Washington Port Washington Port Washington Port Washington Port Washington Port Washington Port Washington Port Washington Port Washington Port Washington Port Washington Port Washington Port Washington Port Washington Port Washington Port Washington Port Washington Port Washington Port Washington Port Washington Port Washington Port Washington
NorthNorthNorthNorthNorthNorthNorthNorthNorthNorthNorthNorthNorthNorthNorthNorthNorthNorthNorthNorthNorthNorthNorthNorthNorthNorthNorthNorthNorthNorthNorthNorthNorthNorthNorthNorthNorthNorthNorthNorthNorthNorthNorthNorthNorthNorthNorthNorthNorth
Kings PointKings PointKings PointKings PointKings PointKings PointKings PointKings PointKings PointKings PointKings PointKings PointKings PointKings PointKings PointKings PointKings PointKings PointKings PointKings PointKings PointKings PointKings PointKings PointKings PointKings PointKings PointKings PointKings PointKings PointKings PointKings PointKings PointKings PointKings PointKings PointKings PointKings PointKings PointKings PointKings PointKings PointKings PointKings PointKings PointKings PointKings PointKings PointKings Point
GreenhavenGreenhavenGreenhavenGreenhavenGreenhavenGreenhavenGreenhavenGreenhavenGreenhavenGreenhavenGreenhavenGreenhavenGreenhavenGreenhavenGreenhavenGreenhavenGreenhavenGreenhavenGreenhavenGreenhavenGreenhavenGreenhavenGreenhavenGreenhavenGreenhavenGreenhavenGreenhavenGreenhavenGreenhavenGreenhavenGreenhavenGreenhavenGreenhavenGreenhavenGreenhavenGreenhavenGreenhavenGreenhavenGreenhavenGreenhavenGreenhavenGreenhavenGreenhavenGreenhavenGreenhavenGreenhavenGreenhavenGreenhavenGreenhaven
BronxBronxBronxBronxBronxBronxBronxBronxBronxBronxBronxBronxBronxBronxBronxBronxBronxBronxBronxBronxBronxBronxBronxBronxBronxBronxBronxBronxBronxBronxBronxBronxBronxBronxBronxBronxBronxBronxBronxBronxBronxBronxBronxBronxBronxBronxBronxBronxBronx

Bronx SC, LLC
d/b/a Empire State Ambulatory Surgery Center Balance Sheets
December 31,
Assets
Current Assets
Cash and cash equivalents Accounts receivable, net of allowance for contractual
adjustments and uncollectible accounts: 2017 - $4,652,000; 2016- $4,274,000
Sales tax receivable Rebate receivable Prepaid expenses Supplies
Total Current Assets
Property, Equipment and Improvements
Equipment Furniture and fixtures Leasehold improvements
Total Accumulated depreciation
Net Property, Equipment and Improvements
Other Assets
Lease origination fees, net of accumulated am011ization: 2017 - $8,808; 2016 - $4,702
Deferred rental income Security deposits
Total Other Assets
Total Assets
$
$
2017
174,790
2,138,036
34,363 14,619
334,782
2,696,590
2,783,659 46,308
5,219,607 8,049,574
(2,212,230)
5,837,344
50,467 37,083
141,997
229,547
8,763,481
$
$
(RESTATED) 2016
260,068
1,685,338 61,517 19,995
9,009 351,583
2,387,510
2,769,290 46,308
5,219,607 8,035,205
(1,378,744)
6,656,461
54,573 29,797
141,997
226,367
9,270,338
BFA Attachment B - CON 191019

BFA Attachment B - CON 191019
(RESTATED) 2017 2016
Liabilities and Members' Equity
Current Liabilities
Bank loan, due on demand, net of unamortized debt issuance costs of $22, 199 $ 6,470,468 $
Accounts payable 876,473 676,201 Accrued expenses 345,542 327,444 Refunds payable 202,442 143,887 Current portion oflong-tenn debt, net of unamortized debt
issuance costs: 2016 - $8,265 418,084 Current portion of equipment payable 7,376 7,376 Insurance payable 5,687 3,439 Notes payable, members 440,854
Total Current Liabilities 7,907,988 2,017,285
Long-Term Liabilities
Long-term debt, net of current portion and unamortized debt issuance costs: 2017 - $0; 2016- $22,198 6,397,453
Equipment payable, net of current portion 20,284 27,660 Security deposit 12,650 12,650 Deferred rent 517,010 442,769
Total Long-Term Liabilities 549,944 6,880,532
Commitments and Contingencies (Note G)
Total Liabilities 8,457,932 8,897,817
Members' Equity 305,549 372,521
Total Liabilities and Members' Equity $ 8,763,481 $ 9,270,338
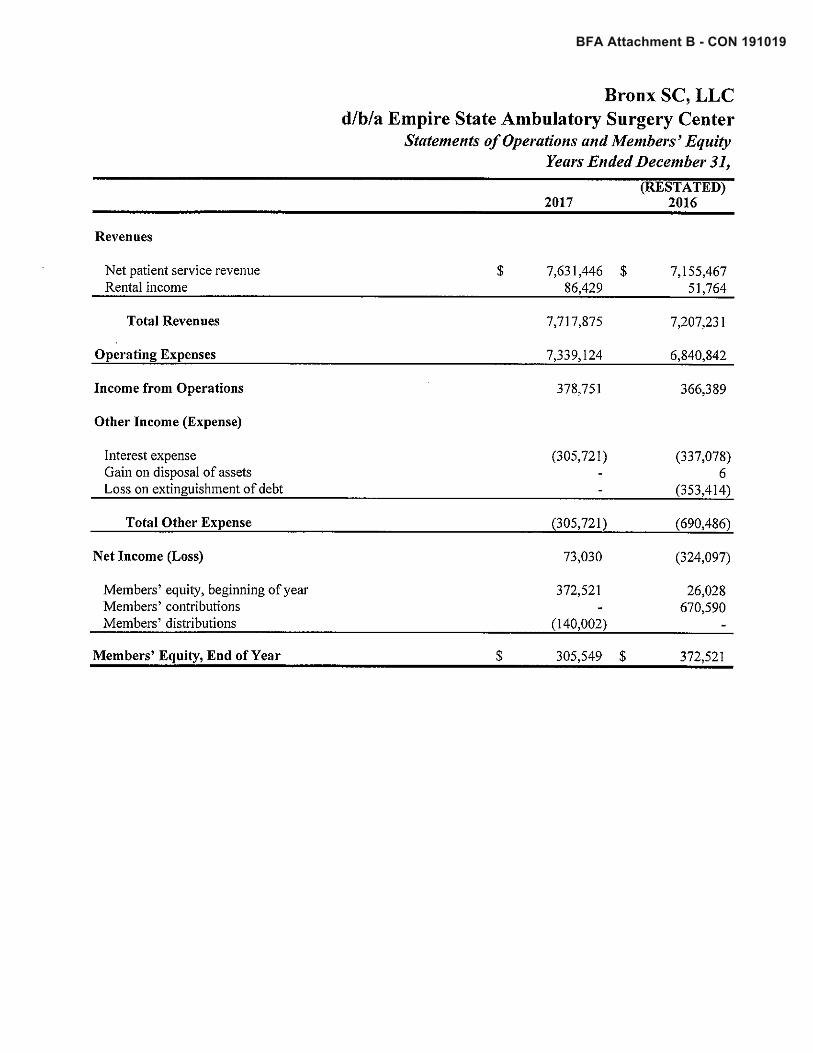
BFA Attachment B - CON 191019
Bronx SC, LLC d/b/a Empire State Ambulatory Surgery Center
Statements of Operations and Members' Equity Years Ended December 31,
(RESTATED) 2017 2016
Revenues
Net patient service revenue $ 7,631,446 $ 7,155,467 Rental income 86,429 51 ,764
Total Revenues 7,717,875 7,207,23 I
Operating Expenses 7,339,124 6,840,842
Income from Operations 378,751 366,389
Other Income (Expense)
Interest expense (305,721) (337,078) Gain on disposal of assets 6 Loss on extinguishment of debt (353,414)
Total Other Expense (305,721) (690,486)
Net Income (Loss) 73,030 (324,097)
Members' equity, beginning of year 372,521 26,028 Members' contributions 670,590 Members' distributions (140,002)
Members' Equity, End of Year $ 305,549 $ 372,521
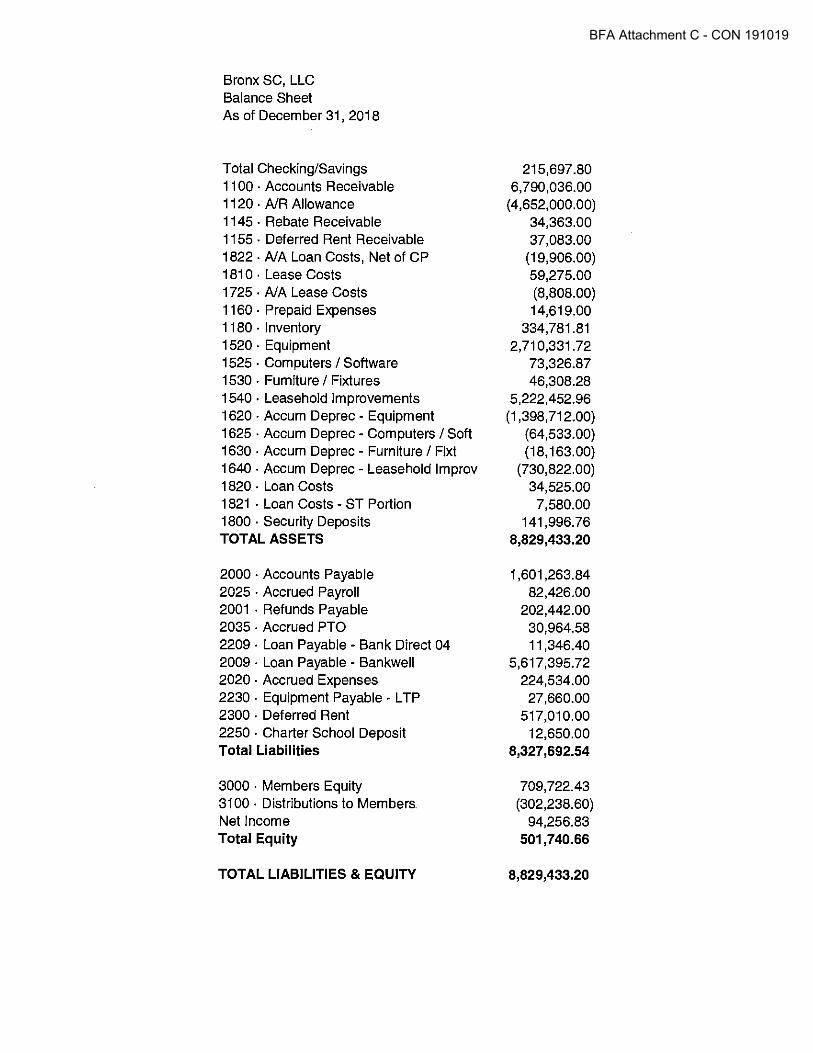
BFA Attachment C - CON 191019
Bronx SC, LLC Balance Sheet As of December 31, 2018
Total Checking/Savings 1100 • Accounts Receivable 1120 • AIR Allowance 1145 • Rebate Receivable 1155 • Deferred Rent Receivable 1822 • A/A Loan Costs, Net of CP 1 810 • Lease Costs 1725 • A/A Lease Costs 1160 • Prepaid Expenses 1180 • Inventory 1520 • Equipment 1525 • Computers/ Software 1530 • Furniture / Fixtures 1540 • Leasehold Improvements 1620 • Accum Depree - Equipment 1625 • Accum Depree - Computers/ Soft 1630 • Accum Depree - Furniture/ Fixt 1640 • Accum Depree - Leasehold lmprov 1 820 • Loan Costs 1821 • Loan Costs - ST Portion 1800 • Security Deposits TOTAL ASSETS
2000 • Accounts Payable 2025 • Accrued Payroll 2001 • Refunds Payable 2035 • Accrued PTO 2209 • Loan Payable - Bank Direct 04 2009 • Loan Payable - Bankwell 2020 • Accrued Expenses 2230 • Equipment Payable - L TP 2300 . Deferred Rent 2250 • Charter School Deposit Total Liabilities
3000 • Members Equity 3100 • Distributions to Members. Net Income Total Equity
TOTAL LIABILITIES & EQUITY
215,697.80 6,790,036.00
(4,652,000.00) 34,363.00 37,083.00
(19,906.00) 59,275.00 (8,808.00) 14,619.00
334,781.81 2,710,331.72
73,326.87 46,308.28
5,222,452.96 (1,398,712.00)
(64,533.00) (18,163.00)
(730,822.00) 34,525.00 7,580.00
141,996.76 8,829,433.20
1,601,263.84 82,426.00
202,442.00 30,964.58 11,346.40
5,617,395.72 224,534.00
27,660.00 517,010.00
12,650.00 8,327,692.54
709,722.43 (302,238.60)
94,256.83 501,740.66
8,829,433.20

BF
A A
ttach
men
t C -
CO
N 1
9101
9
Bronx SC, LLC Profit & Loss January through December 2018
Jan 18 Feb 18 Mar18 Apr18 May18 Jun 18 Jul18 Aug 18 Sep 18 Oct 18 Nov 18 Dec 18 TOTAL
4310 • Sublease Revenue 6,613 6,613 6,613 6,613 6,613 13,226 6,613 6,613 19,988 79,503 4000 - Facility Fees 681,046 515,952 598,658 589,508 665,839 622,004 549,313 515,298 662,168 710,429 724,262 607,412 7,441,888 4300 . Income Miscellaneous 575 150 460 600 150 300 600 450 300 150 3,735 4400 • Refunds 20 (5,737) (2,658) (8,375) Total Income 688,254 516,978 605,731 596,721 672,601 635,530 549,913 519,703 668,780 730,716 724,412 607,412 7,516,751
6110 • Anesthesia 35,000 35,000 35,000 35,000 35,000 35,000 35,000 35,000 280,000 5005 . Medical Supplies 192,890 194,533 211,917 128,158 159,823 155,701 171,007 209,581 139,917 198,663 201,576 150,433 2,114,200 6000 • Wages & Benefits 170,060 185,436 272,323 195,971 184,460 181,700 171,144 270,011 183,639 176,630 201,567 219,630 2,412,571 6100 • Accounting 12,188 9,500 4,100 27,771 53,559 6140 • Bank Charges 586 1,185 1,032 643 489 710 909 502 972 858 792 1,118 9,797 6160 . Billing Charges 5,666 6,450 6,045 6,464 5,111 7,027 5,938 5,576 5,931 6,812 4,909 10,750 76,678 6200 • Cleaning I Janitorial Services 6,895 9,590 7,125 6,425 4,913 7,140 6,920 7,205 6,145 6,625 9,610 4,375 82,967 6220 . Consultants 1,225 3,716 1,578 1,768 1,750 947 1,717 804 1,750 1,434 750 17,436 6300 • Education I Seminars 1,267 795 509 1,034 29 220 1,673 482 2,390 8,398 6380 • Equipment Rental (34,363) 36,653 36,653 (25,750) 36,653 44,736 94,581 6400 • Equipment Maintenance / Repair 6,230 2,678 3,855 1,206 1,628 196 163 950 9,822 4,916 2,299 33,944 6420 • Building Maintenance / Repair 24,981 1,143 3,718 2,121 1,143 327 817 2,139 3,351 794 2,132 4,835 47,502 6450 . Insurance - Liability 50 105,088 14,543 2,447 (25) 122,103 6500 . Interest Expense 23,057 22,782 20,349 22,602 21,635 22,038 21,084 21,228 20,978 20,050 20,455 23,097 259,356 6580 • Legal & Professional 174,234 5,968 5,365 4,380 14,716 23,270 20,072 12,226 6,654 266,884 6600 . Licenses & Permits 775 13,690 2,094 860 479 25 725 18,648 6620 • Management Fee Expense 25,000 25,000 25,000 25,000 25,000 25,000 25,000 25,000 25,000 25,000 25,000 25,000 300,000 6660 • Office Supply & Expense 7,653 9,831 6,747 8,971 6,349 6,295 4,900 5,337 4,864 4,474 5,549 8,630 79,600 67 40 • Printing 1,956 990 2,566 432 131 6,075 6760 . Rent - Real Estate 43,837 43,837 43,837 43,837 43,837 43,837 43,837 43,837 43,837 43,837 43,837 44,714 526,925 6800 • Security 895 895 6820 . Service / Maintenance Contracts 9,220 4,023 4,098 8,287 16,096 4,938 3,487 6,387 3,621 7,258 18,186 2,359 87,961 6870 • Taxes - Other 1,849 8,039 1,751 2,872 1,637 1,125 2,031 9,539 3,129 2,370 2,808 37,149 6880 - Telephone 2,049 2,055 2,055 2,048 2,045 2,086 3,078 1,111 2,064 2,070 2,069 2,076 24,806 6900 . Transportation - Patient 9,230 16,245 16,375 21,590 17,715 23,160 20,350 25,823 17,570 19,290 22,660 16,755 226,763 6920 • Travel 1,049 688 525 1,387 1,004 4,653 6980 . Uniforms / Linens 5,064 6,826 4,530 5,778 4,434 5,701 4,968 4,475 4,358 5,049 4,476 4,929 60,589 6990 . Utilities 11,751 4,383 23,031 13,320 14,746 14,588 15,150 15,447 14,213 17,165 12,483 12,178 168,454 Total Expense 705,294 592,530 777,276 525,538 595,633 542,619 511,738 733,726 546,969 605,730 676,917 608,525 7,422,494
Net Ordinary Income (17,040) (75,552) (171,544) 71,183 76,968 92,911 38,174 (214,023) 121,811 124,987 47,495 (1,113) 94,257

BFA Attachment D - CON 191019
Pro Forma Balance Sheet (AS OF APPROVAL DATE)
Total Checking/Savings 1100 · Accounts Receivable 1120 · NRAllowance 1155 · Deferred Rent Receivable 1822 · NA Loan Costs, Net of CP 1140 · Sales Tax Receivable 1810 · Lease Costs 1725 · AJA Lease Costs 1160 · Prepaid Expenses 1180 · Inventory 1520 · Equipment 1525 · Computers I Software 1530 · Furniture I Fixtures 1540 · Leasehold Improvements 1620 · Accum Depree - Equipment 1625 · Accum Depree - Computers/ So: 1630 · Accum Depree - Furniture / Fixt 1640 • Accum Depree• Leasehold lmprc 1820 · Loan Costs 1821 • Loan Costs - ST Portion 1800 · Security Deposits TOTAL ASSETS
2000 · Accounts Payable 2025 · Accrued Payroll 2001 · Refunds Payable 2035 · Accrued PTO 2209 · Loan Payable• Bank Direct 04 2009 · Loan Payable• Bankwell 2020 · Accrued Expenses 2300 · Deferred Rent 2250 · Charter School Deposit Total Liabilities
3000 · Members Equity 3100 · Distributions to Members 3900 · Retained Earnings Net Income Total Equity
TOTAL LIABILITIES & EQUITY
197,035 5,863,119
(4,136,000) 37,083
(12,327) 61,517 59,275 (8,808) 9,009
348,966 2,663,528
78,937 46,308
5,229.419 (1,372,162)
(64,533) (18,163)
(730,822) 34,525 8,265
141,997 8,436,168
1,314,377 72,421 57,931 30,965 49,308
5,912,998 73,939
517,010 12,650
8,041,599
3,902,07g (3,312,239)
(237,807) 42,535
394,569
8,436,168
This Pro Forma Balance Sheet is based on the Center's August 31, 2018 balance sheet. The Pro Forma Balance sheet does not include the cash that will be paid to the Center by Surglcore 5th Avenue LLC for the purchase of Its 70% membership interest. Although the purchase price will be initially paid to the Center,
the Center will Immediately distribute these proceeds to the selling membens pro-rata, according to the selling percentages set forth in Exhibit A of the Company Interest Purchase Agreement.

CON 191027 BFA Attachment B
NYEEQASC, LLC d/b/a North Queens Surgical Center
Balance Sheets December 31, (RESTATED)
2017 2016
Assets
Current Assets
Cash and cash equivalents $ 113,303 $ 233,253 Accounts receivable, net of allowance for contractual
adjustments and uncollectible accounts: 2017 - $6,620,000; 2016 - $9,248,000 2,335,836 2,621,171
Prepaid expenses 10,565 10,062 Supplies 329,945 336,171 Rebate receivable 15,730
Total Current Assets 2,805,379 3,200,657
Property, Equipment and Improvements
Equipment 3,387,328 3,311,173 Furniture and fixtures 34,136 34,136 Leasehold improvements 5,380,475 5,376,175
Total 8,801,939 8,721,484 Accumulated depreciation (2,482,992) (1,535,715)
Net Property, Equipment and Improvements 6,318,947 7,185,769
Other Assets
Lease costs, net of accumulated am01tization: 2017 - $4,063; 2016 - $2,813 20,937 22,187
Security deposits 4,080 4,080
Total Other Assets 25,017 26,267
Total Assets $ 9,149,343 $ 10,412,693
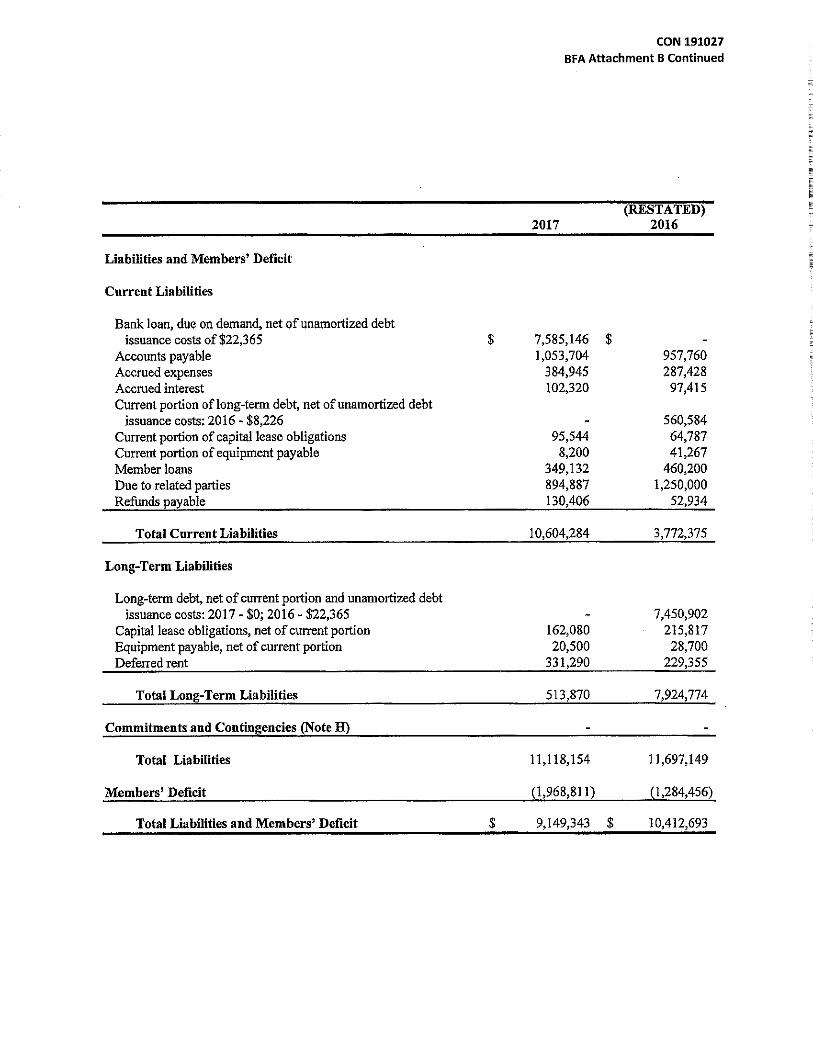
CON 191027 BFA Attachment B Continued
§'.-
" C
·-~ C
~ (RESTATED) f;;-;
2017 2016
Liabilities and Members' Deficit ~
Current Liabilities
Bank loan, due on demand, net of unamortized debt issuance costs of $22,365 $ 7,585,146 $
-
Accounts payable 1,053,704 957,760 Accrued expenses 384,945 287,428 Accrued interest 102,320 97,415 Current portion of long-term debt, net ofunamortized debt
issuance costs: 2016 - $8,226 560,584 Current portion of capital lease obligations 95,544 64,787 Current portion of equipment payable 8,200 41,267 Member loans 349,132 460,200 Due to related parties 894,887 1,250,000 Refunds payable 130,406 52,934
Total Current Liabilities 10,604,284 3,772,375
Long-Term Liabilities
Long-term debt, net of current portion and unamortized debt issuance costs: 2017 -$0; 2016 - $22,365 7,450,902
Capital lease obligations, net of current portion 162,080 215,817 Equipment payable, net of current portion 20,500 28,700 Deferred rent 331,290 229,355
Total Long-Term Liabilities 513,870 7,924,774
Commitments and Contingencies (Note H)
Total Liabilities 11,118,154 11,697,149
Members' Deficit (1,968,81 I) (1,284,456)
Total Liabilities and Members' Deficit $ 9,149,343 $ 10,412,693
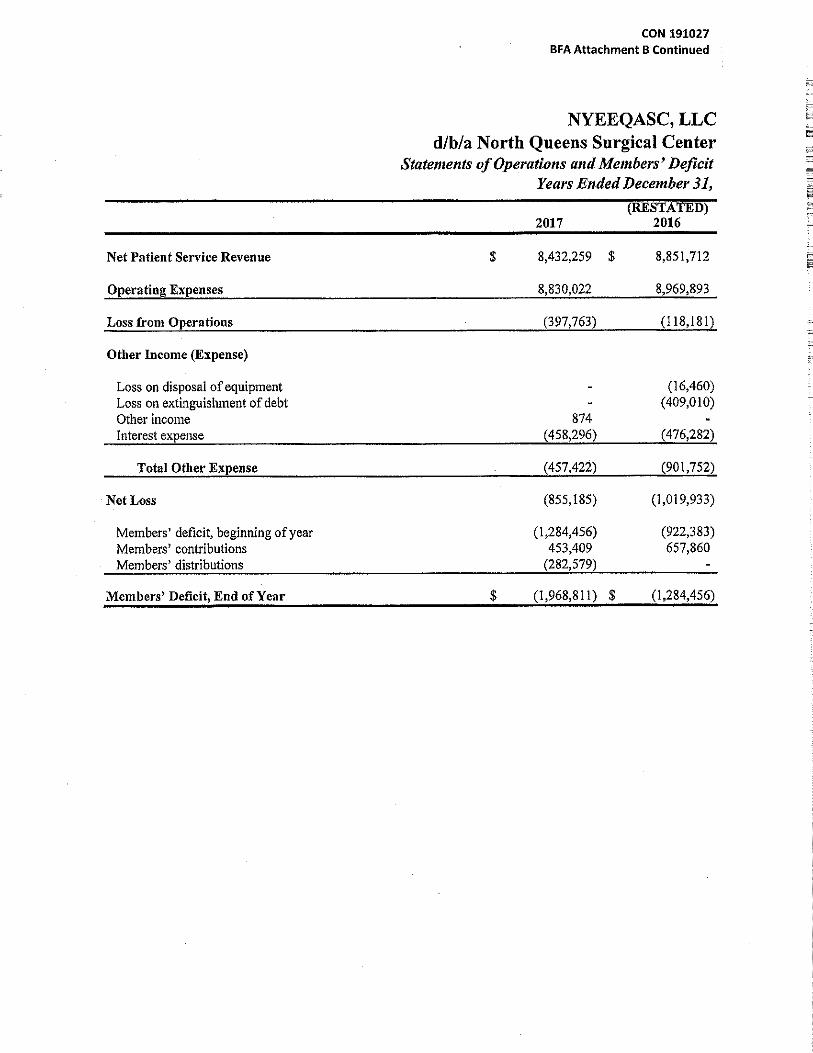
CON 191027 BFA Attachment B Continued
~
NYEEQASC, LLC ~
d/b/a North Queens Surgical Center ~
~
Stateme/lts of Operations and Members' Deficit z-_:
~ Years Ended December 31, cc
~ (RESTATED) E'
2017 2016
Net Patient Service Revenue $ 8,432,259 $ 8,851,712 ~
~
Operating Expenses 8,830,022 8,969,893
Loss from Operations (397,763) (118,181) E.
-Other Income (Expense)
Loss on disposal of equipment (16,460) Loss on extinguishment of debt (409,010) Other income 874 Interest expense (458,296) (476,282)
Total Otlter Expense (457,422) (901,752)
Net Loss (855,185) (1,019,933)
Members' deficit, beginning of year (1,284,456) (922,383) Members' contributions 453,409 657,860 Members' distributions (282,579)
Members' Deficit, End of Year $ (1,968,811) $ (1,284,456)

CON 191027 BFA Attachment C
North Queens Surgical Center !?'--
Balance Sheet ~
As of December 31, 2018 • Internally Prepared - Not GAAP --
~ C
Total Checking/Savings 146,493.53 ~ 1100 · Accounts Receivable 11,869,171.00 ~
1120 • AIR Allowance (9,248,000.00) 1155 · Security Deposit - Con Edison 3,930.00 1160 · Prepaid Expenses 10,565.00
-
1180 · Inventory 329,945.42 1520 • Equipment 3,303,431.31 1525 · Computers / Software 249,812.05 1530 · Furniture/ Fixtures 36,367.48
-
1540 · Leasehold Improvements 5,380,053.54 1620 · Accurn Depree - Equipment (1,594,866.00) 1625 • Accurn Depree - Computers/ Soft (135,470.00) 1630 · Accum Depree - Furniture/ Fixt (13,412.00) 1640 · Accum Depree - Leasehold lmprov (739,244.00) 1820 · Loan Costs 69,230.00 1821 · Loan Costs-ST Portion 7,608.00 1822 · A/A Loan Costs, Net of CP (19,858.00} 1825 · Lease Costs 25,000.00 1830 ·A/A-Lease Costs (4,063.00) 1800 · Security Deposits 150.00 TOTAL ASSETS 9,676,844.33
2000 · Accounts Payable 2,269,225.51 2224 · Bankwell-CP 1,009,029.00 2002 · Refunds Payable 52,934.00 2236 • Alcon Centurion 2014 - CP 8,200.00 2350 · Accrued PTO 35,309.00 2340 • Accrued Payroll 50,981.00 2203 • Bankwell Loan 5,458,114.78 .,,, 2020 • Accrued Expenses 298,655.00 2217 · Storz ENT equipment lease 91,131.25 2216 • Lease Payable - Podiatry 42,203.72 2260 • GE C-Arm Lease 15,561.71 2300 · Deferred Rent 331,290.00 2006 · Centurion Payable 2014 20,500.00 2215 • Lease Payable - Everbank 28,989.30 .
2205 · Lease Payable - Alcon 128,161.62 2210 · Loan Payable - Partners 1,281,872.78 2065 · Loan Payable - BankDirect 4,991.32 2255 • Loan Payable - PeoplesBank 129,070.44 Total Liabilities 11,256,220.43
3000 · Members Equity (1,980,562.66) 3100 • Distributions to Members (29,607.23) 3900 • Retained Earnings 387,596.55 Net Income 43,197.24 Total Equity (1,579,376.10)
TOTAL LIABILITIES & EQUITY 9,676,844.33

North Queens Surgical Center P(0flt& Loss January through December 2018 Internally Prepared• Not GAAP Jan 18 Feb 18 Mat1& Apr18 May1~ Jun18 Jut18 Aug 18 Sep 18- Oct 18 Nov18 Dec18 TOTAL
4000 • Facmty Fees 609,737 571,492 754,350 710,819 711,389 644,907 731,155 698,668 688,461 769,438 847,972 671,118 8,409,505 4300 · Income Miscellaneous 1 1 1 4400 • Refunds (9,632) (13,384) (11,115) (12,145) 17,031) {16,956) (9,545) (11,576) {9,151) (4,000) (10,164) (7,435) (122,134) Total lnc:ame 600,104 568,109 743,235 698,674 704,358 627,951 721,610 687,092 679,310 765.438 637,808 663,683 8,287,372
6130 • Anesthesia Stipend 30,000 15,000 15,000 15,000 15,000 30,000 120,000 5005 · Medfcal Supplies 176,370 115,553 230,140 155,136 175,885 192,677 176,110 237,605 188,269 210,704 154,356 85,639 2,098,444 5020 • Pa.Uent Costs Other 603 528 650 581 . 2,372 6000 • Wages & Benefits 213,596 257,918 231,816 237,451 347,935 238,429 235,788 255,277 250,461 246,829 355,925 270,869 3,153,293 6100 • Accounting, 25,468 19,600 (86) . . 44,982 6120 · Advertising & Promotion (53) 726 1,650 85B 1,705 335 9B2 424 . 6,526 6140 • Bank Charges 131 672 187 184 174 1,816 1,820 1,512 306 638 7,441 6160 · BUling Charges 18,854 11,906 10,574 9,426 11,055 23,700 12,622 12,963 17,523 4,189 4,443 42,238 179,504 6200 · Cleaning / Janitorial Services 4,300 4.100 9.075 9,031 4,300 4,932 8,125 9,050 7,750 8,973 9.425 4,300 B3,360 6220 · Consultants 3,330 6,869 4.538 3,450 6,252 BO 1.B95 2,116 474 2,303 206 275 31,568 6280 · Credit Card Processing Expense 2,636 2,005 2.0,9 1,467 (271) 2,148 10,004 6300 • Educatron / Seminars 295 99B 5,380 535 7,206 6340 • Entertainment I Meals 559 1B0 223 442 446 208 2,188 6380 • equipment Rental (60) 460 411 6400 · Equipment Maintenance/ Repair 28,894 21,751 5,368 6,550 4,342 3,025 20,908 4,841 4,337 152 100,168 6420 · Bullding Maintenance/ Repair 21.476 6,980 6,532 4,327 6,118 7,183 6,127 7,472 7,374 4,437 4,327 5,305 86,659 6450 · rnsurance • Uabl!ity 5,677 66,272 3,731 . 75,679 6480 · rnsurance • Other . 12 12 6600 • Interest Expense 34,907 33.344 31,927 32,464 46,657 48,735 31,791 32,796 33,762 31,282 30,739 23,208 411,613 6580 · Legal & Profe!;.Slonal 132.468 4,482 4,203 7,613 6,880 7,084 17,114 41,289 27,389 32,614 20,243 301,239 6600 • Ltcenses & Permits 200 731 231 . 1,162 6620 • Management Fee Expetlse 37,500 37,500 37,500 37,500 37,500 37,500 37,500 37,500 37,600 37,500 37,500 37,500 450,000 6660 • Offiee Supply & Expense 2,070 1,616 3,862 4,324 2,939 2,695 3,101 2,687 4,001 2,892 283 1,188 31,659 6720 • Postage & Delivery 1,122 1,730 1.424 928 989 1,398 980 1,105 542 1,082 500 11,801 6760 · Rent~ Real estate 41,250 41,250 41,250 41,250 41,250 41,260 41,250 41,260 41,250 41,250 41,250 41,250 495,004 6800 , Security . 1,995 1,996 S820 • Service I Maintenance Contracts 14,534 12,331 17,270 12,203 5,916 7,752 15,025 11,880 5,947 7,851 5,066 7,642 123,317 6860 · Taxes - Real Estate n,143 11,143 11,143 11,143 11,143 11,143 11,143 11,143 11,143 11,143 11,143 11,143 133,718 6870 ·Taxes• Other 4<10 366 13,497 488 367 895 1,354 583 788 1,038 1,584 1,193 22,633 6880 · Telephone 2,378 4,751 2,402 1,471 2,393 3,259 2,300 2,362 2,368 2,925 28,609
"' 6900 • Transportat!on • Patient 8,334 3,933 6,180 4,387 4,772 4,950 4,806 6,872 3,916 5,601 10,600 4,583 68,935 .., 6920 • Travel 5,265 1,289 576 579 557 494 1,019 423 10,203 l>
6980 • Unlform.s / Linens 4,443 5,049 2,490 4,394 4,885 4,071 4,139 4,079 4,832 . 38,381 1f: ~
6990 · Uti!illes 8,789 1,763 15,322 7,629 7,686 8,781 10,209 11,314 11,257 8,550 7,692 6,900 106,092 "' n Total Expen,e 80&,667 586,956 755,982 619,798 763,807 651,675 6-63,653 763t12J 676,893 679,988 709,575 576,057 6,244,175 ::r
3 Net Ordinary Income (206,563) {28,847) (12,747) 78,875 (59,449) (23,724) 57,957 (66,031) 2,416 85,449 128,234 87,626 43,197
II> :, ~
nn .-,o O 2
a to :, ... C: 0 II>"' a. ....
l'I-Wffll'l'<'""ll"1lll r,1F,H ..,,-1 •1•0- 'l
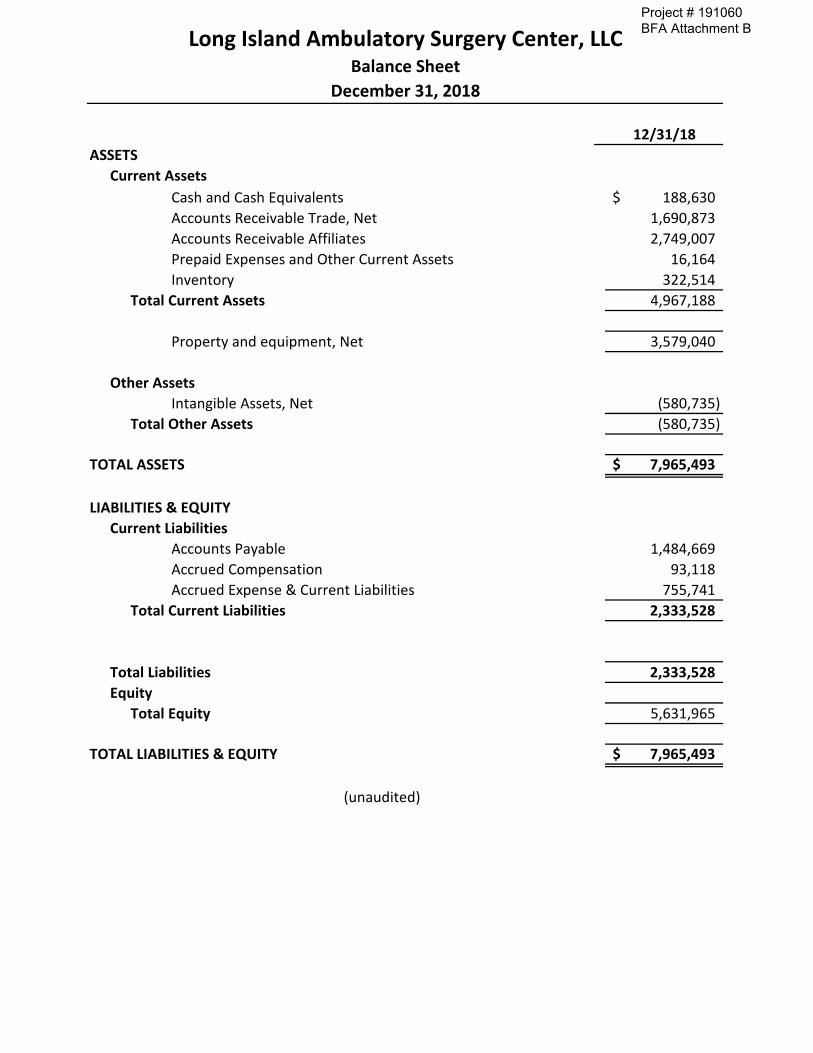
12/31/18ASSETS
Current AssetsCash and Cash Equivalents 188,630$ Accounts Receivable Trade, Net 1,690,873 Accounts Receivable Affiliates 2,749,007 Prepaid Expenses and Other Current Assets 16,164 Inventory 322,514
Total Current Assets 4,967,188
Property and equipment, Net 3,579,040
Other AssetsIntangible Assets, Net (580,735)
Total Other Assets (580,735)
TOTAL ASSETS 7,965,493$
LIABILITIES & EQUITYCurrent Liabilities
Accounts Payable 1,484,669 Accrued Compensation 93,118 Accrued Expense & Current Liabilities 755,741
Total Current Liabilities 2,333,528
Total Liabilities 2,333,528 Equity
Total Equity 5,631,965
TOTAL LIABILITIES & EQUITY 7,965,493$
(unaudited)
Long Island Ambulatory Surgery Center, LLCBalance Sheet
December 31, 2018
Project # 191060BFA Attachment B
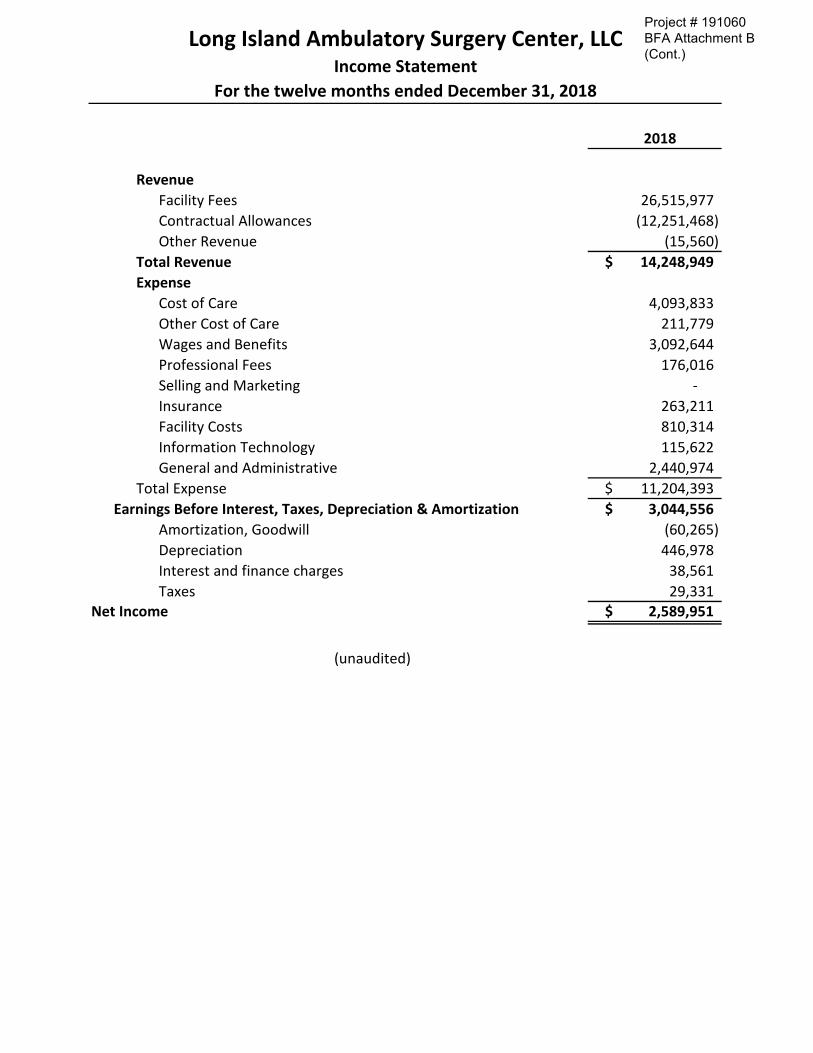
2018
RevenueFacility Fees 26,515,977 Contractual Allowances (12,251,468) Other Revenue (15,560)
Total Revenue 14,248,949$ Expense
Cost of Care 4,093,833 Other Cost of Care 211,779 Wages and Benefits 3,092,644 Professional Fees 176,016 Selling and Marketing - Insurance 263,211 Facility Costs 810,314 Information Technology 115,622 General and Administrative 2,440,974
Total Expense 11,204,393$ Earnings Before Interest, Taxes, Depreciation & Amortization 3,044,556$
Amortization, Goodwill (60,265) Depreciation 446,978 Interest and finance charges 38,561 Taxes 29,331
Net Income 2,589,951$
(unaudited)
Long Island Ambulatory Surgery Center, LLCIncome Statement
For the twelve months ended December 31, 2018
Project # 191060BFA Attachment B (Cont.)
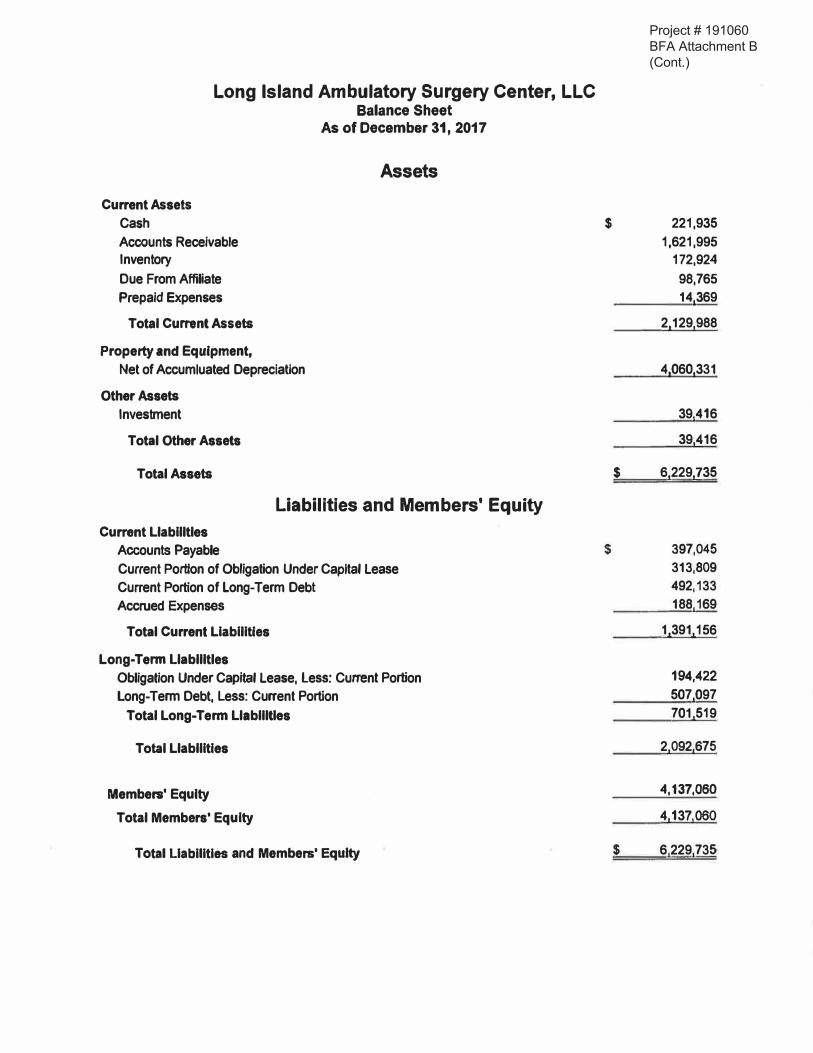
Long Island Ambulatory Surgery Center, LLC Balance Sheet
Current Assets
Cash
Accounts Receivable Inventory
Due From Affiliate
Prepaid Expenses
Total Current Assets
Property and Equipment,
As of December 31, 2017
Assets
Net of Accumluated Depreciation
Other Assets
Investment
Total Other Assets
Total Assets
Current Llabilltles
Accounts Payable
Liabilities and Members' Equity
Current Portion of Obligation Under Capital Lease
Current Portion of Long-Term Debt
Accrued Expenses
Total Current Liabilities
Long-Tenn Llabllltles
Obligation Under Capital Lease, Less: Current Portion
Long-Term Debt, Less: Current Portion
Total Long-Term Llabllltles
Total Llabllitles
Members' Equity
Total Members' Equity
Total Llabllltles and Members' Equity
$ 221,935
1,621,995 172,924
98,765
14.369
2,129,988
4,060.331
391416
39,416
$ 6,229i135
$ 397,045
313,809
492,133
188,169
1,3911156
194,422
507,097
701,519
2,092,675
4,137,060
4,1371060
$ 6,229,735·
Project # 191060BFA Attachment B (Cont.)
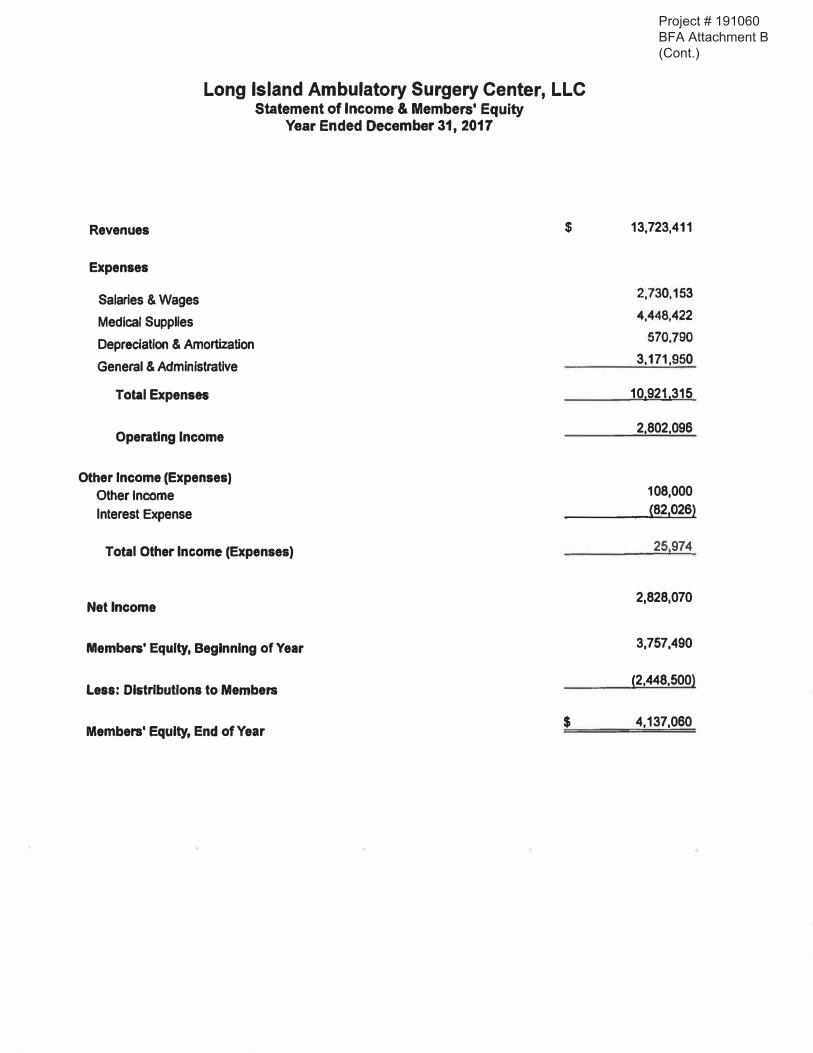
Long Island Ambulatory Surgery Center, LLC Statement of Income & Members' Equity
Year Ended December 31, 2017
Revenues
Expenses
Salaries & Wages
Medlcal Supplies
Depreciation & Amortization
General & Administrative
Total Expenses
OperaUng Income
Other Income (Expenses) Other Income
Interest Expense
Total Other Income (Expenses)
Net Income
Members' Equity, Beginning of Year
Less: Distributions to Members
Members' Equity, End of Year
$
$
13,723,411
2,730,153
4,448,422
570,790
3,171,950
10,921.315
2,802,096
108,000
(82,026)
25,974
2,828,070
3,757,490
(2,448,500)
4,137,060
Project # 191060BFA Attachment B (Cont.)

Long Island Ambulatory Surgery Center, LLC
Balance Sheet
Current Assets Cash Accounts Receivable Inventory
Due From Affiliate Prepaid Expenses
Total Current Assets
Property and Equipment,
As of December 31, 2016
Assets
Net of Accumluated Depreciation
Other Assets Investment
Total Other Assets
Total Assets
Current Liabllltles Accounts Payable
Liabilities and Members' Equity
Current Portion of Obligation Under Capital Lease Current Portion of Long-Term Debt Line of Credit Accrued Expenses
Total Current Llabllltles
Long-Term Llabllltles Obligation Under Capital Lease, Less: Current Portion Long-Term Debt, Less: Current Portion
Total Long-Tenn Liabilities
Total Liabllltles
Members' Equity
Total Members' Equity
Total Llabllltles and Members' Equity
$ 339,689
1,582,868 180,672
106,592
18,813
2,228,634
4,569,511
35,627
35,627
$ 6,833_772
$ 493,354
255,108
469,593
244,873
119,167
1,582,095
480,610
1.013,577
1,494,187
3,076,282
3i757.490
3,757.490
$ 6,833,772
Project # 191060BFA Attachment B (Cont.)

Long Island Ambulatory Surgery Center, LLC Statement of Income & Members' Equity
Revenues
Expenses
Salaries & Wages
Medical Supplies
Depreciation & Amortization
General & Administrative
Total Expenses
Operating Income
Other lncome/(Expenses) Other Income
Interest Expense
Year Ended December 31, 2016
Total Other Income/Expenses
Net Income
Members' Equity, Beginning of Year
Less: Distributions to Members
Members' Equity, End of Year
$
$
11,949,445
2,429,238
3,143,439
560,037
2,937,852
9,070,566
2,878,879
108,000 (98,808)
9,192
2,888,071
2,920,919
(2,051,500)
3,757,490
Project # 191060BFA Attachment B (Cont.)
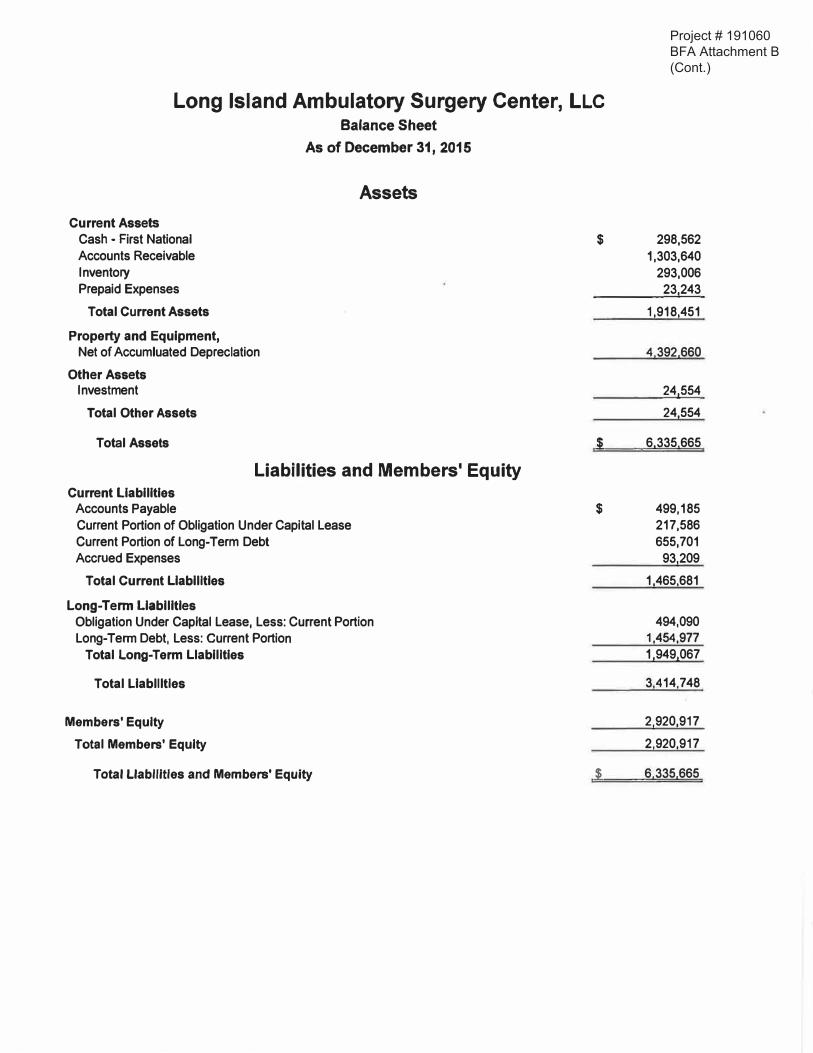
Long Island Ambulatory Surgery Center, LLC Balance Sheet
Current Assets Cash - First National Accounts Receivable Inventory Prepaid Expenses
Total Current Assets
Property and Equipment,
As of December 31, 2015
Assets
Net of Accumluated Depreciation
Other Assets Investment
Total Other Assets
Total Assets
Current Liabilities Accounts Payable
Liabilities and Members' Equity
Current Portion of Obligation Under Capital Lease Current Portion of Long-Term Debt Accrued Expenses
Total Current Llabllltles
Long-Term Llabllltles Obligation Under Capital Lease, Less: Current Portion Long-Term Debt, Less: Current Portion
Total Long-Term Llabillties
Total Llabllltles
Members' Equity
Total Members' Equity
Total Llabllltles and Members' Equity
$
$
$
$
298,562 1,303,640
293,006 23,243
1,918,451
4,392,660
24,554
24 554
6.335.665
499,185 217,586 655,701
93,209
1,465,681
494,090 1,454,977 1,949,067
3 414,748
2,920,917
2,920,917
6,335.665
Project # 191060BFA Attachment B (Cont.)
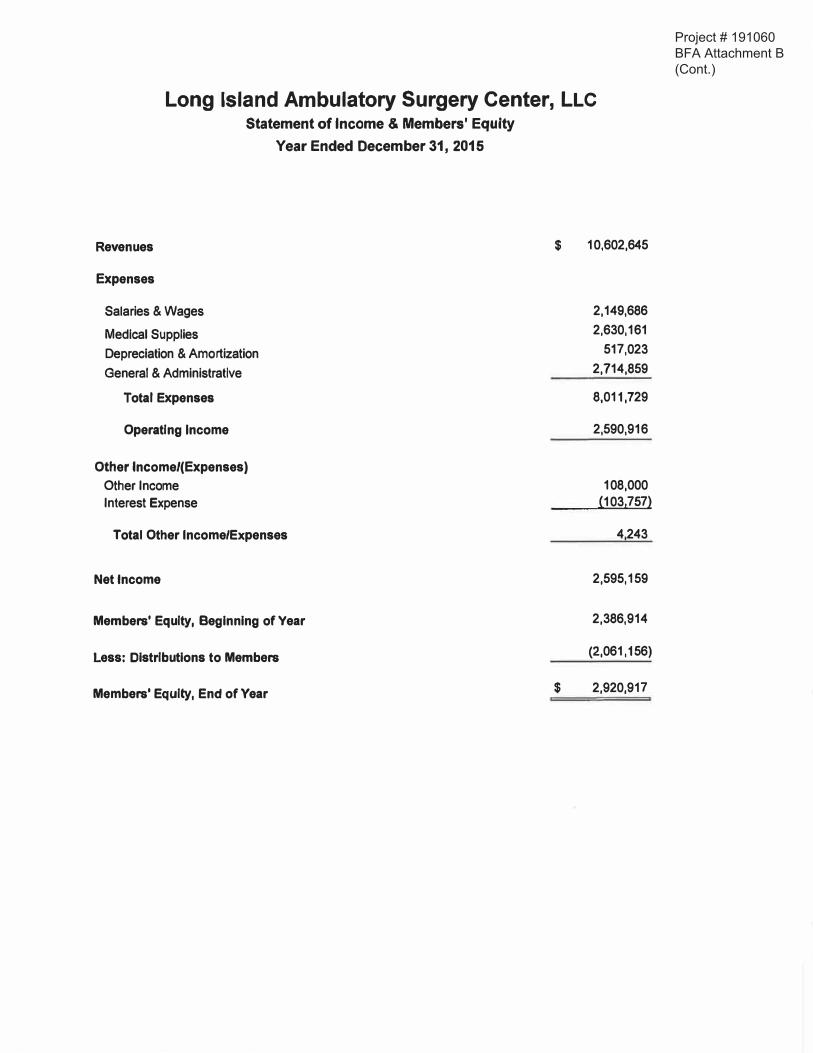
Long Island Ambulatory Surgery Center, LLC Statement of Income & Members' Equity
Year Ended December 31, 2015
Revenues
Expenses
Salaries & Wages
Medlcal Supplies
Depreciation & Amortization
General & Administrative
Total Expenses
Operating Income
Other lncome/(Expenses)
Other Income
Interest Expense
Total Other Income/Expenses
Net Income
Members' Equity, Beginning of Year
Less: Distributions to Members
Members' Equity, End of Year
$ 10,602,645
2,149,686
2,630,161
517,023
2,714,859
8,011,729
2,590,916
108,000 (103,757)
4 243
2,595,159
2,386,914
{2,061,156)
$ 2,920,917
Project # 191060BFA Attachment B (Cont.)
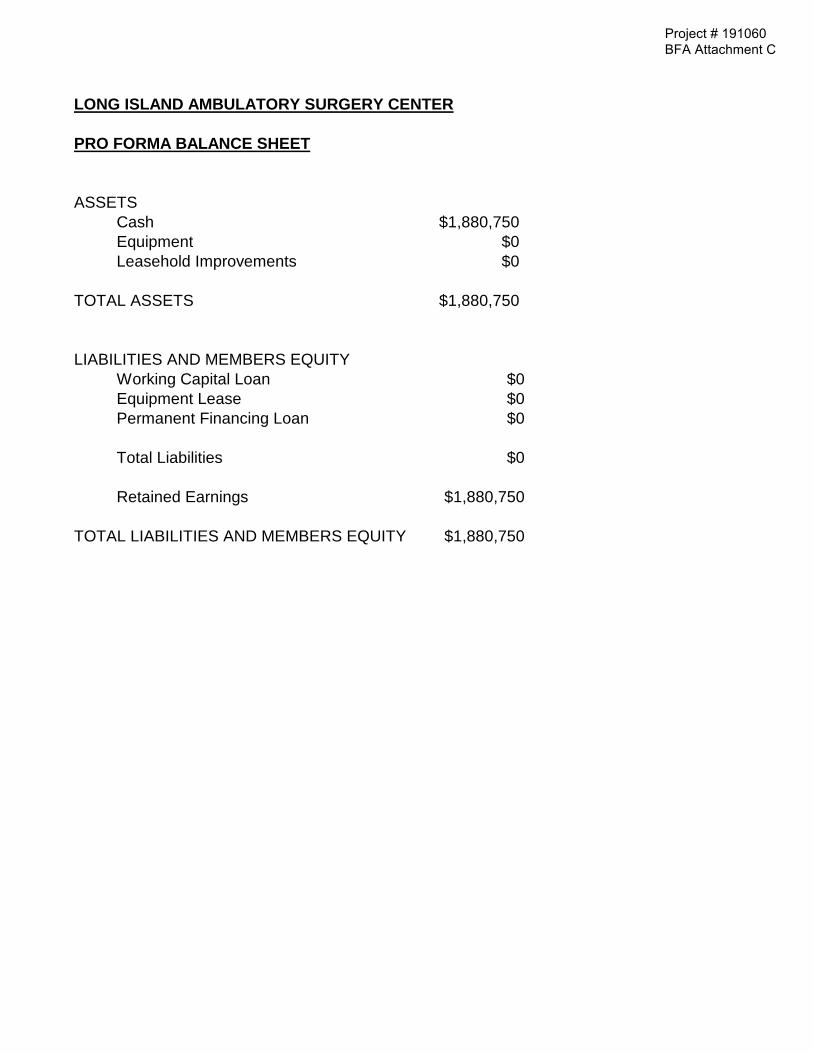
LONG ISLAND AMBULATORY SURGERY CENTER
PRO FORMA BALANCE SHEET
ASSETSCash $1,880,750Equipment $0Leasehold Improvements $0
TOTAL ASSETS $1,880,750
LIABILITIES AND MEMBERS EQUITYWorking Capital Loan $0Equipment Lease $0Permanent Financing Loan $0
Total Liabilities $0
Retained Earnings $1,880,750
TOTAL LIABILITIES AND MEMBERS EQUITY $1,880,750
Project # 191060BFA Attachment C
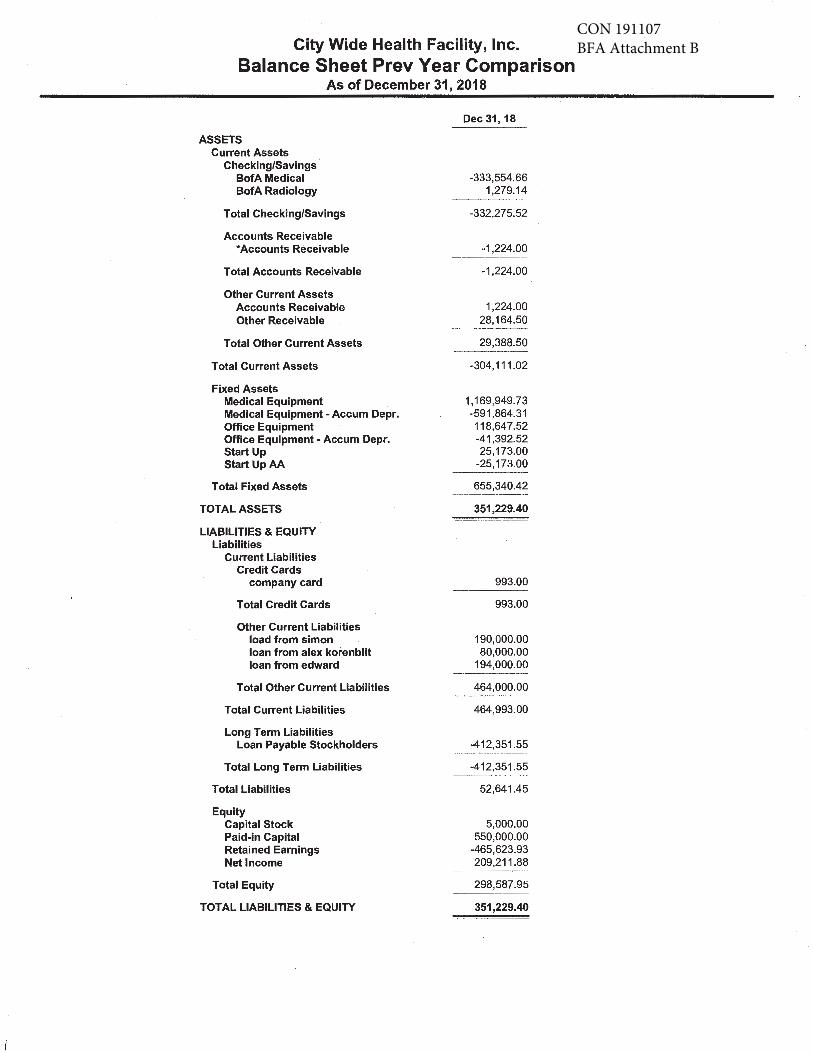
CON 191107BFA Attachment BCity Wide Health Facility, Inc.
Balance Sheet Prev Year Comparison As of December 31, 2018
ASSETS Current Assets
Checking/Savings · BofA Medical BofA Radiology
Total Checking/Savings
Accounts Receivable *Accounts Receivable
Total Accounts Receivable
Other Current Assets Accounts Receivable Other Receivable
Total Other Current Assets
Total Current Assets
Fixed Assets Medical Equipment Medical Equipment - Accum Depr. Office Equipment Office Equipment - Accum Depr. Start Up Start Up AA
Total Fixed Assets
TOTAL ASSETS
LIABILITIES & EQUITY Liabilities
Current Liabilities Credit Cards
company card
Total Credit Cards
Other Current Liabilities load from simon loan from alex korenblit loan from edward
Total Other Current Liabilities
Total Current Liabilities
Long Term Liabilities Loan Payable Stockholders
Total Long Term Liabilities
Total Liabilities
Equity Capital Stock Paid-in Capital Retained Earnings Net Income
Total Equity
TOT AL LIABILITIES & EQUITY
Dec 31, 18
-333,554.66 1,279.14
-332,275.52
-1,224.00
-1,224.00
1,224.00 28,164.50
29,388.50
-304, 111 .02
1,169,949.73 -591,864.31 118,647.52 -41,392.52 25,173.00
-25,173.00
655,340.42
351 ,229.40
993.00
993.00
190,000.00 80,000.00
194,000.00
464,000.00
464,993.00
-412,351.55
-412,351.55
52,641.45
5,000.00 550,000.00
-465,623.93 209,211 .88
298,587.95
351,229.40

CON 191107BFA Attachment B Cont.City Wide Health Facility, Inc.
Profit & Loss Prev Year Comparison January through December 2018
Ordinary Income/Expense Income
Fee Income
Total Income
Gross Profit
Expense Administrative (A)
Administrative Payroll Bank Service Charges Contract Labor - Computer Maint Dues and Subscriptions Equipment purchase In Service and Staff Education marketing Office Expense Postage and Delivery Printing and Reproduction Professional Fees
Accounting Billing Service Consulting Legal Fees Professional Fees - Other
Total Professional Fees
Public Education/Commun.ication Telephone Travel & Ent Administrative (A) - Other
Total Administrative (A)
Employee Health & Welfare (M) Health Insurance
Total Employee Health & Welfare (M)
Facility (B) Automobile Expense Gas and Electric · Housekeeping Maintenance Maintenance Supplies Repairs Security
Total Facility (B)
Facility Capital Costs (N) Depreciation Expense Liability Insurance Rent
Total Facility Capital Costs (N)
Medical (D) Laboratory Fees Medical Payroll Medical Supplies
Total Medical (D)
Jan - Dec 18
3,621 ,666.34
3,621,666.34
3,621 ,666.34
73,666.39 7,365.91
81 ,860.62 14,266.60
120,416.63 7,000.15
264,226.18 42,679.49
597.53 1,420.83
32,759.00 121,711 .80 187,538.74
73,943.10 36,780.87
452,733.51
30,000.00 7,069.06 7,046.00
150.00
1,110,498.90
39,486.59
39,486.59
15,000.00 31 ,946.31 25,786.28 60,936.45
1,279.38 516,324.17
54.44
651,327.03
0.00 7,630.73
261 ,293.29
268,924.02
1,100.00 580,638.32 72,844.82
654,583.14
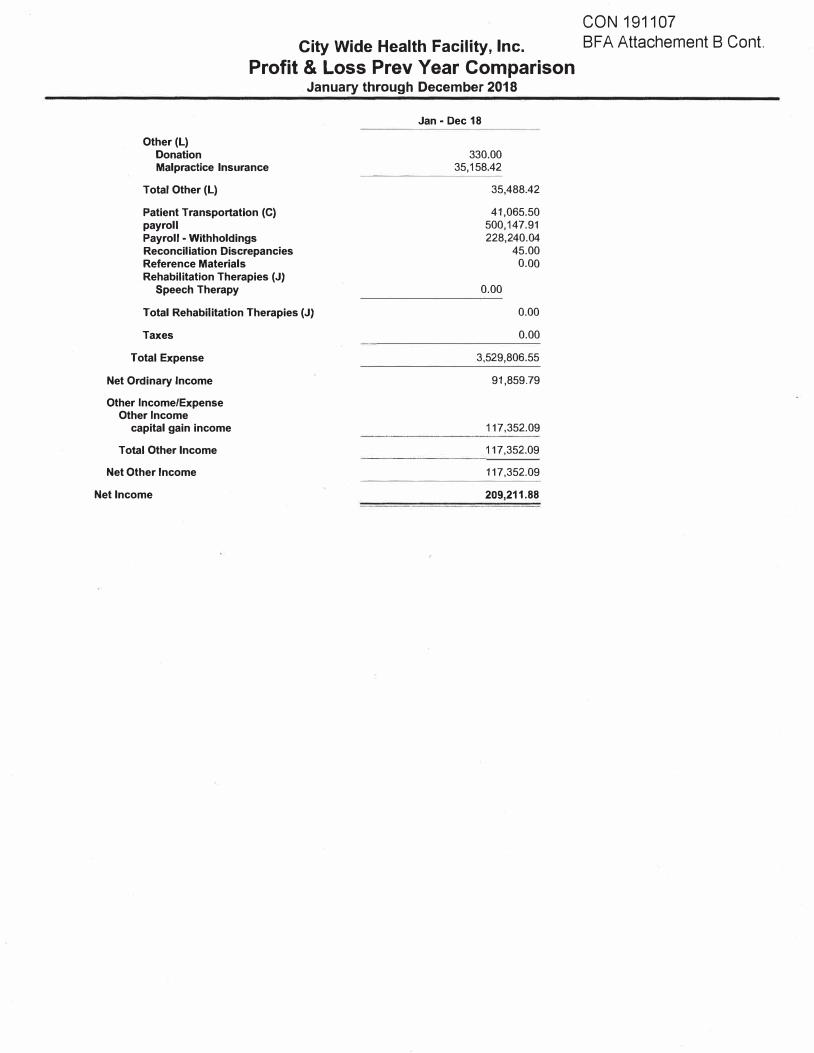
City Wide Health Facility, Inc.
Profit & Loss Prev Year Comparison January through December 2018
.Other (L) Donation Malpractice Insurance
Total Other (L)
Patient Transportation (C) payroll Payroll • Withholdings Reconciliation Discrepancies Reference Materials Rehabilitation Therapies (J)
Speech Therapy
Total Rehabilitation Therapies (J)
Taxes
Total Expense
Net Ordinary Income
Other Income/Expense Other Income
capital gain income
Total Other Income
Net Other Income
Jan• Dec 18
330.00 35,158.42
35,488.42
41,065.50
500,147.91
228,240.04
45.00
0.00
0.00
0.00
0.00
3,529,806.55
91,859.79
117,352.09
117,352.09
117,352.09
Net Income 209,211.88
CON 191107BFA Attachement B Cont.
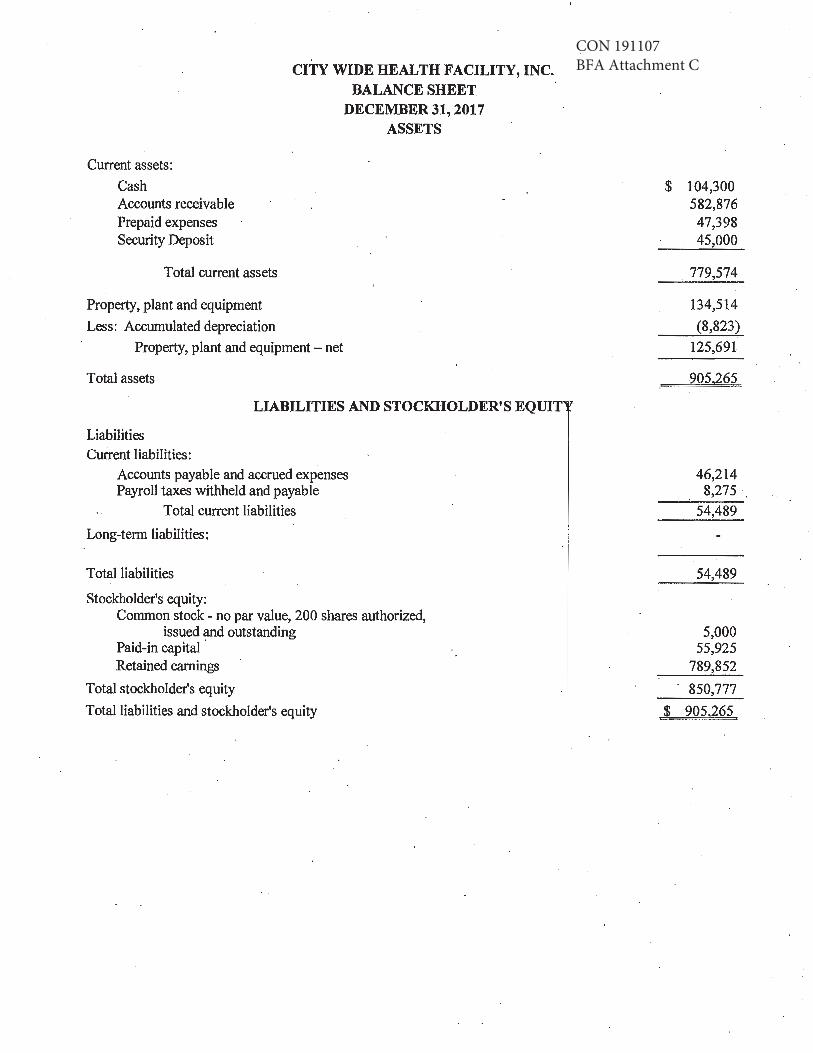
CON 191107BFA Attachment CCITY WIDE HEALTH FACILITY, INC.
Current assets:
Cash Accounts receivable Prepaid expenses Security Deposit
Total current assets
Property, plant and equipment
Less: Accumulated depreciation
Property, plant and equipment - net
Total assets
BALANCE SHEET DECEMBER 31, 2017
ASSETS
LIABILITIES AND STOCKHOLDER'S EQUIT
Liabilities Current liabilities:
Accounts payable and accrued expenses Payroll taxes withheld and payable
Total current liabilities
Long-term liabilities:
Total liabilities
Stockholder's equity: Common stock - no par value, 200 shares authorized,
issued and outstanding Paid-in capital · Retained earnings
Total stockholder's equity
Total liabilities and stockholder's equity
$
$
104,300 582,876 47,398 45,000
779,574
134,514
{8,823)
125,691
905,265
46,214 8,275
54,489
54,489
5,000 55,925
789,852
850,777
905,265
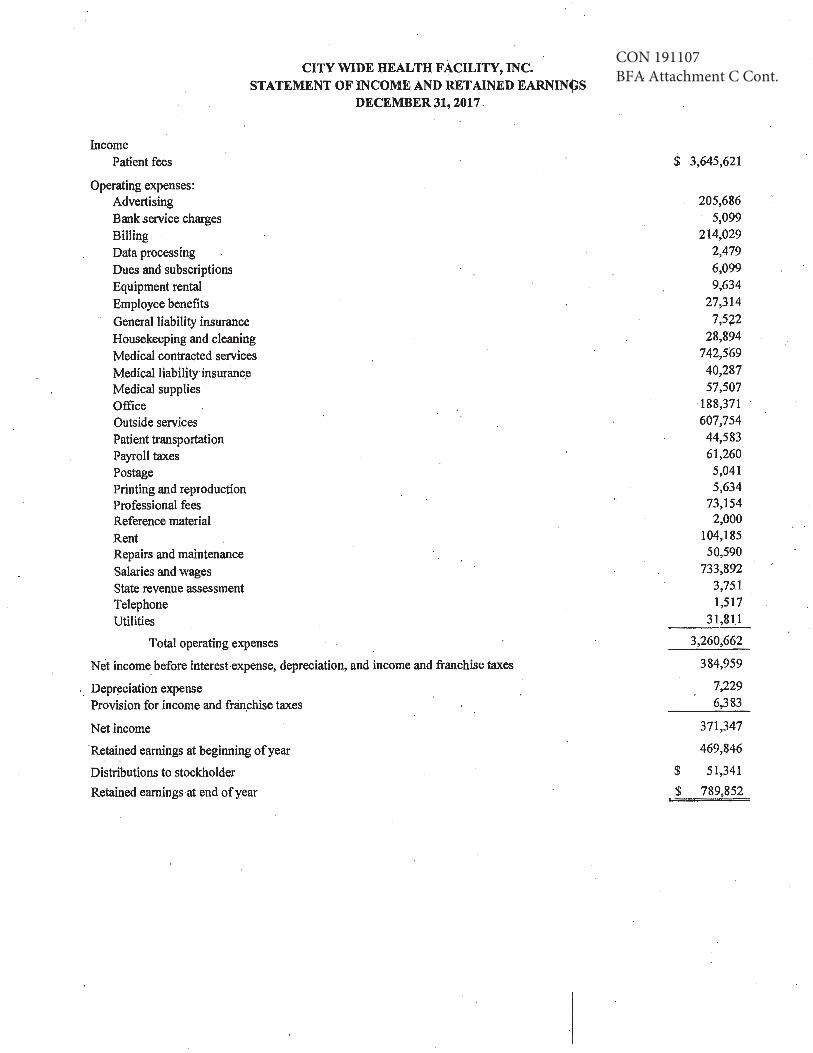
CON 191107BFA Attachment C Cont.CITY WIDE HEALTH FACILITY, INC.
STATEMENT OF INCOME AND RETAINED EARNIN~S DECEMBER 31, 2017 .
Income Patient fees
Operating expenses: Advertising Bank service charges Billing Data processing Dues and subscriptions Equipment rental Employee benefits General liability insurance Housekeeping and cleaning Medical contracted services Medical liability insurance Medical supplies Office Outside services Patient transportation Payroll taxes Postage Printing and reproduction Professional fees Reference material Rent Repairs and maintenance Salaries and wages State revenue assessment Telephone Utilities
Total operating expenses
Net income_before interest expense, depreciation, and income and franchise taxes
. . Depr~ciation expense Provision for income and fran.chise taxes
Net income
Retained earnings at beginning of year
Distributions to stockholder
Retained earnings at end of year
$ 3,645,621
205,686 5,099
214,029 2,479 6,099 9,634
27,314 7,5';,2
28,894 742,569 40,287 57,507
·188,371 607,754
44,583 61,260 5,041 5,634
73,154 2,000
104,185 50,590
733,892 3,751 1,517
31,811
3,260,662
384,959
7,229 6,383
371,347
469,846
$ 51,341
$ 789,852
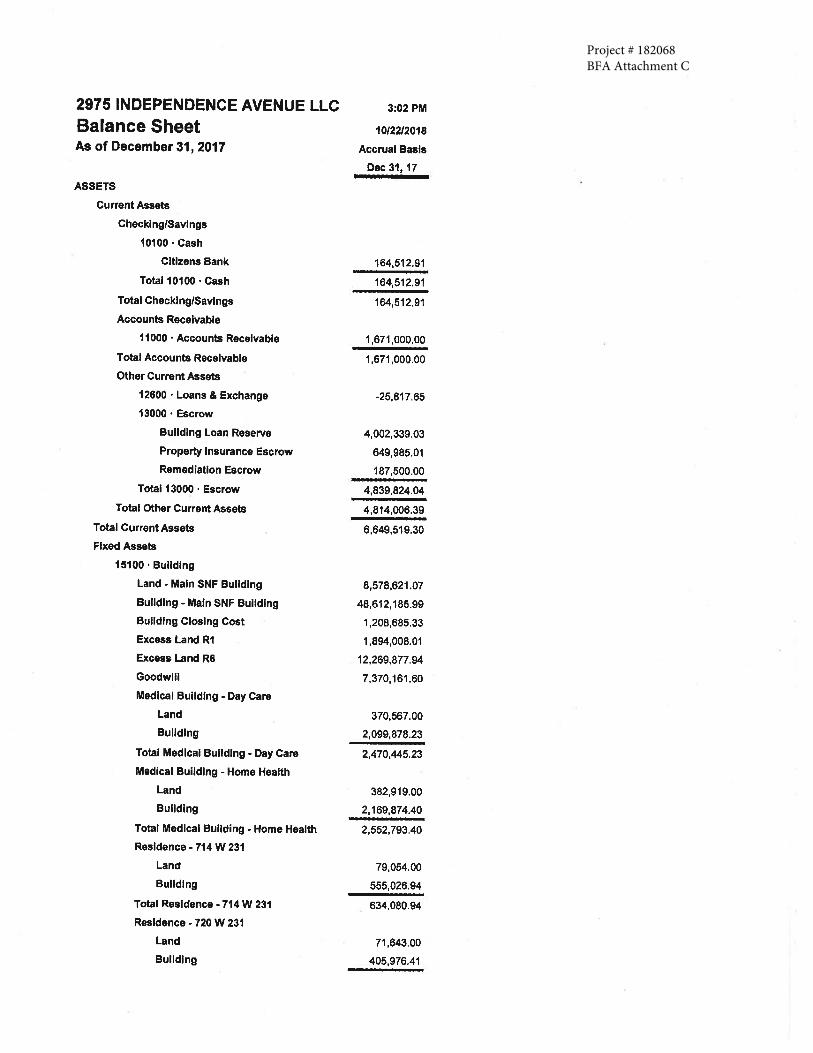
Project # 182068BFA Attachment C
2975 INDEPENDENCE AVENUE LLC 3:02 PM
Balance Sheet 10,221201s
As of December 31, 2017 Accrual Basis
ASSETS
Current Assets
Checking/Savings
10100 · Cash
Citizens Bank
Total 10100 · Cash
Total Checking/Savings
Accounts Receivable
11000 • Accounts Receivable
Total Accounts Receivable
Other Current Assets
12600 • Loans & Exchange
13000 • Escrow
Building Loan Reserve
Property Insurance Escrow
Remediation Escrow
Total 13000 · Escrow
Total other current Assets
Total Current Assets
Fixed Assets
15100 · Bulldlng
Land • Main SNF Building
Building - Main SNF Building
Bulldlng Closing Cost
Excess Land R1
Excess Land R6
Goodwlll
Medical Building • Day Care
Land
Bulldlng
Total Medlcal Building- Day Care
Medical Building - Home Health
Land
Building
Total Medlcal Building - Home Health
Residence - 714 W 231
Land
Bulldlng
Total Residence• 714 W 231
Residence - 720 W 231
Land
Building
Dec 31, 17
164,512.91
164,512.91
164,512.91
1,671,000.00
1,671,000.00
-25,817.65
4,002,339.03
649,985.01
187,500.00
4,839,824.04
4,814,006.39
6,649,519.30
8,578,621.07
48,612,185.99
1,208,685.33
1,894,008.01
12,269,877.94
7,370,161.60
370,567.00
2,099,878.23
2,470,445.23
382,919.00
2,169,874.40
2,552,793.40
79,054.00
555,026.94
634,080.94
71,643.00
405,976.41
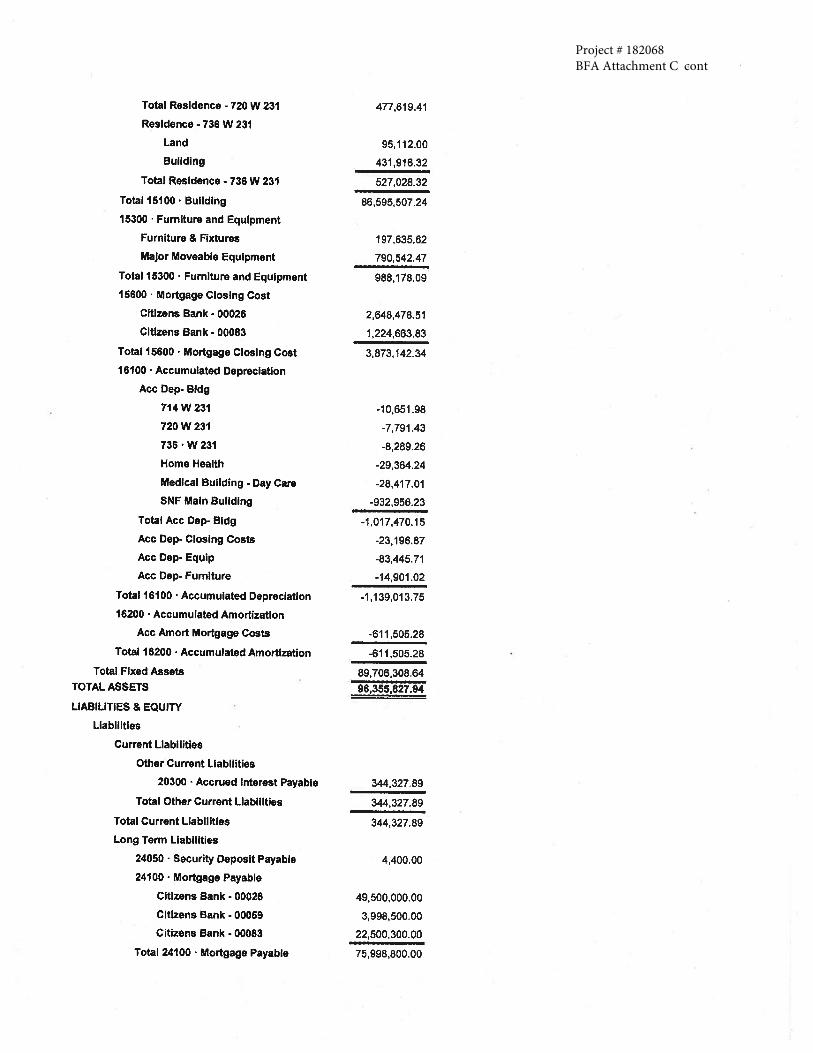
Project # 182068BFA Attachment C cont
Total Residence - 720 W 231
Residence - 736 W 231
Land
Bulldlng
Total Residence - 736 W 231
Total 15100 • Building
15300 · Furniture and Equipment
Furniture & Fixtures
Major Moveable Equipment
Total 15300 · Furniture and Equipment
15600 · Mortgage Closlng Cost
Citizens Bank - 00026
Citizens Bank - 00083
Total 15600 • Mortgage Closlng Cost
16100 • Accumulated Depreciation
Ace Dep- Bldg
714 W231
720W231
736 · W 231
Home Health
Medical Building - Day Care
SNF Main Bulldlng
Total Ace Dep- Bldg
Ace Dep- Closing Costs
Ace Dep- Equip
Ace Dep- Furniture
Total 16100 • Accumulated Depreciation
16200 · Accumulated Amortization
Ace Amort Mortgage Costs
Total 16200 · Accumulated Amortization
Total Fixed Assets TOTAL ASSETS
LIABILITIES & EQUITY
Liabllltles
Current Llabllltles
Other Current Liabilities
20300 · Accrued Interest Payable
Total Other Current Llablllties
Total Current Llabllltles
Long Term Liabilities
24050 · Security Deposit Payable
24100 · Mortgage Payable
Citizens Bank - 00026
Citizens Bank - 00059
Citizens Bank - 00083
Total 24100 · Mortgage Payable
4TT,619.41
95,112.00
431,916.32
527,028.32
86,595,507.24
197,635.62
790,542.47
988,178.09
2,648,478.51
1,224,663.83
3,873,142.34
-10,651.98
-7,791.43
-8,289.26
-29,364.24
-28,417.01
-932,956.23
-1,017,470.15
-23,196.87
-83,445.71
-14,901.02
-1,139,013.75
-611,505.28
-611,505.28
89,706,308.64
96,355,827.94
344,327.89
344,327.89
344,327.89
4,400.00
49,500,000.00
3,998,500.00
22,500,300.00
75,998,800.00
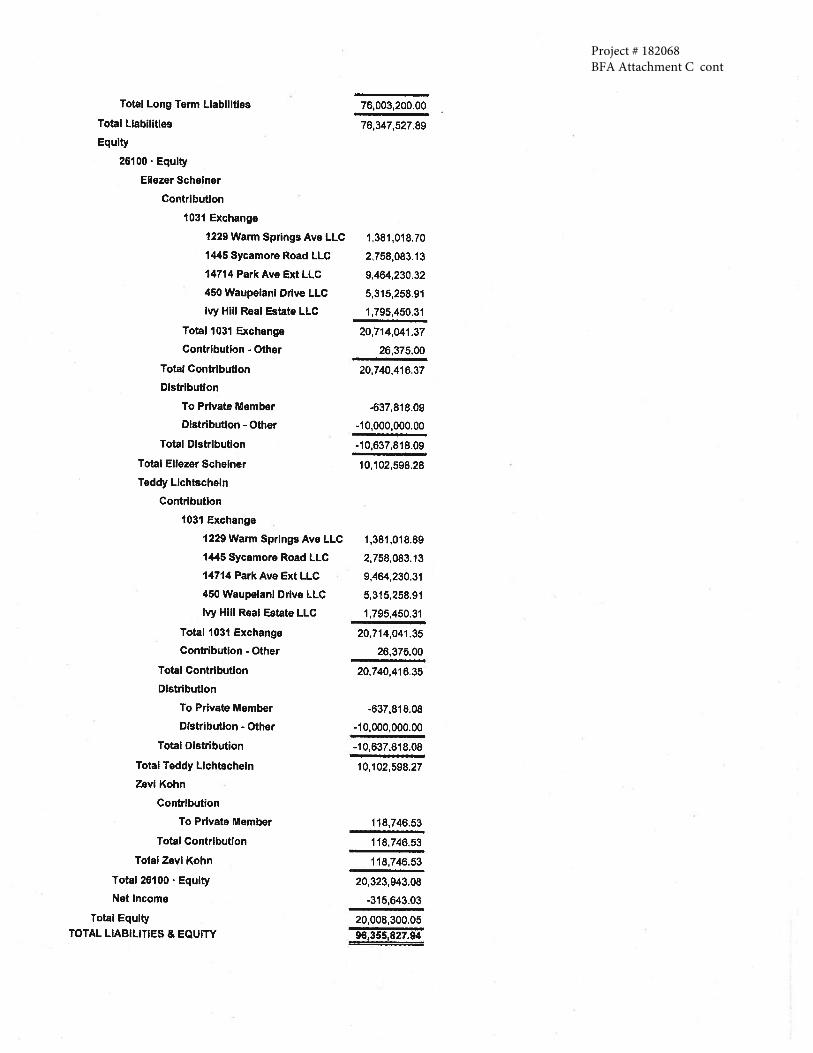
Project # 182068BFA Attachment C cont
Total Long Term Liabilltles
Total Llabllitles
Equity
26100 · Equity
Ellezer Scheiner
Contribution
1031 Exchange
1229 Wann Springs Ave LLC
1445 Sycamore Road LLC
14714 Park Ave Ext LLC
450 Waupelanl Drive LLC
Ivy Hill Real Estate LLC
Total 1031 Exchenge
Contribution - Other
Total Contribution
Distribution
To Private Member
Distribution - Other
Total Distribution
Total Ellezer Scheiner
Teddy Llchtscheln
Contribution
1031 Exchange
1229 Warm Springs Ave LLC
1445 Sycamore Road LLC
14714 Park Ave Ext LLC
450 Waupelanl Drive LLC
Ivy Hill Real Estate LLC
Total 1031 Exchange
Contribution - Other
Total Contribution
Distribution
To Private Member
Distribution - Other
Total Distribution
Total Teddy Llchtscheln
ZevlKohn
Contribution
To Private Member
Total Contribution
Total Zevl Kohn
Total 26100 · Equity
Net Income
Total Equity
TOTAL LIABILITIES & EQUITY
76,003,200.00
76,347,527.89
1,381,018.70
2,758,083.13
9,464,230.32
5,315,258.91
1,795,450.31
20,714,041.37
26,375.00
20,740,416.37
-637,818.09
-10,000,000.00
-10,637,818.09
10,102,598.28
1,381,018.69
2,758,083.13
9,464,230.31
5,315,258.91
1,795,450.31
20,714,041 .35
26,375.00
20,740,416.35
-637,818.08
-10,000,000.00
-10,637.818.08
10,102,598.27
118,746.53
118,746.53
118,746.53
20,323,943.08
-315,643.03
20,008,300.05 96,355,827.94
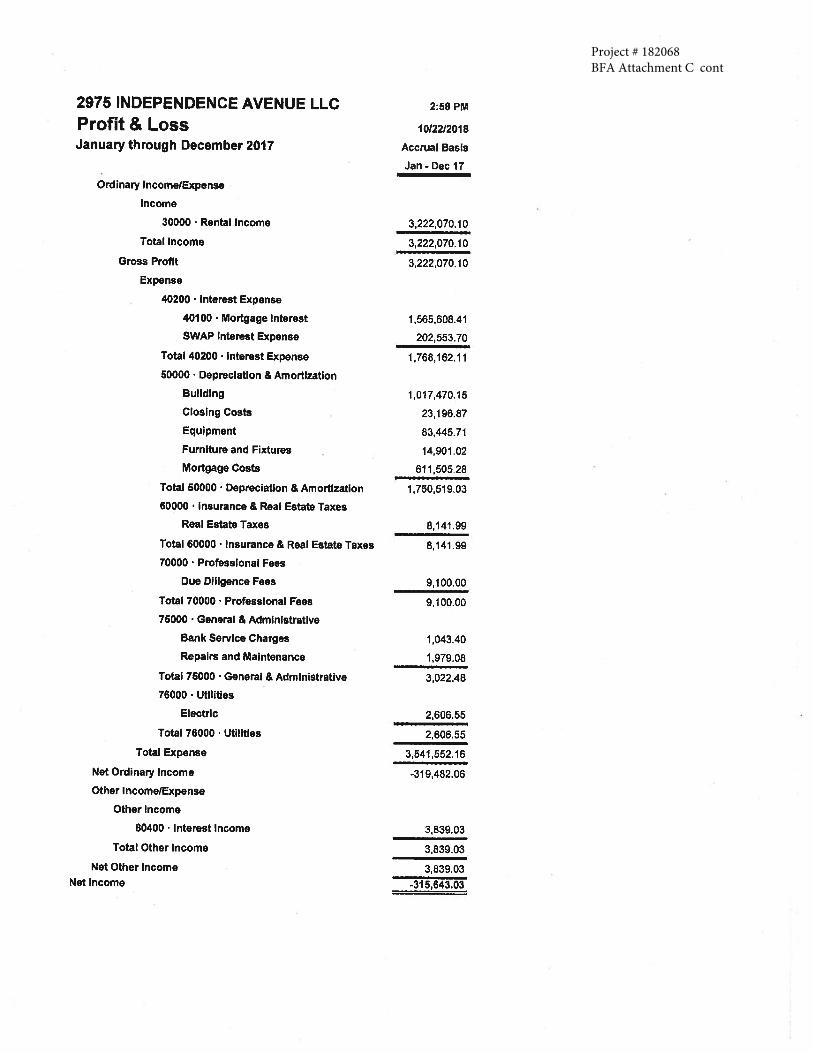
Project # 182068BFA Attachment C cont
2975 INDEPENDENCE AVENUE LLC Profit & Loss January through December 2017
Ordinary Income/Expense
Income
30000 • Rental Income
Total Income
Gross Profit
Expense
40200 · Interest Expense
40100 · Mortgage Interest
SWAP Interest Expense
Total 40200 • Interest Expense
50000 · Depreciation & Amortization
Building
Closing Costs
Equipment
Furniture and Fixtures
Mortgage Costs
Total 60000 · Depreciation & Amortization
60000 · Insurance & Real Estate Taxes
Real Estate Taxes
Total 60000 · Insurance & Real Estate Taxes
70000 · Professional Fees
Due Diligence Fees
Total 70000 · Professional Fees
75000 · General & Administrative
Bank Service Charges
Repairs and Maintenance
Total 75000 · General & Administrative
76000 · Utilities
Electric
Total 76000 · Utilities
Total Expense
Net Ordinary Income
Other Income/Expense
Other Income
80400 · Interest Income
Total Other Income
Net Other Income Net Income
2:58 PM
10/22/2018
Accrual Basis
Jan - Dec 17
3,222,070.10
3,222,070.10
3,222,070.10
1,565,608.41
202,553.70
1,768,162.11
1,017,470.15
23,196.87
83,445.71
14,901.02
611,505.28
1,750,519.03
8,141.99
8,141.99
9,100.00
9,100.00
1,043.40
1,979.08
3,022.48
2,606.55
2,606.55
3,541,552.16
-319,482.06
3,839.03
3,839.03
3,839.03
-315,643.03
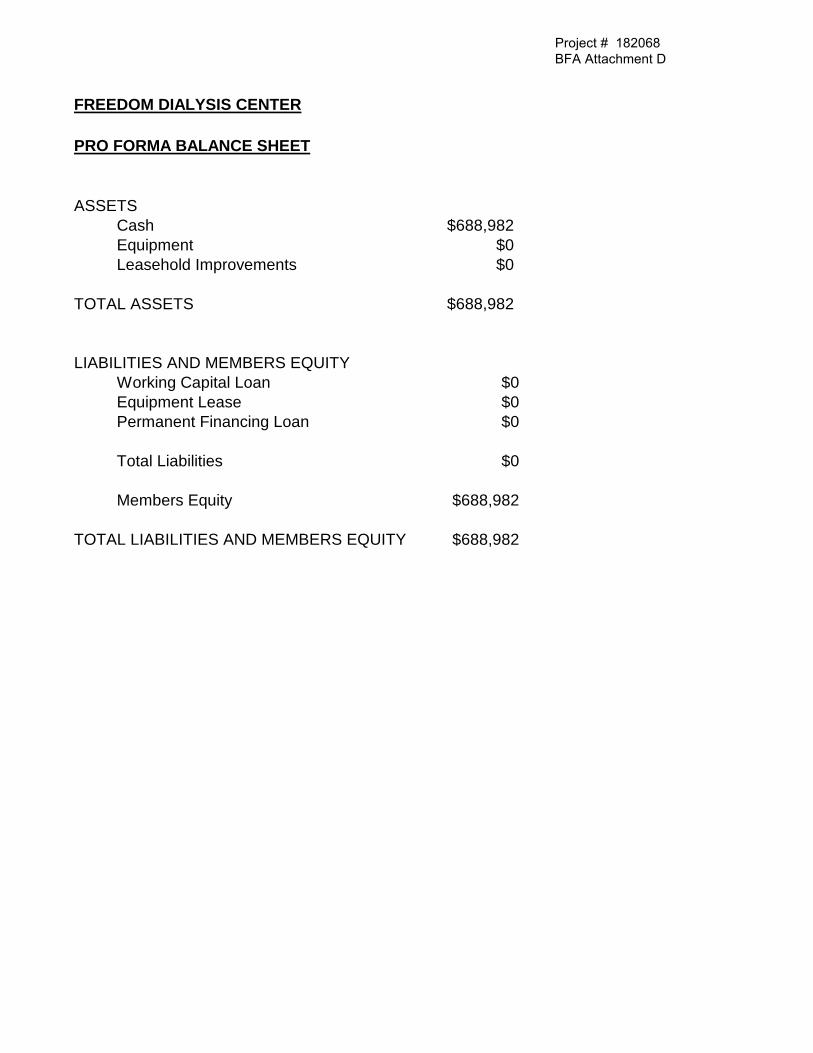
FREEDOM DIALYSIS CENTER
PRO FORMA BALANCE SHEET
ASSETSCash $688,982Equipment $0Leasehold Improvements $0
TOTAL ASSETS $688,982
LIABILITIES AND MEMBERS EQUITYWorking Capital Loan $0Equipment Lease $0Permanent Financing Loan $0
Total Liabilities $0
Members Equity $688,982
TOTAL LIABILITIES AND MEMBERS EQUITY $688,982
Project # 182068BFA Attachment D
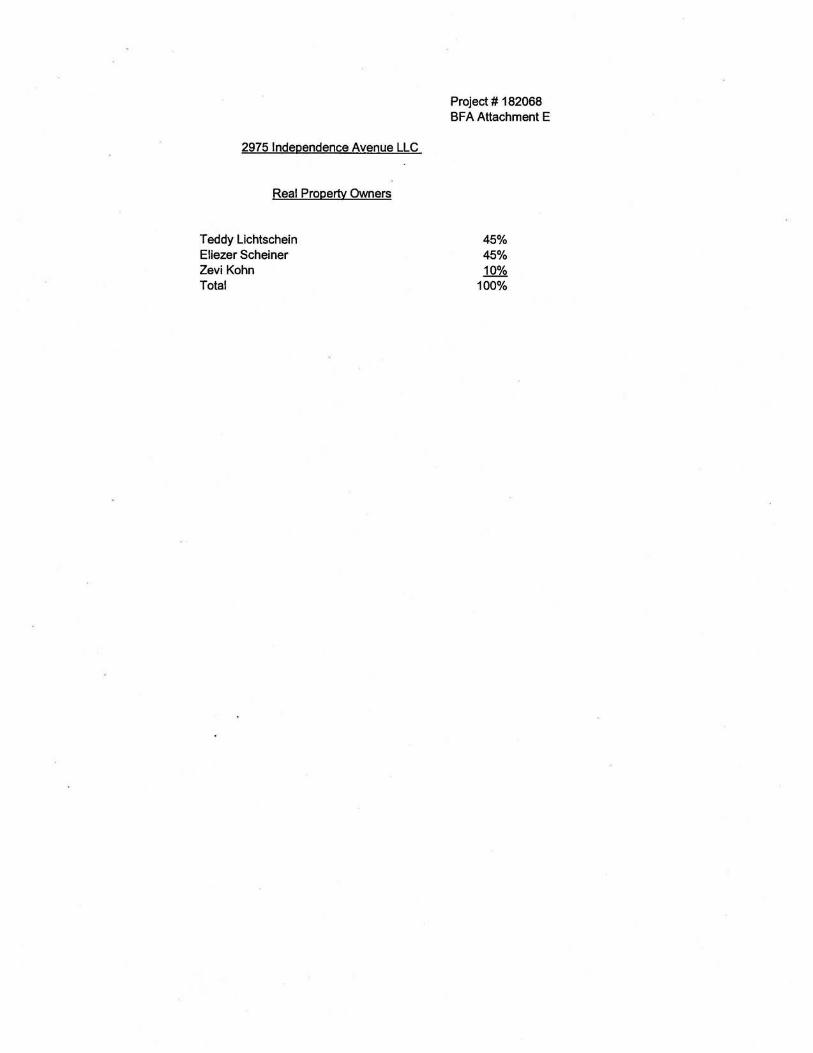
2975 Independence Avenue LLC
Real Property Owners
Teddy Lichtschein Eliezer Scheiner ZeviKohn Total
Project # 182068 BFA Attachment E
45% 45% 10%
100%
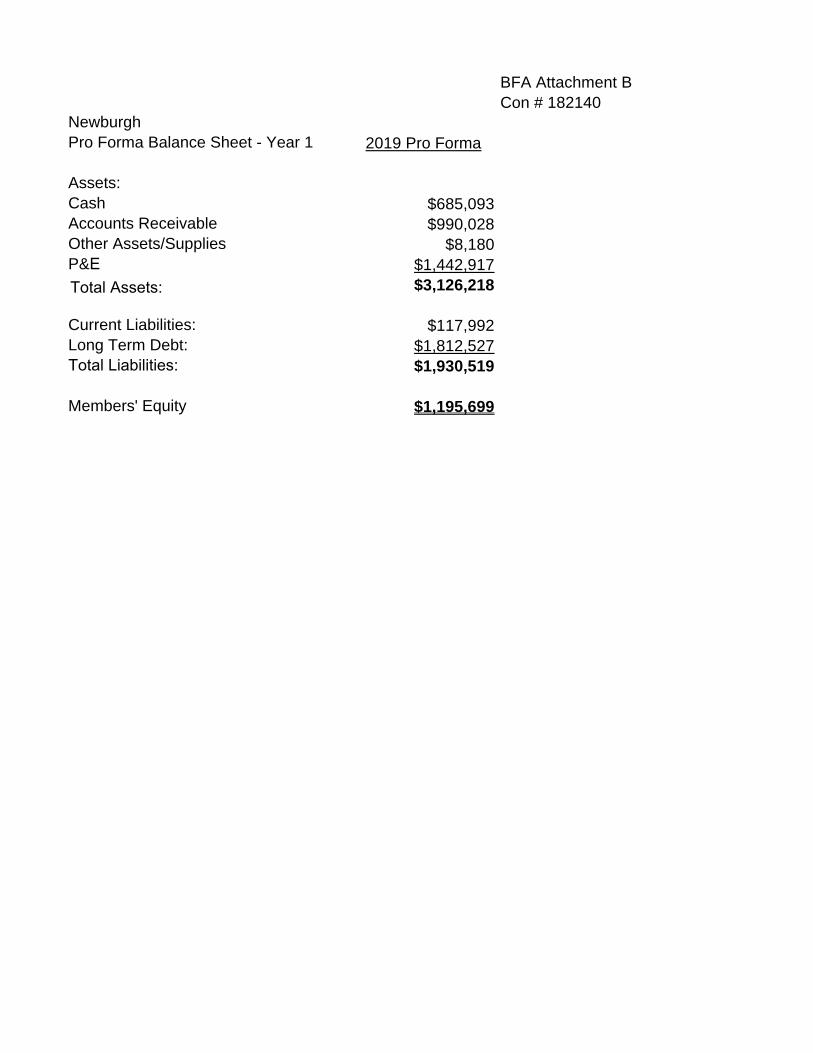
BFA Attachment BCon # 182140
2019 Pro Forma
$685,093$990,028
$8,180$1,442,917$3,126,218
$117,992$1,812,527$1,930,519
NewburghPro Forma Balance Sheet - Year 1
Assets:CashAccounts ReceivableOther Assets/SuppliesP&E
Current Liabilities:Long Term Debt:
Members' Equity $1,195,699
Total Assets:
Total Liabilities:
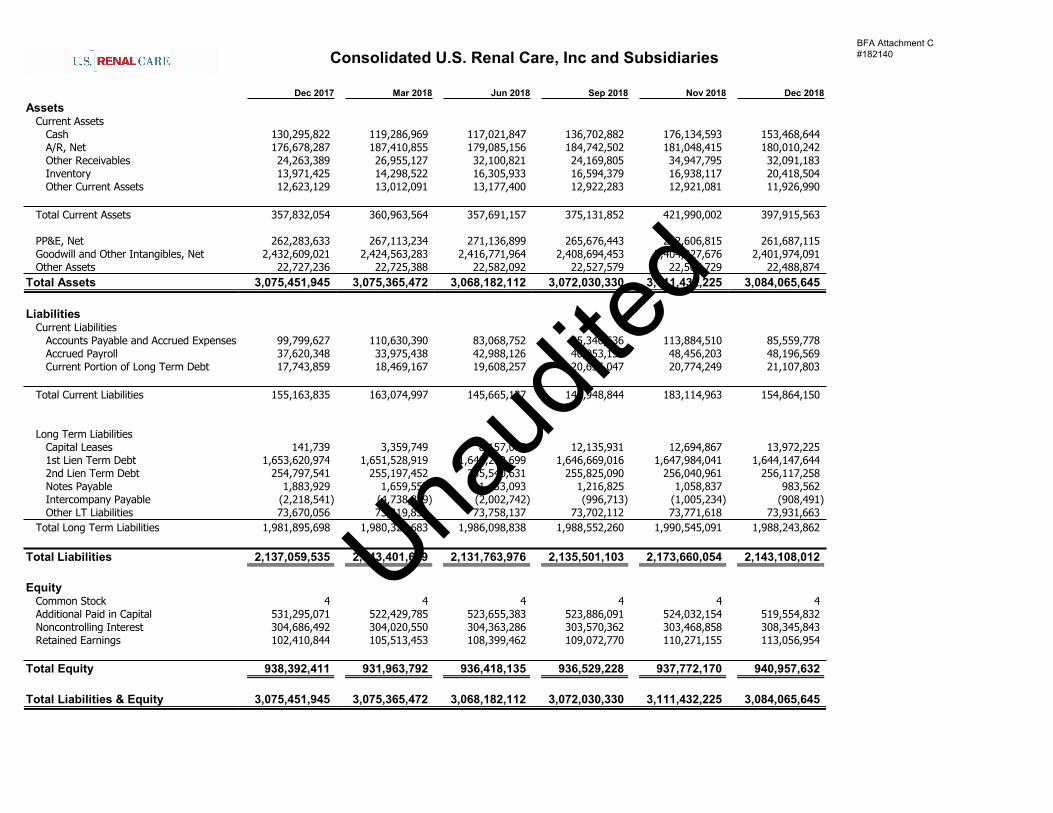
Dec 2017 Mar 2018 Jun 2018 Sep 2018 Nov 2018 Dec 2018
AssetsCurrent Assets
Cash 130,295,822 119,286,969 117,021,847 136,702,882 176,134,593 153,468,644
A/R, Net 176,678,287 187,410,855 179,085,156 184,742,502 181,048,415 180,010,242
Other Receivables 24,263,389 26,955,127 32,100,821 24,169,805 34,947,795 32,091,183
Inventory 13,971,425 14,298,522 16,305,933 16,594,379 16,938,117 20,418,504
Other Current Assets 12,623,129 13,012,091 13,177,400 12,922,283 12,921,081 11,926,990
Total Current Assets 357,832,054 360,963,564 357,691,157 375,131,852 421,990,002 397,915,563
PP&E, Net 262,283,633 267,113,234 271,136,899 265,676,443 262,606,815 261,687,115
Goodwill and Other Intangibles, Net 2,432,609,021 2,424,563,283 2,416,771,964 2,408,694,453 2,404,327,676 2,401,974,091
Other Assets 22,727,236 22,725,388 22,582,092 22,527,579 22,507,729 22,488,874
Total Assets 3,075,451,945 3,075,365,472 3,068,182,112 3,072,030,330 3,111,432,225 3,084,065,645
LiabilitiesCurrent Liabilities
Accounts Payable and Accrued Expenses 99,799,627 110,630,390 83,068,752 85,340,636 113,884,510 85,559,778
Accrued Payroll 37,620,348 33,975,438 42,988,126 40,953,159 48,456,203 48,196,569
Current Portion of Long Term Debt 17,743,859 18,469,167 19,608,257 20,655,047 20,774,249 21,107,803
Total Current Liabilities 155,163,835 163,074,997 145,665,137 146,948,844 183,114,963 154,864,150
Long Term Liabilities
Capital Leases 141,739 3,359,749 8,157,019 12,135,931 12,694,867 13,972,225
1st Lien Term Debt 1,653,620,974 1,651,528,919 1,649,212,699 1,646,669,016 1,647,984,041 1,644,147,644
2nd Lien Term Debt 254,797,541 255,197,452 255,540,631 255,825,090 256,040,961 256,117,258
Notes Payable 1,883,929 1,659,552 1,433,093 1,216,825 1,058,837 983,562
Intercompany Payable (2,218,541) (4,738,839) (2,002,742) (996,713) (1,005,234) (908,491)
Other LT Liabilities 73,670,056 73,319,850 73,758,137 73,702,112 73,771,618 73,931,663
Total Long Term Liabilities 1,981,895,698 1,980,326,683 1,986,098,838 1,988,552,260 1,990,545,091 1,988,243,862
Total Liabilities 2,137,059,535 2,143,401,679 2,131,763,976 2,135,501,103 2,173,660,054 2,143,108,012
EquityCommon Stock 4 4 4 4 4 4
Additional Paid in Capital 531,295,071 522,429,785 523,655,383 523,886,091 524,032,154 519,554,832
Noncontrolling Interest 304,686,492 304,020,550 304,363,286 303,570,362 303,468,858 308,345,843
Retained Earnings 102,410,844 105,513,453 108,399,462 109,072,770 110,271,155 113,056,954
Total Equity 938,392,411 931,963,792 936,418,135 936,529,228 937,772,170 940,957,632
Total Liabilities & Equity 3,075,451,945 3,075,365,472 3,068,182,112 3,072,030,330 3,111,432,225 3,084,065,645
Consolidated U.S. Renal Care, Inc and Subsidiaries
Unaud
ited
BFA Attachment C#182140
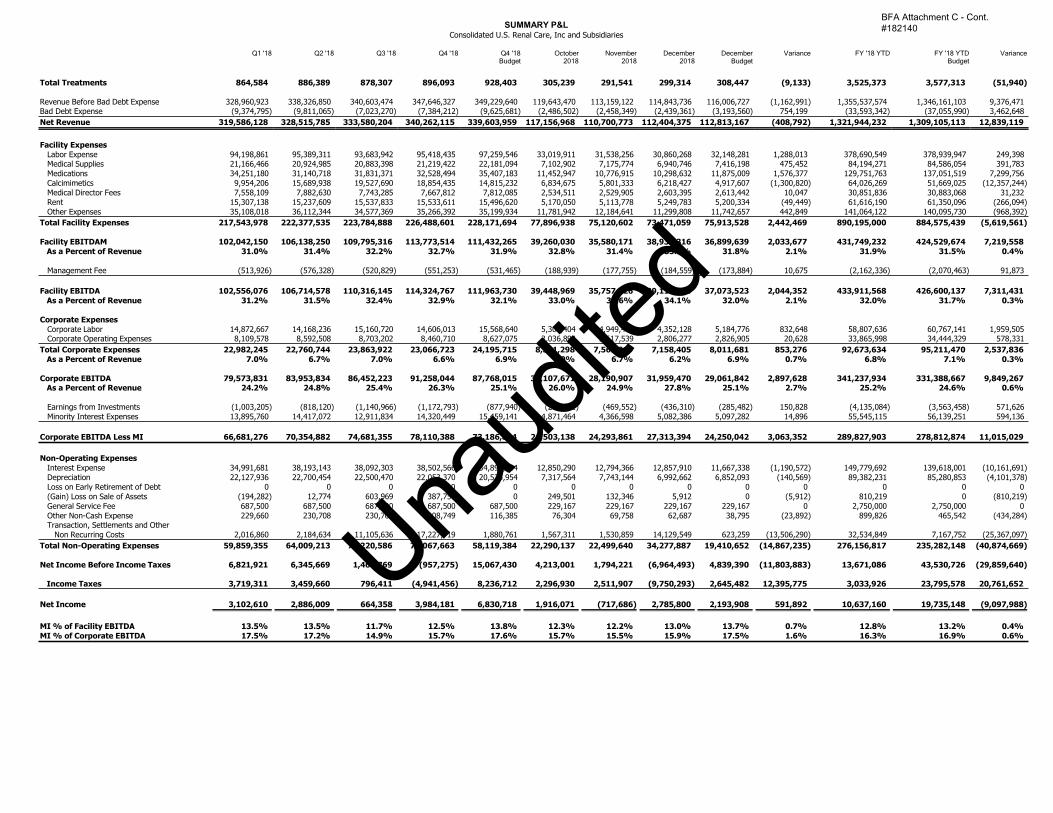
Q1 '18 Q2 '18 Q3 '18 Q4 '18 Q4 '18Budget
October2018
November2018
December2018
DecemberBudget
Variance FY '18 YTD FY '18 YTDBudget
Variance
Total Treatments 864,584 886,389 878,307 896,093 928,403 305,239 291,541 299,314 308,447 (9,133) 3,525,373 3,577,313 (51,940)
Revenue Before Bad Debt Expense 328,960,923 338,326,850 340,603,474 347,646,327 349,229,640 119,643,470 113,159,122 114,843,736 116,006,727 (1,162,991) 1,355,537,574 1,346,161,103 9,376,471Bad Debt Expense (9,374,795) (9,811,065) (7,023,270) (7,384,212) (9,625,681) (2,486,502) (2,458,349) (2,439,361) (3,193,560) 754,199 (33,593,342) (37,055,990) 3,462,648
Net Revenue 319,586,128 328,515,785 333,580,204 340,262,115 339,603,959 117,156,968 110,700,773 112,404,375 112,813,167 (408,792) 1,321,944,232 1,309,105,113 12,839,119
Facility Expenses
Labor Expense 94,198,861 95,389,311 93,683,942 95,418,435 97,259,546 33,019,911 31,538,256 30,860,268 32,148,281 1,288,013 378,690,549 378,939,947 249,398Medical Supplies 21,166,466 20,924,985 20,883,398 21,219,422 22,181,094 7,102,902 7,175,774 6,940,746 7,416,198 475,452 84,194,271 84,586,054 391,783
Medications 34,251,180 31,140,718 31,831,371 32,528,494 35,407,183 11,452,947 10,776,915 10,298,632 11,875,009 1,576,377 129,751,763 137,051,519 7,299,756
Calcimimetics 9,954,206 15,689,938 19,527,690 18,854,435 14,815,232 6,834,675 5,801,333 6,218,427 4,917,607 (1,300,820) 64,026,269 51,669,025 (12,357,244)
Medical Director Fees 7,558,109 7,882,630 7,743,285 7,667,812 7,812,085 2,534,511 2,529,905 2,603,395 2,613,442 10,047 30,851,836 30,883,068 31,232
Rent 15,307,138 15,237,609 15,537,833 15,533,611 15,496,620 5,170,050 5,113,778 5,249,783 5,200,334 (49,449) 61,616,190 61,350,096 (266,094)
Other Expenses 35,108,018 36,112,344 34,577,369 35,266,392 35,199,934 11,781,942 12,184,641 11,299,808 11,742,657 442,849 141,064,122 140,095,730 (968,392)
Total Facility Expenses 217,543,978 222,377,535 223,784,888 226,488,601 228,171,694 77,896,938 75,120,602 73,471,059 75,913,528 2,442,469 890,195,000 884,575,439 (5,619,561)
Facility EBITDAM 102,042,150 106,138,250 109,795,316 113,773,514 111,432,265 39,260,030 35,580,171 38,933,316 36,899,639 2,033,677 431,749,232 424,529,674 7,219,558
As a Percent of Revenue 31.0% 31.4% 32.2% 32.7% 31.9% 32.8% 31.4% 33.9% 31.8% 2.1% 31.9% 31.5% 0.4%
Management Fee (513,926) (576,328) (520,829) (551,253) (531,465) (188,939) (177,755) (184,559) (173,884) 10,675 (2,162,336) (2,070,463) 91,873
Facility EBITDA 102,556,076 106,714,578 110,316,145 114,324,767 111,963,730 39,448,969 35,757,926 39,117,875 37,073,523 2,044,352 433,911,568 426,600,137 7,311,431
As a Percent of Revenue 31.2% 31.5% 32.4% 32.9% 32.1% 33.0% 31.6% 34.1% 32.0% 2.1% 32.0% 31.7% 0.3%
Corporate Expenses
Corporate Labor 14,872,667 14,168,236 15,160,720 14,606,013 15,568,640 5,304,404 4,949,480 4,352,128 5,184,776 832,648 58,807,636 60,767,141 1,959,505Corporate Operating Expenses 8,109,578 8,592,508 8,703,202 8,460,710 8,627,075 3,036,894 2,617,539 2,806,277 2,826,905 20,628 33,865,998 34,444,329 578,331
Total Corporate Expenses 22,982,245 22,760,744 23,863,922 23,066,723 24,195,715 8,341,298 7,567,019 7,158,405 8,011,681 853,276 92,673,634 95,211,470 2,537,836
As a Percent of Revenue 7.0% 6.7% 7.0% 6.6% 6.9% 7.0% 6.7% 6.2% 6.9% 0.7% 6.8% 7.1% 0.3%
Corporate EBITDA 79,573,831 83,953,834 86,452,223 91,258,044 87,768,015 31,107,671 28,190,907 31,959,470 29,061,842 2,897,628 341,237,934 331,388,667 9,849,267As a Percent of Revenue 24.2% 24.8% 25.4% 26.3% 25.1% 26.0% 24.9% 27.8% 25.1% 2.7% 25.2% 24.6% 0.6%
Earnings from Investments (1,003,205) (818,120) (1,140,966) (1,172,793) (877,940) (266,931) (469,552) (436,310) (285,482) 150,828 (4,135,084) (3,563,458) 571,626
Minority Interest Expenses 13,895,760 14,417,072 12,911,834 14,320,449 15,459,141 4,871,464 4,366,598 5,082,386 5,097,282 14,896 55,545,115 56,139,251 594,136
Corporate EBITDA Less MI 66,681,276 70,354,882 74,681,355 78,110,388 73,186,814 26,503,138 24,293,861 27,313,394 24,250,042 3,063,352 289,827,903 278,812,874 11,015,029
Non-Operating Expenses
Interest Expense 34,991,681 38,193,143 38,092,303 38,502,566 34,898,784 12,850,290 12,794,366 12,857,910 11,667,338 (1,190,572) 149,779,692 139,618,001 (10,161,691)
Depreciation 22,127,936 22,700,454 22,500,470 22,053,370 20,535,954 7,317,564 7,743,144 6,992,662 6,852,093 (140,569) 89,382,231 85,280,853 (4,101,378)
Loss on Early Retirement of Debt 0 0 0 0 0 0 0 0 0 0 0 0 0
(Gain) Loss on Sale of Assets (194,282) 12,774 603,969 387,759 0 249,501 132,346 5,912 0 (5,912) 810,219 0 (810,219)
General Service Fee 687,500 687,500 687,500 687,500 687,500 229,167 229,167 229,167 229,167 0 2,750,000 2,750,000 0
Other Non-Cash Expense 229,660 230,708 230,708 208,749 116,385 76,304 69,758 62,687 38,795 (23,892) 899,826 465,542 (434,284)Transaction, Settlements and Other
Non Recurring Costs 2,016,860 2,184,634 11,105,636 17,227,719 1,880,761 1,567,311 1,530,859 14,129,549 623,259 (13,506,290) 32,534,849 7,167,752 (25,367,097)
Total Non-Operating Expenses 59,859,355 64,009,213 73,220,586 79,067,663 58,119,384 22,290,137 22,499,640 34,277,887 19,410,652 (14,867,235) 276,156,817 235,282,148 (40,874,669)
Net Income Before Income Taxes 6,821,921 6,345,669 1,460,769 (957,275) 15,067,430 4,213,001 1,794,221 (6,964,493) 4,839,390 (11,803,883) 13,671,086 43,530,726 (29,859,640)
Income Taxes 3,719,311 3,459,660 796,411 (4,941,456) 8,236,712 2,296,930 2,511,907 (9,750,293) 2,645,482 12,395,775 3,033,926 23,795,578 20,761,652
Net Income 3,102,610 2,886,009 664,358 3,984,181 6,830,718 1,916,071 (717,686) 2,785,800 2,193,908 591,892 10,637,160 19,735,148 (9,097,988)
MI % of Facility EBITDA 13.5% 13.5% 11.7% 12.5% 13.8% 12.3% 12.2% 13.0% 13.7% 0.7% 12.8% 13.2% 0.4%
MI % of Corporate EBITDA 17.5% 17.2% 14.9% 15.7% 17.6% 15.7% 15.5% 15.9% 17.5% 1.6% 16.3% 16.9% 0.6%
SUMMARY P&L
Consolidated U.S. Renal Care, Inc and Subsidiaries
Unaud
ited
BFA Attachment C - Cont.#182140
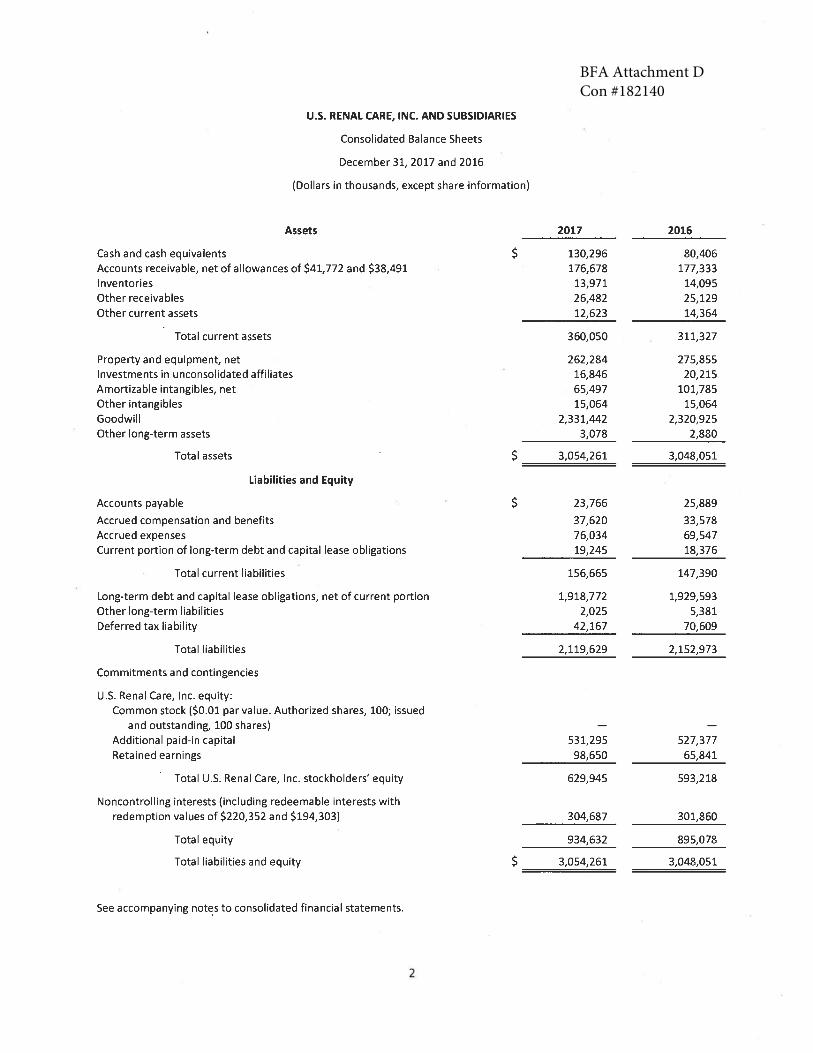
BFA Attachment D Con #182140
U.S. RENAL CARE, INC. AND SUBSIDIARIES
Consolidated Balance Sheets
December 31, 2017 and 2016
(Dollars in thousands, except share ·information)
Assets
Cash and cash equivalents Accounts receivable, net of allowances of $41,772 and $38,491 Inventories Other receivables Other current assets
Total current assets
Property and equipment, net Investments in unconsolidated affiliates Amortizable intangibles, net Other intangibles Goodwill Other long-term assets
Total assets
Liabilities and Equity
Accounts payable
Accrued compensation and benefits Accrued expenses Current portion of long-term debt and capital lease obligations
Total current liabilities
Long-term debt and capital lease obligations, net of current portion Other long-term liabilities Deferred tax liability
Total liabilities
Commitments and contingencies
U.S. Renal Care, Inc. equity: Common stock ($0.01 par value. Authorized shares, 100; issued
and outstanding, 100 shares) Additional paid-in capital Retained earnings
Total U.S. Renal Care, Inc. stockholders' equity
Noncontrolling interests (including redeemable interests with redemption values of $220,352 and $194,303)
Total equity
Total liabilities and equity
See accompanying not~s to consolidated financial statements.
2
2017
$ 130,296 176,678
13,971 26,482 12,623
360,050
262,284 16,846 65,497 15,064
2,331,442 3,078
$ 3,054,261 ====
$ 23,766
37,620 76,034 19,245
156,665
1,918,772 2,025
42,167
2,119,629
531,295 98,650
629,945
304,687
934,632
$ 3,054,261
2016
80,406 177,333
14,095 25,129 14,364
311,327
275,855 20,215
101,785 15,064
2,320,925 2,880
3,048,051
25,889
33,578 69,547 18,376
147,390
1,929,593 5,381
70,609
2,152,973
527,377 65,841
593,218
301,860
895,078
3,048,051
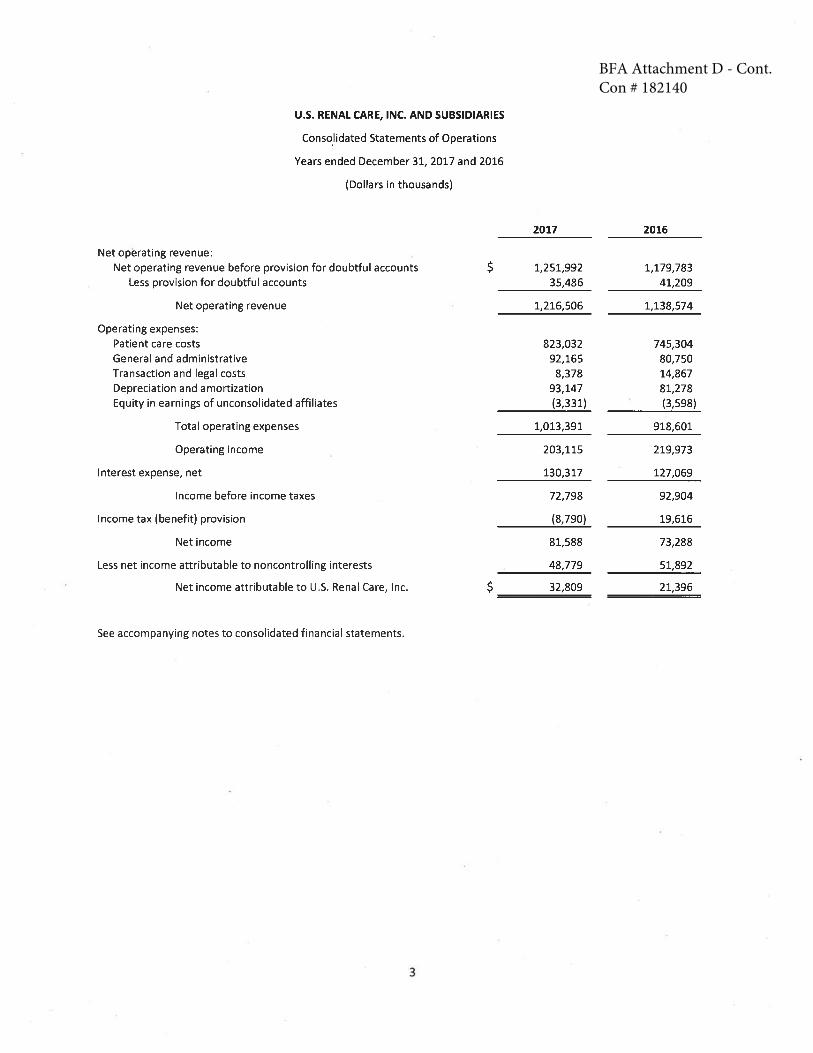
BFA Attachment D - Cont. Con # 182140
U.S. RENAL CARE, INC. AND SUBSIDIARIES
Conso_lidated Statements of Operations
Years ended December 31, 2017 and 2016
(Dollars in thousands)
Net operating revenue: Net operating revenue before provision for doubtful accounts $
Less provision for doubtful accounts
Net operating revenue
Operating expenses: Patient care costs General and administrative Transaction and legal costs Depreciation and amortization Equity in earnings of unconsolidated affiliates
Total operating expenses
Operating income
Interest expense, net
Income before income taxes
Income tax (benefit) provision
Net income
Less net income attributable to noncontrolling interests
Net income attributable to U.S. Renal Care, Inc. $
See accompanying notes to consolidated financial statements.
3
2017 2016
1,251,992 1,179,783 35,486 41,209
1,216,506 1,138,574
823,032 745,304 92,165 80,750 8,378 14,867
93,147 81,278 (3,331) (3,598)
1,013,391 918,601
203,115 219,973
130,317 127,069
72,798 92,904
(8,790) 19,616
81,588 73,288
48,779 51,892
32,809 21,396
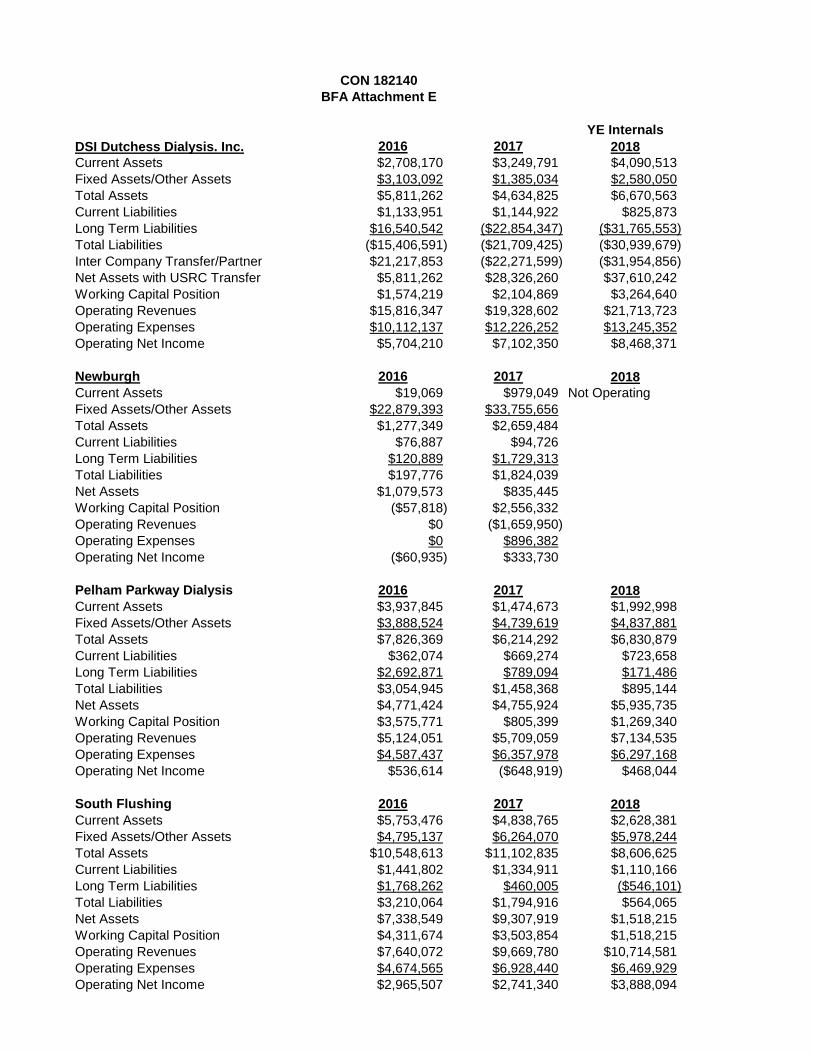
YE InternalsDSI Dutchess Dialysis. Inc. 2016 2017 2018Current Assets $2,708,170 $3,249,791 $4,090,513Fixed Assets/Other Assets $3,103,092 $1,385,034 $2,580,050Total Assets $5,811,262 $4,634,825 $6,670,563Current Liabilities $1,133,951 $1,144,922 $825,873Long Term Liabilities $16,540,542 ($22,854,347) ($31,765,553)Total Liabilities ($15,406,591) ($21,709,425) ($30,939,679)Inter Company Transfer/Partner $21,217,853 ($22,271,599) ($31,954,856)Net Assets with USRC Transfer $5,811,262 $28,326,260 $37,610,242Working Capital Position $1,574,219 $2,104,869 $3,264,640Operating Revenues $15,816,347 $19,328,602 $21,713,723Operating Expenses $10,112,137 $12,226,252 $13,245,352Operating Net Income $5,704,210 $7,102,350 $8,468,371
Newburgh 2016 2017 2018Current Assets $19,069 $979,049 Not OperatingFixed Assets/Other Assets $22,879,393 $33,755,656Total Assets $1,277,349 $2,659,484Current Liabilities $76,887 $94,726Long Term Liabilities $120,889 $1,729,313Total Liabilities $197,776 $1,824,039Net Assets $1,079,573 $835,445Working Capital Position ($57,818) $2,556,332Operating Revenues $0 ($1,659,950)Operating Expenses $0 $896,382Operating Net Income ($60,935) $333,730
Pelham Parkway Dialysis 2016 2017 2018Current Assets $3,937,845 $1,474,673 $1,992,998Fixed Assets/Other Assets $3,888,524 $4,739,619 $4,837,881Total Assets $7,826,369 $6,214,292 $6,830,879Current Liabilities $362,074 $669,274 $723,658Long Term Liabilities $2,692,871 $789,094 $171,486Total Liabilities $3,054,945 $1,458,368 $895,144Net Assets $4,771,424 $4,755,924 $5,935,735Working Capital Position $3,575,771 $805,399 $1,269,340Operating Revenues $5,124,051 $5,709,059 $7,134,535Operating Expenses $4,587,437 $6,357,978 $6,297,168Operating Net Income $536,614 ($648,919) $468,044
South Flushing 2016 2017 2018Current Assets $5,753,476 $4,838,765 $2,628,381Fixed Assets/Other Assets $4,795,137 $6,264,070 $5,978,244Total Assets $10,548,613 $11,102,835 $8,606,625Current Liabilities $1,441,802 $1,334,911 $1,110,166Long Term Liabilities $1,768,262 $460,005 ($546,101)Total Liabilities $3,210,064 $1,794,916 $564,065Net Assets $7,338,549 $9,307,919 $1,518,215Working Capital Position $4,311,674 $3,503,854 $1,518,215Operating Revenues $7,640,072 $9,669,780 $10,714,581Operating Expenses $4,674,565 $6,928,440 $6,469,929Operating Net Income $2,965,507 $2,741,340 $3,888,094
CON 182140BFA Attachment E
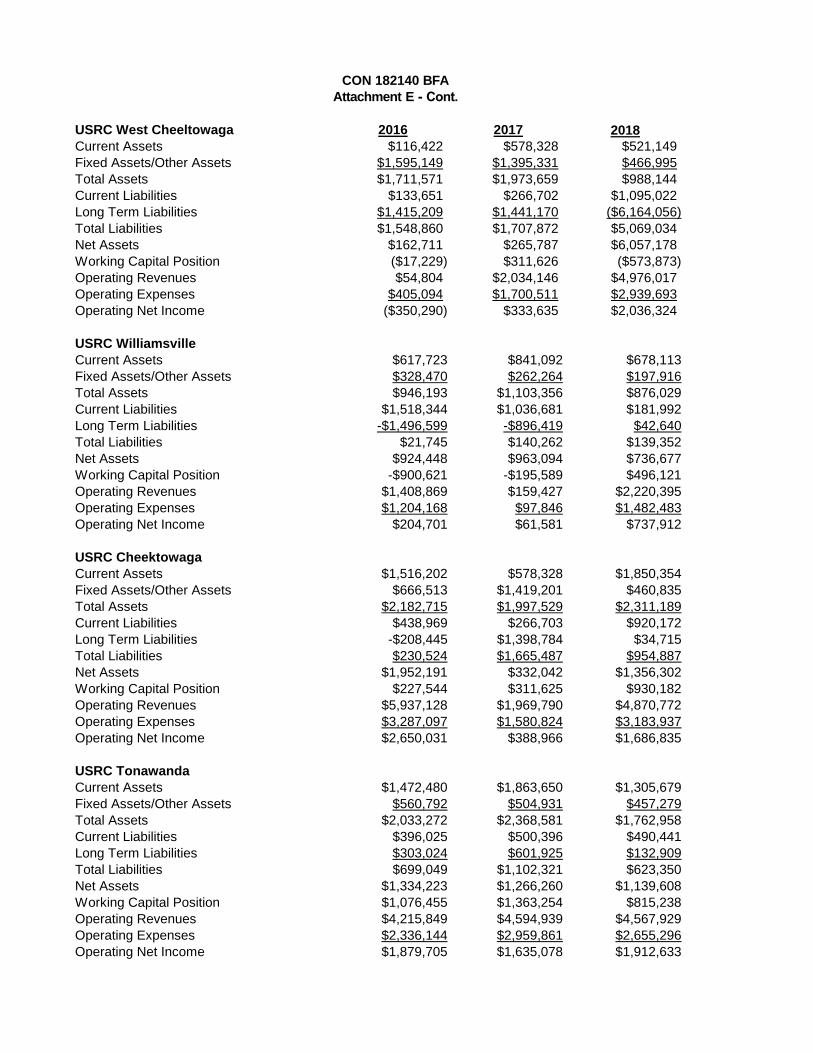
CON 182140 BFA Attachment E - Cont.
USRC West Cheeltowaga 2016 2017 2018Current Assets $116,422 $578,328 $521,149Fixed Assets/Other Assets $1,595,149 $1,395,331 $466,995Total Assets $1,711,571 $1,973,659 $988,144Current Liabilities $133,651 $266,702 $1,095,022Long Term Liabilities $1,415,209 $1,441,170 ($6,164,056)Total Liabilities $1,548,860 $1,707,872 $5,069,034Net Assets $162,711 $265,787 $6,057,178Working Capital Position ($17,229) $311,626 ($573,873)Operating Revenues $54,804 $2,034,146 $4,976,017Operating Expenses $405,094 $1,700,511 $2,939,693Operating Net Income ($350,290) $333,635 $2,036,324
USRC WilliamsvilleCurrent Assets $617,723 $841,092 $678,113Fixed Assets/Other Assets $328,470 $262,264 $197,916Total Assets $946,193 $1,103,356 $876,029Current Liabilities $1,518,344 $1,036,681 $181,992Long Term Liabilities -$1,496,599 -$896,419 $42,640Total Liabilities $21,745 $140,262 $139,352Net Assets $924,448 $963,094 $736,677Working Capital Position -$900,621 -$195,589 $496,121Operating Revenues $1,408,869 $159,427 $2,220,395Operating Expenses $1,204,168 $97,846 $1,482,483Operating Net Income $204,701 $61,581 $737,912
USRC CheektowagaCurrent Assets $1,516,202 $578,328 $1,850,354Fixed Assets/Other Assets $666,513 $1,419,201 $460,835Total Assets $2,182,715 $1,997,529 $2,311,189Current Liabilities $438,969 $266,703 $920,172Long Term Liabilities -$208,445 $1,398,784 $34,715Total Liabilities $230,524 $1,665,487 $954,887Net Assets $1,952,191 $332,042 $1,356,302Working Capital Position $227,544 $311,625 $930,182Operating Revenues $5,937,128 $1,969,790 $4,870,772Operating Expenses $3,287,097 $1,580,824 $3,183,937Operating Net Income $2,650,031 $388,966 $1,686,835
USRC TonawandaCurrent Assets $1,472,480 $1,863,650 $1,305,679Fixed Assets/Other Assets $560,792 $504,931 $457,279Total Assets $2,033,272 $2,368,581 $1,762,958Current Liabilities $396,025 $500,396 $490,441Long Term Liabilities $303,024 $601,925 $132,909Total Liabilities $699,049 $1,102,321 $623,350Net Assets $1,334,223 $1,266,260 $1,139,608Working Capital Position $1,076,455 $1,363,254 $815,238Operating Revenues $4,215,849 $4,594,939 $4,567,929Operating Expenses $2,336,144 $2,959,861 $2,655,296Operating Net Income $1,879,705 $1,635,078 $1,912,633
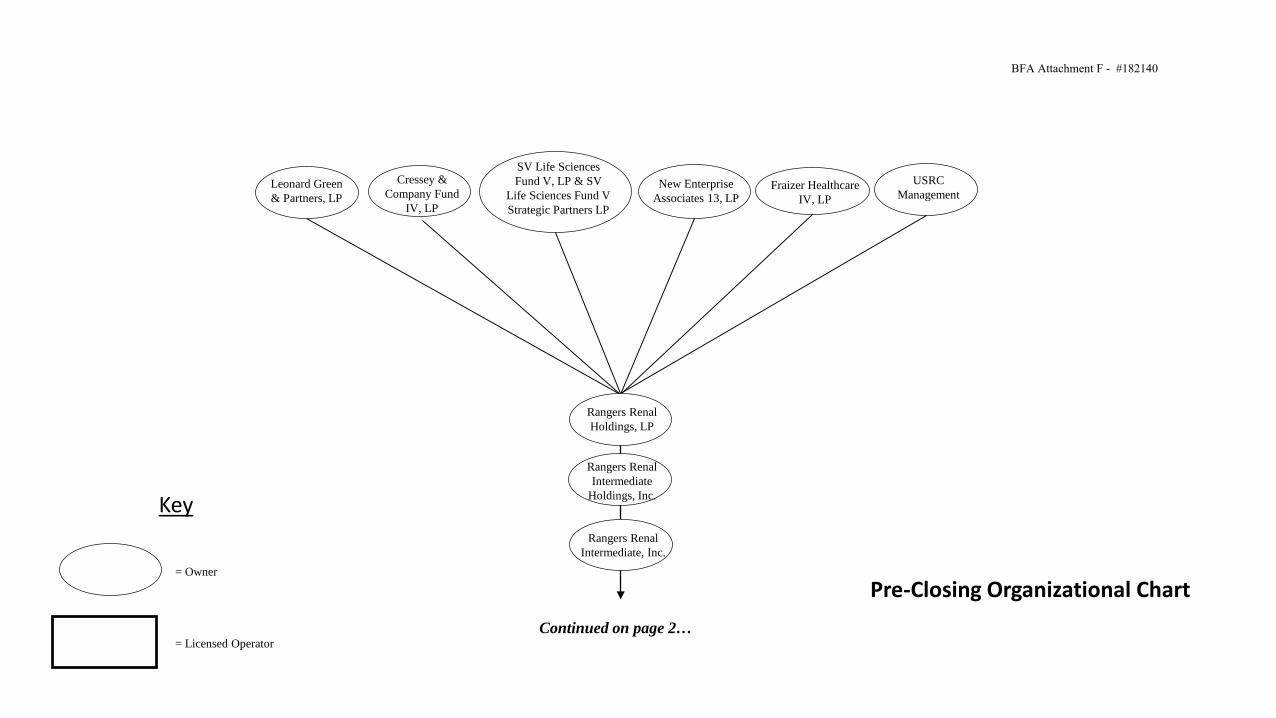
Leonard Green & Partners, LP
New Enterprise Associates 13, LP
Cressey & Company Fund
IV, LP
USRC Management
Fraizer Healthcare IV, LP
SV Life Sciences Fund V, LP & SV
Life Sciences Fund V Strategic Partners LP
Pre-Closing Organizational Chart
Rangers Renal Intermediate
Holdings, Inc.
Rangers Renal Intermediate, Inc.
Continued on page 2…
= Owner
= Licensed Operator
Key
Rangers Renal Holdings, LP
BFA Attachment F - #182140
C)
D
__ C)

Heather Wheat
Kristen Matteson
Richard Steinacher
U.S. Renal Care Inc.
DSI Dutchess Dialysis, Inc.
USRC Pelham, LLC
Wei Yue Sun, MD
USRC West Cheektowaga, LLC
USRC Cheektowaga, Inc.
USRC South Flushing, LLC
DSI Newburgh, LLC*
Dialysis Newco, Inc.
USRC Tonawanda, Inc.
45% 55%
USRC Alliance, LLC
USRC Appalachian Partners, LLC
IHS Dialysis, Inc.
55%
70%
100%100%
30%
USRC Forest Hills, LLC
51%
29%
USRC Williamsville, Inc.
L.E.D.P., LLC
Laurel Win Yap, MD
Li Yang, MD
Elizabeth Liang, MD
5%
5%
5%
5%
55% 45%
45% 45% 55%
Paul Feldman, M.D.
Yong Wen, M.D.
100%
100%
51%
24.5%
24.5%
Dialysis Holdco, LLC
100%
100%
LEDP II, LLC
= Owner
= Licensed Operator
Key*DSI Newburgh, LLCapplication pending
… continued from Page 1
Arundathi Namassivaya
Maria Concepcion V, Del Castillo
20%
20%
20%
20%
20%
Heather Wheat, MD
Kristen A. Matteson. DO
Maria C.V. Del Castillo, MD
Arundathi Namassivaya, MD
Nelson Shaller
100%
25%
25%25%
25%
BFA Attachment F- Cont. #182140
C)
D
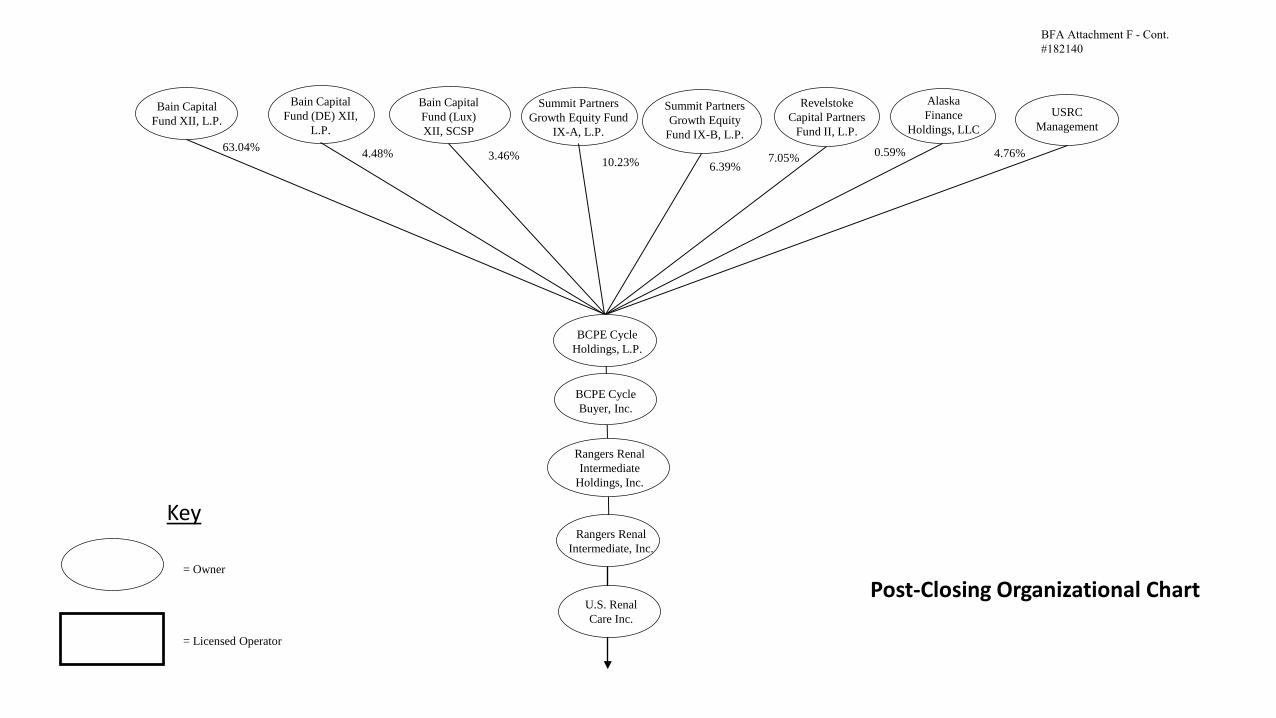
Bain Capital Fund XII, L.P.
Summit Partners Growth Equity Fund
IX-A, L.P.
Bain Capital Fund (DE) XII,
L.P.
Bain Capital Fund (Lux) XII, SCSP
Summit Partners Growth Equity
Fund IX-B, L.P.
Revelstoke Capital Partners
Fund II, L.P.
Alaska Finance
Holdings, LLC
USRC Management
Post-Closing Organizational Chart
Rangers Renal Intermediate
Holdings, Inc.
Rangers Renal Intermediate, Inc.
BCPE Cycle Buyer, Inc.
U.S. Renal Care Inc.
= Owner
= Licensed Operator
Key
BCPE Cycle Holdings, L.P.
63.04% 4.48% 3.46% 10.23% 6.39%7.05% 0.59% 4.76%
BFA Attachment F - Cont. #182140
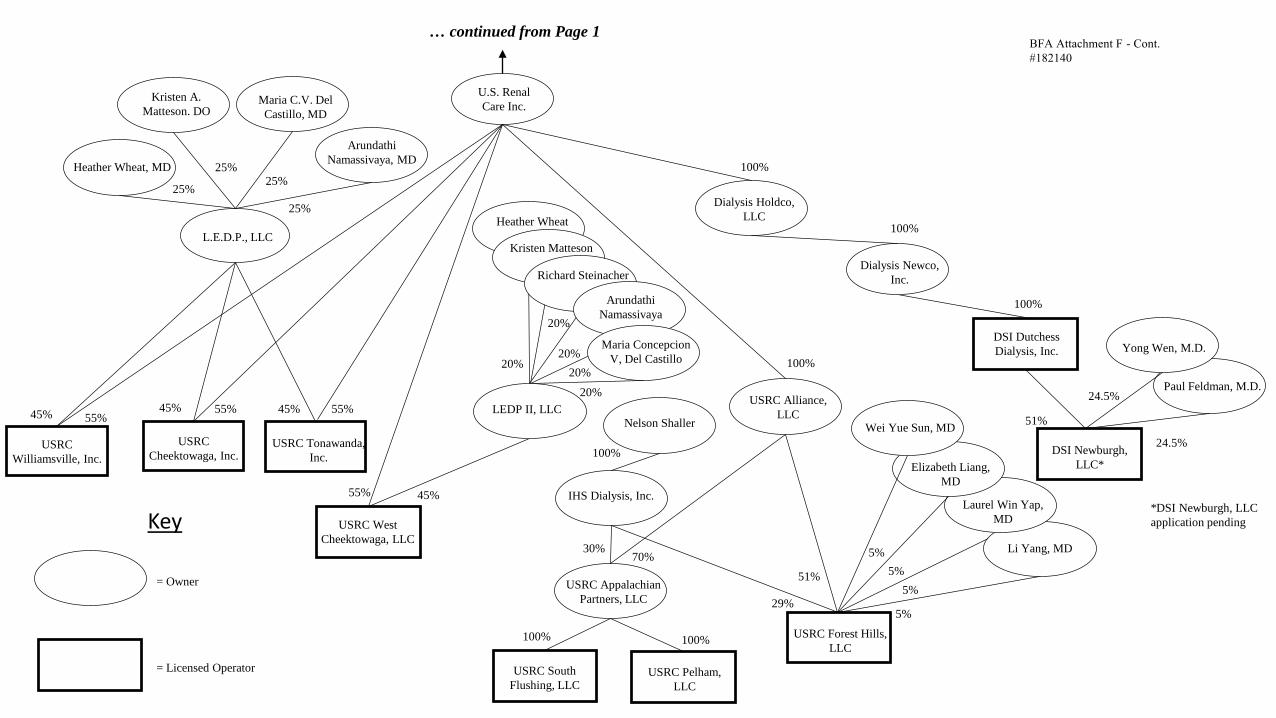
Heather Wheat
Kristen Matteson
Richard Steinacher
U.S. Renal Care Inc.
DSI Dutchess Dialysis, Inc.
USRC Pelham, LLC
Wei Yue Sun, MD
USRC West Cheektowaga, LLC
USRC Cheektowaga, Inc.
USRC South Flushing, LLC
DSI Newburgh, LLC*
Dialysis Newco, Inc.
USRC Tonawanda, Inc.
45% 55%
USRC Alliance, LLC
USRC Appalachian Partners, LLC
IHS Dialysis, Inc.
55%
70%
100%100%
30%
USRC Forest Hills, LLC
51%
29%
USRC Williamsville, Inc.
L.E.D.P., LLC
Laurel Win Yap, MD
Li Yang, MD
Elizabeth Liang, MD
5%
5%
5%
5%
55% 45%
45% 45% 55%
Paul Feldman, M.D.
Yong Wen, M.D.
100%
100%
51%
24.5%
24.5%
Dialysis Holdco, LLC
100%
100%
LEDP II, LLC
= Owner
= Licensed Operator
Key*DSI Newburgh, LLCapplication pending
… continued from Page 1
Arundathi Namassivaya
Maria Concepcion V, Del Castillo
20%
20%
20%
20%
20%
Heather Wheat, MD
Kristen A. Matteson. DO
Maria C.V. Del Castillo, MD
Arundathi Namassivaya, MD
Nelson Shaller
100%
25%
25%25%
25%
- Cont.BFA Attachment F #182140
C)
D

HSP Attachment A - CON 182140 DSI Newburgh, LLC - STAR RATNGS
Facility Name Address Star Rating
DSI Dutchess Dialysis Inc. d/b/a DSI Dutchess Dialysis 2585 South Road Poughkeepsie, NY 12601
DSI Dutchess Dialysis Inc. d/b/a DSI Newburgh Dialysis 39 North Plank Road Newburgh, NY 12550-2124
USRC Cheektowaga Inc.d/b/a U.S. Renal Care Cheektowaga 2875 Union Road Suite 13 C/D Cheektowaga, NY 14225
USRC Pelham, LLC d/b/a U.S. Renal Care Pelham Parkway Dialysis
1400 Pelham Parkway South Building 5 Bronx, NY 10461-1138
USRC South Flushing, LLC d/b/a U.S. Renal Care South Flushing Dialysis
71-12 Park Ave Flushing, NY11365-4105
USRC Tonawanda, Inc d/b/a U.S. Renal Care Tonawanda Dialysis
3161 Eggert Road Tonawanda, NY 14150
USRC West Cheektowaga, LLC d/b/a U.S. Renal Care Amherst Dialysis
2880 Sheridan Drive Tonawanda, NY 14150-9419 Not Available
USRC West Cheektowaga, LLC d/b/a U.S. Renal Care West Cheektowaga
2681 Harlem Road Cheektowaga, NY 14225-9998
USRC Williamsville, Inc d/b/a U.S. Renal Care Williamsville Dialysis
7964 Transit Road Suite 8-A Williamsville, NY 14421
•• •
. · *··· •• ·• •
·•• ••
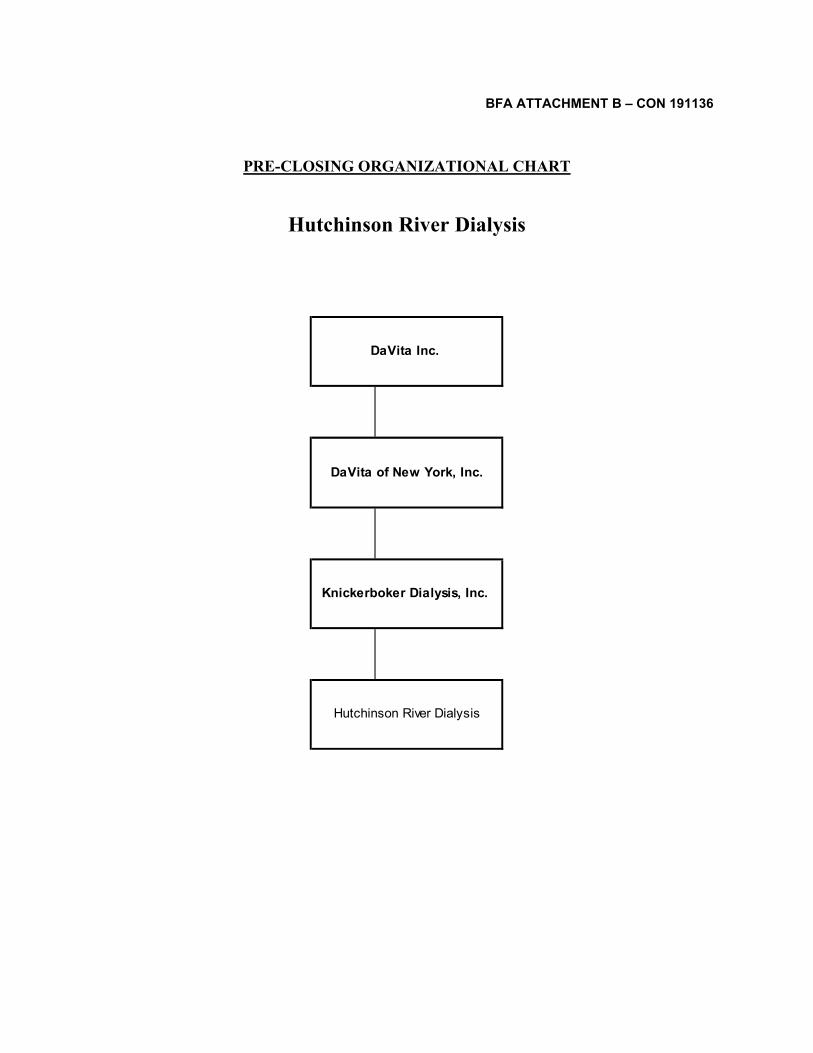
BFA ATTACHMENT B – CON 191136
PRE-CLOSING ORGANIZATIONAL CHART
Hutchinson River Dialysis
DaVita of New York, Inc.
Knickerboker Dialysis, Inc.
Hutchinson River Dialysis
DaVita Inc.
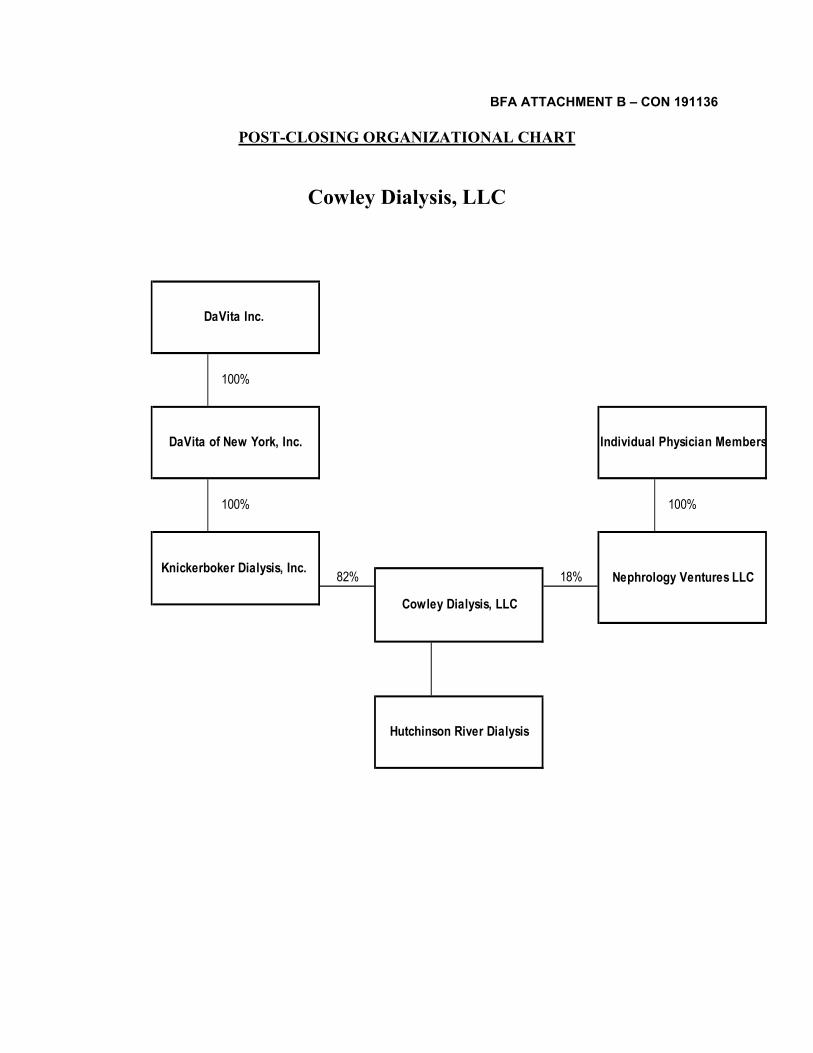
BFA ATTACHMENT B – CON 191136
POST-CLOSING ORGANIZATIONAL CHART
Cowley Dialysis, LLC
100%
100% 100%
82% 18%
Cowley Dialysis, LLC
Hutchinson River Dialysis
Individual Physician Members
Nephrology Ventures LLC
DaVita Inc.
DaVita of New York, Inc.
Knickerboker Dialysis, Inc.
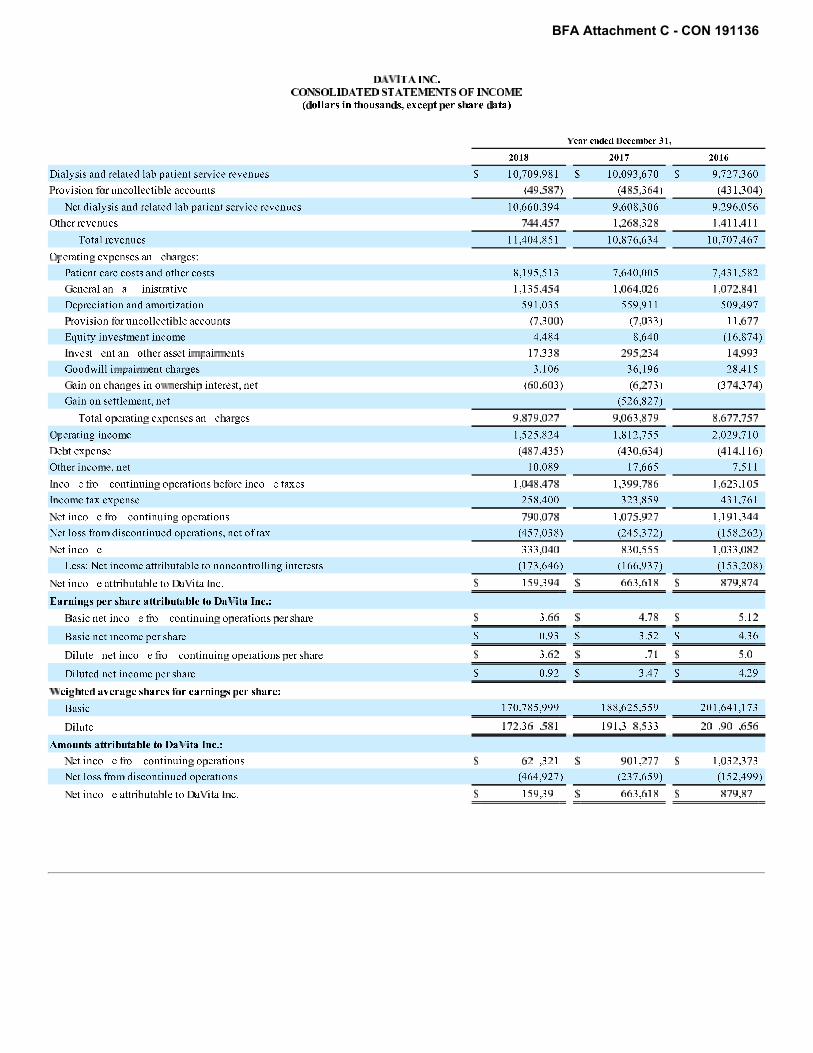
BFA Attachment C - CON 191136
D .ffAINC. CONSOLIDATED STATEMENTS OF INCOME
(dollars in thousands, except per share data)
Year ended December 31,
Dialysis and related lab patient service revenues
Provision foruncollectible accounts
Net dialysis and related lab patient service revenues
Other revenues
Total revenues
Qi:erating expenses an charges:
Patient care costs and other costs
General an a inistrative
Depreciation and amortization
Provision for uncollectible accounts
Equity investment income
Invest ent an other asset i paim,ents
Goodwill impairn,ent charges
Gain on changes in ov.'llership interest, net
Gain on settlement, net
Total operating expenses an charges
~ erating income
Debt expense
Other income, net
lnco e fro continuing operations before inco e taxes
Income tax expense
Net inco e fro continuing operations
Net loss from discontinued operations, net of tax
Net inco e
Less: Net income attributable to noncontrolling interests
Net inco e attributable to DaVita Inc.
Earnings per share attributable to Da\Jita Inc.:
Basic net inco e fro continuing operations per share
Basic net income per share
Dilute net inco e fro continuing operations per share
Di luted net income per share
'eighted average shares for earnings per share:
Basic
Dilute
Amounts attributable to Da\Jita Inc.:
Net inco e fro continuing operations
Net loss from discontinued operations
Net inco e attributable to DaVita Inc.
$
$
$
$
$
$
$
$
2018
10,709,98 1 $
(49,587)
10,660,394
744,457
11 ,404,851
8,195,513
1,135 ,454
591 ,035
(7,300)
4,484
17,338
3,106
(60,603)
9,879,027
1,525,824
(487,435)
10,089
1,048 ,478
258,400
790,078
(457,038)
333,040
(173,646)
159,394 $
3.66 $
0.93 $
3.62 $
0.92 $
170,785 ,999
172,36 ,58 1
62 ,321 $
(464,927)
159,39 $
2017 2016
10,093 ,670 $ 9,727,360
(431,304) (485,364)
9,608,306
1,268,328
10,876,63 4
7,640,005
1,064,026
559 ,9 I I
(7,033)
8,640
295,234
36,196
(6,273)
(526,827)
9,063,879
1,8 I 2,755
(430,634)
17,665
1,399,786
323,859
1,075 ,927
(245,372)
830,555
(I 66,937)
9,296,056
1,411 ,411
10,707,467
7,431,582
1,072,841
509 ,497
11 ,677
(16,874)
14,993
28,415
(374,374)
8,677,757
2,029,7 I 0
(414,116)
7,511
1,623,105
431 ,76 1
1,191,344
(158,262)
1,033,082
(153,208)
663,618 $ 879,874 =======
4~8 $ 5.12 =======
3.52 $ 4.36 =======
.71 $ 5.0 =======
3A7 $ 429
188,625 ,559
191 ,3 8,533
901,277 $
(237,659)
663,618 $
201,641,173
20 ,90 ,656
1,032,373
(152,499)
879,87 =======

BFA Attachment C - CON 191136
D .ffAINC. CONSOLIDATEDB ·m .NCE SHEETS
(dollars in thousands, except per share data)
Cash an cash equivalents
Restricted cash and equivalents
hort-term invest···ents
Accounts receivable, net
Inventories
Other receivables
Prepai an other current assets
Income tax receivable
Current assets he! for sale, net
Total current assets
Property an equip--· ent, net
Intangible assets, net
Equity ···etho an other invesi---ents
Long-term investments
Other long-term assets
Goodwill
ASSETS
LI 'RILITIES J,,'Jl EQUITY
Accounts payable
Other liabilities
Accrue compensation an bene _ ts
Current portion oflong-term debt
Current liab ilities he! for sale
Total current liabilities
Long-term ebt
Other long-term liabilities
Deferre inco--·e taxes
Total liabilities
Com1111ii---ents an contingencies:
Noncontrolling interests subject to put provisions
Equity:
Preferred stock ($0,00 I par value, 5,000 ,000 shares authorized; none issued)
Co 11110n stock ($0.001 par value, 50,000,000 shares authorize ; I ,387,307 an 182, 2,278 shares issue an outstan ing, respectively)
Additional paid-in capital
Retaine earnings
Accumulated other comi:;rehensive (loss) income
Total DaVita Inc. sharehol ers' equity
Noncontrolling interests not subject to put provisions
Total equity
$
$
$
$
December 31, 2018
323,038 $
92,382
2,935
1,858,608
107,381
469 ,796
111 ,8 0
68,614
5,389,5 5
8,424,159
3,393, 9
I 18 ,846
22 , 11
35,424
71,583
6,841,960
19,110,252 $
December 31, 2017
508,23
10,686
32,830
1,7 14,750
181 ,799
399,262
112,058
49,440
5,7 1, 2
8,770,701
3,1 9,213
I 13 ,827
2 5,53
37,695
7,287
6,610,279
18,97 ,53 ========
3,270 $
595,850
58,913
1,929,369
1,2 3,759
4,891,161
8,172,8 7
450,669
5 2,53
14,077 ,213
1,124,641
995,006
2,7 3,19
(34,924)
3,703, 2
204,956
3,908,398
19,110,252 $
509 ,11
579,005
1 ,11
178,2 I 3
1,185,070
3,067,520
9,158,018
365,325
8 ,2 7
13,077,110
1,011 ,360
182
1,042 ,899
3, 33,713
13 ,235
, 90,029
196,037
,88 ,0
18,974,536 ========
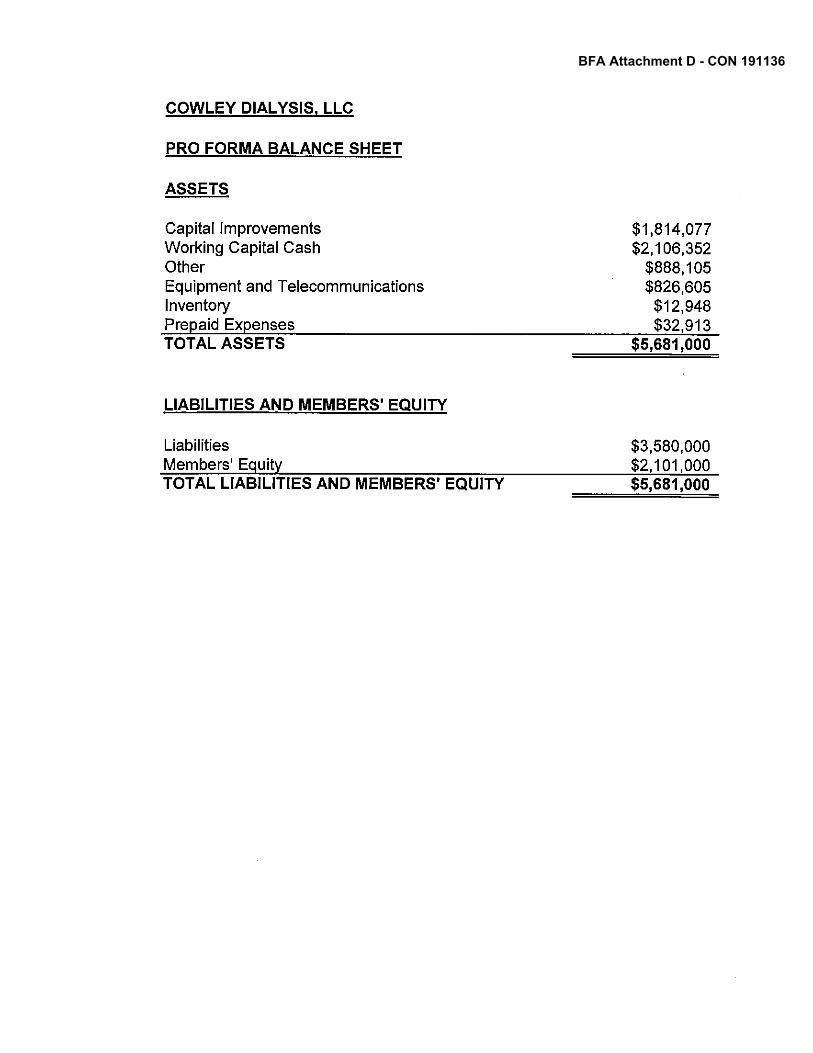
BFA Attachment D - CON 191136
COWLEY DIALYSIS, LLC
PRO FORMA BALANCE SHEET
ASSETS
Capital Improvements Working Capital Cash Other Equipment and Telecommunications Inventory Prepaid Expenses TOTAL ASSETS
LIABILITIES AND MEMBERS' EQUITY
Liabilities Members' Equity TOTAL LIABILITIES AND MEMBERS' EQUITY
$1,814,077 $2,106,352
$888,105 $826,605 $12,948 $32,913
$5,681,000
$3,580,000 $2,101,000 $5,681,000
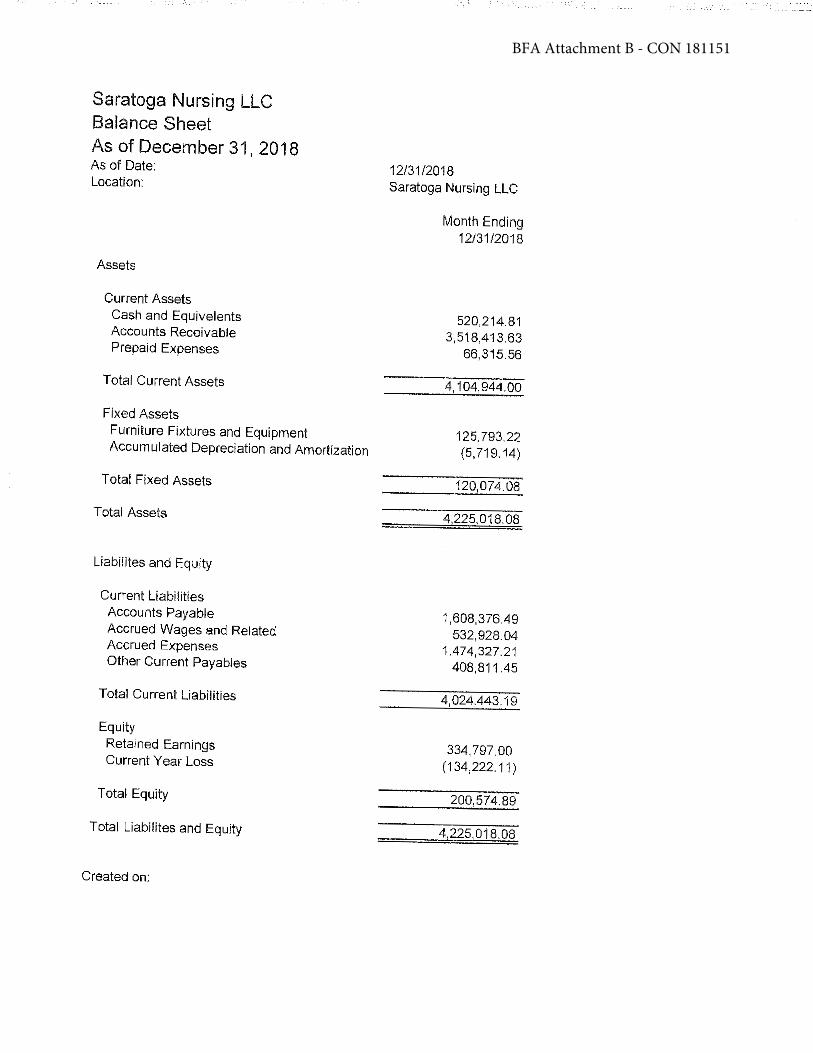
BFA Attachment B - CON 181151
Saratoga Nursing LLC Balance Sheet As of December 31, 2018 As of Date: Location:
Assets
Current Assets Cash and Equivelents Accounts Receivable Prepaid Expenses
Total Current Assets
Fixed Assets Furniture Fixtures and Equipment Accumulated Depreciation and Amortization
Total Fixed Assets
Total Assets
Liabilites and Equity
Current Liabilities Accounts Payable Accrued Wages and Related Accrued Expenses Otl1er Current Payables
Total Current Liabilities
Equity Retained Earnings Current Year Loss
Total Equity
Total Liabilites and Equity
Created on:
12/31/2018 Saratoga Nursing LLC
Month Ending 12/31/2018
520,214.81 3.518,413.63
66,315.56
4,104,944.00
125,793.22 (5,719.14)
120,074.08
4,225,018 08
1,608,376.49 532,928.04
1,474,327.21 408,811.45
4,024,443,19
334,797.00 (134,222.11)
200,574,89
4 225 018.08
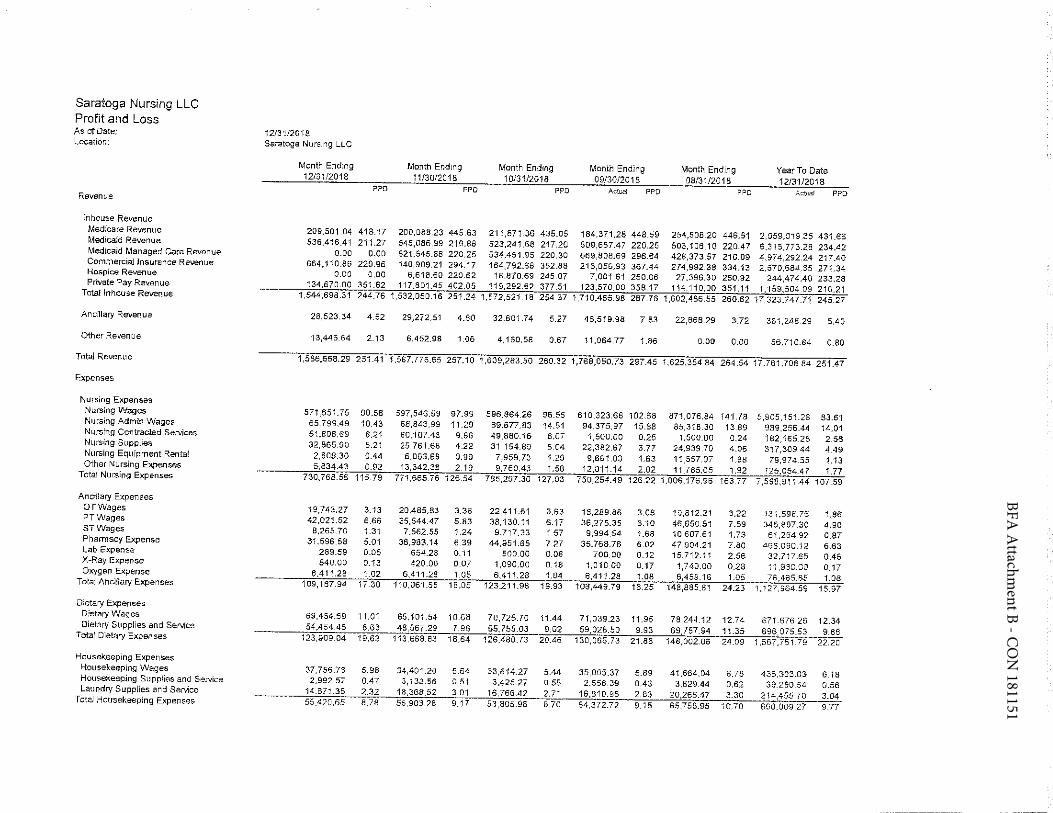
BFA A
ttachment B - C
ON
181151
Saratoga Nursing LLC Profit and Loss As of Date; 12/31/2018 Locatlon: Saratoga Nursing LLC
Month Ending Month Ending Month Ending Month Ending Month Ending Year To Date 12/31/2018 11/30/2018 10/31/2018 09/30/2018 08/31/2018 12131/2018
??D PPD PPD Aclwal PPD PPD ?.ctval PPD Revem1e
lnhouse Revenue Medicare Revenue 209,501.04 418.17 200,0-88.23 445,63 211,871.36 435.05 184,371.28 448.59 254,508-20 446.51 2,059,019.35 431.66 Medicaid Revenue 536.416.41 211.27 545,086,99 219,88 523,241.68 217.20 509,657.47 220.25 503,106, 10 220.47 6,315,773.28 234.42 Medicaid Managed Care Revenue 0,00 0.00 521,545.68 220.25 534,451.95 220.30 669,808.69 296.64 428,373.57 210.09 4,974,292 24 217.40 Comrnercla! Insurance Revenue 664,110.86 229.96 140,909.21 294.17 164,792.88 352.88 216,056,93 367.44 274,99-2.38 334. 13 2,570.684.35 271.34 Hospice Revenue 0.00 0,00 6,618.60 220,62 18,870.69 245.07 7,001.61 250.06 27,396.30 260.92 244,474.40 233.28 Private Pay Revenue 134,670.00 351.62 117,801.45 402.05 119,292.62 377.51 123,570.00 358.17 114.110,00 351.11 1,159,504 09 210.21 Tota! fnhouse Revenue 1,544,698.31 244.76 1,532,050.16 251.2'1 1,572,521.18 254.37 1,710,465.98 287.76 1,602,486.55 260.62 17,323.747.71 245.27
Ancill.ary Revenue 28,523.34 4.52 29,272.51 4.80 32,601.74 5.27 46,519.98 7.83 22,868.29 3.72 381,248.29 5.40
Other Revenue 13,446.64 2.13 6,452.98 1.06 4,160.58 0.67 11,064 77 1.86 0.00 0.00 56,710.84 0,80
Total Revenue 1,585,668.29 251.41 1,567.775.65 257.10 1,609,283.50 260.32 1,768,050.73 297.45 1,625,35484 264.54 17J61,706.84 251.47
Expenses
Nursing Expensas NLirsfng Wages 571,651.75 90.58 597,546,59 97.99 596.864.26 96.55 610,323.68 102.68 871,076.84 i41.78 5,905,151."26 83.61 Nursing Admin Wages 6-5,799.49 10.43 68,843.99 11.29 89.677.83 14,51 94,375,97 15.88 85.318.30 13.89 989,256-44 14.01 Nursing Contracted Services 5 1,,808,69 821 60,107.43 9.86 49,880.16- 8.07 1,500.00 0,25 1,500.00 024 182,165.28 2.58 NL1rsing Supplies 32,865.90 5.21 25,761.68 4.22 31,154.89 5.04 22,382.67 3.77 24,939.70 4,06 317,3-09 44 4.49 Nursing Equipment Rental 2,808.30 0.44 6,063.69 0.99 7,959.73 1.29 9,661.03 1.63 11_557.07 1.88 79,974.55 1.13 Other Nursing Expenses 5-,834.43 0.92 13,342.38 2,19 9,760.43 1.58 12,011.14 2.02 11,785.05 1.92 125,054.47 1.77 Total Nursing Expenses 730,768.56 115.79 771,665.(6 126.54 785,297.30 127,03 750,254.49 126.22 1,006,176,96 163.77 7,598,911.44 107.59
AncijJary Expenses OT Wages 19,743.27 3."13 20,485.83 3.36 22,411.61 3.63 18,289.86 3.08 19,812.21 3.22 131.598.75 1.86 PT Wages 42,021.52 6.66 35,544.47 5.63 38,130.11 6.17 36,275.35 6.10 46,650.51 7.59 345.897.30 4.90 ST Wages 8,265.70 1.31 7,562.55 1.24 9,717.33 1 57 9,994,54 1.68 10,607.61 1.73 6i ,264 92 0.87 Phamiacy Expense 31.596.58 5.01 38,983. i4 6.39 44,951.65 7.27 35.768.76 6.02 47,904.21 7.80 466-090.12 6.63 Lab Experise 289.59 0.05 654.28 0, 1i 500,00 0.08 700.00 0.12 15,712.11 2.56 32,717.65 0.46 X-Ray Expense 840.00 0.13 420.00 0.07 1,090.00 0.18 i ,010_00 0.17 1,740.00 0.28 1:,930.00 0.17 Oxygen Expense 6.411.28 1.02 s,4·r1.2s 1,05 s.41·J.2e 1.04 6,411.28 1.08 6,459.16 1.05 76,465.85 1.08 Total Ancmary EXpenses 109,167.94 17.30 110.061.55 18.05 123.211 .98 19.93 iOS,449,79 18.25 148,885.81 24.23 1,127,964 59 15.97
Dietary Expenses Dietary Wages 69,454.59 11.01 65,101.54 10.68 70,725.70 11.44 71,039.23 11.95 78,244.12 12.74 871,676.26 12.34 Dietary Supplies and SeNice 54.454.45 8.63 48,567.29 7.96 55,755.03 9.02 59,026.50 9.93 69,757.94 1 i.35 696.075.53 9.86 Total Dietary Expenses 123,909.04 19,63 113,668.83 18,64 126,480.73 20.46 130,065.73- 21.88 148,002,06 24.09 1,56r,r51.79 22,20
Housekeeping Expenses Housekeeping Wages 37,756.73 5.98 34,401.20 5.64 33,614.27 5.44 35,005.37 5.89 41,664.04 6.?S 436,303.03 6.18 Housekeeping Supplies and Servk:e 2,992.57 0.47 3,133.56 0.51 3,425.27 0.55 2,556.39 0.43 3,829.44 0.62 09250.54 0.56 Laundry Supplies and Service 14.671.35 2.32 18.368.52 3.01 16,766 42 2.71 16,810.96 2.83 20,265.47 3.30 214A55 70 3.04 Total Housel-;eeping Expenses 55.420,65 8.78 55,903.28 9.17 53,805.96 8.70 54,372.72 9, 15 65,758.95 i0.70 690,009.27 9.77
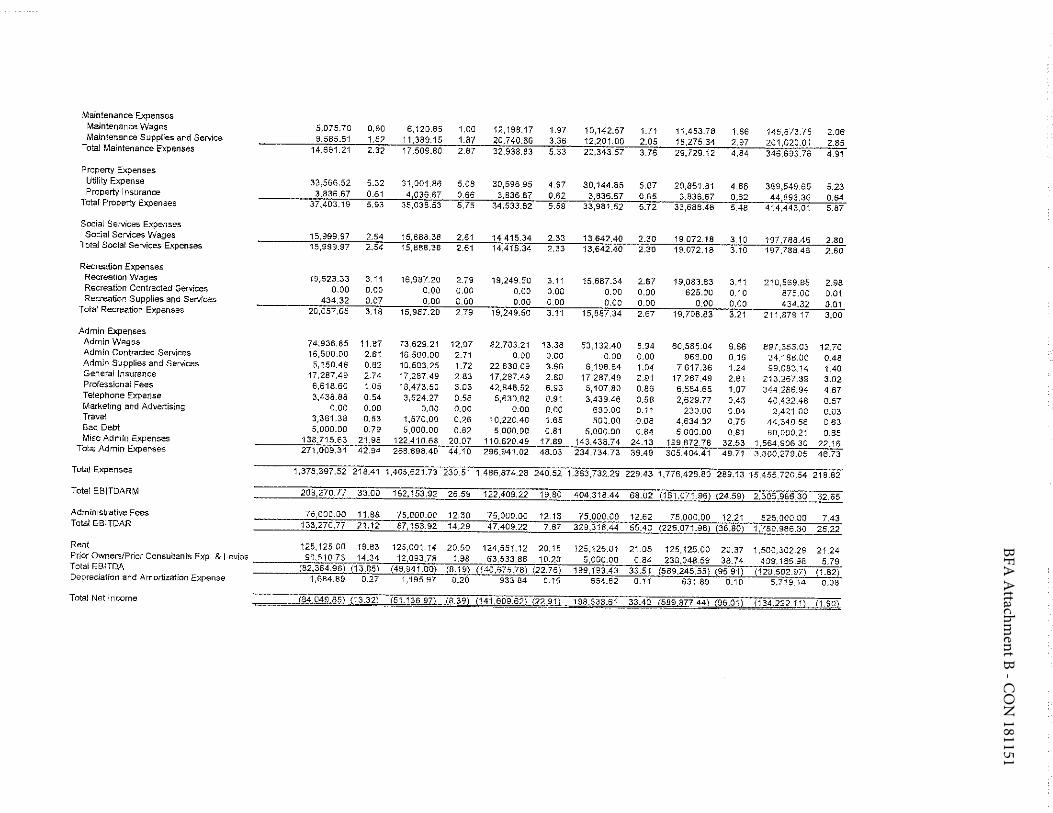
BFA A
ttachment B - C
ON
181151
Maintenance ExpenSBs Maintenance Wages 5,075.70 0,80 6,120.65 1.00 12,198.17 1.97 10,142.57 1.71 11.453.78 1.86 145,673.75 2,06 Maintenance Suppties and Service 9,585.51 1.52 11,389.15 1.87 20,740,66 :us 12,201.00 2.05 18,275.34 2.97 201,020.01 2.85 Total Maintenance Expenses 14,661.21 2.12 17,509.80 2,87 32,938.83 5.33 22,343.57 3.76 29,129.12 4.84 346,693.76 4.91
Property Expenses Utitity Expense 33,566,52 5.32 31,001.86 5,08 30,696.95 4.97 30,144.85 5.07 29,851.61 4.86 369,549.65 5.23 Property Insurance 3,836.67 0,61 4'°36.67 0.66 3)!36.67 0.62 3,836.67 0.65 3.836 67 0.62 44,893.36 0.64 Total Property Expenses 37,403.19 5,93 35,036,53 5,75 34,533,62 5,59 33,981.52 5.72 33,686.48 5.48 414.443,01 5.87
Social Seivices Expenses Social Services Wages 15.999.97 2,54 15,888.38 2.51 14,415.34 2.33 13,642.40 2.30 19,072.18 3. to 197,788.46 2.80 Total Social Services Expenses 15,999.97 2.54 15,888.38 2.61 14,415.34 2.33 13,642.40 2.30 19.072.18 3.10 197,788.46 2.80
Recreation Expenses Recrealion Wages 19,623.33 3.11 16,987.20 2.79 19,249.50 3.11 15,887.34 2.67 19,083,83 3, 11 210,569 . .B5 2.98 Recreation Contracted Services 0.00 □.00 0.00 0.00 0,00 0.00 0.00 0.00 625.00 0.1 a 875,00 0.0t Recreatioo Sup plies and Services 434.32 0.07 0,00 0.00 0.00 0.00 0.00 0.00 0.00 0.00 434.32 0.01
Total Recreation Expenses 20,057.65 3.18 16,987.20 2.79 19,249.50 3.11 15,881.34 2.67 19,708.63 3,21 211,87917 3.00
Adrnin Expenses Admin Wages 74,936.85 11.87 73,629.21 12.07 82,703 21 13.38 53,132.40 8.94 60,585.04 9.86 897,353.03 12.70 Admin Con1racted Services 16,5D0,00 2.61 16,500.00 2.71 0.00 0.00 0.0D 0.00 963.00 0.16 34.188.00 0.48 Ad min Supplies and Services 5,150.46 0.82 10,603.25 1.72 22,630.09 3.86 6,198.84 1.04 7,617.36 1.24 99,083.14 1.40 General Insurance 17,287.49 2.74 17,287.49 2,83 17,287.49 2.80 17,287.49 2.91 17,287.49 2,81 213,267.30 3.02 Professional Fees 6,618.60 1.05 18A73.so 303 42,848.52 6.93 5, 107.BO 0,86 6,584,65 1.07 344,286.94 4.87 Te!ephone Expense 3,438,88 0.54 3,524.27 0.58 5,630.82 0.91 3,439.46 0.58 2,629]7 0.43 401432,48 0.57 Marketing and Advertising 0.00 o.oo 0,00 o.oo 0.00 0.00 630.00 D.11 230.00 0.04 2,421.DC 0.03 Travel 3,361.38 0.53 1,570.00 0.26 10,220AO 1.65 500.00 0,08 4,634.32 0.75 44,340.56 0.63 Bad Debt 5,000.00 0.79 5,000.00 0.82 5,000.00 0.81 5,000,00 0,84 5,000.00 0.81 60,000.21 085 Misc Adm in Expen= 138,715.63 21,96 122,410.68 20.07 110,620.49 17.89 143,438.74 24.13 199,872.78 3253 ·1 ,564,906 30 22.16 Total Adrnir, Expenses 271,009.31 42.94 268.898.40 44.10 296,941.02 48.03 234,734.73 39.49 305,404.41 49.71 3.300.279 05 46.73
Total Expenses 1,373,397.52 218.41 1,405,621.73 230.51 1,486,874.28 240,52 1,363,732.29 229.43 1,176,426.80 289.13 15,455.720 54 218,82
Total EB!TDARM 208,270.77 33.00 162,153.92 26.59 122,409.22 19.80 404.318.44 68.02 (151,071.96) (24.59) 2,305,985.30 32.65
Administrative Fees 75,000.00 11.SS 75,000.00 12.30 75,000.00 12 13 75,000,00 12.62 75.000.00 12.21 525,QOOOO 7.43 Total EBITDAR 133,270,77 21.12 87,153.92 14.29 47.409.22 7.6, 329,318.44 55.40 (226,071.96) (36.SO) I ,780.9S6.30 25.22
Rent 125,125.00 19.83 125,001 14 20.50 124,55·1.-12 20.15 125.~25.01 21.05 125,125.00 20,37 1,500,302 28 21.24 Prior O,vners/Prior Consultants Exp. & Levies 90,510.73 14.34 12,093.78 1,98 63,.533,88 10.28 5,000.00 0.84 238,048.59 JB.74 409,185.98 5.79 Total EB!TDA [82,364.96) (13.051 (49,941.00} (8.19) (140,&75.78) (22.76) 199, 1S3.43 33.51 (589,245.55) (95.91) (128,502.97) (1.82) Depreciatron and Am ortizalion Expense 1,684.89 0.27 1,195.97 0.20 933 84 0.15 654.82 0.11 631.89 0.10 5,719.14 0.08
Total Net Income (84 049.85) (13.3?) (5U36.971 (8.39) (141 609.62) (22.911 198.538.61 33.40 (~89 877.44) (96.01) (134.22? ·,1) 11.90)
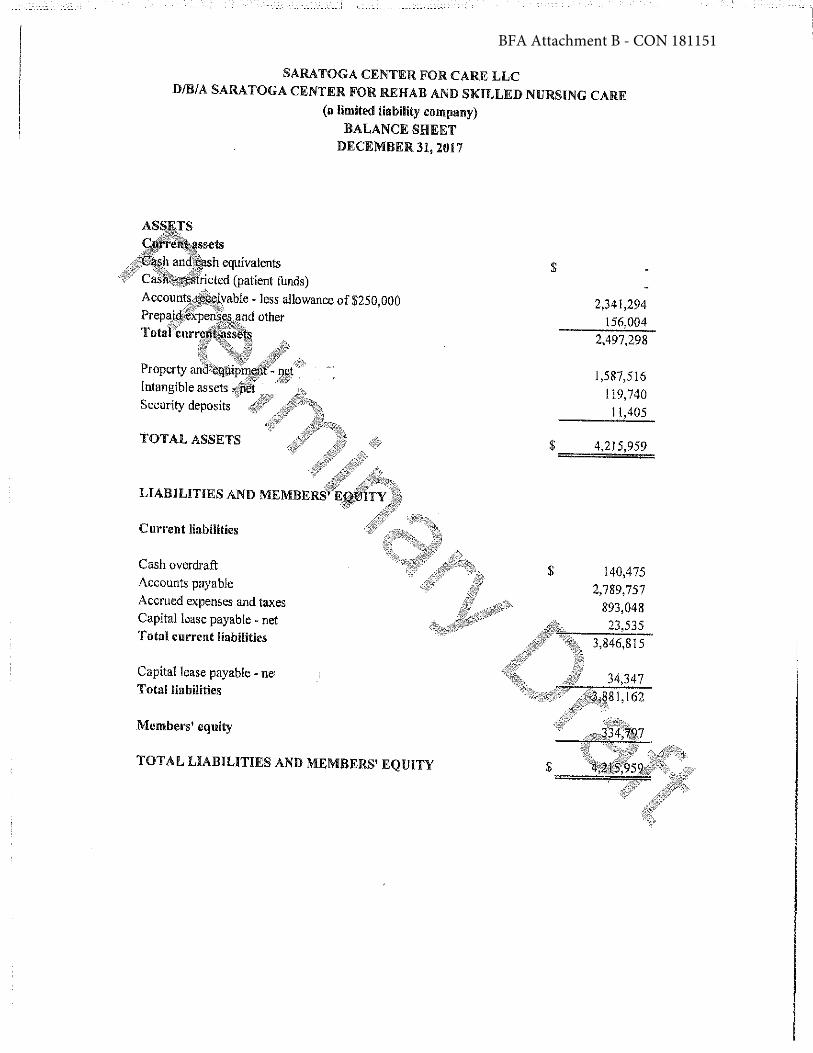
BFA Attachment B - CON 181151
SARATOGA CENTER FOR CARE LLC D/B/A SARA TOGA CENTER FOR REHAB AND SKILLED NURSING CARE
(a limited liability company} BALANCE SHEET
DECEMBER 31, 2017
ssets h equivalents
· cted (patient funds) able M less allowance of$250,000
TOTAL ASSETS
LIABILITIES AND MEMBE
Current liabilities
Cash overdraft Accounts payable Accrued expenses and taxes Capital lease payable" net Total current liabmties
Capital lease payable - ne' Total liabilities
Members' equity
TOTAL LIABILITIES AND MEMBERS' EQUITY
$
2,341,294 156,004
2,497,298
1,587,516 119,740
l l,405
$ 4,215,959 =======
$ 140,475 2,789,757
893,048 23,535
3,846,815
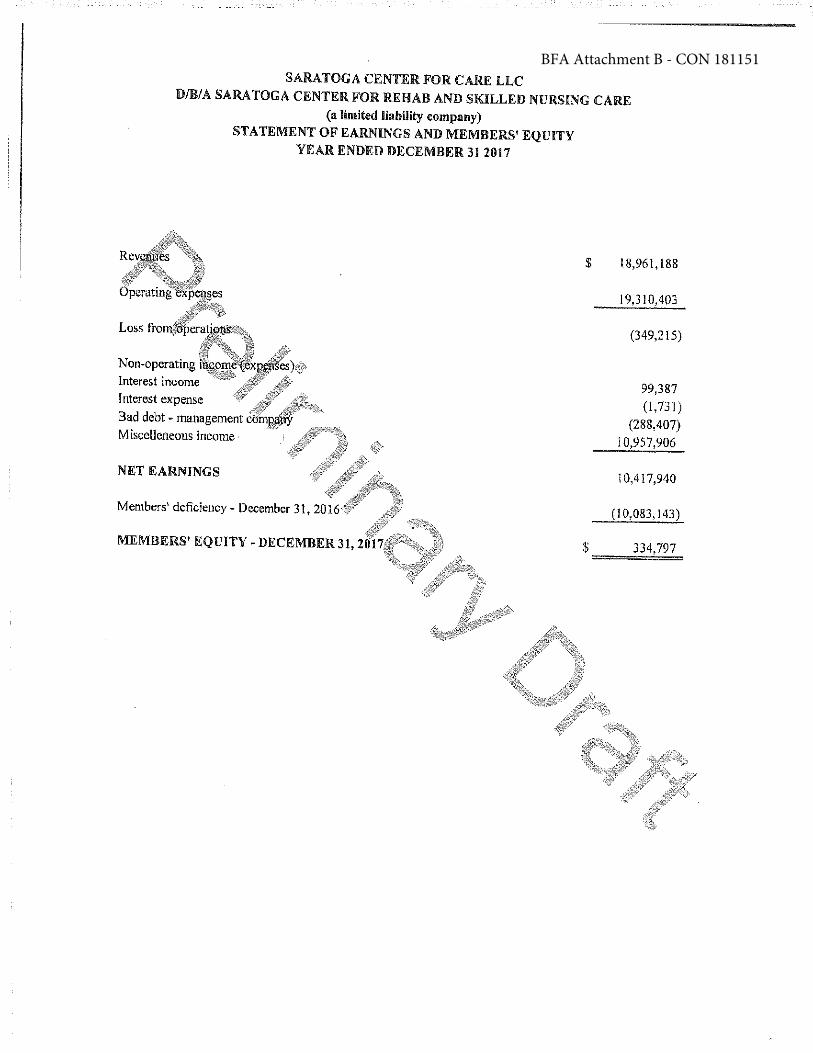
BFA Attachment B - CON 181151SARATOGA CENTER FOR CARE LLC
D/B/A SARATOGA CENTER FOR REHAB AND SKILLED NURSING CARE (a limited liability company)
Interest income Interest expense
STATEMENT OF EARNINGS AND MEMBERS' EQUITY YEAR ENDED DECEMBER 31 2017
Bad debt - management c Miscelleneous income
NET EARNINGS
MEMBERS' EQUITY - DECEMBER 31, 2fll
$ l8,961,l88
$
l 9,3 l 0,403
(349,2 I 5)
99,387 (1,731)
(288,407) 10,957,906
10,417,940
(10,083,143)
334,797
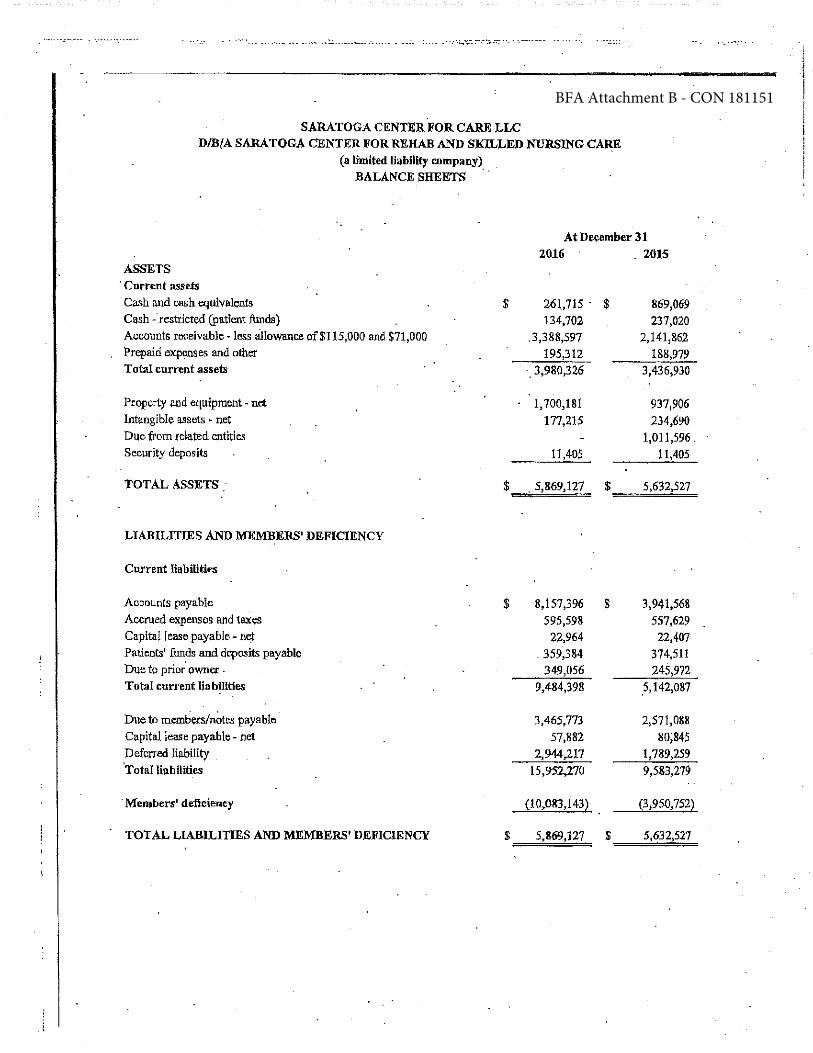
BFA Attachment B - CON 181151
• •••••-1.•,, ~ ·•••••~ ••• •·•••••- •·• ••• ~-. 0\=-=-•••~••"--••·•··•··· .. T•;• • ... • .••••:-;---...,...•~•-=-",'', ....... •-•
SARATOGA CENTER FOR CA.RE LLC D/B(A SARATOGA CENTER FOR REHAB AND SKILLED NIJnslNG C~
(a limited liability company) BALANCE SHEETS .
At D~ember 31 2016 _ 2015
ASSETS · Current assets Cash and cash equivalents $ 26\,715 - $ 869,069 Cash-· restricted (patient funds) 134,702 237,020 Accounts receivable• less al.lowanceof$115,000 and $71,000 .3,388,5!17 2,141,862 l>repaid expl?nses and other 195,312 188,979 Total eurrf:nt assets ·. 3,980,326 3,436,930
Property ancl equipment - net 1. 700,181 937,906 lntangibl~ assets • net 177,215 234,690 Due from related entitles 1,011,596. Security deposits 11,405 11,405
TOT AL ASSETS - $ . S;869,127 $ 5,632,527
LlABILITms AND MEMBERS' JlEFICIENCY
Current liabiliti~
Accounts payable $ 8,157,396 $ 3,941,568 Accrued expenses and taxes 595,598 551,629 Capital lease payable - n~ 22,964 22,407 Patients' funds and depooits payable . 359,384 374,511 Due to prior· owner . 349,056 245,972 Total current liabilities 9,484,398 5,142,087
Due to m.embers/ru:ites payable 3,465,773 2,571,088 Capital lease payable - net 57,882 80;845 Deferred liability _ 2,944,217 1,189,159 ·Total liabilities 15,952,270 9,583,2-79
· Mernbers' deffcie:ncy (10,.o&J,143) (3)950,752)
TOTAL LIABU,ITIES AND MEMBERS' DEFICIENCY $ 5,869,127 $ 5,632,527
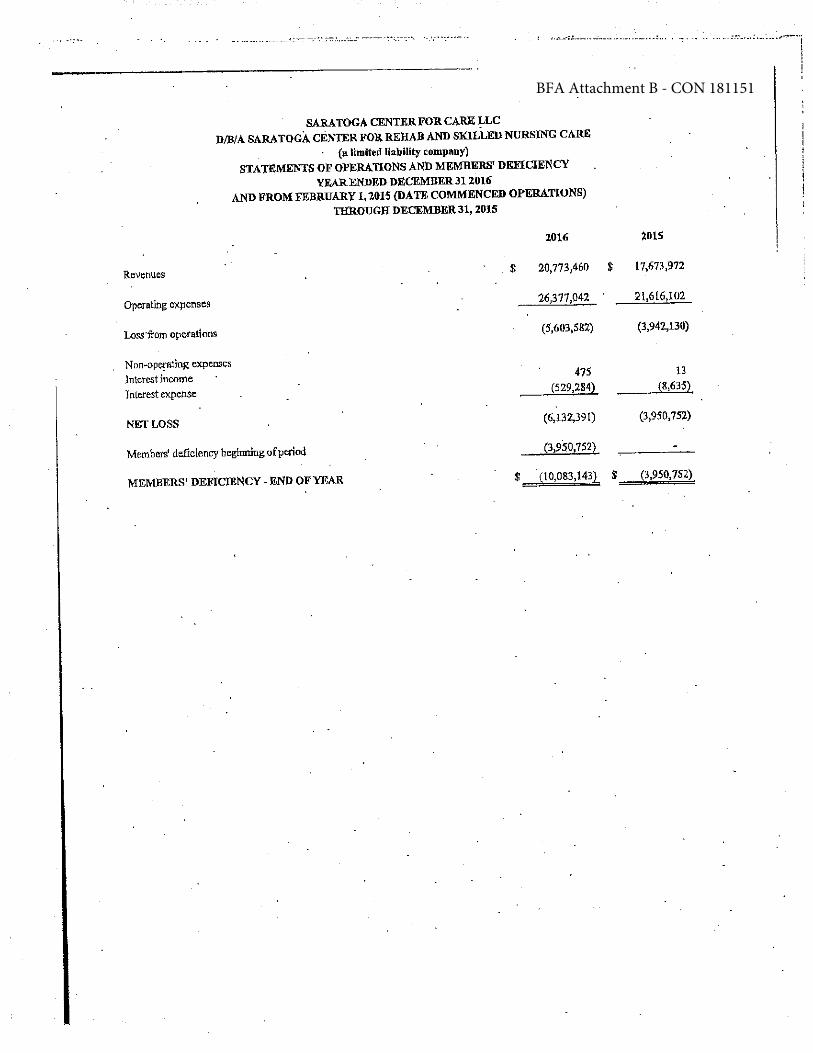
BFA Attachment B - CON 181151
, .... ··---··--------· . --~-'>c••--- -·-- ···-.... ·- ,--···----· r ?•,· -· •"---·- ·--·· ....... ··---•·-•• .. ,
SARA.TOGA CENTER FOR CA.RE LLC
DIS/A SARATOGA CENTER :FOR REHAB AND SKILLED NURSING CARE
· (a limited liability company)
STATEMENTS OF OPERATIONS AND MEMBERS' DEFICIET'ICY
\'EARENDEO DECEMBER312016
AND FROM FEBRUARY I, 2015 (DA TE COMMENCED OPERATlONS)
THROUGH DECEMBER 31, 2015
1016
Re\Jenues $ 20,773,460 $
Operntlhg expenses
Loss·from operations
Non•opc:;11ting expcosi;:;
lnterest income lnt:erest expense
NET LOSS
Members' deficiency beginning of period
MEMBERS' DEFICIENCY - ENO OFY£AR t
26,377,042
(5,603,581)
475 (529,284}
(6,132,391)
(3,950,7522
(10,083,143) $
l015
17,673,972
2!,616,102
(3,942,130)
13
(8,635),
(:1,950,752)
(3,950,752)
, .. -- .... __ ,' ... ___ .,.., ... -... ~ i ! !
'
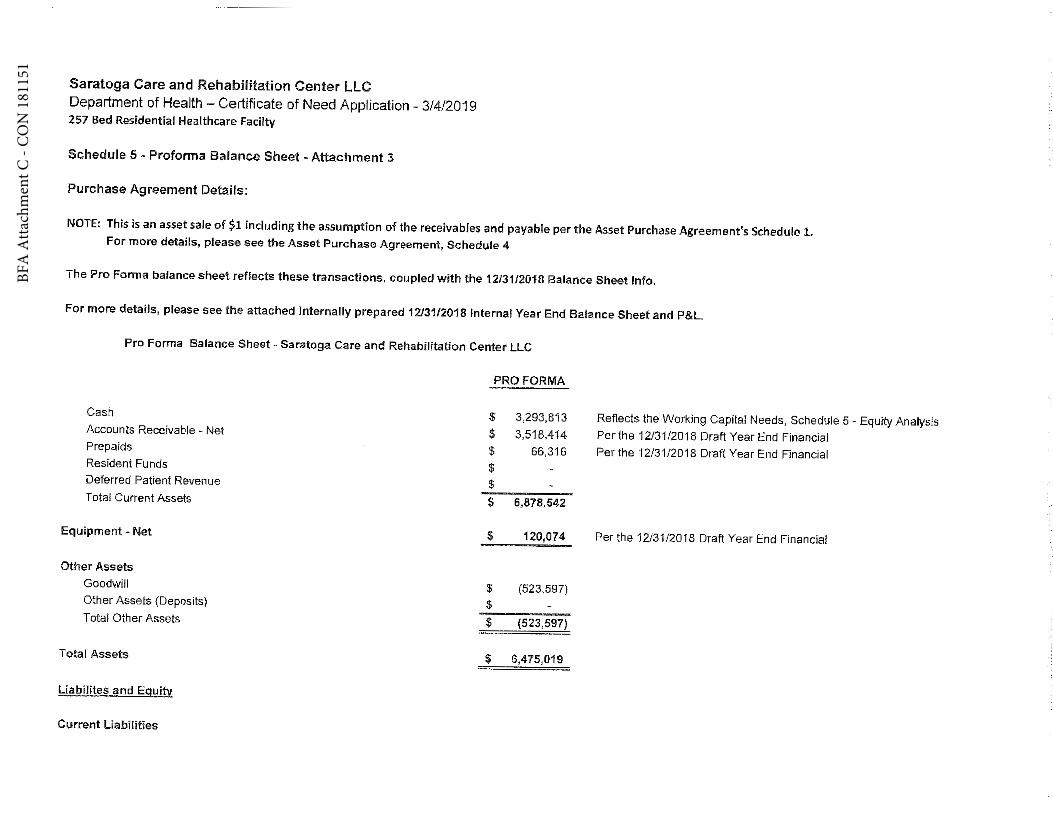
BFA
Atta
chm
ent C
- C
ON
181
151
Saratoga Care and Rehabilitation Center LLC Department of Health - Certificate of Need Application - 3/4/2019 257 Bed Residential Healthcare Facilty
Schedule 5 - Proforma Balance Sheet -Attachment 3
Purchase Agreement Details:
NOTE: This ls an asset sale of $1 including the assumption of the receivables and payable per the Asset Purchase Agreement's Schedule 1. For more details, please see the Asset Purchase Agreement, Schedule 4
The Pro Forma balance sheet reflects these transactions, coL1plecl with !he 12131/2018 Balance Sheet Info.
For more details, please see the attached Internally prepared 12131f2018 Internal Year End Balance Sheet and P&L
Pro Forma Balance Sheet• Saratoga Care and Rehabilitation Center LLC
Cash
Accounts Receivable - Net Prepalds
Resident Funds Deferred Patient Revenue
Total current Assets
Equipment - Net
Other Assets
Goodwill
Other Assets (Deposits)
Total Other Assots
Total Assets
Liabilites an_d Equity
Current Liabilities
PROFORMA
$ 3,293,813
$ 3,518,414 $ 66,316 $
$
$ 6,878,542
$ 120,074
$ (523,597) $
$ (523,597)
$ 6,475,019
Reflects !he Working Capita! Needs, Schedule 5 • Equity Analysis Petll1e 12/3112018 Draft Year End Financial Per the 12/3112018 Draft Year End Financial
Per the 12/3112018 Draft Year End Financial
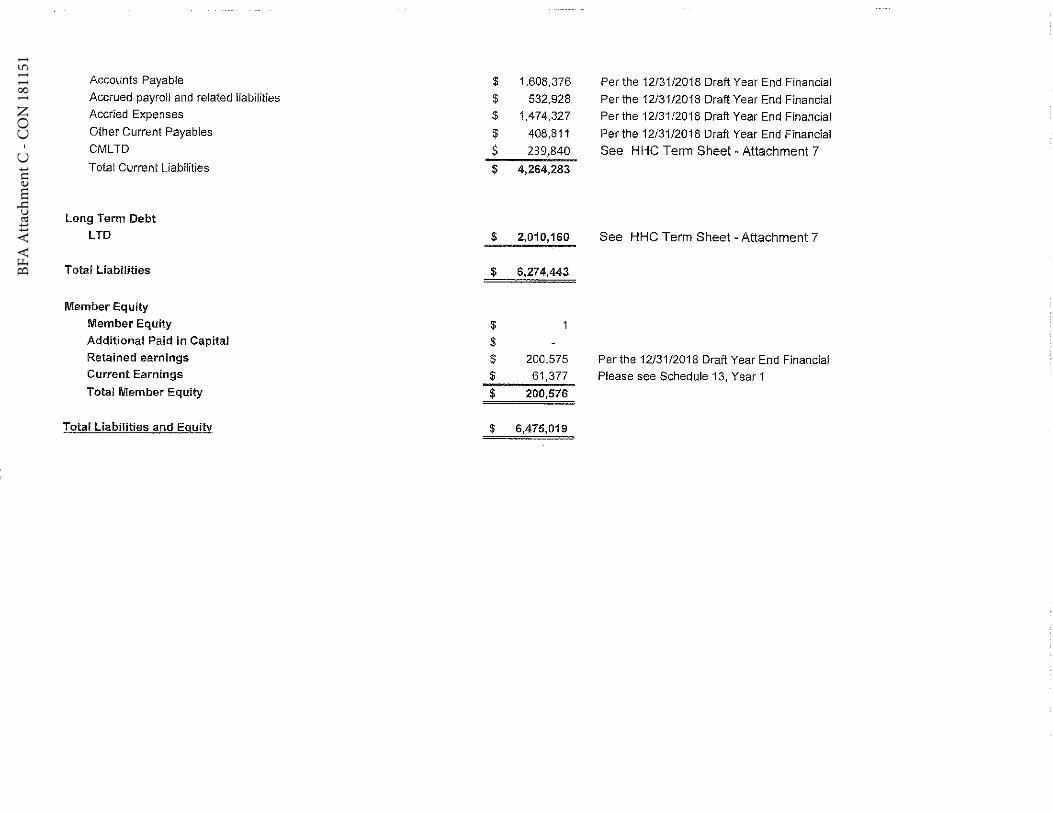
BFA
Atta
chm
ent C
- C
ON
181
151
Accounts Payable $ 1,608,376 Per the 12/31/2018 Draft Year End Financial Accrued payroll and related liabilities $ 532,928 Per the 12131/2018 Draft Year End Financial Accried Expenses $ 1,474,327 Per the 12/31/2018 Draft Year End Financial Other Current Payables $ 408,811 Per the 12/31/2018 Draft Year End Financial CMLTD $ 239,840 See HHC Term Sheet -Attachment 7 Total Current Liabilities $ 4,264,283
Long Term Debt
LTD $ 2,010,160 See HHC Term Sheet - Attachment 7
Total Liabilities $ 6,274,443
Member Equity
Member Equity $
Additional Paid in Capital $ Retained earnings $ 200,575 Perlhe 12/31/2018 Draft Year End Financial Current Earnings $ 61,377 Please see Schedule 13, Year 1 Total Member Equity $ 200,576
Total Liabilities and Equity $ 6,475,019

BFA
Atta
chm
ent C
- C
ON
181
151
Saratoga Care and Rehabilitation Center LLC Department of Health - Certificate of Need Application - 3/4/2019 257 Bed Residential Healthcare Facilty
Schedule 5 - Proforma Balance Sheet - Attachment 3
Pro Forma Balance Sheet -Saratoga Realty Holdings LLC
Cash Accounts Recelvable - Net Total Current Assets
FF& E- Net
Other Assets Goodwill
Total Other Assets
T otaJ Assets
Liabll"ites and Equity
Current Liahilities Accounts Payable Accrued payroll and related liabilities CMLTD
Total Current Uabllities
Long Term llabilites Mortgage Total Other Liabilities
Total Liabilities
Member Equity Member Equity Additional Paid in Capital Retained earnings Total Member Equity
Total_Uabilities and Equity
PROFORMA
$ $
! $ 26,000,000
$
$
$ 26,000,000
$
$
$ 214,680 $ 214,680
$ 20,585,320 $ 20,585,320
$ 20,800,000
$ 5,200,000 $
$
$ 5,200,000
$ 26,000,000
Per the Real Estate Purchase Contract
See HHC Term Sheet~ Attachment 7
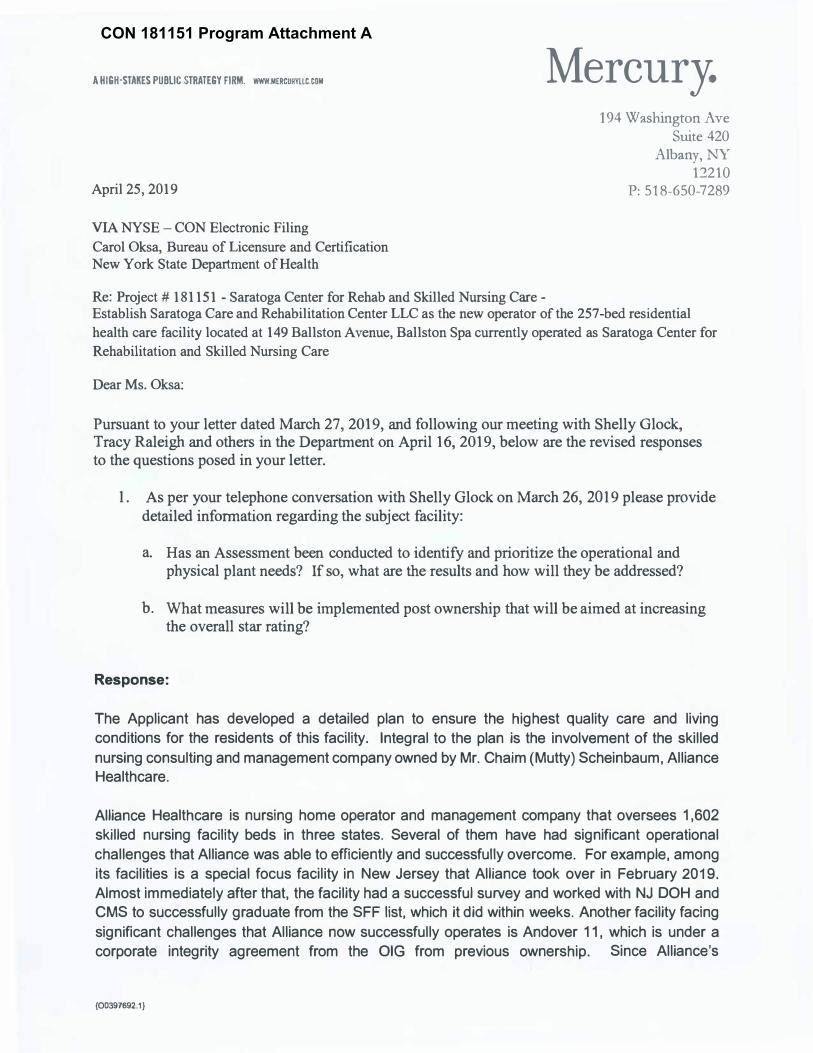
A HIGH-STAKES PUBLIC STRATEGY FIRM. WWW.MERCURVlLC.COM
April 25, 2019
VIA NYSE - CON Electronic Filing
Carol Oksa, Bureau of Licensure and Certification New York State Department of Health
Re: Project # 181151 - Saratoga Center for Rehab and Skilled Nursing Care -
Mercury. 194 Washington Ave
Suite 420 Albany, NY
12210 P: 518-650-7289
Establish Saratoga Care and Rehabilitation Center LLC as the new operator of the 257-bed residential
health care facility located at 149 Ballston Avenue, Ballston Spa currently operated as Saratoga Center for
Rehabilitation and Skilled Nursing Care
Dear Ms. Oksa:
Pursuant to your letter dated March 27, 2019, and following our meeting with Shelly Glock, Tracy Raleigh and others in the Department on April 16, 2019, below are the revised responses to the questions posed in your letter.
1. As per your telephone conversation with Shelly Glock on March 26, 2019 please providedetailed information regarding the subject facility:
a. Has an Assessment been conducted to identify and prioritize the operational andphysical plant needs? If so, what are the results and how will they be addressed?
b. What measures will be implemented post ownership that will be aimed at increasingthe overall star rating?
Response:
The Applicant has developed a detailed plan to ensure the highest quality care and living
conditions for the residents of this facility. Integral to the plan is the involvement of the skilled
nursing consulting and management company owned by Mr. Chaim (Mutty) Scheinbaum, Alliance
Healthcare.
Alliance Healthcare is nursing home operator and management company that oversees 1,602
skilled nursing facility beds in three states. Several of them have had significant operational
challenges that Alliance was able to efficiently and successfully overcome. For example, among
its facilities is a special focus facility in New Jersey that Alliance took over in February 2019.
Almost immediately after that, the facility had a successful survey and worked with NJ DOH and
CMS to successfully graduate from the SFF list, which it did within weeks. Another facility facing
significant challenges that Alliance now successfully operates is Andover 11, which is under a
corporate integrity agreement from the OIG from previous ownership. Since Alliance's
(00397692.1)
CON 181151 Program Attachment A

Mercury. involvement, this facility has had two successful years to date working with independent federal
monitors to ensure continued compliance.
Attached to this letter is the organizational chart of Alliance Healthcare, which demonstrates the
breadth and depth of knowledge and skill set readily available. Mr. Scheinbaum has 11 years of
SNF experience, starting out as an LNHA in NJ, where he continued on to become a regional
administrator and eventually ended up in his current role as Alliance's CEO. Sam Goldberger
serves as Alliance's COO along with Phil Bak as VP of Operations. Both Sam and Phil have over
14 plus combined years in SNF operational experience. Phil worked in Marquis Healthcare when
they successfully graduated a NJ SNF from the SFF list.
The plan developed by the Applicant for Saratoga Center has contemplated that Alliance
Healthcare will work on a consulting basis with facility staff, so as to bring the knowledge and
experience gained by thousands of hours in other similar facilities, to Saratoga Center. The
budgets presented in the Applicant's CON application have budgeted for consulting. As both
Alliance and the Applicant will have overlapping ownership, Alliance has committed to spending
as much time as will be needed, particularly in the critical first years of the Applicant's operation,
in order to bring the facility not just in compliance with the Department's regulations, but up to a
standard of excellence in the provision of care.
Below are details of the plan. In addition and also critically, a plan is in place to ensure the facility
becomes fiscally stable to provide continuous quality care to its residents. Highlights are as
follows:
Labor Management: The facility's biggest challenge is having enough nursing staff to provide
quality care; and the cost for agency care was approximately $2 million during 2016. Further,
the facility experienced large expenditures approximating $1. 7 million for outsourced services,
e.g. Dietary and Laundry/Housekeeping (please also see Contract Negotiations below).
Additionally, the Facility's Administration, with financial support from the Applicants, who have
used their personal financial resources to support these payments, is often in a position to have
to offer bonuses to employees to work extra shifts. This adds to the overall stress of management
and workers, while adding to the labor expenses.
The Applicant and Alliance, working as consultants to the facility, will and are working with the
nurses' union to discuss rates, ensuring that the facility's wages are competitive with other
employers in the area. Additionally, the Applicant is poised to hold job fairs to increase
employment opportunities and broaden the reach.
The Applicant will make a thorough analysis of bringing the outsourced services in house or
continuing to outsource them. As stated above, the areas affected are: Dietary,
Housekeeping/Laundry and Nursing. If outsourced, the Applicant will utilize providers that the
Applicant has long term relationships with through Alliance. The network that the Applicant has
{00397692.1}
CON 181151 Program Attachment A - continued
Mercury. established through his tenure with Alliance has allowed him to access resources not otherwise
readily available to a sole operator.
Alliance Healthcare intends to hire a regional manager to support the operations of Saratoga
Center, as well as another skilled nursing facility in the area that Mr. Scheinbaum is in the midst
of acquiring. This will fit into the current structure used by the Applicant and Mr. Scheinbaum in
particular with other facilities, to great success.
It is anticipated that this will effect a cost savings of approximately $1.7 million per year overall,
with $. 7 million projected in the nursing staff savings alone.
Capital Expenditure: The Applicant has already been paying from its own resources, the
expenses of the facility, to a total of approximately $1 million dollars since undertaking the
proposed purchase of Saratoga Center, through direct payment of facility expenses and via work
provided by Alliance to the facility as a consultant since May 2018. Additionally, when the facility
went through a renovation of 20 beds of the facility, the Administration utilized the expertise of the
Applicant and Alliance to oversee this renovation. These beds are now operational and are fully
occupied.
Upon taking control of the facility, the Applicant will begin a capital expenditure plan after the first quarter of operational control, primarily focused on the sub-acute unit (40 beds) and dining area,
and specifically geared to enhance the quality of stay. This is estimated to cost $350,000 and
take 3 months to complete. Upon completion of phase 1, the Applicant will commence phase 2
of Capital Expenditures which will include renovating all carpeted corridors, specifically, replacing
carpets, ceiling tiles and lighting also estimated at $350,000; a total initial renovation of $700,000.
As the Applicant further stabilizes the facility's operations and the financial condition of the facility
improves, the Applicant is committed to further renovations in the facility. The Applicant's strategy is expected to greatly assist with stabilization and potential year 2 census growth.
Quality Measures: Through the hard work of the Administration, supported by the consulting
services provided by Alliance, the facility currently carries a 5-star rating in quality measures. The
Administration, with recommendations and support from the Applicant and Alliance, brought on board a full time MDS specialist that is doing monthly summary reviews of each trigger and looking
for continued ways to maintain and improve measures. Upon DOH approval, the Applicant will
continue this process.
Currently, results of audits and oversight by the facility's Administration, with support from the
Applicant and Alliance, have been used to create systemic changes, as needed. Root cause
analysis of the aforementioned audits has already uncovered several key areas of focus:
• Wounds/ pressure ulcers;
• Accidents and incidents;
{00397692.1}
CON 181151 Program Attachment A - continued
•
• Abuse training and reporting;
• Hydration;
• Medication administration procedures.
Mercury.
Again, upon receiving DOH approval of the ownership transfer, these areas will continue to be a
primary focus for the Applicant.
The facility's Administration, again with the support of the Applicant and Alliance, have made
additional investigations into several QM issues. It was found that there was a lack of supportive
documentation related to the residents' care that was provided. A plan was developed for weekly
reporting and plans of care and correction have been established. The longer-term plan already
initiated by the Administration, with support from Alliance and the Applicant, and to continue after
the Applicant begins operating the facility, will include educating and following-up to ensure that
the facility is capturing information correctly. Alliance's quality improvement committee will be
focusing to ensure all triggers are corrected with proper measures and will review all areas that
may possibly need improvement.
The Applicant and Alliance are currently interviewing for a Regional Manager for Alliance, to be
appointed specifically to oversee Saratoga Center. The regional manager's job description will
include but not limited to, staffing levels and recruitment and retention to ensure the safety of the
residents, oversee facility administration, manage the contractors during the facility construction
and ensure all quality improvement goals are being met. The Regional Manager will report directly
to Mr. Scheinbaum.
The Applicant will oversee Alliance's regional team, and as stated above, the facility's
Administration has been and will continue to audit all QM, inclusive of the education and training
for staff. The specific goal is to have the staff fully comprehending the importance of this area
and the impact of it to the residents. Additionally, the Applicant with the assistance from Alliance,
is looking/will continue to look at other areas that may be a trigger within the QM.
The Applicant, using Alliance as a resource, has already performed an overall review of the facility,
taking individual projects and addressing specific and identifiable areas of concern. Upon DOH
approval, the Applicant will oversee the facility process and re-audit through the QAPI process
until the root cause has been eliminated and will communicate findings to management and key
staff members. The facility's (QAPl) Quality Assurance Performance and Improvement Plan will
be reviewed and revised by the Applicant, Medical Director, Director of Nursing, and Administrator.
The Administrator will report recommendations for changes to the Applicant prior to
implementation. The facility's QAPl/Regulatory Compliance Program will be applied facility wide
by including all staff to improve and monitor systems and outcomes. The QAPI program will
provide a proactive approach of excellent quality resident care while meeting or exceeding the
needs and expectations of the resident population. Under the Applicant, the QAPl plan will include
policies and procedures to identify and use data to monitor performance, establish goals and
thresholds for performance measurement; utilize resident, staff, and family input, identify and
{00397692.11
CON 181151 Program Attachment A - continued
Mercury. prioritize opportunities for improvement, systematically analyze underlying root causes of
systemic problems and adverse events, and develop corrective action for performance
improvement activities.
Business development: Gradual census increases have occurred since Alliance began
consulting at the facility. The facility had a census of 180 during 3/2018. Currently it is 206, a
growth of 14.4% or 80% occupancy.
At the suggestion of Alliance and with the support of the Applicant, the Administration has already
hired a Facility Customer Service Liaison that spends time with the facility residents and family
members enhancing their stay and satisfaction. The Applicant will to continue this process as well
as expand opportunities by utilizing its business development methods of building strong
relationships with area and hospital physicians and discharge planners. This would include
monthly events with senior community groups establishing local ties.
With the support of the Applicant and assistance from Alliance, in addition to better community
interaction and communication, the Administration is already working to accept a wider variety of
patients, as the staff develop their clinical strengths. This will continue with the Applicant as
operator. The facility's staff is currently focused on doing the basics of rehabilitation and nursing
to prevent readmissions and other potential client issues. However, with support from Alliance
and the Applicant, the facility has begun, and can continue in earnest, to expand its patient
population to include:
• IV,
• basic respiratory, and
• wound care.
As the facility's staff becomes more adept at handling these cases, the Applicant will expand to
Tracheotomy care and weaning patients with greater physical needs and comorbidity.
The Applicant has provided all of the foregoing initiatives as ideas to the facility already and will
be following through in earnest with all of the above Business Development strategies upon DOH
approval.
Procurement savings: The Purchasing department is already utilizing Alliance's GPO
relationships to bring down costs of supplies, including but not limited to, medical supplies,
maintenance supplies and over the counter medications. The Applicant will be utilizing
recommendations from Alliance coupled with its own experience and relationships to determine
the best method to control costs while not giving up quality.
Contract negotiations: As noted above in the Labor Management section, there are outsourced
services that have cost the facility over $3.7 million as of the 2016 Cost Report. The Applicant
will analyze the benefit of outsourcing versus bringing the service back in-house; however, the
{00397692.1}
CON 181151 Program Attachment A - continued
Mercury. Applicant has long-term contracted services in place with industry leaders in the following areas: Dietary, housekeeping, therapy and pharmacy companies. Saratoga Center has a high pharmacy
contract and can benefit from negotiated dietary and therapy rates.
Projected savings utilizing cost comparisons from their pricing in other facilities are projected to
result in a $1.0 million annual expense savings in this area. Once approved by DOH, new
contracts will be in place by closing so that the facility can take advantage of the savings from day
one.
Insurance Management: The Applicant has contacts with multiple GPO and self-insuring insurance carriers. As a result, and to insure best pricing and best coverages, multiple quotes are received and analyzed to cover employee health, liability, workers compensation and property insurances.
2. Describe the current or previous relationship between Alliance Healthcare and the subjectfacility. Please also describe any future plans for staffing agency usage and/or consultingand services agreements for the subject facility.
Response: Alliance Healthcare has served as a consultant to the facility since March 2018. As
Alliance Healthcare has overlapping ownership with the Applicant, these services have been
provided and will continue to be provided after the change of ownership. Alliance has assisted
the facility to achieve a sustainable operation including the renovation of 20 of its s 257 beds
which began May 2018. Moreover, the Applicant has supported the facility to cash flow positive
by making personal loans of over $1 million to the facility to support capital improvements, repairs,
and to cover operational costs of the facility.
Since Alliance's presence in the facility, Saratoga Center has experienced one survey on 4/25/2018, where it received only C to E Deficiencies. Prior to the arrival of Alliance, and since the February 2015 when the current operators started operating the facility, the facility has experienced 4 surveys which included fines of $150k+ due to Deficiencies ranging from D to L. The current operators have been absent with little to no involvement in the day to day operations of the facility for some time.
As stated above in Question 1, the Applicant intends to use as little agency staffing as possible. The Applicant believes that the residents will have a better experience with staff nurses that are invested in the residents and their jobs. Additionally, the Applicant feels that with facility nurses, the quality of care is more predictable and more easily controlled and standardized; thus, the overall Quality of Care for the residents is improved.
The Applicant's approach is always to address the facility's needs as they arise, ensuring quality care and cash flow management. To that end, the Applicant will:
{00397692.1)
CON 181151 Program Attachment A - continued
f
....
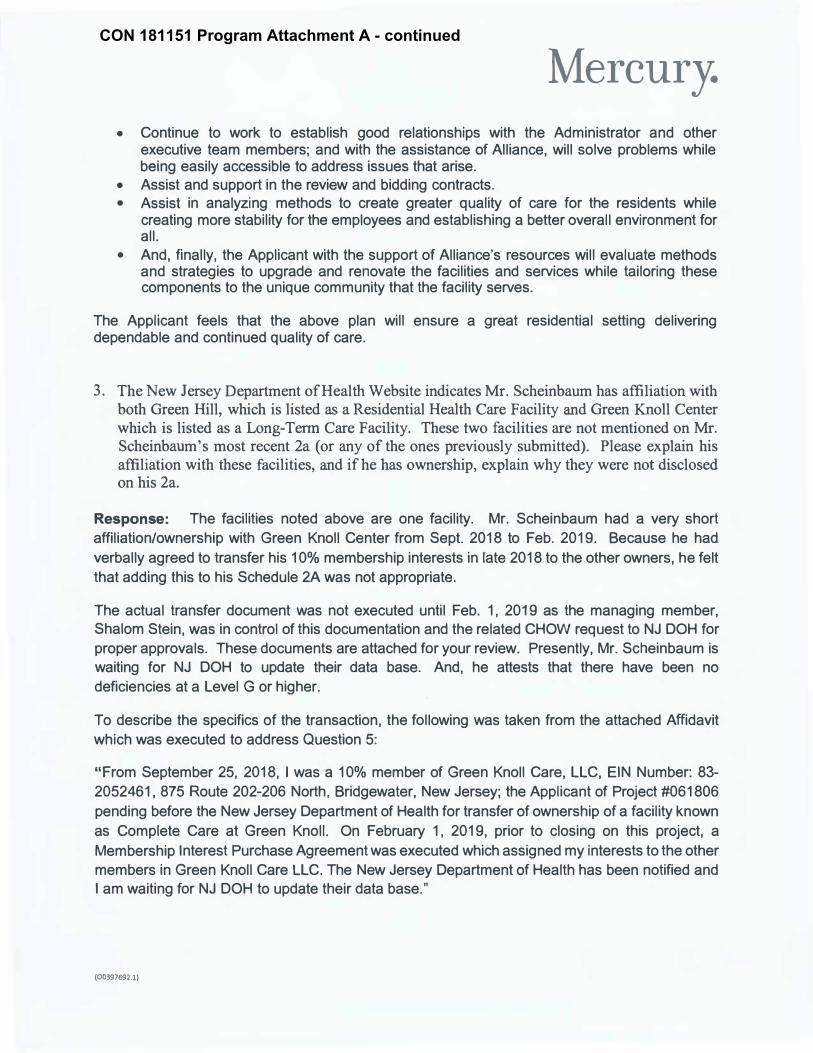
Mercury. • Continue to work to establish good relationships with the Administrator and other
executive team members; and with the assistance of Alliance, will solve problems whilebeing easily accessible to address issues that arise.
• Assist and support in the review and bidding contracts.• Assist in analyzing methods to create greater quality of care for the residents while
creating more stability for the employees and establishing a better overall environment forall.
• And, finally, the Applicant with the support of Alliance's resources will evaluate methodsand strategies to upgrade and renovate the facilities and services while tailoring thesecomponents to the unique community that the facility serves.
The Applicant feels that the above plan will ensure a great residential setting delivering dependable and continued quality of care.
3. The New Jersey Department of Health Website indicates Mr. Scheinbaum has affiliation withboth Green Hill, which is listed as a Residential Health Care Facility and Green Knoll Centerwhich is listed as a Long-Term Care Facility. These two facilities are not mentioned on Mr.Scheinbaum's most recent 2a (or any of the ones previously submitted). Please explain hisaffiliation with these facilities, and ifhe has ownership, explain why they were not disclosedon his 2a.
Response: The facilities noted above are one facility. Mr. Scheinbaum had a very short
affiliation/ownership with Green Knoll Center from Sept. 2018 to Feb. 2019. Because he had
verbally agreed to transfer his 10% membership interests in late 2018 to the other owners, he felt
that adding this to his Schedule 2A was not appropriate.
The actual transfer document was not executed until Feb. 1, 2019 as the managing member, Shalom Stein, was in control of this documentation and the related CHOW request to NJ DOH for
proper approvals. These documents are attached for your review. Presently, Mr. Scheinbaum is
waiting for NJ DOH to update their data base. And, he attests that there have been no
deficiencies at a Level G or higher.
To describe the specifics of the transaction, the following was taken from the attached Affidavit
which was executed to address Question 5:
"From September 25, 2018, I was a 10% member of Green Knoll Care, LLC, EIN Number: 83-
2052461, 875 Route 202-206 North, Bridgewater, New Jersey; the Applicant of Project #061806
pending before the New Jersey Department of Health for transfer of ownership of a facility known
as Complete Care at Green Knoll. On February 1, 2019, prior to closing on this project, a
Membership Interest Purchase Agreement was executed which assigned my interests to the other
members in Green Knoll Care LLC. The New Jersey Department of Health has been notified and
I am waiting for NJ DOH to update their data base."
(00397692.1}
CON 181151 Program Attachment A - continued
..
I S

Mercury. 4. Mr. Scheinbaum indicates on this resume that Alliance Healthcare has a relationship withGold Choice Deltona and Gold Choice Ormond which are assisted living facilities in Florida. DoesMr. Scheinbaum own these facilities, if not what is the relationship? Ifhe has ownership, explainwhy they were not disclosed on his 2a.
Response: These properties are Assisted Living Facilities; Mr. Scheinbaum has no operational
ownership in either Gold Choice Ormond or Gold Choice Deltona. He only has 33% ownership
in the real property and is not on the facilities' operating licenses. These two Florida real estate
interests are listed on Mr. Scheinbaum's Schedule 28 - page 2, as Normandy Holdings LLC
and Vocusia Holdings LLC.
5. If Mr. Scheinbaum does have ownership in any of the facilities mentioned in #3 or 4, pleaseprovide ownership start dates and:
A signed affidavit attesting that for any of the above nursing homes and assisted living facilities that he owns, there have been:
• No survey deficiencies of "G" level or higher;
• No survey deficiencies which resulted in an enforcement action or fine;
• No survey deficiencies which resulted in a declaration of immediate jeopardy.
For any answers other than no, complete information regarding the enforcement fines or CMP's imposed must be provided to include; dates of survey, citation(s) sited and the level of the deficiency, amount of fine and payment status for each.
Response: The Affidavit of Chaim Scheinbaum related to the NJ facility was attached to the previous submission of this letter.
Thank you for your continuing courtesies.
Very truly yours,
'11t A� Nan�cchetti
Enc.
{00397692.1}
CON 181151 Program Attachment A - continued
'I
• ..

'vi
�
ti')
C:
n:,
Q)
.c.
L
m
u"cii
u
QI
· o
ro
·�
U)
L
&
.�
Q)
0...
0..
c;;
rJl
(!] -
lfl
(lJ
C
0
·1;:
�(Q
QI
u
(lJ
L.
n:,
�
QI
u
a
0
6
'i: v
·o
Q)
w
a:
<(
�
"'
0I
'
1--....
_J
'
•
w
I
CO
N 181151 Program
Attachm
ent A - continued--
Esty Berman. Assistant VP of Finance
Mutty Schernbaum CEO
Managing Partner
Sam Goldberger
Managing Partner
Angelica Sarenas VP of Rehab
Sara Jaffe
Chany Frost
AP specia_list
Dave Barmak. Chief Compliance Officer
Lisa Castillo.
VP of HR and Payroll
Bisheva Friedman
Leah Friedman.
Payroll
I)
Esther Olsl1i11. 1-Jaz: •l · ..
VP of Reirrbursement VP of er· ;1 -
Caryl Paterson. . : .. l~,.i~ Billing Specialist
A;.. t, . • ~.:e·f.-;..,.:, ,..,,,, . •~ ..
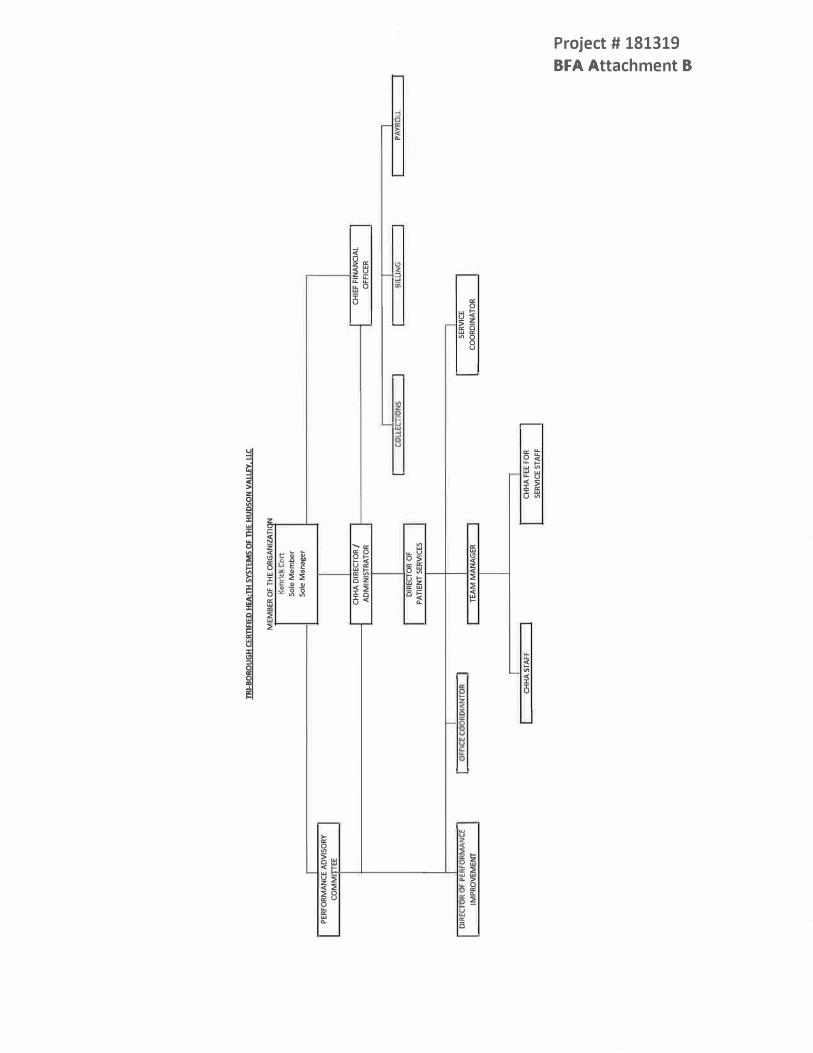
IPER
FO
RM
AN
CE A
DV
ISO
RY
I C
OM
MITT
EE
IDIREC
TO
R O
F P
ER
FO
RM
AN
CE
II
IMPRO
VEM
ENT
I
lRI-
BO
RO
UG
H C
ER
TIFIE
D H
EA;Tll
SY
STEM
S O
F Tll
E H
UD
SO
N V
ALLEY
, LL
C
MEM
BER
OF T
HE O
RG
AN
IZATIO
N
Kenrick Co
rt
So
le M
em
be
r
So
le M
an
age
r
CH
HA
DIR
EC
TO
R/
AD
MIN
ISTR
ATO
R
I D
IREC
TO
R O
F
PA
TIE
NT S
ER
VIC
ES
OFFICE
CO
OR
DIA
NTO
R
I TEA
M M
AN
AG
ER
I CH
HA
STA
FF
CH
HA
FEE F
OR
SER
VIC
E S
TA
FF
I C
HIE
F F
INA
NC
IAL
I I
OFFIC
ER
I I
CO
LLECT
lON
S
I I
Bl L
UN
G
I P
AYR
OL
l
ISE
RV
ICE
CO
OR
DIN
ATO
R
l
Project # 181319BFA Attachment B
--
)
•
-
-- - - -
- - -
-- - ._ -
-•
-=
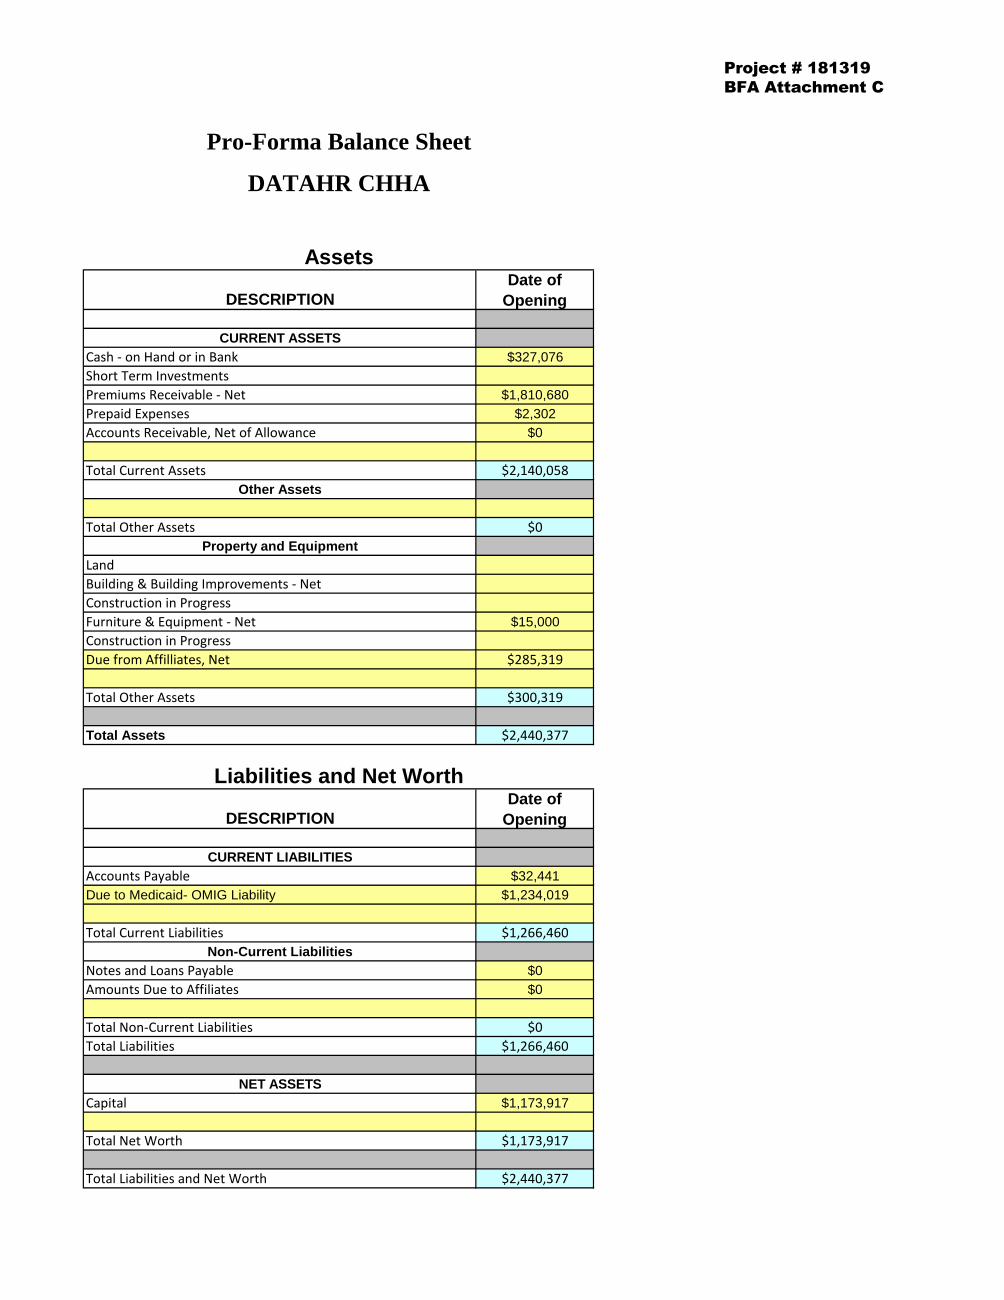
Pro-Forma Balance Sheet
DATAHR CHHA
DESCRIPTIONDate of
Opening
CURRENT ASSETS
Cash - on Hand or in Bank $327,076Short Term InvestmentsPremiums Receivable - Net $1,810,680Prepaid Expenses $2,302Accounts Receivable, Net of Allowance $0
Total Current Assets $2,140,058Other Assets
Total Other Assets $0Property and Equipment
LandBuilding & Building Improvements - NetConstruction in ProgressFurniture & Equipment - Net $15,000Construction in ProgressDue from Affilliates, Net $285,319
Total Other Assets $300,319
Total Assets $2,440,377
DESCRIPTIONDate of
Opening
CURRENT LIABILITIES
Accounts Payable $32,441Due to Medicaid- OMIG Liability $1,234,019
Total Current Liabilities $1,266,460Non-Current Liabilities
Notes and Loans Payable $0Amounts Due to Affiliates $0
Total Non-Current Liabilities $0Total Liabilities $1,266,460
NET ASSETS
Capital $1,173,917
Total Net Worth $1,173,917
Total Liabilities and Net Worth $2,440,377
Assets
Liabilities and Net Worth
Project # 181319BFA Attachment C
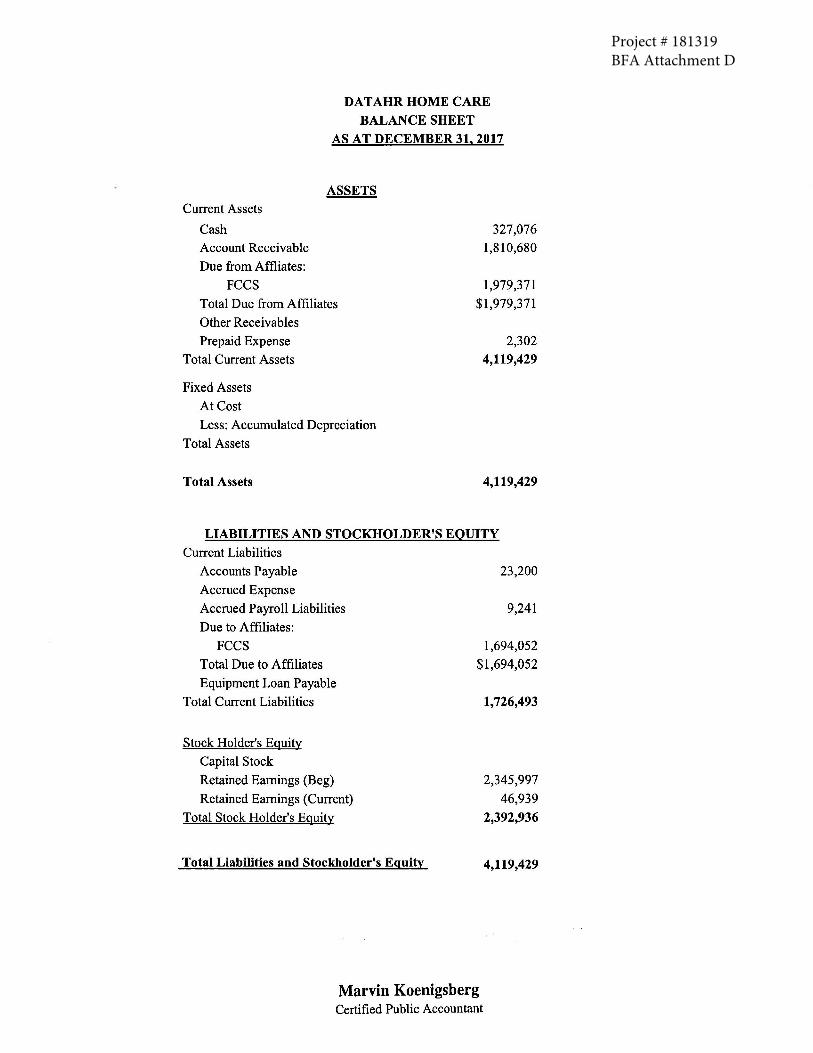
Project # 181319 BFA Attachment D
DATAHRHOME CARE BALANCE SHEET
AS AT DECEMBER 31. 2017
Current Assets
Cash
Account Receivable
Due from Affliates:
FCCS
ASSETS
Total Due from Affiliates
Other Receivables
Prepaid Expense
Total Current Assets
Fixed Assets
At Cost
Less: Accumulated Depreciation
Total Assets
Total Assets
327,076
1,810,680
1,979,371
$1,979,371
2,302
4,119,429
4,119,429
LIABILITIES AND STOCKHOLDER'S EQUITY Current Liabilities
Accounts Payable
Accrued Expense
Accrued Payroll Liabilities
Due to Affiliates:
FCCS
Total Due to Affiliates
Equipment Loan Payable
Total Current Liabilities
Stock Holder's Equity
Capital Stock
Retained Earnings (Beg)
Retained Earnings (Current)
Total Stock Holder's Equity
Total Liabilities and Stockholder's Equity
23,200
9,241
1,694,052
$1,694,052
1,726,493
2,345,997
46,939
2,392,936
4,119,429
Marvin Koenigsberg Certified Public Accountant
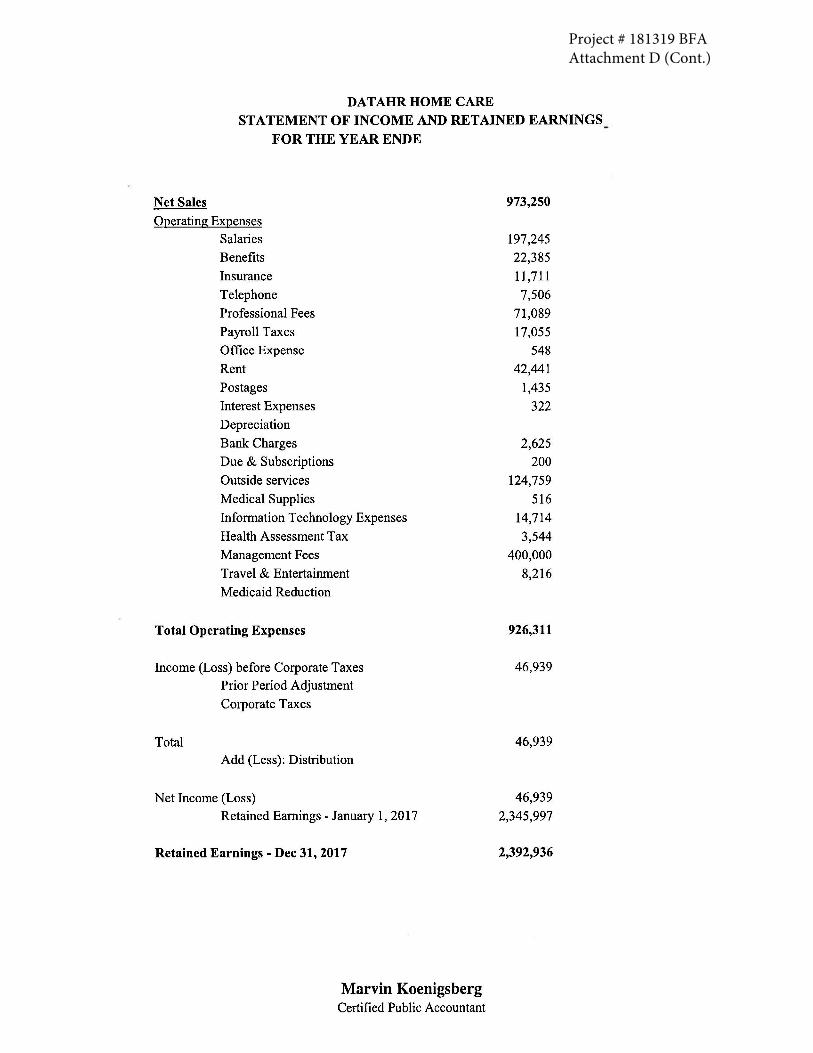
Project # 181319 BFA Attachment D (Cont.)
DAT AHR HOME CARE STATEMENT OF INCOME AND RETAINED EARNINGS
FOR THE YEAR ENDE
Net Sales
Operating Expenses Salaries
Benefits
Insurance
Telephone
Professional Fees
Payroll Taxes
Office Expense
Rent
Postages
Interest Expenses
Depreciation
Bank Charges
Due & Subscriptions
Outside services
Medical Supplies
Information Technology Expenses
Health Assessment Tax
Management Fees
Travel & Entertainment
Medicaid Reduction
Total Operating Expenses
Income (Loss) before Corporate Taxes Prior Period Adjustment
Corporate Taxes
Total Add (Less): Distribution
Net Income (Loss)
Retained Earnings - January 1, 2017
Retained Earnings - Dec 31, 2017
Marvin Koenigsberg Certified Public Accountant
973,250
197,245
22,385
11,711
7,506
71,089
17,055
548
42,441
1,435
322
2,625
200
124,759
516
14,714
3,544
400,000
8,216
926,311
46,939
46,939
46,939
2,345,997
2,392,936
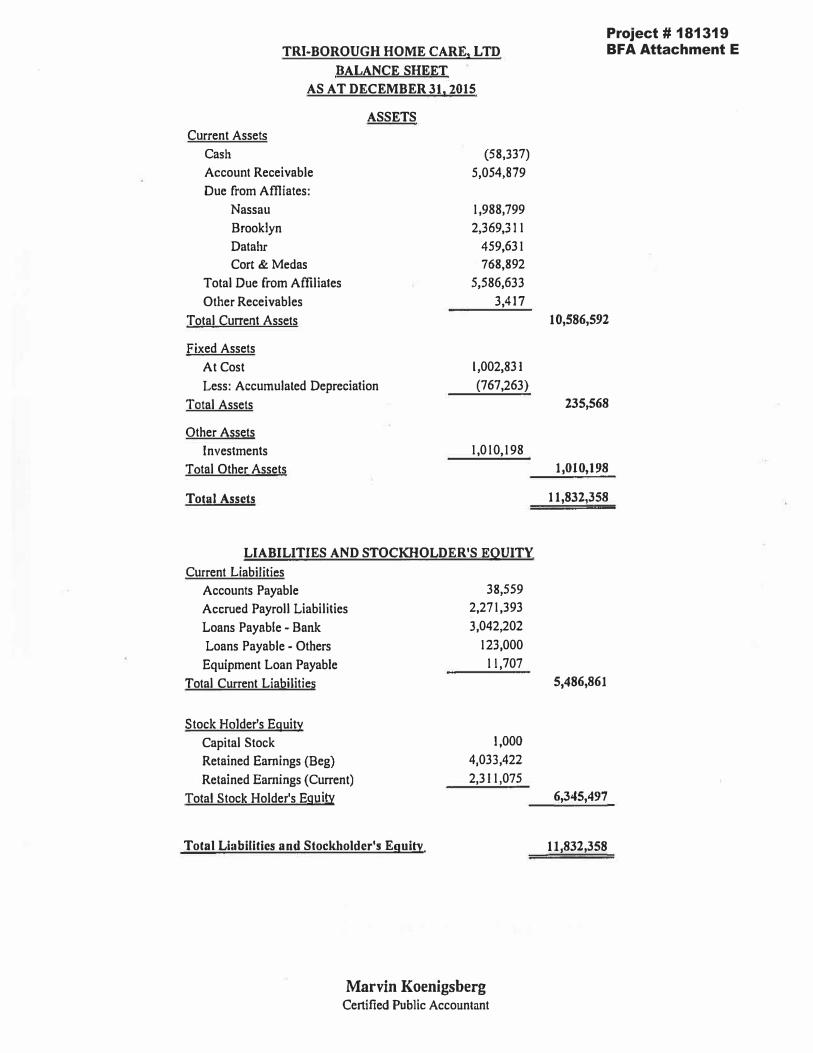
TRI-BOROUGH HOME CARE, LTD
BALANCE SHEET
AS AT DECEMBER 311
2015
ASSETS
Current Assets
Cash (58,337)
Account Receivable 5,054,879
Due from Affiiates:
Nassau 1,988,799
Brooklyn 2,369,311
Datalir 459,631
Cort & Medas 768,892
Total Due from Affiliates 5,586,633
Other Receivables 3,417
Total Current Assets
Fixed Assets
At Cost 1,002,831
Less: Accumulated Depreciation (767,263)
Total Assets
Other Assets
Investments 1,010,198
Total Other Assets
Total Assets
LIABILITIES AND STOCKHOLDER'S EQUITY
Current Liabilities
Accounts Payable
Accrued Payroll Liabilities
Loans Payable - Bank
Loans Payable - Others
Equipment Loan Payable
Total Current Liabilities
Stock Holder's Equity
Capital Stock
Retained Earnings (Beg)
Retained Earnings (Current)
Total Stock Holder's Equity
Total Liabilities and Stockholder's Equity
38,559
2,271,393
3,042,202
123,000
11,707
1,000
4,033,422
2,311,075
10,586,592
235,568
1,010,198
11,832,358
5,486,861
6,345,497
11,832,358
Marvin Koenigsberg Certified Public Accountant
Project # 181319BFA Attachment E
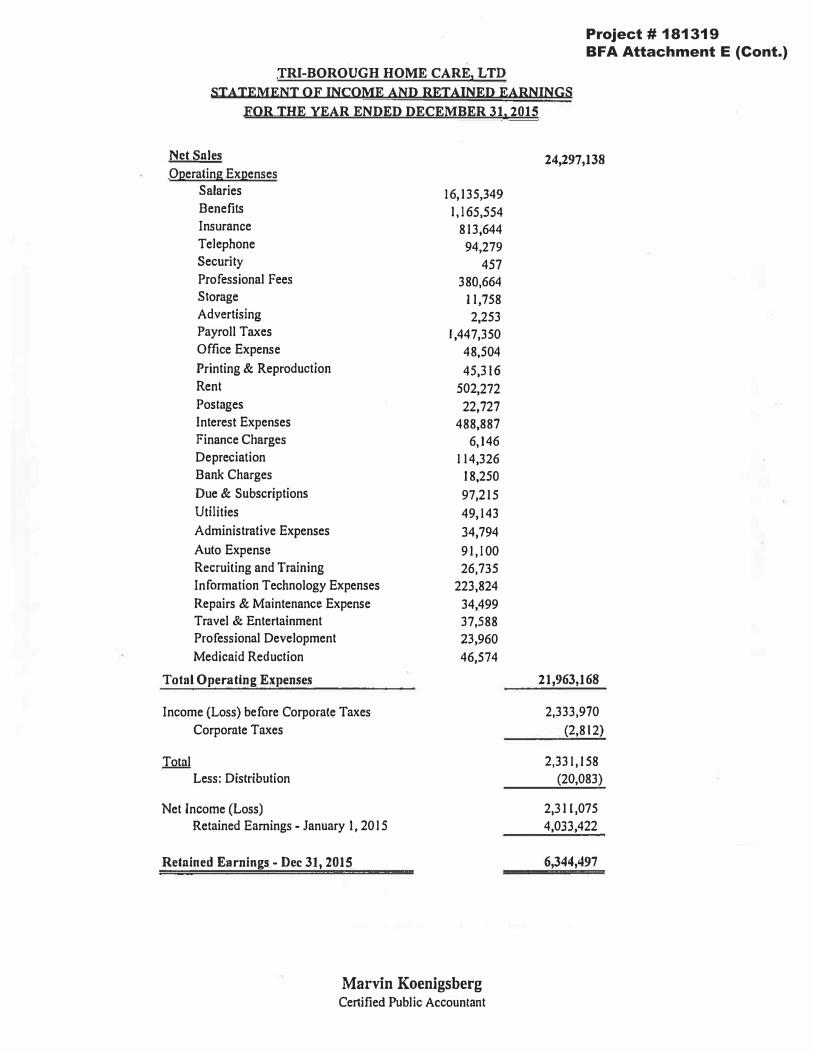
TRI-BOROUGH HOME CARE, LTD
STATEMENT OF INCOME AND RETAINED EARNINGS
FOR THE YEAR ENDED DECEMBER 311
2015
Net Sales 24,297,138 Operating Expenses
Salaries 16,135,349 Benefits 1,165,554 Insurance 813,644 Telephone 94,279 Security 457 Professional Fees 380,664 Storage 11,758 Advertising 2,253 Payroll Truces 1,447,350 Office Expense 48,504 Printing & Reproduction 45,316 Rent 502,272 Postages 22,727 Interest Expenses 488,887 Finance Charges 6,146 Depreciation 114,326 Bank Charges 18,250 Due & Subscriptions 97,215 Utilities 49,143 Administrative Expenses 34,794 Auto Expense 91,100 Recruiting and Training 26,735 Information Technology Expenses 223,824 Repairs & Maintenance Expense 34,499 Travel & Entertainment 37,588 Professional Development 23,960 Medicaid Reduction 46,574
Total Operating Expenses 21,963,168
Income (Loss) before Corporate Taxes 2,333,970
Corporate Taxes (2,812)
Total 2,331, I 58 Less: Distribution (20,083)
Net Income (Loss) 2,311,075 Retained Earnings - January I, 20 l 5 4,033,422
Retained Earnings - Dec 31, 2015 6,344,497
Marvin Koenigsberg Certified Public Accountant
Project # 181319BFA Attachment E (Cont.)
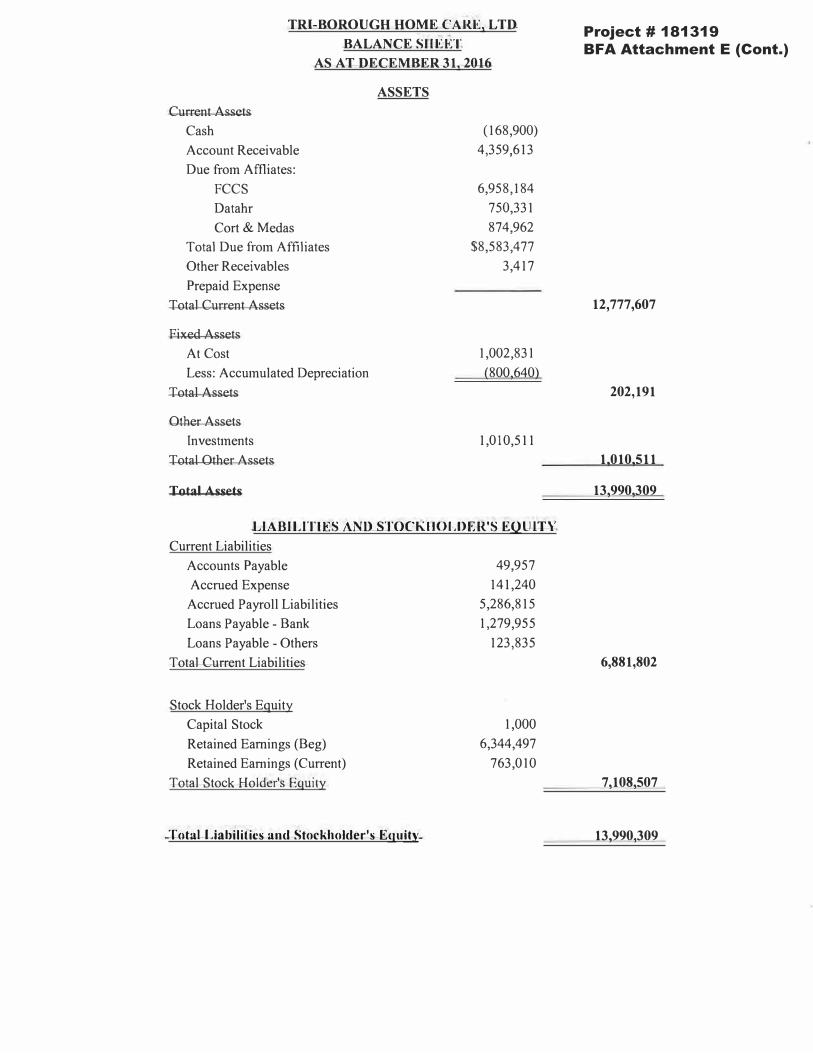
TRI-BOROUGH HOME CARE, LTD
BALANCE SHEET
AS AT DECEMBER 31, 2016
ASSETS
Current Assets
Cash (168,900)
Account Receivable 4,359,613
Due from Affliates:
FCCS 6,958,184
Datahr 750,331
Cort & Medas 874,962
Total Due from Affiliates $8,583,477
Other Receivables 3,417
Prepaid Expense
Total Current Assets
Fixed Assets
At Cost 1,002,831
Less: Accumulated Depreciation (800,640)
Total Assets
Other Assets
Investments 1,010,511
Total Other Assets
Total Assets
LIABILITIES AND STOCKHOLDER'S EQUITY
Current Liabilities
Accounts Payable
Accrued Expense
Accrued Payroll Liabilities
Loans Payable - Bank
Loans Payable - Others
Total Current Liabilities
Stock Holder's Equity
Capital Stock
Retained Earnings (Beg)
Retained Earnings (Current)
Total Stock Holder's Equity
Total Liabilities a11d Stockholder's Equjty
49,957
141,240
5,286,815
1,279,955
123,835
1,000
6,344,497
763,010
12,777,607
202,191
1,010,511
13,990,309
6,881,802
7,108,507
13,990,309
Project # 181319BFA Attachment E (Cont.)

TRI-BOROUGH HOME CARE, LTD
STATEMENT OF INCOME AND RETAJNED EARNINGS
FOR TIIE YEAR ENDED DECEMBER 31, 2016
Net Sales
Operating Expenses
Salaries
Benefits
Insurance
Telephone
Professional Fees
Storage
Advertising & Marketing
Payroll Taxes
Office Expense
Printing & Reproduction
Rent
Postages
Interest Expenses
Finance Charges
Depreciation
Bank Charges
Equipment Lease
Due & Subscriptions
Utilities
Administrative Expenses
Auto Expense
Recruiting and Training
Information Technology Expenses
Repairs, Cleaning & Maintenance
Travel & Entertainment . ,
Professional Development
Medicaid Reduction
Total Operating Expenses
Income (Loss) before Corporate Taxes
Prior Period Adjustment
Corporate Taxes
Add: Distribution
Net Income (Loss)
Retained Earnings - January I, 2016
Retained Earnings - Dec 31, 2016
19,498,990
13,500,225 1,106,828
556,782
85,275
262,161
13,653
8,207
1,619,411
6,736
37,976
472,727
20,710
348,051
1,321
33,378
17,363
42,817
118,093
30,540
67,026
96,322 25,321
219,962
30,301
34,179
9,508
4,346
18,769,220
729,770
729,770
51,982
781,752
6,345,497
7,127,249
Marvin Koenigsberg Certified Public Accountant
Project # 181319BFA Attachment E (Cont.)
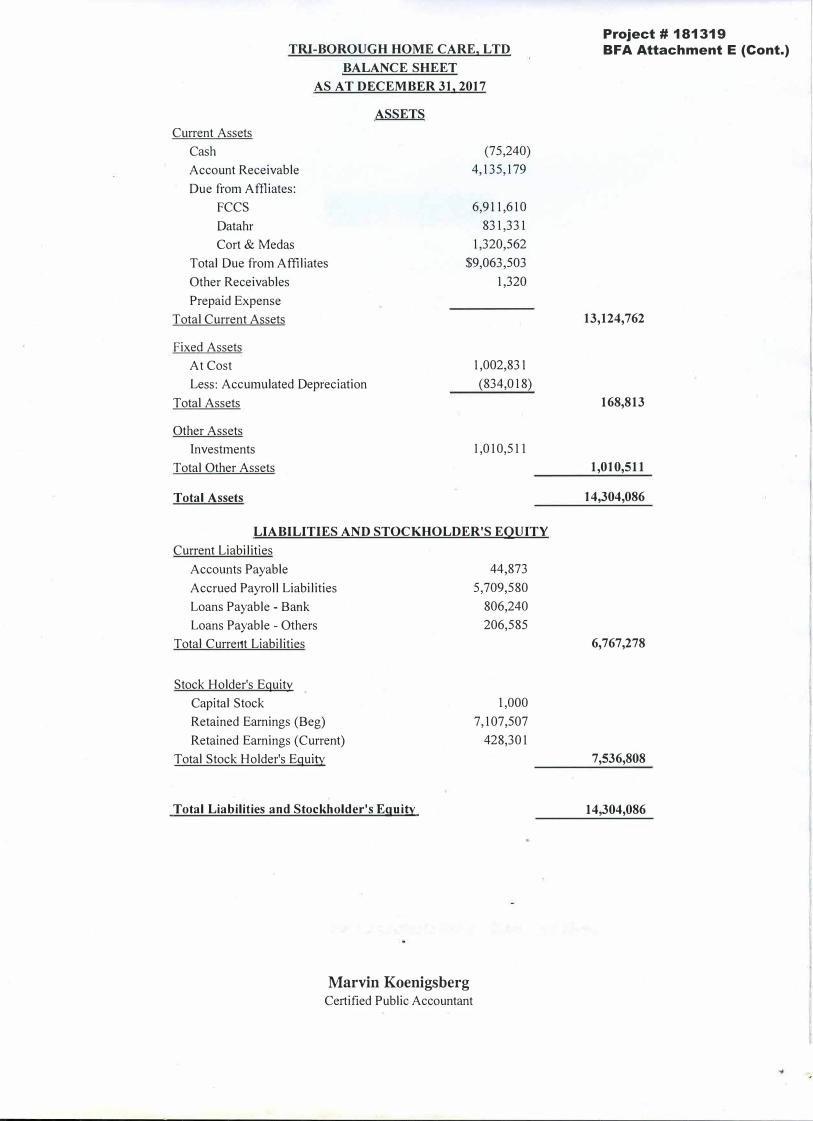
TRI-BOROUGH HOME CARE, LTD
BALANCE SHEET
AS AT DECEMBER 31, 2017
ASSETS
Current Assets
Cash (75,240)
Account Receivable 4,135,179
Due from Affliates:
FCCS 6,911,610
Datahr 831,331
Cort& Medas 1,320,562
Total Due from Affiliates $9,063,503
Other Receivables 1,320
Prepaid Expense
Total Current Assets
Fixed Assets
At Cost 1,002,831
Less: Accumulated Depreciation (834,018)
Total Assets
Other Assets
Investments 1,010,511
Total Other Assets
Total Assets
LIABILITIES AND STOCKHOLDER'S EQUITY
Current Liabilities
Accounts Payable
Accrued Payroll Liabilities
Loans Payable - Bank
Loans Payable - Others
Total Currer1t Liabilities
Stock Holder's Equity
Capital Stock
Retained Earnings (Beg)
Retained Earnings (Current)
Total Stock Holder's Equity
Total Liabilities and Stockholder's Equity
44,873
5,709,580
806,240
206,585
1,000
7,107,507
428,301
13,124,762
168,813
1,010,511
14,304,086
6,767,278
7,536,808
14,304,086
Marvin Koenigsberg Certified Public Accountant
Project # 181319BFA Attachment E (Cont.)
..

----�-------- -------- ----------
TRI-BOROUGH HOME CARE, LTD
STATEMENT OF INCOME AND RETAINED EARNINGS
FOR THE YEAR ENDED DECEMBER 31, 2017
Net Sales 18,904,465
Operating Expenses
Salaries 14,226,333
Benefits 90,765
Insurance 773,374
Telephone 96,629
Professional Fees 300,175
Storage 10,210
Advertising & Marketing 5,853
Payroll Taxes 1,055,656
Office Expense 48,403
Printing & Reproduction 32,544
Rent 527,348
Postages 15,563
Interest Expenses 295,005
Depreciation 33,378
Bank Charges 11,110
Equipment Lease 71,855
Due & Subscriptions 110,097
Utilities 37,162
Administrative Expenses 68,770
Auto Expense 67,409
Recruiting and Training 32,790
Information Technology Expenses 180,321
Repairs, Cleaning & Maintenance 65,373
Travel & Entertainment 78,198
Professional Development 17,263
Legal & Accounting Expense 114,999
Total Operating Expenses 18,366,583
Income (Loss) before Corporate Taxes 537,882
Prior Period Adjustment
Corporate Taxes (4,427)
Total 533,455
Add: Distribution (105,154)
Net Income (Loss) 428,301
Retained Earnings - January 1, 2017 7,107,507 .
Retained Earnings - Dec 31, 2017 7,535,808
Marvin Koenigsberg Certified Public Accountant
Project # 181319BFA Attachment E (Cont.)
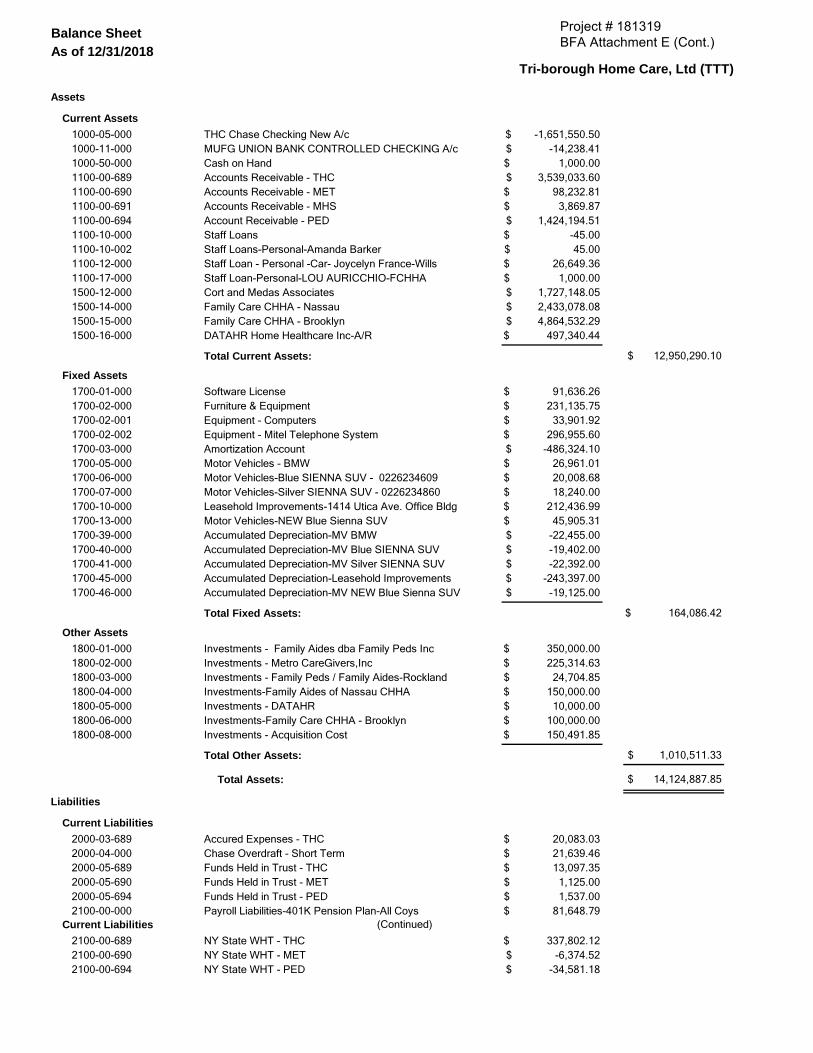
-1,651,550.50$ -14,238.41$
1,000.00$ 3,539,033.60$
98,232.81$ 3,869.87$
1,424,194.51$ -45.00$ 45.00$
26,649.36$ 1,000.00$
1,727,148.05$ 2,433,078.08$ 4,864,532.29$
497,340.44$
91,636.26$ 231,135.75$
33,901.92$ 296,955.60$
-486,324.10$ 26,961.01$ 20,008.68$ 18,240.00$
212,436.99$ 45,905.31$
-22,455.00$ -19,402.00$ -22,392.00$
-243,397.00$ -19,125.00$
350,000.00$ 225,314.63$
24,704.85$ 150,000.00$
10,000.00$ 100,000.00$ 150,491.85$
20,083.03$ 21,639.46$ 13,097.35$
1,125.00$ 1,537.00$
81,648.79$
337,802.12$ -6,374.52$
-34,581.18$
Balance SheetAs of 12/31/2018
Tri-borough Home Care, Ltd (TTT)
Assets
Current Assets1000-05-000 THC Chase Checking New A/c1000-11-000 MUFG UNION BANK CONTROLLED CHECKING A/c1000-50-000 Cash on Hand1100-00-689 Accounts Receivable - THC1100-00-690 Accounts Receivable - MET1100-00-691 Accounts Receivable - MHS1100-00-694 Account Receivable - PED1100-10-000 Staff Loans1100-10-002 Staff Loans-Personal-Amanda Barker1100-12-000 Staff Loan - Personal -Car- Joycelyn France-Wills1100-17-000 Staff Loan-Personal-LOU AURICCHIO-FCHHA1500-12-000 Cort and Medas Associates1500-14-000 Family Care CHHA - Nassau1500-15-000 Family Care CHHA - Brooklyn1500-16-000 DATAHR Home Healthcare Inc-A/R
Total Current Assets: 12,950,290.10$
Fixed Assets1700-01-000 Software License1700-02-000 Furniture & Equipment1700-02-001 Equipment - Computers1700-02-002 Equipment - Mitel Telephone System1700-03-000 Amortization Account1700-05-000 Motor Vehicles - BMW1700-06-000 Motor Vehicles-Blue SIENNA SUV - 02262346091700-07-000 Motor Vehicles-Silver SIENNA SUV - 02262348601700-10-000 Leasehold Improvements-1414 Utica Ave. Office Bldg1700-13-000 Motor Vehicles-NEW Blue Sienna SUV1700-39-000 Accumulated Depreciation-MV BMW1700-40-000 Accumulated Depreciation-MV Blue SIENNA SUV1700-41-000 Accumulated Depreciation-MV Silver SIENNA SUV1700-45-000 Accumulated Depreciation-Leasehold Improvements1700-46-000 Accumulated Depreciation-MV NEW Blue Sienna SUV
Total Fixed Assets: 164,086.42$
Other Assets1800-01-000 Investments - Family Aides dba Family Peds Inc1800-02-000 Investments - Metro CareGivers,Inc1800-03-000 Investments - Family Peds / Family Aides-Rockland1800-04-000 Investments-Family Aides of Nassau CHHA1800-05-000 Investments - DATAHR1800-06-000 Investments-Family Care CHHA - Brooklyn1800-08-000 Investments - Acquisition Cost
Total Other Assets: 1,010,511.33$
Total Assets: 14,124,887.85$
Liabilities
Current Liabilities2000-03-689 Accured Expenses - THC2000-04-000 Chase Overdraft - Short Term2000-05-689 Funds Held in Trust - THC2000-05-690 Funds Held in Trust - MET2000-05-694 Funds Held in Trust - PED2100-00-000 Payroll Liabilities-401K Pension Plan-All Coys
Current Liabilities (Continued)2100-00-689 NY State WHT - THC2100-00-690 NY State WHT - MET2100-00-694 NY State WHT - PED
Project # 181319BFA Attachment E (Cont.)
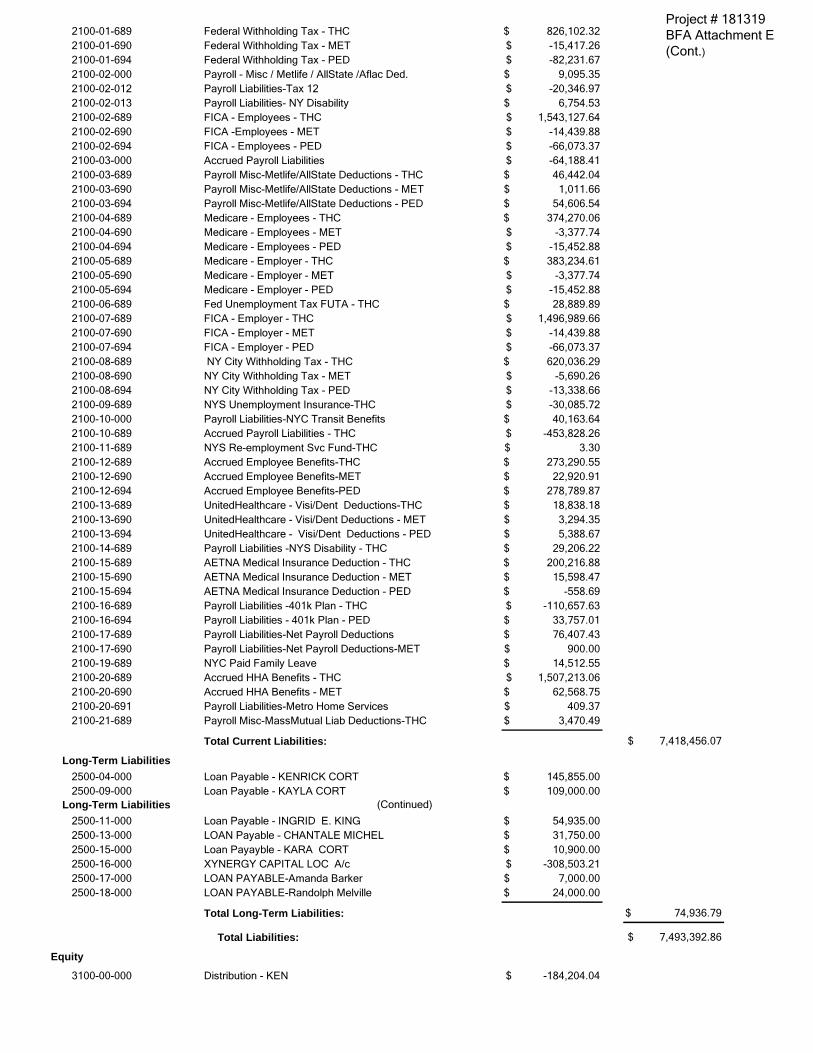
826,102.32$ -15,417.26$ -82,231.67$
9,095.35$ -20,346.97$
6,754.53$ 1,543,127.64$
-14,439.88$ -66,073.37$ -64,188.41$ 46,442.04$
1,011.66$ 54,606.54$
374,270.06$ -3,377.74$
-15,452.88$ 383,234.61$
-3,377.74$ -15,452.88$ 28,889.89$
1,496,989.66$ -14,439.88$ -66,073.37$ 620,036.29$
-5,690.26$ -13,338.66$ -30,085.72$ 40,163.64$
-453,828.26$ 3.30$
273,290.55$ 22,920.91$
278,789.87$ 18,838.18$
3,294.35$ 5,388.67$
29,206.22$ 200,216.88$
15,598.47$ -558.69$
-110,657.63$ 33,757.01$ 76,407.43$
900.00$ 14,512.55$
1,507,213.06$ 62,568.75$
409.37$ 3,470.49$
145,855.00$ 109,000.00$
54,935.00$ 31,750.00$ 10,900.00$
-308,503.21$ 7,000.00$
24,000.00$
-184,204.04$
2100-01-689 Federal Withholding Tax - THC2100-01-690 Federal Withholding Tax - MET2100-01-694 Federal Withholding Tax - PED2100-02-000 Payroll - Misc / Metlife / AllState /Aflac Ded.2100-02-012 Payroll Liabilities-Tax 122100-02-013 Payroll Liabilities- NY Disability2100-02-689 FICA - Employees - THC2100-02-690 FICA -Employees - MET2100-02-694 FICA - Employees - PED2100-03-000 Accrued Payroll Liabilities2100-03-689 Payroll Misc-Metlife/AllState Deductions - THC2100-03-690 Payroll Misc-Metlife/AllState Deductions - MET2100-03-694 Payroll Misc-Metlife/AllState Deductions - PED2100-04-689 Medicare - Employees - THC2100-04-690 Medicare - Employees - MET2100-04-694 Medicare - Employees - PED2100-05-689 Medicare - Employer - THC2100-05-690 Medicare - Employer - MET2100-05-694 Medicare - Employer - PED2100-06-689 Fed Unemployment Tax FUTA - THC2100-07-689 FICA - Employer - THC2100-07-690 FICA - Employer - MET2100-07-694 FICA - Employer - PED2100-08-689 NY City Withholding Tax - THC2100-08-690 NY City Withholding Tax - MET2100-08-694 NY City Withholding Tax - PED2100-09-689 NYS Unemployment Insurance-THC2100-10-000 Payroll Liabilities-NYC Transit Benefits2100-10-689 Accrued Payroll Liabilities - THC2100-11-689 NYS Re-employment Svc Fund-THC2100-12-689 Accrued Employee Benefits-THC2100-12-690 Accrued Employee Benefits-MET2100-12-694 Accrued Employee Benefits-PED2100-13-689 UnitedHealthcare - Visi/Dent Deductions-THC2100-13-690 UnitedHealthcare - Visi/Dent Deductions - MET2100-13-694 UnitedHealthcare - Visi/Dent Deductions - PED2100-14-689 Payroll Liabilities -NYS Disability - THC2100-15-689 AETNA Medical Insurance Deduction - THC2100-15-690 AETNA Medical Insurance Deduction - MET2100-15-694 AETNA Medical Insurance Deduction - PED2100-16-689 Payroll Liabilities -401k Plan - THC2100-16-694 Payroll Liabilities - 401k Plan - PED2100-17-689 Payroll Liabilities-Net Payroll Deductions2100-17-690 Payroll Liabilities-Net Payroll Deductions-MET2100-19-689 NYC Paid Family Leave2100-20-689 Accrued HHA Benefits - THC2100-20-690 Accrued HHA Benefits - MET2100-20-691 Payroll Liabilities-Metro Home Services2100-21-689 Payroll Misc-MassMutual Liab Deductions-THC
Total Current Liabilities: 7,418,456.07$
Long-Term Liabilities2500-04-000 Loan Payable - KENRICK CORT2500-09-000 Loan Payable - KAYLA CORT
Long-Term Liabilities (Continued)2500-11-000 Loan Payable - INGRID E. KING2500-13-000 LOAN Payable - CHANTALE MICHEL2500-15-000 Loan Payayble - KARA CORT2500-16-000 XYNERGY CAPITAL LOC A/c2500-17-000 LOAN PAYABLE-Amanda Barker2500-18-000 LOAN PAYABLE-Randolph Melville
Total Long-Term Liabilities: 74,936.79$
Total Liabilities: 7,493,392.86$
Equity3100-00-000 Distribution - KEN
Project # 181319BFA Attachment E (Cont.)
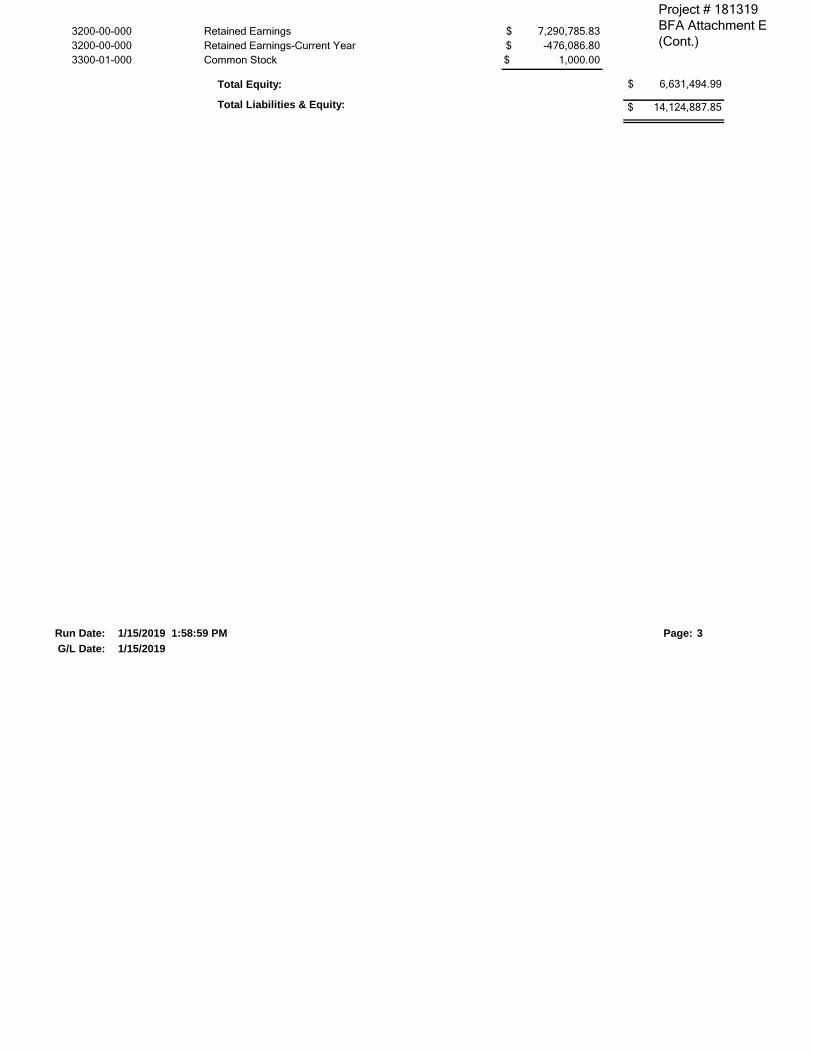
7,290,785.83$ -476,086.80$
1,000.00$
Page: 3
3200-00-000 Retained Earnings3200-00-000 Retained Earnings-Current Year3300-01-000 Common Stock
Total Equity: 6,631,494.99$
Total Liabilities & Equity: 14,124,887.85$
Run Date: 1/15/2019 1:58:59 PMG/L Date: 1/15/2019
Project # 181319BFA Attachment E (Cont.)
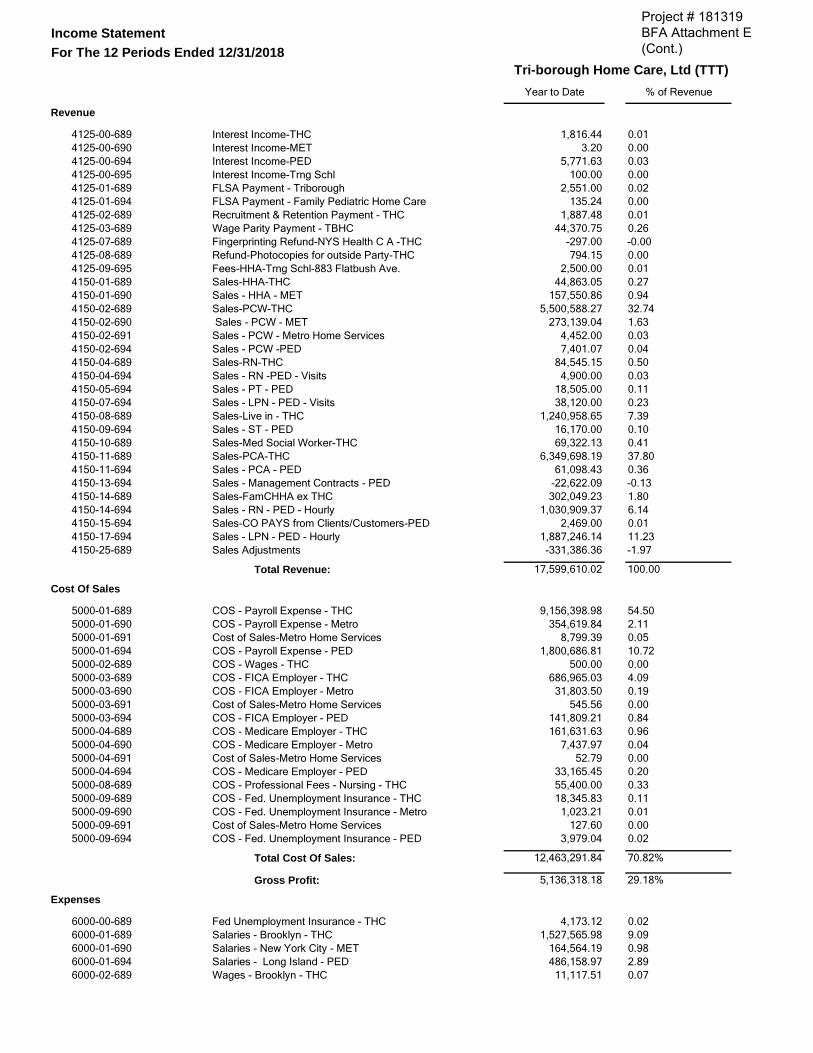
Year to Date
1,816.44 3.20
5,771.63 100.00
2,551.00 135.24
1,887.48 44,370.75
-297.00 794.15
2,500.00 44,863.05
157,550.86 5,500,588.27
273,139.04 4,452.00 7,401.07
84,545.15 4,900.00
18,505.00 38,120.00
1,240,958.65 16,170.00 69,322.13
6,349,698.19 61,098.43
-22,622.09 302,049.23
1,030,909.37 2,469.00
1,887,246.14 -331,386.36
17,599,610.02
9,156,398.98 354,619.84
8,799.39 1,800,686.81
500.00 686,965.03
31,803.50 545.56
141,809.21 161,631.63
7,437.97 52.79
33,165.45 55,400.00 18,345.83
1,023.21 127.60
3,979.04
12,463,291.84
5,136,318.18
4,173.12 1,527,565.98
164,564.19 486,158.97
11,117.51
Income StatementFor The 12 Periods Ended 12/31/2018
Tri-borough Home Care, Ltd (TTT)% of Revenue
Revenue
4125-00-689 Interest Income-THC 0.014125-00-690 Interest Income-MET 0.004125-00-694 Interest Income-PED 0.034125-00-695 Interest Income-Trng Schl 0.004125-01-689 FLSA Payment - Triborough 0.024125-01-694 FLSA Payment - Family Pediatric Home Care 0.004125-02-689 Recruitment & Retention Payment - THC 0.014125-03-689 Wage Parity Payment - TBHC 0.264125-07-689 Fingerprinting Refund-NYS Health C A -THC -0.004125-08-689 Refund-Photocopies for outside Party-THC 0.004125-09-695 Fees-HHA-Trng Schl-883 Flatbush Ave. 0.014150-01-689 Sales-HHA-THC 0.274150-01-690 Sales - HHA - MET 0.944150-02-689 Sales-PCW-THC 32.744150-02-690 Sales - PCW - MET 1.634150-02-691 Sales - PCW - Metro Home Services 0.034150-02-694 Sales - PCW -PED 0.044150-04-689 Sales-RN-THC 0.504150-04-694 Sales - RN -PED - Visits 0.034150-05-694 Sales - PT - PED 0.114150-07-694 Sales - LPN - PED - Visits 0.234150-08-689 Sales-Live in - THC 7.394150-09-694 Sales - ST - PED 0.104150-10-689 Sales-Med Social Worker-THC 0.414150-11-689 Sales-PCA-THC 37.804150-11-694 Sales - PCA - PED 0.364150-13-694 Sales - Management Contracts - PED -0.134150-14-689 Sales-FamCHHA ex THC 1.804150-14-694 Sales - RN - PED - Hourly 6.144150-15-694 Sales-CO PAYS from Clients/Customers-PED 0.014150-17-694 Sales - LPN - PED - Hourly 11.234150-25-689 Sales Adjustments -1.97
Total Revenue: 100.00
Cost Of Sales
5000-01-689 COS - Payroll Expense - THC 54.505000-01-690 COS - Payroll Expense - Metro 2.115000-01-691 Cost of Sales-Metro Home Services 0.055000-01-694 COS - Payroll Expense - PED 10.725000-02-689 COS - Wages - THC 0.005000-03-689 COS - FICA Employer - THC 4.095000-03-690 COS - FICA Employer - Metro 0.195000-03-691 Cost of Sales-Metro Home Services 0.005000-03-694 COS - FICA Employer - PED 0.845000-04-689 COS - Medicare Employer - THC 0.965000-04-690 COS - Medicare Employer - Metro 0.045000-04-691 Cost of Sales-Metro Home Services 0.005000-04-694 COS - Medicare Employer - PED 0.205000-08-689 COS - Professional Fees - Nursing - THC 0.335000-09-689 COS - Fed. Unemployment Insurance - THC 0.115000-09-690 COS - Fed. Unemployment Insurance - Metro 0.015000-09-691 Cost of Sales-Metro Home Services 0.005000-09-694 COS - Fed. Unemployment Insurance - PED 0.02
Total Cost Of Sales: 70.82%
Gross Profit: 29.18%
Expenses
6000-00-689 Fed Unemployment Insurance - THC 0.026000-01-689 Salaries - Brooklyn - THC 9.096000-01-690 Salaries - New York City - MET 0.986000-01-694 Salaries - Long Island - PED 2.896000-02-689 Wages - Brooklyn - THC 0.07
Project # 181319BFA Attachment E (Cont.)

1,176.00 11,412.00
5,244.75 405,951.74
5.35 35,788.98
125,429.94 11,482.40 59,098.29
1,016,857.47 37,719.95
409.37 618.40 272.00
62,000.12 19,446.07
3,613.63 80,731.30 18,172.79 10,800.00 97,070.21
1,837.85 14,451.21
807.45 4,967.71 6,755.44
32,338.49 500.00 600.00
35,140.10 12,048.86
146.81 3,728.72 4,977.69 1,469.30 3,801.70
92.54 38,174.53 44,409.17 16,612.21 68,694.50
6,930.00 67,726.11
5,167.95 4,592.39 4,797.98
29,109.64 52.34
39,480.00 49,779.41 23,333.33 17,243.06
12.00 695.00 685.13
6,821.00 -454.00
1,849.13 1,360.32
36,852.69 44,260.68
7,815.00 2,043.60
27,639.27 11,729.37
8,204.02 15,088.91 16,443.74
4,514.39 315.88 457.28
92,373.75
6000-02-690 Wages - New York City - MET 0.016000-02-694 Wages - Long Island - PED 0.076000-06-689 NYS Disability - Brooklyn - THC 0.036000-07-689 Worker's Compensation - THC 2.426000-07-691 Worker's Compensation - Queens 0.006000-08-689 Medical Insurance - Brooklyn - THC 0.216000-09-689 Payroll Expense -Benefits-Vac/Pers/Sick Dys-THC 0.756000-09-690 Payroll Expense-Benefits-Vac/Pers/Sick Dys-MET 0.076000-09-694 Payroll Expense-Benefits-Vac/Pers/Sick Dys-PED 0.356000-20-689 HHA Benefits Expense- THC 6.056000-20-690 HHA Benefits Expense- MET 0.226000-20-691 Payroll Expense-Metro Home Services 0.006050-01-689 Nursing - Brooklyn - THC 0.006050-01-690 Nursing - New York City - MET 0.006050-01-694 Nursing - Long Island - PED 0.376050-02-694 Physical Therapy - Long Island-PED 0.126050-06-689 A/R & Marketing - Brooklyn -THC 0.026050-07-689 Information Technology - Brooklyn-THC 0.486050-08-689 Legal Fees - Brooklyn- THC 0.116050-09-689 Accounting Fees - Brooklyn- THC 0.066050-10-689 Professional Fees -Others-THC 0.586100-02-015 Tax Expenses-Tax 15 0.016120-00-689 Credit Allowance for Customers' Overpayments-THC 0.096120-00-690 Credit Allowance for Customers Overpayments-MET 0.006120-00-694 Credit Allowance for Customers Overpayments-PED 0.036125-00-689 Insurance Expenses-Medical-THC 0.046126-00-689 Liability Insurance - THC 0.196130-01-695 Training Expenses-Trng Schl-883 Flatbush Ave. 0.006130-04-690 Training Expense - MET 0.006135-00-689 Professional Develpment Exp-THC 0.216200-00-689 Administrative Expenses - THC 0.076200-04-690 Administrative Expenses - MET 0.006202-00-689 Travel & Entertainment - THC 0.026202-06-694 Travel & Entertainment - PED 0.036204-00-689 General Bus. Taxes THC 0.016206-00-689 General Exp-Parking Tickets - THC 0.026207-00-689 General Exp-Others - THC 0.006301-00-689 Auto Exp - Insurance - THC 0.236303-00-689 Auto Expense - Gas - THC 0.266304-00-689 Auto Expense - Repairs & Maintenance - THC 0.106312-00-689 Dues & Subscriptions - THC 0.416314-00-689 Contributn/Donations - THC 0.046329-04-689 Equipment Rentals-Triborough Home Care, Brooklyn 0.406329-06-694 Equipment Rentals - PED 0.036339-00-689 Postages&Deliveries - THC 0.036339-06-694 Postages&Deliveries - PED 0.036344-00-689 Printing & Reproduction - THC 0.176344-06-694 Printing & Reproduction - PED 0.006401-00-689 Finance Charges - THC 0.246402-00-689 Loan Interest - THC 0.306403-00-689 Mortgage Expenses - THC 0.146405-00-689 Bank Svc Chrgs - THC 0.106405-04-690 Bank Svc Chrgs - MET 0.006405-06-694 Bank Svc Chrgs - PED 0.006420-00-689 Security Exp-Others - THC 0.006451-00-689 Storage Expenses - THC 0.046451-06-694 Storage Expenses - PED 0.006501-00-689 Office Expenses - THC 0.016501-00-690 Office Expenses-Metro Care Givers 0.016502-00-689 Stationery & Supplies - THC 0.226550-00-689 Repairs & Maintenance 0.266552-00-689 Janitorial & Cleaning - THC 0.056552-06-694 Janitorial & Cleaning - PED 0.016601-00-689 Communication Exp-Office Telephone - THC 0.166602-00-689 Commun. Exp-Modem&Internet-THC 0.076602-04-690 Commun. Exp-Modem&Internet-MET 0.056602-06-694 Commun. Exp-Modem&Internet-PED 0.096603-00-689 Commun.Exp -Cellphones - THC 0.106604-00-689 Commun. Exp-WebHosting - THC 0.036607-00-689 Timekeeping Expenses - THC 0.006653-00-689 Computer Exp-Repairs & Maintenance-THC 0.006655-00-689 Computer Exp-Software - THC 0.55
Project # 181319BFA Attachment E (Cont.)

27,478.49 4,157.77
259,300.00 476.68 223.94 405.74
30,663.69 3,908.09
73,792.80 8,734.14
98,083.76 63,367.34
-462.41 160,257.10
12,900.74
5,758,642.05
-622,323.87
146,237.07
146,237.07
-476,086.80
-476,086.80
Page: 3
6700-01-694 Rent - Long Island 0.166700-02-689 Building Repairs - Brooklyn 0.026700-07-689 Rent-Corporate Office Bldg-1414 Utica Ave.Brooklyn 1.546701-00-689 Utilities - Water - THC 0.006701-04-690 Utilities - Water - MET 0.006701-06-694 Utilities - Water - PED 0.006702-00-689 Utilities-Gas&Electricity - THC 0.186702-04-690 Utilities-Gas&Electricity - MET 0.026703-04-690 Rent - MET 0.446704-00-689 Rent - Others - THC 0.056704-00-694 Rent - Others-Family Pediatric Home Care 0.586704-00-695 Rent - Others-MHS-Training School 0.386825-00-000 Cash Discount 0.006902-00-689 Miscellaneous Expenses -Amex- THC 0.956999-02-689 Miscellaneous Exp-CAPITALONE Charge card 0.08
Total Expenses: 32.72%
Net Income From Operations: -3.54%
Other Income and Expense
4999-00-689 Other Income - THC 0.83%
Total Other Income and 0.83%
G/L Date: 1/15/2019
Earnings Before Income Tax: -2.71%
Net Income (Loss): -2.71%
Run Date: 1/15/2019 1:59:34 PM
Project # 181319BFA Attachment E (Cont.)
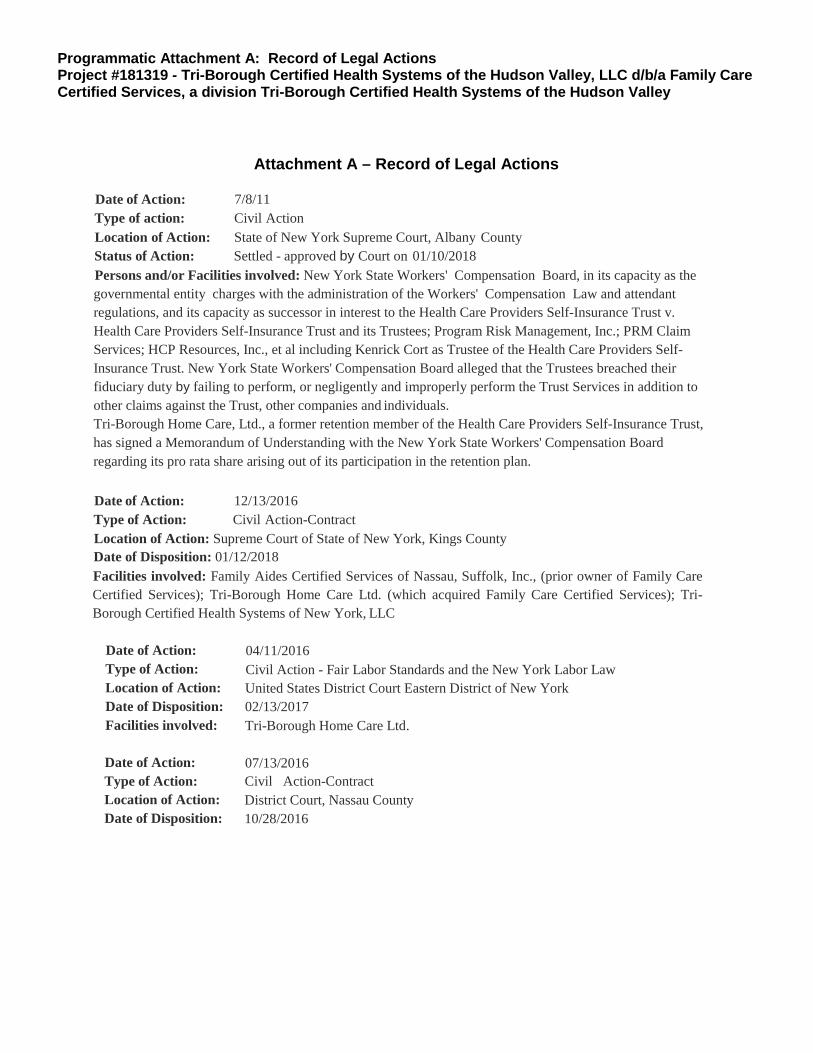
Programmatic Attachment A: Record of Legal Actions Project #181319 - Tri-Borough Certified Health Systems of the Hudson Valley, LLC d/b/a Family Care Certified Services, a division Tri-Borough Certified Health Systems of the Hudson Valley
Attachment A – Record of Legal Actions
Date of Action: 7/8/11 Type of action: Civil Action Location of Action: State of New York Supreme Court, Albany County Status of Action: Settled - approved by Court on 01/10/2018 Persons and/or Facilities involved: New York State Workers' Compensation Board, in its capacity as the governmental entity charges with the administration of the Workers' Compensation Law and attendant regulations, and its capacity as successor in interest to the Health Care Providers Self-Insurance Trust v. Health Care Providers Self-Insurance Trust and its Trustees; Program Risk Management, Inc.; PRM Claim Services; HCP Resources, Inc., et al including Kenrick Cort as Trustee of the Health Care Providers Self-Insurance Trust. New York State Workers' Compensation Board alleged that the Trustees breached their fiduciary duty by failing to perform, or negligently and improperly perform the Trust Services in addition to other claims against the Trust, other companies and individuals. Tri-Borough Home Care, Ltd., a former retention member of the Health Care Providers Self-Insurance Trust, has signed a Memorandum of Understanding with the New York State Workers' Compensation Board regarding its pro rata share arising out of its participation in the retention plan.
Date of Action: 12/13/2016 Type of Action: Civil Action-Contract Location of Action: Supreme Court of State of New York, Kings County Date of Disposition: 01/12/2018 Facilities involved: Family Aides Certified Services of Nassau, Suffolk, Inc., (prior owner of Family Care Certified Services); Tri-Borough Home Care Ltd. (which acquired Family Care Certified Services); Tri-Borough Certified Health Systems of New York, LLC
Date of Action: Type of Action: Location of Action: Date of Disposition: Facilities involved:
Date of Action: Type of Action: Location of Action: Date of Disposition:
04/11/2016 Civil Action - Fair Labor Standards and the New York Labor Law United States District Court Eastern District of New York 02/13/2017 Tri-Borough Home Care Ltd.
07/13/2016 Civil Action-Contract District Court, Nassau County 10/28/2016
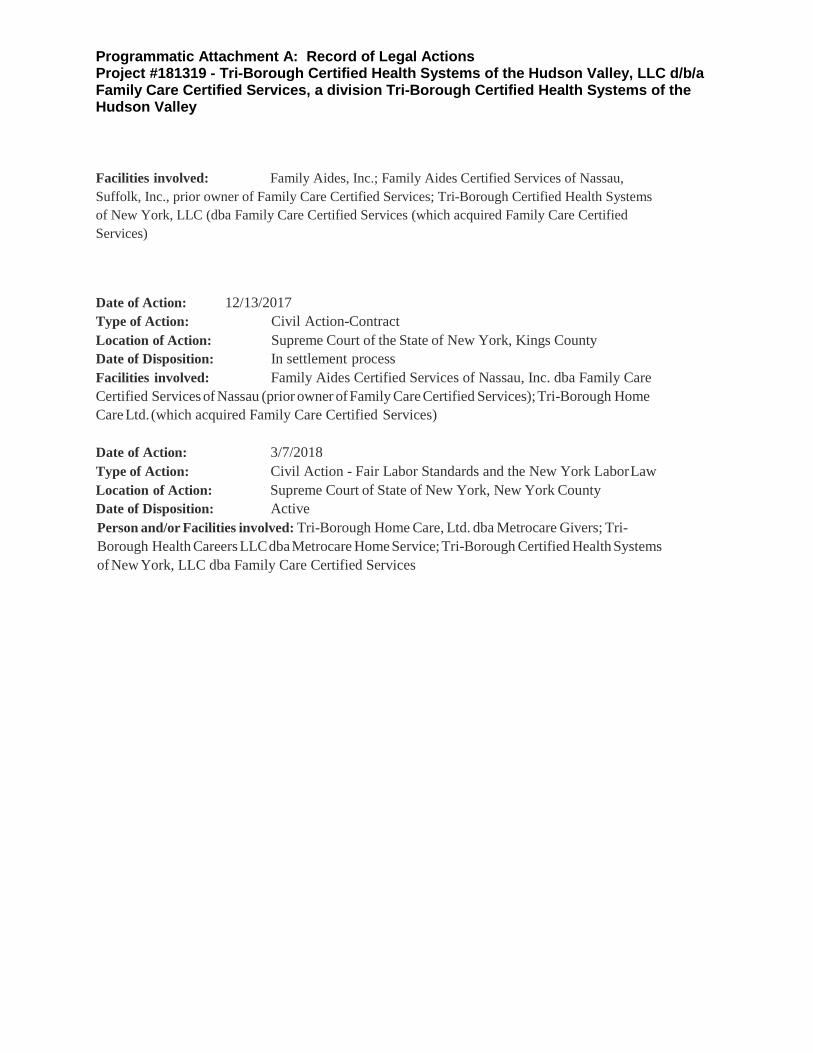
Programmatic Attachment A: Record of Legal Actions Project #181319 - Tri-Borough Certified Health Systems of the Hudson Valley, LLC d/b/a Family Care Certified Services, a division Tri-Borough Certified Health Systems of the Hudson Valley
Facilities involved: Family Aides, Inc.; Family Aides Certified Services of Nassau, Suffolk, Inc., prior owner of Family Care Certified Services; Tri-Borough Certified Health Systems of New York, LLC (dba Family Care Certified Services (which acquired Family Care Certified Services)
Date of Action: 12/13/2017 Type of Action: Civil Action-Contract Location of Action: Supreme Court of the State of New York, Kings County Date of Disposition: In settlement process Facilities involved: Family Aides Certified Services of Nassau, Inc. dba Family Care Certified Services of Nassau (prior owner of Family Care Certified Services); Tri-Borough Home Care Ltd. (which acquired Family Care Certified Services) Date of Action: 3/7/2018 Type of Action: Civil Action - Fair Labor Standards and the New York Labor Law Location of Action: Supreme Court of State of New York, New York County Date of Disposition: Active Person and/or Facilities involved: Tri-Borough Home Care, Ltd. dba Metrocare Givers; Tri-Borough Health Careers LLC dba Metrocare Home Service; Tri-Borough Certified Health Systems of New York, LLC dba Family Care Certified Services