Embed Size (px)
Citation preview
NORTHERN VICTORIA IRRIGATION RENEWAL PROJECT STAGE 1 –WATER SAVINGS AUDIT AUDIT REPORT
Job Number: 7637-62 Prepared for: Department of Sustainability &
Environment Victoria Dated: October 2009
1
Northern Victoria Irrigation Renewal Project (NVIRP) Stage 1 Audit of Water Savings
Cardno (Qld) Pty Ltd ABN 57 051 074 992
Level 11 Green Square North Tower 515 St Paul’s Terrace
Fortitude Valley Qld 4006 Locked Bag 4006 Fortitude Valley
Queensland 4006 Australia
Telephone: 07 3369 9822 Facsimile: 07 3369 9722
International: +61 7 3369 9822 [email protected]
www.cardno.com.au
Document Control
John Graham Natalie Muir
Version Date Author Reviewer
5 October 2009
"© 2009 Cardno (Qld) Pty Ltd All Rights Reserved. Copyright in the whole and every part of this document belongs to Cardno (Qld) Pty Ltd and may not be used, sold, transferred, copied or reproduced in whole or in part in any manner or form or in or on any media to any person without the prior written consent of Cardno (Qld) Pty Ltd.”
October 2009 M:\7637-62\Word\Final Report\Audit Report_Final -NVIRP.docx
i
Northern Victoria Irrigation Renewal Project (NVIRP) Stage 1 Audit of Water Savings
Executive Summary Cardno (Qld) Pty Ltd was engaged by the Department of Sustainability and Environment (DSE) to undertake the first independent audit of water savings for the Northern Victoria Irrigation Renewal Project (NVIRP) Stage 1.
The irrigation areas covered by the NVIRP project Stage 1 are:
66 Torrumbarry Irrigation Area;
66 Pyramid Boort Irrigation Area;
66 Rochester Irrigation Area;
66 Campaspe Irrigation Area;
66 Murray Valley Irrigation Area; and
66 Central Goulburn Irrigation Areas (CG 5-9).
Cardno’s scope of works for the NVIRP Stage 1 project involved the completion of an independent audit of the water savings estimates for the following two cases:
66 Phase 3 water savings – interim actual water savings for the works in place for the period 1 March 2009 to the end of the irrigation season (nominally 15th May 2009); and
66 Phase 4 water savings – in terms of Long Term Cap Equivalent (LTCE) for the works in place for the period 15th May 2008 to the end of the irrigation season (nominally 15th May 2009).
The audit was based on the Victorian Government Water Savings Protocol for the Quantification of Water Savings from Irrigation Modernisation Projects (the Protocol) which includes a “Technical Manual for the Quantification of Water Savings”.
Audit interviews were completed between 21st and 25th September, 2009 and included representatives from NVIRP, Goulburn Murray Water and the Future Flow Alliance.
DSE advised Cardno that NVIRP water savings estimates are based on the following completed works:
� 87 outfalls which have been impacted by the installation of 983 regulator gates � 5.25km of channel lining; � 349 Dethridge meters or previous open outlets, now replaced with new meters; and � 61 Dethridge meters or open outlet, now rationalised.
In summary, the audit found that the water savings estimates Phase 3 for the period 1 March 2009 to the end of the irrigation season and Phase 4 for the period 15 May 2008 to the end of the irrigation season have been calculated generally in accordance with the updated Technical Manual for the Quantification of Water Savings (the Technical Manual) with the exception of Channel Automation – Bank Leakage and Channel Remediation, both of which have been calculated using theoretical methods. In both cases the theoretical methods are considered to result in conservative water savings estimate figures.
Some minor errors in input data (e.g. season operating periods being miscalculated by a day in three of the six districts) or interpretation of the Technical Manual were identified during the audit and these were corrected and the water savings recalculated by the Audit team. The resultant changes are not significant and are summarised
October 2009 Cardno (Qld) Pty Ltd M:\7637-62\Word\Final Report\Audit Report_Final -NVIRP.docx
ii
Northern Victoria Irrigation Renewal Project (NVIRP) Stage 1 Audit of Water Savings
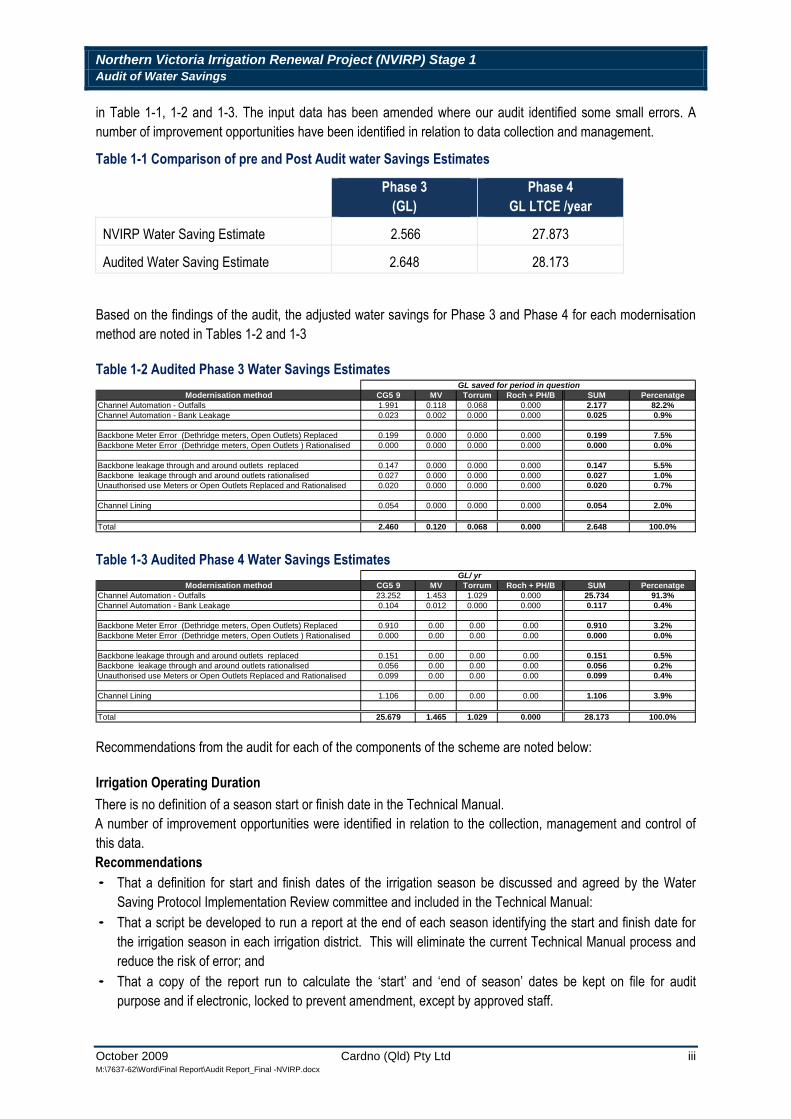
in Table 1-1, 1-2 and 1-3. The input data has been amended where our audit identified some small errors. A number of improvement opportunities have been identified in relation to data collection and management.
Table 1-1 Comparison of pre and Post Audit water Savings Estimates
Phase 3 (GL)
Phase 4 GL LTCE /year
NVIRP Water Saving Estimate 2.566 27.873
Audited Water Saving Estimate 2.648 28.173
Based on the findings of the audit, the adjusted water savings for Phase 3 and Phase 4 for each modernisation method are noted in Tables 1-2 and 1-3
Table 1-2 Audited Phase 3 Water Savings Estimates GL saved for period in question
Modernisation method CG5 9 MV Torrum Roch + PH/B SUM Percenatge Channel Automation - Outfalls 1.991 0.118 0.068 0.000 2.177 82.2% Channel Automation - Bank Leakage 0.023 0.002 0.000 0.000 0.025 0.9%
Backbone Meter Error (Dethridge meters, Open Outlets) Replaced 0.199 0.000 0.000 0.000 0.199 7.5% Backbone Meter Error (Dethridge meters, Open Outlets ) Rationalised 0.000 0.000 0.000 0.000 0.000 0.0%
Backbone leakage through and around outlets replaced 0.147 0.000 0.000 0.000 0.147 5.5% Backbone leakage through and around outlets rationalised 0.027 0.000 0.000 0.000 0.027 1.0% Unauthorised use Meters or Open Outlets Replaced and Rationalised 0.020 0.000 0.000 0.000 0.020 0.7%
Channel Lining 0.054 0.000 0.000 0.000 0.054 2.0%
Total 2.460 0.120 0.068 0.000 2.648 100.0%
Table 1-3 Audited Phase 4 Water Savings Estimates GL/ yr
Modernisation method CG5 9 MV Torrum Roch + PH/B SUM Percenatge Channel Automation - Outfalls 23.252 1.453 1.029 0.000 25.734 91.3% Channel Automation - Bank Leakage 0.104 0.012 0.000 0.000 0.117 0.4%
Backbone Meter Error (Dethridge meters, Open Outlets) Replaced 0.910 0.00 0.00 0.00 0.910 3.2% Backbone Meter Error (Dethridge meters, Open Outlets ) Rationalised 0.000 0.00 0.00 0.00 0.000 0.0%
Backbone leakage through and around outlets replaced 0.151 0.00 0.00 0.00 0.151 0.5% Backbone leakage through and around outlets rationalised 0.056 0.00 0.00 0.00 0.056 0.2% Unauthorised use Meters or Open Outlets Replaced and Rationalised 0.099 0.00 0.00 0.00 0.099 0.4%
Channel Lining 1.106 0.00 0.00 0.00 1.106 3.9%
Total 25.679 1.465 1.029 0.000 28.173 100.0%
Recommendations from the audit for each of the components of the scheme are noted below:
Irrigation Operating Duration There is no definition of a season start or finish date in the Technical Manual. A number of improvement opportunities were identified in relation to the collection, management and control of this data. Recommendations · That a definition for start and finish dates of the irrigation season be discussed and agreed by the Water
Saving Protocol Implementation Review committee and included in the Technical Manual: · That a script be developed to run a report at the end of each season identifying the start and finish date for
the irrigation season in each irrigation district. This will eliminate the current Technical Manual process and reduce the risk of error; and
· That a copy of the report run to calculate the ‘start’ and ‘end of season’ dates be kept on file for audit purpose and if electronic, locked to prevent amendment, except by approved staff.
October 2009 Cardno (Qld) Pty Ltd M:\7637-62\Word\Final Report\Audit Report_Final -NVIRP.docx
iii
Northern Victoria Irrigation Renewal Project (NVIRP) Stage 1 Audit of Water Savings
Program of Works Based upon our audit of FutureFlow construction records, and G-MW operational practices, Cardno is satisfied, based upon the spot checks undertaken, that the program of works has been implemented. It was noted that G-MW does not have a documented checking process for transfer of constructed assets from FutureFlow.
Recommendation • That G-MW prepare and implement asset acceptance procedures including verification process
Channel Automation:
It was observed that Water Savings were only calculated for channels where more than 25% of the length has been implemented. While verification of input data and between NVIRP and G-MW is effective, the final agreement is not formally documented and signed off by both organisations. There are also some inconsistencies between the definitions in the technical manual.
Recommendations; · That where matters relating to definitions, data validation, inputs etc are discussed and agreed between
the Project Proponent (NVIRP) and System Operator (G-MW) the agreement should be documented and signed off by both parties.
Outfalls:
Outfalls water savings account for over 80% of the total Phase 3 savings and over 90% of the Phase 4 saving for the audited period.
As part of our audit, it was discovered that the calculation of the Outfalls water savings had been calculated based on a misinterpretation of the Technical Manual. The water savings were not calculated on an “outfall by outfall basis”. The significance of the error is minor however the water savings were recalculated in accordance with the strict interpretation of the Technical Manual. Both G-MW and NVIRP senior staff have expressed concern over the interpretation.
The LTCEyearx figure was calculated by NVIRP for each individual irrigation area whereas the intent of the Technical Manual is for a single LTCEyearx figure to be calculated for the entire NVIRP area.
It was also noted that outfall record keeping was largely manual and was sometimes adjusted (with no audit trail) where the results were known to be inaccurate. A number of improvement opportunities were identified in relation to the collection, verification, management and control of this data.
October 2009 Cardno (Qld) Pty Ltd M:\7637-62\Word\Final Report\Audit Report_Final -NVIRP.docx
iv

Northern Victoria Irrigation Renewal Project (NVIRP) Stage 1 Audit of Water Savings
Recommendations
· That the requirement to estimate Water Saving Outfalls on a “outfall by outfall” be reviewed by the Water Savings Protocol Implementation Review Committee prior to preparation of next year’s water savings estimates and that an explanation for the adopted approach be included in the next revision of the Technical Manual.
· That the daily outfall volume reporting sheets be retained on file after the figures have been transferred to the area summary spreadsheet.
· That a consistent format be adopted for recording outfall volume across all areas. · That detail of any adjustments made by Supervisors/Loss Management Officers be documented and
retained along with a corresponding comment on the reasons for the adjustment. · That a single LTCEyearx figure be used for the entire NVIRP area in future years when calculating water
savings.
Bank Leakage:
It was observed that there were some issues with the 2008/2009 water balance which remain unresolved. The water balance is considered to contain some inaccuracies which impacts on the ability to accurately report on water savings in the 2009/10 year.
A view was expressed that an alternative method, not dependent upon the water balance needs to be developed for future calculation of Bank Leakage water savings.
It was also observed that the water savings calculations were calculated in accordance with Phase 2 and Phase 1 calculation methods in lieu of the Phase 3 and Phase 4 methods due to the lack of measured data.
Recommendations
· That the water balance for 2008/2009 be reviewed and agreed between NVIRP & G-MW. · That the water saving estimates for bank leakage – channel automation in 2008/2009 not be calculated in
accordance with the Phase 3 and Phase 4 equations. · That Phase 2 and Phase 1 be adopted as theoretical calculations in lieu of Phase 3 & Phase 4 for
2008/2009. · That alternative methodologies for calculating bank leakage water saving be investigated and evaluated by
the Water Saving Protocol Implementation Review Committee.
Channel Remediation:
The auditor observed a minor discrepancy between the length of lining stated in the Program of Works and the water savings calculations, however the impact was considered to have a negligible impact. It was also noted that NVIPR and G-MW had separately calculated the Phase 3 water savings audits, via two different methodologies.
There was no pre pondage test data available for the lined pools in the NVIRP area necessitating the use of a theoretical calculation method rather than a direct method calculation
October 2009 Cardno (Qld) Pty Ltd M:\7637-62\Word\Final Report\Audit Report_Final -NVIRP.docx
v
Northern Victoria Irrigation Renewal Project (NVIRP) Stage 1 Audit of Water Savings
Recommendations
· That pre and post works pondage tests should be carried out for all channel remediation works in future years.
· That consideration should be given to ensuring flexibility in the programming of out of season maintenance/construction works so pondage test can be completed.
· That the more conservative Water Saving Figures calculated using the G-MW methodology be adopted for Phase 3 Water Saving Estimate Channel Remediation for 2008/09.
Service Points Replacements:
Some inconsistencies were identified in the service delivery volumes for the season due to the timing for the running of the various reports and the difference in start and finish dates for the irrigation seasons. These were corrected and the water savings recalculated.
Recommendations
· That G-MW review its procedures to ensure that in future years the delivery data report for input into the water saving calculations is only run after the end of the irrigation season, all meters read and the IPM database updated.
· That data recalculations agreed between G-MW and NVIRP should be formally documented. · That the various definitions of DyearX and Dbase be reviewed and clarified
Service Points Rationalisation:
The findings of the audit on this element were similar to the Service Points Replacements as the process followed by NVIRP and G-MW to determine the number of points rationalised was identical to that followed for service points replaced. An additional recommendation was made in relation to this element:
Recommendations
· That the definition for Dbase in 12.3.3 be reviewed and clarified.
Improvement Opportunities
The audit scope includes a requirement to identify potential improvements to the data collection, data analysis, assumptions and methods used to estimate water saving as recommending changes to the Technical Manual that will improve the use ability and accuracy of the water savings estimates.
In addition to the recommendations above relating to specific savings calculations, during the course of the audit we identified a number of generic improvement opportunities which are summarised below.
Item Recommendation
Data Management · That both G-MW and NVIRP should continue to develop and refine document procedures covering all aspects of data collection, cleansing, validation, alteration, storage, reporting and calculation of water saving estimates.
· That all ‘input data’ prepared and issued for inclusion in water savings estimate calculations be given a ‘closed’ status at the time of issue and only amended by approved staff members and all amendments documented. A central copy of each report should be returned of each issued report.
October 2009 Cardno (Qld) Pty Ltd M:\7637-62\Word\Final Report\Audit Report_Final -NVIRP.docx
vi
Northern Victoria Irrigation Renewal Project (NVIRP) Stage 1 Audit of Water Savings
Item Recommendation
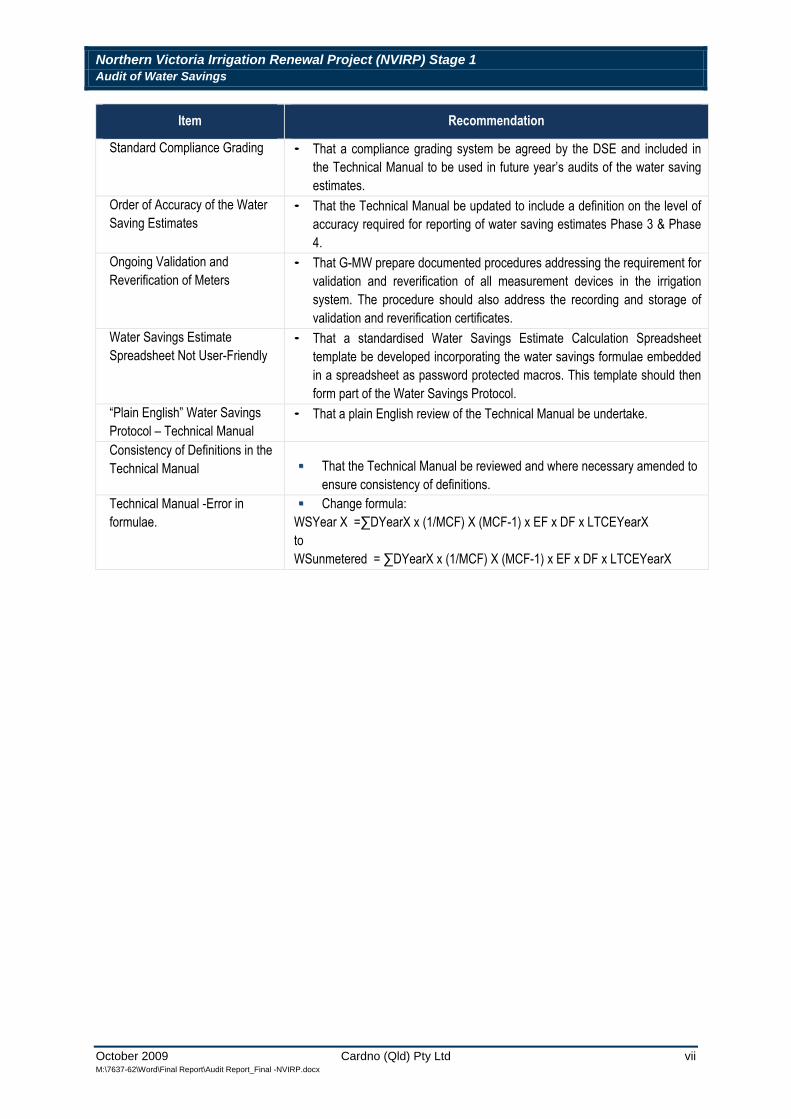
Standard Compliance Grading · That a compliance grading system be agreed by the DSE and included in the Technical Manual to be used in future year’s audits of the water saving estimates.
Order of Accuracy of the Water · That the Technical Manual be updated to include a definition on the level of Saving Estimates accuracy required for reporting of water saving estimates Phase 3 & Phase
4. Ongoing Validation and · That G-MW prepare documented procedures addressing the requirement for Reverification of Meters validation and reverification of all measurement devices in the irrigation
system. The procedure should also address the recording and storage of validation and reverification certificates.
Water Savings Estimate · That a standardised Water Savings Estimate Calculation Spreadsheet Spreadsheet Not User-Friendly template be developed incorporating the water savings formulae embedded
in a spreadsheet as password protected macros. This template should then form part of the Water Savings Protocol.
“Plain English” Water Savings · That a plain English review of the Technical Manual be undertake. Protocol – Technical Manual Consistency of Definitions in the Technical Manual �� That the Technical Manual be reviewed and where necessary amended to
ensure consistency of definitions. Technical Manual -Error in �� Change formula: formulae. WSYear X =∑DYearX x (1/MCF) X (MCF-1) x EF x DF x LTCEYearX
to WSunmetered = ∑DYearX x (1/MCF) X (MCF-1) x EF x DF x LTCEYearX
October 2009 Cardno (Qld) Pty Ltd M:\7637-62\Word\Final Report\Audit Report_Final -NVIRP.docx
vii
Northern Victoria Irrigation Renewal Project (NVIRP) Stage 1 Audit of Water Savings
Table of Contents Executive Summary .................................................................................................................................... ii
Irrigation Operating Duration ...................................................................................................................iii
Program of Works ................................................................................................................................ iv
1 Introduction ....................................................................................................................................... 3
1.1 General ...................................................................................................................................... 3
1.2 Scope of Works............................................................................................................................3
2 Background ....................................................................................................................................... 5
2.1 General ...................................................................................................................................... 5
2.2 Baseline Year Audit ......................................................................................................................5
3 Audit Methodology .............................................................................................................................. 7
4 Audit Findings .................................................................................................................................... 9
4.1 Introduction ................................................................................................................................. 9
4.2 Irrigation Operating Duration .........................................................................................................10
4.3 Program of Works.......................................................................................................................14
4.3.1 Introduction...................................................................................................................14
4.3.2 FutureFlow ...................................................................................................................14
4.3.3 G-MW..........................................................................................................................15
4.3.4 Channel Length Error......................................................................................................15
4.3.5 Conclusion ...................................................................................................................15
4.4 Channel Automation....................................................................................................................15
4.4.1 Water Saving – Outfalls ...................................................................................................17
4.4.2 Water Saving – Bank Leakage ..........................................................................................20
4.5 Channel Remediation (Channel Lining) ...........................................................................................22
4.5.1 Introduction...................................................................................................................22
4.6 Service Points ...........................................................................................................................27
4.6.1 Service Points Replacements ...........................................................................................27
4.6.2 Service Point Rationalisation ............................................................................................31
4.6.3 Improvement Opportunities ..............................................................................................36
4.7 NVIRP Business Case Targets ......................................................................................................40
5 Summary Table of Water Savings Estimates 2008/09 .............................................................................41
October 2009 Cardno (Qld) Pty Ltd M:\7637-62\Word\Final Report\Audit Report_Final -NVIRP.docx
1
Northern Victoria Irrigation Renewal Project (NVIRP) Stage 1 Audit of Water Savings
List of Tables Table 3-1 People Interviewed ................................................................................................................... 8
Table 4-1 Irrigation Operating Duration – Audit Comments ........................................................................... 12
Table 4-2 Irrigation Season Start/Finish Dates ........................................................................................... 14
Table 4-3 Channel Automation General Comments .................................................................................... 16
Table 4-4 Channel Automation – Outfalls.................................................................................................. 18
Table 4-5 Summary of Changes to Water Saving Estimates Channel Automation – Outfalls ................................ 20
Table 4-6 Channel Automation – Bank Leakage ......................................................................................... 21
Table 4-7 Channel Remediation – Lining .................................................................................................. 24
Table 4-8 Summary of Changes to Water Saving Estimates Channel Remediation ............................................ 26
Table 4-9 Service Point Replacement ...................................................................................................... 28
Table 4-10 Service Point Rationalisation .................................................................................................... 33
Table 4-11 Summery of Changes to Water Saving Estimates Meter Error ......................................................... 34
Table 4-12 Summary of Changes to Water Saving Estimates Meter Leakage and Unauthorised ............................ 35
Table 4-13 Improvement Opportunities ...................................................................................................... 37
Table 4-14 Water Savings Vs NVIRP Business Case Target .......................................................................... 40
Table 5-1 Audited Phase 3 Water Savings ................................................................................................ 41
Table 5-2 Audited Phase 4 Water Savings ................................................................................................ 41
List of Figures
Figure 4-1 Phase 3 – Water Saving Estimates ......................................................................................................................... 9
Figure 4-2 Phase 4 – Water Saving Estimates ....................................................................................................................... 10
Appendices
Appendix A Executive Summary, Baseline Audit Report August 2009 by Sharp Coefficient Pty Ltd. Appendix B Typical FutureFlow Work Package sign off documentation Appendix C G-MW List of Procedures Appendix D NVIRP Procedure Flow Charts Appendix E Essential Service Commission Standard Compliance Grading System
October 2009 Cardno (Qld) Pty Ltd M:\7637-62\Word\Final Report\Audit Report_Final -NVIRP.docx
2
Northern Victoria Irrigation Renewal Project (NVIRP) Stage 1 Audit of Water Savings
1 Introduction
1.2 General
Cardno (Qld) Pty Ltd has been engaged by the Department of Sustainability of Environment Victoria (DSE) to undertake the first independent audit of water savings for the Northern Victoria Irrigation Renewal Project (NVIRP) Stage 1.
The irrigation areas covered by the NVIRP project Stage 1 are:
66 Torrumbarry Irrigation Area;
66 Pyramid Boort Irrigation Area;
66 Rochester Irrigation Area;
66 Campaspe Irrigation Area;
66 Murray Valley Irrigation Area; and
66 Central Goulburn Irrigation Areas (CG 5-9).
The irrigation modernisation works are being carried out over several years.
The Victorian Government has developed the Water Savings Protocol for the Quantification of Water Savings from Irrigation Modernisation Projects (the Protocol).
The Protocol is a series of documents, which together, aim to provide transparency and consistency in the estimation and allocation of water savings derived from irrigation modernisation projects. It has been developed based on the key principles of the draft Northern Region Sustainable Water Strategy and is applicable State-wide.
The Protocol includes a “Technical Manual for the Quantification of Water Savings” (Technical Manual).
1.3 Scope of Works
Cardno’s scope of works for the NVIRP Stage 1 project involved the completion of an independent audit of the water savings estimates for the following two cases:
Phase 3 water savings – interim actual water savings for the works in place for the period 1 March 2009 to the end of the irrigation season (nominally 15th May 2009).
Phase 4 water savings – in terms of Long Term Cap Equivalent (LTCE) for the works in place for the period 15 May 2008 to the end of the irrigation season (nominally 15th May 2009).
October 2009 Cardno (Qld) Pty Ltd M:\7637-62\Word\Final Report\Audit Report_Final -NVIRP.docx
3
Northern Victoria Irrigation Renewal Project (NVIRP) Stage 1 Audit of Water Savings
The scope of the Independent Audit is also defined in the Protocol to include:
a) Verifying that the Phase 3 (and Phase 4) water savings calculations have been calculated in accordance with the Technical Manual for the Quantification of Water Savings.
b) Checking that the data collection and inputs are as accurate as could reasonably be expected for the purpose of calculating water savings.
c) Spot checks that the program of works has been implemented as documented in the water saving calculations.
d) Checking that water savings have been calculated based on the nature and the extent of all modernisation works completed prior to 15th May in the year of the audit.
e) Providing a corrected estimate of the water savings for any component where the project proponent calculations are found to be non-compliant or deficient.
f) Identifying potential improvements to the data collection, data analysis, assumptions and methods used to estimate the water savings. Recommend changes to the Technical Manual for the Quantification of Water Savings to the Director of Allocations and Licences within DSE that will improve useability and accuracy of water savings.
g) Checking if suggestions from the previous year’s audit have been actioned upon and report upon the status of each of the suggested improvements.
It should be noted that as this is the first independent audit of water savings there is no “previous year’s audit” and accordingly item g) above is not addressed further in this report.
October 2009 Cardno (Qld) Pty Ltd M:\7637-62\Word\Final Report\Audit Report_Final -NVIRP.docx
4
Northern Victoria Irrigation Renewal Project (NVIRP) Stage 1 Audit of Water Savings
2 Background
2.1 General
In 2004, the Victorian Government put in place a long-term plan for water resource management titled “Our Water Our Future”.
As part of implementing this plan, the Government established NVIRP as a State Owned Entity under the State Owned Enterprise Act 1992 to implement the modernisation of the Goulburn-Murray Irrigation District (GMID). Some initial works were undertaken by G-MW in the Shepparton and Central Goulburn 1-4 systems with the remaining majority of the modernisation works being managed by NVIRP.
Goulburn-Murray Water operates across a region of 68,000 square kilometres, bordered by the Great Dividing Range in the south to the River Murray in the north, and stretching from Corryong in the east, downriver to Nyah.
The GMID is divided into six management areas: Shepparton, Central Goulburn, Rochester-Campaspe, Pyramid-Boort, Murray Valley and Torrumbarry.
NVIRP Stage 1 works only occur in five of the six irrigation systems. The Stage 1 NVIRP works area excludes Shepparton and Central Goulburn 1-4 channel areas. The Stage 1 NVIRP project area covers approximately 85 percent of the Goulburn-Murray Irrigation District (GMID) and a total of about 6,000km of channels and natural carrier (river) irrigation supply systems.
The aim of the project is to increase the efficiency of the irrigation delivery for Northern Victoria Irrigation Renewal Project from approximately 70% to at least 85% with the water savings achieved via the modernisation works being reallocated between the environment, farmers and urban water supply systems.
The NVIRP program of works is to be delivered in two separate stages:
66 Stage 1 generally involves automation, remediation and measurement with some connection work;
66 Stage 2 is mainly focused on further connection works.
The Victorian State Government has committed to clear and transparent processes for the calculation and verification of the water savings achieved through the project and accordingly requires the water savings estimates to be independently audited.
2.2 Baseline Year Audit
In July – August 2009, NVIRP engaged Sharp Coefficient Pty Ltd to undertake an initial Baseline Year Audit. This involved reviewing data for the baseline year and documentation, primarily provided by G-MW.
While the audit findings specifically related to the baseline year data and documentation, many are also relevant to the 2008-2009 data and documentation.
Sharp Coefficient Pty Ltd identified a lack of documented procedures as restricting the ability to audit the water balances for each irrigation district. Between August and the Cardno audit in late September, G-MW has prepared a number of procedures.
October 2009 Cardno (Qld) Pty Ltd M:\7637-62\Word\Final Report\Audit Report_Final -NVIRP.docx
5
Northern Victoria Irrigation Renewal Project (NVIRP) Stage 1 Audit of Water Savings
The Sharp Coefficient Pty Ltd audit report also recommended that the water balance for each irrigation district be re-calculated following incorporation of the report recommendations for some 22 parameters reviewed during the report. G-MW is still in the process of addressing a number of the recommendations at the time of our audit.
In discussions with both NVIRP & G-MW, Cardno were advised that both organisations accepted the findings of the baseline audit.
Cardno did not re-audit the baseline year.
October 2009 Cardno (Qld) Pty Ltd M:\7637-62\Word\Final Report\Audit Report_Final -NVIRP.docx
6
Northern Victoria Irrigation Renewal Project (NVIRP) Stage 1 Audit of Water Savings
3 Audit Methodology Immediately following Cardno's appointment, an information request was forwarded to NVIRP seeking copies of water savings calculation spreadsheets, the data source totals, procedures and flowcharts for all relevant processes as well as a list of interviewees from both NVIRP and G-MW. Supplied data was reviewed in the days prior to the on-site audit interviews to identify issues to be covered during the audit.
The on-site audit interviews commenced on Monday 21st September with a start-up meeting held at NVIRP’s office in Shepparton. Representatives attended the meeting from NVIRP, G-MW and the FutureFlow Alliance. A further introductory meeting was held with senior G-MW staff prior to commencing interviews at the G-MW offices in Tatura.
On Monday, 21st September, DSE forwarded an updated copy of the Water Savings Protocol Technical Manual.
DSE has advised Cardno that:
66 this document included amendments of clarification that were adopted by the Water Savings Protocol Implementation Review Committee, and
66 the amendments are adjustments arising from experience in the initial application of the Technical Manual to the Early Works water savings.
Changes to the Technical Manual were discussed with representatives from NVIRP and G-MW. We were advised that as the changes were generally known to both organisations via their representation on the Water Savings Protocol Implementation Review Committee, they had anticipated the changes when preparing their water savings estimates. Over the ensuing five days we held one-on-one interviews and meetings with representatives from all of the above companies regarding the savings spreadsheets, input data and procedures.
Interviews were held at NVIRP’s office in Shepparton, G-MW’s office in Tatura and FutureFlow Alliance office in Shepparton.
During these meetings we sought to;
66 gain an understanding of how the system modernisation works were implemented; 66 subject the calculations and supporting data and inputs to focused scrutiny; 66 identify and challenge all material assumptions that underpin the estimates; 66 assess information quality; 66 assess the adequacy of reporting processes; 66 assess company procedures to identify whether or not they are fit for purpose; and 66 develop an opinion on the accuracy and reliability of the input data and estimates.
We sighted hardcopy and / or electronic copies of samples of source data, procedures, worksheets, construction records and water savings worked examples. We also obtained both hardcopy and electronic copies of the water saving spreadsheets to enable further analysis during the preparation of the audit report.
At the conclusion of the week long on-site work, a closeout meeting was held at the offices of NVIRP. Representatives from all three organisations were invited to attend this meeting at which we outlined some initial findings and the ongoing audit process.
October 2009 Cardno (Qld) Pty Ltd M:\7637-62\Word\Final Report\Audit Report_Final -NVIRP.docx
7
Northern Victoria Irrigation Renewal Project (NVIRP) Stage 1 Audit of Water Savings
The draft audit report was prepared and forwarded to NVIRP, G-MW and DSE for review and advice of any errors of fact. All responses were considered by the audit team, and where appropriate, amendments were made to the final report.
A complete audit of the water balance was not expected as part of the Cardno audit scope. An internal audit of the base case year was undertaken by Sharp Coefficient in August 2009. That audit identified a lack of documented procedures as restricting the ability to audit the water balances for each irrigation district. The Sharp Coefficient Pty Ltd audit report also recommended that the water balance for each irrigation district be re-calculated following incorporation of the report recommendations for some 22 parameters reviewed during the report.
Many of the findings of the Sharp Coefficient Pty Ltd audit are relevant to the Cardno audit. As there has been insufficient time since the audit for G-MW to action all the recommendations of that audit, it was agreed with the DSE that this work should be the subject of a separate brief later in the operating year.
It was also noted that the latest version of the water balance had yet to be agreed between NVIRP and G-MW and will be the subject of upcoming meetings
It should be noted that the water balance has minimal impact on this year’s water savings calculations. It only impacts water savings calculations for Upper Bank Leakage which represents less than 1% of the total Phase 3 water savings and Channel Lining which represents 2% of the total Phase 3 water savings in 2008/09
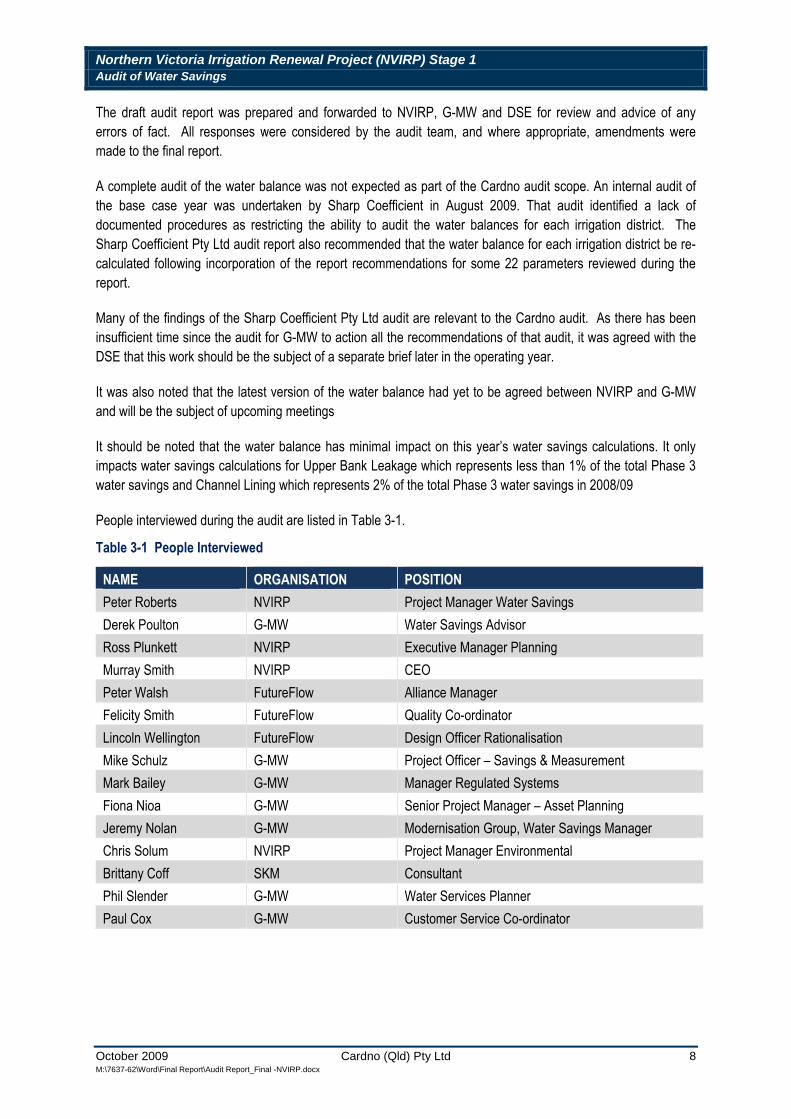
People interviewed during the audit are listed in Table 3-1.
Table 3-1 People Interviewed
NAME ORGANISATION POSITION Peter Roberts NVIRP Project Manager Water Savings Derek Poulton G-MW Water Savings Advisor Ross Plunkett NVIRP Executive Manager Planning Murray Smith NVIRP CEO Peter Walsh FutureFlow Alliance Manager Felicity Smith FutureFlow Quality Co-ordinator Lincoln Wellington FutureFlow Design Officer Rationalisation Mike Schulz G-MW Project Officer – Savings & Measurement Mark Bailey G-MW Manager Regulated Systems Fiona Nioa G-MW Senior Project Manager – Asset Planning Jeremy Nolan G-MW Modernisation Group, Water Savings Manager Chris Solum NVIRP Project Manager Environmental Brittany Coff SKM Consultant Phil Slender G-MW Water Services Planner Paul Cox G-MW Customer Service Co-ordinator
October 2009 Cardno (Qld) Pty Ltd M:\7637-62\Word\Final Report\Audit Report_Final -NVIRP.docx
8
Northern Victoria Irrigation Renewal Project (NVIRP) Stage 1 Audit of Water Savings
4 Audit Findings
4.1 Introduction
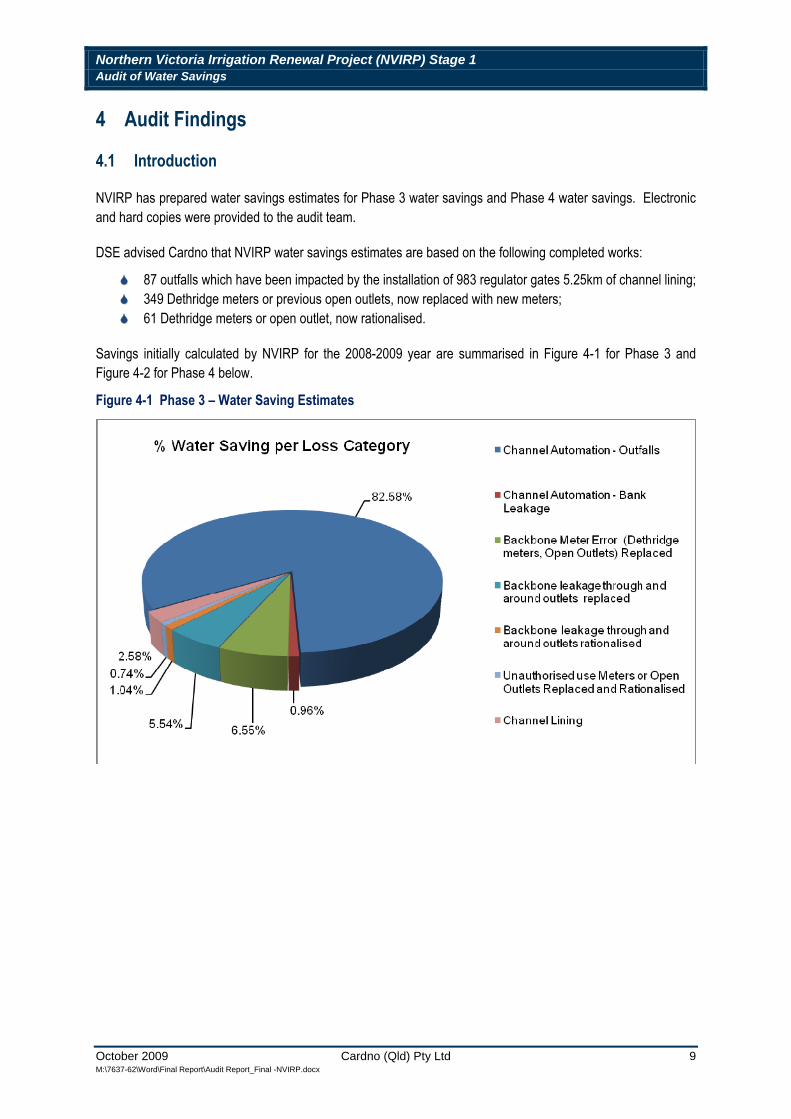
NVIRP has prepared water savings estimates for Phase 3 water savings and Phase 4 water savings. Electronic and hard copies were provided to the audit team.
DSE advised Cardno that NVIRP water savings estimates are based on the following completed works:
66 87 outfalls which have been impacted by the installation of 983 regulator gates 5.25km of channel lining; 66 349 Dethridge meters or previous open outlets, now replaced with new meters; 66 61 Dethridge meters or open outlet, now rationalised.
Savings initially calculated by NVIRP for the 2008-2009 year are summarised in Figure 4-1 for Phase 3 and Figure 4-2 for Phase 4 below.
Figure 4-1 Phase 3 – Water Saving Estimates
October 2009 Cardno (Qld) Pty Ltd M:\7637-62\Word\Final Report\Audit Report_Final -NVIRP.docx
9

Northern Victoria Irrigation Renewal Project (NVIRP) Stage 1 Audit of Water Savings
Figure 4-2 Phase 4 – Water Saving Estimates
The water savings estimates can be calculated using formulae detailed in the Technical Manual for Quantification of Water Savings. An updated version of the Technical Manual, dated September 2009, was issued to Cardno by DSE for use during the audit.
DSE has advised Cardno that
66 the amendments detailed in the updated Technical Manual were adopted by the Water Savings Protocol Implementation Review Committee, and
66 the amendments are adjustments arising from experience in the initial application of the Technical Manual to the Early Works water savings and are predominantly of a clarifying nature.
The water savings estimates prepared by NVIRP were generally calculated in accordance with and have been audited against the updated Technical Manual.
4.2 Irrigation Operating Duration
The length of the irrigation season in each irrigation area is required for the calculation of OPx used in the calculation of water savings – service point replacements and for the pro rata factor (R) used in calculating Phase 3 water savings for the shortened period 1st March to the end of the season (nominally 15th May 2009) which impacts all Phase 3 water saving calculations. The requirement to pro rata the water savings for the shorter period is not specifically addressed in the Technical Manual formulae. We understand this adjustment will not be applicable to future years’ water saving calculations which will be for the full irrigation season.
G-MW has four key computer/software systems used to collect, store and report data used in water savings calculations. One of these is the Irrigation Planning Module (IPM).
October 2009 Cardno (Qld) Pty Ltd M:\7637-62\Word\Final Report\Audit Report_Final -NVIRP.docx
10
Northern Victoria Irrigation Renewal Project (NVIRP) Stage 1 Audit of Water Savings
IPM is the business system G-MW uses to receive irrigation supply orders from customers using interactive voice response (IVR) software (known as WaterLINE), and to plan these orders into delivery schedules for customers. Planners provide channel flow regulation schedules from IPM for use by field staff. The IPM system also provides management reporting facilities on a range of operational aspects and manages the recording of actual delivery volumes for billing purposes.
The system has the following functions:
66 Receives orders from customers lodged through telephone or internet ; 66 Plans water deliveries to each system taking into account customers orders and hydraulics of the water
system; 66 Records measured deliveries to customers and passes to customer billing software; 66 Records measurements through the deeming procedure outlined in G-MW’s By Law 11; and 66 Maintains an account of water supplied against entitlement and rejects orders where supply is in excess
of entitlement.
The system is a live system and is continually updated.
We sought to verify the season start and finish dates supplied to NVIRP by having G-MW verify dates of the first and last orders in the 2008-09 irrigation season for each irrigation area from the IPM data base.
The findings of our audit are detailed in Tables 4-1 and 4-2 below.
October 2009 Cardno (Qld) Pty Ltd M:\7637-62\Word\Final Report\Audit Report_Final -NVIRP.docx
11
Northern Victoria Irrigation Renewal Project (NVIRP) Stage 1 Audit of Water Savings
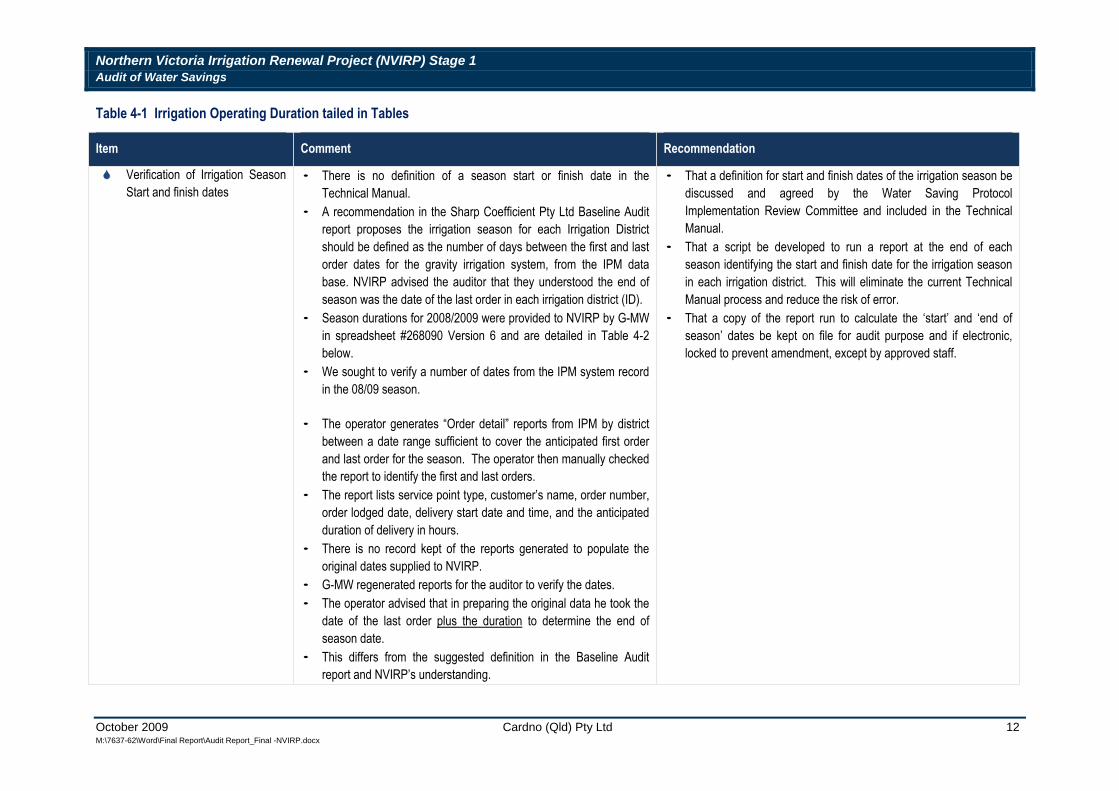
Table 4-1 Irrigation Operating Duration tailed in Tables
Item Comment Recommendation
66 Verification of Irrigation Season Start and finish dates
· There is no definition of a season start or finish date in the Technical Manual.
·
·
A recommendation in the Sharp Coefficient Pty Ltd Baseline Audit report proposes the irrigation season for each Irrigation District should be defined as the number of days between the first and last order dates for the gravity irrigation system, from the IPM data base. NVIRP advised the auditor that they understood the end of season was the date of the last order in each irrigation district (ID). Season durations for 2008/2009 were provided to NVIRP by G-MW in spreadsheet #268090 Version 6 and are detailed in Table 4-2 below.
· We sought to verify a number of dates from the IPM system record in the 08/09 season.
·
·
·
·
·
The operator generates “Order detail” reports from IPM by district between a date range sufficient to cover the anticipated first order and last order for the season. The operator then manually checked the report to identify the first and last orders. The report lists service point type, customer’s name, order number, order lodged date, delivery start date and time, and the anticipated duration of delivery in hours. There is no record kept of the reports generated to populate the original dates supplied to NVIRP. G-MW regenerated reports for the auditor to verify the dates. The operator advised that in preparing the original data he took the date of the last order plus the duration to determine the end of season date.
· This differs from the suggested definition in the Baseline Audit report and NVIRP’s understanding.
· That a definition for start and finish dates of the irrigation season be discussed and agreed by the Water Saving Protocol Implementation Review Committee and included in the Technical Manual.
· That a script be developed to run a report at the end of each season identifying the start and finish date for the irrigation season in each irrigation district. This will eliminate the current Technical Manual process and reduce the risk of error.
· That a copy of the report run to calculate the ‘start’ and ‘end of season’ dates be kept on file for audit purpose and if electronic, locked to prevent amendment, except by approved staff.
October 2009 Cardno (Qld) Pty Ltd M:\7637-62\Word\Final Report\Audit Report_Final -NVIRP.docx
12
Northern Victoria Irrigation Renewal Project (NVIRP) Stage 1 Audit of Water Savings
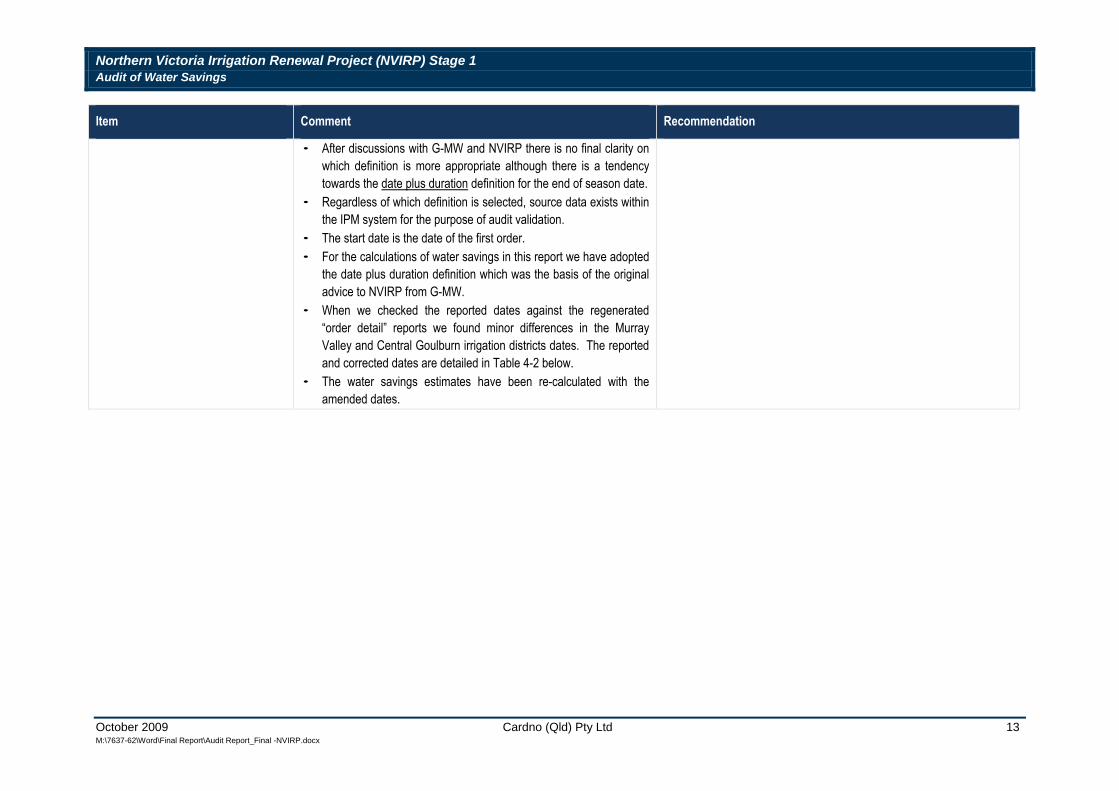
Comment Recommendation Item
· After discussions with G-MW and NVIRP there is no final clarity on which definition is more appropriate although there is a tendency towards the date plus duration definition for the end of season date.
· Regardless of which definition is selected, source data exists within the IPM system for the purpose of audit validation.
· The start date is the date of the first order. · For the calculations of water savings in this report we have adopted
the date plus duration definition which was the basis of the original advice to NVIRP from G-MW.
· When we checked the reported dates against the regenerated “order detail” reports we found minor differences in the Murray Valley and Central Goulburn irrigation districts dates. The reported and corrected dates are detailed in Table 4-2 below.
· The water savings estimates have been re-calculated with the amended dates.
October 2009 Cardno (Qld) Pty Ltd M:\7637-62\Word\Final Report\Audit Report_Final -NVIRP.docx
13
Northern Victoria Irrigation Renewal Project (NVIRP) Stage 1 Audit of Water Savings
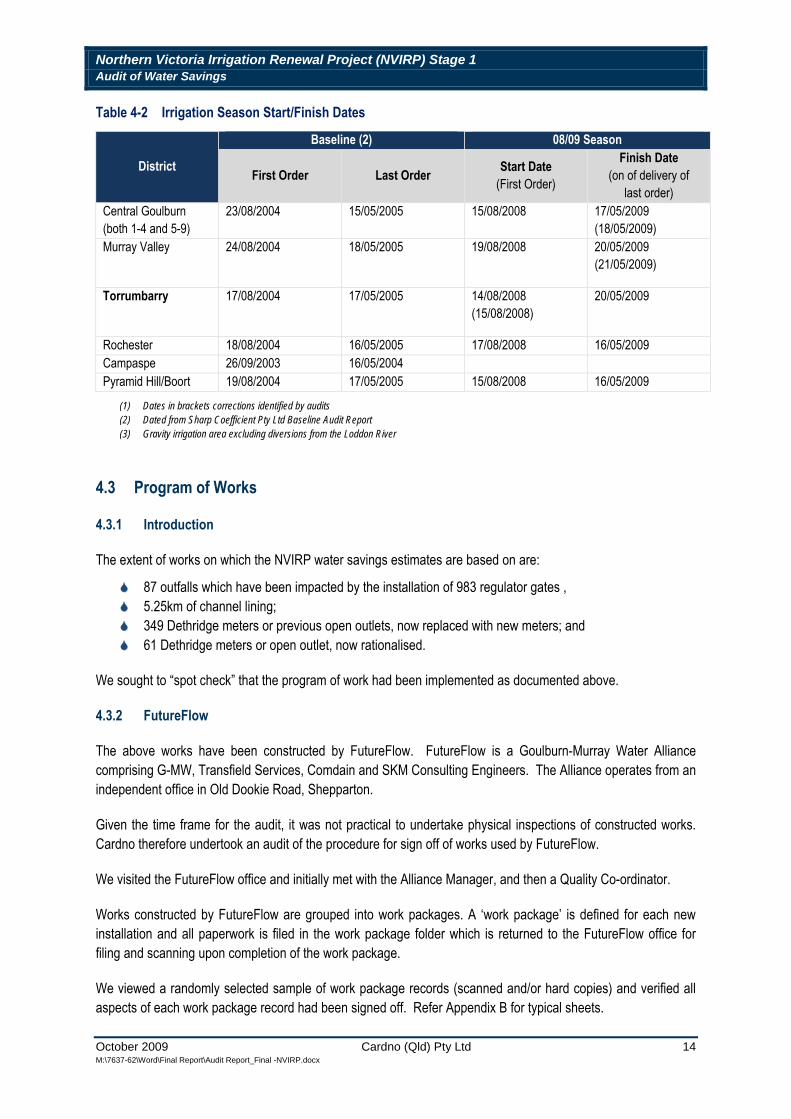
Table 4-2 Irrigation Season Start/Finish Dates
Baseline (2) 08/09 Season
District
Central Goulburn 23/08/2004 15/05/2005 15/08/2008 17/05/2009 (both 1-4 and 5-9) (18/05/2009) Murray Valley 24/08/2004 18/05/2005 19/08/2008 20/05/2009
(21/05/2009)
Torrumbarry 17/08/2004 17/05/2005 14/08/2008 20/05/2009 (15/08/2008)
Rochester 18/08/2004 16/05/2005 17/08/2008 16/05/2009 Campaspe 26/09/2003 16/05/2004 Pyramid Hill/Boort 19/08/2004 17/05/2005 15/08/2008 16/05/2009
First Order Last Order Start Date (First Order)
Finish Date (on of delivery of
last order)
(1) Dates in brackets corrections identified by audits (2) Dated from Sharp Coefficient Pty Ltd Baseline Audit Report (3) Gravity irrigation area excluding diversions from the Loddon River
4.3 Program of Works
4.3.1 Introduction
The extent of works on which the NVIRP water savings estimates are based on are:
66 87 outfalls which have been impacted by the installation of 983 regulator gates , 66 5.25km of channel lining; 66 349 Dethridge meters or previous open outlets, now replaced with new meters; and 66 61 Dethridge meters or open outlet, now rationalised.
We sought to “spot check” that the program of work had been implemented as documented above.
4.3.2 FutureFlow
The above works have been constructed by FutureFlow. FutureFlow is a Goulburn-Murray Water Alliance comprising G-MW, Transfield Services, Comdain and SKM Consulting Engineers. The Alliance operates from an independent office in Old Dookie Road, Shepparton.
Given the time frame for the audit, it was not practical to undertake physical inspections of constructed works. Cardno therefore undertook an audit of the procedure for sign off of works used by FutureFlow.
We visited the FutureFlow office and initially met with the Alliance Manager, and then a Quality Co-ordinator.
Works constructed by FutureFlow are grouped into work packages. A ‘work package’ is defined for each new installation and all paperwork is filed in the work package folder which is returned to the FutureFlow office for filing and scanning upon completion of the work package.
We viewed a randomly selected sample of work package records (scanned and/or hard copies) and verified all aspects of each work package record had been signed off. Refer Appendix B for typical sheets.
October 2009 Cardno (Qld) Pty Ltd M:\7637-62\Word\Final Report\Audit Report_Final -NVIRP.docx
14
Northern Victoria Irrigation Renewal Project (NVIRP) Stage 1 Audit of Water Savings
4.3.3 G-MW
We asked G-MW what practices they had to verify that the works had been constructed. They advised that these were not documented checking processes as they are members of the FutureFlow Alliance and have staff working within the Alliance.
In addition, as part of the normal operations, Water Services Officers are inspecting channels daily and report any unsatisfactory/defective works including issues with the modernisation works.
Thirdly, the new gates and new meters are all automated or monitored by SCADA from G-MW area offices. Any signal failures or excessive volumes are investigated by Water Services Officers.
4.3.4 Channel Length Error
While we are satisfied that channel lining works took place there is however, uncertainty over the actual length. When checking the calculation for the water saving estimates due to channel lining we noted that the total length of channel lined was listed in the calculation as 5.546km, slightly greater than the 5.25km in the DSE brief to Cardno. The discrepancy (an increase of 296 m) is minor and the measured length of 5.546km has been used in the water savings calculation
4.3.5 Conclusion
Based upon our audit of FutureFlow construction records, and G-MW operational practices, Cardno is satisfied, based upon the spot checks undertaken, that the program of works in 4.3.1 above has been implemented, albeit that the exact length of channel lining is slightly incorrect.
Recommendation
That G-MW prepare and implement asset acceptance procedures including verification process.
4.4 Channel Automation
Channel Automation is where Flumegate regulators are installed with SCADA control for monitoring and operation.
Channel Automation reduces losses via outfalls and upper bank leakage.
The formula for calculating water saving due to Channel Automation is:
WSYearX = WSoutfalls + WSbank leakage
We reviewed the water savings estimate calculations for Channel Automation provided by NVIRP and source data. The findings of our audit are detailed in Tables 4-3, 4-4, 4-5, & 4-6 below.
October 2009 Cardno (Qld) Pty Ltd M:\7637-62\Word\Final Report\Audit Report_Final -NVIRP.docx
15
Northern Victoria Irrigation Renewal Project (NVIRP) Stage 1 Audit of Water Savings
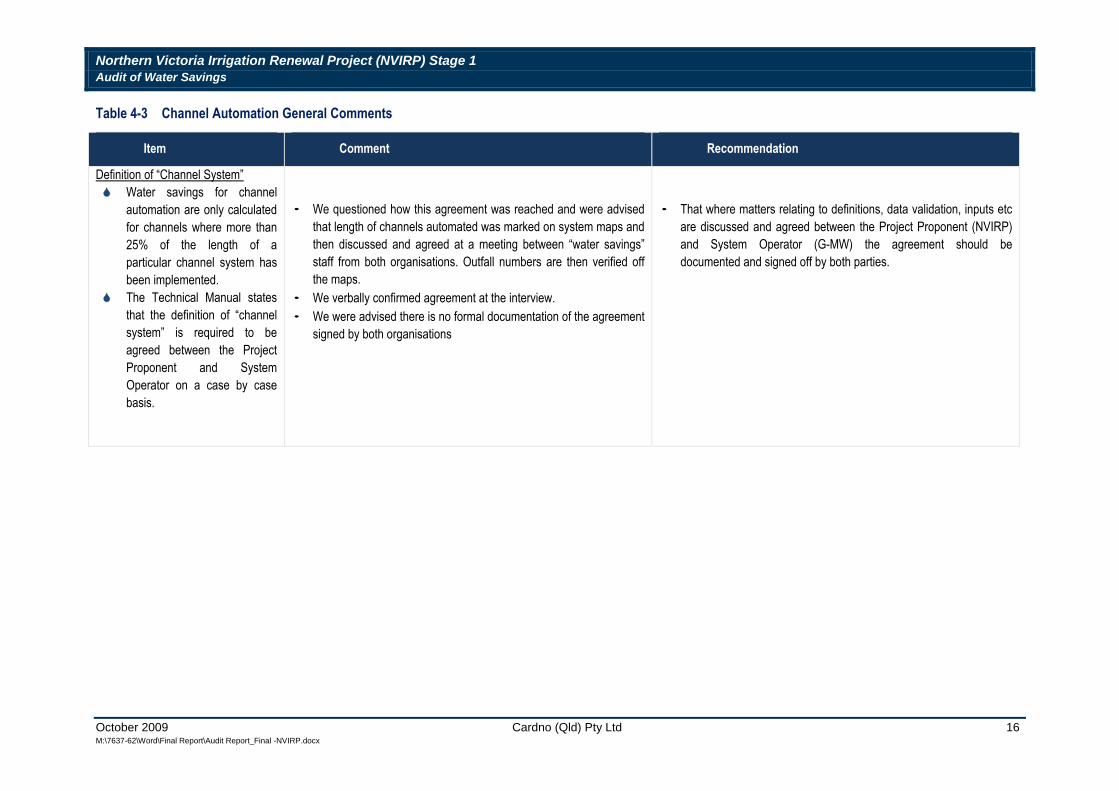
Table 4-3 Channel Automation General Comments
Item Comment Recommendation
Definition of “Channel System” 66 Water savings for channel
automation are only calculated for channels where more than 25% of the length of a particular channel system has been implemented.
66 The Technical Manual states that the definition of “channel system” is required to be agreed between the Project Proponent and System Operator on a case by case basis.
· We questioned how this agreement was reached and were advised that length of channels automated was marked on system maps and then discussed and agreed at a meeting between “water savings” staff from both organisations. Outfall numbers are then verified off the maps.
· That where matters relating to definitions, data validatioare discussed and agreed between the Project Proponand System Operator (G-MW) the agreement documented and signed off by both parties.
n, inputs ent (NVIshould
etc RP)
be
· We verbally confirmed agreement at the interview. · We were advised there is no formal documentation of the agreement
signed by both organisations
October 2009 Cardno (Qld) Pty Ltd M:\7637-62\Word\Final Report\Audit Report_Final -NVIRP.docx
16
Northern Victoria Irrigation Renewal Project (NVIRP) Stage 1 Audit of Water Savings
4.4.1 Water Saving – Outfalls
4.4.1.1 Introduction
As stated earlier, the major water saving Phase 3 and Phase 4 for 2008-2009 in the NVIRP area are achieved via channel automation, outfalls (Phase 3 >80% and Phase 4 > 90%).
Outfall water losses are defined in the Technical Manual as:
Outfalls are the unscheduled flows through the channel outfall (flow escape) structures. They are a variable loss as they are influenced by rainfall, water deliveries and the length of the season. Outfalls may occur due to the following reasons:
66 Rainfall rejections events (or sometimes called shutdowns); and/or 66 Operational activities such as maintaining a water level to deliver a service standard; and/or reducing
water levels for maintenance works in the channel infrastructure.
The formula for calculating water saving outfalls are defined as:
Phase 3
WSoutfalls* = ∑[(Obasex OPx X (DYearX/DBase)) – OYearX]
Phase 4
WSoutfalls* = ∑[(Obasex LTCEBase x)-(OYearX LTCEyearx X( 1/OPx))] x DF
*Applied on an outfall by outfall basis this equation must be =>0 (eg. Mitigation Water can never be greater than outfall volumes in any one year).
4.4.1.2 Input Data
We reviewed G-MW’s documented Procedure for Collection of Outfall Data doc No. 2705583 version 1 as well as document procedure No. 2706495, Procedure for Determining Outfall Savings for 2008/2009.
We verified a sample of delivery volumes from Area Annual Report spreadsheet for 2008/2009.
We also reviewed the examples of area spreadsheets prepared by Area Supervisors for the un-metered outfalls and viewed SCADA system output for new continuously recorded outfalls.
We reviewed the water savings estimate calculations for Channel Automation Outfalls provided by NVIRP. The findings of our audit are detailed in Tables 4-4 and 4-5 below.
.
October 2009 Cardno (Qld) Pty Ltd M:\7637-62\Word\Final Report\Audit Report_Final -NVIRP.docx
17
Northern Victoria Irrigation Renewal Project (NVIRP) Stage 1 Audit of Water Savings
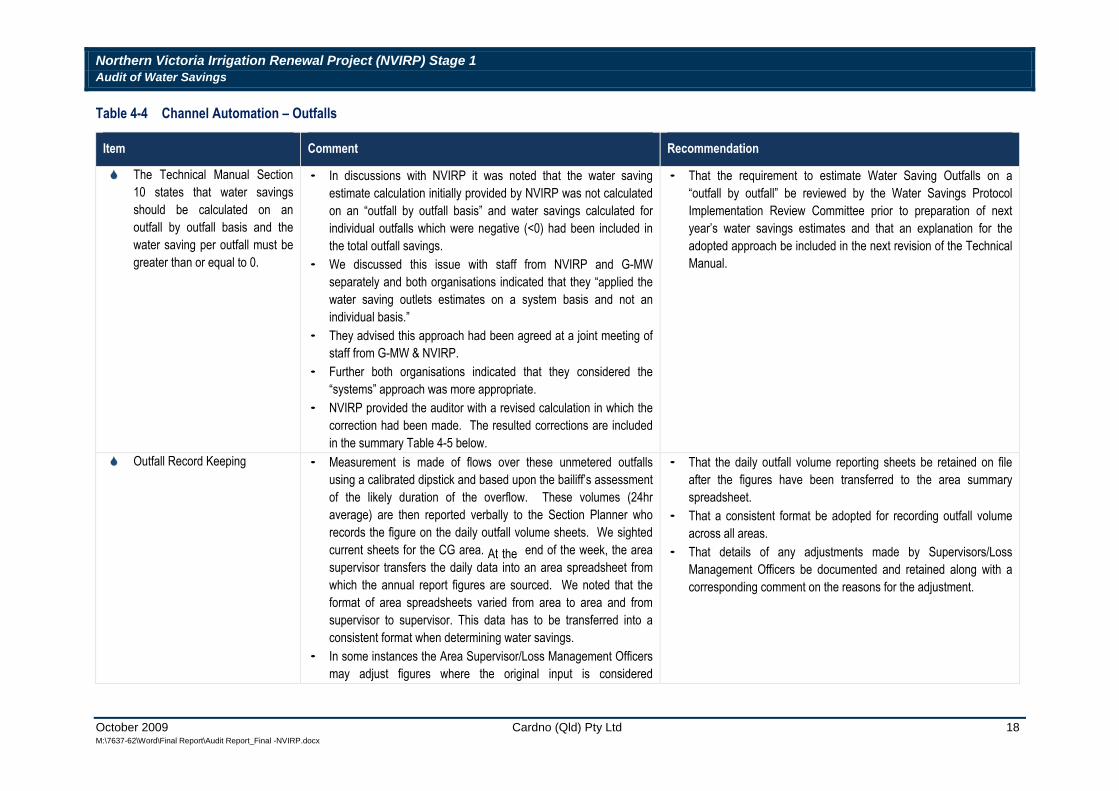
Table 4-4 Channel Automation – Outfalls
Item Comment Recommendation
66 The Technical Manual Section 10 states that water savings should be calculated on an outfall by outfall basis and the water saving per outfall must be greater than or equal to 0.
66 Outfall Record Keeping
· In discussions with NVIRP it was noted that the water saving estimate calculation initially provided by NVIRP was not calculated on an “outfall by outfall basis” and water savings calculated for individual outfalls which were negative (<0) had been included in the total outfall savings.
· We discussed this issue with staff from NVIRP and G-MW separately and both organisations indicated that they “applied the water saving outlets estimates on a system basis and not an individual basis.”
· They advised this approach had been agreed at a joint meeting of staff from G-MW & NVIRP.
· Further both organisations indicated that they considered the “systems” approach was more appropriate.
· NVIRP provided the auditor with a revised calculation in which the correction had been made. The resulted corrections are included in the summary Table 4-5 below.
· Measurement is made of flows over these unmetered outfalls using a calibrated dipstick and based upon the bailiff’s assessment of the likely duration of the overflow. These volumes (24hr average) are then reported verbally to the Section Planner who records the figure on the daily outfall volume sheets. We sighted current sheets for the CG area. At the end of the week, the area supervisor transfers the daily data into an area spreadsheet from which the annual report figures are sourced. We noted that the format of area spreadsheets varied from area to area and from supervisor to supervisor. This data has to be transferred into a consistent format when determining water savings.
· In some instances the Area Supervisor/Loss Management Officers may adjust figures where the original input is considered
· That the requirement to estimate Water Saving Outfalls on a “outfall by outfall” be reviewed by the Water Savings Protocol Implementation Review Committee prior to preparation of next year’s water savings estimates and that an explanation for the adopted approach be included in the next revision of the Technical Manual.
· That the daily outfall volume reporting sheets be retained on file after the figures have been transferred to the area summary spreadsheet.
· That a consistent format be adopted for recording outfall volume across all areas.
· That details of any adjustments made by Supervisors/Loss Management Officers be documented and retained along with a corresponding comment on the reasons for the adjustment.
October 2009 Cardno (Qld) Pty Ltd M:\7637-62\Word\Final Report\Audit Report_Final -NVIRP.docx
18
Northern Victoria Irrigation Renewal Project (NVIRP) Stage 1 Audit of Water Savings
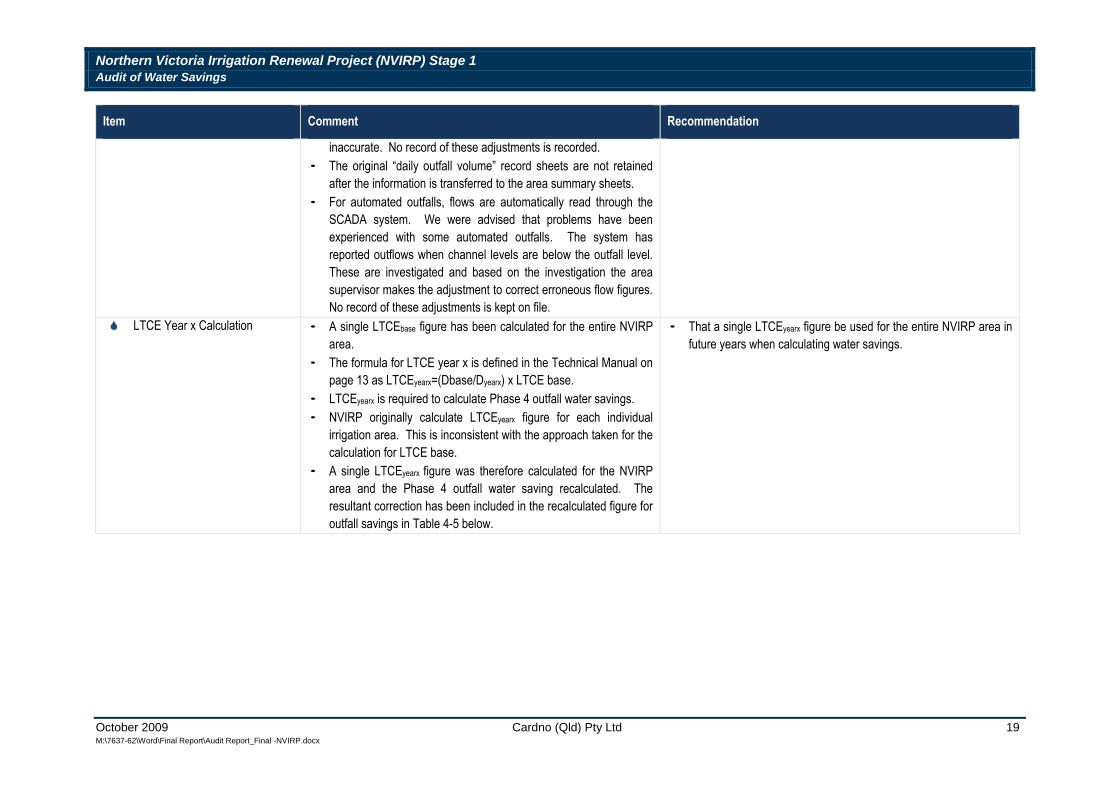
Item Comment Recommendation
inaccurate. No record of these adjustments is recorded. · The original “daily outfall volume” record sheets are not retained
after the information is transferred to the area summary sheets. · For automated outfalls, flows are automatically read through the
SCADA system. We were advised that problems have been experienced with some automated outfalls. The system has reported outflows when channel levels are below the outfall level. These are investigated and based on the investigation the area supervisor makes the adjustment to correct erroneous flow figures. No record of these adjustments is kept on file.
66 LTCE Year x Calculation · A single LTCEbase figure has been calculated for the entire NVIRP · That a single LTCEyearx figure be used for the entire NVIRP area in area. future years when calculating water savings.
· The formula for LTCE year x is defined in the Technical Manual on page 13 as LTCEyearx=(Dbase/Dyearx) x LTCE base.
· LTCEyearx is required to calculate Phase 4 outfall water savings. · NVIRP originally calculate LTCEyearx figure for each individual
irrigation area. This is inconsistent with the approach taken for the calculation for LTCE base.
· A single LTCEyearx figure was therefore calculated for the NVIRP area and the Phase 4 outfall water saving recalculated. The resultant correction has been included in the recalculated figure for outfall savings in Table 4-5 below.
October 2009 Cardno (Qld) Pty Ltd M:\7637-62\Word\Final Report\Audit Report_Final -NVIRP.docx
19
Northern Victoria Irrigation Renewal Project (NVIRP) Stage 1 Audit of Water Savings
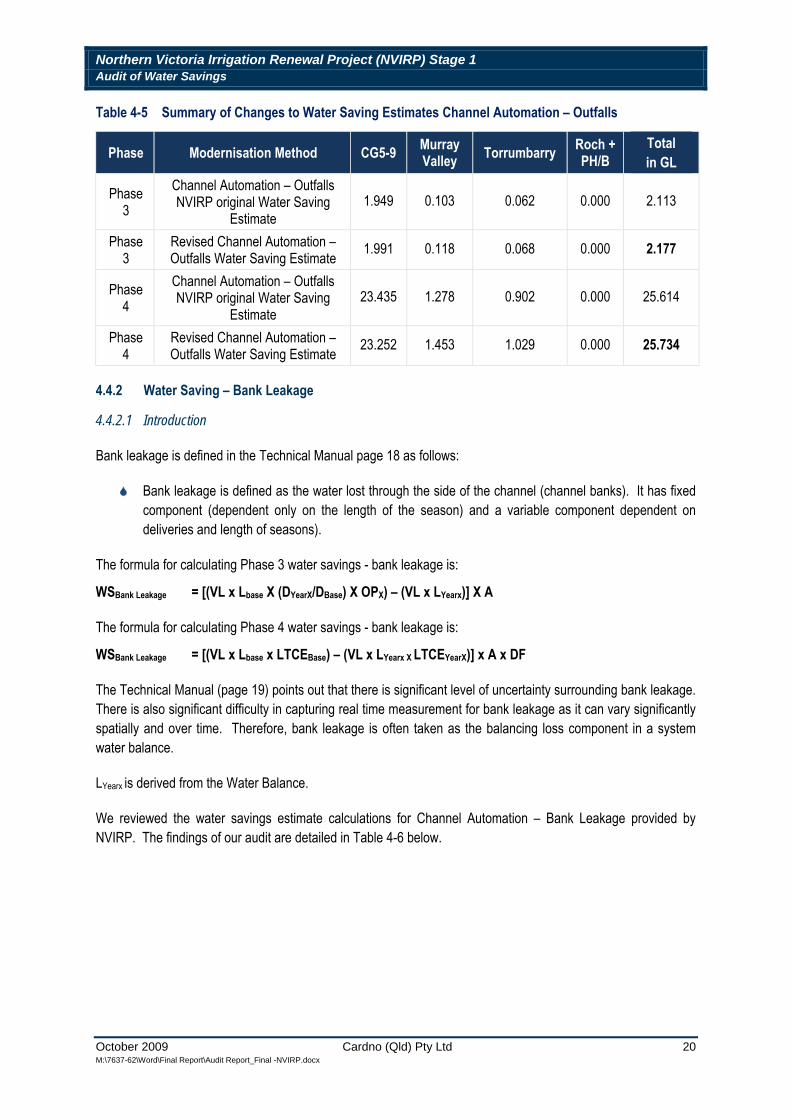
Table 4-5
Phase
Phase 3
Phase 3
Phase 4
Phase 4
Summary of Changes to Water Saving Estimates Channel Automation – Outfalls
Modernisation Method
Channel Automation – Outfalls NVIRP original Water Saving
Estimate
Revised Channel Automation – Outfalls Water Saving Estimate
Channel Automation – Outfalls NVIRP original Water Saving
Estimate
Revised Channel Automation – Outfalls Water Saving Estimate
CG5-9
1.949 0.103 0.062 0.000 2.113
1.991 0.118 0.068 0.000 2.177
23.435 1.278 0.902 0.000 25.614
23.252 1.453 1.029 0.000 25.734
MurrayValley Torrumbarry Roch +
PH/B Total in GL
4.4.2 Water Saving – Bank Leakage
4.4.2.1 Introduction
Bank leakage is defined in the Technical Manual page 18 as follows:
66 Bank leakage is defined as the water lost through the side of the channel (channel banks). It has fixed component (dependent only on the length of the season) and a variable component dependent on deliveries and length of seasons).
The formula for calculating Phase 3 water savings - bank leakage is:
WSBank Leakage = [(VL x Lbase X (DYearX/DBase) X OPX) – (VL x LYearx)] X A
The formula for calculating Phase 4 water savings - bank leakage is:
WSBank Leakage = [(VL x Lbase x LTCEBase) – (VL x LYearx X LTCEYearX)] x A x DF
The Technical Manual (page 19) points out that there is significant level of uncertainty surrounding bank leakage. There is also significant difficulty in capturing real time measurement for bank leakage as it can vary significantly spatially and over time. Therefore, bank leakage is often taken as the balancing loss component in a system water balance.
LYearx is derived from the Water Balance.
We reviewed the water savings estimate calculations for Channel Automation – Bank Leakage provided by NVIRP. The findings of our audit are detailed in Table 4-6 below.
October 2009 Cardno (Qld) Pty Ltd M:\7637-62\Word\Final Report\Audit Report_Final -NVIRP.docx
20
Northern Victoria Irrigation Renewal Project (NVIRP) Stage 1 Audit of Water Savings
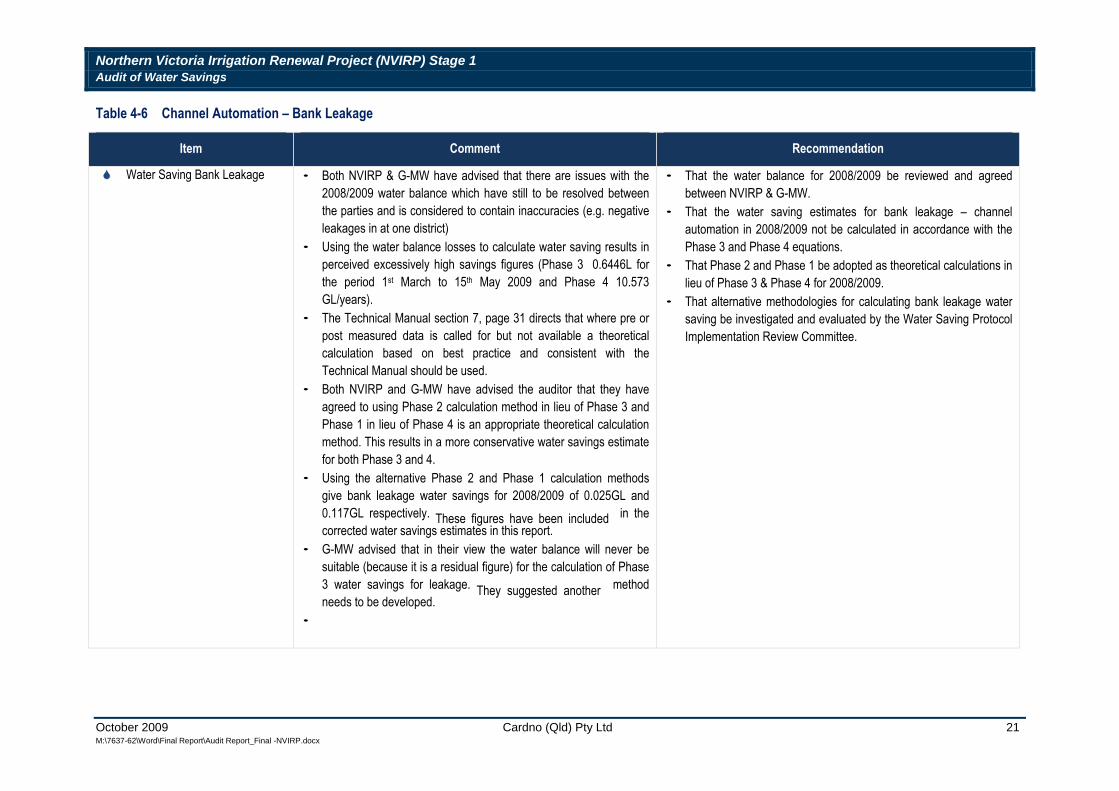
Table 4-6 Channel Automation – Bank Leakage
Item Comment Recommendation
66 Water Saving Bank Leakage · Both NVIRP & G-MW have advised that there are issues with the 2008/2009 water balance which have still to be resolved between the parties and is considered to contain inaccuracies (e.g. negative leakages in at one district)
· Using the water balance losses to calculate water saving results in perceived excessively high savings figures (Phase 3 0.6446L for the period 1st March to 15th May 2009 and Phase 4 10.573 GL/years).
· The Technical Manual section 7, page 31 directs that where pre or post measured data is called for but not available a theoretical calculation based on best practice and consistent with the Technical Manual should be used.
· Both NVIRP and G-MW have advised the auditor that they have agreed to using Phase 2 calculation method in lieu of Phase 3 and Phase 1 in lieu of Phase 4 is an appropriate theoretical calculation method. This results in a more conservative water savings estimate for both Phase 3 and 4.
· Using the alternative Phase 2 and Phase 1 calculation methods give bank leakage water savings for 2008/2009 of 0.025GL and 0.117GL respectively. These figures have been included in the corrected water savings estimates in this report.
· G-MW advised that in their view the water balance will never be suitable (because it is a residual figure) for the calculation of Phase 3 water savings for leakage. They suggested another method needs to be developed.
·
· That the water balance for 2008/2009 be reviewed and agreed between NVIRP & G-MW.
· That the water saving estimates for bank leakage – channel automation in 2008/2009 not be calculated in accordance with the Phase 3 and Phase 4 equations.
· That Phase 2 and Phase 1 be adopted as theoretical calculations in lieu of Phase 3 & Phase 4 for 2008/2009.
· That alternative methodologies for calculating bank leakage water saving be investigated and evaluated by the Water Saving Protocol Implementation Review Committee.
October 2009 Cardno (Qld) Pty Ltd M:\7637-62\Word\Final Report\Audit Report_Final -NVIRP.docx
21
Northern Victoria Irrigation Renewal Project (NVIRP) Stage 1 Audit of Water Savings
4.4.2.2 Summary of Amended Water Saving Estimates Channel Automation – Bank Leakage
There was no change to the water saving estimates for Channel Automation- Bank Leakage as calculated by NVIRP.
4.5 Channel Remediation (Channel Lining)
4.5.1 Introduction
Channel remediation works can consist of piping, channel lining (with plastic (HDPE) sheets or clay) and bank remodelling works.
In the NVIRP area for the period under review a total of 5 to 6 km of channels has been lined using plastic (HDPE) sheet.
The Technical Manual outlines how the water savings assessment methodology to be adopted depends on whether pondage tests can and are undertaken pre and post works. If pondage tests are not undertaken on the remediation channels, then a theoretical baseline water savings estimate would be the most appropriate mechanism for estimating. If pondage tests are undertaken the losses recorded are only the fixed losses. An estimation of the variable losses proportion must be added to determine the total loss.
Thus, the losses pre/post intervention can be measured in two ways:
(1) Theoretical Analysis based on a range of known soil type properties and other data and assumed factors; or
(2) Using Direct Physical Measurements based on actual recorded data through pondage tests, or alternative approved physical sampling.
The preferred method is using direct recorded data. The results of these tests can be analysed further to inform the theoretical assumptions that are used for loss estimation within channel systems.
For channel relining water savings are achieved by reducing seepage and leakage.
Channel remediation techniques are used to target those areas where it is most cost-effective. These are high loss pools and pools that are above the average loss pool for the system.
Where the theoretical method is applied to estimate water savings, with limited understanding of the actual loss within the pool targeted, it is possible to adjust average losses to account for the fact that high loss pools are being targeted rather than average loss pools.
Both NVIRP and G-MW have estimated the water saving for the channel remediation works completed in the NVIRP area for the period under review.
We were advised that there was no pre works pondage test data available for the lined lengths of channel in the NVIRP area.
NVIRP has therefore used the theoretical approach to calculate the water savings estimates Phase 3 and Phase 4. Further, due to the unresolved issues with the water balance, they have used the Phase 1 theoretical methodology in calculating the Phase 4 estimate and Phase 2 theoretical methodology for the Phase 3 estimate.
October 2009 Cardno (Qld) Pty Ltd M:\7637-62\Word\Final Report\Audit Report_Final -NVIRP.docx
22

Northern Victoria Irrigation Renewal Project (NVIRP) Stage 1 Audit of Water Savings
G-MW offered a different approach in relation to the NVIRP area water saving estimates for Channel Lining works. Pre works Leakage and Seepage estimates have been calculated by G-MW by using soil type (theoretical method) based on test results from pre pondage testing on 13 pools in the CG 2 and 4 systems to calculate the HLP factor for the sections of channel lined in the absence of pre works pondage test data. The HLP factor is then multiplied by the system average leakage and seepage to estimate the pre works losses per pool. Post works leakage and seepage estimates have been calculated by using post works pondage test data (direct method) from 3 of the 7 pools lined to estimate the weighted average effectiveness of reducing leakage and seepages across all pools which is then used to calculate the estimated Phase 3 leakage and seepage savings.
The calculated weighted average effectiveness percentages for leakage and seepage calculated by G-MW were then used by the Audit team to recalculate the Phase 4 water savings estimate for Channel Remediation.
We have audited both methodologies and our findings are detailed within Tables 4-7 and 4-8 below.
October 2009 Cardno (Qld) Pty Ltd M:\7637-62\Word\Final Report\Audit Report_Final -NVIRP.docx
23
Northern Victoria Irrigation Renewal Project (NVIRP) Stage 1 Audit of Water Savings
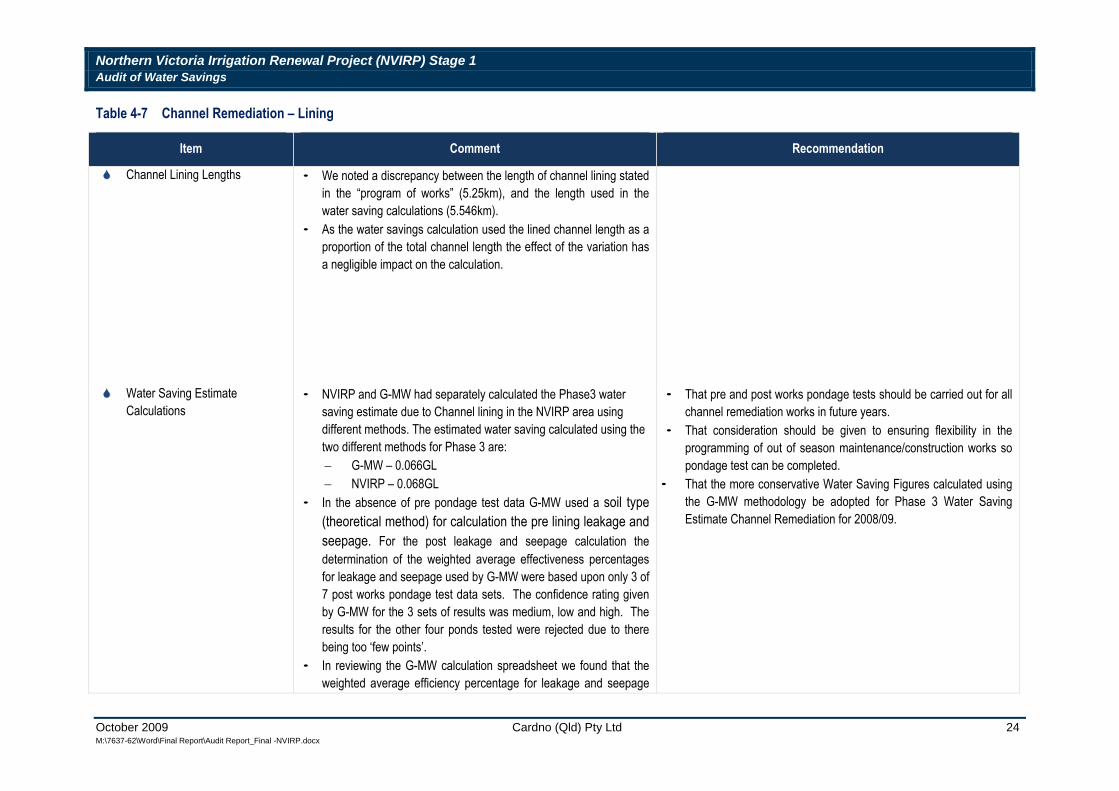
Table 4-7 Channel Remediation – Lining
Item Comment Recommendation
66 Channel Lining Lengths ·
·
We noted a discrepancy between the length of channel lining stated in the “program of works” (5.25km), and the length used in the water saving calculations (5.546km). As the water savings calculation used the lined channel length as a proportion of the total channel length the effect of the variation has a negligible impact on the calculation.
66 Water Saving Estimate Calculations
· NVIRP and G-MW had separately calculated the Phase3 water saving estimate due to Channel lining in the NVIRP area using different methods. The estimated water saving calculated using the two different methods for Phase 3 are: − G-MW – 0.066GL − NVIRP – 0.068GL
·
·
In the absence of pre pondage test data G-MW used a soil type (theoretical method) for calculation the pre lining leakage and seepage. For the post leakage and seepage calculation the determination of the weighted average effectiveness percentages for leakage and seepage used by G-MW were based upon only 3 of 7 post works pondage test data sets. The confidence rating given by G-MW for the 3 sets of results was medium, low and high. The results for the other four ponds tested were rejected due to there being too ‘few points’. In reviewing the G-MW calculation spreadsheet we found that the weighted average efficiency percentage for leakage and seepage
· That pre and post works pondage tests should be carried out for all channel remediation works in future years.
· That consideration should be given to ensuring flexibility in the programming of out of season maintenance/construction works so pondage test can be completed.
· That the more conservative Water Saving Figures calculated using the G-MW methodology be adopted for Phase 3 Water Saving Estimate Channel Remediation for 2008/09.
October 2009 Cardno (Qld) Pty Ltd M:\7637-62\Word\Final Report\Audit Report_Final -NVIRP.docx
24
Northern Victoria Irrigation Renewal Project (NVIRP) Stage 1 Audit of Water Savings
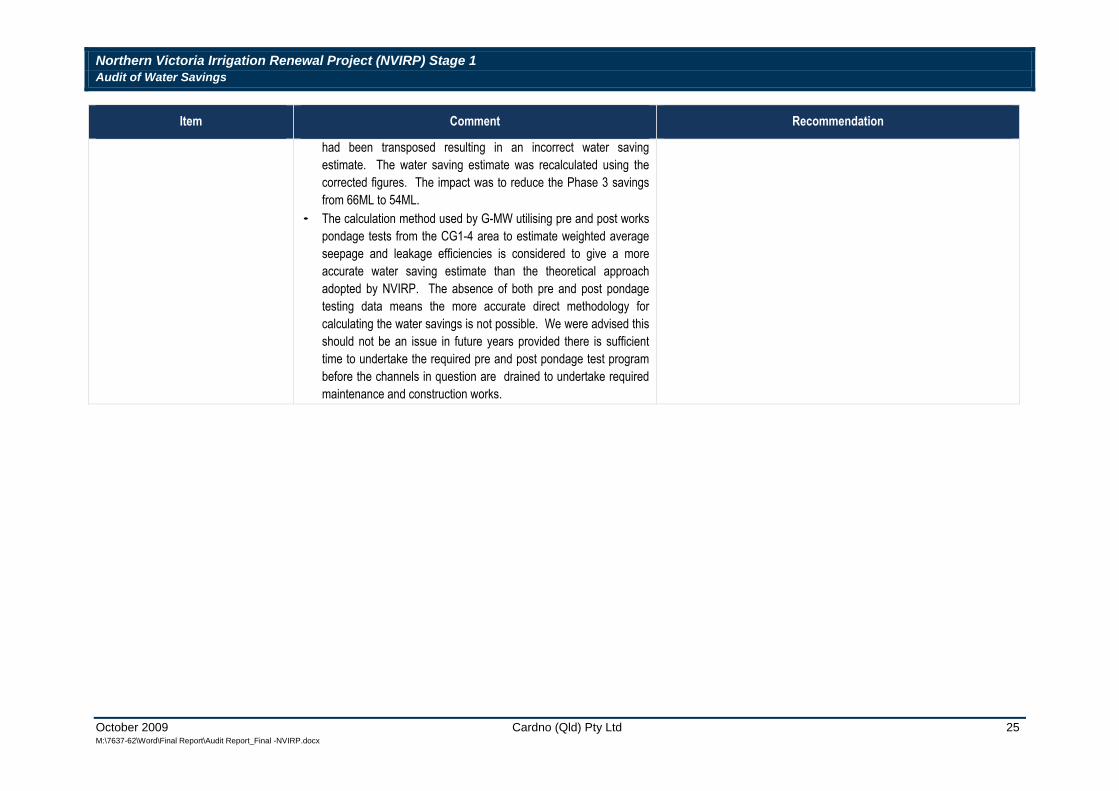
Comment Recommendation Item
had been transposed resulting in an incorrect water saving estimate. The water saving estimate was recalculated using the corrected figures. The impact was to reduce the Phase 3 savings from 66ML to 54ML.
· The calculation method used by G-MW utilising pre and post works pondage tests from the CG1-4 area to estimate weighted average seepage and leakage efficiencies is considered to give a more accurate water saving estimate than the theoretical approach adopted by NVIRP. The absence of both pre and post pondage testing data means the more accurate direct methodology for calculating the water savings is not possible. We were advised this should not be an issue in future years provided there is sufficient time to undertake the required pre and post pondage test program before the channels in question are drained to undertake required maintenance and construction works.
October 2009 Cardno (Qld) Pty Ltd M:\7637-62\Word\Final Report\Audit Report_Final -NVIRP.docx
25
Northern Victoria Irrigation Renewal Project (NVIRP) Stage 1 Audit of Water Savings
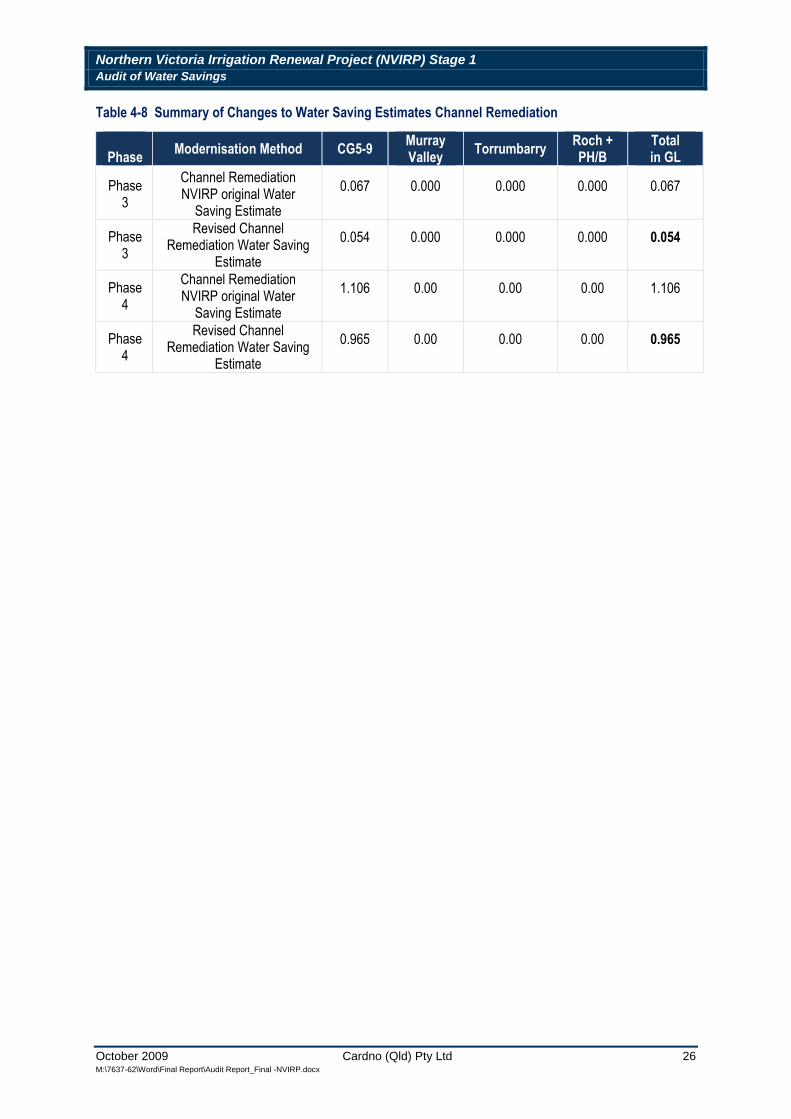
Table 4-8 Summary of Changes to Water Saving Estimates Channel Remediation
Phase Modernisation Method CG5-9 Murray Valley Torrumbarry Roch +
PH/B Total in GL
Phase 3
Channel Remediation NVIRP original Water
Saving Estimate 0.067 0.000 0.000 0.000 0.067
Phase 3
Revised Channel Remediation Water Saving
Estimate 0.054 0.000 0.000 0.000 0.054
Phase 4
Channel Remediation NVIRP original Water
Saving Estimate 1.106 0.00 0.00 0.00 1.106
Phase 4
Revised Channel Remediation Water Saving
Estimate 0.965 0.00 0.00 0.00 0.965
October 2009 Cardno (Qld) Pty Ltd M:\7637-62\Word\Final Report\Audit Report_Final -NVIRP.docx
26
Northern Victoria Irrigation Renewal Project (NVIRP) Stage 1 Audit of Water Savings
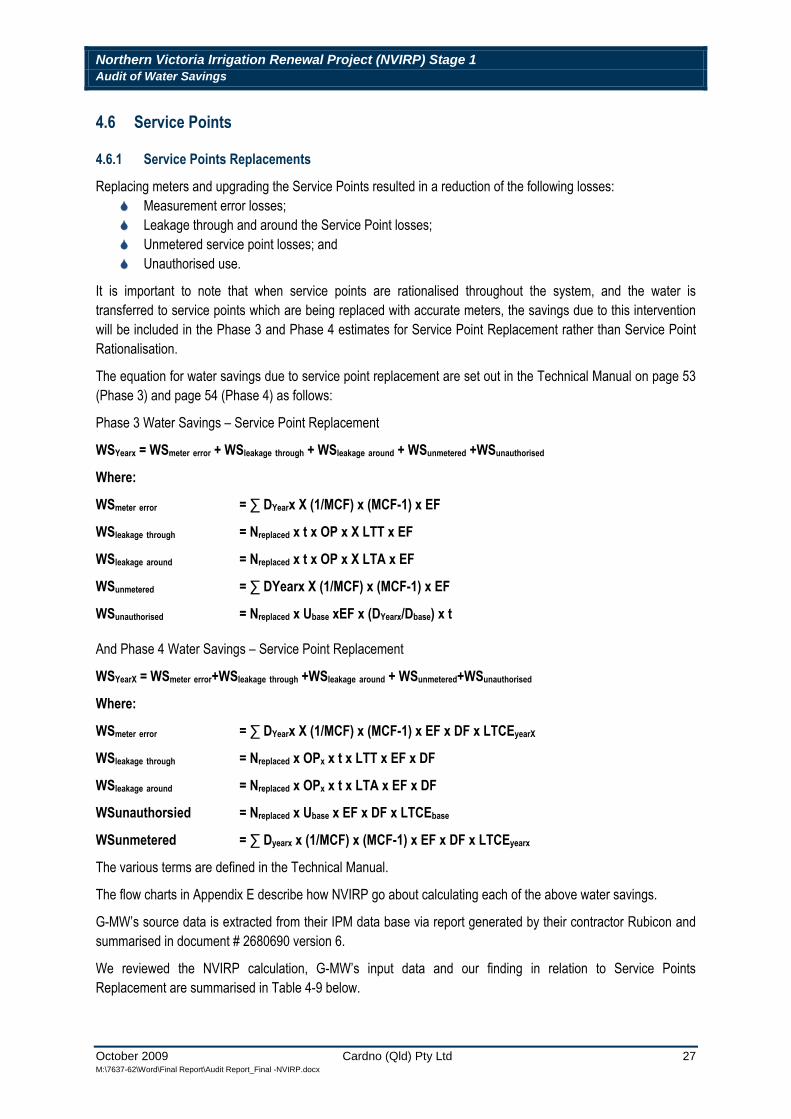
4.6 Service Points
4.6.1 Service Points Replacements
Replacing meters and upgrading the Service Points resulted in a reduction of the following losses: 66 Measurement error losses; 66 Leakage through and around the Service Point losses; 66 Unmetered service point losses; and 66 Unauthorised use.
It is important to note that when service points are rationalised throughout the system, and the water is transferred to service points which are being replaced with accurate meters, the savings due to this intervention will be included in the Phase 3 and Phase 4 estimates for Service Point Replacement rather than Service Point Rationalisation.
The equation for water savings due to service point replacement are set out in the Technical Manual on page 53 (Phase 3) and page 54 (Phase 4) as follows:
Phase 3 Water Savings – Service Point Replacement
WSYearx = WSmeter error + WSleakage through + WSleakage around + WSunmetered +WSunauthorised
Where:
WSmeter error = ∑ DYearx X (1/MCF) x (MCF-1) x EF
WSleakage through = Nreplaced x t x OP x X LTT x EF
WSleakage around = Nreplaced x t x OP x X LTA x EF
WSunmetered = ∑ DYearx X (1/MCF) x (MCF-1) x EF
WSunauthorised = Nreplaced x Ubase xEF x (DYearx/Dbase) x t
And Phase 4 Water Savings – Service Point Replacement
WSYearX = WSmeter error+WSleakage through +WSleakage around + WSunmetered+WSunauthorised
Where:
WSmeter error = ∑ DYearx X (1/MCF) x (MCF-1) x EF x DF x LTCEyearX
WSleakage through = Nreplaced x OPx x t x LTT x EF x DF
WSleakage around = Nreplaced x OPx x t x LTA x EF x DF
WSunauthorsied = Nreplaced x Ubase x EF x DF x LTCEbase
WSunmetered = ∑ Dyearx x (1/MCF) x (MCF-1) x EF x DF x LTCEyearx
The various terms are defined in the Technical Manual.
The flow charts in Appendix E describe how NVIRP go about calculating each of the above water savings.
G-MW’s source data is extracted from their IPM data base via report generated by their contractor Rubicon and summarised in document # 2680690 version 6.
We reviewed the NVIRP calculation, G-MW’s input data and our finding in relation to Service Points Replacement are summarised in Table 4-9 below.
October 2009 Cardno (Qld) Pty Ltd M:\7637-62\Word\Final Report\Audit Report_Final -NVIRP.docx
27
Northern Victoria Irrigation Renewal Project (NVIRP) Stage 1 Audit of Water Savings
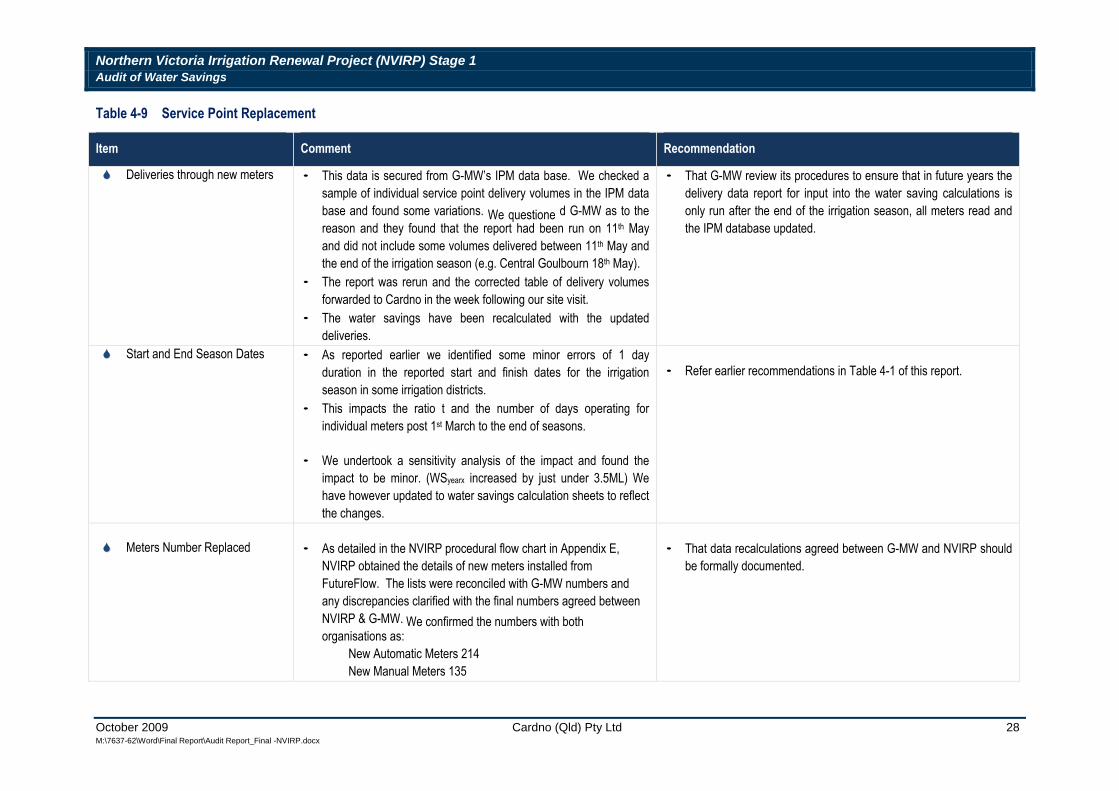
Table 4-9 Service Point Replacement
Item Comment Recommendation
66 Deliveries through new meters ·
·
This data is secured from G-MW’s IPM data base. We checked a sample of individual service point delivery volumes in the IPM data base and found some variations. We questione d G-MW as to the reason and they found that the report had been run on 11th May and did not include some volumes delivered between 11th May and the end of the irrigation season (e.g. Central Goulbourn 18th May). The report was rerun and the corrected table of delivery volumes forwarded to Cardno in the week following our site visit.
· The water savings have been recalculated with the updated deliveries.
66 Start and End Season Dates ·
·
As reported earlier we identified some minor errors of 1 day duration in the reported start and finish dates for the irrigation season in some irrigation districts. This impacts the ratio t and the number of days operating for individual meters post 1st March to the end of seasons.
· We undertook a sensitivity analysis of the impact and found the impact to be minor. (WSyearx increased by just under 3.5ML) We have however updated to water savings calculation sheets to reflect the changes.
66 Meters Number Replaced · As detailed in the NVIRP procedural flow chart in Appendix E, NVIRP obtained the details of new meters installed from FutureFlow. The lists were reconciled with G-MW numbers and any discrepancies clarified with the final numbers agreed between NVIRP & G-MW. We confirmed the numbers with both organisations as:
New Automatic Meters 214 New Manual Meters 135
· That G-MW review its procedures to ensure that in future years the delivery data report for input into the water saving calculations is only run after the end of the irrigation season, all meters read and the IPM database updated.
· Refer earlier recommendations in Table 4-1 of this report.
· That data recalculations agreed between G-MW and NVIRP should be formally documented.
October 2009 Cardno (Qld) Pty Ltd M:\7637-62\Word\Final Report\Audit Report_Final -NVIRP.docx
28
Northern Victoria Irrigation Renewal Project (NVIRP) Stage 1 Audit of Water Savings
Item Comment Recommendation
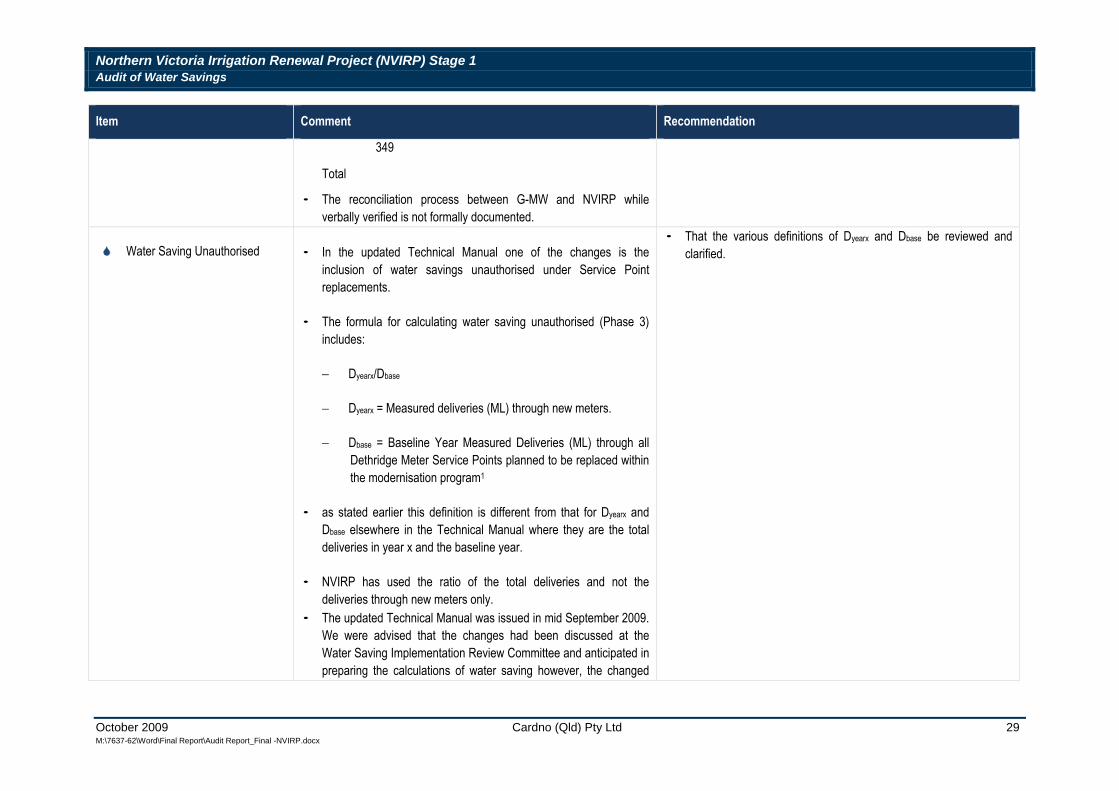
Total
349
66 Water Saving Unauthorised
·
·
The reconciliation process between G-MW and NVIRP while verbally verified is not formally documented.
In the updated Technical Manual one of the changes is the inclusion of water savings unauthorised under Service Point replacements.
· That the various definitions of Dyearx and Dbase be reviewed and clarified.
· The formula for calculating water saving unauthorised (Phase 3) includes:
− Dyearx/Dbase
− Dyearx = Measured deliveries (ML) through new meters.
− Dbase = Baseline Year Measured Deliveries (ML) through all Dethridge Meter Service Points planned to be replaced within the modernisation program1
· as stated earlier this definition is different from that for Dyearx and Dbase elsewhere in the Technical Manual where they are the total deliveries in year x and the baseline year.
·
·
NVIRP has used the ratio of the total deliveries and not the deliveries through new meters only. The updated Technical Manual was issued in mid September 2009. We were advised that the changes had been discussed at the Water Saving Implementation Review Committee and anticipated in preparing the calculations of water saving however, the changed
October 2009 M:\7637-62\Word\Final Report\Audit Report_Final -NVIRP.docx
Cardno (Qld) Pty Ltd 29
Northern Victoria Irrigation Renewal Project (NVIRP) Stage 1 Audit of Water Savings
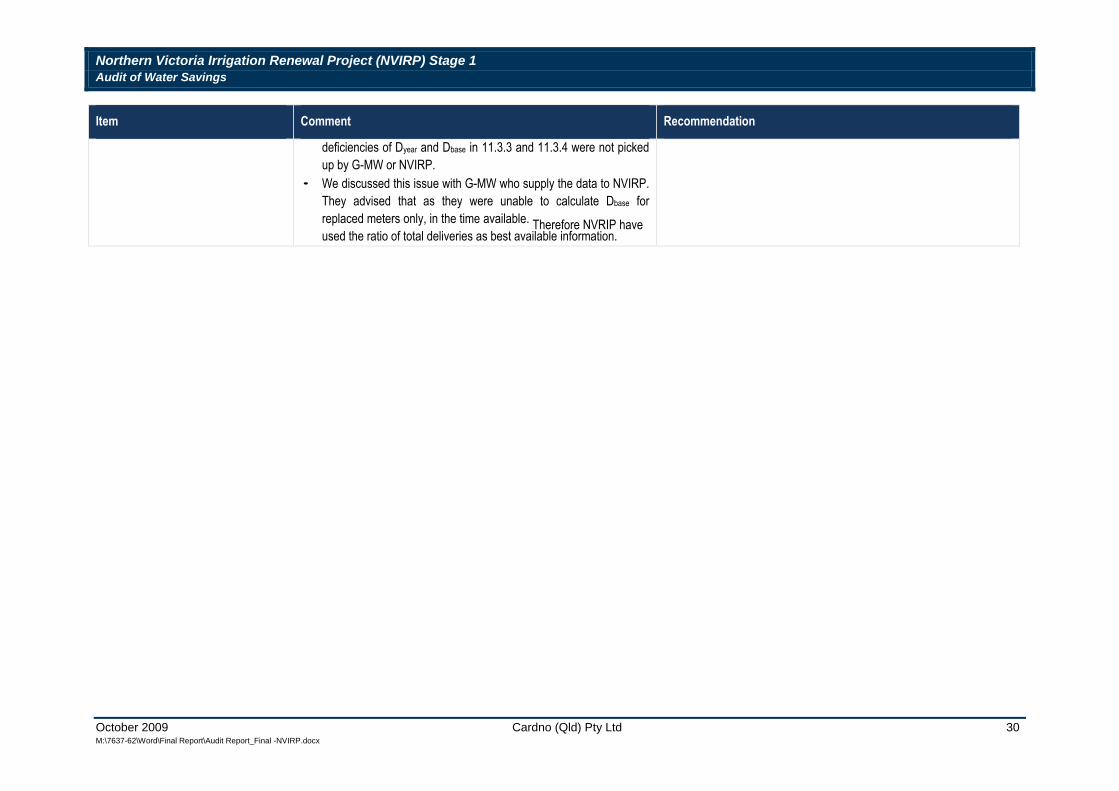
Comment Recommendation Item
deficiencies of Dyear and Dbase in 11.3.3 and 11.3.4 were not picked up by G-MW or NVIRP.
· We discussed this issue with G-MW who supply the data to NVIRP. They advised that as they were unable to calculate Dbase for replaced meters only, in the time available. Therefore NVRIP have used the ratio of total deliveries as best available information.
October 2009 Cardno (Qld) Pty Ltd M:\7637-62\Word\Final Report\Audit Report_Final -NVIRP.docx
30
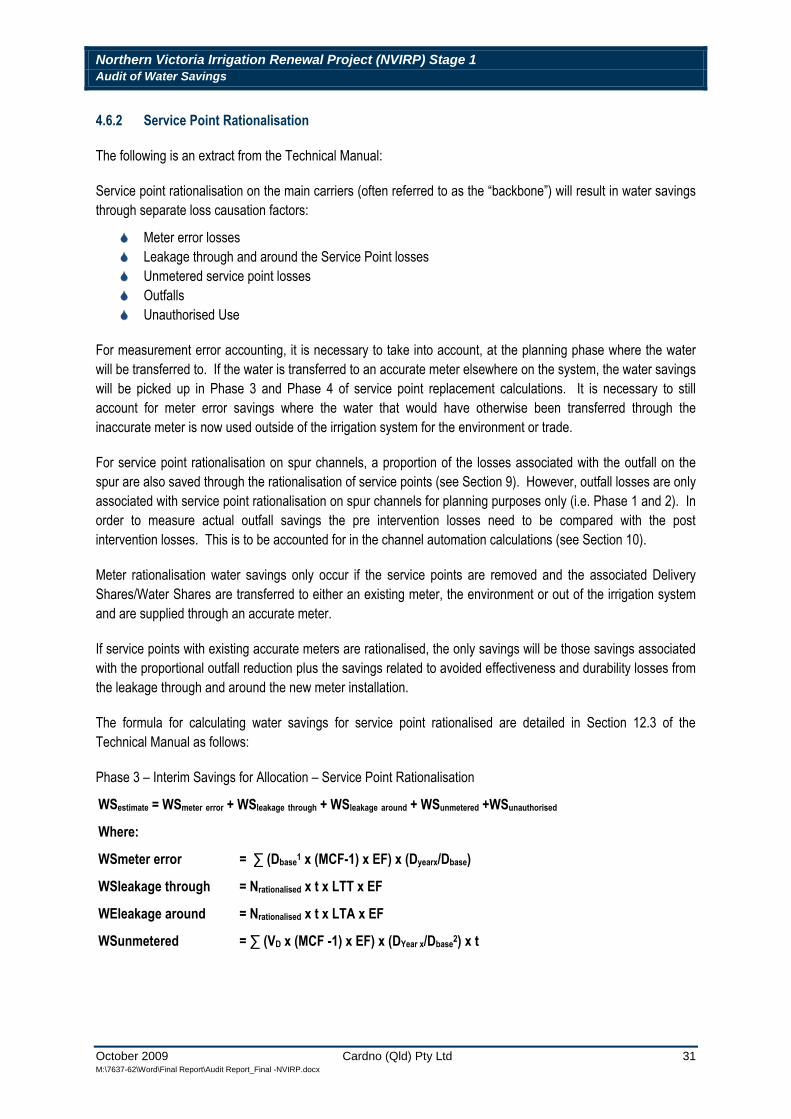
Northern Victoria Irrigation Renewal Project (NVIRP) Stage 1 Audit of Water Savings
4.6.2 Service Point Rationalisation
The following is an extract from the Technical Manual:
Service point rationalisation on the main carriers (often referred to as the “backbone”) will result in water savings through separate loss causation factors:
66 Meter error losses 66 Leakage through and around the Service Point losses 66 Unmetered service point losses 66 Outfalls 66 Unauthorised Use
For measurement error accounting, it is necessary to take into account, at the planning phase where the water will be transferred to. If the water is transferred to an accurate meter elsewhere on the system, the water savings will be picked up in Phase 3 and Phase 4 of service point replacement calculations. It is necessary to still account for meter error savings where the water that would have otherwise been transferred through the inaccurate meter is now used outside of the irrigation system for the environment or trade.
For service point rationalisation on spur channels, a proportion of the losses associated with the outfall on the spur are also saved through the rationalisation of service points (see Section 9). However, outfall losses are only associated with service point rationalisation on spur channels for planning purposes only (i.e. Phase 1 and 2). In order to measure actual outfall savings the pre intervention losses need to be compared with the post intervention losses. This is to be accounted for in the channel automation calculations (see Section 10).
Meter rationalisation water savings only occur if the service points are removed and the associated Delivery Shares/Water Shares are transferred to either an existing meter, the environment or out of the irrigation system and are supplied through an accurate meter.
If service points with existing accurate meters are rationalised, the only savings will be those savings associated with the proportional outfall reduction plus the savings related to avoided effectiveness and durability losses from the leakage through and around the new meter installation.
The formula for calculating water savings for service point rationalised are detailed in Section 12.3 of the Technical Manual as follows:
Phase 3 – Interim Savings for Allocation – Service Point Rationalisation
WSestimate = WSmeter error + WSleakage through + WSleakage around + WSunmetered +WSunauthorised
Where:
WSmeter error = ∑ (Dbase1 x (MCF-1) x EF) x (Dyearx/Dbase)
WSleakage through = Nrationalised x t x LTT x EF
WEleakage around = Nrationalised x t x LTA x EF
WSunmetered = ∑ (VD x (MCF -1) x EF) x (DYear x/Dbase2) x t
October 2009 Cardno (Qld) Pty Ltd M:\7637-62\Word\Final Report\Audit Report_Final -NVIRP.docx
31
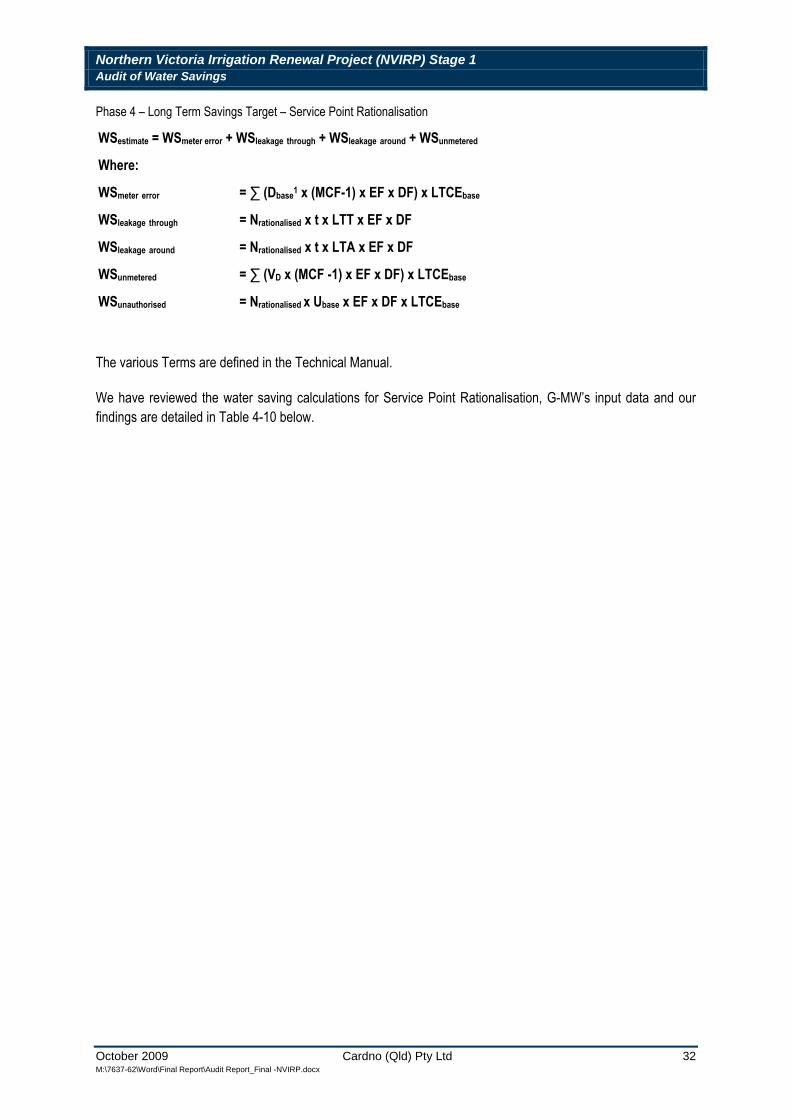
Northern Victoria Irrigation Renewal Project (NVIRP) Stage 1 Audit of Water Savings
Phase 4 – Long Term Savings Target – Service Point Rationalisation
WSestimate = WSmeter error + WSleakage through + WSleakage around + WSunmetered
Where:
WSmeter error = ∑ (Dbase1 x (MCF-1) x EF x DF) x LTCEbase
WSleakage through = Nrationalised x t x LTT x EF x DF
WSleakage around = Nrationalised x t x LTA x EF x DF
WSunmetered = ∑ (VD x (MCF -1) x EF x DF) x LTCEbase
WSunauthorised = Nrationalised x Ubase x EF x DF x LTCEbase
The various Terms are defined in the Technical Manual.
We have reviewed the water saving calculations for Service Point Rationalisation, G-MW’s input data and our findings are detailed in Table 4-10 below.
October 2009 Cardno (Qld) Pty Ltd M:\7637-62\Word\Final Report\Audit Report_Final -NVIRP.docx
32
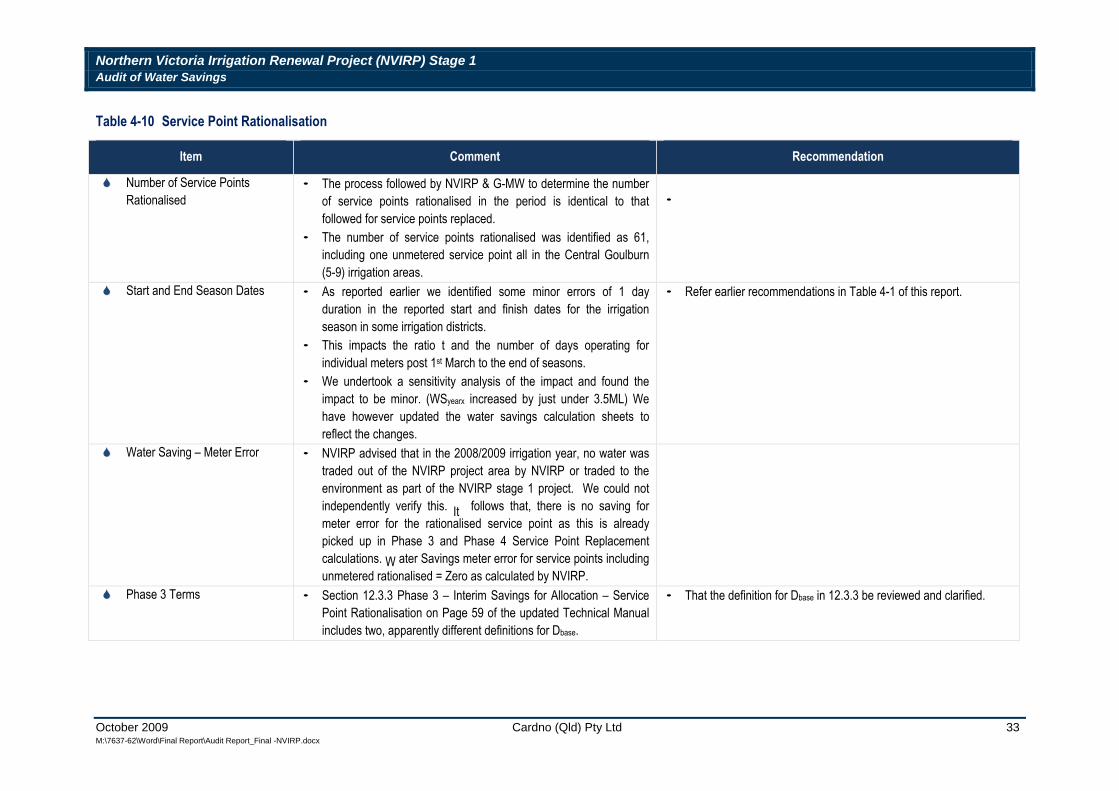
Northern Victoria Irrigation Renewal Project (NVIRP) Stage 1 Audit of Water Savings
Table 4-10 Service Point Rationalisation
Item Comment Recommendation
66 Number of Service Points · The process followed by NVIRP & G-MW to determine the number Rationalised of service points rationalised in the period is identical to that ·
followed for service points replaced. · The number of service points rationalised was identified as 61,
including one unmetered service point all in the Central Goulburn (5-9) irrigation areas.
66 Start and End Season Dates · As reported earlier we identified some minor errors of 1 day duration in the reported start and finish dates for the irrigation season in some irrigation districts.
· This impacts the ratio t and the number of days operating for individual meters post 1st March to the end of seasons.
· We undertook a sensitivity analysis of the impact and found the impact to be minor. (WSyearx increased by just under 3.5ML) We have however updated the water savings calculation sheets to reflect the changes.
66 Water Saving – Meter Error · NVIRP advised that in the 2008/2009 irrigation year, no water was traded out of the NVIRP project area by NVIRP or traded to the environment as part of the NVIRP stage 1 project. We could not independently verify this. It follows that, there is no saving for meter error for the rationalised service point as this is already picked up in Phase 3 and Phase 4 Service Point Replacement calculations. W ater Savings meter error for service points including unmetered rationalised = Zero as calculated by NVIRP.
· Refer earlier recommendations in Table 4-1 of this report.
66 Phase 3 Terms · Section 12.3.3 Phase 3 – Interim Savings for Allocation – Service · That the definition for Dbase in 12.3.3 be reviewed and clarified. Point Rationalisation on Page 59 of the updated Technical Manual includes two, apparently different definitions for Dbase.
October 2009 Cardno (Qld) Pty Ltd M:\7637-62\Word\Final Report\Audit Report_Final -NVIRP.docx
33
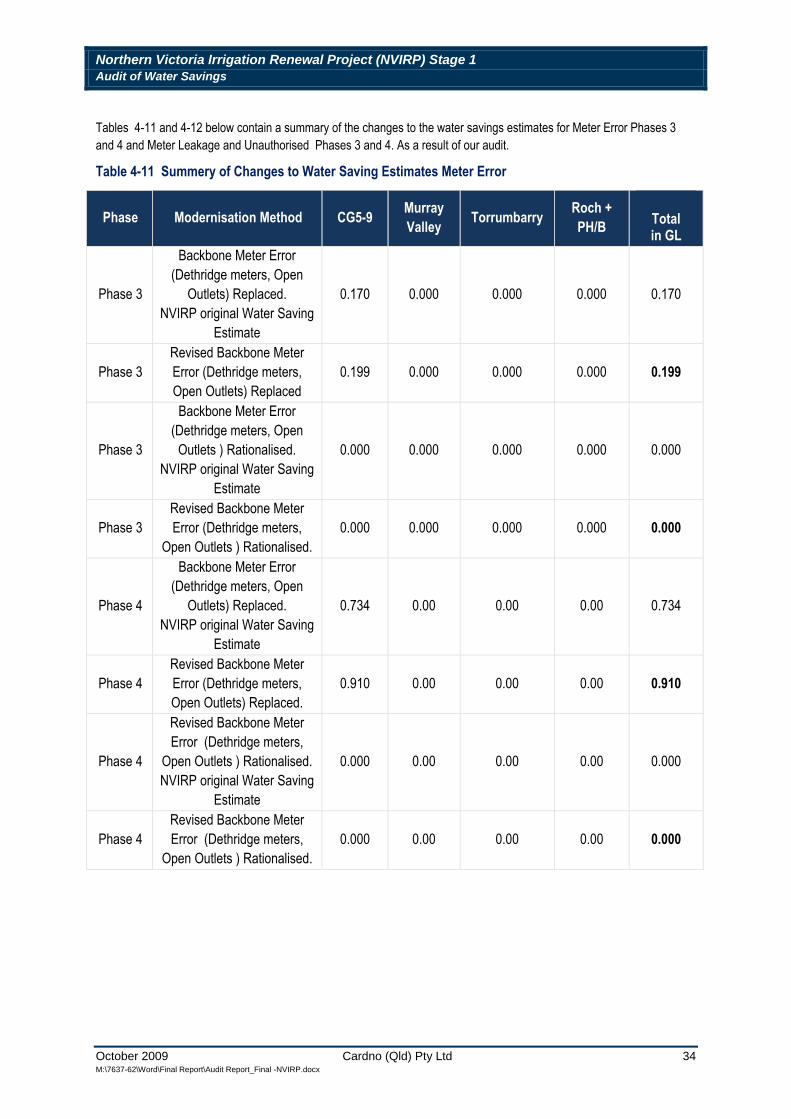
Northern Victoria Irrigation Renewal Project (NVIRP) Stage 1 Audit of Water Savings
Tables 4-11 and 4-12 below contain a summary of the changes to the water savings estimates for Meter Error Phases 3 and 4 and Meter Leakage and Unauthorised Phases 3 and 4. As a result of our audit.
Table 4-11 Summery of Changes to Water Saving Estimates Meter Error
Phase Modernisation Method CG5-9 Murray Valley Torrumbarry Roch +
PH/B Total in GL
Backbone Meter Error
Phase 3 (Dethridge meters, Open
Outlets) Replaced. NVIRP original Water Saving
Estimate
0.170 0.000 0.000 0.000 0.170
Revised Backbone Meter Phase 3 Error (Dethridge meters,
Open Outlets) Replaced Backbone Meter Error
0.199 0.000 0.000 0.000 0.199
Phase 3 (Dethridge meters, Open
Outlets ) Rationalised. NVIRP original Water Saving
Estimate
0.000 0.000 0.000 0.000 0.000
Revised Backbone Meter Phase 3 Error (Dethridge meters,
Open Outlets ) Rationalised. Backbone Meter Error
0.000 0.000 0.000 0.000 0.000
Phase 4 (Dethridge meters, Open
Outlets) Replaced. NVIRP original Water Saving
Estimate
0.734 0.00 0.00 0.00 0.734
Revised Backbone Meter Phase 4 Error (Dethridge meters,
Open Outlets) Replaced. Revised Backbone Meter
0.910 0.00 0.00 0.00 0.910
Phase 4 Error (Dethridge meters,
Open Outlets ) Rationalised. NVIRP original Water Saving
Estimate
0.000 0.00 0.00 0.00 0.000
Revised Backbone Meter Phase 4 Error (Dethridge meters,
Open Outlets ) Rationalised. 0.000 0.00 0.00 0.00 0.000
October 2009 Cardno (Qld) Pty Ltd M:\7637-62\Word\Final Report\Audit Report_Final -NVIRP.docx
34
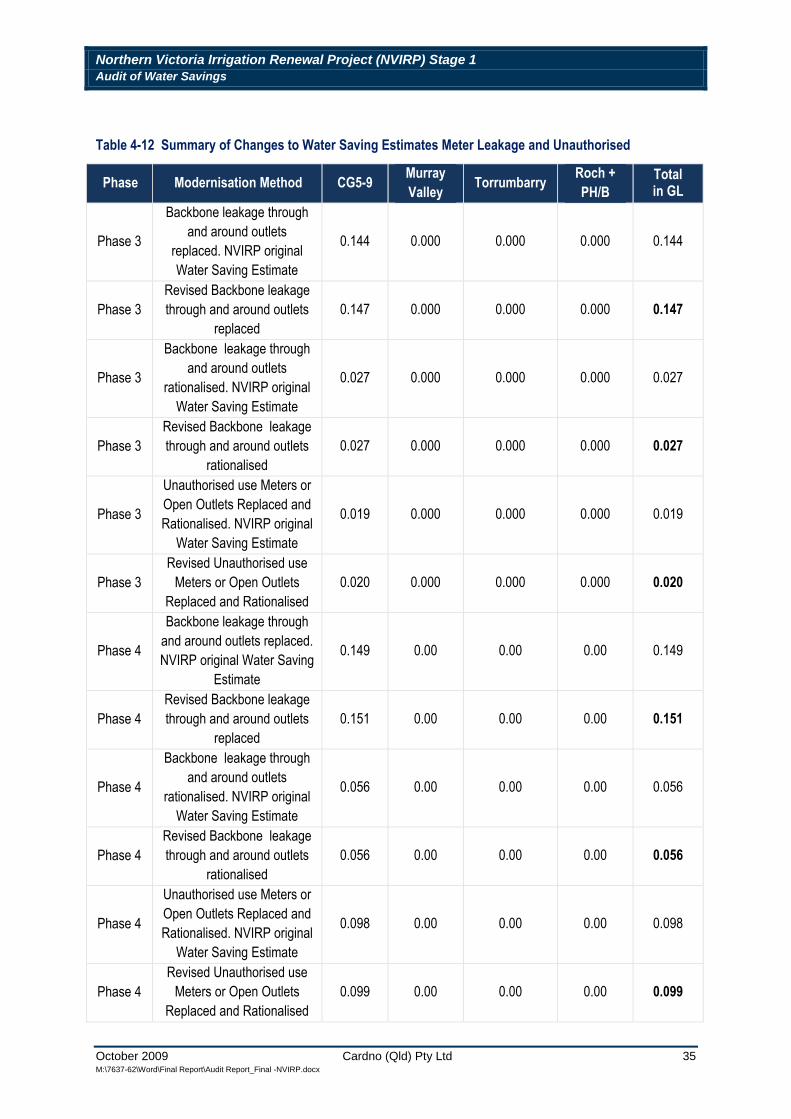
Northern Victoria Irrigation Renewal Project (NVIRP) Stage 1 Audit of Water Savings
Table 4-12 Summary of Changes to Water Saving Estimates Meter Leakage and Unauthorised
Phase Modernisation Method CG5-9 Murray Valley Torrumbarry Roch +
PH/B Total in GL
Phase 3
Phase 3
Phase 3
Phase 3
Phase 3
Phase 3
Phase 4
Phase 4
Phase 4
Phase 4
Phase 4
Phase 4
Backbone leakage through and around outlets
replaced. NVIRP original Water Saving Estimate
Revised Backbone leakage through and around outlets
replaced Backbone leakage through
and around outlets rationalised. NVIRP original
Water Saving Estimate Revised Backbone leakage through and around outlets
rationalised Unauthorised use Meters or Open Outlets Replaced and Rationalised. NVIRP original
Water Saving Estimate Revised Unauthorised use
Meters or Open Outlets Replaced and Rationalised Backbone leakage through
and around outlets replaced. NVIRP original Water Saving
Estimate Revised Backbone leakage through and around outlets
replaced Backbone leakage through
and around outlets rationalised. NVIRP original
Water Saving Estimate Revised Backbone leakage through and around outlets
rationalised Unauthorised use Meters or Open Outlets Replaced and Rationalised. NVIRP original
Water Saving Estimate Revised Unauthorised use
Meters or Open Outlets Replaced and Rationalised
0.144
0.147
0.027
0.027
0.019
0.020
0.149
0.151
0.056
0.056
0.098
0.099
0.000
0.000
0.000
0.000
0.000
0.000
0.00
0.00
0.00
0.00
0.00
0.00
0.000
0.000
0.000
0.000
0.000
0.000
0.00
0.00
0.00
0.00
0.00
0.00
0.000
0.000
0.000
0.000
0.000
0.000
0.00
0.00
0.00
0.00
0.00
0.00
0.144
0.147
0.027
0.027
0.019
0.020
0.149
0.151
0.056
0.056
0.098
0.099
October 2009 Cardno (Qld) Pty Ltd M:\7637-62\Word\Final Report\Audit Report_Final -NVIRP.docx
35
Northern Victoria Irrigation Renewal Project (NVIRP) Stage 1 Audit of Water Savings
4.6.3 Improvement Opportunities
The audited scope includes a requirement to identify potential improvements to the data collection, data analysis, assumptions and methods used to estimate water saving as recommending changes to the Technical Manual that will improve the useability and accuracy of the water savings estimates.
A number of recommendations have been included in the earlier tables relating to specific savings calculations.
In addition, during the course of the audit we identified a number of generic improvement opportunities which are detailed in Table 4-13 below.
It should be noted however that the Technical Manual is a “ground breaking” document and will be subject to ongoing continuous improvement reviews and refinement throughout the duration of the Northern Victoria Irrigation Renewals Project.
October 2009 Cardno (Qld) Pty Ltd M:\7637-62\Word\Final Report\Audit Report_Final -NVIRP.docx
36
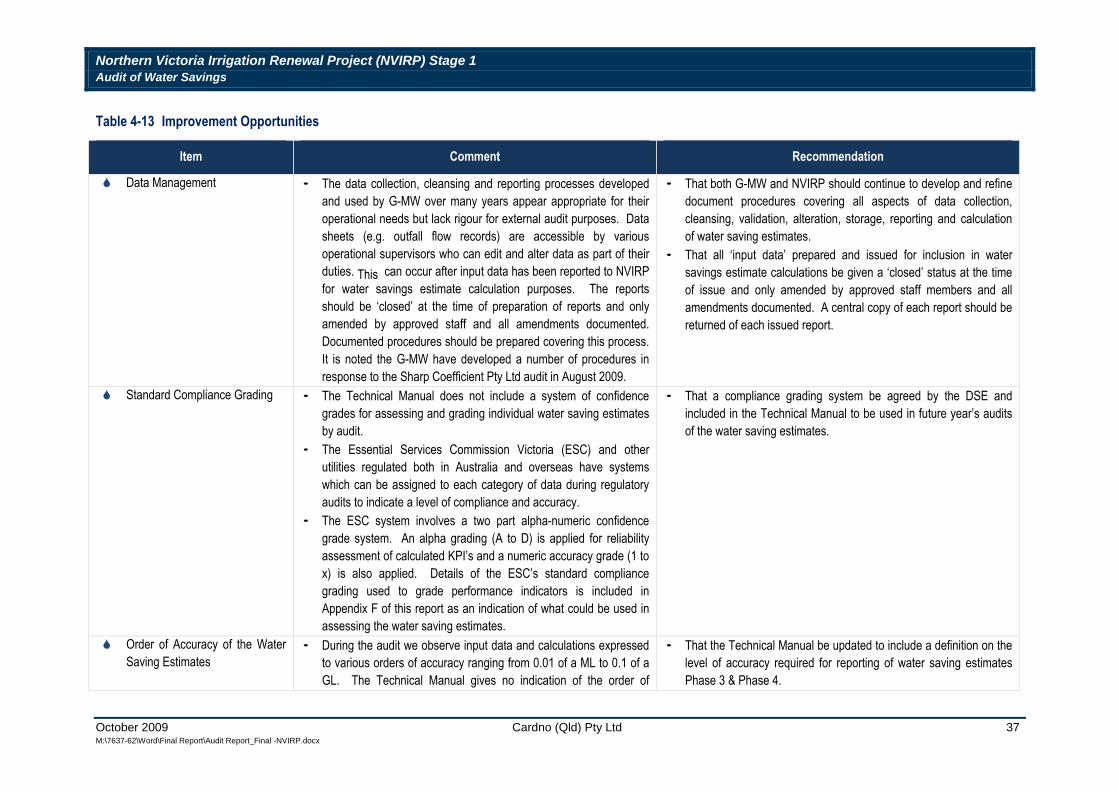
Northern Victoria Irrigation Renewal Project (NVIRP) Stage 1 Audit of Water Savings
Table 4-13 Improvement Opportunities
Item Comment Recommendation
66 Data Management · The data collection, cleansing and reporting processes developed · That both G-MW and NVIRP should continue to develop and refine and used by G-MW over many years appear appropriate for their document procedures covering all aspects of data collection, operational needs but lack rigour for external audit purposes. Data cleansing, validation, alteration, storage, reporting and calculation sheets (e.g. outfall flow records) are accessible by various of water saving estimates. operational supervisors who can edit and alter data as part of their duties. This can occur after input data has been reported to NVIRP for water savings estimate calculation purposes. The reports should be ‘closed’ at the time of preparation of reports and only amended by approved staff and all amendments documented. Documented procedures should be prepared covering this process.
· That all ‘input data’ prepared and issued for inclusion in water savings estimate calculations be given a ‘closed’ status at the time of issue and only amended by approved staff members and all amendments documented. A central copy of each report should be returned of each issued report.
It is noted the G-MW have developed a number of procedures in response to the Sharp Coefficient Pty Ltd audit in August 2009.
66 Standard Compliance Grading · The Technical Manual does not include a system of confidence · That a compliance grading system be agreed by the DSE and grades for assessing and grading individual water saving estimates included in the Technical Manual to be used in future year’s audits by audit. of the water saving estimates.
· The Essential Services Commission Victoria (ESC) and other utilities regulated both in Australia and overseas have systems which can be assigned to each category of data during regulatory audits to indicate a level of compliance and accuracy.
· The ESC system involves a two part alpha-numeric confidence grade system. An alpha grading (A to D) is applied for reliability assessment of calculated KPI’s and a numeric accuracy grade (1 to x) is also applied. Details of the ESC’s standard compliance grading used to grade performance indicators is included in Appendix F of this report as an indication of what could be used in assessing the water saving estimates.
66 Order of Accuracy of the Water Saving Estimates
· During the audit we observe input data and calculations expressed to various orders of accuracy ranging from 0.01 of a ML to 0.1 of a GL. The Technical Manual gives no indication of the order of
· That the Technical Manual be updated to include a definition on the level of accuracy required for reporting of water saving estimates Phase 3 & Phase 4.
October 2009 M:\7637-62\Word\Final Report\Audit Report_Final -NVIRP.docx
Cardno (Qld) Pty Ltd 37
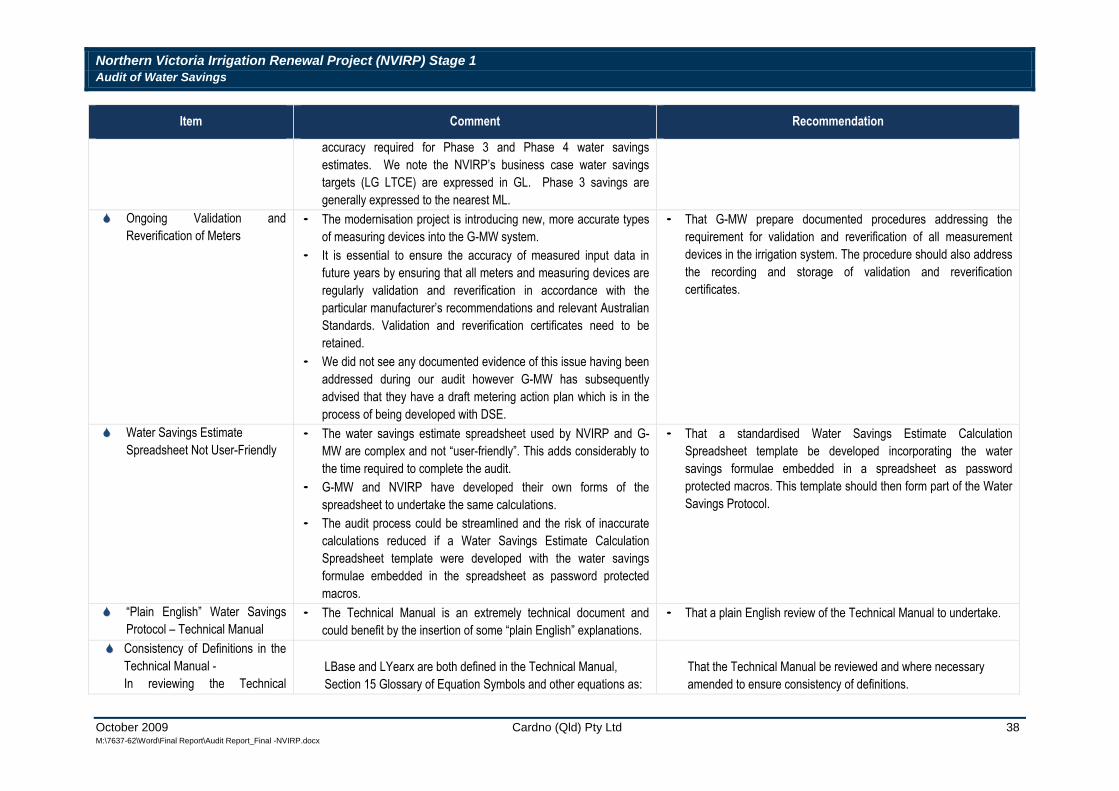
Northern Victoria Irrigation Renewal Project (NVIRP) Stage 1 Audit of Water Savings
Item Comment Recommendation
66 Ongoing Validation and Reverification of Meters
66 Water Savings Estimate Spreadsheet Not User-Friendly
66 “Plain English” Water Savings Protocol – Technical Manual
66 Consistency of Definitions in the Technical Manual -In reviewing the Technical
accuracy required for Phase 3 and Phase 4 water savings estimates. We note the NVIRP’s business case water savings targets (LG LTCE) are expressed in GL. Phase 3 savings are generally expressed to the nearest ML.
· The modernisation project is introducing new, more accurate types of measuring devices into the G-MW system.
· It is essential to ensure the accuracy of measured input data in future years by ensuring that all meters and measuring devices are regularly validation and reverification in accordance with the particular manufacturer’s recommendations and relevant Australian Standards. Validation and reverification certificates need to be retained.
· We did not see any documented evidence of this issue having been addressed during our audit however G-MW has subsequently advised that they have a draft metering action plan which is in the process of being developed with DSE.
· The water savings estimate spreadsheet used by NVIRP and G-MW are complex and not “user-friendly”. This adds considerably to the time required to complete the audit.
· G-MW and NVIRP have developed their own forms of the spreadsheet to undertake the same calculations.
· The audit process could be streamlined and the risk of inaccurate calculations reduced if a Water Savings Estimate Calculation Spreadsheet template were developed with the water savings formulae embedded in the spreadsheet as password protected macros.
· The Technical Manual is an extremely technical document and could benefit by the insertion of some “plain English” explanations.
LBase and LYearx are both defined in the Technical Manual, Section 15 Glossary of Equation Symbols and other equations as:
· That G-MW prepare documented procedures addressing the requirement for validation and reverification of all measurement devices in the irrigation system. The procedure should also address the recording and storage of validation and reverification certificates.
· That a standardised Water Savings Estimate Calculation Spreadsheet template be developed incorporating the water savings formulae embedded in a spreadsheet as password protected macros. This template should then form part of the Water Savings Protocol.
· That a plain English review of the Technical Manual to undertake.
That the Technical Manual be reviewed and where necessary amended to ensure consistency of definitions.
October 2009 Cardno (Qld) Pty Ltd M:\7637-62\Word\Final Report\Audit Report_Final -NVIRP.docx
38
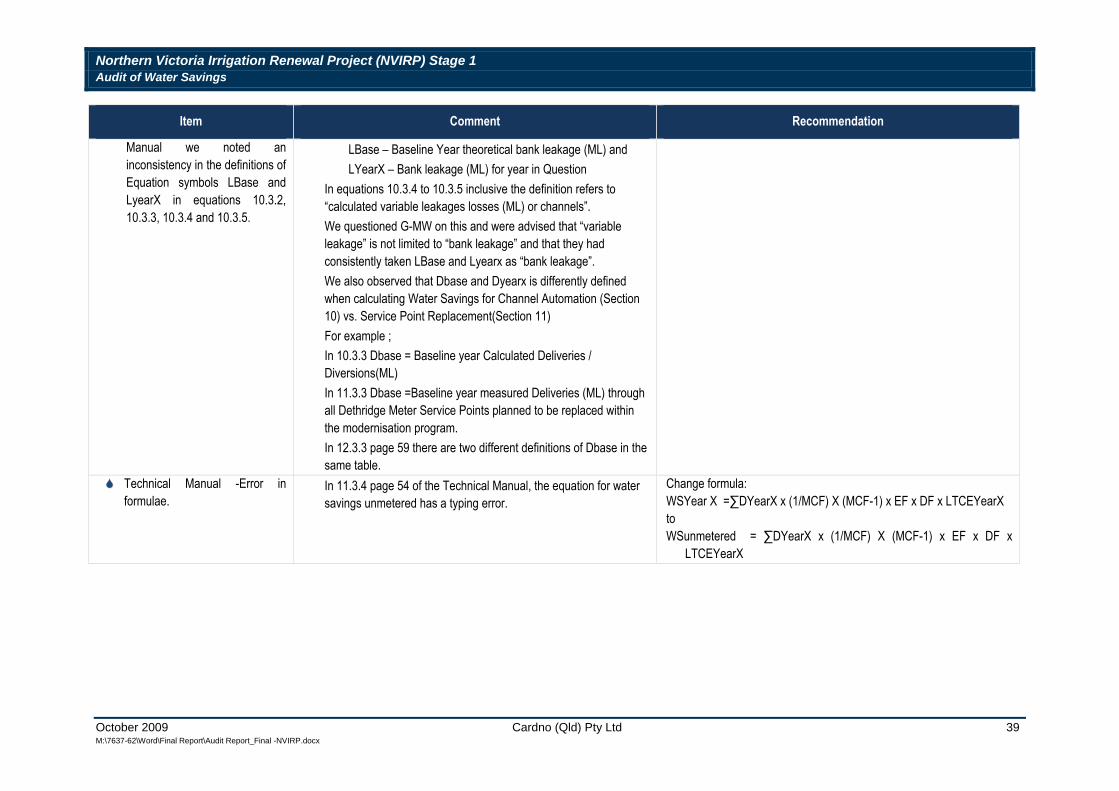
Northern Victoria Irrigation Renewal Project (NVIRP) Stage 1 Audit of Water Savings
Item Comment Recommendation
Manual we noted an inconsistency in the definitions of Equation symbols LBase and LyearX in equations 10.3.2, 10.3.3, 10.3.4 and 10.3.5.
LBase – Baseline Year theoretical bank leakage (ML) and LYearX – Bank leakage (ML) for year in Question
In equations 10.3.4 to 10.3.5 inclusive the definition refers to “calculated variable leakages losses (ML) or channels”. We questioned G-MW on this and were advised that “variable leakage” is not limited to “bank leakage” and that they had
consistently taken LBase and Lyearx as “bank leakage”.
We also observed that Dbase and Dyearx is differently defined
when calculating Water Savings for Channel Automation (Section
10) vs. Service Point Replacement(Section 11)
For example ;
In 10.3.3 Dbase = Baseline year Calculated Deliveries /
Diversions(ML)
In 11.3.3 Dbase =Baseline year measured Deliveries (ML) through
all Dethridge Meter Service Points planned to be replaced within
the modernisation program.
In 12.3.3 page 59 there are two different definitions of Dbase in the same table.
66 Technical formulae.
Manual -Error in In 11.3.4 page 54 of the Technical Manual, the equation for water savings unmetered has a typing error.
Change formula: WSYear X =∑DYearX x (1/MCF) X (MCF-1) x EF x DF x LTCEYearX to WSunmetered = ∑DYearX x (1/MCF) X (MCF-1) x EF x DF x
LTCEYearX
October 2009 Cardno (Qld) Pty Ltd M:\7637-62\Word\Final Report\Audit Report_Final -NVIRP.docx
39
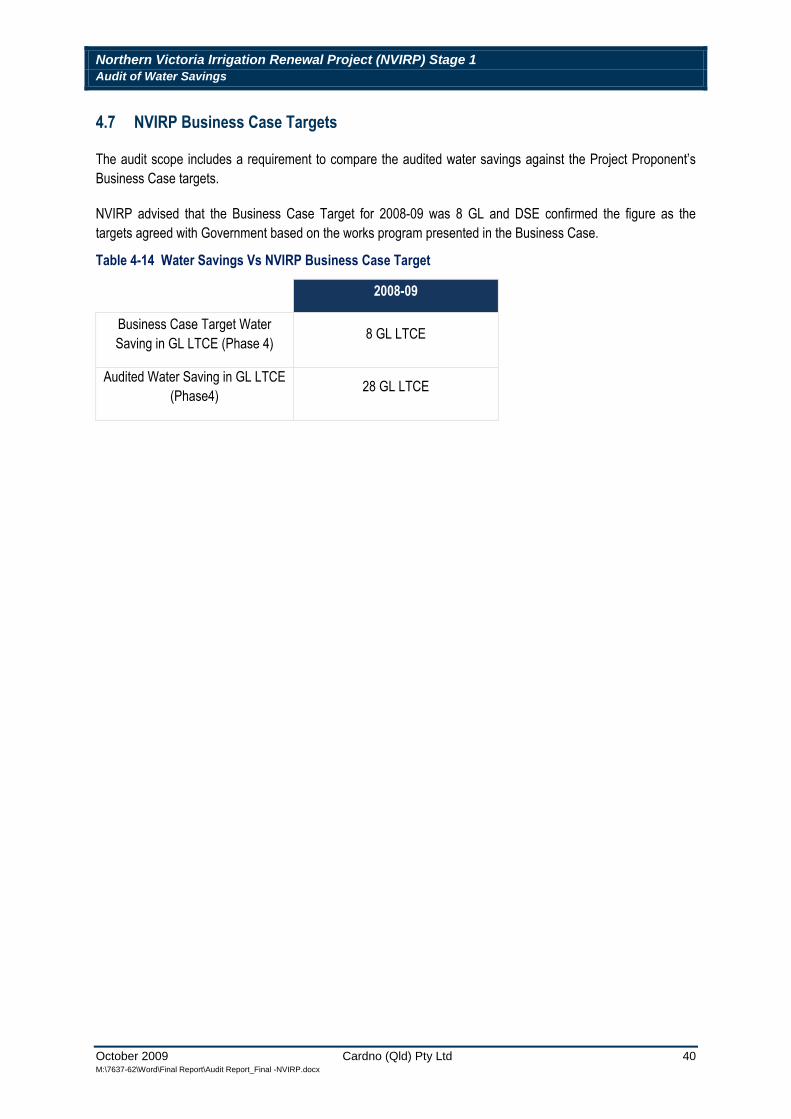
Northern Victoria Irrigation Renewal Project (NVIRP) Stage 1 Audit of Water Savings
4.7 NVIRP Business Case Targets
The audit scope includes a requirement to compare the audited water savings against the Project Proponent’s Business Case targets.
NVIRP advised that the Business Case Target for 2008-09 was 8 GL and DSE confirmed the figure as the targets agreed with Government based on the works program presented in the Business Case.
Table 4-14 Water Savings Vs NVIRP Business Case Target
2008-09
Business Case Target Water Saving in GL LTCE (Phase 4) 8 GL LTCE
Audited Water Saving in GL LTCE (Phase4) 28 GL LTCE
October 2009 Cardno (Qld) Pty Ltd M:\7637-62\Word\Final Report\Audit Report_Final -NVIRP.docx
40
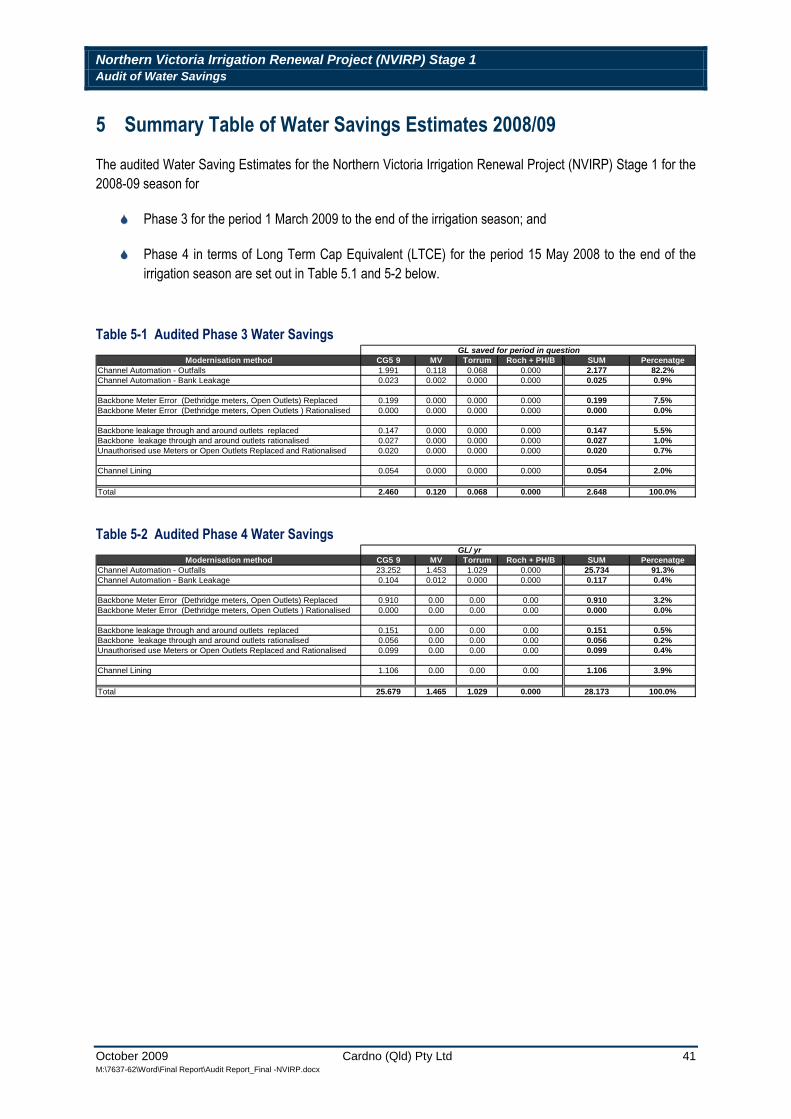
Northern Victoria Irrigation Renewal Project (NVIRP) Stage 1 Audit of Water Savings
5 Summary Table of Water Savings Estimates 2008/09 The audited Water Saving Estimates for the Northern Victoria Irrigation Renewal Project (NVIRP) Stage 1 for the 2008-09 season for
66 Phase 3 for the period 1 March 2009 to the end of the irrigation season; and
66 Phase 4 in terms of Long Term Cap Equivalent (LTCE) for the period 15 May 2008 to the end of the irrigation season are set out in Table 5.1 and 5-2 below.
Table 5-1 Audited Phase 3 Water Savings GL saved for period in question
Modernisation method CG5 9 MV Torrum Roch + PH/B SUM Percenatge Channel Automation - Outfalls 1.991 0.118 0.068 0.000 2.177 82.2% Channel Automation - Bank Leakage 0.023 0.002 0.000 0.000 0.025 0.9%
Backbone Meter Error (Dethridge meters, Open Outlets) Replaced 0.199 0.000 0.000 0.000 0.199 7.5% Backbone Meter Error (Dethridge meters, Open Outlets ) Rationalised 0.000 0.000 0.000 0.000 0.000 0.0%
Backbone leakage through and around outlets replaced 0.147 0.000 0.000 0.000 0.147 5.5% Backbone leakage through and around outlets rationalised 0.027 0.000 0.000 0.000 0.027 1.0% Unauthorised use Meters or Open Outlets Replaced and Rationalised 0.020 0.000 0.000 0.000 0.020 0.7%
Channel Lining 0.054 0.000 0.000 0.000 0.054 2.0%
Total 2.460 0.120 0.068 0.000 2.648 100.0%
Table 5-2 Audited Phase 4 Water Savings GL/ yr
Modernisation method CG5 9 MV Torrum Roch + PH/B SUM Percenatge Channel Automation - Outfalls 23.252 1.453 1.029 0.000 25.734 91.3% Channel Automation - Bank Leakage 0.104 0.012 0.000 0.000 0.117 0.4%
Backbone Meter Error (Dethridge meters, Open Outlets) Replaced 0.910 0.00 0.00 0.00 0.910 3.2% Backbone Meter Error (Dethridge meters, Open Outlets ) Rationalised 0.000 0.00 0.00 0.00 0.000 0.0%
Backbone leakage through and around outlets replaced 0.151 0.00 0.00 0.00 0.151 0.5% Backbone leakage through and around outlets rationalised 0.056 0.00 0.00 0.00 0.056 0.2% Unauthorised use Meters or Open Outlets Replaced and Rationalised 0.099 0.00 0.00 0.00 0.099 0.4%
Channel Lining 1.106 0.00 0.00 0.00 1.106 3.9%
Total 25.679 1.465 1.029 0.000 28.173 100.0%
October 2009 Cardno (Qld) Pty Ltd M:\7637-62\Word\Final Report\Audit Report_Final -NVIRP.docx
41

Appendix A Executive Summary, Baseline Audit Report August 2009 by Sharp Coefficient Pty Ltd
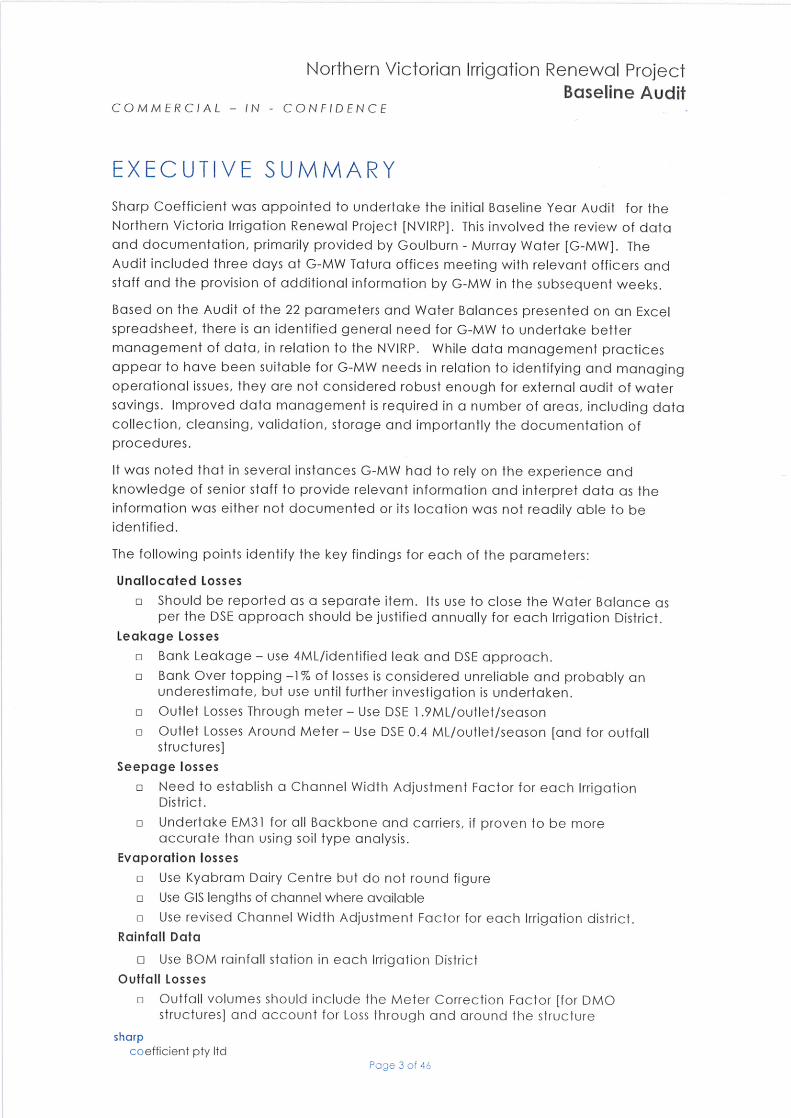
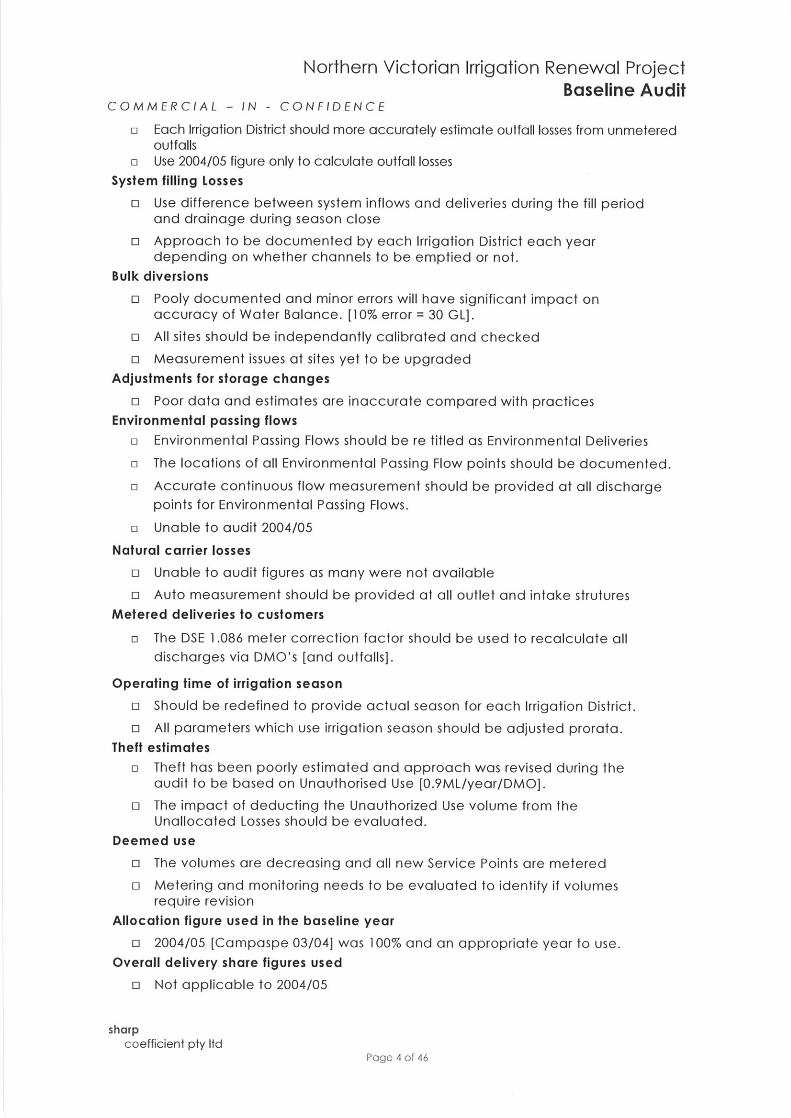
Northern Victorian Irrigation Renewal Project
Baseline Audit
August 2009
s h a r p c o e f f i c i e n t
1. This report has been prepared by sharp coefficient for the purposes stated herein. We do not accept responsibility for the consequences of extrapolation, extension or transference of the findings and recommendations of this report to different sites, cases or conditions.
2. This report is based in part on information which was provided to us by the client and/or others and which is not under our control. We do not warrant or guarantee the accuracy of this information.
3. We believe the conclusions and recommendations contained herein were reasonable and appropriate at the time of issue of the report. However, the user is cautioned that fundamental input assumptions upon which this report is based may change with time. It is the user’s responsibility to ensure that input assumptions remain valid.
4. This report must be read in its entirety. This notice constitutes an integral part of the report, and must be reproduced with every copy.
5. This report is prepared solely for the use of the person or company to whom it is addressed. No responsibility or liability to any third party is accepted for any damages howsoever arising out of the use of this report by any third party.
6. Unless specifically agreed otherwise in the contract of engagement, sharp coefficient retains Intellectual Property Rights over the contents of this report. The client is granted a licence to use the report for the purposes for which it was commissioned.
NVIRP final report 150809 i
s h a r p c o e f f i c i e n t
TABLE OF CONTENTS
EXECUTIVE SUMMARY 3
INTRODUCTION 6
BACKGROUND 7
PARAMETERS 8
introduction 8
1 Unallocated Losses 10
2 Leakage Losses 11
3 Seepage losses 14
4 Evaporation losses 16
5 Rainfall Data 17
6 Outfall Losses 18
7 System filling Losses 22
8 Bulk diversions 23
9 Adjustments for storage changes 24
10 Environmental passing flows 26
11 Natural carrier losses 26
12 Metered deliveries to customers 28
13 Operating time of irrigation season 29
14 Theft estimates 30
15 Deemed use 31
16 Allocation figure used in the baseline year 32
17 Overall delivery share figures used 32
18 Overall water share figures used 33
19 Number of dethridge wheels and type 33
20 Estimates of farm pumpbacks 34
21 Kilometres of backbone and SPUR channels 35
22 Kilometres of pipelines in place 36
WATER BALANCES 38
AUDIT METHODOLOGY 40
APPENDIX A. ACKNOWLEDGEMENTS 41
APPENDIX B GMW PERSONNEL INTERVIEWED 42
APPENDIX C DOCUMENTS PROVIDED 43
NVIRP final report 150809 ii
Northern Victorian Irrigation Renewal Project Baseline Audit
C O M M E R C I A L – I N C O N F I D E N C E
EXECUT IVE SUMMARY
Sharp Coefficient was appointed to undertake the initial Baseline Year Audit for the
Northern Victoria Irrigation Renewal Project [NVIRP]. This involved the review of data
and documentation, primarily provided by Goulburn Murray Water [GMW]. The
Audit included three days at GMW Tatura offices meeting with relevant officers and
staff and the provision of additional information by GMW in the subsequent weeks.
Based on the Audit of the 22 parameters and Water Balances presented on an Excel
spreadsheet, there is an identified general need for GMW to undertake better
management of data, in relation to the NVIRP. While data management practices
appear to have been suitable for GMW needs in relation to identifying and managing
operational issues, they are not considered robust enough for external audit of water
savings. Improved data management is required in a number of areas, including data
collection, cleansing, validation, storage and importantly the documentation of
procedures.
It was noted that in several instances GMW had to rely on the experience and
knowledge of senior staff to provide relevant information and interpret data as the
information was either not documented or its location was not readily able to be
identified.
The following points identify the key findings for each of the parameters:
Unallocated Losses
□ Should be reported as a separate item. Its use to close the Water Balance as per the DSE approach should be justified annually for each Irrigation District.
Leakage Losses
□ Bank Leakage – use 4ML/identified leak and DSE approach.
□ Bank Over topping –1% of losses is considered unreliable and probably an underestimate, but use until further investigation is undertaken.
□ Outlet Losses Through meter – Use DSE 1.9ML/outlet/season
□ Outlet Losses Around Meter – Use DSE 0.4 ML/outlet/season [and for outfall structures]
Seepage losses
□ Need to establish a Channel Width Adjustment Factor for each Irrigation District.
□ Undertake EM31 for all Backbone and carriers, if proven to be more accurate than using soil type analysis.
Evaporation losses
□ Use Kyabram Dairy Centre but do not round figure
□ Use GIS lengths of channel where available
□ Use revised Channel Width Adjustment Factor for each Irrigation district.
Rainfall Data
□ Use BOM rainfall station in each Irrigation District
Outfall Losses
□ Outfall volumes should include the Meter Correction Factor [for DMO structures] and account for Loss through and around the structure
sharp coefficient pty ltd
Page 3 of 46
Northern Victorian Irrigation Renewal Project Baseline Audit
C O M M E R C I A L – I N C O N F I D E N C E
□ Each Irrigation District should more accurately estimate outfall losses from unmetered outfalls
□ Use 2004/05 figure only to calculate outfall losses
System filling Losses
□ Use difference between system inflows and deliveries during the fill period and drainage during season close
□ Approach to be documented by each Irrigation District each year depending on whether channels to be emptied or not.
Bulk diversions
□ Pooly documented and minor errors will have significant impact on accuracy of Water Balance. [10% error = 30 GL].
□ All sites should be independantly calibrated and checked
□ Measurement issues at sites yet to be upgraded
Adjustments for storage changes
□ Poor data and estimates are inaccurate compared with practices
Environmental passing flows
□ Environmental Passing Flows should be re titled as Environmental Deliveries
□ The locations of all Environmental Passing Flow points should be documented.
□ Accurate continuous flow measurement should be provided at all discharge
points for Environmental Passing Flows.
□ Unable to audit 2004/05
Natural carrier losses
□ Unable to audit figures as many were not available
□ Auto measurement should be provided at all outlet and intake strutures
Metered deliveries to customers
□ The DSE 1.086 meter correction factor should be used to recalculate all
discharges via DMO’s [and outfalls].
Operating time of irrigation season
□ Should be redefined to provide actual season for each Irrigation District.
□ All parameters which use irrigation season should be adjusted prorata.
Theft estimates
□ Theft has been poorly estimated and approach was revised during the audit to be based on Unauthorised Use [0.9ML/year/DMO].
□ The impact of deducting the Unauthorized Use volume from the Unallocated Losses should be evaluated.
Deemed use
□ The volumes are decreasing and all new Service Points are metered
□ Metering and monitoring needs to be evaluated to identify if volumes require revision
Allocation figure used in the baseline year
□ 2004/05 [Campaspe 03/04] was 100% and an appropriate year to use.
Overall delivery share figures used
□ Not applicable to 2004/05
sharp coefficient pty ltd
Page 4 of 46
Northern Victorian Irrigation Renewal Project Baseline Audit
C O M M E R C I A L – I N C O N F I D E N C E
Overall water share figures used
□ Not applicable to 2004/05
Number of Dethridge Meters and type
□ There were limited discrepancies in the number of DMO’s reported for the Baseline year.
Estimates of farm pumpbacks
□ No farm pumpbacks were reported for the baseline year
□ The curent measurement and recording systems are inappropriate and inaccurate, however the volumes are considered to be very small, even in historic wet years
Kilometres of backbone and SPUR channels
□ Lengths are available and have been agreed between GMW and NVIRP
□ Lengths should be based onn GIS measurement rather than historic records, where available
Kilometres of pipelines in place
□ No pipeline lengths were used in compiling the NVIRP spread sheet.
□ The data provided to the Auditor should be verified prior to compiling the
lengths of RRJ and welded pipes for each Irrigation District, by Backbone and
Spur channel.
The Auditor identified the lack of documented Procedures as restricting the ability to
audit the Water Balances for each Irrigation District. It was noted that the data
available for the Campaspe Irrigation District appeared the least reliable and required
a number of assumptions to enable a Water Balance. It appeared that the major
cause of discrepancy for Campaspe was concerns in relation to the accuracy of the
Bulk Diversions. It is recommended that the Water Balance for each Irrigation District
be recalculated following incorporation of the recommendations for the parameters
above.
GMW should prepare appropriate mapping and flow charts to provide future auditors
with a succinct overview of each Irrigation District, the overall systems and the process
of estimating Water Balances.
sharp coefficient pty ltd
Page 5 of 46
Northern Victorian Irrigation Renewal Project Baseline Audit
C O M M E R C I A L – I N C O N F I D E N C E
I N TRODUCT ION
This report provides the results of an audit of the relevant water loss base parameters
and the baseline year for each of the Irrigation Districts which comprise the irrigation
region covered by the Northern Victorian Irrigation Renewal Project [NVIRP].
In addition as part of the audit the Auditor was asked to identify opportunities for
Goulburn Murray Water [GMW] to improve their practices to provide a more robust
information base for future audits. This comprised both verbal advice to relevant
GMW officers and comments within this report.
sharp coefficient pty ltd
Page 6 of 46
Northern Victorian Irrigation Renewal Project Baseline Audit
C O M M E R C I A L – I N C O N F I D E N C E
BACKGROUND
The Victorian Government has embarked on an ambitious project to undertake the
first major strategic upgrade of the irrigation systems which cover the northern portion
of the State in over 80 years. The NVIRP project was initiated by the Victorian
Government in 2007 with the goal of achieving substantial savings in the efficiency of
the delivery of water to farmers. The water saved is to be shared equally between the
farmers, the environment and as a bulk water supply to supplement Melbourne’s
urban water resources. The budget for Stage 1 of the works is $1B.
In order to expedite the Project some early works were undertaken by GMW via the
Food Bowl Early Works project. The remaining and majority of the works are being
managed by the NVIRP.
As part of the overall project the Government has committed to transparently
identifying the savings in water that eventuate from the works undertaken. Annual
audits of the works undertaken and the resulting water savings are to be undertaken
by independent auditors appointed by the Department of Sustainability &
Environment. In order to identify the volume of water savings achieved a baseline
audit is required to identify the volumes of the various losses and deliveries for each
Irrigation District prior to commencing the upgrade work. To this end Sharp Coefficient
was appointed to undertake an audit of the losses, deliveries, etc. of the various
irrigation systems which comprise the NVIRP area for a typical irrigation season, before
the commencement of the Project. The selection of the Baseline year was based on
the review of a number of factors as described in Appendix a of the DSE Technical
Manual. As part of the evaluation it was identified that all audits should be
undertaken in comparison to an irrigation season which provided for 100% of water
allocation. For the majority of the region this was identified as the 2004/05 irrigation
season, with the exception of the Campaspe Irrigation District which had 100%
allocation in 2003/04. For ease of reference the data for the Campaspe Irrigation
District has been reviewed as if it were for the 2004/05 season.
sharp coefficient pty ltd
Page 7 of 46

Northern Victorian Irrigation Renewal Project Baseline Audit
C O M M E R C I A L – I N C O N F I D E N C E
PARAMETERS
INTRODUCT ION
NVIRP identified 22 parameters which it considered would be required to enable
future audits of the success of the NVIRP using the recently released Department of
Sustainability and Environment “Water Savings Protocol – Technical Manual for the
Quantification of Water Savings” [DSE Manual]. These parameters were the prime
focus of this audit.
In undertaking the audit it was identified that available records and data
management practices have not always been robust. In several cases the information
presented was based on experience or estimated by deduction from other
information, by senior GMW staff. It is acknowledged that more recent studies, etc
have been more rigorous and the data is more reliable. It is also acknowledged that
the information used has been based on the best information available at the time.
As part of the audit the Auditor was asked to identify opportunities to improve the
practices to provide a more robust base for future audits. While individual
recommendations have been provided with some parameters it was considered that
a more general recommendation should be provided in relation to data
management.
Traditionally GMW has not been audited, either internally or externally on its data
collection and management. As technical or operational issues have arisen relevant
studies, etc have been undertaken either internally or using consultants, to identify a
course of action. However GMW has not established a consistent or rigorous
approach to data management which has resulted in variable quality of data and
reporting.
It is recommended that GMW undertake a corporation wide program to improve
data management.
GMW is currently extremely reliant on a small number of individuals with the necessary
experience to review data and prepare the NVIRP spreadsheet, etc. It is considered
imperative that GMW prepare written procedures for all parameters and for the
completion of the ‘NVIRP spread sheet’.
For each audited Parameter the auditor should be able to readily answer the
following questions:
□ Is there a documented information specification for the data?
□ Is the data generated in accordance with the specification?
□ Is the data based on sound data and records?
□ Is there precedent data and is it robust?
The following notes are provided for information.
sharp coefficient pty ltd
Page 8 of 46
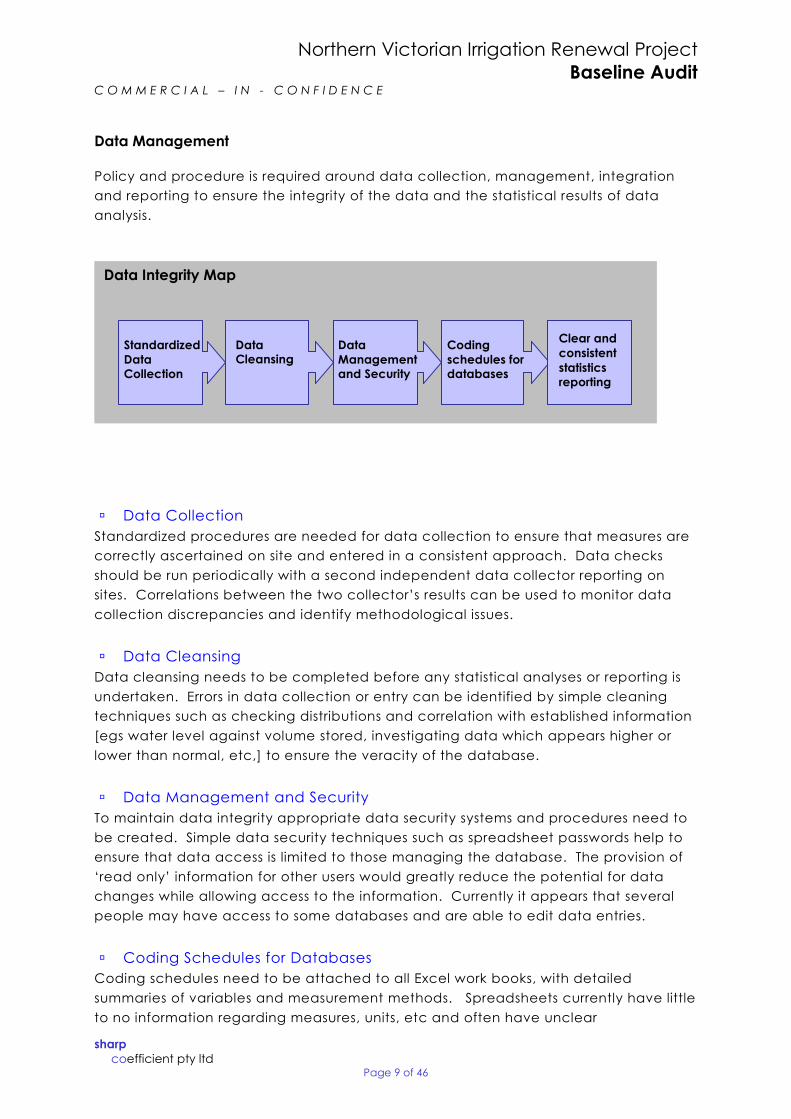
Northern Victorian Irrigation Renewal Project Baseline Audit
C O M M E R C I A L – I N C O N F I D E N C E
Data Management
Policy and procedure is required around data collection, management, integration
and reporting to ensure the integrity of the data and the statistical results of data
analysis.
Data Integrity Map
Standardized Data Collection
Data Cleansing
Data Management and Security
Coding schedules for databases
Clear and consistent statistics reporting
� Data Collection Standardized procedures are needed for data collection to ensure that measures are
correctly ascertained on site and entered in a consistent approach. Data checks
should be run periodically with a second independent data collector reporting on
sites. Correlations between the two collector’s results can be used to monitor data
collection discrepancies and identify methodological issues.
� Data Cleansing Data cleansing needs to be completed before any statistical analyses or reporting is
undertaken. Errors in data collection or entry can be identified by simple cleaning
techniques such as checking distributions and correlation with established information
[egs water level against volume stored, investigating data which appears higher or
lower than normal, etc,] to ensure the veracity of the database.
� Data Management and Security To maintain data integrity appropriate data security systems and procedures need to
be created. Simple data security techniques such as spreadsheet passwords help to
ensure that data access is limited to those managing the database. The provision of
‘read only’ information for other users would greatly reduce the potential for data
changes while allowing access to the information. Currently it appears that several
people may have access to some databases and are able to edit data entries.
� Coding Schedules for Databases Coding schedules need to be attached to all Excel work books, with detailed
summaries of variables and measurement methods. Spreadsheets currently have little
to no information regarding measures, units, etc and often have unclear
sharp coefficient pty ltd
Page 9 of 46

Northern Victorian Irrigation Renewal Project Baseline Audit
C O M M E R C I A L – I N C O N F I D E N C E
titles/descriptions, etc. Coding schedules ensure that measurement procedures are
documented and that statistical analyses can be conducted that appropriately take
into account varying measurement or coding methods.
� Clear and Consistent Statistics Reporting A consistent method of statistical reporting is needed to ensure that analyses and
results are clearly conveyed and the appropriate statistical procedures are employed
and detailed. Requisite statistical information has been omitted and should be
included in all results reporting (e.g. alpha levels, p values, number of cases, standard
deviation etc). Statistical methods should be reported in a standard format.
1 UNALLOCATED LOSSES
Description
Unallocated losses represent the volume of water required to balance the Water
Balance for each Irrigation District after all other losses, deliveries, etc have been
calculated. It is GMW practice to reallocate Unallocated Losses to Leakage as part
of the Water Balance.
Comments
□ The retention of Unallocated Losses as an audit parameter provides an
indication of the voracity of the Water Balance and therefore requires the
presentation of an opinion on the cause of the ‘difference’.
□ While there is some technical justification for re allocating Unallocated Losses
to Leakage based on investigations undertaken on CG1234 in 2003/04 and
reasonable correlation with subsequent years, the Auditor remains concerned
that balancing the Water Balance by manipulating the Leakage volume
removes the ability to verify the accuracy of all other estimates.
□ GMW has advised that the current approach will not impact on future water
savings estimates as all pools of all channels which are to be remediated are
monitored before and after remediation to evaluate the individual pool losses
and subsequent water savings.
Recommendations
1. Unallocated Losses should be reported in the Water Balance and not
automatically reallocated as Leakage. This will then require the provision of an
identification and justification of the likely cause of the losses, as well as allow
the quantification of improved channel operation as the volume of
Unallocated Losses is reduced with channel improvements, etc.
2. The practices for investigating and measuring the success of remediating
irrigation ponds should be documented.
sharp coefficient pty ltd
Page 10 of 46
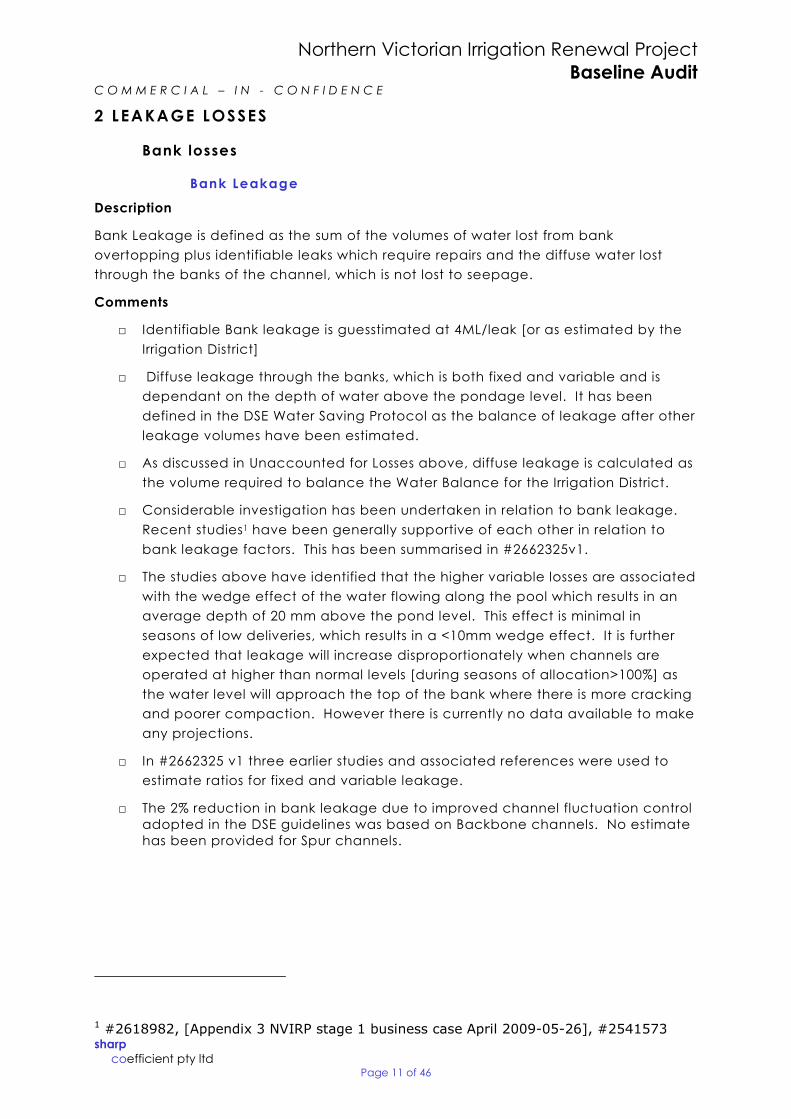
Northern Victorian Irrigation Renewal Project Baseline Audit
C O M M E R C I A L – I N C O N F I D E N C E
2 LEAKAGE LOSSES
Bank losses
Bank Leakage
Description
Bank Leakage is defined as the sum of the volumes of water lost from bank
overtopping plus identifiable leaks which require repairs and the diffuse water lost
through the banks of the channel, which is not lost to seepage.
Comments
□ Identifiable Bank leakage is guesstimated at 4ML/leak [or as estimated by the
Irrigation District]
□ Diffuse leakage through the banks, which is both fixed and variable and is
dependant on the depth of water above the pondage level. It has been
defined in the DSE Water Saving Protocol as the balance of leakage after other
leakage volumes have been estimated.
□ As discussed in Unaccounted for Losses above, diffuse leakage is calculated as
the volume required to balance the Water Balance for the Irrigation District.
□ Considerable investigation has been undertaken in relation to bank leakage.
Recent studies1 have been generally supportive of each other in relation to
bank leakage factors. This has been summarised in #2662325v1.
□ The studies above have identified that the higher variable losses are associated
with the wedge effect of the water flowing along the pool which results in an
average depth of 20 mm above the pond level. This effect is minimal in
seasons of low deliveries, which results in a <10mm wedge effect. It is further
expected that leakage will increase disproportionately when channels are
operated at higher than normal levels [during seasons of allocation>100%] as
the water level will approach the top of the bank where there is more cracking
and poorer compaction. However there is currently no data available to make
any projections.
□ In #2662325 v1 three earlier studies and associated references were used to
estimate ratios for fixed and variable leakage.
□ The 2% reduction in bank leakage due to improved channel fluctuation control adopted in the DSE guidelines was based on Backbone channels. No estimate has been provided for Spur channels.
1 #2618982, [Appendix 3 NVIRP stage 1 business case April 20090526], #2541573 sharp coefficient pty ltd
Page 11 of 46

Northern Victorian Irrigation Renewal Project Baseline Audit
C O M M E R C I A L – I N C O N F I D E N C E
Recommendations
1. The approach presented in the DSE Water Savings Protocol – Technical Manual
should be used to estimate diffuse Bank Leakage until a more robust approach
is developed. However the Unaccounted for losses should be documented as
part of the Water Balance and not be automatically allocated as Diffuse
Leakage.
2. Further investigation by each Irrigation District is required to justify the 4ML/leak
for identified leaks, but should be used until further studies are undertaken.
3. The percentage reduction in bank leakage due to improved channel
fluctuation control for Spur channels should be investigated.
Bank Overtopping
Description
Bank overtopping is currently assumed to be included in the allowance for bank
leakage and has been estimated as 1000ML across the NVIRP region.
Comments
□ Door/DMO and bank overtopping has not been accounted for, as leakage
measurement was undertaken during pondage tests, when the channel was
not operating. The Auditor was unable to identify any documentation
providing measurements of overtopping, however it is known that doors and
channels are prone to overtop during high channel flows, especially after
rainfall events and in years of excess water allocations. It is also expected that
channel overtopping occurs more frequently for channels that are run high due
to capacity constraints or are poorly maintained.
□ #900407v2 on pages 99 and 100 refer to “Additional Volume” [of leakage]. It
has been nominated that 1% [1000ML] of this volume could be attributed to
overtopping and stock damage2. However this assumes an Allocation of 100%
or greater and is not based on any measured volumes or records. The Auditor
is of the opinion that this figure may be considerably lower than actual but has
no basis for proposing an alternative.
□ Each Irrigation District may have a different estimate of losses due to
overtopping, depending on how the system has been operating over the
season.
□ Bank overtopping should be reduced by automated channel control.
Recommendations
1. A figure of 1% of bank leakage should be adopted to cover the guesstimated
volume of water losses due to channel overtopping and stock damage for the
Baseline year.
2 D. Poulton pers. com. sharp coefficient pty ltd
Page 12 of 46
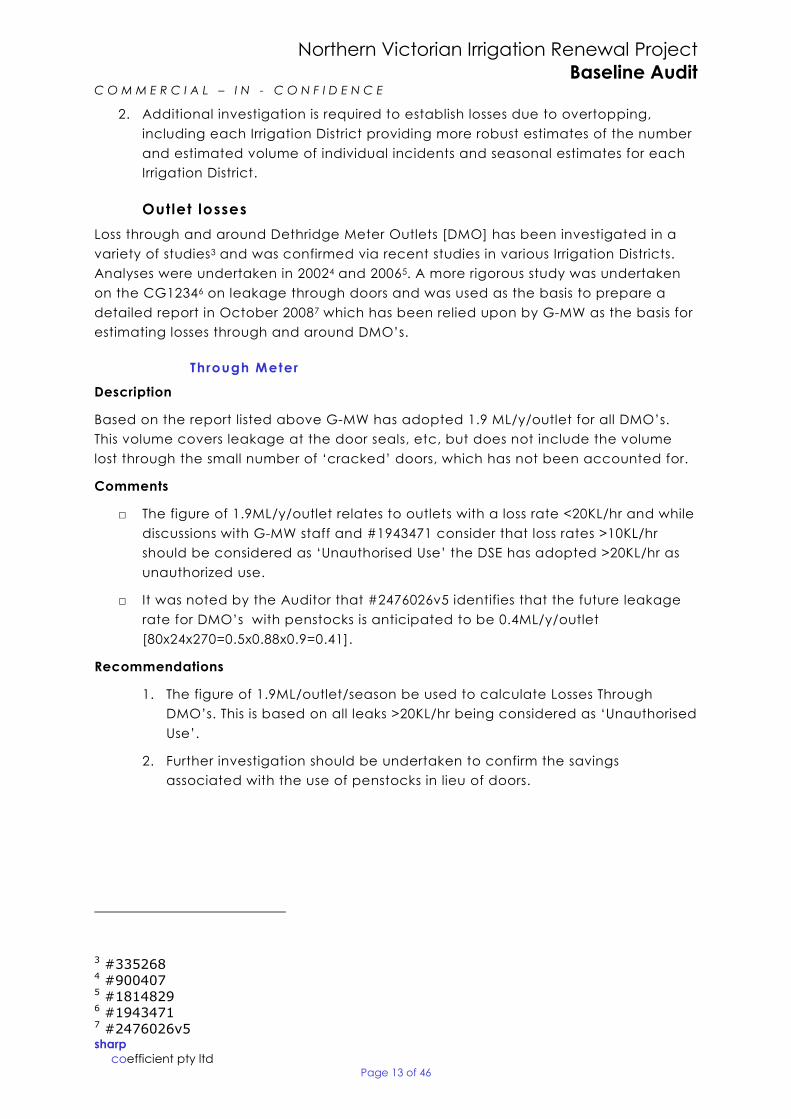
Northern Victorian Irrigation Renewal Project Baseline Audit
C O M M E R C I A L – I N C O N F I D E N C E
2. Additional investigation is required to establish losses due to overtopping,
including each Irrigation District providing more robust estimates of the number
and estimated volume of individual incidents and seasonal estimates for each
Irrigation District.
Outlet losses
Loss through and around Dethridge Meter Outlets [DMO] has been investigated in a
variety of studies3 and was confirmed via recent studies in various Irrigation Districts.
Analyses were undertaken in 20024 and 20065. A more rigorous study was undertaken
on the CG12346 on leakage through doors and was used as the basis to prepare a
detailed report in October 20087 which has been relied upon by GMW as the basis for
estimating losses through and around DMO’s.
Through Meter
Description
Based on the report listed above GMW has adopted 1.9 ML/y/outlet for all DMO’s.
This volume covers leakage at the door seals, etc, but does not include the volume
lost through the small number of ‘cracked’ doors, which has not been accounted for.
Comments
□ The figure of 1.9ML/y/outlet relates to outlets with a loss rate <20KL/hr and while
discussions with GMW staff and #1943471 consider that loss rates >10KL/hr
should be considered as ‘Unauthorised Use’ the DSE has adopted >20KL/hr as
unauthorized use.
□ It was noted by the Auditor that #2476026v5 identifies that the future leakage
rate for DMO’s with penstocks is anticipated to be 0.4ML/y/outlet
[80x24x270=0.5x0.88x0.9=0.41].
Recommendations
1. The figure of 1.9ML/outlet/season be used to calculate Losses Through
DMO’s. This is based on all leaks >20KL/hr being considered as ‘Unauthorised
Use’.
2. Further investigation should be undertaken to confirm the savings
associated with the use of penstocks in lieu of doors.
3 #335268 4 #900407 5 #1814829 6 #1943471 7 #2476026v5 sharp coefficient pty ltd
Page 13 of 46
Northern Victorian Irrigation Renewal Project Baseline Audit
C O M M E R C I A L – I N C O N F I D E N C E
Around Meter
Description
Based on the report #2476026 GMW has adopted 0.4 ML/y/outlet for all DMO’s. This
figure is to cover the leakage of water around the structure due to poor compaction
or degradation from yabbies, etc and is based on an average of two earlier studies8,
which individually estimated the losses to be 4.6 ML/y and 3.6ML/y from leaking
meters. One of the studies was based on 1890 area based leaks across the GMID and
the other was based on 39 measured leaks in the CG1234.
Comments
□ The same leakage factor should be applied to all outfall structures [222 in
2004/05] as they are predominately DMO structures and would be subject to
the same bank structural issues.
Recommendations
1. The Around Meter Loss figure of 0.4 ML/y/outlet should be applied to all DMO’s
and Outfall Structures.
3 SEEPAGE LOSSES
Description
Seepage is defined as the water lost to the ground below the pool level for the
channel section, following an initial higher rate loss which is the diffuse leakage. G
MW has developed a robust process for estimating seepage losses from channels
based on studies of several channels in the CG1234 area. The studies involved
accurately measuring water losses from each pool over subsequent irrigation seasons
and then correlating the seepage losses to the soil groupings for each pool.
For all other Irrigation Districts the various soil groups along each channel pool were
identified from the extensive soil mapping available for the GMID and a resulting
seepage index for each pool established. A spread sheet is used to calculate the
losses from each channel section based on channel width, length, depth [from Asset
Life] and the seepage index for the section/channel/area. In order to correct
channel width [water surface width] for bank slumping/ stock damage, etc GMW
undertook the measurement of 18 sites9 which identified an average error of actual
width to Asset Life entry of 22%. In consideration of this difference a figure of 120% of
Asset Life width has been used across the whole system as an adjustment coefficient
for all channels.
8 # 900407 and #1814829 9 # 2029252 sharp coefficient pty ltd
Page 14 of 46
Northern Victorian Irrigation Renewal Project Baseline Audit
C O M M E R C I A L – I N C O N F I D E N C E
Comments
□ GMW has undertaken considerable investigation to establish the seepage
index relationship to the soil groups for pool sections for the CG14 with a high
degree of correlation10. This strong relationship was then used to estimate
seepage in other Irrigation Districts.
□ GMID has added 20% to the width of each channel at pool depth to allow for
slumping, stock damage etc. It is considered that the adjustment coefficient
for channel width is not based on adequate research and without undertaking
more detailed measurement in each Irrigation District it is not possible to
evaluate the accuracy of this coefficient. For each Irrigation District the level
of maintenance is anticipated to vary, which could result in differences in
channel slumping and hence water width. The adjustment coefficient should
be based on a representative sample of channel widths from each Irrigation
District.
□ Examples11 of the GMW irrigation system Atlas were sighted as part of the audit
and the process was explained in detail.
□ It was noted that for the few areas that soil group mapping is unavailable G
MW has developed a methodology and spreadsheet12 for estimating the
seepage to provide an estimate of all seepage losses for the Irrigation District.
For the majority of areas the length of unmapped channel is less than 5%.
□ It was noted that soil group mapping is not available for the Waranga Western
Channel, Yarrawonga Main Channel, National Channel and the natural
carriers. As these are all backbone channels and convey large volumes of
water the approximated Seepage Losses could be different from actual. G
MW advised that there have been other investigations into the losses from the
Waranga Western channel.
□ It is understood that the NVIRP is funding EM31 [Electromagnetic] surveys of the
main carrier channels. The Auditor was advised that this method of seepage
evaluation provides more accurate results for large carriers than soil group
mapping. The progress of these surveys is not known.
Recommendations
1. The practices and spreadsheet for estimating Seepage Losses should be
documented.
2. Adequate sampling should be undertaken in each Irrigation District to establish
an accurate Channel Width Adjustment Factor for each area.
3. The practices and spreadsheet for estimating Seepage Losses from channels
without soil grouping should be documented.
10 # 2657181 11 #2032020, # 2121487 12 #2656845 sharp coefficient pty ltd
Page 15 of 46
Northern Victorian Irrigation Renewal Project Baseline Audit
C O M M E R C I A L – I N C O N F I D E N C E
4. The increased accuracy of the EM 31[electromagnetic interpretation of losses]
should be verified and the procedure documented. If the increased accuracy
is confirmed EM31 should be undertaken for all Backbone and Natural Carriers
to enable more accurate estimates of leakage and seepage.
5. Until the recommendations above are undertaken the adopted practices and
allowances for channel Seepage are considered appropriate.
4 EVAPORATION LOSSES
Description
GMW has adopted a standardised process for estimating Evaporation Losses13 which
was used across all Irrigation Districts. In summary, BOM open pan evaporation data at
the Kyabram Dairy Centre over the duration of the 2004/05 Irrigation Season were
used to calculate an average evaporation – rainfall figure [at the same site] for the
season of 3.78 mm [rounded to 4mm]. This figure was applied to all Irrigation Districts
and presented in #2477220 Appendix 2.
Comments
□ The Auditor was advised that GIS calculated channel lengths [this is in conflict
to advice below that GIS measured lengths have not been undertaken for the
whole of the NVIRP area] and Asset Life records of channel width [factored]
are used to calculate the surface area for each Irrigation District.
□ The Kyabram Dairy Centre site evaporation data was used for all Irrigation
Districts as it was considered to be the most reliable and to best represent
evaporation conditions equivalent to channel water surfaces. There was some
discussion of the need to include a pan factor to better equate to channels,
however no evidence was provided to justify modifying the pan factor from 1.0.
□ The evaporation figure of 3.78mm for 2004/05 was calculated based on a
relatively good set of data and was rounded to 4mm. The use of a rounded
figure of 4mm inflates the resulting evaporation losses by over 10%.
□ It was noted that the NVIRP Spreadsheet used the figure of 3.78mm.
13 # 2029252, # 2477220, #247951 sharp coefficient pty ltd
Page 16 of 46
Northern Victorian Irrigation Renewal Project Baseline Audit
C O M M E R C I A L – I N C O N F I D E N C E
□ In discussion with the Manager Geomatics at GMW the Auditor was advised
that channel lengths recorded on Asset Life are based on historic records. Only
comparatively recently the GIS has been used to measure channel lengths
from aerial photography. This process is only partially completed and is subject
to future funding and resource availability. The Auditor was further advised
that the areas that had been checked using GIS had identified that channel
lengths in Asset Life differ from the GIS by up to +/ 2030% in the Shepparton
Irrigation District. Asset life channel lengths are generally based on historic
design information. It was advised that the lengths in Asset Life have been
found to be shorter than the lengths from the GIS. At the time of the Audit little
of the GIS revised channel data had been verified and uploaded to Asset Life.
□ As noted in Parameter 3 Seepage Losses above, it is considered that the
adjustment coefficient of 120% for channel width is not based on adequate
research and should be accurately established for each Irrigation District.
□ Where channels remain full after the end of the irrigation season the
evaporation should be calculated based on the actual period that the
channel contains water.
Recommendations
1. Evaporation for the Kyabram Dairy Centre should continue to be used for all
Irrigation Districts, until suitably robust data is available for a site within each
Irrigation District.
2. The practices for calculating the gross and net evaporation should be
documented.
3. The figure of 3.78mm should be used for the 2004/05 season
4. Channel lengths should be based on the GIS aerial photography lengths, where
available, following verification and uploading to Asset Life.
5. GMW should document which GIS channel lengths are loaded on Asset Life.
5 RAINFALL DATA
Description
Rainfall Data from the BOM Kyabram Dairy Centre is used for all Irrigation Districts. This
is to enable correlation with the evaporation records from the same site.
Comments
□ As BOM rainfall records are considered highly reliable and are available for
many areas in the state, a more accurate approach to calculating net
evaporation losses would be to use a representative rainfall station in each
Irrigation District in combination with the Kyabram evaporation figures. This
approach would provide a more accurate estimate of temporal rainfall
implications.
sharp coefficient pty ltd
Page 17 of 46
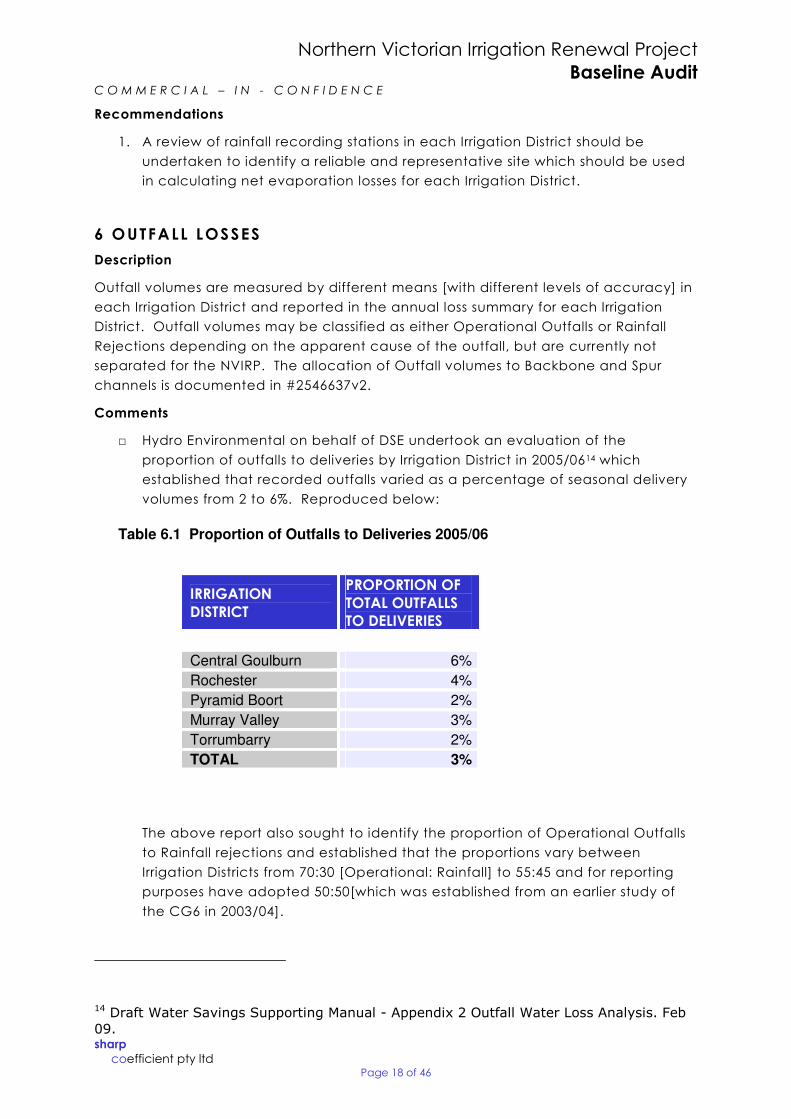
Northern Victorian Irrigation Renewal Project Baseline Audit
C O M M E R C I A L – I N C O N F I D E N C E
Recommendations
1. A review of rainfall recording stations in each Irrigation District should be
undertaken to identify a reliable and representative site which should be used
in calculating net evaporation losses for each Irrigation District.
6 OUTFALL LOSSES
Description
Outfall volumes are measured by different means [with different levels of accuracy] in
each Irrigation District and reported in the annual loss summary for each Irrigation
District. Outfall volumes may be classified as either Operational Outfalls or Rainfall
Rejections depending on the apparent cause of the outfall, but are currently not
separated for the NVIRP. The allocation of Outfall volumes to Backbone and Spur
channels is documented in #2546637v2.
Comments
□ Hydro Environmental on behalf of DSE undertook an evaluation of the
proportion of outfalls to deliveries by Irrigation District in 2005/0614 which
established that recorded outfalls varied as a percentage of seasonal delivery
volumes from 2 to 6%. Reproduced below:
Table 6.1 Proportion of Outfalls to Deliveries 2005/06
IRRIGATION DISTRICT
PROPORTION OF TOTAL OUTFALLS TO DELIVERIES
Central Goulburn 6%
Rochester 4%
Pyramid Boort 2%
Murray Valley 3%
Torrumbarry 2%
TOTAL 3%
The above report also sought to identify the proportion of Operational Outfalls
to Rainfall rejections and established that the proportions vary between
Irrigation Districts from 70:30 [Operational: Rainfall] to 55:45 and for reporting
purposes have adopted 50:50[which was established from an earlier study of
the CG6 in 2003/04].
14 Draft Water Savings Supporting Manual Appendix 2 Outfall Water Loss Analysis. Feb 09. sharp coefficient pty ltd
Page 18 of 46
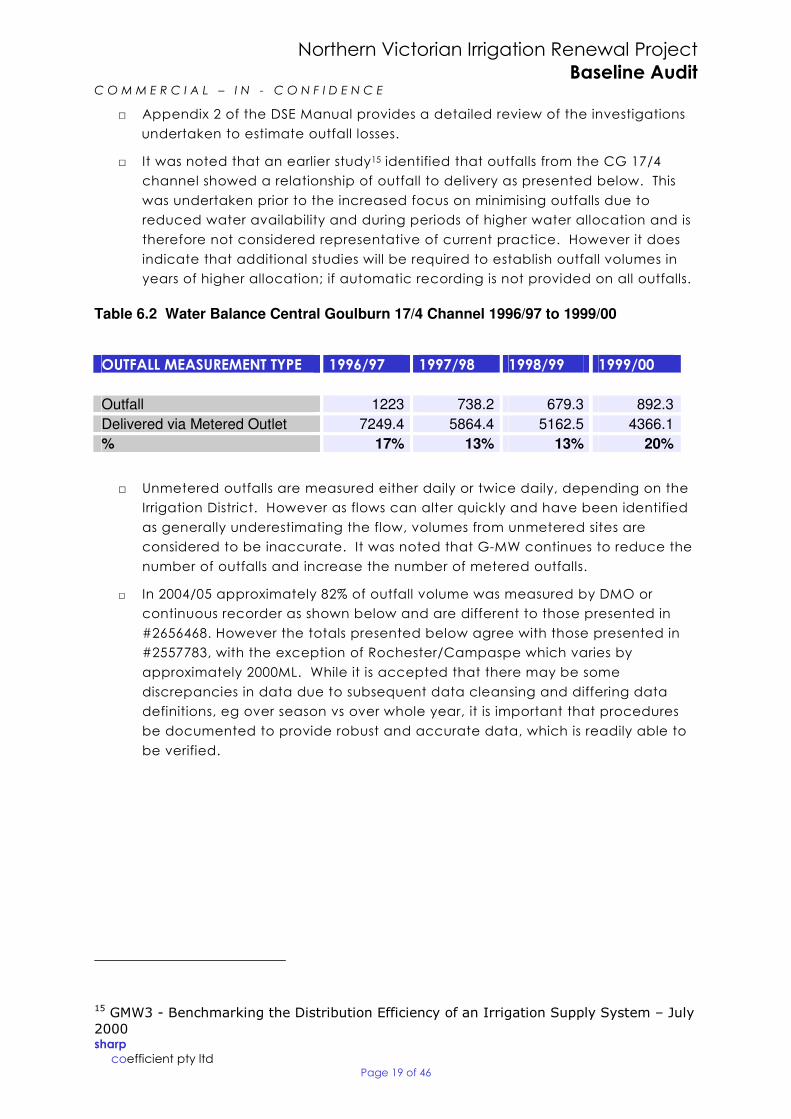
Northern Victorian Irrigation Renewal Project Baseline Audit
C O M M E R C I A L – I N C O N F I D E N C E
□ Appendix 2 of the DSE Manual provides a detailed review of the investigations
undertaken to estimate outfall losses.
□ It was noted that an earlier study15 identified that outfalls from the CG 17/4
channel showed a relationship of outfall to delivery as presented below. This
was undertaken prior to the increased focus on minimising outfalls due to
reduced water availability and during periods of higher water allocation and is
therefore not considered representative of current practice. However it does
indicate that additional studies will be required to establish outfall volumes in
years of higher allocation; if automatic recording is not provided on all outfalls.
Table 6.2 Water Balance Central Goulburn 17/4 Channel 1996/97 to 1999/00
OUTFALL MEASUREMENT TYPE 1996/97 1997/98 1998/99 1999/00
Outfall 1223 738.2 679.3 892.3
Delivered via Metered Outlet 7249.4 5864.4 5162.5 4366.1
% 17% 13% 13% 20%
□ Unmetered outfalls are measured either daily or twice daily, depending on the
Irrigation District. However as flows can alter quickly and have been identified
as generally underestimating the flow, volumes from unmetered sites are
considered to be inaccurate. It was noted that GMW continues to reduce the
number of outfalls and increase the number of metered outfalls.
□ In 2004/05 approximately 82% of outfall volume was measured by DMO or
continuous recorder as shown below and are different to those presented in
#2656468. However the totals presented below agree with those presented in
#2557783, with the exception of Rochester/Campaspe which varies by
approximately 2000ML. While it is accepted that there may be some
discrepancies in data due to subsequent data cleansing and differing data
definitions, eg over season vs over whole year, it is important that procedures
be documented to provide robust and accurate data, which is readily able to
be verified.
15 GMW3 Benchmarking the Distribution Efficiency of an Irrigation Supply System – July 2000 sharp coefficient pty ltd
Page 19 of 46
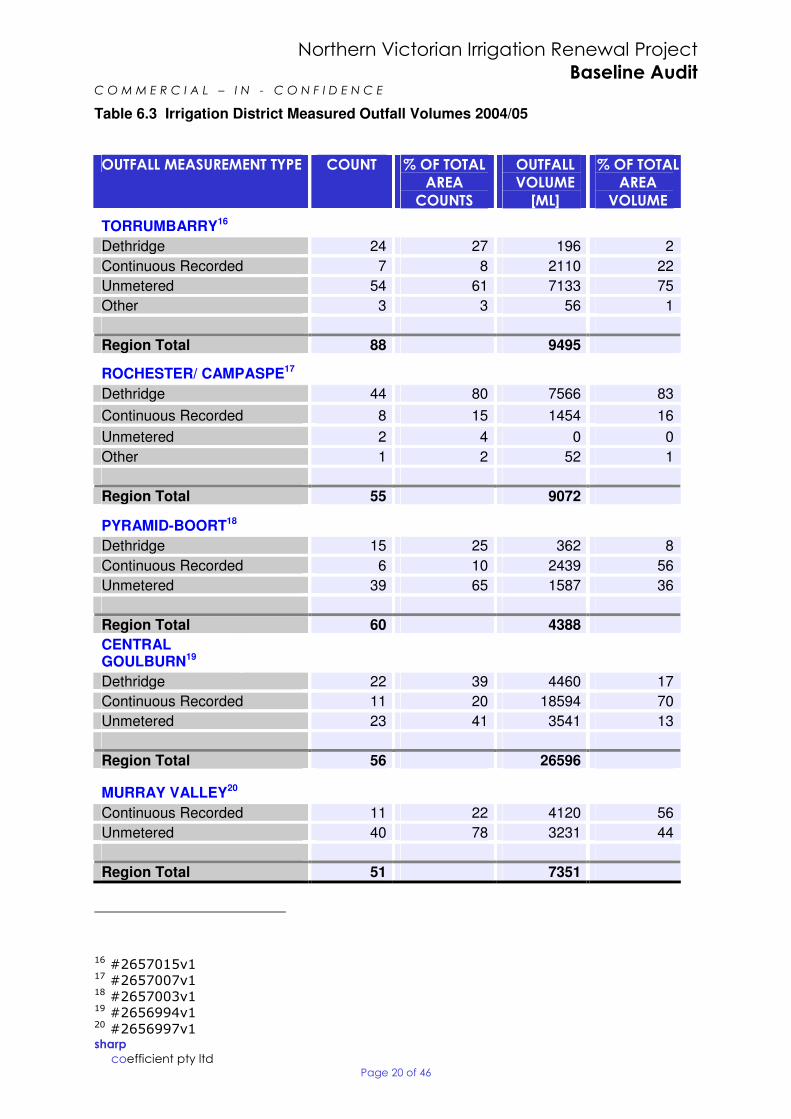
Northern Victorian Irrigation Renewal Project Baseline Audit
C O M M E R C I A L – I N C O N F I D E N C E
Table 6.3 Irrigation District Measured Outfall Volumes 2004/05
OUTFALL MEASUREMENT TYPE COUNT % OF TOTAL AREA
COUNTS
OUTFALL VOLUME [ML]
% OF TOTAL AREA
VOLUME
TORRUMBARRY16
Dethridge 24 27 196 2
Continuous Recorded 7 8 2110 22
Unmetered 54 61 7133 75
Other 3 3 56 1
Region Total 88 9495
ROCHESTER/ CAMPASPE17
Dethridge 44 80 7566 83
Continuous Recorded 8 15 1454 16
Unmetered 2 4 0 0
Other 1 2 52 1
Region Total 55 9072
PYRAMID-BOORT18
Dethridge 15 25 362 8
Continuous Recorded 6 10 2439 56
Unmetered 39 65 1587 36
Region Total 60 4388
CENTRAL GOULBURN19
Dethridge 22 39 4460 17
Continuous Recorded 11 20 18594 70
Unmetered 23 41 3541 13
Region Total 56 26596
MURRAY VALLEY20
Continuous Recorded 11 22 4120 56
Unmetered 40 78 3231 44
Region Total 51 7351
16 #2657015v1 17 #2657007v1 18 #2657003v1 19 #2656994v1 20 #2656997v1 sharp coefficient pty ltd
Page 20 of 46
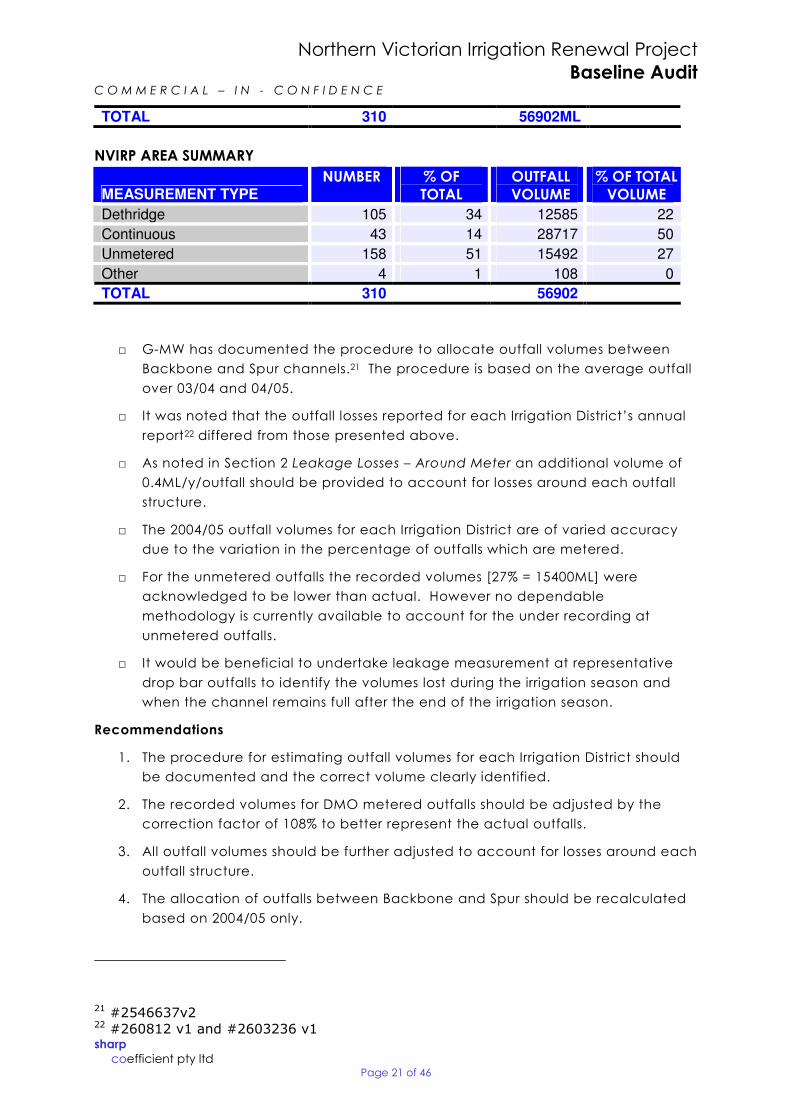
Northern Victorian Irrigation Renewal Project Baseline Audit
C O M M E R C I A L – I N C O N F I D E N C E
TOTAL 310 56902ML
NVIRP AREA SUMMARY
MEASUREMENT TYPE NUMBER % OF
TOTAL OUTFALL VOLUME
% OF TOTAL VOLUME
Dethridge 105 34 12585 22
Continuous 43 14 28717 50
Unmetered 158 51 15492 27
Other 4 1 108 0
TOTAL 310 56902
□ GMW has documented the procedure to allocate outfall volumes between
Backbone and Spur channels.21 The procedure is based on the average outfall
over 03/04 and 04/05.
□ It was noted that the outfall losses reported for each Irrigation District’s annual
report22 differed from those presented above.
□ As noted in Section 2 Leakage Losses – Around Meter an additional volume of
0.4ML/y/outfall should be provided to account for losses around each outfall
structure.
□ The 2004/05 outfall volumes for each Irrigation District are of varied accuracy
due to the variation in the percentage of outfalls which are metered.
□ For the unmetered outfalls the recorded volumes [27% = 15400ML] were
acknowledged to be lower than actual. However no dependable
methodology is currently available to account for the under recording at
unmetered outfalls.
□ It would be beneficial to undertake leakage measurement at representative
drop bar outfalls to identify the volumes lost during the irrigation season and
when the channel remains full after the end of the irrigation season.
Recommendations
1. The procedure for estimating outfall volumes for each Irrigation District should
be documented and the correct volume clearly identified.
2. The recorded volumes for DMO metered outfalls should be adjusted by the
correction factor of 108% to better represent the actual outfalls.
3. All outfall volumes should be further adjusted to account for losses around each
outfall structure.
4. The allocation of outfalls between Backbone and Spur should be recalculated
based on 2004/05 only.
21 #2546637v2 22 #260812 v1 and #2603236 v1 sharp coefficient pty ltd
Page 21 of 46
Northern Victorian Irrigation Renewal Project Baseline Audit
C O M M E R C I A L – I N C O N F I D E N C E
5. The ongoing rationalisation and metering of outfalls by GMW should continue
until all outfalls are metered.
6. Undertake leakage measurement at representative drop bar [and other
unmetered] outfalls to more accurately identify the volumes lost through the
outfalls; during and after the end of irrigation season.
7 SYSTEM F I LL ING LOSSES
Description
System Filling volume is defined to be “the difference between system inflows and
deliveries during the fill period and during the season close”23. This fill volume is
assumed to be allocated in the subsequent ‘winter’ period as leakage: seepage:
evaporation [20%:40%:40%] and has therefore not been included as a discrete figure
in the Water Balance.
Comments
□ There appears to be no technical basis for the ratios used to allocate fill volume
losses between leakage, seepage and evaporation.
□ The definition makes no allowance for water discharged [drained] from outfalls
or used for irrigation or retained for water supply. The Auditor was advised that
water ‘drained’ was included in the calculation of System Fill.
□ GMW has advised that in recent years the water remaining in the channels has
not been drained, except where there is a productive use, eg dam fill, late
irrigation, etc. It is not known if this approach was adopted in the Baseline year.
This approach results in other maintenance issues [weed growth, algae, bank
damage, etc] and may further alter the ratios of leakage, seepage and
evaporation. The volume required to top up the channel at the next season
could potentially be used to gain further understanding of the outofseason
losses.
Recommendations
1. System fill should be the difference between system inflows and deliveries
during the fill period and drainage during season close.
2. System Fill should be recorded for each Irrigation District.
3. Depending on how/if the channel is emptied at the end of the irrigation season
the allocation of water to various losses will vary. At the completion of each
irrigation season the approach to be adopted for each Irrigation District should
be set and volumes estimated and documented as part of the Water Balance
for the Area.
23 #2477220 sharp coefficient pty ltd
Page 22 of 46
Northern Victorian Irrigation Renewal Project Baseline Audit
C O M M E R C I A L – I N C O N F I D E N C E
8 BULK DIVERSIONS
Description
Bulk diversions are measured in two ways at regulator structures at the boundary of
each Irrigation District24. ‘Operational Flows’ are used for the daily operational
requirements while ‘Hydrographic Flows’ are used for reporting purposes. The
Hydrographic Flows are automatically recorded under contract by Thiess
Environmental Services. The Auditor was advised that these are typically knife edge or
Parshall flume and are calibrated by Thiess to provide accurate measurement. The
exception to this is the Campaspe Irrigation District which has ongoing issues with
accurate measurement.
Comments
□ The Auditor was advised that check measurements of major diversion sites were
undertaken by Thiess Environmental services, however examples of this
information were not provided for the Audit.
□ The Auditor was advised that GMW recognised the need for improved
accuracy of Bulk diversion measurement some years back and the Strategic
Measurement Program [SMP] was implemented in 2006 2008, which involved
the upgrade and automation of the majority of bulk diversion points.
□ Any inaccuracies in flow measurement at the bulk diversion points will have
significant impact on the flow balance for the Irrigation District.
□ It was noted in #2610441v1 that the discrepancy in the flow for the Campaspe
Irrigation District was likely to be due to measurement errors at the District
offtake. In the same report it was noted that a 10% error in measurement at the
offtakes for the NVIRP irrigation region would result in a flow discrepancy of
30GL.
□ Inaccuracies in flow measurement at various offtake points were noted during
the audit. eg #2477220 in Appendix 4 discusses the difficulties associated with
accurate flow measurement at the boundaries and in particular at the 95 km
Regulator, which affects both the Rochester and PyramidBoort Irrigation
Districts. The Auditor was advised that GMW is proposing to combine the
Rochester and Pyramid –Boort areas as one Irrigation District to assist in
improving the accuracy of Bulk Diversion reporting. For 2004/05 a number of
assumptions were required to achieve the water balance; for which there was
little justification.
□ #2244076v1 provided a review of the bulk diversion measurement for
Campaspe. However it was noted that while there were inaccuracies in the
older meters the staff did not accept measurements from the recently installed
ultrasonic meter for a variety of technical and operational reasons. While
improvements have been identified to improve the accuracy of measurement,
the works have not been undertaken.
24 #2684998 sharp coefficient pty ltd
Page 23 of 46
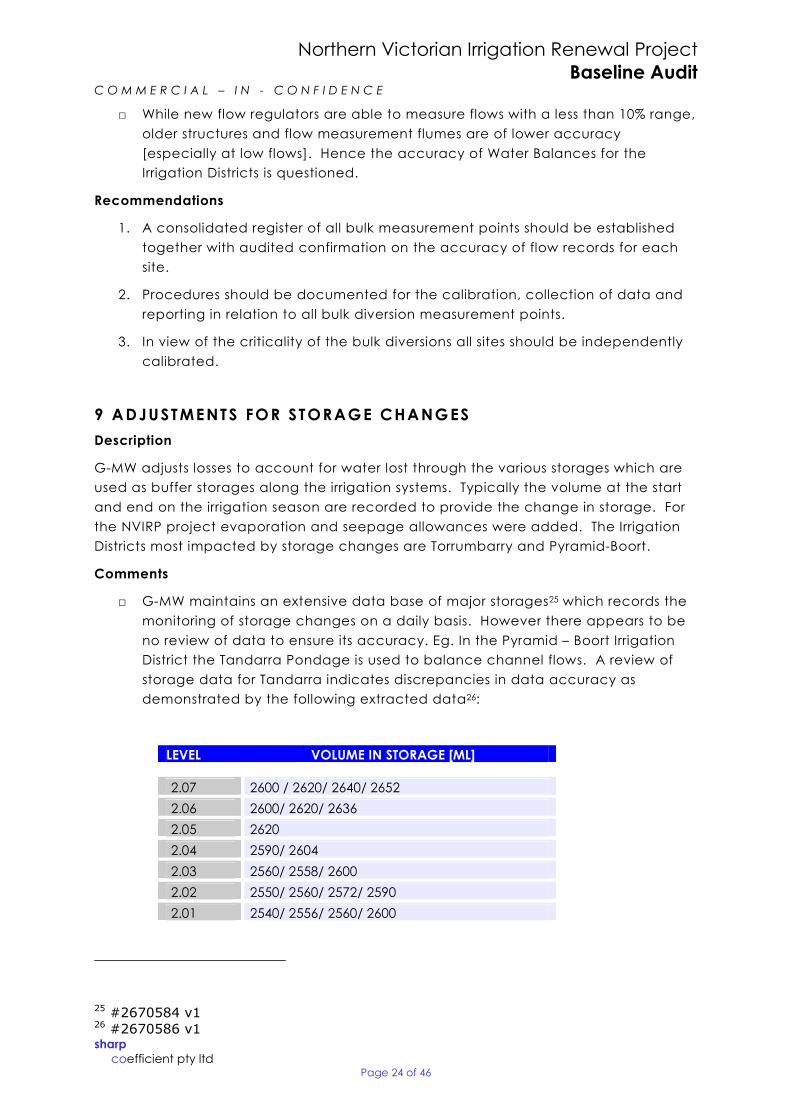
Northern Victorian Irrigation Renewal Project Baseline Audit
C O M M E R C I A L – I N C O N F I D E N C E
□ While new flow regulators are able to measure flows with a less than 10% range,
older structures and flow measurement flumes are of lower accuracy
[especially at low flows]. Hence the accuracy of Water Balances for the
Irrigation Districts is questioned.
Recommendations
1. A consolidated register of all bulk measurement points should be established
together with audited confirmation on the accuracy of flow records for each
site.
2. Procedures should be documented for the calibration, collection of data and
reporting in relation to all bulk diversion measurement points.
3. In view of the criticality of the bulk diversions all sites should be independently
calibrated.
9 ADJUSTMENTS FOR STORAGE CHANGES
Description
GMW adjusts losses to account for water lost through the various storages which are
used as buffer storages along the irrigation systems. Typically the volume at the start
and end on the irrigation season are recorded to provide the change in storage. For
the NVIRP project evaporation and seepage allowances were added. The Irrigation
Districts most impacted by storage changes are Torrumbarry and PyramidBoort.
Comments
□ GMW maintains an extensive data base of major storages25 which records the
monitoring of storage changes on a daily basis. However there appears to be
no review of data to ensure its accuracy. Eg. In the Pyramid – Boort Irrigation
District the Tandarra Pondage is used to balance channel flows. A review of
storage data for Tandarra indicates discrepancies in data accuracy as
demonstrated by the following extracted data26:
LEVEL VOLUME IN STORAGE [ML]
2.07 2600 / 2620/ 2640/ 2652
2.06 2600/ 2620/ 2636
2.05 2620
2.04 2590/ 2604
2.03 2560/ 2558/ 2600
2.02 2550/ 2560/ 2572/ 2590
2.01 2540/ 2556/ 2560/ 2600
25 #2670584 v1 26 #2670586 v1 sharp coefficient pty ltd
Page 24 of 46
Northern Victorian Irrigation Renewal Project Baseline Audit
C O M M E R C I A L – I N C O N F I D E N C E
Similar discrepancies were noted in other storage data. It would appear that
data cleansing and review has not been undertaken.
□ The Tandarra Pondage has cut off bores which discharge into the Pyramid No.1
Channel however no allowance is made for seepage. The Auditor was advised
that for the last 4 years the bores have been turned off as the ground water
level has dropped below the bores. The Auditor surmises that if the ground
water level has dropped and the bores are turned off it is reasonable to assume
that there are deep seepage losses from the Pondage which are not being
intercepted by the cut off bores. The fact that seepage is not being registered
at the bores could indicate highly permeable soils under the storage and a
high likelihood of seepage. GMW advised that the seepage volume would be
small [approximately 10ML/yr] and therefore not significant27.
□ Reviewing the level data28 for the Tandarra Pondage and the season start and
end date29 a volume difference of 1036ML was calculated. If evaporation from
the 1km square surface area and seepage is added then the total loss will
differ significantly from the figure of 47 ML for level change and evaporation
provided in #2477220 Appendix 5.
□ For the Torrumbarry Irrigation District there are a number of storages. The
Auditor was unable to identify how the storage changes were calculated,
especially the evaporation and seepage rates.
□ #1991385 v1 provides an important insight into the difficulties associated with
the accurate measurement and control of the Waranga Western Channel and
associated Tandarra pondage. It also contains a number of recommendations
for improving the control, accuracy and operation of the bulk supply to the
Pyramid Boort and Rochester Irrigation Districts.
Recommendations
1. The practices for calculating all storage changes should be documented,
reviewed and the Storage Changes recalculated for all storages.
2. The actual duration of the irrigation season should be used to calculate losses
from all storages and natural carriers.
3. In view of the considerably lowered water table in the vicinity of the Tandarra
Pondage GMW should include Seepage losses.
4. Improvements are required in the control and measurement of flows along the
Waranga Western Channel and in the configuration and operation of the
Tandarra pondage
27 Pers Cons from D Poulton 28 #2670584 v1 29 #2656547 v1 sharp coefficient pty ltd
Page 25 of 46
Northern Victorian Irrigation Renewal Project Baseline Audit
C O M M E R C I A L – I N C O N F I D E N C E
10 ENVIRONMENTAL PASS ING FLOWS
Description
GMW provides Environmental Passing Flows on behalf of the DSE to various wetlands
and waterways, from the irrigation systems.
Comments
□ The Environmental Passing Flow estimates appear to be of low reliability and
the procedure for estimating them is not documented. e.g. In #2673436 it is
stated that flows to Johnston and Hirds Swamps are measured each few
months as a daily point measurement of depth via an open outlet to provide a
volume. However Mr Derek Poulton of GMW advised that recordings are taken
daily. While flow variation from a swamp/ pondage will vary more slowly than
from a channel, ‘stick’ read volumes are considered to be unreliable whether
they are taken daily or several months apart.
□ It was noted that #2603236 in the section entitled “E Urban Bulk Supplies”
provides volumes for ‘DSE Environmental Entitlement and ‘DSE Environmental
Usage’ for the Torrumbarry and Central Goulburn Irrigation Districts. However
there is no description of what the volumes related to or how they are derived.
The Auditor was advised that these figures are the accumulation of deliveries at
various locations.
□ The Auditor was unable to verify the Environmental Passing Flows for the
Baseline Year.
□ No other information was provided in relation to other Environmental Passing
Flows.
□ A potential conflict of title was raised by GMW in relation to ‘Passing Flows’ as
this is used by GMW for a different purpose. A more appropriate title would be
Environmental Deliveries. This would also appear to be a more relevant title for
use in publication.
Recommendations
1. Environmental Passing Flows be re titled as Environmental Deliveries
2. The locations of all Environmental Passing Flow points should be documented.
3. The practices used to estimate/measure Environmental Passing Flows should be
documented
4. Accurate continuous flow measurement should be provided at all discharge
points for Environmental Passing Flows.
11 NATURAL CARRIER LOSSES
Description
Natural carriers are used to transfer water within some Irrigation Districts [Pyramid –
Boort, Murray Valley and Torrumbarry].
sharp coefficient pty ltd
Page 26 of 46
Northern Victorian Irrigation Renewal Project Baseline Audit
C O M M E R C I A L – I N C O N F I D E N C E
Comments
□ GMW has provided estimates of the losses in carriers but due to the
considerable uncertainties related to flow measurement, evaporation and
seepage the estimates can be considered as approximations only. It would be
difficult to provide accurate estimates.
□ The provision of automatic continuous measurement on all outfalls and inlets
from the carriers would assist in improving the accuracy of system flows.
However it would not improve the accuracy of individual losses in the carrier
and the provision of accurate measurement in the carriers would be expensive
to install.
□ #2477220 Appendix 5 provides notes on the assumptions made in undertaking
the NVIRP calculations. No justification is provided for the assumption that
seepage and leakage values are low. The Auditor identified some concerns in
relation to the assumptions:
Pyramid Boort
□ Serpentine Creek Losses30 have been assessed by the local Irrigation
District as 34 ML/d which equates to 0.9GL/yr, however no detailed
data was provided to support this figure.
Murray Valley
□ A balance for losses in the Broken Creek is required to allow the balance
of the Irrigation District but does not impact the loss management data,
so no loss estimates were undertaken; only measured flows were
recorded. However no estimate is available of the accuracy of the flow
measurement. The methods of measurement should be documented
and the relevant error adjustments made to obtain a more accurate
estimate.
Torrumbarry
□ There are a number of natural carriers and storages in this Irrigation
District. Estimates have been provided for evaporation and seepage,
from storages however no justification of the volumes was provided.
□ No estimates were provided for the natural carriers. However the
Auditor was advised that investigations into losses are currently
underway in this area
□ The volume changes provided in #2477220 Appendix 5 were not able
to be verified.
Recommendations
1. GMW should document the practice for calculating this parameter for
each of the natural carriers [and storages].
30 #2670501v1 sharp coefficient pty ltd
Page 27 of 46
Northern Victorian Irrigation Renewal Project Baseline Audit
C O M M E R C I A L – I N C O N F I D E N C E
2. Losses should be based on the actual number of days for the irrigation
season rather than the adopted 270 days.
3. EM 31 measurements or Soil classifications should be prepared for all
natural carriers and the seepage losses recalculated where appropriate.
4. All inlets and outlets to carriers should be provided with automatic flow
measurement facilities.
5. Where appropriate, consideration should be given to the construction of
automatic flow recording stations on the natural carriers.
12 METERED DEL IVERIES TO CUSTOMERS
Description
The vast majority of metered deliveries to customers in 2004/05 were via Dethridge
meters. GMW maintains records of all meter Service Points on the Asset Life data base
and records water deliveries on the Irrigation Planning Module [IPM] data base.
Relevant data has been extracted from the data bases to populate the NVIRP Excel
spreadsheet31.
Comments
□ There appeared to be some discrepancies between the number of meters on
the Asset Life data base and the number of delivery points on the IPM data
base. The Auditor was advised that this was possibly due to some properties
having multiple DMO’s and some DMO’s serving multiple properties.
□ In reviewing different documents as part of the audit it was noted that there
were discrepancies in the number of meters quoted and the volume delivered.
It is anticipated that this may have been due to modifications of the ‘NVIRP
area’
□ The Auditor was advised that access to the data bases is restricted and
appropriate controls are in place to maintain the voracity of the data.
However there are no procedures documented which establish the practices
to be followed in relation to data management and control for the IPM and
Asset Life data bases, or the NVIRP data base/spread sheets.
□ Considerable research and testing has been undertaken into the accuracy of
delivery of individual DMO’s32. The likely range of meter error is between 5.5%
and 10% with a median value of 86%. This figure has been adopted for the
calculation of the savings associated with the replacement of DMO’s.
31 #090414 32 #2627553 sharp coefficient pty ltd
Page 28 of 46
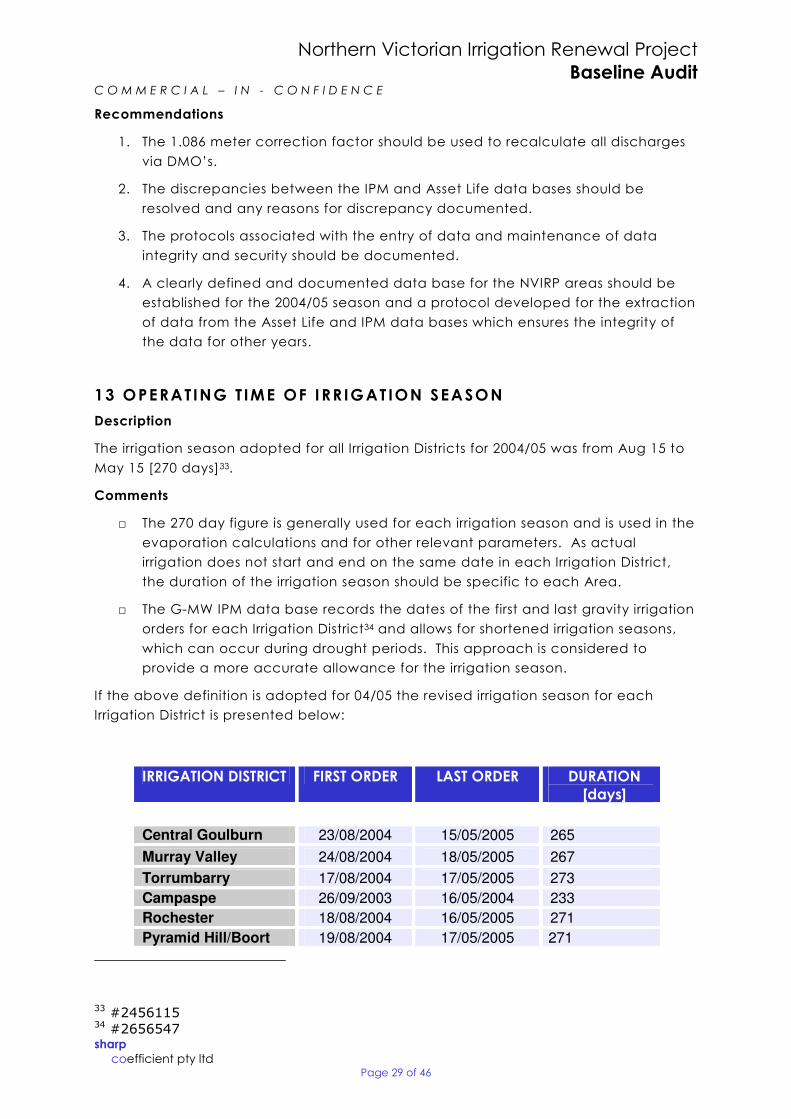
Northern Victorian Irrigation Renewal Project Baseline Audit
C O M M E R C I A L – I N C O N F I D E N C E
Recommendations
1. The 1.086 meter correction factor should be used to recalculate all discharges
via DMO’s.
2. The discrepancies between the IPM and Asset Life data bases should be
resolved and any reasons for discrepancy documented.
3. The protocols associated with the entry of data and maintenance of data
integrity and security should be documented.
4. A clearly defined and documented data base for the NVIRP areas should be
established for the 2004/05 season and a protocol developed for the extraction
of data from the Asset Life and IPM data bases which ensures the integrity of
the data for other years.
13 OPERATING T IME OF I RR IGAT ION SEASON
Description
The irrigation season adopted for all Irrigation Districts for 2004/05 was from Aug 15 to
May 15 [270 days]33.
Comments
□ The 270 day figure is generally used for each irrigation season and is used in the
evaporation calculations and for other relevant parameters. As actual
irrigation does not start and end on the same date in each Irrigation District,
the duration of the irrigation season should be specific to each Area.
□ The GMW IPM data base records the dates of the first and last gravity irrigation
orders for each Irrigation District34 and allows for shortened irrigation seasons,
which can occur during drought periods. This approach is considered to
provide a more accurate allowance for the irrigation season.
If the above definition is adopted for 04/05 the revised irrigation season for each
Irrigation District is presented below:
IRRIGATION DISTRICT FIRST ORDER LAST ORDER DURATION [days]
Central Goulburn 23/08/2004 15/05/2005 265
Murray Valley 24/08/2004 18/05/2005 267
Torrumbarry 17/08/2004 17/05/2005 273
Campaspe 26/09/2003 16/05/2004 233
Rochester 18/08/2004 16/05/2005 271
Pyramid Hill/Boort 19/08/2004 17/05/2005 271
33 #2456115 34 #2656547 sharp coefficient pty ltd
Page 29 of 46
Northern Victorian Irrigation Renewal Project Baseline Audit
C O M M E R C I A L – I N C O N F I D E N C E
Recommendations
1. The irrigation season for each Irrigation District should be defined as the
number of days between the first and last order dates for the gravity irrigation
system, from the IPM data base.
2. All parameters which use ‘season’ [270 days] should be modified prorata.
14 THEFT EST IMATES
Description
The Auditor was initially advised that theft volume is based on the volume associated
with successful prosecution against irrigators35. However it was established that
volume figures are not available for successful prosecutions and a figure provided by
each Irrigation District had been adopted. During the Audit the definition was revised
to be Unauthorised Use and a volume of 0.9ML/year/DMO was adopted.
Comments
□ Based on observation and advice from GMW staff, it is accepted that theft of
water comprises much more than the volumes associated with prosecutions.
□ No justification was provided for the volumes lost due to theft as estimated by
the Irrigation Districts.
□ In Parameter 2 Leakage Losses – through Meter, the 1.9 ML did not include the
volume of ‘cracked’ doors [The door is not properly closed and is leaking at a
significant rate. Eg > 20KL/hr].
□ Based on observation and advice from GMW staff it is accepted that some
DMO doors are ‘cracked’ to allow ‘unauthorised’ flow which is not measured
by the meter. This ‘Unauthorised flow’ has also been identified in studies36 while
investigating leakage. It is considered that leakage rates in excess of 10KL/hr
are not the result of leakage37. However other studies and the DSE have
adopted flows >20KL/hr as Unauthorised flow.
□ There is no allowance currently made in the Water Balances for Unauthorised
Use through cracked doors despite the occurrence being noted in several
studies observed by GMW staff and others and included in the DSE Water
Saving Protocol. This issue was raised with GMW who prepared #2659828v3
which summarised various of the earlier studies. The review did not consider a
check review of the CG1234 to confirm the leakage rates through repaired
doors38. As part of this review Unauthorised Use was identified to equate to
33.5GL across the GMID[This equates to approximately 29GL for the NVIRP
Irrigation District]
35 #2477220 36 #1943471v2 37 #2667664v1 38 #2667664v1 sharp coefficient pty ltd
Page 30 of 46

Northern Victorian Irrigation Renewal Project Baseline Audit
C O M M E R C I A L – I N C O N F I D E N C E
□ Report #900407v2 identified that approximately 2% of 188 DMO’s over two
seasons had leakage rates in excess of 4KL/hr and that “in a small number of
cases doors are thought to be deliberately not completely closed to gain some
water.” Further it was noted that it was different doors that leaked each
season. This same report notes that an option to reduce leakage is to
“…modify the existing door so that the door is closed positively.”
□ The use of positive closing doors should reduce the unauthorised losses volume.
Additional investigation would be required to establish the size of the reduction.
□ As the Unauthorised Use volume will reduce the volume required to balance
the Water Balance and hence the volume associated with Unallocated Losses
the impact of allocating 0.9ML/outlet/season to Unauthorized Use needs to
evaluated.
Recommendations
1. While accounting for Theft is appropriate the use of ‘unpaid for water’ is
considered to be more widespread and of higher significance than successful
prosecutions for theft or Irrigation District estimates. It is therefore
recommended that GMW account for ‘Unauthorised Use’, in lieu of Theft.
2. It is recommended that a figure of 0.9 ML/year/DMO outlet be used to account
for Theft and Unauthorized Use, as recommended by the DSE.
3. Further investigation is required to establish the volume of Unauthorised Use
from the new styles of Service Points.
4. The impact of deducting the unauthorized Use volume from the Unallocated
Losses should be evaluated.
15 DEEMED USE
Description
There are a large number of unmetered Service Points which are used for a variety of
purposes from Rural Residential garden watering to Large Dairy water supplies. Since
2003 GMW has been undertaking meter installations and monitoring use from an
increasing number of these Service Points. Summary data is reported each year and
includes information from previous seasons.39 Since 2007 all new SMO’s have been
required to be metered. The deemed volumes attributable to various uses are
documented in “By Law 11 – Computation of Water Supplied”.
Comments
□ A major study into measurement of deemed use supplies40 was undertaken in
2002 which noted an earlier report identifying that approximately 38GL of
water was estimated to be Deemed Use.
39 Temp#2526376v1 40 #2703225 v1 sharp coefficient pty ltd
Page 31 of 46
Northern Victorian Irrigation Renewal Project Baseline Audit
C O M M E R C I A L – I N C O N F I D E N C E
□ There has been an increasing level of monitoring of the Deemed Use supplies
[primarily on the major usage sites] since 2003 which should allow confirmation
of the predictions of Deemed Use volumes. Unfortunately the relevant data
had not been collated or analysed for this audit.
□ All new Service Points are required to be metered41. While measurements in
recent years should reflect the lower usage due to the restricted allocations a
review of actual verses deemed would provide confirmation of the applicability
of the deemed volumes.
□ Due to the drought and reduced irrigation allowances in recent years the
Deemed Use volumes have been reduced as water users have been asked to
reduce their consumption.
Recommendations
1. GMW undertakes an analysis of metering for small pipe Service Points to
identify if any modification is required to the Deemed Use for the various use
types. In the absence of further data the current parameters should be used.
16 ALLOCATION F IGURE USED IN THE BASEL INE YEAR
Description
In order to minimise the potential for inaccuracy when comparing information from
other years to the baseline year, 2004/05 was chosen as the baseline year as the
water allocation was 100%. However for the Campaspe Irrigation District 2004/05 did
not have a 100% allocation so the data for 2003/04 was used, which was a year of
100% allocation.
Comments
□ The years chosen for the base year are post the introduction of a loss
management system by GMW and prior to the introduction of the strategic
outfall measurement program, which relates to the NVIRP project.
17 OVERALL DEL IVERY SHARE F IGURES USED
This parameter is not applicable as Delivery Share was not used in 2004/05. However
the Auditor would like to recommend that GMW review all relevant data and ensure
that procedures and data trails, etc are available for future auditors to be able to
readily confirm the voracity of information presented.
41 #2526376v1 sharp coefficient pty ltd
Page 32 of 46
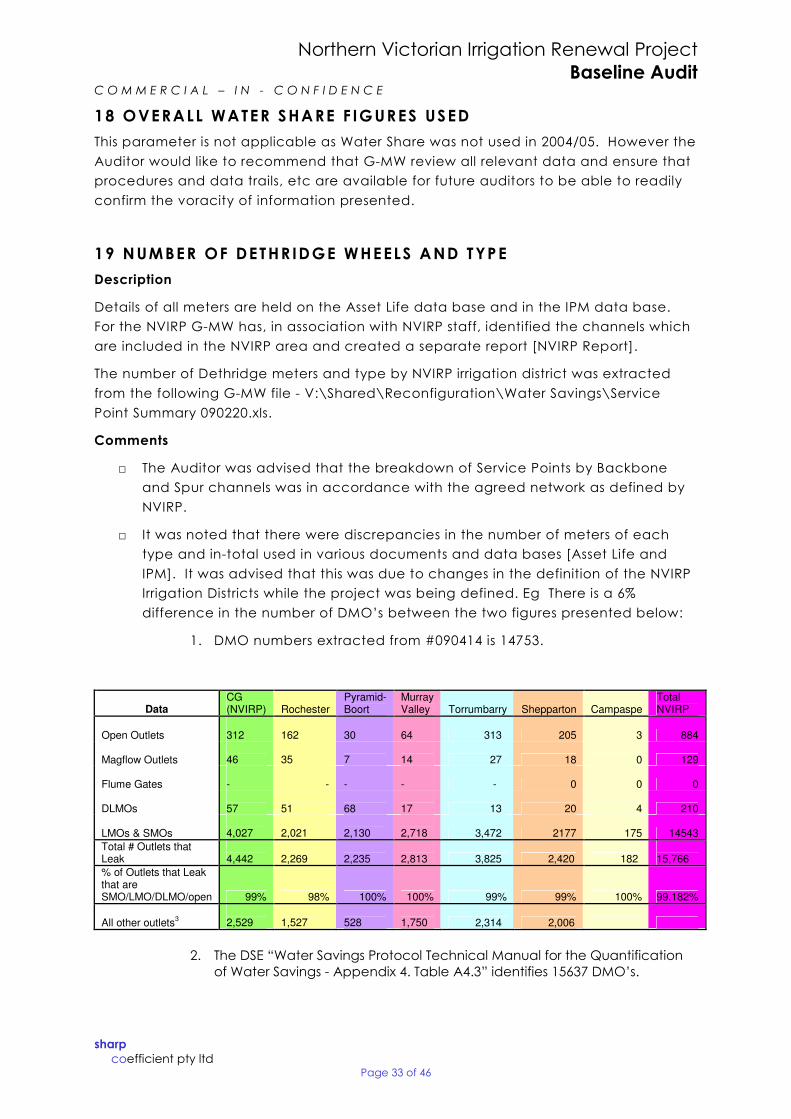
Northern Victorian Irrigation Renewal Project Baseline Audit
C O M M E R C I A L – I N C O N F I D E N C E
18 OVERALL WATER SHARE F IGURES USED
This parameter is not applicable as Water Share was not used in 2004/05. However the
Auditor would like to recommend that GMW review all relevant data and ensure that
procedures and data trails, etc are available for future auditors to be able to readily
confirm the voracity of information presented.
19 NUMBER OF DETHRIDGE WHEELS AND TYPE
Description
Details of all meters are held on the Asset Life data base and in the IPM data base.
For the NVIRP GMW has, in association with NVIRP staff, identified the channels which
are included in the NVIRP area and created a separate report [NVIRP Report].
The number of Dethridge meters and type by NVIRP irrigation district was extracted
from the following GMW file V:\Shared\Reconfiguration\Water Savings\Service
Point Summary 090220.xls.
Comments
□ The Auditor was advised that the breakdown of Service Points by Backbone
and Spur channels was in accordance with the agreed network as defined by
NVIRP.
□ It was noted that there were discrepancies in the number of meters of each
type and intotal used in various documents and data bases [Asset Life and
IPM]. It was advised that this was due to changes in the definition of the NVIRP
Irrigation Districts while the project was being defined. Eg There is a 6%
difference in the number of DMO’s between the two figures presented below:
1. DMO numbers extracted from #090414 is 14753.
Data CG (NVIRP) Rochester
Pyramid-Boort
Murray Valley Torrumbarry Shepparton Campaspe
Total NVIRP
Open Outlets 312 162 30 64 313 205 3 884
Magflow Outlets 46 35 7 14 27 18 0 129
Flume Gates - - - - - 0 0 0
DLMOs 57 51 68 17 13 20 4 210
LMOs & SMOs 4,027 2,021 2,130 2,718 3,472 2177 175 14543
Total # Outlets that Leak 4,442 2,269 2,235 2,813 3,825 2,420 182 15,766
% of Outlets that Leak that are SMO/LMO/DLMO/open 99% 98% 100% 100% 99% 99% 100% 99.182%
All other outlets3 2,529 1,527 528 1,750 2,314 2,006
2. The DSE “Water Savings Protocol Technical Manual for the Quantification of Water Savings Appendix 4. Table A4.3” identifies 15637 DMO’s.
sharp coefficient pty ltd
Page 33 of 46
Northern Victorian Irrigation Renewal Project Baseline Audit
C O M M E R C I A L – I N C O N F I D E N C E
Recommendations
1. Data cleansing and verification should be undertaken for the relevant data
base[s].
2. As recommended in Parameter 12 above a clearly defined and documented
procedure for extracting the relevant information from the data bases should
be established.
20 EST IMATES OF FARM PUMPBACKS
Description
Irrigators are able to apply for a licence to pump excess irrigation water back to the
irrigation channel. Licences are usually granted where there is no access to a
drainage system and if the pump back will not adversely affect the channel system.
Comments
□ Based on feedback from the various Irrigation Districts it appears that there was
little or no pumpback in 2004/05.
□ Pumpback records are not well maintained by GMW.
□ As pumpback volumes are only recorded by GMW when reported by irrigators
and are based on irrigator estimates, little reliability can be attributed to any
figures.
□ As drainage systems are extended and more farms install dams the number of
pump back licence applications is expected to reduce
□ Pumpback volumes are assumed to be negligible in relation to other water
volumes; even during years of high irrigation allowances.
Recommendations
1. The provision of a pumpback licence should require the irrigator to install a
meter on the pump and to report all pumpback volumes on a monthly basis to
GMW.
2. Each Irrigation District should establish and maintain an uptodate register of
all pumpback licences.
3. No volume should be attributed to pumpback for 2004/05.
4. Pumpback volumes should not be included in the Water Balance as the
volumes are predicted to reduce to insignificance in future years.
sharp coefficient pty ltd
Page 34 of 46
Northern Victorian Irrigation Renewal Project Baseline Audit
C O M M E R C I A L – I N C O N F I D E N C E
21 KILOMETRES OF BACKBONE AND SPUR CHANNELS
Description
All details related to the length of channels are maintained on the Asset Life Data
base and are generally based on the design information for the channel. The
allocation between Backbone and Spur channels has been undertaken as a joint
undertaking between GMW and NVIRP staff and is recorded on the GMW Asset Life
data base. GMW is currently updating channel lengths using the GIS and aerial
photography, which will provide more accurate data.
For the baseline year the relative lengths were extracted form the Asset Life data base
and summarised in Table 7 of #090416 v1.
Comments
□ A review of the data42 used to calculate the Seepage Losses indicated that GIS
lengths have been established for all channels with the length ex Asset Life and
GIS varying by less than 0.3% over the whole of the GMID.
□ A detailed review of the channel lengths in the Central Goulburn Irrigation
District43 revealed a variation between the Asset Life length and the GIS length
of less than 0.1%. However it was noted that 14 % had an individual difference
> 10%, 4% had a difference >30% and 0.5% had length differences of greater
than 100%.
□ The auditor noted discrepancies between the channel lengths provided in the
NVIRP spread sheet44 provided by NVIRP and “NVIRP – GMID – Extent of
backbone Final v645
□ The final lengths adopted for the NVIRP project were documented in NVIRP
“Extent of Back bone, Final Draft v.2.” which drew on “NVIRP – GMID Extent of
Backbone. Final v.6”.
□ There is uncertainty within GMW whether the lengths in Asset life are based on
historic records or GIS measured lengths
Recommendations
1. As the respective channels have been established jointly between GMW and
NVIRP it is assumed by the Auditor that they have been checked and are
correct. The lengths as presented in Table 7 of “NVIRP – GMID Extent of
Backbone. Final v.6” should be used.
2. Channel lengths recorded in Asset Life should be updated to GIS lengths as
they become available. Further, any individual discrepancies greater than 10%
should be checked to ensure data integrity before saving on Asset Life.
42 #2264216 43 #267052 44 V2 090414 – HE NVIRP Water Savings Estimate 45 #090416v1 sharp coefficient pty ltd
Page 35 of 46
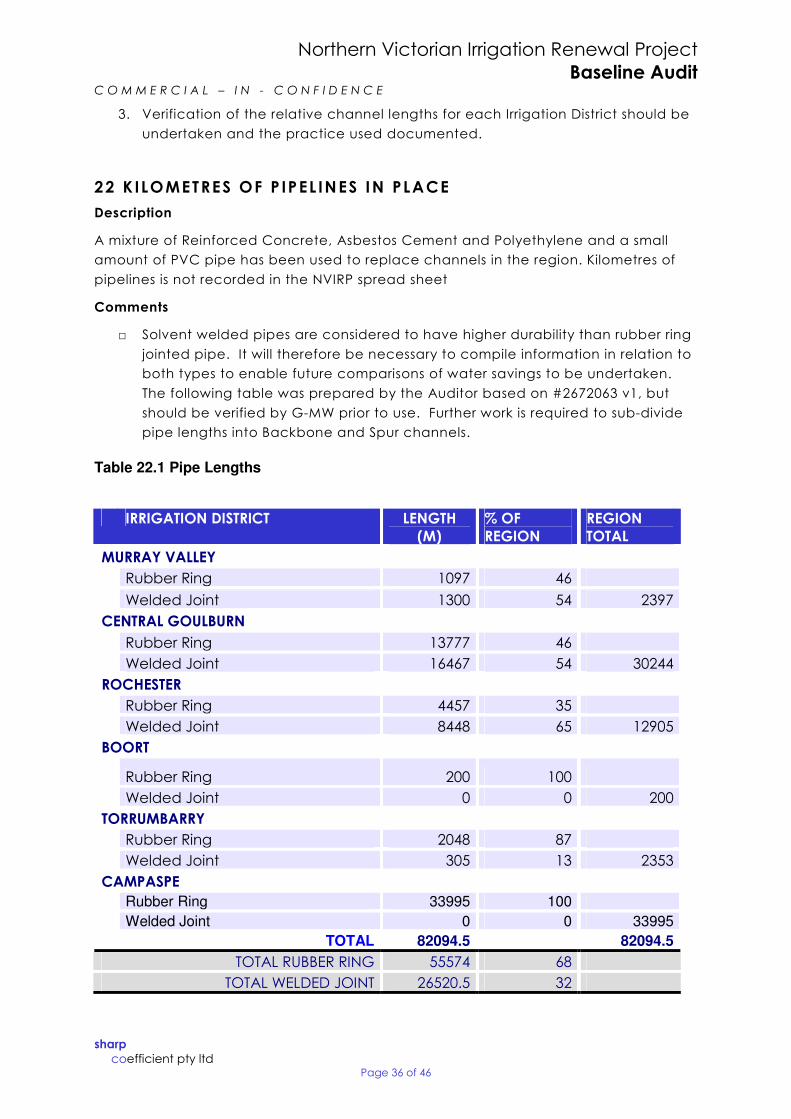
Northern Victorian Irrigation Renewal Project Baseline Audit
C O M M E R C I A L – I N C O N F I D E N C E
3. Verification of the relative channel lengths for each Irrigation District should be
undertaken and the practice used documented.
22 KILOMETRES OF P IPEL INES IN PLACE
Description
A mixture of Reinforced Concrete, Asbestos Cement and Polyethylene and a small
amount of PVC pipe has been used to replace channels in the region. Kilometres of
pipelines is not recorded in the NVIRP spread sheet
Comments
□ Solvent welded pipes are considered to have higher durability than rubber ring
jointed pipe. It will therefore be necessary to compile information in relation to
both types to enable future comparisons of water savings to be undertaken.
The following table was prepared by the Auditor based on #2672063 v1, but
should be verified by GMW prior to use. Further work is required to subdivide
pipe lengths into Backbone and Spur channels.
Table 22.1 Pipe Lengths
IRRIGATION DISTRICT LENGTH (M)
% OF REGION
REGION TOTAL
MURRAY VALLEY
Rubber Ring 1097 46
Welded Joint 1300 54 2397
CENTRAL GOULBURN
Rubber Ring 13777 46
Welded Joint 16467 54 30244
ROCHESTER
Rubber Ring 4457 35
Welded Joint 8448 65 12905
BOORT
Rubber Ring 200 100
Welded Joint 0 0 200
TORRUMBARRY
Rubber Ring 2048 87
Welded Joint 305 13 2353
CAMPASPE Rubber Ring 33995 100
Welded Joint 0 0 33995
TOTAL 82094.5 82094.5
TOTAL RUBBER RING 55574 68
TOTAL WELDED JOINT 26520.5 32
sharp coefficient pty ltd
Page 36 of 46
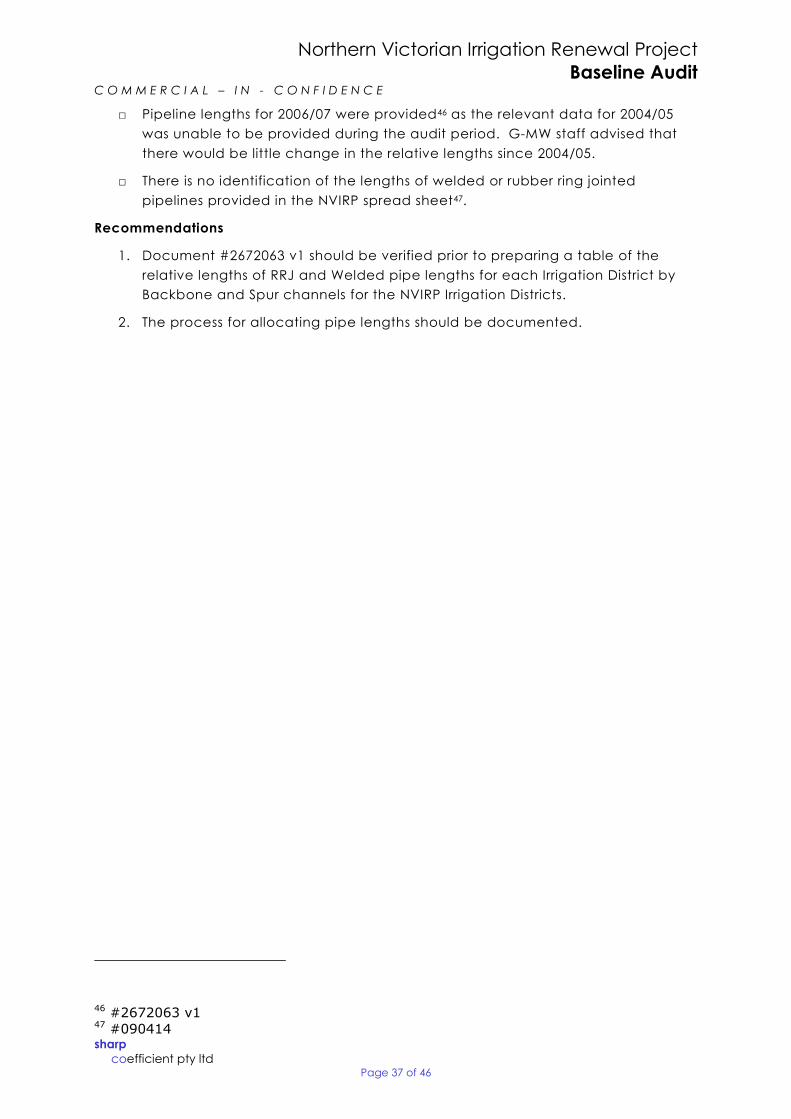
Northern Victorian Irrigation Renewal Project Baseline Audit
C O M M E R C I A L – I N C O N F I D E N C E
□ Pipeline lengths for 2006/07 were provided46 as the relevant data for 2004/05
was unable to be provided during the audit period. GMW staff advised that
there would be little change in the relative lengths since 2004/05.
□ There is no identification of the lengths of welded or rubber ring jointed
pipelines provided in the NVIRP spread sheet47.
Recommendations
1. Document #2672063 v1 should be verified prior to preparing a table of the
relative lengths of RRJ and Welded pipe lengths for each Irrigation District by
Backbone and Spur channels for the NVIRP Irrigation Districts.
2. The process for allocating pipe lengths should be documented.
46 #2672063 v1 47 #090414 sharp coefficient pty ltd
Page 37 of 46
Northern Victorian Irrigation Renewal Project Baseline Audit
C O M M E R C I A L – I N C O N F I D E N C E
WATER BALANCES
Description
GMW in association with NVIRP has developed an Excel based spread sheet for the
NVIRP irrigation region48, which is subdivided by Irrigation District. Much of the data is
extracted from the Asset Life data base and the IPM data base. In addition some
data is extracted from Excel spread sheets which provide a detailed annual review of
the operations of the Irrigation Districts.
Comments
□ The ‘NVIRP spread sheet’ contains much of the base information [which can be
used to calculate savings in subsequent years]. However it was difficult to
locate/relate some of the relevant data and to establish where some of the
information originated.
□ The data for each of the Irrigation Districts appears to be of similar quality, with
the exception of the Campaspe area. The data for Campaspe was based on
the 2003/04 irrigation season as the 2004/05 irrigation season did not have 100%
allocation. It was noted in #2244076v1 that there was some uncertainty in the
total diversion volume accuracy for Campaspe and various assumptions were
made in order to obtain a Water Balance.
□ In some instances data was modified based on the experience of senior GMW
staff to enable the completion of the NVIRP spread sheet.
□ For the Campaspe Irrigation District in 2003/04 the total amount of water
accounted for as deliveries, outfalls or passing flows was greater than the
volume of deliveries by 2949 ML49.
□ In some instances the information presented on the NVIRP spread sheet varied
from the information provided in the supporting data for the relevant
parameter. This may have been due to changes in the definition of the NVIRP
area or the result of more up to date information.
□ The Auditor was unable to verify the Water Balances due to the lack of written
procedures and data validation associated with the NVIRP spread sheet.
Recommendations
1. A clear set of procedures should be prepared for the completion of the NVIRP
spread sheet. These procedures should define the data, identify the source of
the data and where it is to be used.
2. Coding schedules should be prepared for the NVIRP spread sheet as this will
form a critical part of the annual audit process.
48 #2656468v1 49 #2477220 App 3 sharp coefficient pty ltd
Page 38 of 46
Northern Victorian Irrigation Renewal Project Baseline Audit
C O M M E R C I A L – I N C O N F I D E N C E
3. The Water Balances should be recalculated based on the various changes
recommended in the review of the parameters above.
sharp coefficient pty ltd
Page 39 of 46
Northern Victorian Irrigation Renewal Project Baseline Audit
C O M M E R C I A L – I N C O N F I D E N C E
AUDI T METHODOLOGY
A selection of relevant reports etc was collected by GMW and forwarded to NVIRP
prior to the audit.
At the commencement of the site visit the Auditor met with senior GMW staff and was
advised of the process for seeking information and identification of the various
contacts. For the following three days [12 – 14 May 2009] the Auditor was assisted by
various GMW staff, in particular Derek Poulton, Fiona Nioa and Michael Schulz to
locate relevant documents and information and to describe the practices used by G
MW. At the completion of the three days the Auditor again meet with senior GMW
staff and outlined the progress of the Audit. Following the site visit, requests for further
supporting information and clarification of information were sought from relevant G
MW staff. Based on the information received a draft was prepared and presented to
NVIRP and GMW for review and comment.
The following people attended the presentation:
□ Mark Bailey GMW Manager Regulated Systems
□ Mike Shultz – GMW Project Manager Water Savings
□ Jeremy Nolan –GMW Principal Project Manager
□ Derek Poulton – GMW Water Savings Adviser
□ Peter Roberts NVIRP Project Manager Water Savings
□ Lucinda Ryan – NVIRP Project Manager Planning
□ Ross Plunkett – NVIRP Executive Manager Planning
Following receipt of comments and additional information from:
□ Fiona Nioa – email of 4 August 2009
□ Derek Poulton – emails of 6 August 2009 and 11 August 2009
□ Peter Roberts – email of 7 August 2009,
the Auditor made minor modifications to the Draft report and finalised this audit
report.
sharp coefficient pty ltd
Page 40 of 46
Northern Victorian Irrigation Renewal Project Baseline Audit
C O M M E R C I A L – I N C O N F I D E N C E
APPENDIX A . ACKNOWLEDGEMENTS
Undertaking an audit of a large variety of information from different sources that have
not previously been audited can be a difficult task. This becomes even more difficult
when the audit is of data from several years prior. However the assistance provided to
the Auditor by staff from GMW involved in the audit was invaluable in obtaining
relevant data and in clarifying the practices adopted to develop the data.
Sharp Coefficient would like to thank the various people who enthusiastically and
openly contributed to the audit either directly or in promptly providing information. In
particular the Auditor would like to acknowledge the assistance of Mr Derek Poulton
and Ms Fiona Nioa who coordinated the provision of inputs, provided much of the
information and actively contributed to the audit.
The Auditor would also like to acknowledge the assistance of Peter Roberts from NVIRP
for his enthusiastic assistance in coordinating and managing the audit on behalf of
NVIRP.
sharp coefficient pty ltd
Page 41 of 46
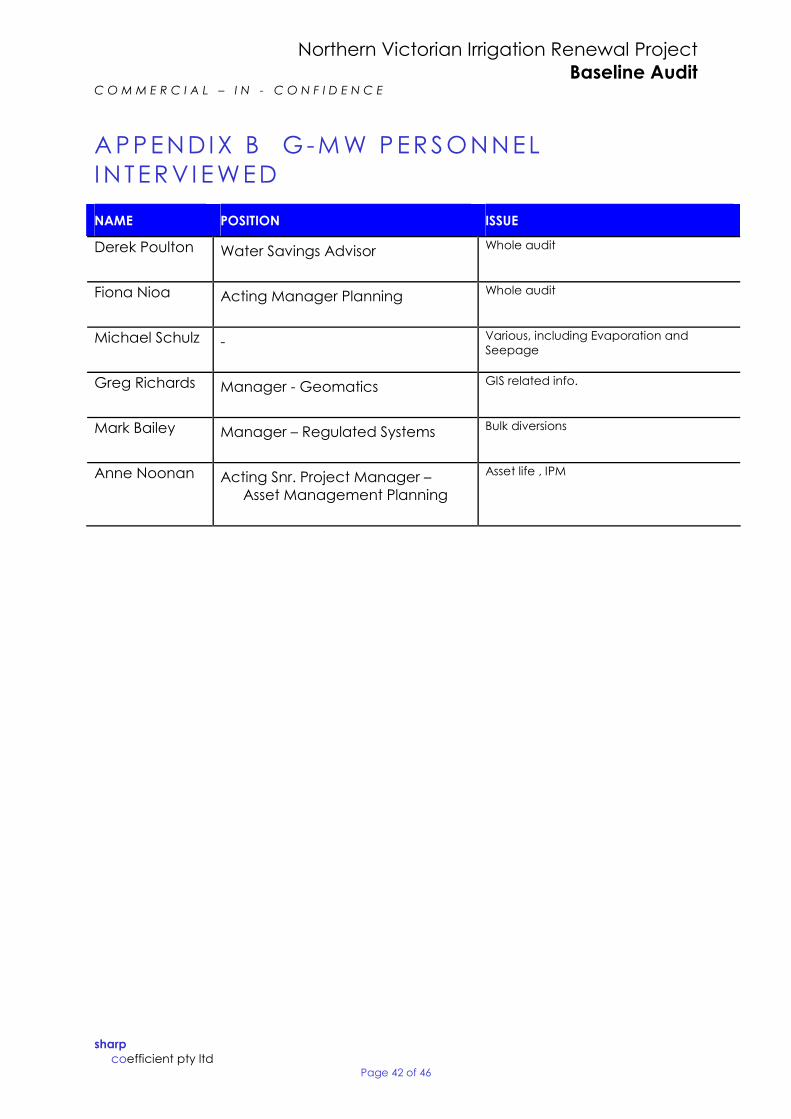
Northern Victorian Irrigation Renewal Project Baseline Audit
C O M M E R C I A L – I N C O N F I D E N C E
APPENDIX B GMW PERSONNEL I N TERVI EWED
NAME POSITION ISSUE
Derek Poulton Water Savings Advisor Whole audit
Fiona Nioa Acting Manager Planning Whole audit
Michael Schulz Various, including Evaporation and Seepage
Greg Richards Manager Geomatics GIS related info.
Mark Bailey Manager – Regulated Systems Bulk diversions
Anne Noonan Acting Snr. Project Manager – Asset Management Planning
Asset life , IPM
sharp coefficient pty ltd
Page 42 of 46
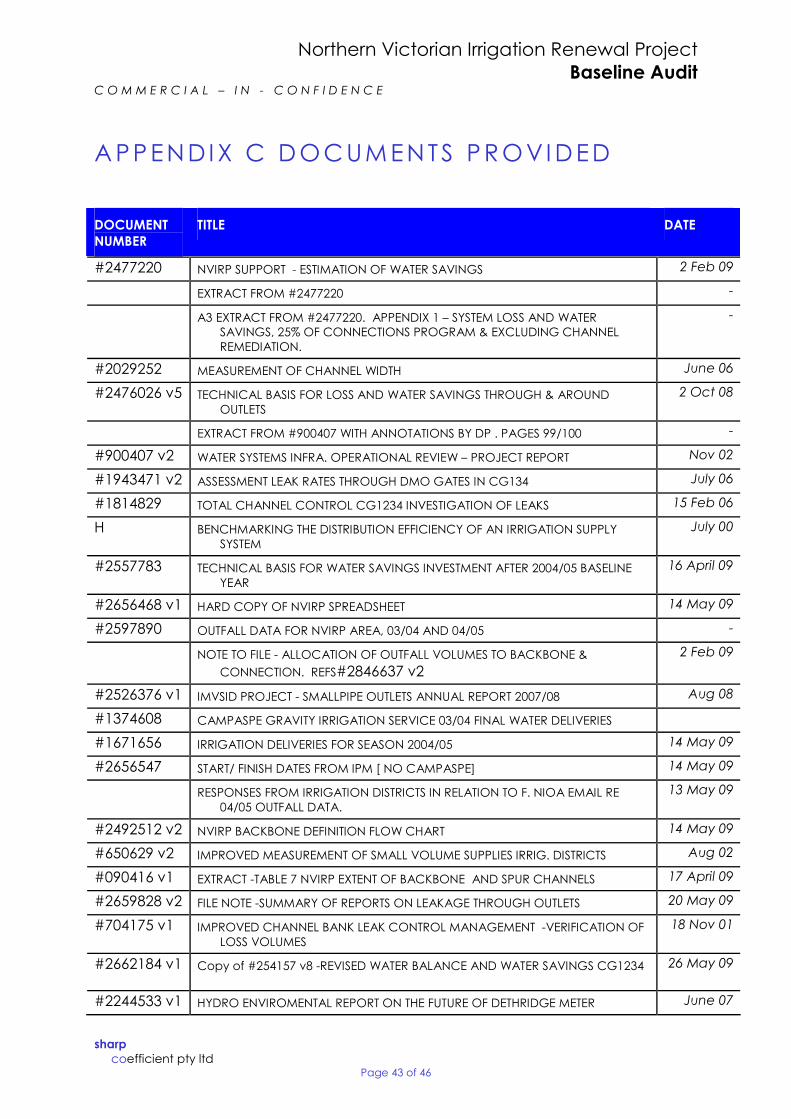
Northern Victorian Irrigation Renewal Project Baseline Audit
C O M M E R C I A L – I N C O N F I D E N C E
APPENDIX C DOCUMENTS PROVIDED
DOCUMENT NUMBER
TITLE DATE
#2477220 NVIRP SUPPORT ESTIMATION OF WATER SAVINGS 2 Feb 09
EXTRACT FROM #2477220
A3 EXTRACT FROM #2477220. APPENDIX 1 – SYSTEM LOSS AND WATER SAVINGS, 25% OF CONNECTIONS PROGRAM & EXCLUDING CHANNEL REMEDIATION.
#2029252 MEASUREMENT OF CHANNEL WIDTH June 06
#2476026 v5 TECHNICAL BASIS FOR LOSS AND WATER SAVINGS THROUGH & AROUND OUTLETS
2 Oct 08
EXTRACT FROM #900407 WITH ANNOTATIONS BY DP . PAGES 99/100
#900407 v2 WATER SYSTEMS INFRA. OPERATIONAL REVIEW – PROJECT REPORT Nov 02
#1943471 v2 ASSESSMENT LEAK RATES THROUGH DMO GATES IN CG134 July 06
#1814829 TOTAL CHANNEL CONTROL CG1234 INVESTIGATION OF LEAKS 15 Feb 06
H BENCHMARKING THE DISTRIBUTION EFFICIENCY OF AN IRRIGATION SUPPLY SYSTEM
July 00
#2557783 TECHNICAL BASIS FOR WATER SAVINGS INVESTMENT AFTER 2004/05 BASELINE YEAR
16 April 09
#2656468 v1 HARD COPY OF NVIRP SPREADSHEET 14 May 09
#2597890 OUTFALL DATA FOR NVIRP AREA, 03/04 AND 04/05
NOTE TO FILE ALLOCATION OF OUTFALL VOLUMES TO BACKBONE &
CONNECTION. REFS#2846637 v2 2 Feb 09
#2526376 v1 IMVSID PROJECT SMALLPIPE OUTLETS ANNUAL REPORT 2007/08 Aug 08
#1374608 CAMPASPE GRAVITY IRRIGATION SERVICE 03/04 FINAL WATER DELIVERIES
#1671656 IRRIGATION DELIVERIES FOR SEASON 2004/05 14 May 09
#2656547 START/ FINISH DATES FROM IPM [ NO CAMPASPE] 14 May 09
RESPONSES FROM IRRIGATION DISTRICTS IN RELATION TO F. NIOA EMAIL RE 04/05 OUTFALL DATA.
13 May 09
#2492512 v2 NVIRP BACKBONE DEFINITION FLOW CHART 14 May 09
#650629 v2 IMPROVED MEASUREMENT OF SMALL VOLUME SUPPLIES IRRIG. DISTRICTS Aug 02
#090416 v1 EXTRACT TABLE 7 NVIRP EXTENT OF BACKBONE AND SPUR CHANNELS 17 April 09
#2659828 v2 FILE NOTE SUMMARY OF REPORTS ON LEAKAGE THROUGH OUTLETS 20 May 09
#704175 v1 IMPROVED CHANNEL BANK LEAK CONTROL MANAGEMENT VERIFICATION OF LOSS VOLUMES
18 Nov 01
#2662184 v1 Copy of #254157 v8 REVISED WATER BALANCE AND WATER SAVINGS CG1234 26 May 09
#2244533 v1 HYDRO ENVIROMENTAL REPORT ON THE FUTURE OF DETHRIDGE METER June 07
sharp coefficient pty ltd
Page 43 of 46
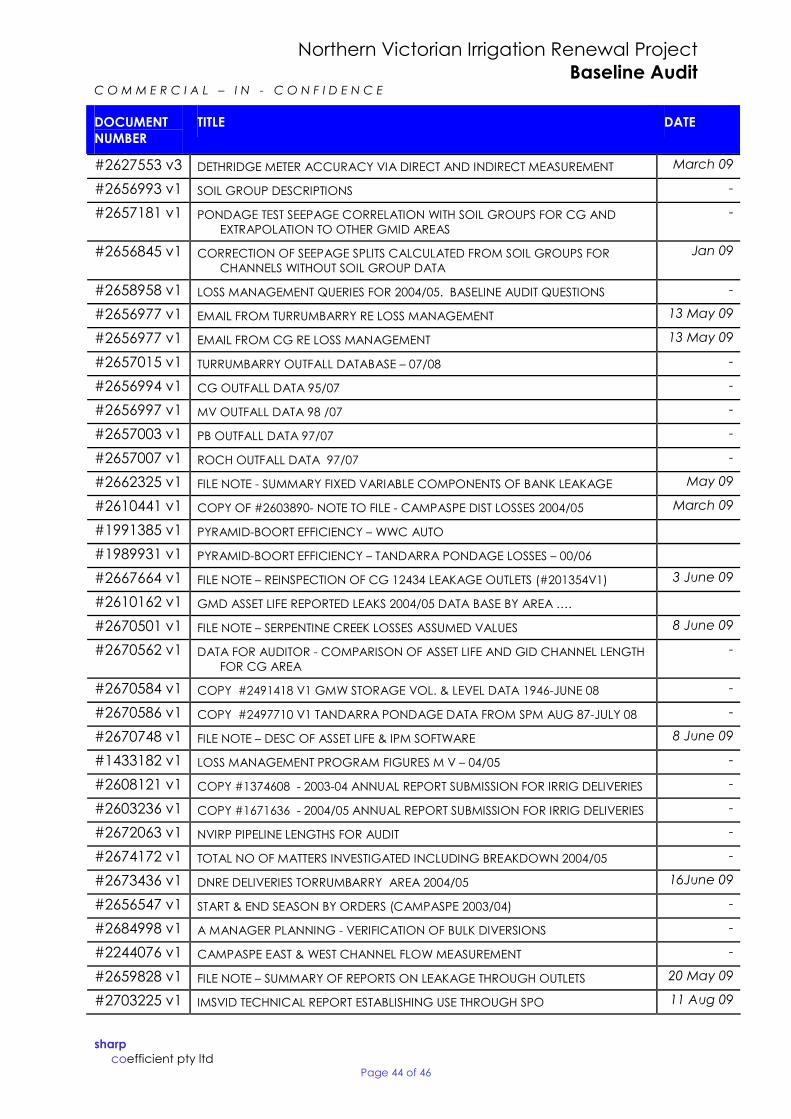
Northern Victorian Irrigation Renewal Project Baseline Audit
C O M M E R C I A L – I N C O N F I D E N C E
DOCUMENT NUMBER
TITLE DATE
#2627553 v3 DETHRIDGE METER ACCURACY VIA DIRECT AND INDIRECT MEASUREMENT March 09
#2656993 v1 SOIL GROUP DESCRIPTIONS
#2657181 v1 PONDAGE TEST SEEPAGE CORRELATION WITH SOIL GROUPS FOR CG AND EXTRAPOLATION TO OTHER GMID AREAS
#2656845 v1 CORRECTION OF SEEPAGE SPLITS CALCULATED FROM SOIL GROUPS FOR CHANNELS WITHOUT SOIL GROUP DATA
Jan 09
#2658958 v1 LOSS MANAGEMENT QUERIES FOR 2004/05. BASELINE AUDIT QUESTIONS
#2656977 v1 EMAIL FROM TURRUMBARRY RE LOSS MANAGEMENT 13 May 09
#2656977 v1 EMAIL FROM CG RE LOSS MANAGEMENT 13 May 09
#2657015 v1 TURRUMBARRY OUTFALL DATABASE – 07/08
#2656994 v1 CG OUTFALL DATA 95/07
#2656997 v1 MV OUTFALL DATA 98 /07
#2657003 v1 PB OUTFALL DATA 97/07
#2657007 v1 ROCH OUTFALL DATA 97/07
#2662325 v1 FILE NOTE SUMMARY FIXED VARIABLE COMPONENTS OF BANK LEAKAGE May 09
#2610441 v1 COPY OF #2603890 NOTE TO FILE CAMPASPE DIST LOSSES 2004/05 March 09
#1991385 v1 PYRAMIDBOORT EFFICIENCY – WWC AUTO
#1989931 v1 PYRAMIDBOORT EFFICIENCY – TANDARRA PONDAGE LOSSES – 00/06
#2667664 v1 FILE NOTE – REINSPECTION OF CG 12434 LEAKAGE OUTLETS (#201354V1) 3 June 09
#2610162 v1 GMD ASSET LIFE REPORTED LEAKS 2004/05 DATA BASE BY AREA ….
#2670501 v1 FILE NOTE – SERPENTINE CREEK LOSSES ASSUMED VALUES 8 June 09
#2670562 v1 DATA FOR AUDITOR COMPARISON OF ASSET LIFE AND GID CHANNEL LENGTH FOR CG AREA
#2670584 v1 COPY #2491418 V1 GMW STORAGE VOL. & LEVEL DATA 1946JUNE 08
#2670586 v1 COPY #2497710 V1 TANDARRA PONDAGE DATA FROM SPM AUG 87JULY 08
#2670748 v1 FILE NOTE – DESC OF ASSET LIFE & IPM SOFTWARE 8 June 09
#1433182 v1 LOSS MANAGEMENT PROGRAM FIGURES M V – 04/05
#2608121 v1 COPY #1374608 200304 ANNUAL REPORT SUBMISSION FOR IRRIG DELIVERIES
#2603236 v1 COPY #1671636 2004/05 ANNUAL REPORT SUBMISSION FOR IRRIG DELIVERIES
#2672063 v1 NVIRP PIPELINE LENGTHS FOR AUDIT
#2674172 v1 TOTAL NO OF MATTERS INVESTIGATED INCLUDING BREAKDOWN 2004/05
#2673436 v1 DNRE DELIVERIES TORRUMBARRY AREA 2004/05 16June 09
#2656547 v1 START & END SEASON BY ORDERS (CAMPASPE 2003/04)
#2684998 v1 A MANAGER PLANNING VERIFICATION OF BULK DIVERSIONS
#2244076 v1 CAMPASPE EAST & WEST CHANNEL FLOW MEASUREMENT
#2659828 v1 FILE NOTE – SUMMARY OF REPORTS ON LEAKAGE THROUGH OUTLETS 20 May 09
#2703225 v1 IMSVID TECHNICAL REPORT ESTABLISHING USE THROUGH SPO 11 Aug 09
sharp coefficient pty ltd
Page 44 of 46
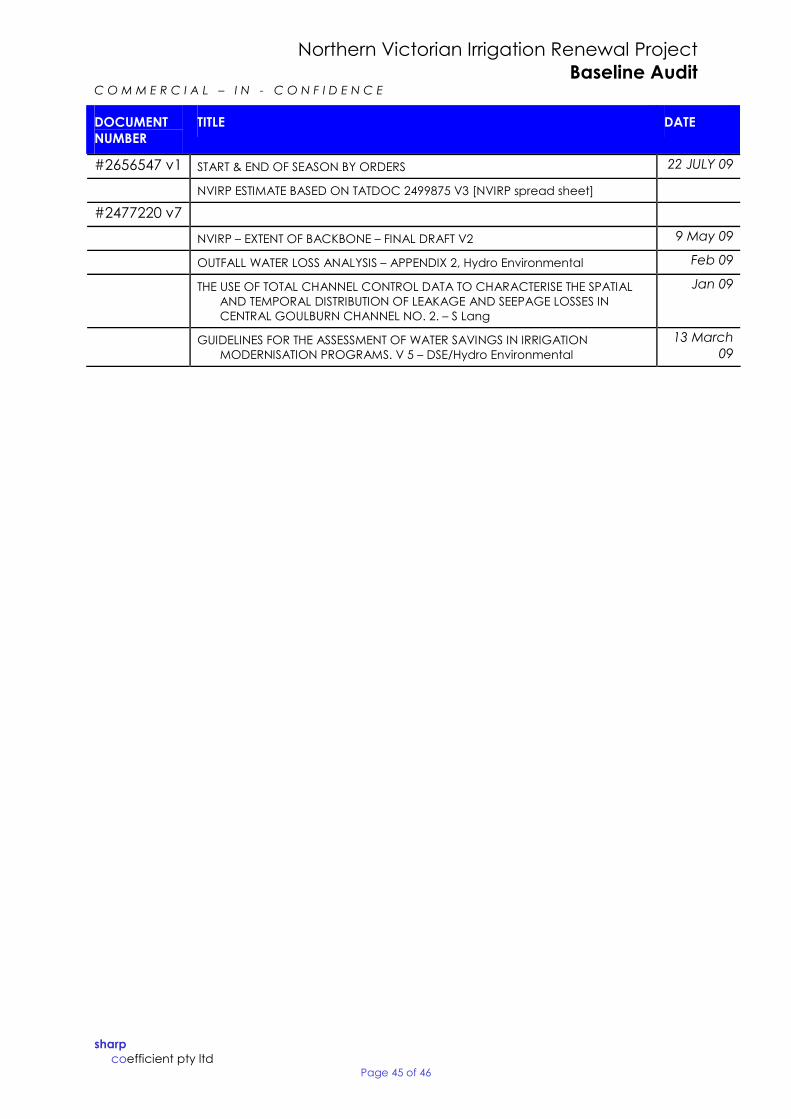
Northern Victorian Irrigation Renewal Project Baseline Audit
C O M M E R C I A L – I N C O N F I D E N C E
DOCUMENT NUMBER
TITLE DATE
#2656547 v1 START & END OF SEASON BY ORDERS 22 JULY 09
NVIRP ESTIMATE BASED ON TATDOC 2499875 V3 [NVIRP spread sheet]
#2477220 v7
NVIRP – EXTENT OF BACKBONE – FINAL DRAFT V2 9 May 09
OUTFALL WATER LOSS ANALYSIS – APPENDIX 2, Hydro Environmental Feb 09
THE USE OF TOTAL CHANNEL CONTROL DATA TO CHARACTERISE THE SPATIAL AND TEMPORAL DISTRIBUTION OF LEAKAGE AND SEEPAGE LOSSES IN CENTRAL GOULBURN CHANNEL NO. 2. – S Lang
Jan 09
GUIDELINES FOR THE ASSESSMENT OF WATER SAVINGS IN IRRIGATION MODERNISATION PROGRAMS. V 5 – DSE/Hydro Environmental
13 March 09
sharp coefficient pty ltd
Page 45 of 46

Appendix B Typical Futureflow Work Packages sign off Documentation
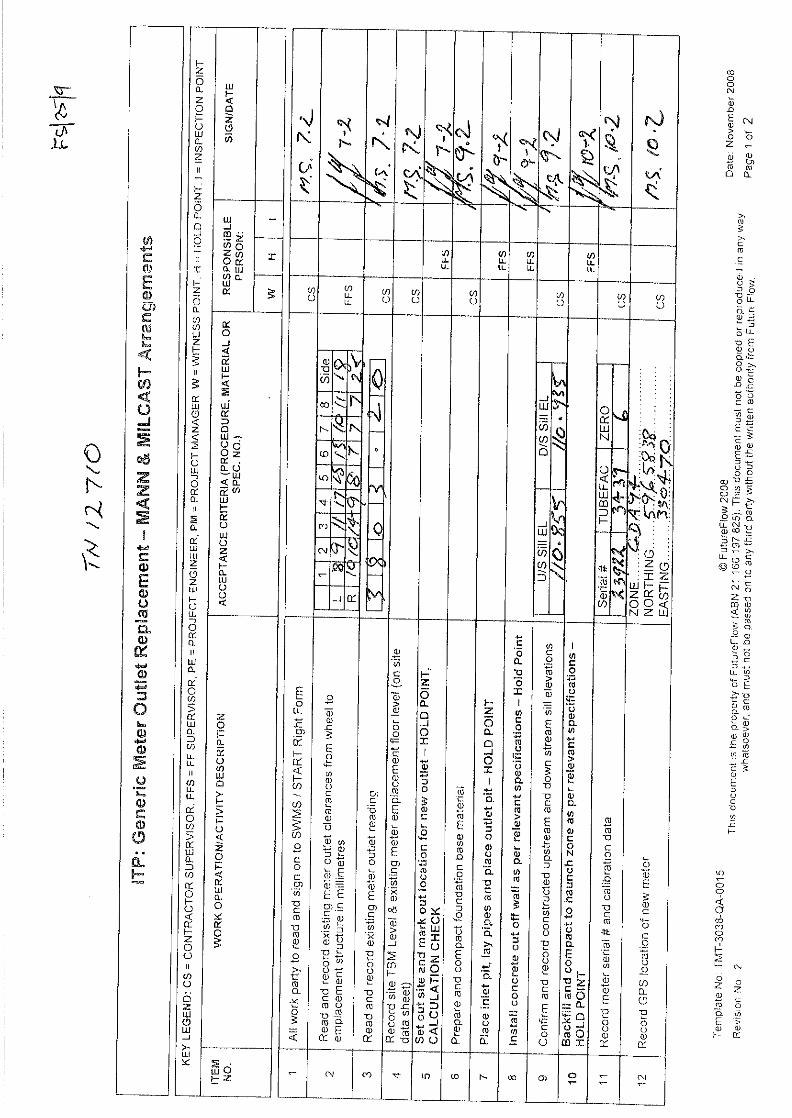
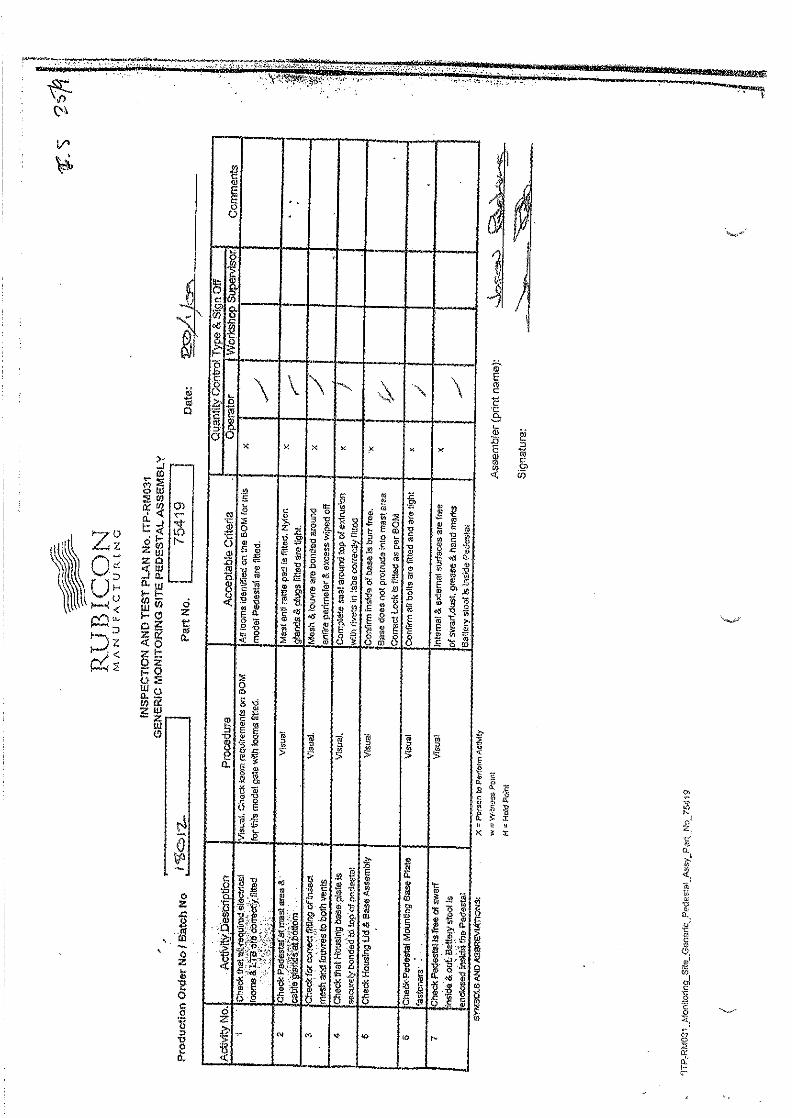
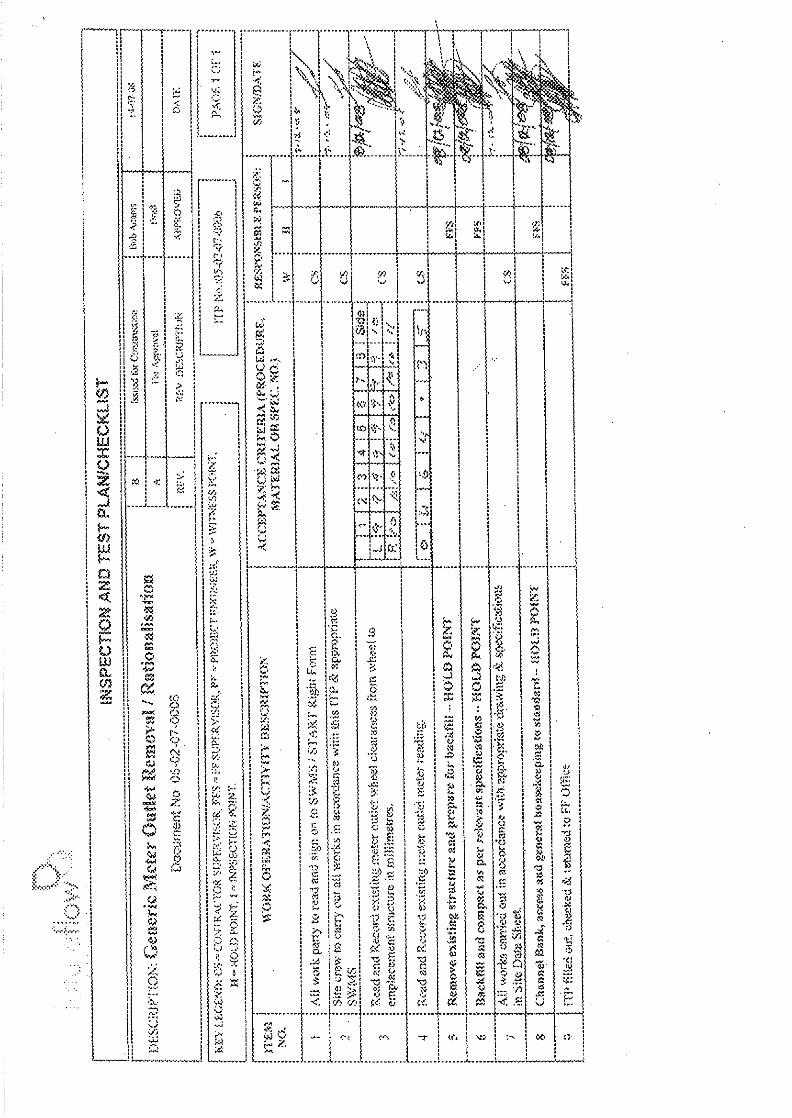
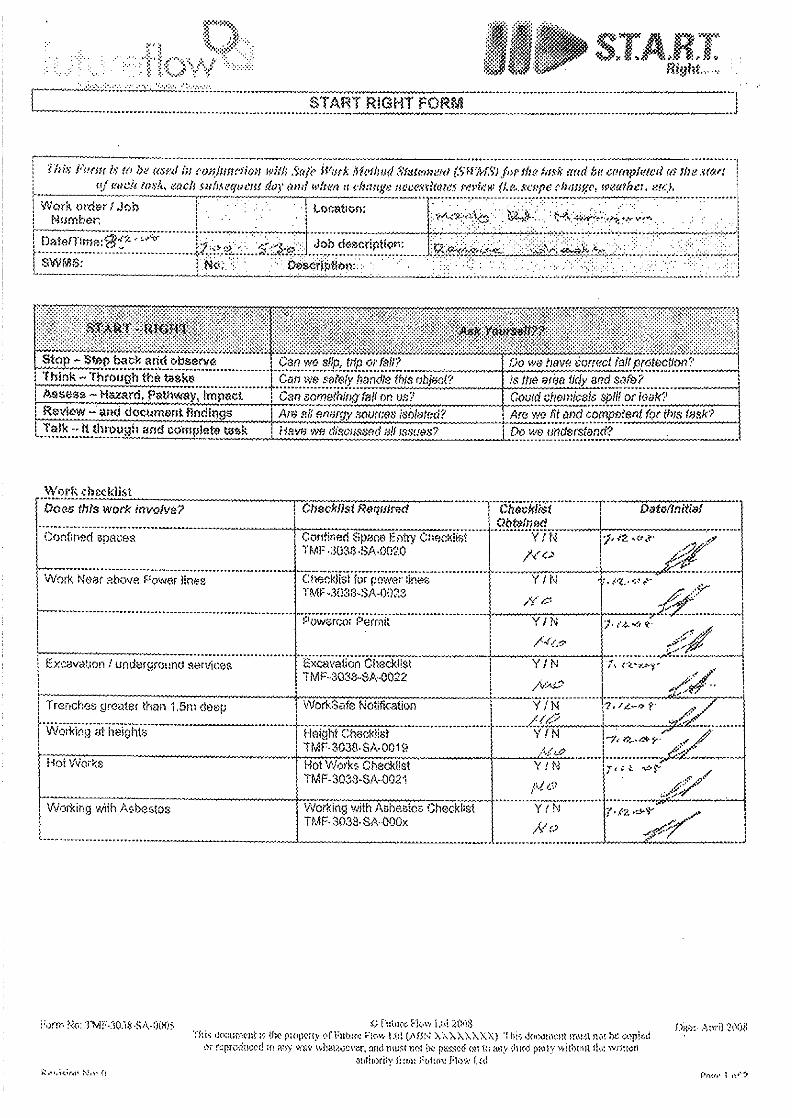


Appendix C G-MW List of Procedures
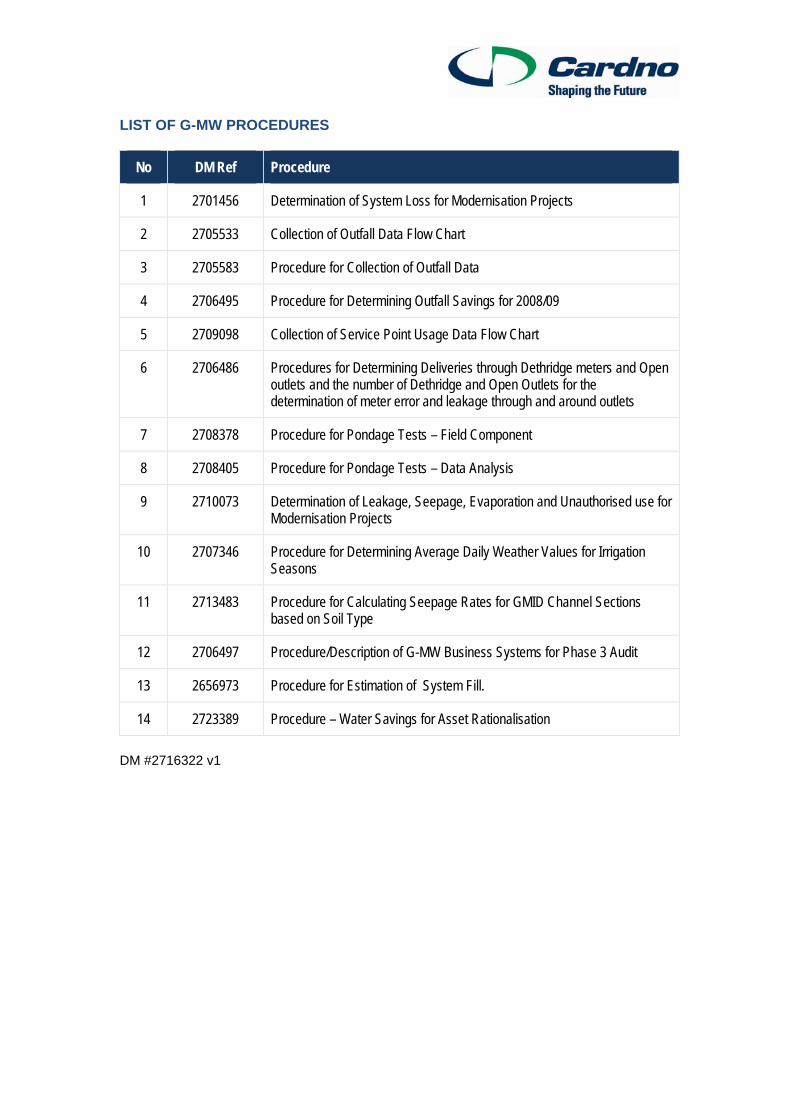
LIST OF G-MW PROCEDURES
No DM Ref Procedure
1 2701456
2 2705533
3 2705583
4 2706495
5 2709098
6 2706486
7 2708378
8 2708405
9 2710073
10 2707346
11 2713483
12 2706497
13 2656973
14 2723389
DM #2716322 v1
Determination of System Loss for Modernisation Projects
Collection of Outfall Data Flow Chart
Procedure for Collection of Outfall Data
Procedure for Determining Outfall Savings for 2008/09
Collection of Service Point Usage Data Flow Chart
Procedures for Determining Deliveries through Dethridge meters and Open outlets and the number of Dethridge and Open Outlets for the determination of meter error and leakage through and around outlets
Procedure for Pondage Tests – Field Component
Procedure for Pondage Tests – Data Analysis
Determination of Leakage, Seepage, Evaporation and Unauthorised use for Modernisation Projects
Procedure for Determining Average Daily Weather Values for Irrigation Seasons
Procedure for Calculating Seepage Rates for GMID Channel Sections based on Soil Type
Procedure/Description of G-MW Business Systems for Phase 3 Audit
Procedure for Estimation of System Fill.
Procedure – Water Savings for Asset Rationalisation

Appendix D NVIRP Procedure Flow Charts
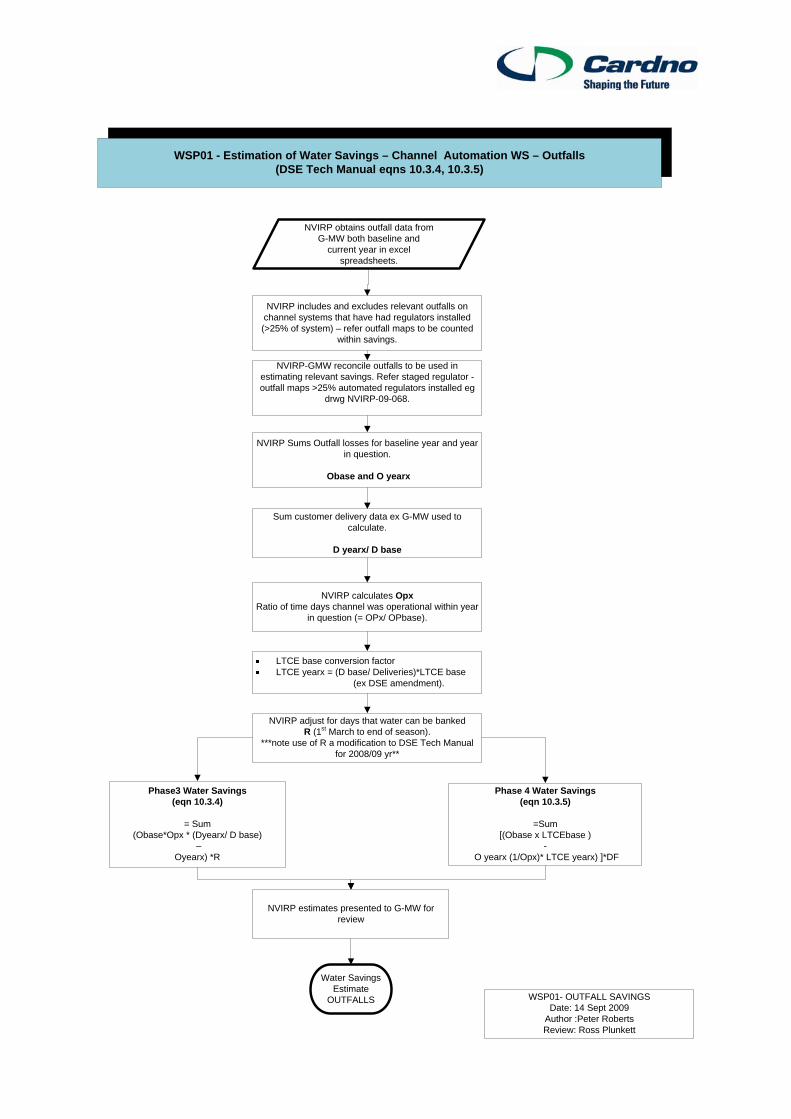
NVIRP obtains outfall data from G-MW both baseline and
current year in excel spreadsheets.
NVIRP includes and excludes relevant outfalls on channel systems that have had regulators installed (>25% of system) – refer outfall maps to be counted
within savings.
NVIRP-GMW reconcile outfalls to be used in estimating relevant savings. Refer staged regulator -outfall maps >25% automated regulators installed eg
drwg NVIRP-09-068.
NVIRP Sums Outfall losses for baseline year and year in question.
Obase and O yearx
Sum customer delivery data ex G-MW used to calculate.
D yearx/ D base
NVIRP calculates Opx Ratio of time days channel was operational within year
in question (= OPx/ OPbase).
WSP01 - Estimation of Water Savings – Channel Automation WS – Outfalls (DSE Tech Manual eqns 10.3.4, 10.3.5)
LTCE base conversion factor LTCE yearx = (D base/ Deliveries)*LTCE base
(ex DSE amendment).
NVIRP adjust for days that water can be banked R (1st March to end of season).
***note use of R a modification to DSE Tech Manual for 2008/09 yr**
Phase3 Water Savings (eqn 10.3.4)
= Sum (Obase*Opx * (Dyearx/ D base)
– Oyearx) *R
Phase 4 Water Savings (eqn 10.3.5)
=Sum [(Obase x LTCEbase )
-O yearx (1/Opx)* LTCE yearx) ]*DF
Water Savings Estimate
OUTFALLS
NVIRP estimates presented to G-MW for review
WSP01- OUTFALL SAVINGS Date: 14 Sept 2009
Author :Peter Roberts Review: Ross Plunkett
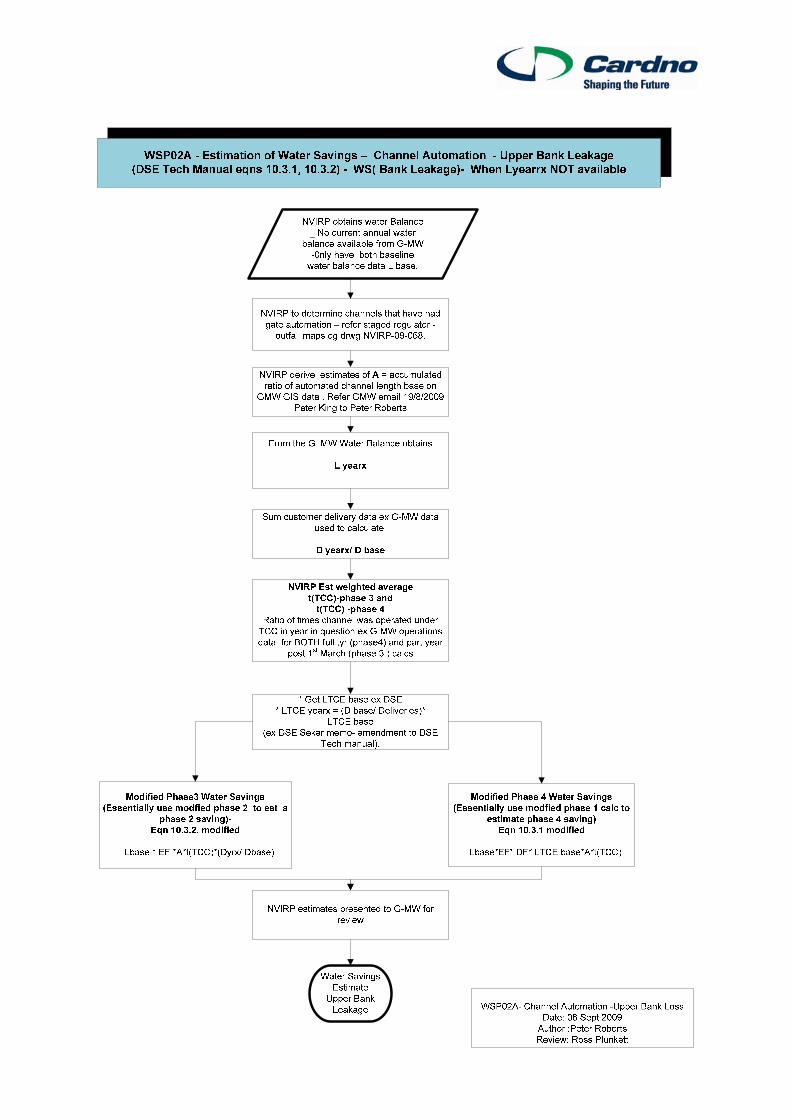
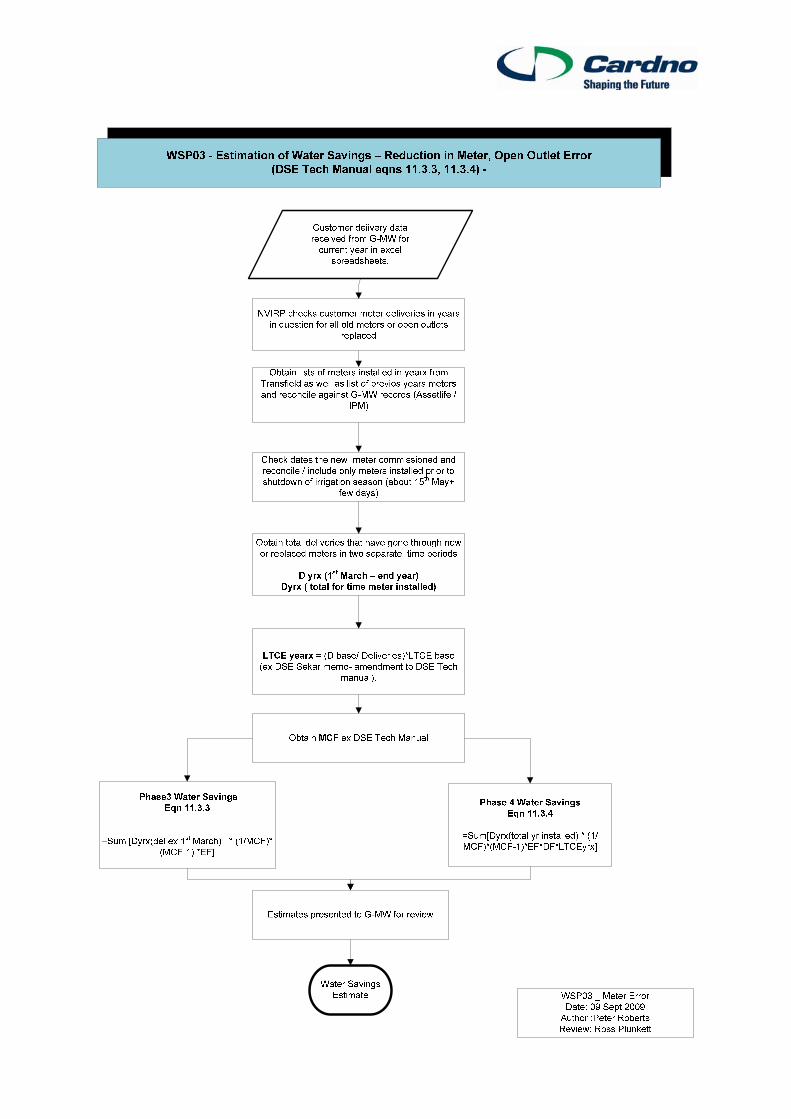
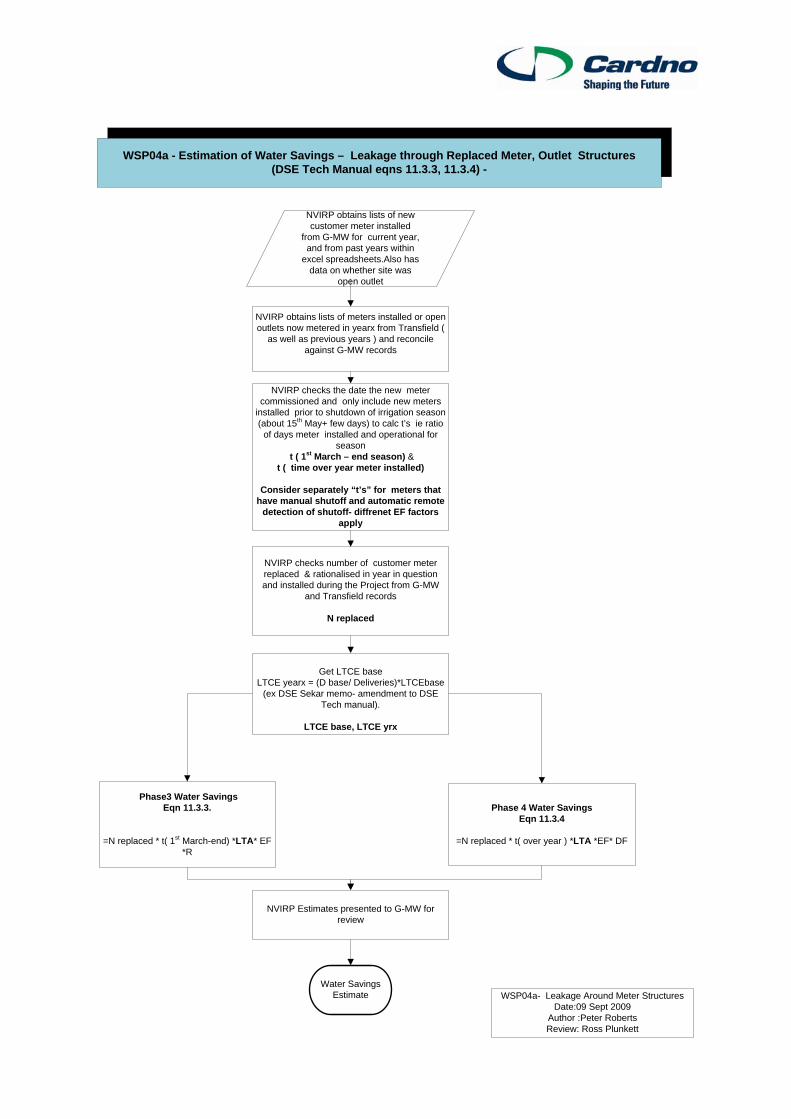
NVIRP obtains lists of meters installed or open outlets now metered in yearx from Transfield (
as well as previous years ) and reconcile against G-MW records
WSP04a - Estimation of Water Savings – Leakage through Replaced Meter, Outlet Structures (DSE Tech Manual eqns 11.3.3, 11.3.4) -
NVIRP obtains lists of new customer meter installed
from G-MW for current year, and from past years within
excel spreadsheets.Also has data on whether site was
open outlet
NVIRP checks the date the new meter commissioned and only include new meters
installed prior to shutdown of irrigation season (about 15th May+ few days) to calc t’s ie ratio
of days meter installed and operational for season
t ( 1st March – end season) & t ( time over year meter installed)
Consider separately “t’s” for meters that have manual shutoff and automatic remote
detection of shutoff- diffrenet EF factors apply
NVIRP checks number of customer meter replaced & rationalised in year in question and installed during the Project from G-MW
and Transfield records
N replaced
Get LTCE base LTCE yearx = (D base/ Deliveries)*LTCEbase
(ex DSE Sekar memo- amendment to DSE Tech manual).
LTCE base, LTCE yrx
Water Savings Estimate
Phase3 Water Savings Eqn 11.3.3.
=N replaced * t( 1st March-end) *LTA* EF *R
Phase 4 Water Savings Eqn 11.3.4
=N replaced * t( over year ) *LTA *EF* DF
NVIRP Estimates presented to G-MW for review
WSP04a- Leakage Around Meter Structures Date:09 Sept 2009
Author :Peter Roberts Review: Ross Plunkett
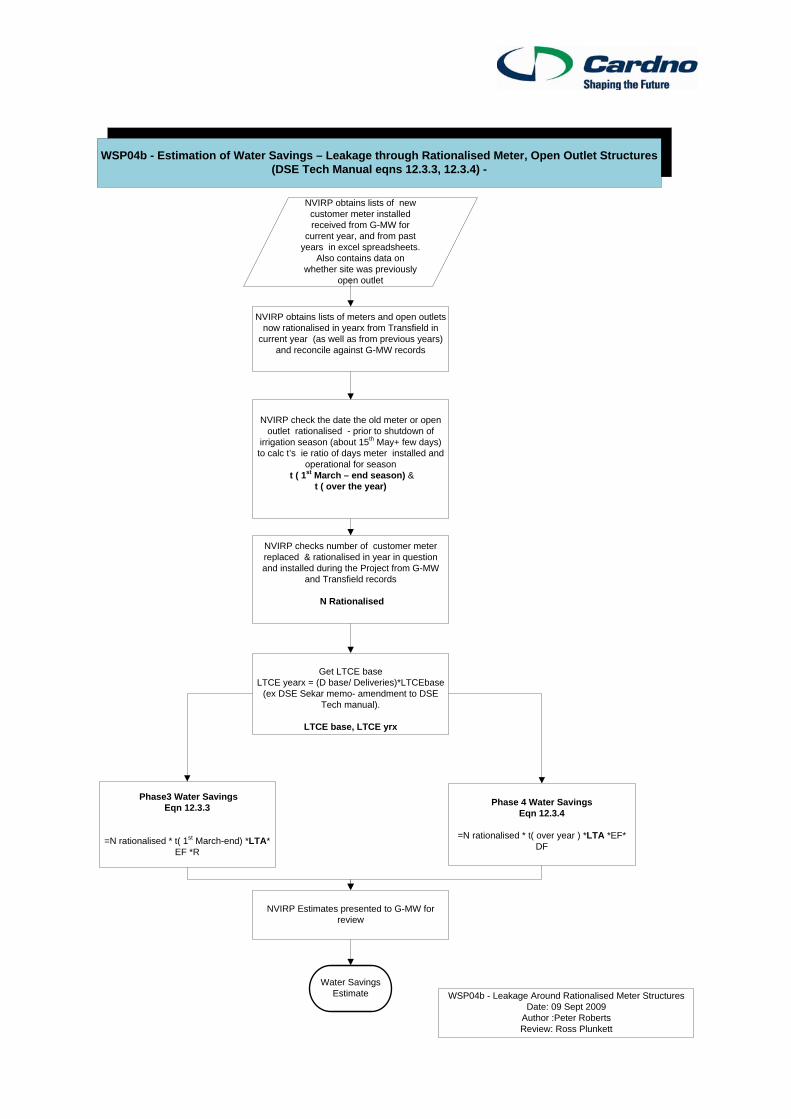
NVIRP obtains lists of meters and open outlets now rationalised in yearx from Transfield in
current year (as well as from previous years) and reconcile against G-MW records
NVIRP obtains lists of new customer meter installed received from G-MW for
current year, and from past years in excel spreadsheets.
Also contains data on whether site was previously
open outlet
WSP04b - Estimation of Water Savings – Leakage through Rationalised Meter, Open Outlet Structures (DSE Tech Manual eqns 12.3.3, 12.3.4) -
NVIRP check the date the old meter or open outlet rationalised - prior to shutdown of
irrigation season (about 15th May+ few days) to calc t’s ie ratio of days meter installed and
operational for season t ( 1st March – end season) &
t ( over the year)
NVIRP checks number of customer meter replaced & rationalised in year in question and installed during the Project from G-MW
and Transfield records
N Rationalised
Get LTCE base LTCE yearx = (D base/ Deliveries)*LTCEbase
Water Savings Estimate
Phase3 Water Savings Eqn 12.3.3
=N rationalised * t( 1st March-end) *LTA* EF *R
Phase 4 Water Savings Eqn 12.3.4
=N rationalised * t( over year ) *LTA *EF* DF
NVIRP Estimates presented to G-MW for review
(ex DSE Sekar memo- amendment to DSE Tech manual).
LTCE base, LTCE yrx
WSP04b - Leakage Around Rationalised Meter Structures Date: 09 Sept 2009
Author :Peter Roberts Review: Ross Plunkett
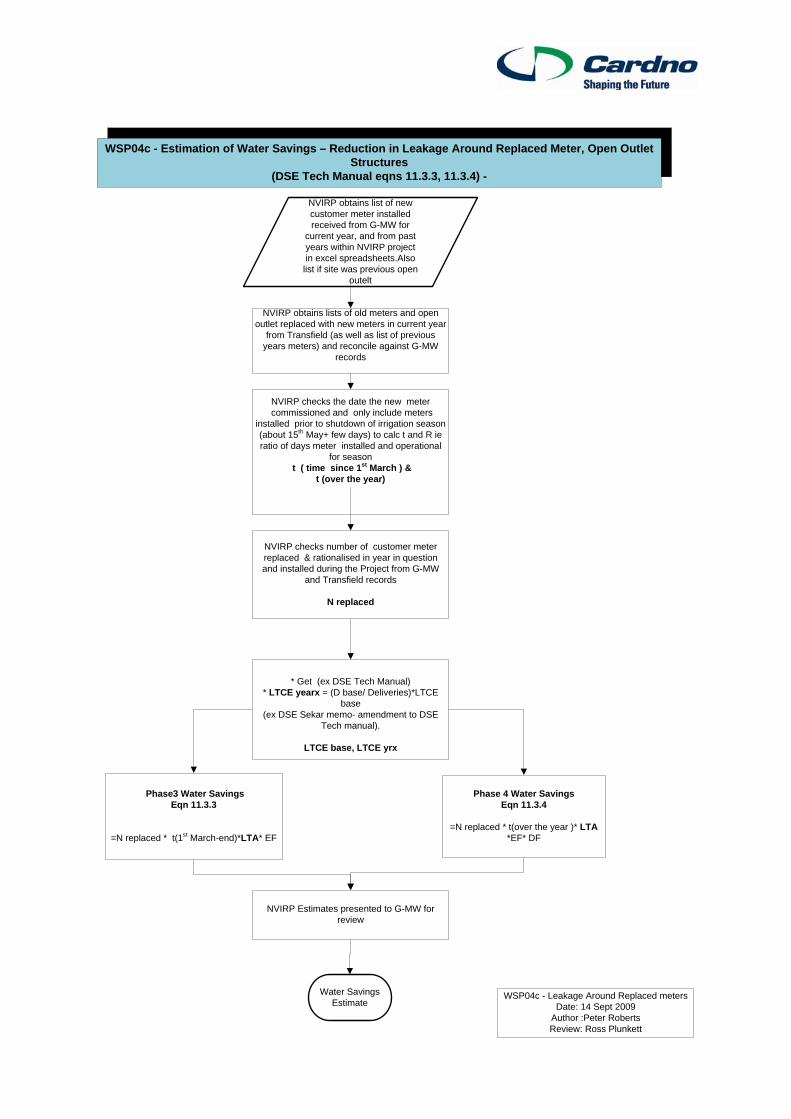
WSP04c - Estimation of Water Savings – Reduction in Leakage Around Replaced Meter, Open Outlet Structures
(DSE Tech Manual eqns 11.3.3, 11.3.4) -
NVIRP obtains list of new customer meter installed received from G-MW for
current year, and from past years within NVIRP project in excel spreadsheets.Also list if site was previous open
outelt
NVIRP obtains lists of old meters and open outlet replaced with new meters in current year
from Transfield (as well as list of previous years meters) and reconcile against G-MW
records
NVIRP checks the date the new meter commissioned and only include meters
installed prior to shutdown of irrigation season (about 15th May+ few days) to calc t and R ie ratio of days meter installed and operational
for season t ( time since 1st March ) &
t (over the year)
NVIRP checks number of customer meter replaced & rationalised in year in question and installed during the Project from G-MW
and Transfield records
N replaced
* Get (ex DSE Tech Manual) * LTCE yearx = (D base/ Deliveries)*LTCE
base (ex DSE Sekar memo- amendment to DSE
Tech manual).
LTCE base, LTCE yrx
Phase3 Water Savings Eqn 11.3.3
=N replaced * t(1st March-end)*LTA* EF
Phase 4 Water Savings Eqn 11.3.4
=N replaced * t(over the year )* LTA *EF* DF
NVIRP Estimates presented to G-MW for review
Water Savings Estimate
WSP04c - Leakage Around Replaced meters Date: 14 Sept 2009
Author :Peter Roberts Review: Ross Plunkett
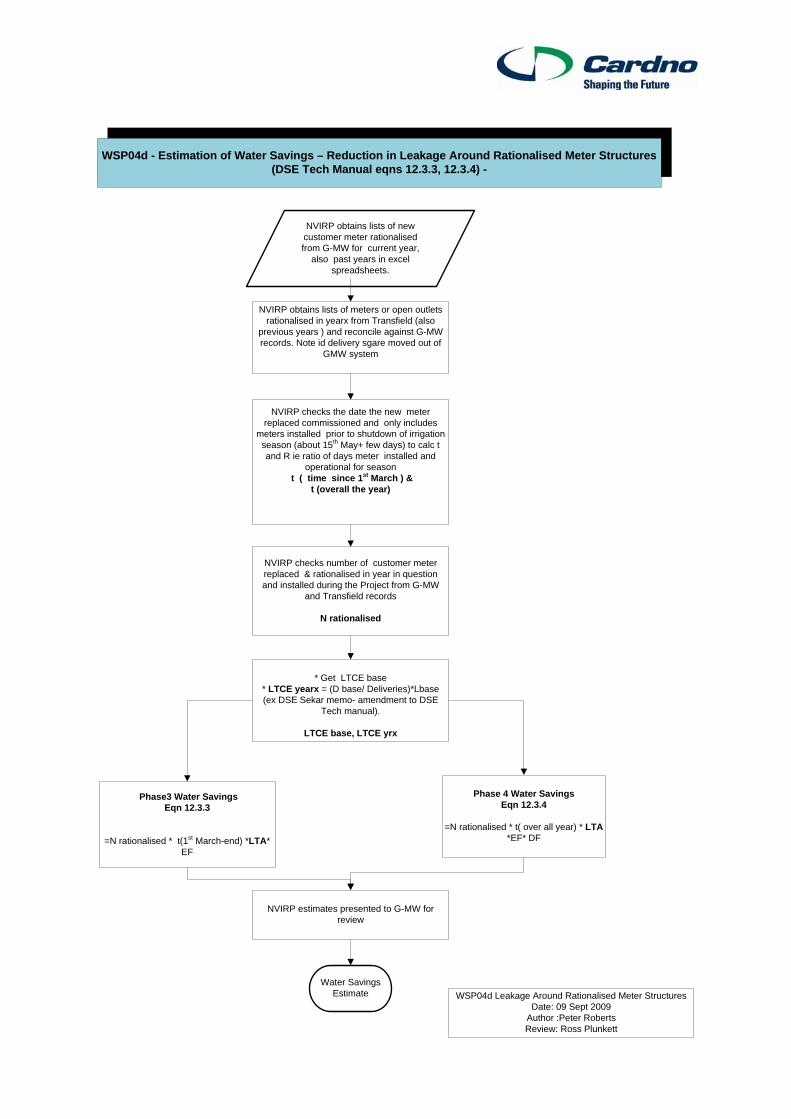
WSP04d - Estimation of Water Savings – Reduction in Leakage Around Rationalised Meter Structures (DSE Tech Manual eqns 12.3.3, 12.3.4) -
NVIRP obtains lists of new customer meter rationalised from G-MW for current year,
also past years in excel spreadsheets.
NVIRP obtains lists of meters or open outlets rationalised in yearx from Transfield (also
previous years ) and reconcile against G-MW records. Note id delivery sgare moved out of
GMW system
NVIRP checks the date the new meter replaced commissioned and only includes
meters installed prior to shutdown of irrigation season (about 15th May+ few days) to calc t and R ie ratio of days meter installed and
operational for season t ( time since 1st March ) &
t (overall the year)
NVIRP checks number of customer meter replaced & rationalised in year in question and installed during the Project from G-MW
and Transfield records
N rationalised
* Get LTCE base * LTCE yearx = (D base/ Deliveries)*Lbase (ex DSE Sekar memo- amendment to DSE
Tech manual).
LTCE base, LTCE yrx
Water Savings Estimate
Phase3 Water Savings Eqn 12.3.3
=N rationalised * t(1st March-end) *LTA* EF
Phase 4 Water Savings Eqn 12.3.4
=N rationalised * t( over all year) * LTA *EF* DF
NVIRP estimates presented to G-MW for review
WSP04d Leakage Around Rationalised Meter Structures Date: 09 Sept 2009
Author :Peter Roberts Review: Ross Plunkett
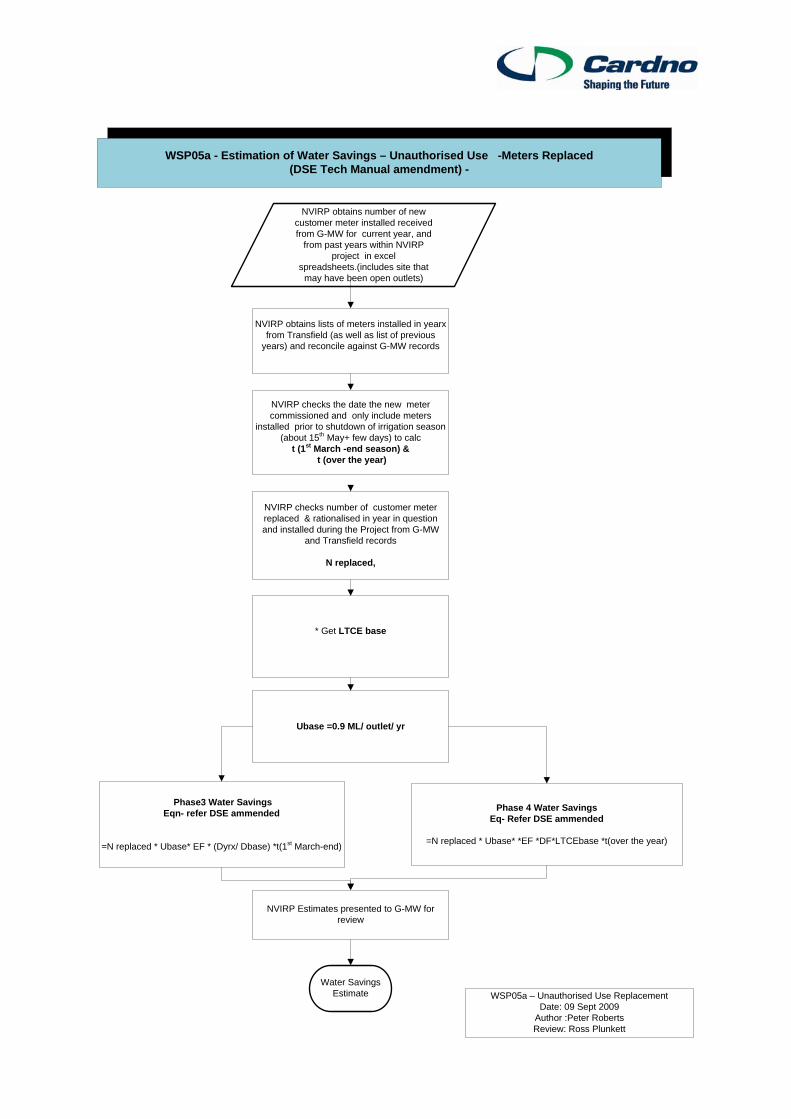
NVIRP obtains lists of meters installed in yearx from Transfield (as well as list of previous
years) and reconcile against G-MW records
NVIRP obtains number of new customer meter installed received from G-MW for current year, and
from past years within NVIRP project in excel
spreadsheets.(includes site that may have been open outlets)
WSP05a - Estimation of Water Savings – Unauthorised Use -Meters Replaced (DSE Tech Manual amendment) -
NVIRP checks the date the new meter commissioned and only include meters
installed prior to shutdown of irrigation season (about 15th May+ few days) to calc
t (1st March -end season) & t (over the year)
NVIRP checks number of customer meter replaced & rationalised in year in question and installed during the Project from G-MW
and Transfield records
N replaced,
Water Savings Estimate
Ubase =0.9 ML/ outlet/ yr
Phase3 Water Savings Eqn- refer DSE ammended
=N replaced * Ubase* EF * (Dyrx/ Dbase) *t(1st March-end)
Phase 4 Water Savings Eq- Refer DSE ammended
=N replaced * Ubase* *EF *DF*LTCEbase *t(over the year)
NVIRP Estimates presented to G-MW for review
* Get LTCE base
WSP05a – Unauthorised Use Replacement Date: 09 Sept 2009
Author :Peter Roberts Review: Ross Plunkett

NVIRP obtains lists of meters and open outlets rationalised in yearx from Transfield (as well
as list of previous years ) and reconcile against G-MW records
WSP05b - Estimation of Water Savings – Unauthorised Use - Meters Open Outlets Rationalised (DSE Tech Manual amendment) -
NVIRP obtains number of customer old meters or
former open outlets rationalised from G-MW for
current year, (and past years) in excel spreadsheets.
NVIRP checks the date the meter rationalised and only include meters rationalised prior to
shutdown of irrigation season to calc t (1st March -end season) &
t (over the yearl)
Water Savings Estimate
NVIRP reconciles number of customer meter r rationalised in year in question from G-MW
and Transfield records
N rationalised,
Ubase =0.9 ML/ outlet/ yr
Phase3 Water Savings Eqn refer DSE ammended manual
=N rationalised * Ubase* EF * (Dyrx/ Dbase) *t(1st March-end)
Phase 4 Water Savings Eqn refer DSE amended manual
=N rationalised * Ubase* *EF *DF*LTCEbase *t(over the year)
NVIRP estimates presented to G-MW for review
* Get LTCE base
WSP05b- Unauthorised Use Rationalised Date: 09 Sept 2009
Author :Peter Roberts Review: Ross Plunkett
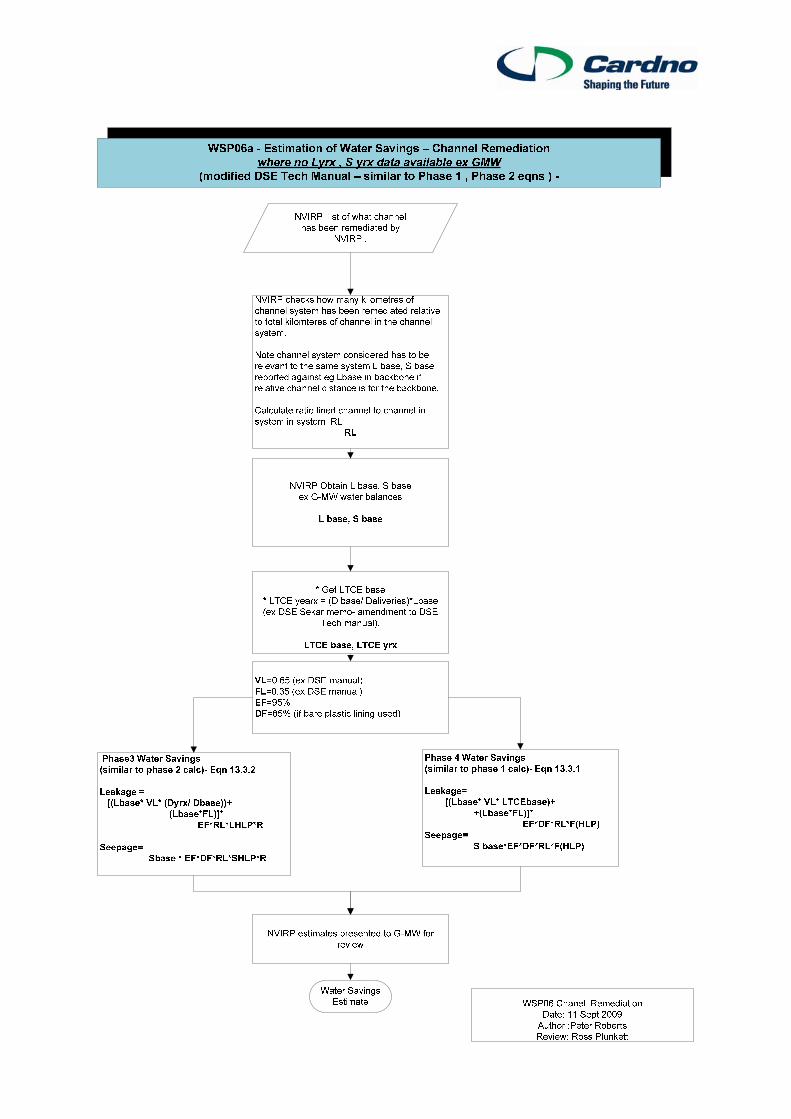

Appendix E Essential Service Commission Standard Compliance Grading System
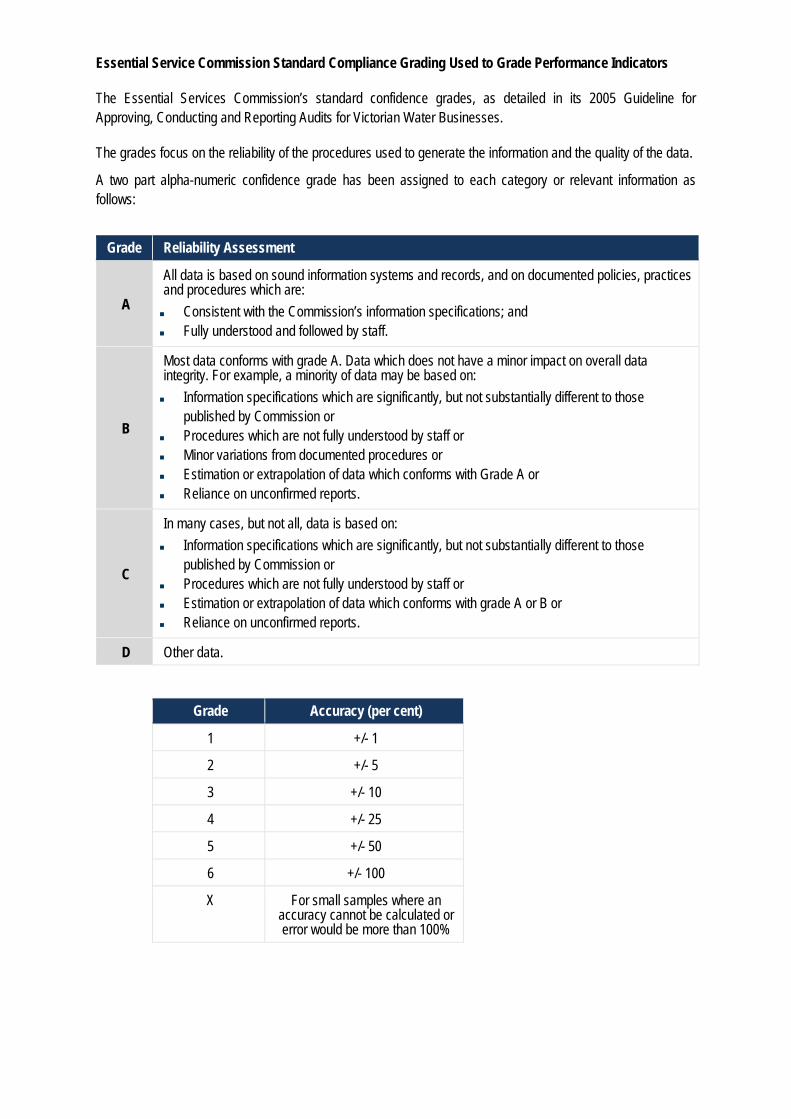
Essential Service Commission Standard Compliance Grading Used to Grade Performance Indicators
The Essential Services Commission’s standard confidence grades, as detailed in its 2005 Guideline for Approving, Conducting and Reporting Audits for Victorian Water Businesses.
The grades focus on the reliability of the procedures used to generate the information and the quality of the data.
A two part alpha-numeric confidence grade has been assigned to each category or relevant information as follows:
Grade Reliability Assessment
A
All data is based on sound information systems and records, and on documented policies, practices and procedures which are: � Consistent with the Commission’s information specifications; and � Fully understood and followed by staff.
B
Most data conforms with grade A. Data which does not have a minor impact on overall data integrity. For example, a minority of data may be based on: � Information specifications which are significantly, but not substantially different to those
published by Commission or � Procedures which are not fully understood by staff or � Minor variations from documented procedures or � Estimation or extrapolation of data which conforms with Grade A or � Reliance on unconfirmed reports.
C
In many cases, but not all, data is based on: � Information specifications which are significantly, but not substantially different to those
published by Commission or � Procedures which are not fully understood by staff or � Estimation or extrapolation of data which conforms with grade A or B or � Reliance on unconfirmed reports.
D Other data.
Grade Accuracy (per cent)
1 +/- 1
2 +/- 5
3 +/- 10
4 +/- 25
5 +/- 50
6 +/- 100
X For small samples where an accuracy cannot be calculated or error would be more than 100%