Embed Size (px)
Citation preview

PoPulation
Until the latter part of the 2000s, the “graying of North Dakota” seemed relatively certain; decades of population loss or mixed growth in most counties2, the aging of the baby boomers (born 1946 through 1964) and improvements in life expectancy led to predictions of increasingly high proportions of elderly in counties throughout the state.
More recently, however, energy development in western North Dakota has contributed to population growth in some areas of the state and demographic shifts across the state. Although proportions are not expected to reach as high of levels as previously projected, the senior population has been growing in the state and will continue to do so.
The leading edge of the baby boom began to turn 65 in 2011. That year, 14.4 percent of North Dakota’s population was ages 65 and older (98,595 people), the 12th highest proportion in the nation3. In 16 of the state’s 53 counties, the proportion was at least 23 percent3. Figure 1 offers a national comparison using 2010 data4. By 2025, 26 counties are expected to have at least 23 percent seniors2.
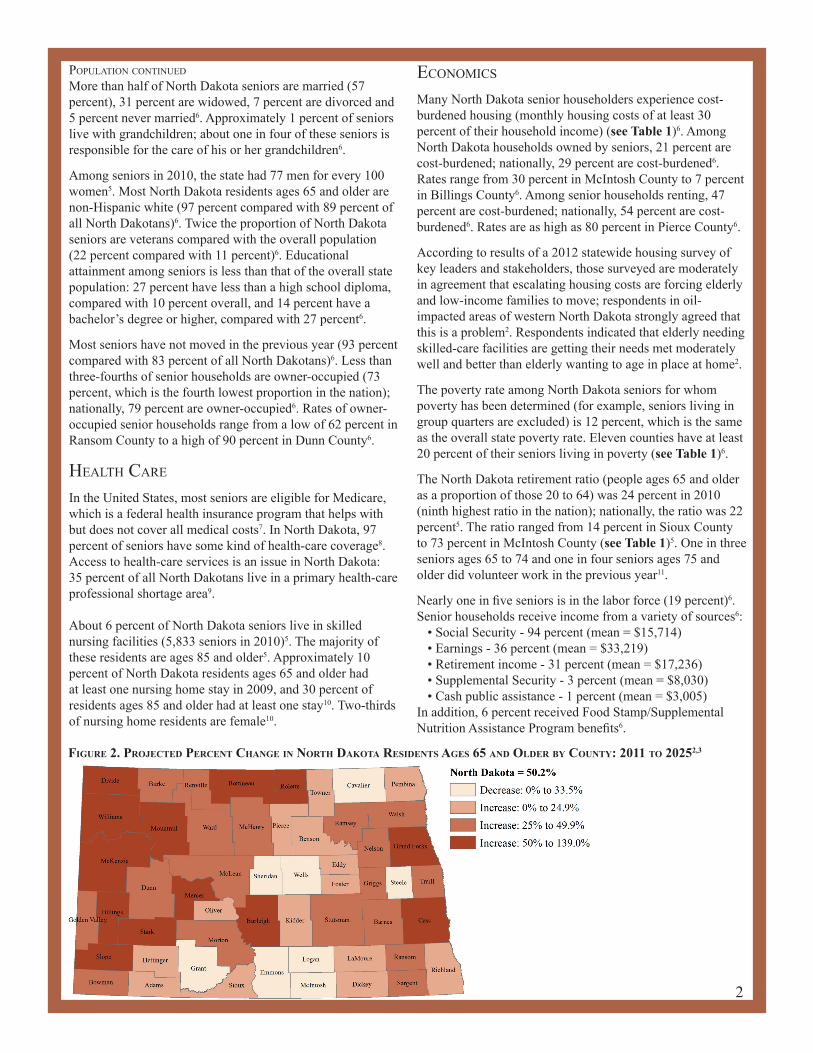
Statewide, the number of seniors is expected to increase 50 percent (from 98,595 in 2011 to 148,060 in 2025), with the overall state proportion rising to 17.6 percent2,3. In western North Dakota, McKenzie, Williams and Divide counties are expected to more than double their numbers of seniors from 2011 to 2025 (see Figure 2)2,3.
In 2011, North Dakota had the second highest proportion of older seniors ages 85 and older in the nation at 2.5 percent3. The number of these older seniors more than doubled from 1980 to 2011 (from 8,140 to 17,216 residents), but it is expected to stay fairly stable during the next 14 years2,3,5.
In 2010, North Dakota had 221 residents age 100 and older (more than double the 103 residents in 1980); 90 percent of these centenarians were women (up from 69 percent in 1980)5.
The vast majority of North Dakota residents ages 65 and older live in households (93 percent); one in four of all households has at least one senior (24 percent)6. Of the more than 61,000 heads of households (householders) who are seniors, half live alone (second highest proportion in the nation); nationally, 44 percent live alone6. Proportions living alone range from a high of 62 percent in Nelson County to a low of 30 percent in Slope County (see Table 1)6. Among householders living alone, 72 percent are female6.
North Dakota’s agiNg PoPulatioN:Profile aND treNDs of seNiors ages 65 aND olDer
eC1673 JuNe 2013ramoNa DaNielsoN
OVERVIEW: This aging population brief presents a picture of the health, finances and well-being of adults ages 65 and older in North Dakota. The brief focuses on well-being indicators1 including population, health care, economics, health risks and behaviors, and health status, as well as cognitive impairment and caregiving.
1
Stat
ewid
e, t
he
nu
mbe
r o
f n
ort
h d
ako
ta r
eSid
entS
ag
eS 6
5 an
d o
lder
iS
expe
cted
to in
crea
Se 5
0 pe
rcen
t, f
rom 9
8,59
5 in
201
1 to
148
,060
in 2
0252,
3 .
figure 1. PerCeNt ages 65 aND olDer by CouNty: 20104
Prepared by the Center for Social Research at NDSU for NDSU Extension Service. NDSU is an EO/AA institution. For more information, contact Jane Strommen at (701) 231-5948 or [email protected]. For more information on this and other topics, see www.ag.ndsu.edu. NDSU encourages you to use and share this content, but please do so under the conditions of our Creative Commons license. You may copy, distribute, transmit and adapt this work as long as you give full attribution, don’t use the work for commercial purposes and share your resulting work similarly. For more information, visit www.ag.ndsu.edu/agcomm/creative-commons.County commissions, North Dakota State University and U.S. Department of Agriculture cooperating. North Dakota State University does not discriminate on the basis of age, color, disability, gender expression/identity, genetic information, marital status, national origin, public assistance status, sex, sexual orientation, status as a U.S. veteran, race or religion. Direct inquiries to the Vice President for Equity, Diversity and Global Outreach, 205 Old Main, (701) 231-7708. This publication will be made available in alternative formats for people with disabilities upon request, (701) 231-7881.
PoPulation continued
More than half of North Dakota seniors are married (57 percent), 31 percent are widowed, 7 percent are divorced and 5 percent never married6. Approximately 1 percent of seniors live with grandchildren; about one in four of these seniors is responsible for the care of his or her grandchildren6.
Among seniors in 2010, the state had 77 men for every 100 women5. Most North Dakota residents ages 65 and older are non-Hispanic white (97 percent compared with 89 percent of all North Dakotans)6. Twice the proportion of North Dakota seniors are veterans compared with the overall population (22 percent compared with 11 percent)6. Educational attainment among seniors is less than that of the overall state population: 27 percent have less than a high school diploma, compared with 10 percent overall, and 14 percent have a bachelor’s degree or higher, compared with 27 percent6.
Most seniors have not moved in the previous year (93 percent compared with 83 percent of all North Dakotans)6. Less than three-fourths of senior households are owner-occupied (73 percent, which is the fourth lowest proportion in the nation); nationally, 79 percent are owner-occupied6. Rates of owner-occupied senior households range from a low of 62 percent in Ransom County to a high of 90 percent in Dunn County6.
HealtH care
In the United States, most seniors are eligible for Medicare, which is a federal health insurance program that helps with but does not cover all medical costs7. In North Dakota, 97 percent of seniors have some kind of health-care coverage8. Access to health-care services is an issue in North Dakota:35 percent of all North Dakotans live in a primary health-care professional shortage area9.
About 6 percent of North Dakota seniors live in skilled nursing facilities (5,833 seniors in 2010)5. The majority of these residents are ages 85 and older5. Approximately 10 percent of North Dakota residents ages 65 and older had at least one nursing home stay in 2009, and 30 percent of residents ages 85 and older had at least one stay10. Two-thirds of nursing home residents are female10.
economics
Many North Dakota senior householders experience cost-burdened housing (monthly housing costs of at least 30 percent of their household income) (see Table 1)6. Among North Dakota households owned by seniors, 21 percent are cost-burdened; nationally, 29 percent are cost-burdened6. Rates range from 30 percent in McIntosh County to 7 percent in Billings County6. Among senior households renting, 47 percent are cost-burdened; nationally, 54 percent are cost-burdened6. Rates are as high as 80 percent in Pierce County6.
According to results of a 2012 statewide housing survey of key leaders and stakeholders, those surveyed are moderately in agreement that escalating housing costs are forcing elderly and low-income families to move; respondents in oil-impacted areas of western North Dakota strongly agreed that this is a problem2. Respondents indicated that elderly needing skilled-care facilities are getting their needs met moderately well and better than elderly wanting to age in place at home2.
The poverty rate among North Dakota seniors for whom poverty has been determined (for example, seniors living in group quarters are excluded) is 12 percent, which is the same as the overall state poverty rate. Eleven counties have at least 20 percent of their seniors living in poverty (see Table 1)6.
The North Dakota retirement ratio (people ages 65 and older as a proportion of those 20 to 64) was 24 percent in 2010 (ninth highest ratio in the nation); nationally, the ratio was 22 percent5. The ratio ranged from 14 percent in Sioux County to 73 percent in McIntosh County (see Table 1)5. One in three seniors ages 65 to 74 and one in four seniors ages 75 and older did volunteer work in the previous year11.
Nearly one in five seniors is in the labor force (19 percent)6. Senior households receive income from a variety of sources6:
• Social Security - 94 percent (mean = $15,714)• Earnings - 36 percent (mean = $33,219)• Retirement income - 31 percent (mean = $17,236)• Supplemental Security - 3 percent (mean = $8,030)• Cash public assistance - 1 percent (mean = $3,005)
In addition, 6 percent received Food Stamp/Supplemental Nutrition Assistance Program benefits6.
figure 2. ProJeCteD PerCeNt ChaNge iN North Dakota resiDeNts ages 65 aND olDer by CouNty: 2011 to 20252,3
2

HealtH risks, BeHaviors and status
Health risk factors among North Dakota seniors include low physical activity (89 percent), high rates of being overweight (42 percent) and obese (24 percent), high blood pressure (57 percent), not getting a flu shot (42 percent) or a pneumonia vaccine (30 percent), being limited in activities (31 percent), low levels of education (27 percent), and poverty (12 percent) (see Figure 3)8.
Half of North Dakota residents ages 65 and older have arthritis, nearly one in three has vision impairment (31 percent) and one in five has diabetes (19 percent)8. Nearly one in three seniors reports being limited in activities because of physical, mental or emotional problems (31 percent); 16 percent require the use of special equipment8.
More than one-third of noninstitutionalized seniors report having a disability (35 percent)12. Difficulties include ambulatory (20 percent), hearing (16 percent), independent living (13 percent), vision (7 percent), cognitive (6 percent) and self-care (5 percent)12.
Among calls North Dakota seniors make for emergency medical services, the vast majority are for falls (2,779 calls in 2008, which is 87 percent of all calls by seniors)13. In 2011, 68 deaths were attributed to falls among North Dakota seniors ages 70 and older13.
cognitive imPairment
Among North Dakota nursing home residents in 2009, nearly half (47 percent) had severe or moderate cognitive impairment, and an additional 31 percent had mild or very mild impairment10. Alzheimer’s disease is the most common form. In 2010, about 18,000 North Dakota residents ages 65 and older were living with Alzheimer’s disease: 700 ages 65 to 74, 7,700 ages 75 to 84, and 9,800 ages 85 and older14. Nationally, an estimated one in nine people ages 65 and older and one in three people ages 85 and older have the disease14. Alzheimer’s disease is the fifth leading cause of death in the United States among seniors and continues to increase as a cause of death, while causes such as stroke and heart disease are decreasing in prevalence14.
caregiving
Nationally, about one in seven people with Alzheimer’s and other dementias lives alone; many do not have someone providing care to them, putting them at higher risk of issues such as malnutrition, inadequate self-care and accidental death15. In North Dakota, an estimated 28,000 informal caregivers provided 32 million hours of unpaid dementia care in 2012, with a value of $400 million14.
sources1) Federal Interagency Forum on Aging-Related Statistics.(2012). Older Americans 2012: Key Indicators of Well-Being, www.agingstats.gov/2) Center for Social Research at NDSU; CSR’s 2012 North Dakota Statewide Housing Needs Assessment, www.ndhfa.org/3) U.S. Census Bureau, Population Division, Annual Estimates of the Resident Population by Selected Age Groups and Sex for Counties in North Dakota: April 1, 2010, to July 1, 2011 (CC-EST2011-AGESEX-38), www.census.gov/popest/4) U.S. Census Bureau. (2011). The Older Population: 2010, www.census.gov/prod/cen2010/briefs/c2010br-09.pdf 5) U.S. Census Bureau, Decennial Census6) U.S. Census Bureau, American Community Survey, 2007-2011 5-Year Estimates, factfinder2.census.gov/7) U.S. Social Security Administration, How to Qualify for Medicare, ssa-custhelp.ssa.gov/app/answers/detail/a_id/400/~/how-to-qualify-for-medicare8) Behavioral Risk Factor Surveillance System, 2011, http://apps.nccd.cdc.gov/brfss/ 9) Health Resources and Services Administration, State Population and HPSA Designation Population Statistics, http://datawarehouse.hrsa.gov10) U.S. Centers for Medicare & Medicaid Services. (2010). Nursing Home Data Compendium. www.cms.gov/Medicare/Provider-Enrollment-and-Certification/CertificationandComplianc/NHs.html 11) Current Population Survey, 2009-2011, from www.ndcompass.org12) U.S. Census Bureau, American Community Survey, 2011 1-Year Estimates, http://factfinder2.census13) North Dakota Department of Health, data by special request14) Alzheimer’s Association, 2013 Alzheimer’s disease facts and figures, www.alz.org/15) Alzheimer’s Association, 2012 Alzheimer’s disease facts and figures, www.alz.org/16) Family Caregiver Alliance. Who Are the Caregivers?www.caregiver.org/caregiver/jsp/content_node.jsp?nodeid=89217) North Dakota Department of Human Services, Vulnerable Adult Protective Services, Federal Fiscal Year 2012, data by special request
Notes: low physical activity = not participating in enough aerobic and muscle-strengthening exercise to meet guidelines; low education = less than a high school diploma; current smoker = every day or occasionally
3
Research shows that, nationally, two-thirds of seniors with long-term care needs rely exclusively on informal caregiving by friends and family; half of seniors in need of long-term care who do not have a family caregiver are in nursing homes, compared with 7 percent who have a family caregiver16. Informal care includes hands-on health provision, care management, companionship, decision making and advocacy16. The majority of informal care is provided by women; the average caregiver is in her mid-40s, married and working outside the home16. In addition to the expenses of caregiving, caregiving responsibilities can lead to financial hardship through lost wages from reduced work hours, passing on a promotion, taking a leave of absence, time out of the workforce and early retirement, which all can impact retirement income down the road16.
In federal fiscal year 2012, 515 new cases of vulnerable adults in North Dakota who had been subjected to (or were at risk of) abuse or neglect were reported; of those, 77 percent were adults ages 60 and older17. More than half of all cases (60 percent) were determined to be self-neglect; the remaining cases were neglect, abuse or financial exploitation (by a child in 43 percent of cases, a spouse in 16 percent of cases and some other person in 39 percent of cases)17. More than one-third of new cases involved adults with Alzheimer’s disease or dementia17.
4912
273031
4257
6689
0 20 40 60 80 100
Binge drinkerCurrent smoker
Living in povertyLow education
No pneumonia vaccineLimited in activities
No flu shotHigh blood pressureOverweight or obese
Low physical activity
Percent of residents ages 65+
Figure 3. Health Risk Factors Among North Dakota Seniors, 20116,8

table 1. CharaCteristiCs of North Dakota resiDeNts ages 65 aND olDer by CouNty
Location
TotalPopulation
20113
Retire-ment
Ratio* 20105
Population Ages 65+ Householders Ages 65+
Number 20113
% of Total Population
2011
Projected Number
20252
% Change in Number
2011 to 2025
% inPoverty#
2007-20116
% Living Alone2007-20116
Cost-Burdened^2007-20116
% Owner-Occupied
% Renter-Occupied
North Dakota 683,932 24.2% 98,595 14.4% 148,060 50.2% 12.2% 49.5% 21.1% 46.8%Adams 2,307 44.2% 569 24.7% 673 18.3% 10.1% 52.9% 9.7% 26.8%Barnes 11,056 34.6% 2,146 19.4% 2,911 35.6% 14.3% 53.3% 21.5% 41.9%Benson 6,723 25.3% 850 12.6% 869 2.2% 20.1% 38.7% 20.1% 35.3%Billings 816 31.5% 126 15.4% 250 98.4% 3.4% 40.0% 6.5% 0.0%Bottineau 6,443 38.3% 1,359 21.1% 2,259 66.2% 12.8% 54.1% 18.2% 51.3%Bowman 3,134 40.0% 657 21.0% 968 47.3% 17.5% 55.2% 19.9% 38.3%Burke 2,033 36.8% 399 19.6% 580 45.4% 7.4% 56.2% 16.2% 26.4%Burleigh 83,145 22.0% 11,356 13.7% 18,408 62.1% 9.4% 46.8% 19.5% 53.1%Cass 152,368 15.0% 15,076 9.9% 28,291 87.7% 9.0% 52.9% 21.8% 54.3%Cavalier 3,939 48.4% 1,011 25.7% 865 -14.4% 15.8% 42.9% 18.5% 42.7%Dickey 5,317 42.4% 1,180 22.2% 1,461 23.8% 15.8% 55.7% 17.7% 64.9%Divide 2,125 48.8% 551 25.9% 1,141 107.1% 6.8% 46.0% 17.5% 12.1%Dunn 3,720 29.7% 616 16.6% 914 48.4% 10.0% 48.9% 13.9% 13.9%Eddy 2,380 46.7% 581 24.4% 672 15.7% 21.3% 54.6% 19.3% 35.6%Emmons 3,546 55.4% 979 27.6% 930 -5.0% 23.5% 48.9% 28.0% 27.6%Foster 3,341 42.6% 743 22.2% 810 9.0% 14.2% 42.7% 23.2% 46.6%Golden Valley 1,752 40.5% 358 20.4% 513 43.3% 10.2% 57.9% 12.7% 53.7%Grand Forks 66,598 16.1% 7,047 10.6% 11,389 61.6% 10.7% 54.3% 28.6% 49.7%Grant 2,337 50.7% 649 27.8% 647 -0.3% 19.9% 50.0% 28.9% 42.0%Griggs 2,372 49.5% 646 27.2% 863 33.6% 20.2% 50.3% 21.6% 33.7%Hettinger 2,515 48.3% 624 24.8% 760 21.8% 12.5% 49.6% 18.7% 4.4%Kidder 2,414 37.8% 491 20.3% 588 19.8% 22.9% 44.5% 25.3% 43.3%LaMoure 4,105 47.0% 1,004 24.5% 1,127 12.3% 18.1% 46.8% 19.3% 41.2%Logan 1,985 56.4% 558 28.1% 371 -33.5% 17.7% 43.5% 27.0% 41.2%McHenry 5,505 37.2% 1,137 20.7% 1,526 34.2% 15.6% 53.3% 24.7% 18.0%McIntosh 2,769 73.1% 942 34.0% 916 -2.8% 20.7% 47.4% 29.8% 29.7%McKenzie 7,019 24.9% 911 13.0% 2,177 139.0% 10.6% 45.4% 8.5% 20.8%McLean 9,068 38.1% 1,994 22.0% 2,711 36.0% 11.9% 45.4% 18.6% 24.5%Mercer 8,449 25.8% 1,345 15.9% 2,019 50.1% 13.2% 43.4% 21.6% 40.4%Morton 27,734 24.6% 4,096 14.8% 5,879 43.5% 10.3% 45.6% 18.7% 40.5%Mountrail 8,097 22.8% 1,037 12.8% 1,816 75.1% 11.7% 33.3% 23.5% 36.5%Nelson 3,057 51.7% 826 27.0% 1,208 46.2% 13.4% 62.0% 21.3% 32.3%Oliver 1,830 28.0% 298 16.3% 370 24.2% 20.0% 47.7% 19.6% 34.0%Pembina 7,342 35.6% 1,473 20.1% 1,718 16.6% 11.2% 50.5% 17.6% 39.4%Pierce 4,375 44.8% 1,013 23.2% 1,239 22.3% 17.8% 53.5% 28.1% 79.6%Ramsey 11,452 31.8% 2,062 18.0% 2,908 41.0% 14.3% 52.7% 16.9% 39.6%Ransom 5,403 36.2% 1,074 19.9% 1,347 25.4% 12.2% 47.3% 27.9% 43.5%Renville 2,490 36.0% 488 19.6% 644 32.0% 5.8% 40.0% 11.9% 0.0%Richland 16,245 25.6% 2,403 14.8% 2,889 20.2% 9.7% 50.6% 23.5% 44.2%Rolette 14,206 18.8% 1,445 10.2% 2,480 71.6% 28.6% 40.0% 23.2% 30.6%Sargent 3,798 33.7% 731 19.2% 1,068 46.1% 7.5% 45.8% 15.5% 39.1%Sheridan 1,309 57.1% 400 30.6% 365 -8.8% 18.4% 38.2% 15.8% 50.0%Sioux 4,280 13.5% 315 7.4% 388 23.2% 37.2% 45.0% 28.6% 7.4%Slope 718 31.5% 136 18.9% 241 77.2% 15.6% 30.0% 11.3% 44.4%Stark 25,177 27.0% 3,927 15.6% 6,105 55.5% 13.5% 49.3% 22.0% 49.9%Steele 1,950 40.7% 427 21.9% 372 -12.9% 7.5% 42.0% 12.4% 31.3%Stutsman 21,062 28.8% 3,630 17.2% 4,622 27.3% 12.4% 52.6% 25.0% 38.0%Towner 2,264 45.1% 543 24.0% 552 1.7% 8.3% 58.5% 15.8% 47.1%Traill 8,147 33.7% 1,545 19.0% 2,122 37.3% 12.1% 56.1% 20.8% 43.0%Walsh 11,032 36.2% 2,247 20.4% 2,949 31.2% 12.2% 54.7% 17.2% 32.9%Ward 64,072 21.6% 8,056 12.6% 10,661 32.3% 10.9% 45.2% 22.6% 59.3%Wells 4,237 56.4% 1,179 27.8% 1,175 -0.3% 19.5% 52.2% 17.4% 35.6%Williams 24,374 24.9% 3,339 13.7% 7,333 119.6% 9.8% 44.7% 14.4% 58.0%* Retirement ratio = number of people ages 65 and older as a proportion of persons ages 20 to 64# Among persons for whom poverty has been determined (for example, persons living in group quarters are excluded); living in poverty = incomes below 100 percent of the federal poverty level, see http://aspe.hhs.gov/poverty/13poverty.cfm for income limits^ Cost-burdened = households with monthly housing costs that are at least 30 percent of the household’s income 4