Embed Size (px)
Citation preview
NORTH CAROLINA
ENERGY POLICY COUNCIL
May 20, 2015
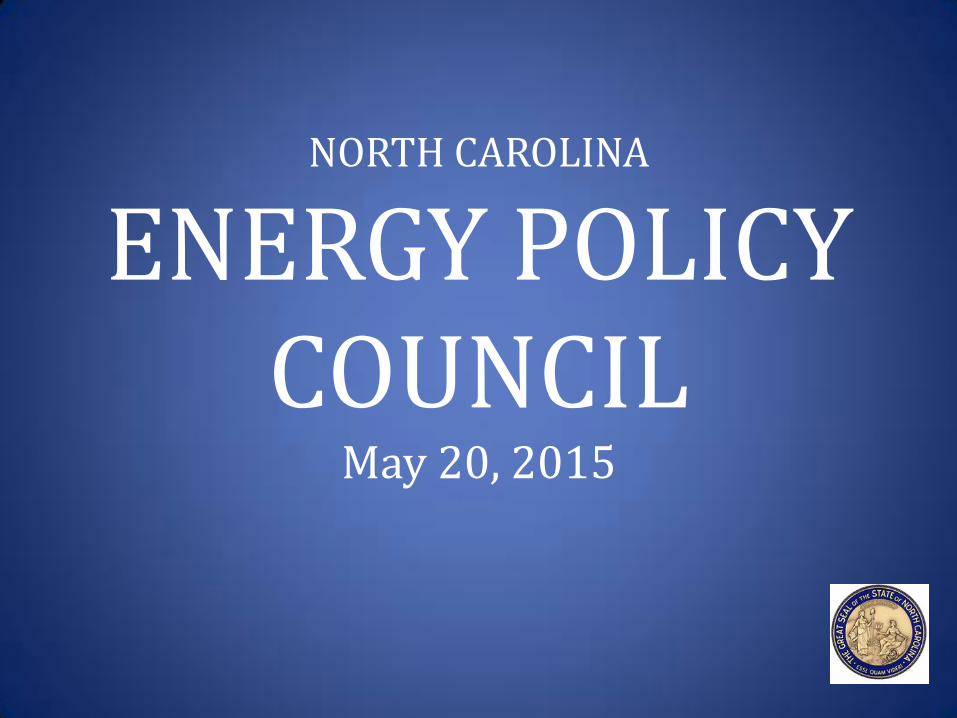
“To grow and prosper through the efficient and responsible utilization of our resources while providing our customers with cost-effective, responsive, and environmentally sound solutions to their solid waste management needs.” - WI Mission Statement
Founded 1970
Headquartered Raleigh, NC
1067 HD trucks and over 200 pieces of Landfill equipment
+2,200 employees
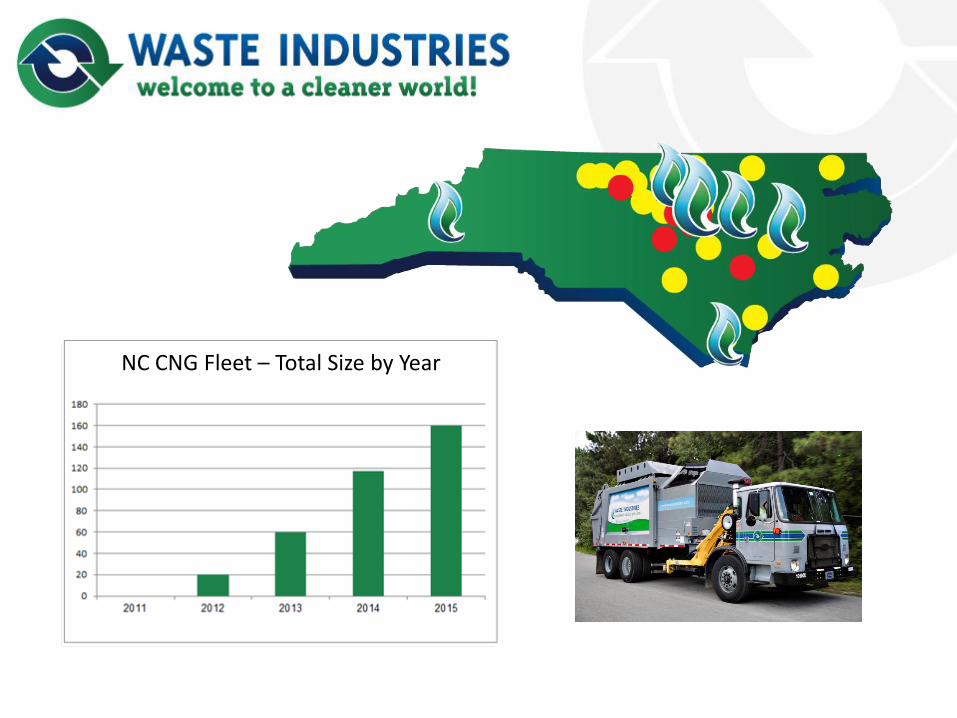
NC CNG Fleet – Total Size by Year
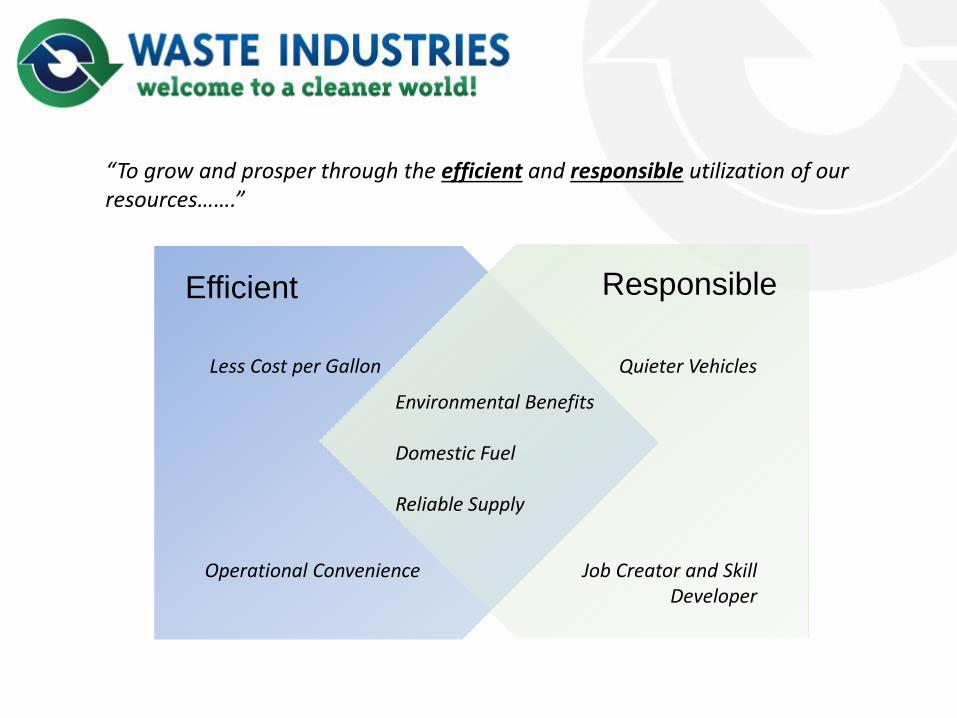
Efficient
Less Cost per Gallon Operational Convenience
Responsible
Quieter Vehicles
Job Creator and Skill Developer
Environmental Benefits Domestic Fuel Reliable Supply
“To grow and prosper through the efficient and responsible utilization of our resources…….”
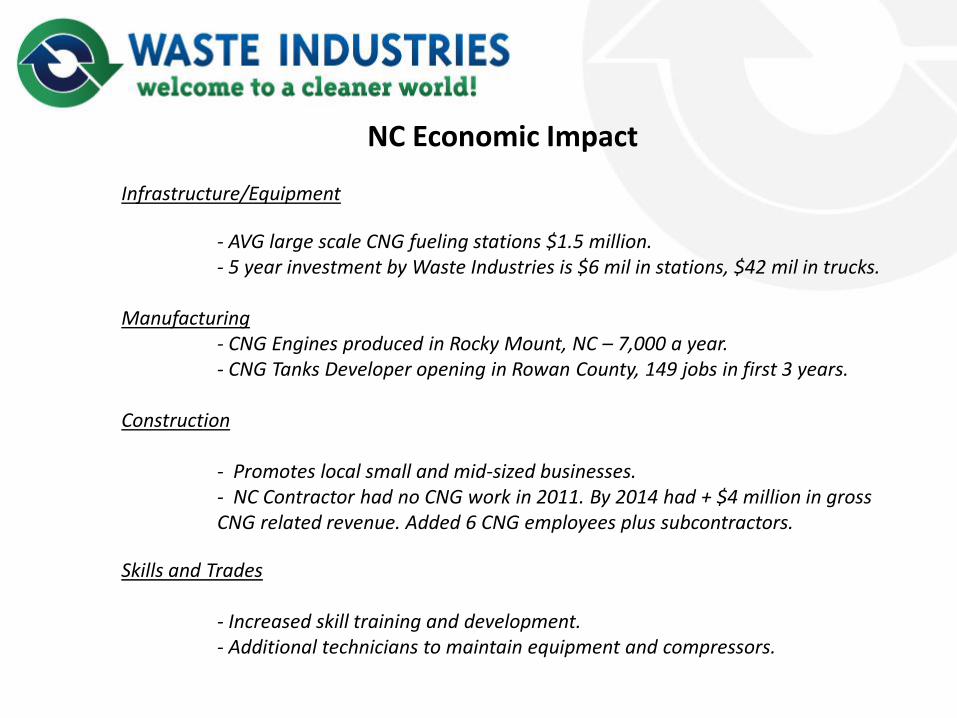
NC Economic Impact Infrastructure/Equipment
- AVG large scale CNG fueling stations $1.5 million. - 5 year investment by Waste Industries is $6 mil in stations, $42 mil in trucks. Manufacturing
- CNG Engines produced in Rocky Mount, NC – 7,000 a year. - CNG Tanks Developer opening in Rowan County, 149 jobs in first 3 years. Construction - Promotes local small and mid-sized businesses. - NC Contractor had no CNG work in 2011. By 2014 had + $4 million in gross CNG related revenue. Added 6 CNG employees plus subcontractors.
Skills and Trades - Increased skill training and development. - Additional technicians to maintain equipment and compressors.
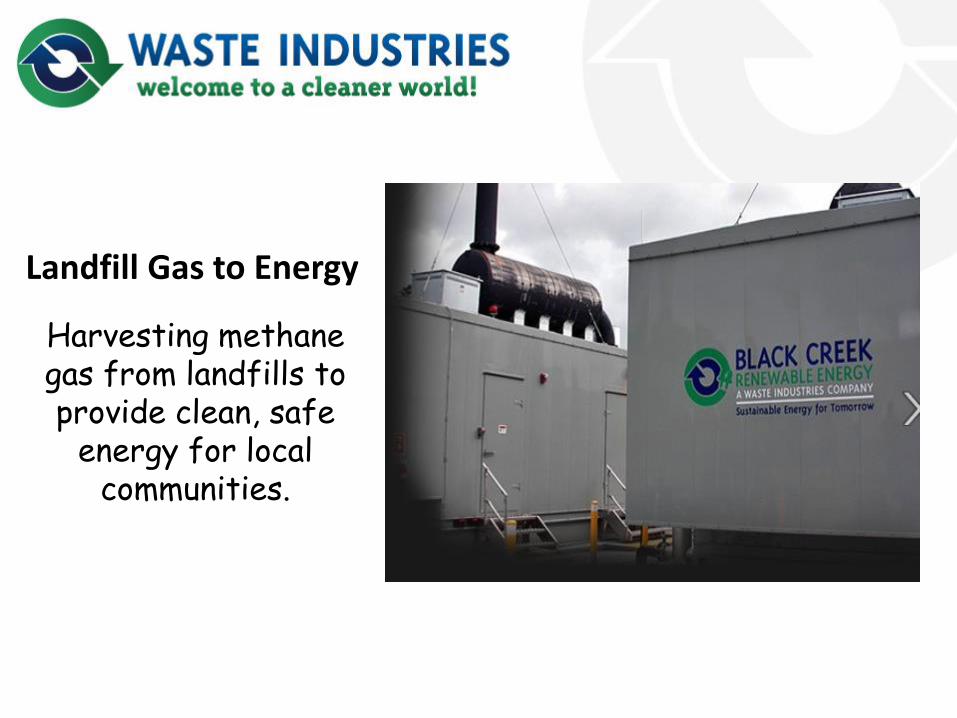
Landfill Gas to Energy
Harvesting methane gas from landfills to provide clean, safe
energy for local communities.
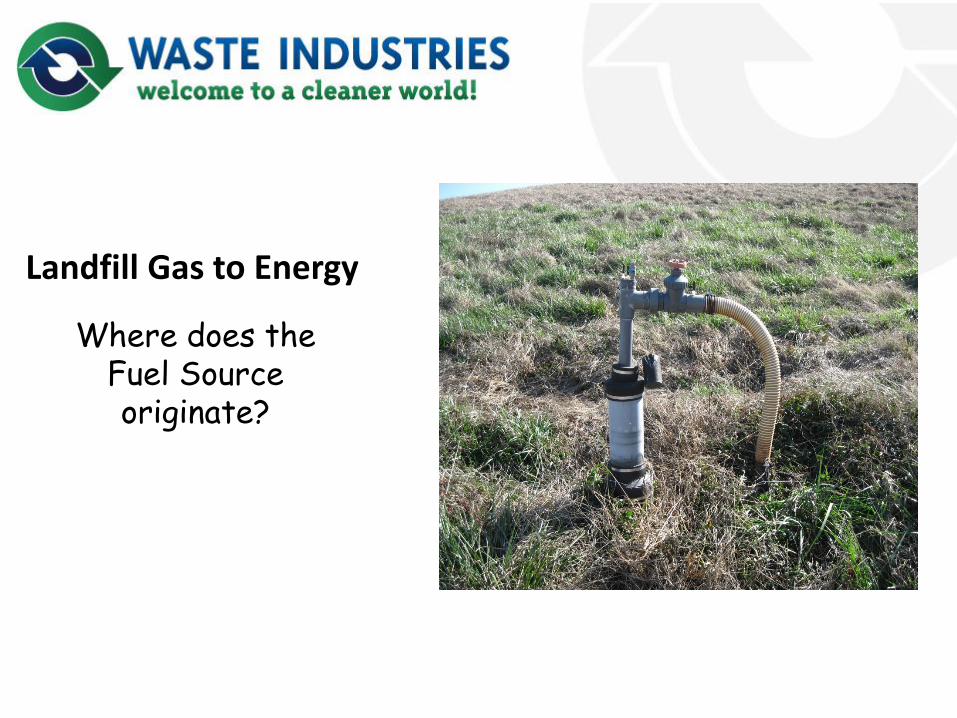
Landfill Gas to Energy
Where does the Fuel Source originate?
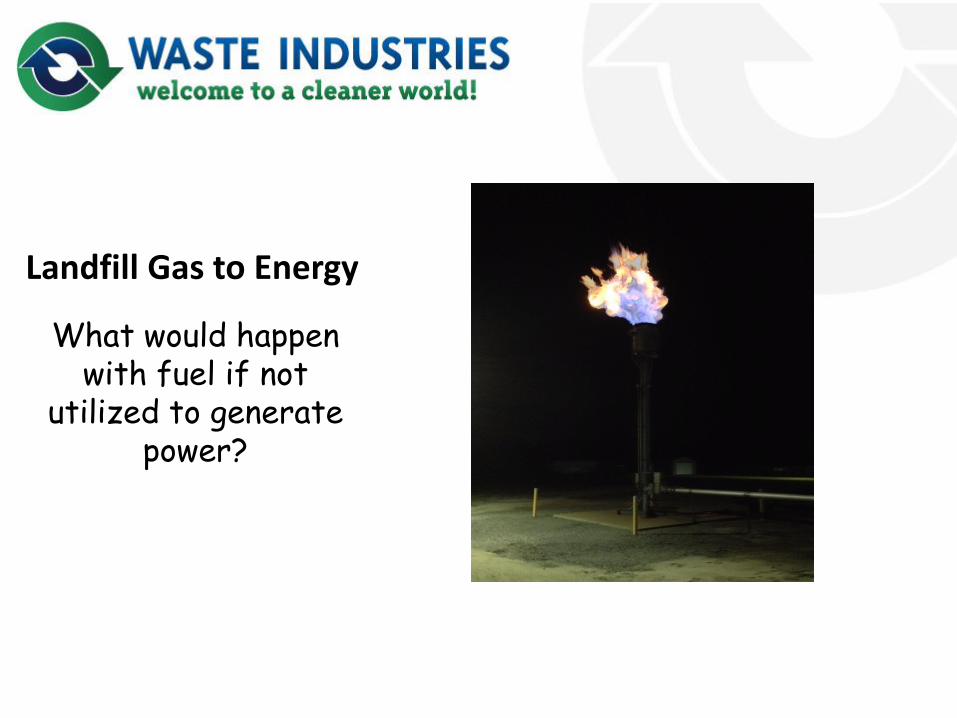
Landfill Gas to Energy
What would happen with fuel if not
utilized to generate power?
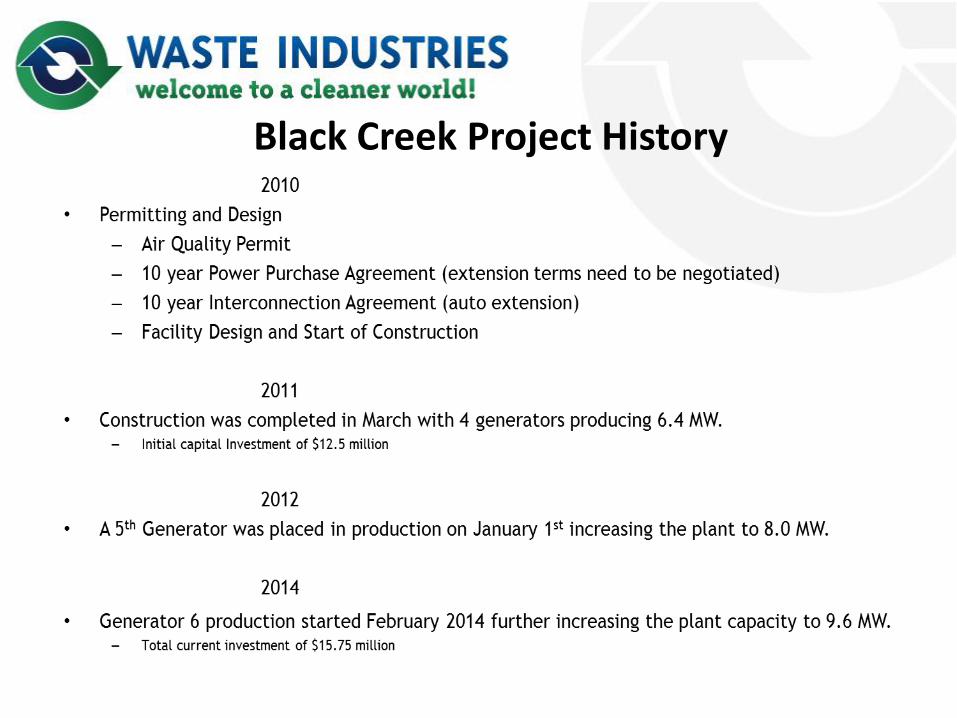
Black Creek Project History
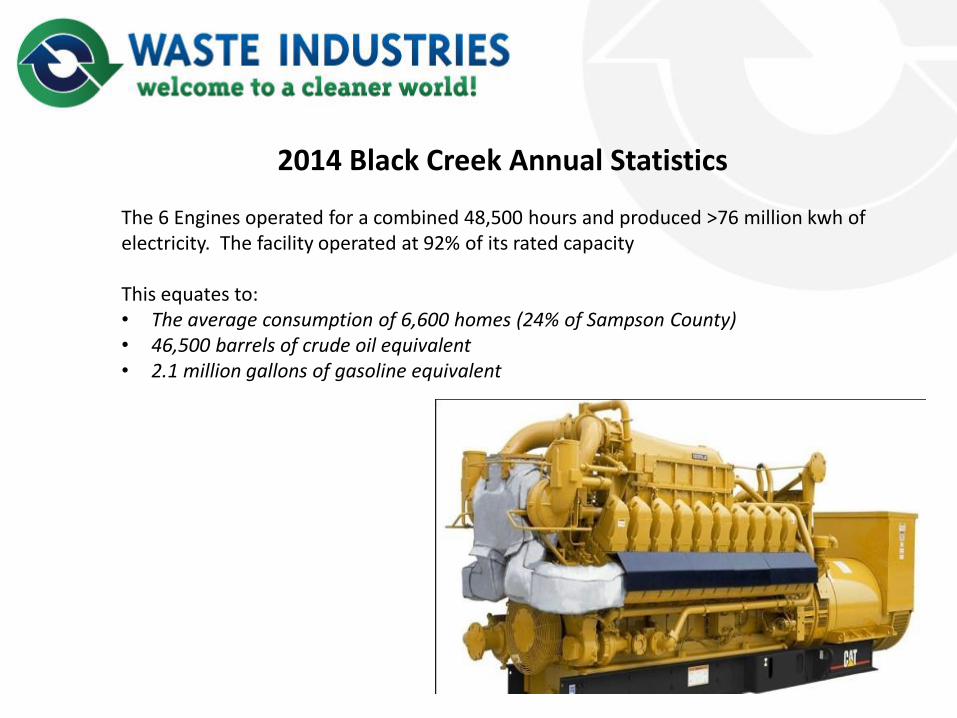
2014 Black Creek Annual Statistics
The 6 Engines operated for a combined 48,500 hours and produced >76 million kwh of electricity. The facility operated at 92% of its rated capacity This equates to: • The average consumption of 6,600 homes (24% of Sampson County) • 46,500 barrels of crude oil equivalent • 2.1 million gallons of gasoline equivalent
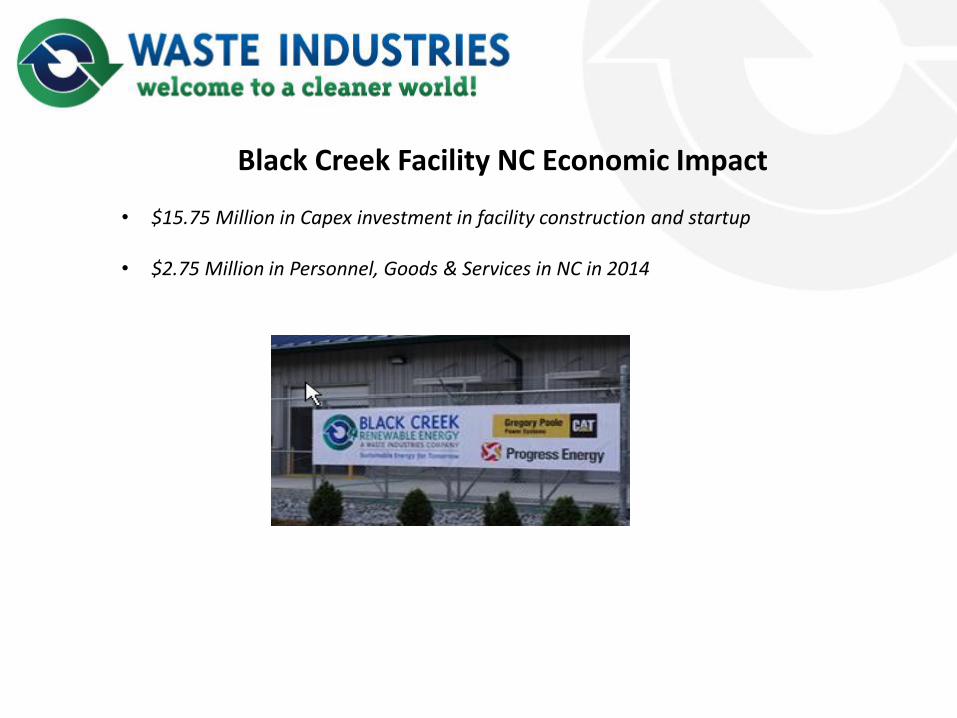
Black Creek Facility NC Economic Impact
• $15.75 Million in Capex investment in facility construction and startup • $2.75 Million in Personnel, Goods & Services in NC in 2014

Josh Thompson – Purchasing Manager (919) 325-3000 [email protected] David Pepper – Director of Capital Projects (919) 325-3000 [email protected] Phil Carter – Government Affairs (919) 201-3152
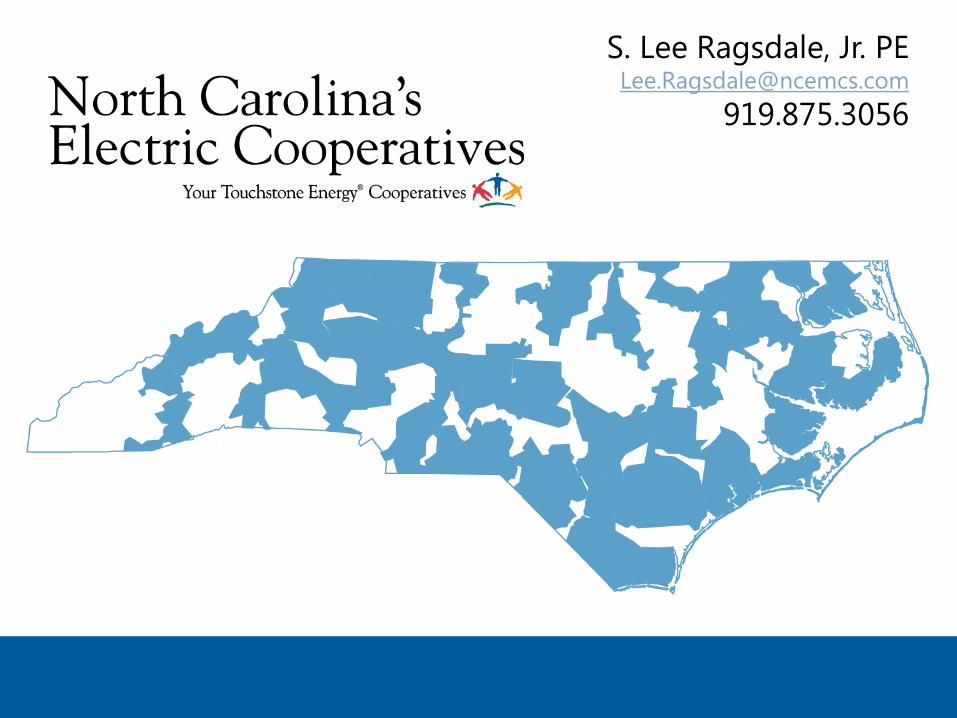
Overview of North Carolina’s Electric Cooperatives
S. Lee Ragsdale, Jr. PE
Vice President, Asset Management
North Carolina Energy Policy Council
May 20, 2015
15
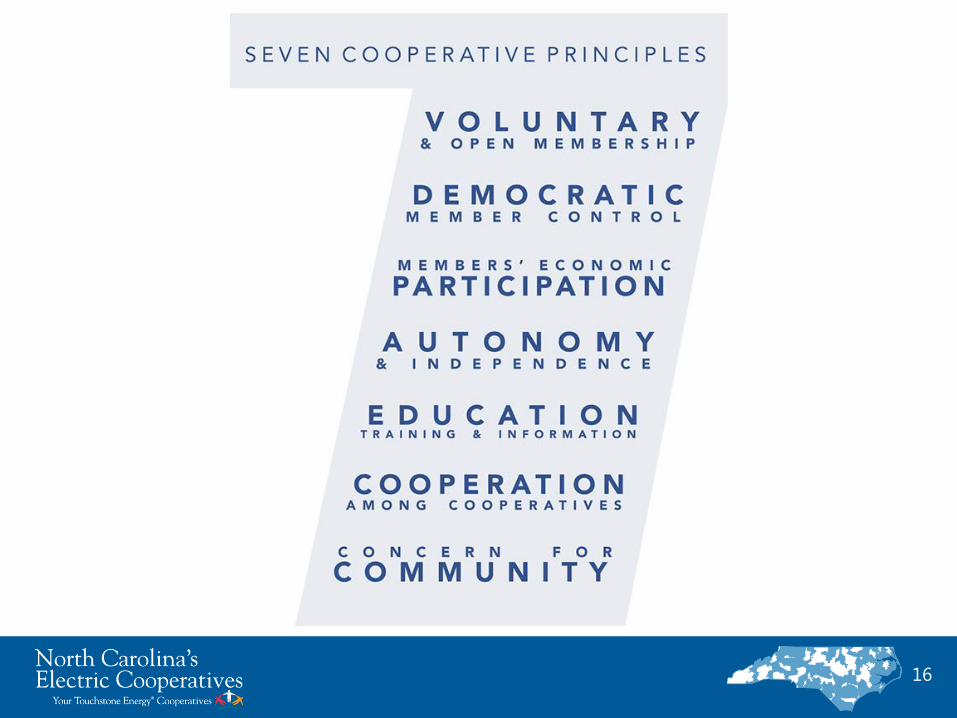
16
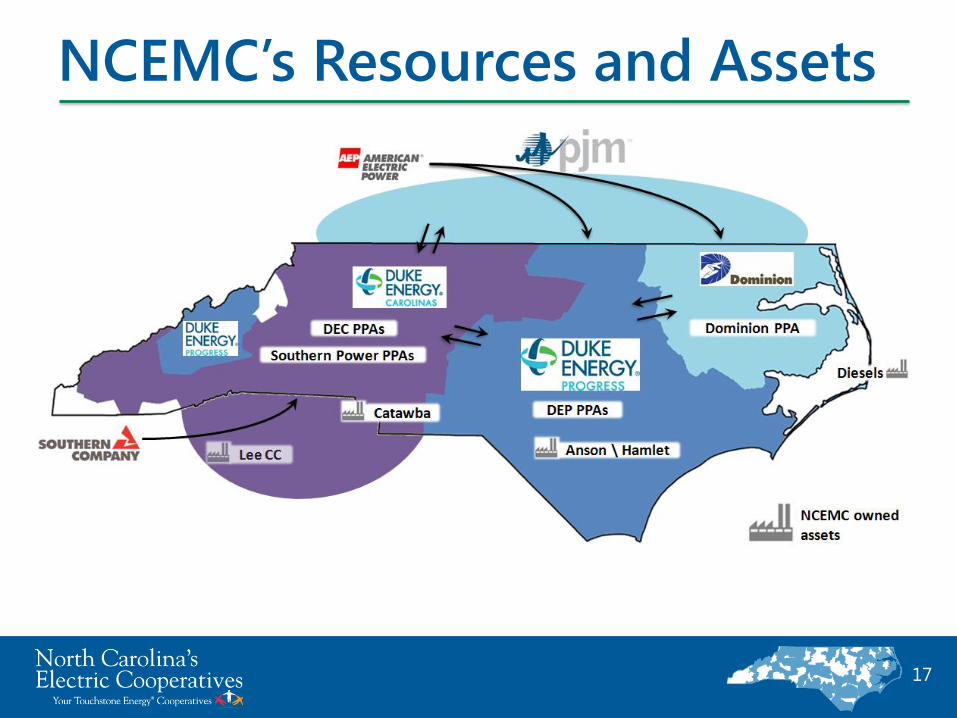
NCEMC’s Resources and Assets
17
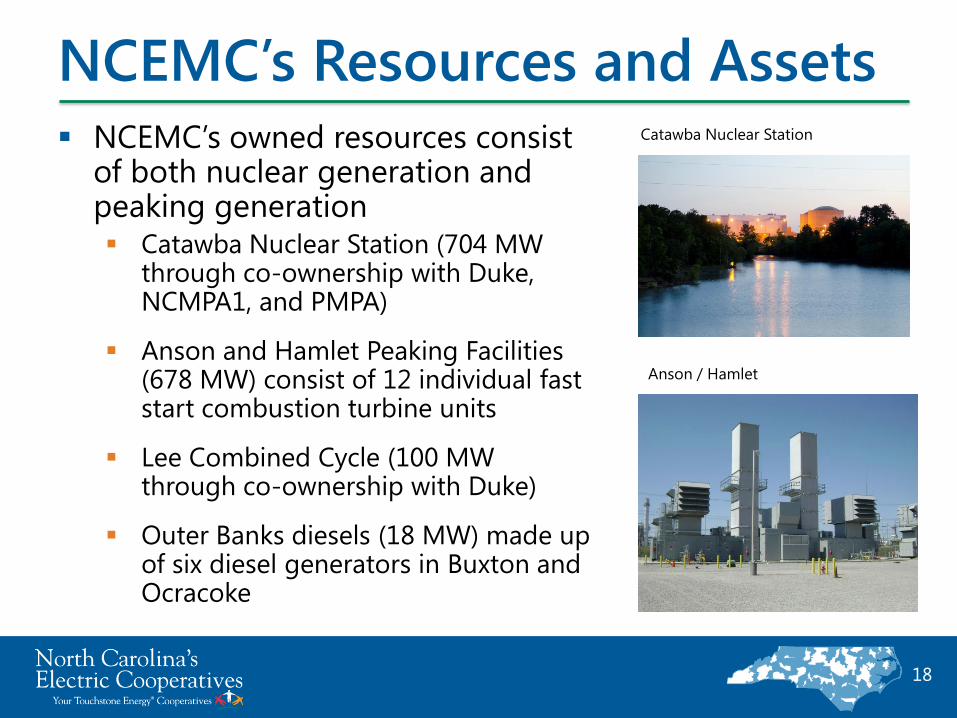
NCEMC’s owned resources consist of both nuclear generation and peaking generation Catawba Nuclear Station (704 MW
through co-ownership with Duke, NCMPA1, and PMPA)
Anson and Hamlet Peaking Facilities (678 MW) consist of 12 individual fast start combustion turbine units
Lee Combined Cycle (100 MW through co-ownership with Duke)
Outer Banks diesels (18 MW) made up of six diesel generators in Buxton and Ocracoke
18
Catawba Nuclear Station
Anson / Hamlet
NCEMC’s Resources and Assets
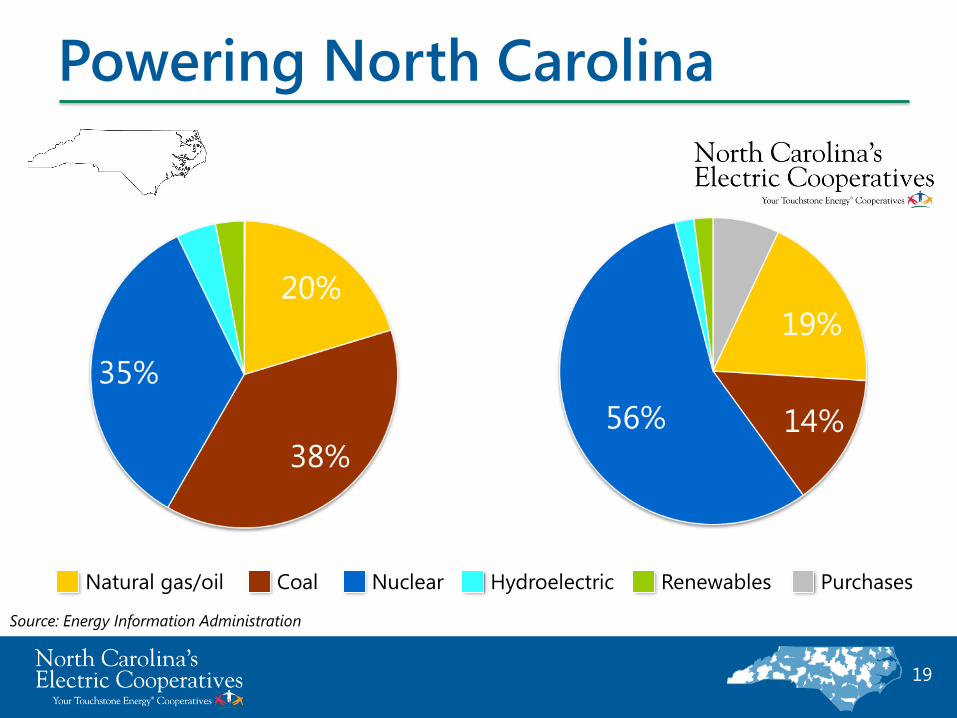
Powering North Carolina
19
Source: Energy Information Administration
Natural gas/oil Coal Nuclear Hydroelectric Renewables Purchases
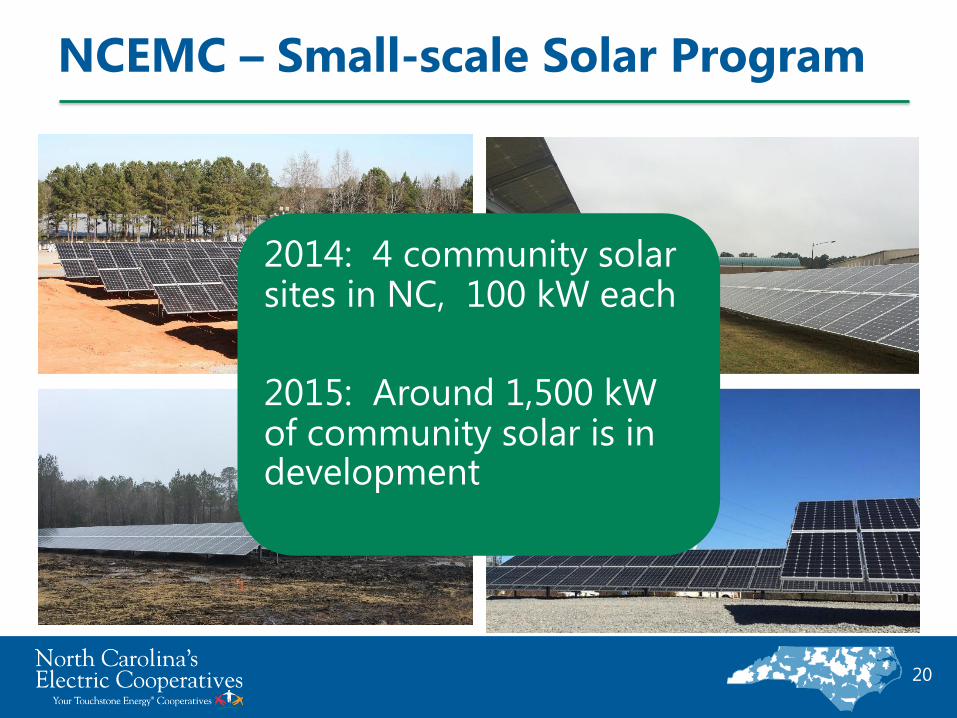
NCEMC – Small-scale Solar Program
20
2014: 4 community solar sites in NC, 100 kW each
2015: Around 1,500 kW of community solar is in development
10 % - REPS
90 %Non- REPS
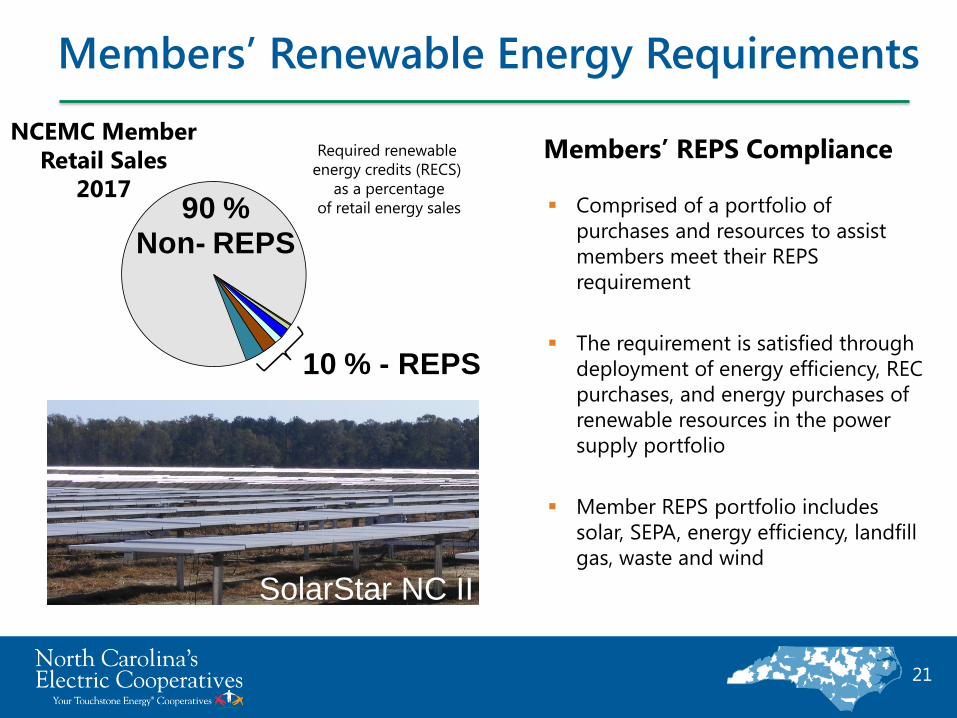
Members’ Renewable Energy Requirements
21
NCEMC Member
Retail Sales
2017
Required renewable
energy credits (RECS)
as a percentage
of retail energy sales
Members’ REPS Compliance
Comprised of a portfolio of
purchases and resources to assist
members meet their REPS
requirement
The requirement is satisfied through
deployment of energy efficiency, REC
purchases, and energy purchases of
renewable resources in the power
supply portfolio
Member REPS portfolio includes
solar, SEPA, energy efficiency, landfill
gas, waste and wind
SolarStar NC II
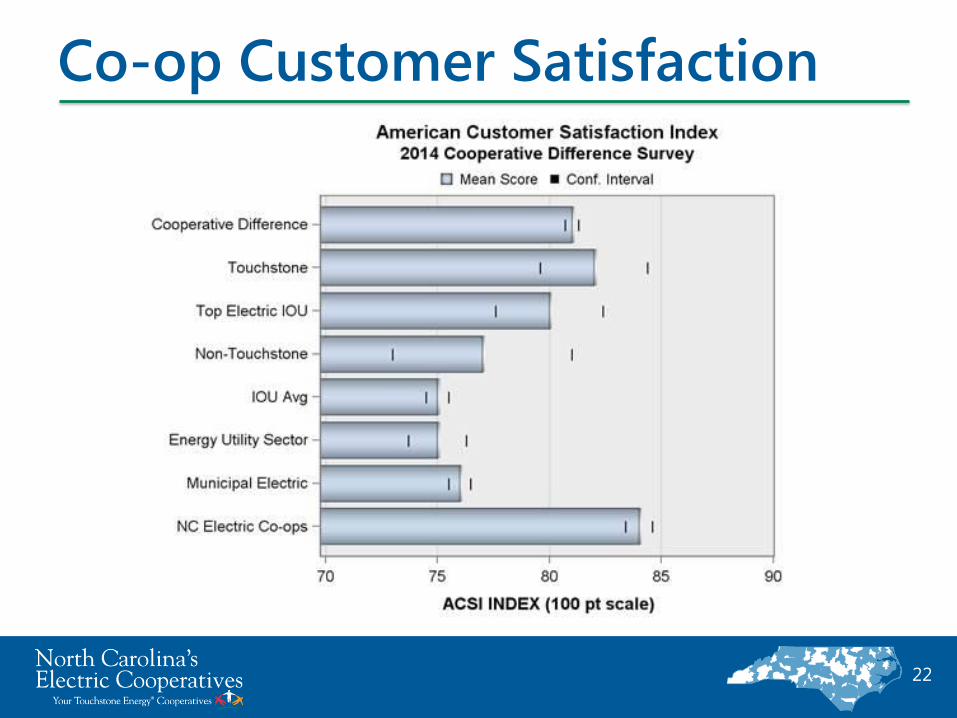
Co-op Customer Satisfaction
22
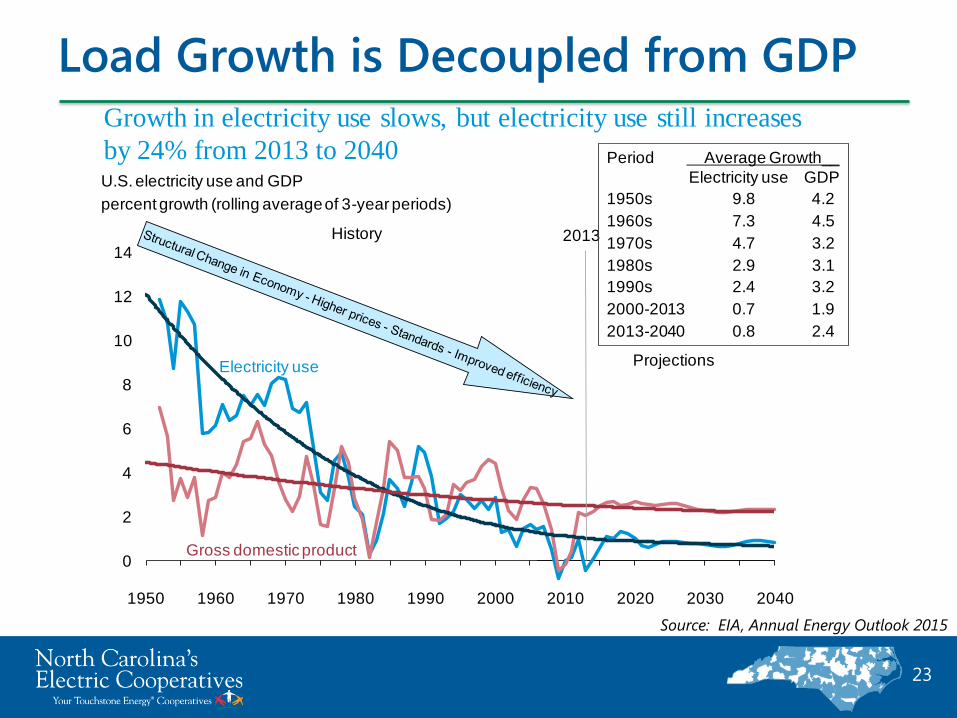
Load Growth is Decoupled from GDP
23
0
2
4
6
8
10
12
14
1950 1960 1970 1980 1990 2000 2010 2020 2030 2040
Growth in electricity use slows, but electricity use still increases
by 24% from 2013 to 2040U.S. electricity use and GDP
percent growth (rolling average of 3-year periods)
Source: EIA, Annual Energy Outlook 2015 Reference case
Projections
History 2013
Period Average Growth__
Electricity use GDP
1950s 9.8 4.2
1960s 7.3 4.5
1970s 4.7 3.2
1980s 2.9 3.1
1990s 2.4 3.2
2000-2013 0.7 1.9
2013-2040 0.8 2.4
Gross domestic product
Electricity use
Source: EIA, Annual Energy Outlook 2015
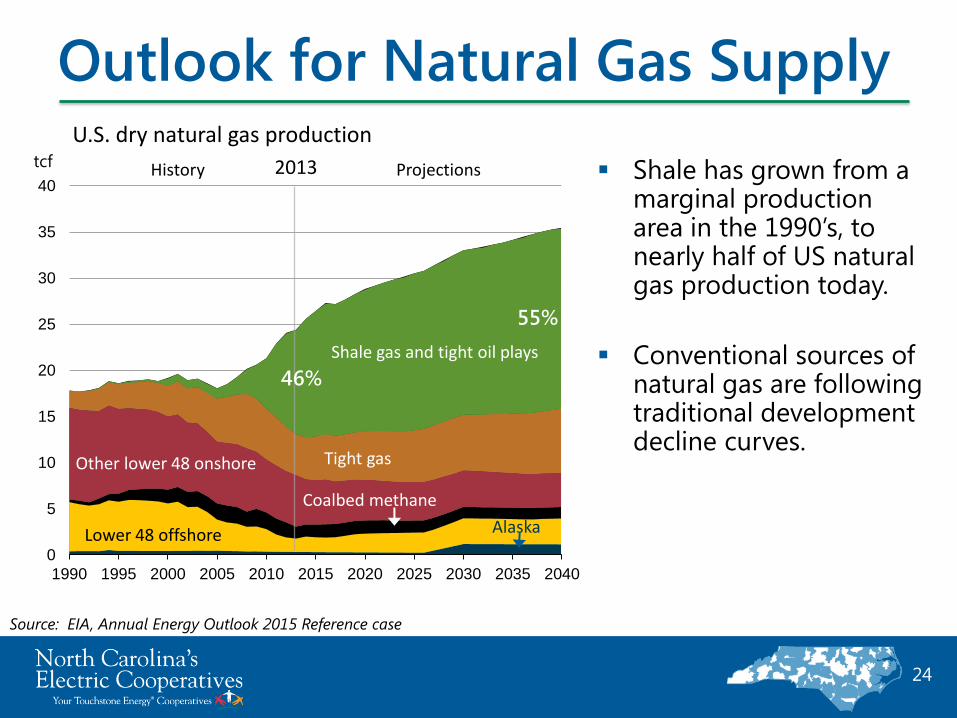
Shale has grown from a marginal production area in the 1990’s, to nearly half of US natural gas production today.
Conventional sources of natural gas are following traditional development decline curves.
24
Source: EIA, Annual Energy Outlook 2015 Reference case
Outlook for Natural Gas Supply
tcf
U.S. dry natural gas production
0
10
20
30
40
50
60
70
80
90
100
0
5
10
15
20
25
30
35
40
1990 1995 2000 2005 2010 2015 2020 2025 2030 2035 2040
Tight gas
Coalbed methane
Other lower 48 onshore
Shale gas and tight oil plays
Alaska Lower 48 offshore
Projections History 2013
46%
55%
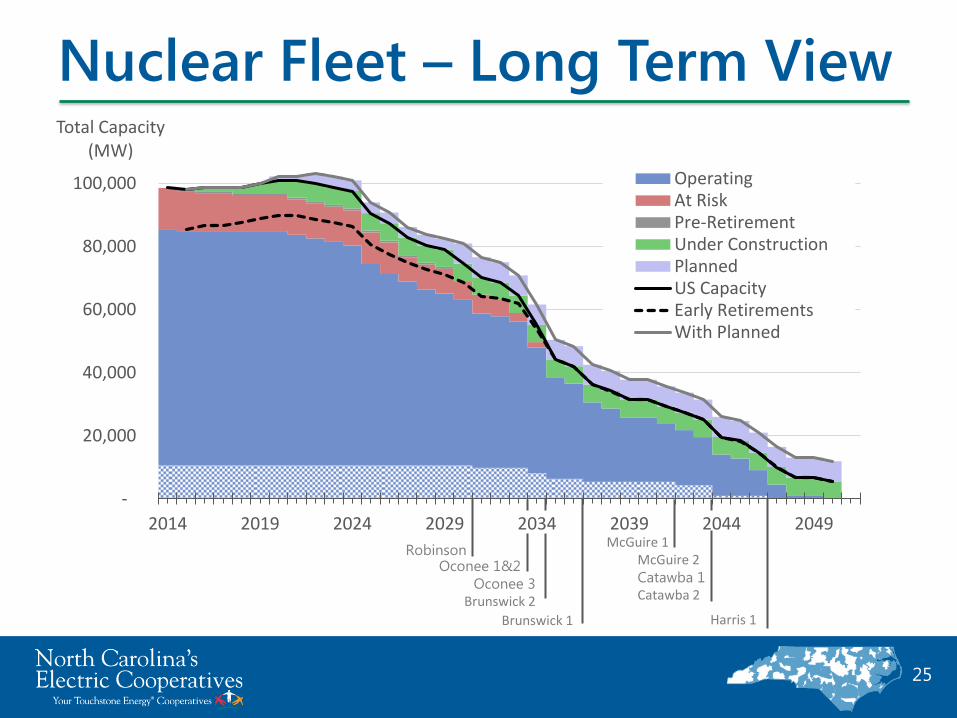
-
20,000
40,000
60,000
80,000
100,000
2014 2019 2024 2029 2034 2039 2044 2049
Total Capacity (MW)
OperatingAt RiskPre-RetirementUnder ConstructionPlannedUS CapacityEarly RetirementsWith Planned
Nuclear Fleet – Long Term View
Robinson Oconee 1&2
Oconee 3
Brunswick 2
Brunswick 1
McGuire 1
McGuire 2 Catawba 1
Catawba 2
Harris 1
25
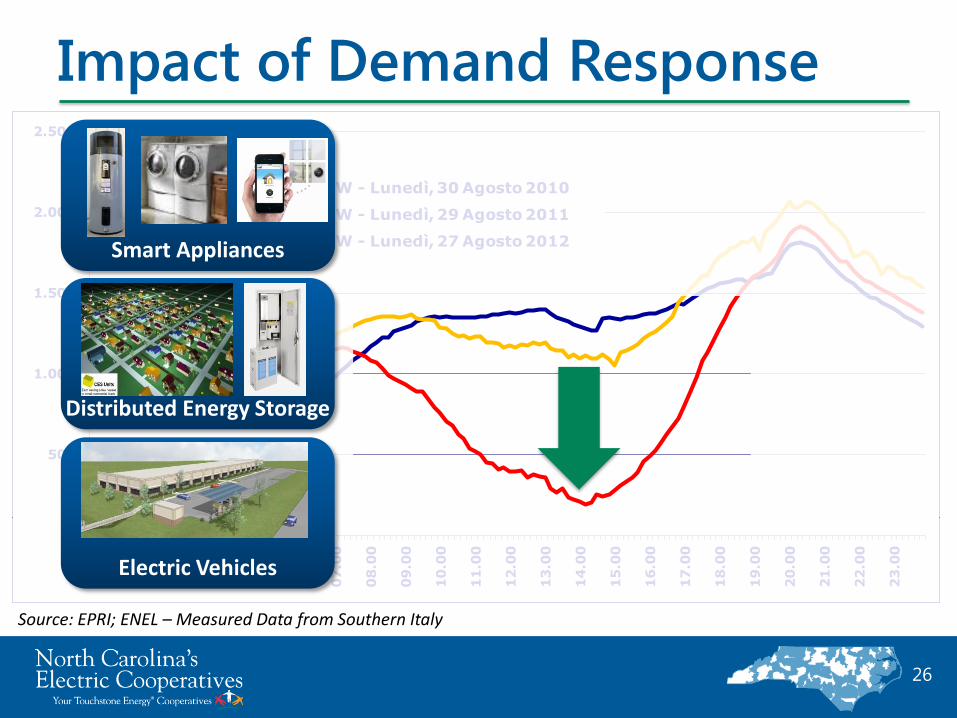
Impact of Demand Response
26
0
500
1.000
1.500
2.000
2.500
00
.00
01
.00
02
.00
03
.00
04
.00
05
.00
06
.00
07
.00
08
.00
09
.00
10
.00
11
.00
12
.00
13
.00
14
.00
15
.00
16
.00
17
.00
18
.00
19
.00
20
.00
21
.00
22
.00
23
.00
MW - Lunedì, 30 Agosto 2010
MW - Lunedì, 29 Agosto 2011
MW - Lunedì, 27 Agosto 2012
Source: EPRI; ENEL – Measured Data from Southern Italy
Distributed Energy Storage
Smart Appliances
Electric Vehicles
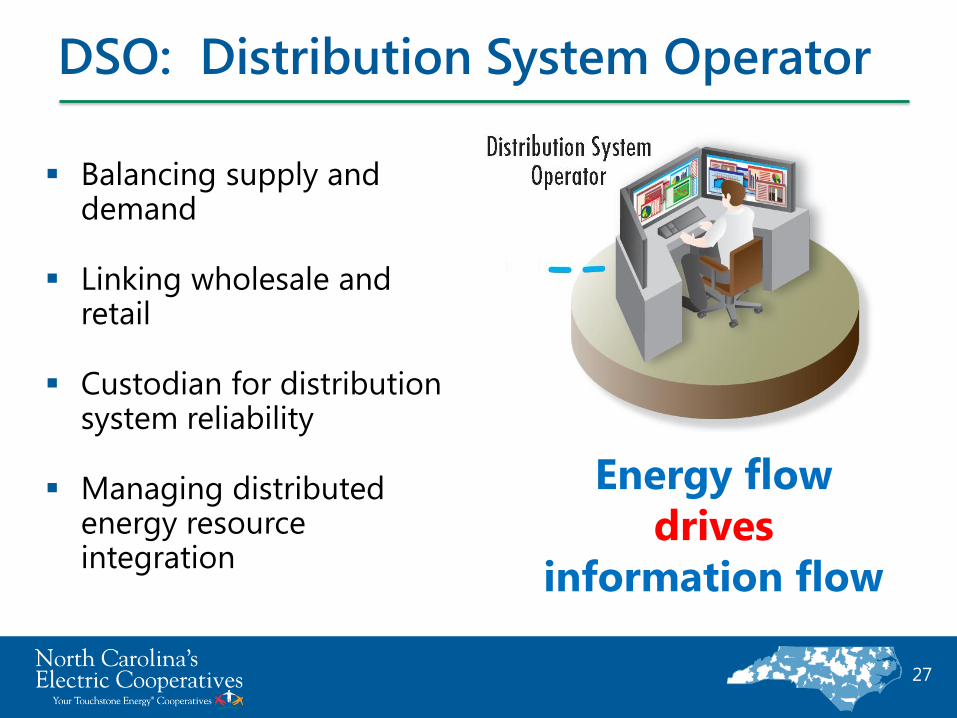
DSO: Distribution System Operator
27
Balancing supply and demand
Linking wholesale and retail
Custodian for distribution system reliability
Managing distributed energy resource integration
Energy flow
drives
information flow
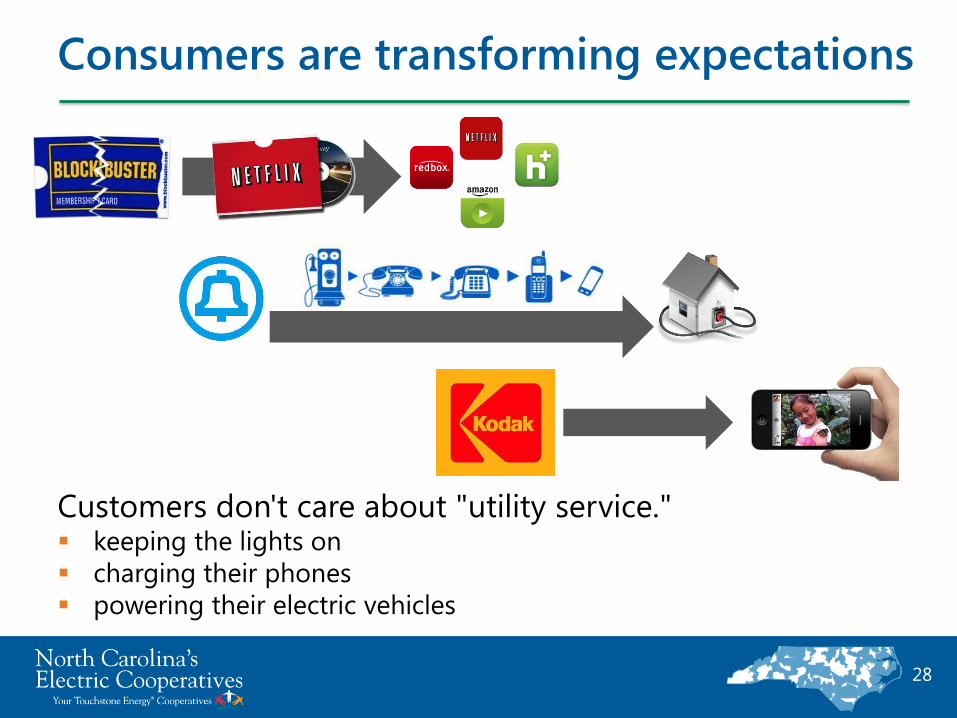
Consumers are transforming expectations
Customers don't care about "utility service." keeping the lights on
charging their phones
powering their electric vehicles
28
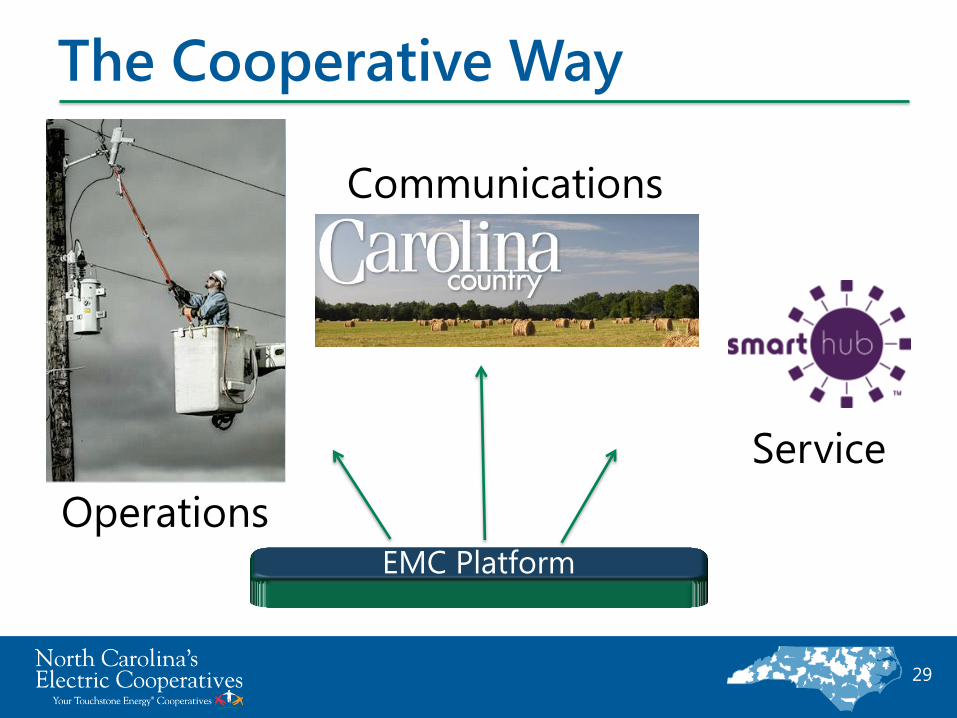
The Cooperative Way
29
EMC Platform
Operations
Communications
Service
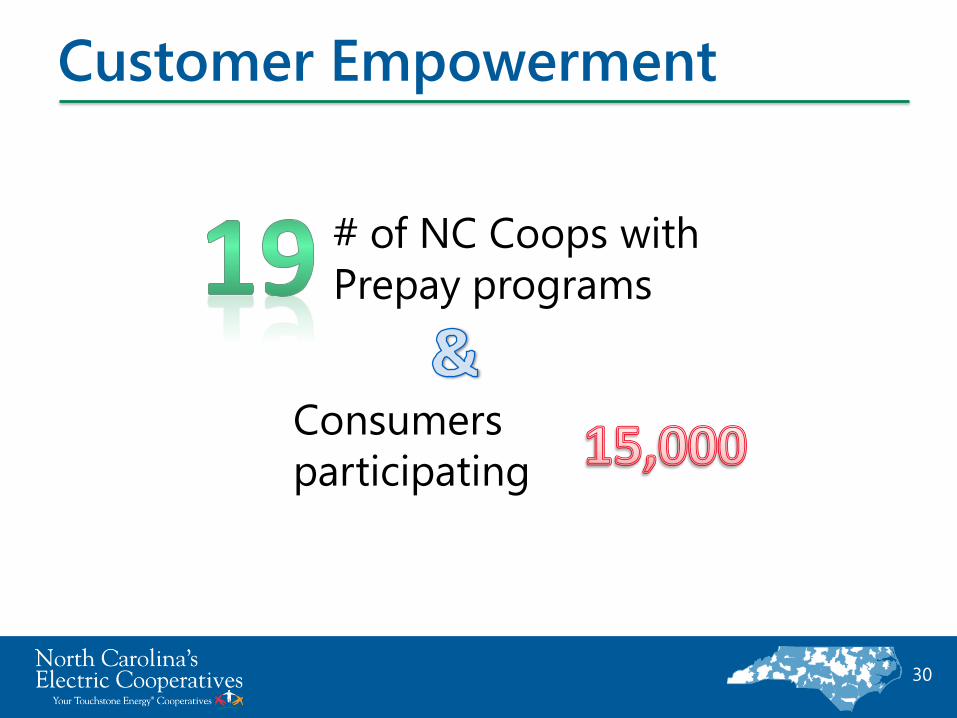
# of NC Coops with
Prepay programs
Consumers
participating
Customer Empowerment
30
31
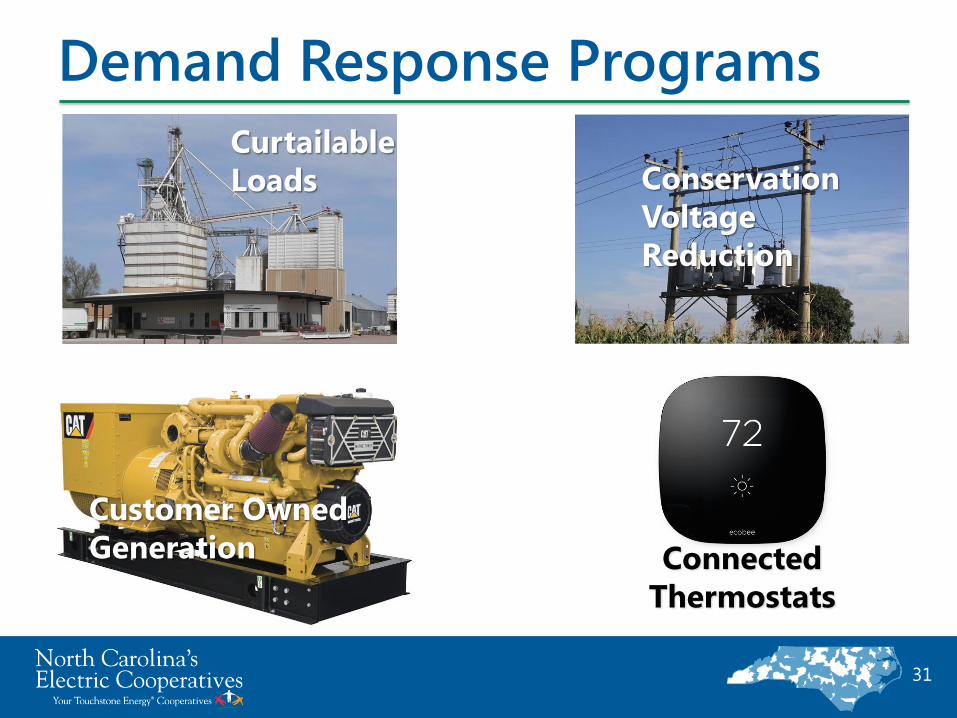
Conservation
Voltage
Reduction
Curtailable
Loads
Customer Owned
Generation Connected
Thermostats
Demand Response Programs
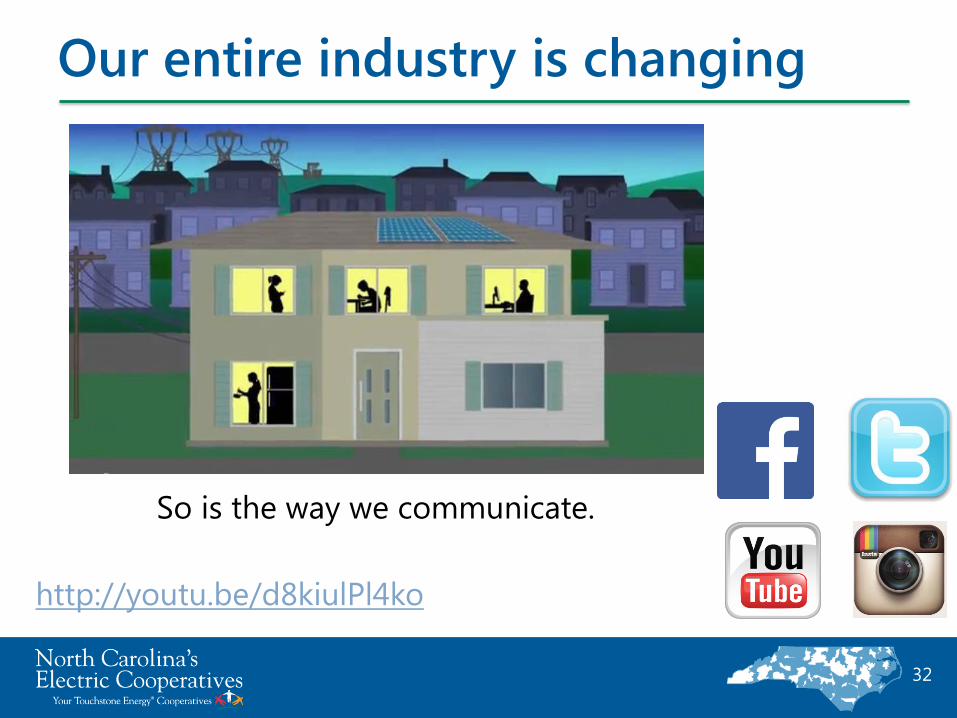
Our entire industry is changing
32
So is the way we communicate.
http://youtu.be/d8kiulPl4ko
Energy Policy Council
Next Meeting
July 15, 2015 Nature Research Center, Raleigh
Tentative