Embed Size (px)
Citation preview
Abstract: This paper deals with overview of nonlinear seismic performance analysis and vulnerability assessment of existing structure in Mumbai region. The earthquake in the Indian subcontinent has severe damages, the ductility of building is main issue for all the structures. In such cases, seismic performance analysis and vulnerability assessment of existing structures have become an extremely important. In order to avoid collapse of structure during earthquake ground motion, the absorption and dissipation of kinetic energy developed by earthquake is necessary. Vulnerability analysis can be carried out for buildings, essential facilities, lifelines etc. Fragility functions (or curves) are extremely important for estimating the overall risk to the civil infrastructure from potential earthquakes and for predicting the economic impact of future earthquakes. They can also be very useful for emergency response and disaster planning by a national authority, as well as insurance companies that wish to estimate the overall loss after a scenario earthquake. Nonlinear seismic performance analysis is carried out by using various software such as SAP2000, ETABS, STAADPRO, DRAIN-2DX, OPEN sees, Seismostruct, etc. Key words: Fragility Functions, Kinetic Energy, Seismic Performance, Vulnerability Assessment.
INTRODUCTION The seismic performance evaluation of structure is of great
importance in seismic design. Seismic performance evaluation is based upon individual deformation capacity of an element as well as overall structural deformation capacity. Traditionally, parameters such as the strength of constituent materials, sectional dimensions, different loads and load effects etc. are considered to be deterministic, but in reality, they are subjected to statistical variations. To accommodate these variations, a proper structural performance assessment should be based on a reliability based framework. The reliability based estimation of system level deformation capacity and related parameters of reinforced concrete Structure is considered to be an important aspect in the seismic performance evaluation of structures.
Conventional seismic design in codes of practice is entirely force-based, with a final check on structural displacements. Seismic design follows the same procedure, except for the fact that inelastic deformations may be utilized to absorb certain levels of energy leading to reduction in the forces for which structures are designed. This leads to the creation of for over-strength, energy absorption and dissipation as well as structural capacity to redistribute forces from inelastic highly stressed regions to other less stressed locations in the structure.
FORCED BASED V/S DISPLACEMENT BASED DESIGN
The force demand on each component of the structure is obtained and compared with available capacities by performing an elastic analysis. These methods are also known as force-based procedures which assume that structures respond elastically to earthquakes.
Elastic methods can predict elastic capacity of structure and indicate where the first yielding will occur, however they don’t predict failure mechanisms and account for the redistribution of forces that will take place as the yielding progresses. Moreover, force-based methods primarily provide life safety but they can’t provide damage limitation and easy repair. Displacement-based procedures are mainly based on inelastic deformations rather than elastic forces and use nonlinear analysis procedures considering seismic demands and available capacities explicitly.
PERFORMANCE LEVELS OF STRUCTURE Over the last 10-15 years, concepts related to the
performance-based seismic design (PBSD) philosophy have gradually entered into the earthquake engineering state of the practice. In PBSD terminology, the limit states are typically known as structural ‘performance levels’, which in combination with seismic ‘hazard levels’ define the ‘performance objective ’for a structure. The commonly followed guidelines for the performance assessment of RC structures are ATC-40 (ATC, 1996), FEMA 273 (FEMA, 1997) and FEMA356 (FEMA, 2000).
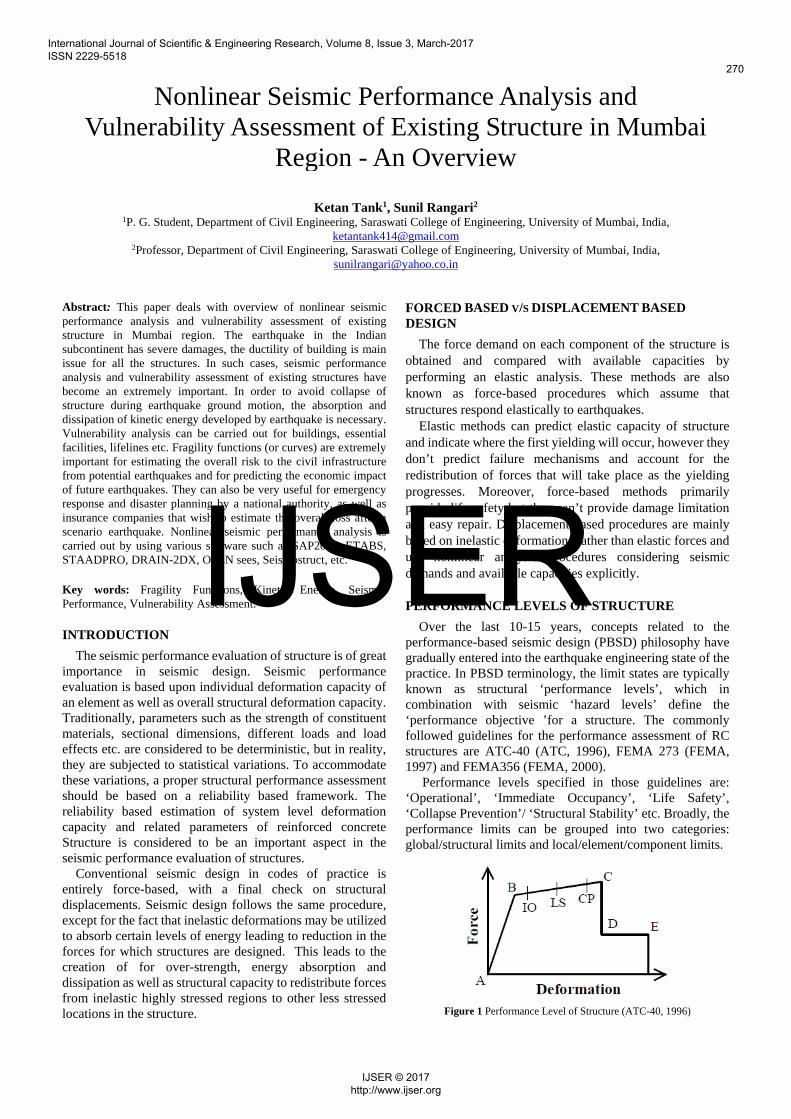
Performance levels specified in those guidelines are: ‘Operational’, ‘Immediate Occupancy’, ‘Life Safety’, ‘Collapse Prevention’/ ‘Structural Stability’ etc. Broadly, the performance limits can be grouped into two categories: global/structural limits and local/element/component limits.
Figure 1 Performance Level of Structure (ATC-40, 1996)
Nonlinear Seismic Performance Analysis and Vulnerability Assessment of Existing Structure in Mumbai
Region - An Overview
Ketan Tank1, Sunil Rangari2 1P. G. Student, Department of Civil Engineering, Saraswati College of Engineering, University of Mumbai, India,
[email protected] 2Professor, Department of Civil Engineering, Saraswati College of Engineering, University of Mumbai, India,
International Journal of Scientific & Engineering Research, Volume 8, Issue 3, March-2017 ISSN 2229-5518
270
IJSER © 2017 http://www.ijser.org
IJSER
LITERATURE REVIEW The literature review is classified in three sections such as response reduction factor studies, pushover analysis for seismic performance assessment of structures and vulnerability assessments.
Response Reduction Factor: The concept of Response Reduction Factor is also commonly known as Force Reduction Factor, has emerged as a single most important number, reflecting the capability of the structure to dissipate energy through inelastic behaviour. Following are observation of some author regarding response reduction factor. Mondal et al. (2013) conducted performance-based evaluation of the response reduction factor for ductile RC frames. Reinforced Concrete (RC) regular frame structures are designed and detailed as per Indian standards IS 456, IS 1893 and IS 13920. Four typical symmetric-in-plans RC framed structures having two, four, eight and 12-storied configurations, intended for a regular office building are performed by NSPA using the DRAIN-2DX analysis software. Based on their results, according to Performance Limit 1 (ATC-40 limits on inter storey drift ratio and member rotation capacity), the Indian standard overestimates the R factor, which leads to the potentially dangerous underestimation of the design base shear. Based on Performance Limit 2, the IS 1893 recommendation is on the conservative side. It should however be noted that this limit does not include any structure level behaviour such as interstorey drift. R (for PL1) comes to be close to the IS 1893 recommended value if P–∆effects are not considered. So, R = 5.0 may be safe for a design where P–∆ effects are actually negligible at the ultimate state.
Maram et al. (2013) have studied the effect of location of lateral force resisting system on seismic behaviour of RC building. 4 types of 10 stories RC frame structure with different positions of shear wall on the symmetrical floor plans. Nonlinear pushover analysis has been performed using ETABS software in according with IS1893-2002. Over strength and ductility were obtained from nonlinear static pushover analysis that has been suggested in FEMA365 and ATC40. All the four models are designed and analysed as per IS456:2000. Finally, it was concluded that there is no mention for the effect of torsional irregularity in IS1893-2002, thus result shows that when shear walls shift to the inner core the ratio of maximum storey drift to the average storey drift, increase to more than allowable value 1.2. In this case the value of accidental torsional (5%) must be increase. It can be seen that when structural ductility increases, response reduction factor (R), increases. In case of building without shear wall according to its value of response reduction factor R= 5.10, it can be observed that the buildings have less value of R as compared to building with shear wall.
Raut et al. (2013) made an effort to evaluate the seismic behaviour of structure with in filled walls by using nonlinear static analysis or pushover analysis. The procedure given in ATC-40 and FEMA 273 were followed. A model was created in SAP-2000 V 11.0. The loading is monotonic with the effects of cyclic behaviour load. Load reversal being estimated by using a modified monotonic force deformation criteria and with damping approximation. Analysis was performed on 3 models i.e. without infill, completely infill
and without infill walls in ground storey. Comparison was done on basis of storey shear at different stories by plotting graph. The seismic performance of a masonry infill reinforced concrete structure was found to be adversely and significantly affected if infill panels were discontinued in ground storey (weak storey).
Affandi et al. (2012) have assessed an evaluation of over strength factor of seismic designed low rise RC buildings. Six frame models regular and irregular in elevation, each are designed to gravity load only and designed to resist seismic load with medium ductility and high ductility class. The nonlinear static analysis or also known as pushover analysis (POA) is used to determine the performance of the buildings. Based on their work, the seismic designed building has greater load carrying-capacity, top displacement capacity and ductility supply compared to the gravity load designed buildings and the over strength factor increases as the ductility supply of the building increases.
Khose et al. (2012) conducted a case study of seismic performance of a ductile RC frame building designed using four major codes, ASCE7, EN1998, NZS 1170 and IS 1893. The performance of the test building was evaluated using the Displacement Modification Method (DMM) as well as the guidelines of ASCE-41. The variation in capacity curves is a result of combined effect of the differences in design spectra, effective member stiffness, response reduction factors, load and material factors, as well as load combinations. The buildings designed for other codes (New Zealand and Euro-code) have significantly lower strengths than the buildings of comparable ductility classes designed for Indian and American codes. In case of DBE, all the considered codes result in Life Safety (LS) or better performance levels in both the directions, except in case of Euro-code 8 in both the directions and NZS 1170.5 in transverse direction.
Hamaydeh et al. (2011) evaluated the seismic design factors for RC special moment resisting frames in Dubai, UAE. This study investigates the seismic design factors for three reinforced concrete (RC) framed buildings with 4, 16 and 32-stories in Dubai, UAE utilizing nonlinear analysis. The buildings are designed according to the response spectrum procedure defined in the 2009 International Building Code (IBC’09). The nonlinear dynamic responses to the earthquake records are computed using IDARC-2D. Second order P-Delta effects are included in the nonlinear analyses as well as the hysteretic strength deterioration and the stiffness degradation. It was concluded that the results of the nonlinear time history analysis showed an increase in the inelastic drift, Cd, R and Rd factors in the range of 2 to 4 times. The Ωo factor, on the other hand, show a nominal 30% increase. Based on the observed trends, period-dependent R and Cd factors are recommended if consistent collapse probability in moment frames with varying heights is to be expected.
Patel and Shah (2010) investigated the formulation of key factors for seismic response modification factor of RCC framed staging of elevated water tank. The evaluation of response modification factor was done using static nonlinear pushover analysis. It was used to evaluate nonlinear behaviour and gave the sequence and mechanism of plastic hinge formation. Here displacement controlled pushover analysis was used to apply the earthquake forces at C.G. of
International Journal of Scientific & Engineering Research, Volume 8, Issue 3, March-2017 ISSN 2229-5518
271
IJSER © 2017 http://www.ijser.org
IJSER
container. The pushover curve was plotted between base shear versus roof displacement, gave the actual capacity of the structure in the nonlinear range. Case study taken was of 2.25lac litres ESR with RCC framed staging of 15m height and soil type was medium. They concluded that single value of R for all buildings of a given framing type, irrespective of plan and vertical geometry, cannot be justified. But for ESR staging (beam – column frame or shaft), where the basic system of framing and behaviour is more or less common, the method can be derived to evaluate R – factor.
Asgarian and Shokrgozar (2009) evaluated over-strength, ductility and response modification factor of Buckling Restrained Braced frames. Seismic codes consider decrease in design loads, taking benefit of the fact that the structures possess substantial reserve strength (over-strength) and capacity to disperse energy (ductility). This factor represents ratio of maximum seismic force on a structure through specified ground motion if it was to remain elastic to the design seismic force. Thus, seismic forces are reduced by the factor R to obtain design forces. The basic fault in code actions is that they use linear methods not considering nonlinear behaviour. Over-strength in structures is connected to the fact that the maximum lateral strength of a structure usually beats its design strength. It was perceived that the response modification factor drops as the height of building increases. This result was outward in all type of bracing outline.
Mendis et al. (2000) reviewed the traditional force-based (FB) seismic design method and the newly proposed displacement-based (DB) seismic assessment approach. A case study was done for reinforced concrete (RC) moment-resisting frames designed and detailed according to European and Australian earthquake code provisions, having low, medium and high ductility capacity. Response reduction factor (R) for Ordinary Moment Resisting frame is ‘4’ as per AS 3600 while for Special Moment Resisting frame, R= 8 as per ACI 318–95. It was observed that OMRF developed plastic hinges in the columns under the El Centro earthquake and SMRF generally developed plastic hinges in the beams rather than the columns. This was consistent with the ACI 318–95 strong column-weak beam detailing philosophy used in the design of this SMRF. The displacement ductility and rotation ductility demands of the SMRF during the El Centro earthquake were some 3 times that of the OMRF.
Borzi and Elnashai (2000) made an effort to evaluate response reduction factor on basis of inelastic behaviour of structure. In this work, two models were used i.e. Elastic perfectly plastic model (EPP) and Hysteretic hardening-softening model. EPP model was used since it is simplest form of inelastic force resistance as well as being the basis for early relationship between seismic motion and ‘R’. HSS model is characterized by definition of a primary curve which is defined as envelope curve under cyclic load reversals. Different ductility levels are used along with different time period values to evaluate ‘R’. It was finally concluded that behaviour factor is only slightly dependent on the period in long range (>1 second) and almost correspond to ductility value. On other hand, in short period range, the behaviour factor is dependent on both ductility and time period.
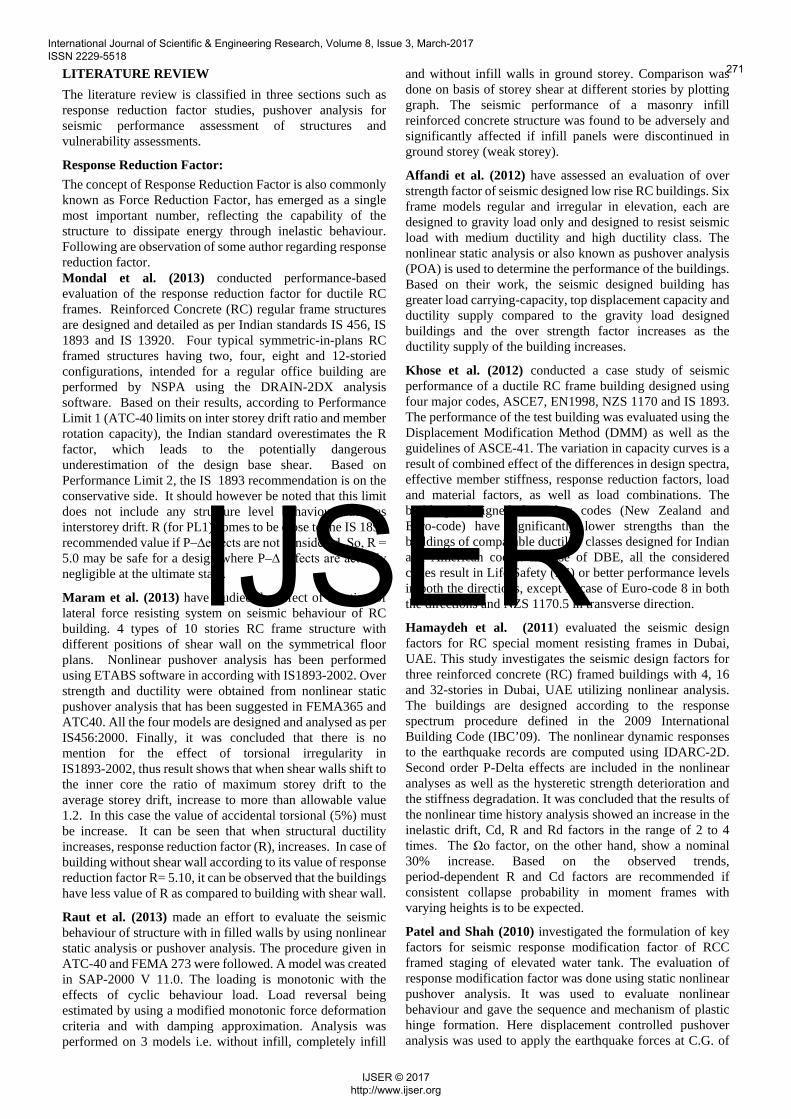
Whittaker et al. (1999) stressed upon the need for the systematic evaluation of the building response characteristics and proposed a draft formulation that represents the response modification factor as the product of factors related to reserve strength, ductility and redundancy.
R = Rs*Rμ*Rξ*RR Where Rs is strength factor, Rμis ductility factor, Rξis
damping factor and RRis redundancy factor.
Strength factor: The maximum lateral strength of building (Vu) will
generally exceed the design lateral strength (Vd) of building because the members or elements are designed with capacities substantially greater than design actions and material strength also exceed specified nominal strengths. Thus, the strength factor or over-strength factor is defined as ratio of ultimate base shear to design base shear.
Ductility factor: It is measured as ratio of ultimate or maximum base shear
to base shear corresponding to yield (Ve). Many studies have been carried out to derive ductility factor. Ductility factor shows response of structure in terms of its plastic deformation capacity. It depends upon ductility level (μ) and time period of system.
Redundancy factor: The redundancy factor RR is measure of redundancy in a
lateral load resisting system. In RC structures, the moment resisting frames, shear walls or their combinations are the most preferred lateral load resisting systems. Sometimes, the central frames are only designed for gravity loads and the perimeter frames are designed as the lateral load resisting systems. Thus, the redundancy in lateral load resisting systems depends on the structural system adopted.
Figure 2 Sample Base Shear Force Versus Roof Displacement Relationship
(Whittaker et al., 1999)
Kappos (1998) made an evaluation of behaviour factors for seismic design of structure with due consideration to both their ductility and over-strength. Here an inelastic strength spectrum for typical target ductility was presented for earthquake motions. The earthquake motion data used in this paper was representing southern Europe, particularly Greece. The over-strength dependent component was addressed with particular emphasis on low rise and medium rise reinforced concrete structures designed to the procedures given in Euro code. To estimate over-strength factor, inelastic static analysis was done. The estimation of over-strength dependent component of behaviour factor can only be made with respect to realistic, code designed, building with
International Journal of Scientific & Engineering Research, Volume 8, Issue 3, March-2017 ISSN 2229-5518
272
IJSER © 2017 http://www.ijser.org
IJSER
minimum ductility provision, possible predominance of gravity load and practical construction consideration may induce significant amount of over-strength. The ductility dependent part of behaviour factor was found to be on higher side than code values for rock sides and high ductility. From case studies, it was clear that the over-strength was higher in case of low rise structures (2.7), where it was less for medium and high rise structures (1.5).
Newmark and Hall (1982) developed a simplified relationship between the ductility factor (Rμ) and displacement ductility (μ). It was observed that in the long period range, elastic and ductile systems with the same initial stiffness reached almost the same displacement. For short period structures, the ductility is higher than the force reduction (or behaviour) factor and the ‘equal energy’ approach is used. The proposed relationships for behaviour factor are:
Ru = 1, When T <0.05s Rµ= , when 0.12s < T <0.5s Rµ= µ, when T >1.0s
Pushover Analysis:
The pushover analysis method was firstly introduced by Freeman et al. (1975) as the Capacity Spectrum Method. The study combined the use of analytical methods with site-response spectra to estimate values of peak structural response, peak ductility demands, equivalent period of vibration, equivalent percentages of critical damping, and residual capacities.
Devrim et al. (2012) studies three 10 storey steel SMRF with different spans were designed as per Turkish Codes. They were analysed with OPENSEES 15 using simulated ground motion records and model frame with span length to storey height ratio of approximately 2 seems to maintain both performance and economy, while the ratio higher than 2.5 can result in relatively high deflections and high element plastic rotations in lower stories under infrequent earthquake loads.
Duan et al. (2012) designed a five storey RC frame building according to Chinese Seismic Codes and investigated the seismic performance of the same by pushover analysis and found the potential for a soft storey mechanism under significant seismic loads.
Tamboli and Karadi (2012) performed seismic analysis using equivalent Lateral Force Method for different reinforced concrete (RC) frame building models that included bare frame, in filled frame and open first storey frame. The seismic analysis of RC (Bare frame) structure lead to under estimation of base shear. Therefore, other response quantities such as time period, natural frequency, and storey drift were not significant. The under estimation of base shear might lead to the collapse of structure during earthquake shaking.
Bodige and Ramancharla (2012) modelled a 1 x 1 bay 2D four storied building using AEM (applied element method). Displacement control pushover analysis was carried out in both cases and the pushover curves were compared. As an observation, it was found that AEM gave good representation capacity curve. From the case studies, it was found that
capacity of the building significantly increased when ductile detailing was adopted. Also, it was found that effect on concrete grade and steel were not highly significant.
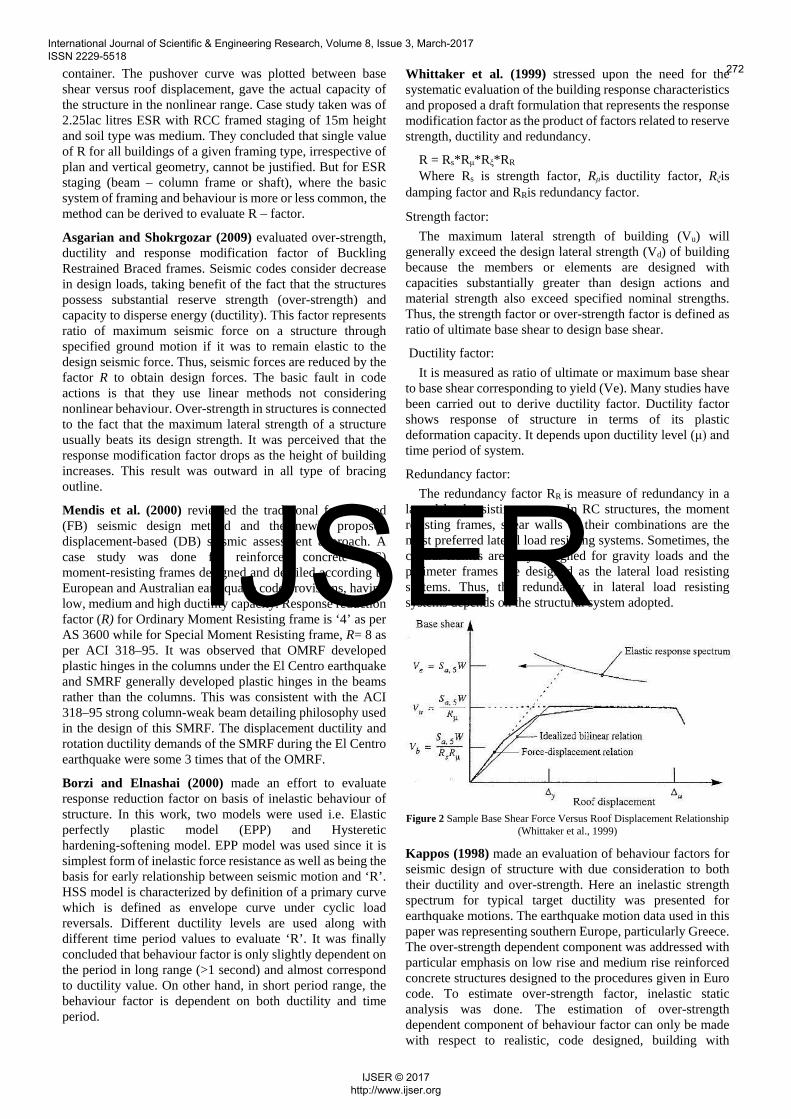
Kadid and Boumrkik (2008) carried out pushover analysis with a Series of incremental static analysis. The extent of damage experienced by the structure at this target displacement is considered the representative of the 'Damage' experienced by the building when subjected to design level ground shaking. Since the ‘Behaviour’ of reinforced concrete structures might be highly inelastic under seismic loads, the global inelastic performance of RC structures would be dominated by plastic yielding effects and consequently the accuracy of the pushover analysis would be influenced by the ability of the analytical models to capture these effects.
Figure 3 Hinges pattern 12 story building for different displacements levels
(Kadid and Boumrkik, 2008) Girgin et al. (2007) presented the pushover analysis that has been the preferred method for seismic performance evaluation of structures by the major rehabilitation guidelines and codes because it is computationally and conceptually simple. Pushover analysis allows tracing the sequence of yielding and failure on member and structural level as well as the progress of overall capacity curve of the structure.
Shuraim et al. (2007) concluded that most columns required significant additional reinforcement, indicating their vulnerability when subjected to seismic forces. The nonlinear pushover procedure shows that the frame is capable of withstanding the presumed seismic force with some significant yielding at all beams and one column.
Vulnerability of Structure: The Seismic Vulnerability of a structure is described as its susceptibility to damage due to ground shaking of a given intensity. The aim of vulnerability assessment is to predict the economic loss (in terms of replacement cost) and casualties. In vulnerability assessment procedure, a parameter is selected to characterize the ground motion and it is related with the damage of buildings.
Karapetou et al. (2016) studied an integrated methodology which is presented for assessing the time-building-specific seismic vulnerability of one of the main buildings of the most important hospital in Thessaloniki (AHEPA) based on field monitoring data. the result is used update and better constrain the initial finite element model of the building, which is based the design and construction documentation plans provided by the technical service of the hospital.
International Journal of Scientific & Engineering Research, Volume 8, Issue 3, March-2017 ISSN 2229-5518
273
IJSER © 2017 http://www.ijser.org
IJSER
Peethambaran and Philip (2015) evaluated that the results of effects of plan aspect ratio on seismic response of buildings have been presented in terms of displacement and base shear behaviour parameters of the pre-analyzed structure. They also concluded that the nonlinear static pushover analysis is performed to investigate the performance point of the building frame in terms of base shear and displacement moment resisting frames also calculated.
Hezha and Sadraddin (2015) developed Fragility curves which are based on the IDA results for the three limit states including slight damage, moderate damage, and collapse to show the probabilistic comparison of seismic responses among the three buildings in both x and y-directions. It was observed from the fragility assessment results that generally shear walls improve buildings’ seismic performance. They conclude that, shear walls increase buildings’ resistance against the seismic loads and decreases record-to-record variability which gives predictability design results.
Dina et al. (2015) studied the vulnerability of hospitals buildings and medical facilities. The vulnerability of non-structural and functional features can lead to severe functional and indirect losses.
Bjarnietal (2014) computed fragility curves for given low-rise building typologies and by mapping how the damage was split into different subcategories of structural and non-structural damage. In total, the damage was broken down under a total of 62 headings. About 50% of all buildings in the area suffered damage. Only 0.44% of the buildings were judged to be a total loss.
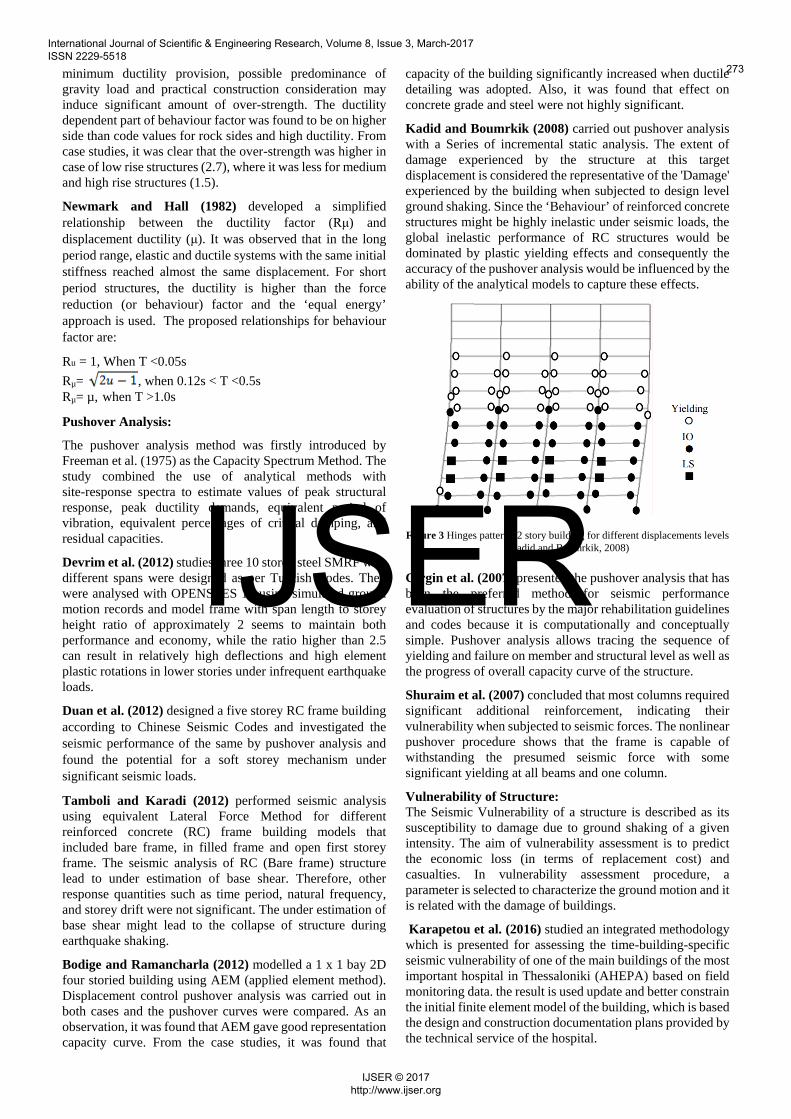
Avhad (2014) surveys of buildings failed in the past earthquakes show that Open Ground Storey framed buildings are found to be one of the most vulnerable due to the formation of soft-storey behaviour in ground storey. The sudden reduction in lateral stiffness and mass in the ground storey results in higher stresses in the columns of ground storey under seismic loading. Bare frame analysis is one of the reasons of failures. The columns and beams of the soft-storey are to be designed for the multiplication factor of 2.5 times the storey shears and moments calculated under seismic loads of bare frame.
Figure 4 Pushover Curves of 10S Building Frame (Avhad, 2014)
Mauro Dolce et al. (2014) evaluated various damages such as; slight damage to plaster on masonry infill panels, moderate damage to the external layer of brick infill emphasizing the absence of damage to RC elements of the
building, damage to the external layer of the infill panels at the first storey, diagonal cracking characterized by shear failure, structural damage in a squat RC column, zoom-in of the squat column, moderate damage and diagonal cracking of the infill panel between two openings, significant damage and partial collapse of an infill panel are seen.
Poweth (2014) compared various parameters such as storey drift, storey shear, deflection, reinforcement requirement in columns etc. of a building under lateral loads based on strategic positioning of shear walls. Following points are observed; maximum reduction in drift values is obtained when shear walls are provided at corners of the building, provision of shear walls in x-direction will reduce displacement in x-direction, requirement of steel in columns is reduced by provision of shear walls and push over analysis results provides an insight into the performance of structures.
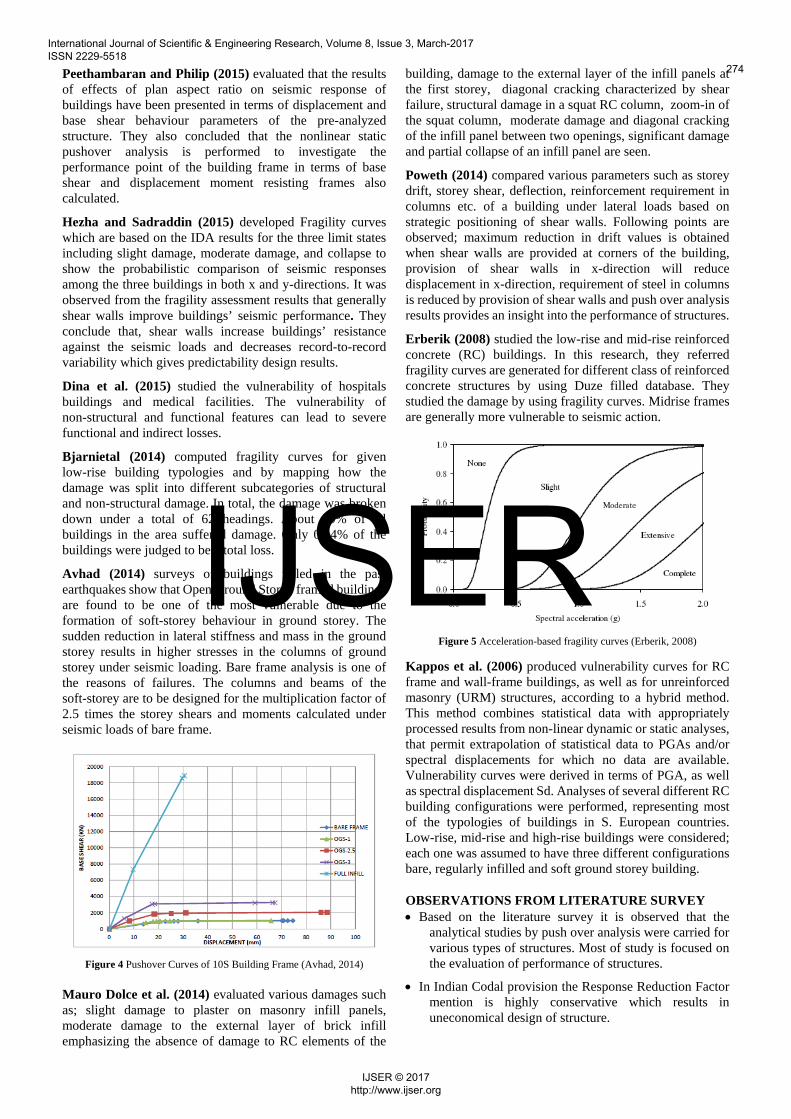
Erberik (2008) studied the low-rise and mid-rise reinforced concrete (RC) buildings. In this research, they referred fragility curves are generated for different class of reinforced concrete structures by using Duze filled database. They studied the damage by using fragility curves. Midrise frames are generally more vulnerable to seismic action.
Figure 5 Acceleration-based fragility curves (Erberik, 2008)
Kappos et al. (2006) produced vulnerability curves for RC frame and wall-frame buildings, as well as for unreinforced masonry (URM) structures, according to a hybrid method. This method combines statistical data with appropriately processed results from non-linear dynamic or static analyses, that permit extrapolation of statistical data to PGAs and/or spectral displacements for which no data are available. Vulnerability curves were derived in terms of PGA, as well as spectral displacement Sd. Analyses of several different RC building configurations were performed, representing most of the typologies of buildings in S. European countries. Low-rise, mid-rise and high-rise buildings were considered; each one was assumed to have three different configurations bare, regularly infilled and soft ground storey building.
OBSERVATIONS FROM LITERATURE SURVEY • Based on the literature survey it is observed that the
analytical studies by push over analysis were carried for various types of structures. Most of study is focused on the evaluation of performance of structures.
• In Indian Codal provision the Response Reduction Factor mention is highly conservative which results in uneconomical design of structure.
International Journal of Scientific & Engineering Research, Volume 8, Issue 3, March-2017 ISSN 2229-5518
274
IJSER © 2017 http://www.ijser.org
IJSER
• SMRF buildings are commonly constructed in earthquake prone countries like India since they provide much higher ductility. Failures observed in past earthquakes show that the collapse of such buildings is predominantly due to the formation of soft-storey mechanism in the ground storey columns.
• In most of the research pertaining to framed structures without considering the infill walls which may not be a reality situation. In addition, majority of the cases a hypothetical structure is analysed instead of reality situation which otherwise would have been analysed for complex condition.
• Vulnerability studies have been carried out for low rise structures and industrial structures. In India, similar study has been carried out. It is therefore, the need of the time to extend the study for high rise structures. Especially in metros like Mumbai where the skyscrapers are raising speedily.
• The Indian standards for design for RC buildings do not provide adequate modelling guidelines, especially to simulate the behaviour of building under earthquake loading, and second, the code provisions for design and detailing are not implemented in practice. The lack of modelling guidelines, usually leads to inaccurate analytical models and faulty designs.
CRITICAL APPRAISAL OF LITERATURE SURVEY • The conclusions of some studies are limited by the facts
that only a single plan configuration (without plan-asymmetry) in one single seismic zone has been considered. Plan irregularity as well as vertical irregularity not considered in some studies. The variation in horizontal aspect ratio can be made by changing bay numbers in both horizontal directions.
• The structural behaviour is not validated by any nonlinear response / time-history analysis in most of studies.
• In some studies, The Soil structure interaction effects are not considered in the analysis. The effects of soil-structure interaction (SSI) in the derivation of fragility functions for RC buildings are not explicitly taken into account.
• A limited number of ground motion excitations considered. Further it can be analyzed by site spectra of different range and different types ground motion.
• Vulnerability studies have not been done by using Potential interaction with other non-structural components.
REFERENCES [1] ATC – 40, “Seismic Evaluation and Retrofit of concrete buildings,”
vol. 1, Applied Technology Council, Redwood City, USA,1996. [2] A. Kadid, and A. Boumrkik, “Pushover analysis of reinforced concrete
frame structures,” Department of Civil Engineering, University of Batna, Algeria, Asian journal of civil engineering (building and housing) vol. 9, no. 1, pp.75-83, 2008.
[3] A. J. Kappos, “Evaluation of behaviour factors on the basis of ductility and over strength studies,” Engineering Structures 21(9), pp. 823–835, 1998.
[4] A. M. Chandler, and P. A. Mendis, “Performance of reinforced concrete frames using force and displacement based seismic
assessment methods,” Engineering Structures, 22, pp. 352–363, Mar 2000.
[5] A. Mondal, S. Ghosh, and G. R. Reddy, “Performance-based evaluation of the response reduction factor for ductile RC frames”, Elsevier 56, pp. 1808–1819, 2013.
[6] Bjarnietal Bessason, J. O. Bjarnason, A. Guomundsson, J. Solnes, and S. Steedman, “Analysis of damage data of low-rise buildings subjected to a shallow Mw6.3 earthquakes,” Elsevier, Soil Dynamics and Earthquake Engineering, vol 66, pp. 89–101, 2014.
[7] B. Patel, and D. Shah, “Formulation of response reduction factor for RCC framed staging of elevated water tank using static pushover analysis,” Proceedings of the World Congress on Engineering, vol 3, World Congress on Engineering, London, U.K, Jul 2010.
[8] Devrim, Ozhendekciand Nuri, “Seismic performance of steel special moment resisting frames with different span arrangements,” Journal of Constructional Steel Research, vol 72, pp. 51–60, 2012.
[9] Duan, and Hueste, “Seismic performance of a reinforced concrete frame building in China,” Engineering Structures, vol 41, pp. 77–89, 2012.
[10] Erberik, “Fragility-based assessment of typical mid-rise and low-rise RC buildings in Turkey,” J. Engineering Structures, vol 30, pp 1360–1374, 2008.
[11] Federal Emergency Management Agency (FEMA-356): Prestandard and commentary for the seismic rehabilitation of buildings, Washington (USA), 2000.
[12] H. R. Tamboli, and U. N. Karadi, “Seismic analysis of RC Frame structure with and without masonry infill walls,” Indian Journal of Natural Sciences, vol.3, issue 14, pp. 1137-1148, Oct 2012.
[13] IS: 456 (Fourth Revision), “Indian standard code for practice for plain reinforced concrete for general building construction,” Bureau of Indian Standards, New Delhi, 2000.
[14] K. Peethambaran, and V. Philip, “Seismic performance assessment of multi- storied RC moment resisting frames based on plan aspect ratio by pushover analysis”, International Journal for Innovative Research in Science & Technology, vol 2, issue 05, Oct 2015.
[15] K. Girgin, and K. Darılmaz, “Seismic response of infilled framed buildings using pushover analysis,” ARI The Bulletin of the Istanbul Technical university volume 54, number 5 communicated by zekai celep, vol 54, no 5, 2007
[16] K. B. Avhad, “Seismic analysis of high rise open ground storey framed building,” International Journal of Recent Technology and Engineering (IJRTE), vol 3, issue 4, Sept 2014.
[17] K. O. Lakshmi, J. Ramanujan, B. Suni, L. Kottalli, and M. J. Poweth, “Effect of shear wall location in buildings subjected to seismic loads,” ISOI Journal of Engineering and Computer Science, vol 1, issue 1, pp. 07-17, 2014.
[18] M. Al Hamaydeh, S. Abdullah, A. Hamid, and A. Mustapha, “Seismic design factors for RC special moment resisting frames in Dubai, UAE,” Earth Engineering and Earthquake Vibration, issue.10, pp. 495-506, 2011.
[19] N. Bodige, and P. K. Ramancharla, “Pushover analysis of RC bare frame: performance comparison between ductile and non-ductile detailing,” Urban Safety of Mega Cities in Asia, Report No: IIIT/TR/2012/-1, Centre for Earthquake Engineering International Institute of Information Technology Hyderabad - 500 032, India.
[20] N. N. Raut, and S. D. Ambadkar, “Pushover analysis of multistoried building,” Global Journal of Researches in Engineering vol 13, issue 4, versions 1.0, 2013.
[21] N. Newmark, and W. Hall, “Earthquake spectra and design,” Technical report, Earthquake Engineering Research Institute, Berkeley, California, 1982.
[22] Whittaker, A., Hart, G., & Rojahn, C., “Seismic Response Modification Factors,” Journal of Structural Engineering, ASCE 125(4), pp. 438-444, 1999.
International Journal of Scientific & Engineering Research, Volume 8, Issue 3, March-2017 ISSN 2229-5518
275
IJSER © 2017 http://www.ijser.org
IJSER