Embed Size (px)
Citation preview

Non-Standard Crystallography
Examples in 3- and 3+1 Dimensional Space
Jeppe Christensen
Department of Physical, Inorganic, and Structural Chemistry Stockholm University
2007

©Jeppe Christensen, Stockholm 2007
ISBN (978-91-7155-524-3)
Printed in Sweden by PrintCenter US-AB, Stockholm 2007 Distributor: Department of Physical, Inorganic, and Structural Chemistry, Stockholm University
Doctoral Thesis 2007 Department of Physical, Inorganic, and Structural Chemistry Stockholm University 106 91 Stockholm Sweden Cover: Top left: The departments Xcalibur3 Diffractometer Top Right: The reconstructed hhlm layer of a cubically fourfold twinned
Sn4Sb3 crystal Bottom left: The x4-x3 plane electron density of the Sn and Sb atoms in
the structure. Bottom right: The final Sn4Sb3 structure after refinement. Faculty Opponent: Professor An-Pang Tsai Institute of Multidisciplinary Research for Advanced Materials Tohuku University Sendai, Japan Evaluation Committee: Professor Staffan Hansen, Materialkemi, University of Lund Professor Margareta Sundberg, FOOS, University of Stockholm Professor Vratislav Langer, Oorganisk Miljökemi, CTH Substitute: Professor Michail Dzugutov, Kondenserade Materiens Fysik, KTH

"A man is not idle because he is absorbed in thought. There is a visible labor and there is an invisible labor".
Victor Hugo
French dramatist, novelist, & poet
(1802 - 1885)


Abstract
Crystallography today is by many seen as merely a tool for determining the structure of a material on the atomic level. It is expected that whatever comes out of the tool is the indisputable truth, a fact. This thesis is based on five publications illustrating that this is very far from the real world of mate-rials research. The experiences drawn from the structural work in the papers are put together to illustrate when to be alert, and how to proceed with a structural investigation using non-standard crystallography. The focus is on interpreting the signs of additional order being present in a structure. The signs may be weak, such as extreme thermal vibration, or unit cell deforma-tion. Or the signs can be strong, with superstructure reflections indicating the presence of either commensurate or incommensurate superstructures.


List of papers
The thesis is based on the following publications:
I. "Solving Approximant Structures Using a 'Strong Reflections' Ap-proach" J. Christensen, P. Oleynikov, S. Hovmöller, X. D. Zou Ferroelectrics, Vol. 305, 273-277, (2004).
II. "The Sn1-xSb1+x, x ~ 0.5, Solid Solution: the Relationship Between α and β" L. Norén, J. Christensen, S. Lidin, S. Schmid and R. L. Withers 30th annual condensed matter and materials meeting.Wagga Wagga, Aus-
tralia 2006. ISBN 1-920791-09-4
III. "The Samson phase, ββββ-Mg2Al3, Revisited" M. Feuerbacher, C. Thomas, J.P.A. Makongo, S. Hoffmann, W. Carrillo-Cabrera, R. Cardoso, Yu. Grin, G. Kreiner, J.-M. Joubert, Th. Schenk, J. Gastaldi, H. Nguyen-Thi, N. Mangelinck-Noël, B. Billia, P. Donnadieu, A. Czyrska-Filemonowicz, A. Zielinska-Lipiec, B. Dubiel, Th. Weber, P. Schaub, G. Krauss, V. Gramlich, J. Christensen, S. Lidin, D. Fredrickson, M. Mihalkovic, W. Sikora, J. Malinowski, S. Brühne, Th. Proffen, W. Assmus, M. de Boissieu, F. Bley, J.L. Chemin, J. Schreuer, W. Steurer Zeitschrift für Kristallographie, vol. 222 (2007) 259-288
IV. "Vacancy Ordering Effects in AlB2-type ErGe2-x (0.4<x≤0.5)." J. Christensen, S. Lidin, B. Malaman, G. Venturini Under revision by Acta. Cryst. B.
V. "The Origins of Superstructure Ordering and Incommensurability in Stuffed CoSn-type Phases" Fredrickson, D.C., Lidin, S., Venturini, G., Malaman, B., Christensen, J. Under revision by J. Am. Chem. Soc.

Publications outside this thesis:
"A new Approach for Solving Quasicrystal Structures" X. D. Zou, J. Christensen, H. Zhang, P Oleynikov and S. Hovmöller Acta Cryst. (2004). A60, s190
"Structure of Pseudodecagonal Al-Co-Ni Approximant PD4" P. Oleyunikov, L. Demchenko, J. Christensen, S. Hovmöller, T. Yokosawa, M. Döblinger, B. Grushko, X. D. Zou Philosophical Magazine, vol.86, No.3-5 /04 January 2006, 457-462
"Strong Reflections in Quasicrystal Approximants" J. Christensen Ph.Lic. Thesis 2004

Preface
I have always taken great pleasure in working with and solving difficult problems. This is what initially led me to the field of crystallography. To-gether with my curiosity it is the key to the experiences I have gathered dur-ing my education. I always seek out crystallography-related problems both within my own pro-jects, and within the projects of my colleagues. In this process I am often asked "How can you know that?" My intention with this thesis is to put to-gether my experiences with certain kinds of problems that I have encoun-tered during my Ph.D. education. The intended audience are people that have practical experience in crystallography but not necessarily the theoretical background. The thesis is not a textbook on the subject as many of these already exist. It is more an introduction to non-standard crystallography with the hope to make people aware of crystallography as a field still under de-velopment.


Contents
Abstract ............................................................................................................ i
List of papers.................................................................................................. iii
Preface............................................................................................................ v
Contents ........................................................................................................ vii
Introduction .....................................................................................................1
1. Methods for structure solution ...............................................................2
2. Warning signs of incomplete solution ....................................................6 2.1. Extreme Thermal vibration, partial Occupation and/or Disorder. ...................6 2.2. Unit cell deformation .....................................................................................7 2.3. Extinction conditions .....................................................................................8 2.4. Un-indexed reflections in 3D reciprocal space ..............................................8 2.5. Diffuse scattering ........................................................................................10 2.6. Intergrowth structures .................................................................................11
3. Symmetry Reduction as a solution to the problems ............................12 3.1. Group-Subgroup relations...........................................................................12 3.2. Supercells ...................................................................................................20 3.3. Commensurate ...........................................................................................22 3.4. Incommensurate .........................................................................................29
3.4.1. The structure of β-SnSb.........................................................................29 3.4.2. The AlB2-type family of structures..........................................................35
4. Approaching the Problem: Two textbook examples. ...........................46 4.1. The structure of Pb0.69Mo4O6 .......................................................................47 4.2. The structure of (Mo,Ti)xMo4O6 ...................................................................55
5. Conclusions .........................................................................................62
Acknowledgements .......................................................................................63
References....................................................................................................64

1
Introduction
During the last 30 years an impressive development of commercially avail-able diffractometers has taken place. Especially the development of detector systems from film over point detector systems to the electronic area detec-tors, we have today, has had a great impact. This development has walked hand in hand with the development of electronic computing power. In all it has made what was once a technique reserved for the few, readily available for any researcher that would be in need of structural investigations. On top, in the last 15 years, there has been a development of software for structural determination from instruction file based Fortran programs to user-friendly windows based systems, or even fully automated systems. This has meant that there is no need for the user to have any background in mathematics or programming to determine a crystal structure. The result of the automatisa-tion is that no theoretical background is needed either: X-ray crystallography is no more than a tool or black box; you enter a crystal and get back the structure.
Is this really true? Have we reached the end of crystallography as a research area - is there nothing more to learn?
For the majority of the crystal structures that are solved this is very near to the truth; otherwise there would be no market for the "black box" products. But what to do when the box fails to give an output, and how to evaluate the quality of an output, apart from looking at the refinement R-values? This thesis will present some of the situations where the black box is failing and some of the ways of handling the problem.

2
1. Methods for structure solution
When collecting diffraction data we only gain half of the information about the structure directly. It is well known that to solve a structure we must recreate the structure factor phases. Through time, many methods for solving the famous "phase problem" in crystallography have emerged. This chapter will shortly describe some methods that are useful when dealing with non-standard crystallography, and try to explain their strengths and weaknesses.
The crystallographic structure factor can be expressed using Equation 1-1 and the relation between measured intensities and the structure factor ampli-tude is given in Equation 1-2.
Equation 1-1 ( ) ( ) ( ) ( )1
exp 2 expN
j j
j
F f i F iπ ϕ=
= = ∑H H r H Hi
Equation 1-2 ( ) ( )2
I F∝H H
Among the early methods the Patterson function1,2 (Equation 1-3) stands out as a method still used today. The Patterson function is defined as the convolution of the electron density with itself; that is the autocorrelation function of the electron density distribution.
Equation 1-3 ( ) ( ) ( ) ( )21
exp 2jk j k
j k
P F i PV
π = − = − − ∑ ∑∑H
u H H u u r ri
The peaks in a Patterson map correspond to the interatomic distances present in the structure. Mathematically, the Patterson function is only depending on the scattering intensity distribution, and can therefore be calculated directly from experimental data. The function does not rely on symmetry but the interpretation of the resulting map is greatly simplified by the occurrence of special positions for the heavy atoms. For simple structures with only a few atoms, this interatomic vector map provides a very good starting point for construction of structure models. A structure may also be regarded as simple in relation to the Patterson function if it contains only a few heavy atoms, as for example the sulphur atoms in a protein molecule. Macromolecular crys-

3
tallography is the area today where the Patterson function is used as a struc-ture solution method. This is done in different disguises or incorporated into other methods. It is an essential part of ShelxD3 and Shelxpro4 where it is used for the initial assignment of "random" phases in MAD and SAD phas-ing routines. The Patterson function holds no assumption about atomicity or dimensionality, and is easily expanded to any dimension necessary to solve a modulated structure. The most successful of all methods is the Direct Methods5,6(incl. references). The method is model independent and only uses the information obtained from the diffraction experiment; diffraction intensities and symmetry. The use of symmetry reduces the calculation times significantly, something that was of great importance in the early days of computers and crystallography. Direct Methods are based on relationships among the structure factor phases induced by symmetry and by physical limits, e.g. the electron density of a real crystal cannot be negative. The most important formulas behind the procedure are: Sayres Equation7 (Equation 1-4). This may also be expressed as the famous triplet relation (Equation 1-5) stating that the most probable phase for a structure factor is given by the phase of the structure factors forming a vector triangle with the one for which we seek the phase. Karle and Hauptman8 were the first to put forward the Tangent Formula (Equation 1-6), which is a development of Sayres Equation and more suitable for com-puter programming. In this equation EH is a normalized structure factor for reflection H.
Equation 1-4 ( )( )
( ) ( )F F FV
θ= −∑
H´
HH H´ H H´
Equation 1-5 ( ) ( ) ( )ϕ ϕ ϕ= + −H H´ H H´
Equation 1-6 ( )( ) ( ) ( )( )( ) ( ) ( )( )
, sintan
, cos
κ φ φφ
κ φ φ
+ − =
+ −
∑∑
H'
H'
H H' H´ H H´H
H H' H´ H H´
Equation 1-7 ( ) ( ) ( ) ( ), E E Eκ ∝ −H H' H H´ H H´
The introduction of Direct Methods into structure solution programs have made crystallography available to a broad audience, and has solved literally hundred of thousands of structures and it is the first choice for almost any structural investigation. However, it is well known that large numbers of

4
unique atoms tend to cause difficulties when applying standard Direct Me-thods programs9,10,11,12. Furthermore pseudo-symmetries in a structure will cause some reflections to be systematically weaker or stronger. This may give rise to phase ambigui-ties13 or other problems14,15 when trying to solve the structure by Direct Methods. Large quasicrystal approximants for example contains both a large number of unique atoms and several different kinds of pseudo symmetries, both rota-tional, translational and inversion centre related. This has been shown to cause difficulties when applying standard Direct Methods16,17. To solve structures having pronounced sub-cells and pseudo-symmetry not compatible with 3D space groups, such as quasicrystal approximants, a method referred to as "Strong Reflections Approach" has been explored re-cently18.19,20,21,22. The method takes advantage of the correlations caused by the pseudo-symmetries and the sub-cell. It is a well known phenomenon that the diffraction patterns and structures of certain approximants are related23,24. This relation is based on the assumption that the element content of the structures are similar. The Strong Reflections Approach may be detached from any such assumptions about element content or for that matter the full symmetry of the diffraction data. The method simply relies on how Direct Methods are working; that a given geometric distribution (a given set of triplet relations) of intensity in reciprocal space will yield a specific phase solution, no matter what actual structure it arises from. Two structures do not need to be obviously related in direct space as long as they are similar in reciprocal space, for example being related by the same sub-cell or pseudo-symmetry. Even small variations in geometry will not affect the result as long as the intensity distribution is maintained. It is the same principles we use when solving a superstructure by first solving the basic structure from the main reflections, and then apply the assumption that the result will be unaffected by the addition of superstructure reflections. A new method called Charge Flipping25,26,27 has recently been developed. Charge Flipping is a dual-space Fourier cycling method that is symmetry independent and independent of atomicity. As a result of the later, Charge Flipping will work in any dimensionality and is as such especially useful for modulated structures. Shortly described, the Charge Flipping routine works in the following way. First the unit cell (of any dimension) is overlaid with a grid. The electron density will be evaluated on the grid points only. An ini-tial electron density is calculated using the observed structure factor ampli-tudes, Fobs. For reflections not measured Fobs is set to zero. Random phases are then assigned, applying only Friedel pair relations.
Equation 1-8 ( )( ) ( ) ( )0
0 exp
0
obs
obs
F iF
ϕ =
H HH
( )
( )
is known
not measured
obs
obs
F
F
H
H

5
In the nth iteration cycle each grid point is evaluated, and the electron density from the previous cycle (n-1) is kept if the density is larger than a small posi-tive threshold, δ, and inverted if below the threshold, Equation 1-9. From this new electron density, new structure factor phases are calculated and combined with Fobs.
Equation 1-9 ( )( )
( )
( )
( )
1 1
, 1 1
if if
n n
n k k
CF k n n
k k
ρ ρ δρ
ρ ρ δ
− −
− −
>=
− <
The cycling continues until convergence is achieved and an overall positive electron density has emerged. Charge Flipping relies on the Fobs being cor-rectly determined and will not work for twinned crystals if the twinning is not recognized. The overlapping reflections can be separated if the twin law is known. Charge Flipping can then be applied to the corrected data. For a more detailed description additional reading may be found in the references 30a, 25 and 27.

6
2. Warning signs of incomplete solution
What remains after solving the phase problem is the structure model refinement. Apart from the cases where the refinement will not pro-ceed to reasonable R-values, certain signs sometimes emerge indicat-ing that the model used to describe the structure is not optimal or in-correct when it comes to the details. In this chapter some of these signs will be briefly presented with examples of their occurrence. The signs may be grouped into those relating to the model and those emerging directly from the data. It should be stressed here that models not taking these effects into account are not necessarily wrong; they may give a very useful and correct image of the overall average struc-ture. For many purposes this kind of model is sufficient.
2.1. Extreme Thermal vibration, partial Occupation
and/or Disorder.
This group of effects constitutes the weakest indications that a model is not optimal, and they are normally ignored as arising from bad crystal quality or poor data. We must also remember that a statistical distribution of atoms on a certain site in some situations is perfectly reasonable and possible. Many examples of these signs exist in the literature, and here we will use the AlB2-type structures. A typical model found for this structure type is shown in Figure 2-1.
Figure 2-1 The structure of NpSi1.6 with 75% thermal ellipsoids indicated28. Blue is Si atoms and gray is Np atoms.

7
The NpSi1.6 structure alone illustrates the issues of partial occupation and large thermal ellipsoids; The hexagonal planes are only 80 % occupied. the Si atom is modelled with an unusually high thermal vibration within the plane whereas the vibration out of the plane is similar to the vibration of the Np atoms. This structural picture is typically what is found for all the AlB2-type structures being deficient on the B site. AlB2-type forming elements found by a literature search are shown in Figure 2-2.
Figure 2-2 An overview of the elements forming the AlB2-type structure. Ele-ments coloured gray prefer the Al site and elements coloured blue prefer the B site.
2.2. Unit cell deformation
One of the most subtle indications that something is not quite right, can be seen already at the data collection stage: Slight deformations of the unit cell away from what would seem like the correct crystal class. This sort of be-haviour is often ascribed to physical effects associated with the data collec-tion, such as instrument calibration. It may indeed be caused by crystal qual-ity, alignment of the crystal and so on. Examples exist though were the ob-served deformation is a real effect even if the data appears to have the full point symmetry of the higher crystal class. A typical case is deformation due to the introduction of vacancies. In the group of rare earth germanides and silicides with the ThSi2-type structure the vacancies are not visible as thermal vibrations mimicking the lattice relaxa-tion but as partial order with lower occupancy on certain sites. The partial ordering results in cell deformations away from tetragonal geometry, and the orthorhombicity ratio (a-b)/(a+b) will depend on the occupancy29. The result

8
is a large number of structures not being recognized as belonging to the ThSi2-type structure.
2.3. Extinction conditions
In reciprocal space, a strong sign of erroneously chosen symmetry is the presence of violations of the extinction conditions. If these reflections are many or strong it is no problem to detect them. They may though be weak and hard to find, as in the case of β-Mg2Al3. In this example violations to the d-glide in the cubic space group 3Fd m are found as indicated in Figure 2-3.
Figure 2-3 hk0 Laue image reconstructed from room temperature data on ββββ-Mg2Al3. The d-glide violations are marked with red circles.
Another sign, indicating that a change of space group may be appropriate is the presence of additional extinction conditions not exploited in the used space group. Such conditions may well show not to comply with any 3D space group symmetry.
2.4. Un-indexed reflections in 3D reciprocal space
A very obvious indication that a 3D model will not be sufficient is the occur-rence of reflections that cannot be indexed using only three reciprocal space vectors. These reflections may lie along one of the principal 3D axes, in a plane defined by two principle axes, or in the general case all three 3D axes are needed to define the position. This kind of reflections will in the rest of the thesis be referred to as satellite reflections; an example is given in

9
Figure 2-4. To index the satellite reflections with integers, additional lattice vectors are needed. Each such vector is referred to as a modulation wave vector or q-vector, and adds an additional dimension to the unit cell. The q-vector is expressed in terms of the principal 3D lattice vectors, Equation 2-1. The parameters α, β, and γ, are the q-vector's component along each of the principal 3D lattice vectors and should not be confused with the unit cell angles.
Equation 2-1 ( )* * *α β γ= + +q a b c
In some cases more than one q-vector will be needed to index the entire dif-fraction pattern, and the vectors are then numbered q1, q2, ... Each q-vector gives rise to an additional Miller index for all reflections. In the 3+1D case the additional index is labelled m. The value of m determines what is called the order of a reflection. For m=0 the reflections are main- or basic reflec-tions. For m= ±1 the reflections are 1st order satellites, and for m=±2 the reflections are called 2nd order satellites and so on. All of this is illustrated in Figure 2-4 and further reading on the subject may be found in the refer-ences30.
Figure 2-4 hhlm layer from a Sn1+δδδδSb1-δδδδ compound with a rhombohedral unit cell in hexagonal setting. The use of the q-vector to index the satellite reflections is illustrated.
The values of α, β, and γ are also important. If any of these are non-rational the modulation is incommensurate. If the values of all three parameters si-

10
multaneously are rational the modulation is metrically commensurate, and reflections will overlap. The nature of this overlap is what determines whether the modulation is truly commensurate or not. If the overlap results in the sum of intensities, the structure is incommensurate, but if the overlap result is the sum of structure factors, the modulation is truly commensurate. This is schematically illustrated in Equation 2-2.
Equation 2-2 ( )
2 2
2
i k
i k
i k
F F IncommensurateI
F F Commensurate+
+ ⇔=
+ ⇔
2.5. Diffuse scattering
It is not always that additional scattering takes the form of Bragg reflections. In many cases the extra order in a crystal structure is only partial and the satellites will have the form of diffuse "blobs" or streaks. No standard method exists for dealing with diffuse scattering, but qualitative analysis is still possible. As the diffraction arises from an extra order that is not fully realized it will occur between the Bragg reflections, and therefore give in-formation about the length scale of the ordering. It is then often possible to "guess" the ordering effect from the structure solution, as this will often show some of the other warning signs discussed here. A different kind of diffuse scattering arises from strain at the grain bounda-ries in the crystal. This will normally occur near the Bragg reflections and may look like a smearing of the peaks. It is the result of a mechanical effect on the nanometre scale and it may help to perform annealing to relieve the strain.
Figure 2-5 Left: Two reconstructed Laue images (hexagonal setting) from Cu3In2. h2l showing well ordered satellites and h7l with diffuse satellites. Pic-ture is courtesy of Shuying Piao. Right: The 1kl (cubic setting) diffraction pat-tern of Sn4Sb3 showing cubic twinning, satellites and diffuse scattering.

11
2.6. Intergrowth structures
A special kind of situation occurs when a structure may be described as an intergrowth between two structure types. Nothing can be said to be wrong with a 3D structure solution, but it does not take advantage of the correla-tions that exist within each of the structure types present. To take a different approach using the symmetry in each of the structure types is first of all a question of parameter economics, especially of interest when using powder data. A second issue to add is the question of what is an elegant description; this is of course an individual taste. In the literature numerous examples of intergrowth structures are found31,32,33,34,35,36,37,38,39 but they are not always recognised as an intergrowth. A good and simple example can be found in the homologous series formed by the compounds USn2, U3Sn7, Ce2Sn5,
40,41,42. The structures are illustrated in Figure 2-6. We will return to this series in section 3.3.
Figure 2-6 The homologous series a) USn2, b) U3Sn7, and c) Cs2Sn5. Blue indi-cate the Sn atom and gray is the rare earth atom.

12
3. Symmetry Reduction as a solution to the problems
The problems discussed in chapter 2 call for different approaches to arrive at a solution, but they all involve the reduction of symmetry in one way or another. Here we will present four approaches illustrated with examples.
3.1. Group-Subgroup relations
The simplest form of symmetry lowering is to remove certain symmetries by changing the space group. As a solution to the refinement problems dis-cussed here, this is most appropriately done by following group-subgroup relations to eliminate unwanted symmetries that relate to, and may be the cause of the observed problem. The indication of a need for such a step may come either from direct space, in the form of disorder, for example an atom moving out of a mirror plane or from reciprocal space as unit cell deforma-tions or violations to extinction conditions. A good example structure is the β-Mg2Al3 structure first solved by Samson43 and now re-determined within the CMA-network44. The background for studying this structure once more is presented in the introduction to paper III. One of the crystals received from Michael Feuerbacher44 is shown in Figure 3-1. Room temperature data were collected, giving a cubic unit cell and R-merge indicating cubic symmetry. The structure was re-fined in the space group 3Fd m (no. 227 origin choice II, origin on 3m). This gave a disordered structure similar to that reported by Samson.
Figure 3-1 One of the spherical crystals of ββββ-Mg2Al3, cut from a large single crystal, and polished. All samples received were cut from the same single crystal.
We then proceeded with a low temperature (100K) data collection, and this yielded the same result. On careful inspection of hk0-Laue images recon-structed from the data, we discovered some weak but sharp

13
Bragg peaks violating the d-glide extinction condition, Figure 3-3a. This lead us to explore the group-subgroup relations for 3Fd m . Following the diagram in Figure 3-2 we then tried the space group F43m as this splits the partial occupied orbits in the structure. This had little effect on the R-values and still resulted in a disordered model. We then tested the space group R3m (in non-standard setting this is equivalent to F13m ), this lead to a significant improvement of the R-values but a disordered and twinned model.
Figure 3-2 Diagram of the group-subgroup relations connecting the space groups Fd3m (no. 227) and R3m (no. 160). The diagram is constructed using the program SUBGROUPGRAPH46. No distinction is made between κκκκ and ττττ type group-subgroup relations.
We then compared the room temperature data with the 100K data and some prominent diffuse scattering could be seen around the most intense Bragg reflections, while weaker diffuse scattering was located between the Bragg reflections. For the room temperature data an example of the observed dif-fuse scattering is visible in Figure 3-3a. The intensity of the diffuse scatter-ing did not decrease when lowering the temperature, this rule out thermal effects as the cause, leaving the possibility of grain boundary strain in the crystal.

14
To relieve the strain, the crystal was annealed at 180°C for 36 hours, and new data were collected showing a dramatic change in the diffuse scattering (Figure 3-4) and also in the number of d-glide violations, Figure 3-3b.
Figure 3-3 a) hk0 Laue image reconstructed from room temperature data on ββββ-Mg2Al3. The d-glide violations are marked with red circles. b) hk0 Laue image reconstructed from room temperature data collected on the annealed crystal. The d-glide extinction condition is now clearly unfulfilled. Both images are in cubic setting.

15
Figure 3-4 Room temperature raw data frame from a) as cast crystal and b) from the annealed crystal. The two frames are taken at the same recording conditions, and the intensities are directly comparable.
The unit cell found for the new data is metrically cubic, but the data statistics for cubic symmetry was significantly worse than for the data before anneal-ing. By comparing the data statistics for rhombohedral symmetry corre-sponding to each of the four cube diagonals, one direction stood out as a particularly good choice indicating that only one of the cubic 3-fold axes remains after annealing. The data were integrated and data statistics showed that the symmetry should be lowered even further to R3m(no. 160). Structure solution and refinement proceeded in this space group. The difficulties do not stop here though. During the initial steps of the structure refinement it became obvious that the cubic pseudo-symmetry is so strong that the Direct Methods solution was cubic. As a result, residuals appeared corresponding to a cubic twinning of the structure. It was necessary to let these enter into the refinement and eventually the atoms that break the cubic symmetry were located. Once this happened, the atoms in the ghost twins refined to zero occupancy and could be removed from the model. The appearance of these ghost twins are illustrated in Figure 3-5 for the location of one cluster. In the final refinements a twin matrix corresponding to cubic twinning was used. This resulted in the refined phase volumes 85% for the major component and 5% for each of the remaining twins. An additional twist to the story is the poor elemental contrast between Mg and Al that only differ in one electron. The elemental distribution was re-solved using two different approaches. One approach is to look at inter-atomic distances as Mg is larger than Al. The other approach is to set all atoms equal to Mg and refine positions and thermal displacement parame-ters. If the quality of the collected data is high, then the atoms having ex-

16
tremely small thermal parameters will be the Al sites. The two methods yielded the same elemental distribution and the same ambiguities.
Figure 3-5 The location of ghost atoms around one cluster centre, necessary to locate the inner shell (blue) of the cluster. The figures a) to d) are consecutive refinement cycles. In the final model no ghost atoms remain.
Inspection of the final structure shows that it is build from two different clus-ter arrangements each build up by three shells. These clusters are then or-dered in a diamond network and the space between the clusters is filled by a network of Friauf polyhedra, Figure 3-6. This entire arrangement is cubic. The breaking of cubic symmetry happens within the clusters. The colour coding used in Figure 3-6 is also used in Figure 3-7.

17
Figure 3-6 a) The arrangement of clusters in a diamond network surrounded by Friauf polyhedra. b) The same arrangement viewed down the rhombohedral c-axis. c) The Mg centred Al build Friauf polyhedron filling the space between the clusters. The clusters in the diamond network are coloured according to the central atom. Ambiguous means that the element species was undetermined by the two methods used.
The shells building up the two clusters are shown in Figure 3-7. The overall point symmetry of the clusters is 3m, and some very distinct features breaking the cubic 43m point symmetry are visible in both clusters. If we compare the second shell of the clusters, ( b) and e) in Figure 3-7), we see that the shell in b) have a triangular feature of Mg atoms where the shell in e) has a three-star of Al and visa versa. In total b) has 3 triangles and one star whereas e) contains 1 triangle and 3 stars. Apart from this the two shells have point group symmetry 43m . In the same way we can compare the shells shown in c) and f) of Figure 3-7. Again they differ only in the distribu-tion of triangles and stars, and the remaining part of the shells follows the 43m point symmetry. The inner shells shown in Figure 3-7 a) and d) are given again in Figure 3-8 for a better representation of the symmetry. In total, 13 atoms out of the 80 unique atoms break the cubic symmetry.

18
Figure 3-7 The different shells building up the clusters. The colour coding is the same as in Figure 3-6. The different features breaking the cubic symmetry are discussed in the text.

19
Figure 3-8 The inner shell of the two clusters. They are clearly seen to have different symmetry.

20
3.2. Supercells
A group of structures where ordering in the form of supercells often occur is the host-guest type structures, where varying interactions between the guest and host leads to a variety of superstructures. As an example representing this kind of structures, we will take the superstructures to the NaMo4O6 structure47 type shown in Figure 3-9.
Figure 3-9 The structure of NaMo4O6 viewed along the a-axis and along the tetragonal c-axis. The unit cell is shown in green.
Table 3-1 The structural parameters of NaMo4O6.
S.G. P4/mbm Atom x y z
a 9.559(3) Mo1 0.1021(1) 0.3979(1) 1/2 c 2.860(1) Mo2 0.3556(1) 0.1444(1) 0 Na1 0 0 0 O1 0.2064(9) 0.2936(9) 0 O2 0.2407(8) 0.0451(9) 1/2
In the different members of this family, the element on the guest (Na) site is varied, with varying occupancy of the guest site and distortion of the host framework as a result48,49,50,51. This is illustrated in Figure 3-10 showing the case of Pb. In this case superstructure reflections were detected correspond-ing to a four-fold supercell, and the structure refined as a superstructure51. This example and a similar superstructure with a mixture of Ti and Mo on the guest position will be treated in detail in section 4.1 and it will be shown how a different treatment of the satellite reflections will result in an ordered model.

21
Figure 3-10 The structure of Pb0.62Mo4O6 as found in the literature. Here viewed along the a-axis and along the tetragonal c-axis. The unit cell is shown in green.
Table 3-2 Structural parameters for Pb0.62Mo4O6. All metal atoms were allowed anisotropic temperature parameters, but only Ueq values are listed. The total number of parameters is 45, as the occupancies are fixed.
S.G. P4/mnc
(no.128)
Atom Occ x y z Ueq(Å2)
a 9.615(1) Pb1 0.75 0 0 0.3009(2) 0.0097(3) c 11.362(3) Pb2 1 0 0 0 0.0474(9) Pb3 0.125 0 0 0.4458(10) 0.030(4) Pb4 0.125 0 0 0.2474(10) 0.013(3) Mo1 1 0.1435(2) 0.6435(2) 0.25 0.0076(6) Mo2 1 0.1445(3) 0.6434(2) 0 0.0091(8) Mo3 1 0.6024(1) 0.1015(1) 0.1250(1) 0.0043(3) O1 1 -0.2067(12) 0.7067(12) 0.75 0.008(3) O2 1 0.0415(11) 0.7627(11) 0.1237(9) 0.005(2) O3 1 0.0413(12) 0.7597(12) 0.3750(9) 0.010(2) O4 1 -0.2098(19) 0.7043(19) 0.5 0.010(3)

22
3.3. Commensurate
A different kind of superstructure is the intergrowth between two structure types. To get an overview of the whole structural variety of such a family it is convenient to make a superstructure model in higher dimensions covering all the existing structures. This will greatly reduce the number of parameters necessary to describe the structures. A model can be built using only the information already published. Here we will take as an example a very sim-ple structure family; that of intergrowth between the CuAu- and Cu3Au structure types, exemplified with RE-Sn structures. The superstructure order-ing in this family is different from the long range ordering in the Au-Cu sys-tem itself31,52,53. The RE-Sn compounds of interest exist in the range 66.67 at.% Sn to 75 at. % Sn, and shows composition driven long range ordering. The known com-mensurate members are given in Table 3-3 and their structures are shown in Figure 3-11.
Table 3-3 The known members of the intergrowth series between the CuAu- and Cu3Au structure types formed in the RE-Sn systems. Space group and unit cell parameters are given for comparison. The number of parameters refined in the published work are given where known and the theoretical minimum num-ber corresponding to one common thermal parameter for all tin atoms and one for the rare earth atoms are given in parenthesis.
Compound S.G. a b c #Parameters Ref
USn2 Cmmm 4.4228(9) 15.451(3) 4.4683(9) - (4) 40
U3Sn7 Cmmm 4.473(2) 24.59(1) 4.498(2) - (6) 40
USn3 3Pm m 4.62 - - - (2) 42
Ce3Sn7 Cmmm 4.524(1) 25.742(11) 4.610(2) 10 (6) 41
Ce2Sn5 Cmmm 4.559(6) 35.01(4) 4.619(4) 14 (8) 41
CeSn3 3Pm m 4.721(2) - - - (2) 41
To analyze the series we first have to locate the end members. The 1:3 com-pounds are the end of high tin content, but investigating the 1:2 compounds both in direct space (Figure 3-11) and in reciprocal space (hk0 layer Figure 3-12) it is seen also to be a superstructure. The real low tin content end member is the CuAu structure type. We may now commence a symmetry analysis based on the known struc-tures. The space group of the CuAu structure type is P4/mmm (no.123) equivalent to C4/mmm in a non-standard setting, and for the Cu3Au structure type the space group is 3Pm m (no.221). The intermediate commensurate members listed in Table 3-3 all have the symmetry Cmmm (no.65), and fur-ther does the modulation wave vector have the form *β=q b as seen from Figure 3-12. In all, this requires us to lower the symmetry for the end-members to orthorhombic. The highest allowed symmetry for the CuAu structure type is then Cmmm and for the Cu3Au structure type it is Pmmm.

23
Figure 3-11 From left to right, the published structures of Ce2Sn5, U3Sn7 and USn2. Important to note is how the Sn atom at the interface moves out of the plane defined by the rare earth atom (sn2 in the superspace model).

24
The diffraction pattern from USn2 shows that all reflections follow the con-dition hklm: h+k+m=2n, indicating a centring vector of ½½0½ for the 3+1D superspace lattice. In total the information results in the superspace group Xmmm(0β0)000 where X represents the non-standard centring involving the fourth dimension.
Figure 3-12 The hk0 layer calculated from the published USn2 structure. The pattern shows superstructure reflection, and the USn2 is thus not the low tin content end member. The published cell is shown in black and the new basic cell shown in green. For two reflections the satellite indexing and overlap is indicated.

25
The two end structure types are shown in Figure 3-13 and a calculated hk0 layer for each is shown in Figure 3-14. The Cu3Au type corresponds to β=0 and the CuAu type corresponds to β=1.
Figure 3-13 Left: The CuAu structure type. Right: the Cu3Au structure type. For both structures yellow indicate the gold sites and orange indicate the cop-per sites. Intergrowth ordering occurs along the b-axis.
Figure 3-14 a) The hk0 layer for the CuAu structure type. The standard cell is shown in black and the new basic cell is shown in green. b) The hk0 layer for the Cu3Au structure type. The published cell is identical to the basic cell used in the superspace description, and is shown in green.

26
Comparing the length of the b-axis for the compositions in Table 3-3 with the length of the b-axis for the 1:3 compounds we find the value of β for each compound. For USn2 we can also see from Figure 3-12 that β is 1/3. From the literature54 we find that the stoichiometry can be described by one single parameter, n. This may be used to describe the value of β as well, as shown in Table 3-4.
Table 3-4 The connection between the observed structures and the parameter n.
n Formula (REnSn3n-2) ββββ=1/(2n-1)
2 USn2 1/3
3 U3Sn7 1/5
4 Ce2Sn5 1/7
... ... ...
∞ CeSn3 0
Looking at the structures in Figure 3-13 it is seen that half of the atoms in the unit cell are always tin, while the other half will be a mixture of RE at-oms and tin atoms with a ratio given by n. With this observation it is conven-ient to reformulate the stoichiometry expression: As half of the atoms can be expressed as 2n-1 the new expression for the composition is REnSn2n-1Sn2n-1-n To calculate the occupancy it is necessary to normalize to one atom, this is done by division by 2n-1, and the stoichiometry now reads
Equation 3-1 REn/(2n-1)Sn1Sn(n-1)/(2n-1)
From the structures shown in Figure 3-11 it is seen that the tin atom in the boundary between the Cu3Au-type blocks moves towards the neighbouring block. Now all the information is ready to put together the complete 3+1D superspace model. The parameters are given in Table 3-5.
Table 3-5 The structural parameters for the 3+1D structural description. The only parameters free to refine are the harmonic modulation wave on Sn2, (symmetry restricted to only affect the position along x2) and thermal parame-ters on the atoms.
Atom x1 x2 x3 Occ. Modulation
U1 0 0 0 n/(2n-1) crenel on occupancy x40=0
Sn1 ½ ½ 0 (n-1)/(2n-1) crenel on occupancy x40=0
Sn2 0 ½ ½ 1 1 harmonic wave on x2
The minimum number of parameters to refine is 2 thermal parameters and 1 harmonic wave parameter to account for the relaxation at the block interface, the rest is locked by symmetry or the composition. This should be compared

27
to the number of parameters mentioned in Table 3-3. A more reasonable number is 3 thermal parameters if all atoms are treated independently, but isotropic. Only the very symmetry restricted 1:3 end structure has less pa-rameters. For the observed structures n is an integer, but nothing in this description prevents n from taking on any value. This corresponds to the ratio of the q-vectors length becoming irrational with respect to the basic unit cell as de-scribed in section 2.4. When this happens, the structure is said to be incom-mensurately modulated. The superspace models used to describe intergrowth compounds are not restricted to the commensurate members; they describe all the intermediate compositions too. For the model we have just derived two theoretical incommensurate cases are illustrated in Figure 3-15. Whether or not these compounds exist is another question. The lack of information on these intermediate compounds may rely on that only the "best quality" crys-tals of a product were investigated, or that no syntheses have been attempted in the region. It may also be that specific intermediate stoichiometries are not favourable as is the case in the AlB2-type ErGe2-x compounds discussed in paper IV. When passing through the incommensurate values the q-vector may change not only in length but also its direction to encompass a continu-ous change in composition. The family of intergrowth between the ScFe6Ga6 and ScFe6Ge6 structure types thoroughly described in paper V is an excellent example.
28
Figure 3-15 Two hypothetical incommensurate structures generated using the proposed model and values of n = ππππ and 5n = . The models does not show the relaxation at the block interface. For easy overview the empty octahedra formed by the Sn atoms are drawn to show the Cu3Au structure type blocks.

29
3.4. Incommensurate
3.4.1. The structure of β-SnSb
Stoichiometry variation controlled by block interfaces is not a phenomenon limited to intergrowth compounds. In the Sn-Sb intermetallic system the β-SnSb compound has a large homogeneity range, best described as Sn1-xSb1+x (-0.57≤x≤0.4). Though the Sn-Sb system has been investigated several times many unsolved questions exist55,56,57,58. Like with the β'-Mg2Al3 structure, the Sn-Sb compounds show little elemental contrast from the difference in elec-tron count, and any ordering should be expected difficult to find. For this reason it is surprising that the β-SnSb shows satellite reflections as strong as the main reflections. Where does the contrast come from? In the homogeneity range of β-SnSb four samples were produced. Two sam-ples were synthesised by a Sn flux method and two were made by melting stoichiometric mixtures of the elements. Finally the high temperature Sn3Sb2 compound was synthesised using a Sn flux. This compound decomposes into the most tin rich member of the β-SnSb. An overview of the samples can be found in Table 3-6. Upon extraction of the samples they showed obvious differences in appearance. The synthesis of Sn3Sn2 produced cubic crystals while the remaining samples were plate like. With increasing Sb content the plate like behaviour becomes less prominent and the samples gain a more glass like appearance. All the samples are brittle. The samples were studied with SEM and elemental analyses were performed with EDS. The SEM images are presented in Figure 3-16 and the EDS results are given in Table 3-6.
Table 3-6 Data on the synthesized samples. The two temperatures given are first for synthesis and the second for annealing. The temperature was lowered with the sample still in the furnace. All samples were quenched in water upon removal from the furnace.
Sample ID
Synthetic mixture
Temp. /°°°°C
% Sn from EDS
% Sb from EDS
a c ββββ
CMB504 57 44 4.338(3) 5.316(4) 1.285(2) A41 Sn5Sb2 650/260 58 43 4.339(3) 5.312(9) 1.276(9) A43 Sn3Sb2 650/350 53 45 4.326(2) 5.349(2) 1.311(2) jc001 SnSb 650/400 43 56 4.330(2) 5.372(2) 1.356(2) jc002 Sn9Sb11 650/420 40 59 4.329(9) 5.412(2) 1.371(8)

30
Figure 3-16 SEM images representing each of the samples synthesized. It is seen how the morphology changes from stacked plates to a more glass like ap-pearance.

31
Figure 3-17 Reconstructed Laue images representing the collected x-ray dif-fraction data. For CMB504 the image shows the 1kl layer using a cubic setting, the remaining images show the hhlm layer in hexagonal setting. The images show that the length of the q-vector changes, and that the higher order satellites appear at high Sb content. The change from plate like to glass like appearance is seen as a decrease in the tendency to form powder rings.

32
From each sample a crystal was selected for single crystal x-ray diffraction. The collected data show a composition dependent q-vector (Figure 3-17) and that the superspace group is ( )R3m 00 00γ . The basic cell is very near metri-cally cubic (the rhombohedral angle is debated in the literature56,57), with one atom at the origin. The satellites must result form elemental ordering on this site possibly combined with a relaxation of the lattice. The composition and the length of the q-vector must therefore be coupled, and from the EDS analysis the relation can be established. Unfortunately the EDS analysis also show that the samples are not homogeneous and to establish a more accurate relationship EDS analysis will have to be performed on the crystals used for the diffraction experiments. Analyzing the phase diagram, the samples CMB504 and A41 must have the same composition. Thus only the un-twinned sample is discussed from hereon.
When solving and refining the structures it emerges that Sn in two ways is a rather soft atom whereas Sb is hard. The tin have a higher thermal vibra-tion and is modulated with a single harmonic function. The antimony on the other hand has a low vibration and is best described using a saw-tooth func-tion. The thermal vibration smears out the electrons of the lighter tin atom and bunch together the electrons of the heavier antimony. This helps in-crease the x-ray diffraction contrast. How the appearance of the two atoms evolves in the density maps from the four compositions are shown in Figure 3-18. It shows how the total modulation becomes stiffer with increasing Sb content. This is also indicated in the data, with more 2nd and 3rd order satel-lites emerging for the samples with high Sb content. We may now evaluate how the structure can cover such a large homogeneity range. From the refinements we see that the structure is build from slabs of SnSb arranged in the NaCl structure type. The slabs are stacked along the cube diagonal of the NaCl cell, resulting in an overall rhombohedral ar-rangement. The composition is controlled by the width of the slabs and by the composition of the interface between slabs. In the Sn rich samples the slabs are small, and Sn-Sn interfaces dominate. For the Sb rich samples the slabs are wider, and Sb-Sb interfaces are dominating. The four structures solved are presented in Figure 3-19.

3
3
Figure 3-18 The final electron density maps of Sn and Sb. Blue indicate Sb and red indicate Sn. From left to right the Sb content increases.

34
Figure 3-19 Representative parts of the refined structures showing their block behaviour. With increasing Sb content, the interfaces changes from pure Sn-Sn to mixed Sn-Sn and Sb-Sb interfaces, and finally pure Sb-Sb interfaces. At the same time the block size increases.

35
3.4.2. The AlB2-type family of structures
We have in section 2.1 briefly introduced this structural family as an exam-ple of structures where certain atoms have extreme thermal vibration, in combination with deficient occupancy. We will in this section elaborate on the issue and show the cause of it, by investigation of structures found in the literature, together with the refinement of nine new structures against powder diffraction data. For clarity we reproduce below the structural image also shown in section 2.1.
Figure 3-20 The structure of NpSi1.6 with 75% thermal ellipsoids indicated28. Blue is Si atoms and gray is Np atoms.
The apparent high thermal vibration found in these structures could be real or mimic static displacements. The image becomes much clearer when con-sidering special variations of the AlB2-type structure. The Y3Ge5 structure60 is one such example, and the structure is shown in Figure 3-21, while the structural parameters are given in Table 3-7.
Figure 3-21 The structure of Y3Ge5 with 75% probability thermal ellipsoids indicated. Only one hexagonal layer is shown for clarity. Blue indicate Ge and gray is Y.

36
Table 3-7 The structural parameters for Y3Ge5.
S.G. P-62c Atom x y z Occ B (Å)
a 6.838(2) Y1 0.328(5) 0 0 1 0.62(8) c 8.298(3) Ge1 0.323(5) 0.390(3) 1/4 0.82(1) 0.62(8) Ge2 0 0 1/4 1 0.62(8) Ge3 2/3 1/3 1/4 0.82 0.62(8) Ge4 0.390(3) 0.323(5) 1/4 0.18(1) 0.62(8) Ge5 1/3 2/3 1/4 0.18(1) 0.62(8)
For this structure the static disorder is no longer hidden in the thermal pa-rameters, but refined as partially occupied sites. To get a better view of what is going on, we simply remove the less occupied atoms, as illustrated in Figure 3-22. This ordering of the structure is discussed in detail in the origi-nal paper60 and is similar but not identical to the structure of Yb3Ge5 which has a different stacking of the layers along the c-axis61.
Figure 3-22 One layer of the Y3Ge5 structure after removing the less occupied atoms. The stacking of layers is such that vacancies in one layer are between three-connected germanium atoms in the adjacent layers.
When investigating rare earth germanide and -silicide systems, Venturini and Malaman62 discovered the presence of weak superstructure reflections, both in Weissenberg images63 and in their powder diffractograms together with line splitting from distortion of the basic hexagonal cell. They indexed the patterns and put forward a structural hypothesis that was tested for one commensurate case, Tm2Ge3. This revealed the existence of a new group of structures with extended vacancy ordering in the parent AlB2-type structure. It also showed the modulation wave vector to be directly coupled to the oc-

37
cupancy of the germanium or silicon, though the relation at that time was somewhat unclear. To take on a rigorous full scale modulation approach to the problem, eight new samples were prepared in the Er-Ge system, ranging from Er41Ge59 to Er39.25Ge60.75 in steps of 0.25 at.% germanium in the synthesis mixture. The samples were arc melted and the products analyzed using x-ray powder dif-fraction. The collected data confirmed the previous reported line splitting originating in the distortion of the hexagonal basic cell, and also the effect of composi-tion on the modulation wave vector. Representative parts of the data are reproduced in Figure 3-24 showing the discussed line splitting. As a result of the distortion, the space group of the basic cell was determined as C2/m(no.12) according to the group - sub group relation P6/mmm - Cmmm -
C2/m. Apart from the C-centring condition hkl0; h+k=2n on the main reflec-tions an additional condition applies to the satellite reflections. To illustrate this, Figure 3-23 shows the indexing of some observed and unobserved re-flections. Similar analysis of all the measured data confirmed the condition hklm: h+k+m=2n, note that this condition includes the C-centring condition for the main reflections.
Figure 3-23 Part of the diffractogram from ErGe1.59423(18) indicating observed and systematically extinct reflections, according to the condition h+k+m=2n. Forbidden reflections are marked as red. The impurities present are top row tick marks: Er2O3. Middle row tick marks: ErGe1.83.

38
Figure 3-24 Examples of observed line splitting and satellite positions depend-ing on composition. The reflections 2200 and 0400 are split due to orthorhom-bic distortion and 1110 and 1110 are split due to a monoclinic distortion. The impurities present are indicated with vertical lines. For clarity only diffracto-grams from 6 samples are shown.

39
Put in words, the condition states that first order satellites are only allowed for main reflections systematically absent due to the C-centring, whereas second order satellites are only allowed for main reflections allowed by the C-centring. It is the equivalent of a centring vector ½½0½ of the 3+1D su-perspace lattice. The allowed superspace groups30 are then: X2/m(α0γ)0s
X2/m(α0γ)00
The group X2/m(α0γ)0s fulfils the same extinction conditions as X2/m(α0γ)00 but in addition contains the extinction condition for the s-glide, h0lm: m=2n. This later condition is strictly adhered to in all cases studied. This determines the superspace group to be X2/m(α0γ)0s. To prepare a model suitable for refinement, the AlB2-type parent structure is first transformed through the group - subgroup relation to C2/m and from here lifted to the 3+1D superspace group X2/m (α0γ) 0s .
Table 3-8 The structural parameters of AlB2 transformed into 3+1D super-space.
S.G. X2/m (α0γ) 0s Atom Er Ge
a 3.009 x1 0 0.5
b 5.2117 x2 0 0.1667
c 3.262 x3 0 0.5
ββββ 90 Occ 1 crenel funct.
q-vector αa*+γc*
The function describing the Ge occupancy is called a crenel function64. The function is defined by a centre in the fourth dimension x4
0 and a width ∆x4. A principal drawing is shown in Figure 3-25. In addition to this description of the occupancy, all atoms are allowed to move away from the ideal position by applying two sinusoidal modulation waves to each atom. This allows the structure to relax around the vacancies. The density maps after refinement are shown in Figure 3-26 for the Er atom, and in Figure 3-27 for the Ge atom. To obtain a 3D image of the real crystal we have to perform a 3D cut of 3+1D superspace. In the density maps such a cut will be represented by a line perpendicular to the x4-axis. We can directly relate such a cut to the real structure by comparing the density maps in Figure 3-27 with the Ge layer in Figure 3-28.

40
Figure 3-25 Principal drawing of a crenel function. The interpretation of ∆∆∆∆x4 is shown.
Figure 3-26 The 3+1D electron density of Er.

41
Figure 3-27 Top: The x2-x4 density map of Ge. Each line corresponds to a se-quence of atoms in the real crystal. Bottom: One layer of Ge atoms. Bands of atoms corresponding to specific cuts of the 3+1D density are highlighted in colour corresponding to the cuts shown in the x2-x4 map above. The band la-belled "5" corresponds to the cut shown in the x1-x4 map in Figure 3-28.

42
Figure 3-28 Top: The x3-x4 density map of Ge. A cut in this map corresponds to to the stacking of consecutive hexagonal layers of Ge. The example drawn shows that vacancies will not be stacked onto each other. Bottom: of x1-x4 den-sity of Ge. A specific cut is shown with the same colour coding and number as in Figure 3-27.

43
Apart from pure AlB2-type structures, slabs of this structure type may be incorporated into other structures; building intergrowth compounds, and simultaneously preserving the preference for vacancy ordering. An example of this is found in the YGe1.82 structure61 shown in Figure 3-29 with the structural parameters given in Table 3-9. In this case one network atom is disordered and partially occupied. By using the ordering information from the Y3Ge5 structure we can systematically remove 2/3 of these atoms. The result is again vacancy ordering as illustrated in Figure 3-30, this is dis-cussed briefly in the original paper.
Figure 3-29 The structure of YGe1.82. Ytterbium atoms are gray and germa-nium atoms are blue; dark blue indicate planar square nets and light blue indi-cate AlB2-type slabs.
Table 3-9 Structural parameters for YGe1.82.
S.G. Cmcm Atom x y z Occ
a 4.1157(9) Y1 0 0.9402 1/4 1 b 29.835(6) Y2 0 0.1725 1/4 1 c 3.9351(9) Ge1 0 0.3541 1/4 1 Ge2 0 0.5917 1/4 1 Ge3 0 0.7486 1/4 1 Ge4 0 0.5109 0.334 0.323

44
Figure 3-30 A zoom-in on the AlB2-type slab in YGe1.82 with a theoretical order-ing of vacancies indicated.
Apart from the vacancy ordering within the planes an interesting issue is the possible schemes for ordering the planes with respect to each other. The simplest way is: Adjacent planes are in phase, and planes separated by a square net are in phase. This situation is illustrated in Figure 3-31. In the literature it has been debated whether the structure is ordered or not, and what the true symmetry is. There is though a general agreement that it is impossible to choose between the suggested space groups Cmcm (no.63) and Cmc21 (no.36) neither from refinement R-values61,65 nor from investigation of high resolution neutron diffraction data giving information about the pres-ence of a centre of symmetry65. The standard is to go for the highest symme-try group, but arguments have been put forward regarding which model is the physically most reasonable65. At a first glance it is true that a model in Cmcm results in short Ge-Ge distances, but, as we have seen in Figure 3-30, this situation does not need to occur in the real crystal with the refined atomic occupancies. The question is how big a difference in the diffraction data an ordering of the vacancies would result in. To illustrate how difficult it would be to detect any ordering, Figure 3-32 shows theoretical precession images calculated from the published disordered model and from the theoretical simple ordered model in Figure 3-31. Obviously one will need a perfect crystal with no do-main disorder but also a reliable instrument giving a minimum of back-ground noise to detect these subtle differences. Further more it is hard to imagine that the different ordering schemes are separated by large differ-ences in energy so the hope for a perfect ordered crystal is small. Indeed investigations using a Weissenberg film camera did not reveal the presence of any super structure reflections61.

45
Figure 3-31 The simplest form of vacancy ordering in YGe1.82.
Figure 3-32 The theoretical precession image of the 0kl plane calculated from a) the disordered YGe1.82 and b) the ordering scheme from Figure 3-31.

46
4. Approaching the Problem: Two textbook examples.
Apart from the situation where a diffraction pattern clearly is not in-dexable using only 3 vectors, it can be quit difficult to explain how to recognize that a structure is modulated. In this chapter we will go through two textbook examples, from the initial structure solution to the final full 3+1D model. The examples belong to the family of super-structures to the NaMo4O6 structure type discussed in section 3.2. For the purpose of being a teaching example we will treat them as being unknown samples.
Figure4-1 Diffraction patterns from different structures encountered during the Ph.D. project. All except the germanate are modulated.
47
4.1. The structure of Pb0.69Mo4O6
With today's single crystal x-ray diffractometers, a structural analysis of an unknown sample can be almost completely automated. A crystal is selected and mounted for the experiment. A computer program then controls the col-lection of a small set of data in order to determine the unit cell. Afterwards an optimized data collection procedure is generated, and data are collected. Finally the data are integrated, and a space group determination is performed using the intensity statistics. The final step of solving and refining the struc-ture can be automated as well, but is normally performed manually. On investigation of the title compound, the data extraction, automatic peak search, indexing and space group determination resulted in the space group P4/mbm (no.127) with a=9.6112(3)Å and c=2.8411(1)Å. Solving the struc-ture using standard software produced the model shown in Figure 4-2. Ex-panding to a few unit cells along the c axis immediately shows that one atom residing inside a channel is disordered. This atom also turns out partially occupied.
Figure 4-2 The structure of Pb0.69Mo4O6 viewed down the a-axis. The structure was solved from an automated data collection and integration.

48
As discussed in section 2.1 this kind of behaviour signals that one should investigate the possibility for vacancy ordering. First question arising now is whether the data contains information about such ordering; were all reflec-tions integrated properly, or are some weak superstructure reflections miss-ing. To investigate this, one could follow the data integration as it pro-gresses, but software development now allows for the reconstruction of Laue images of any plane in reciprocal space, showing the indexing of any point. With this approach it is easy to see if non-integer indexed reflections are present. Reconstructions of the principal zone axes are shown in Figure 4-3.
Figure 4-3 The reconstructed Laue images of 0kl, h0l, hk0 and hhl.
If additional reflections are found, the new unit cell can be derived from the old one, using the Laue images, and a new data integration can be per-formed. Using the new unit cell, the Laue images may be regenerated. From Figure 4-3 extra reflections are seen corresponding to a 4-fold superstructure along the c-axis. As extra reflections are only seen along the c-axis recon-structing the 0kl and 1kl will be almost indispensable when it comes to de-termine the systematic absence conditions and from them the space group symmetry. Laue images with the new cell are identical to those in Figure 4-3

49
as the cell orientation is the same, only the indexing is changing. To determine the extinction condi-tions and thus the superspace group Figure 4-4 highlights the main and satellite reflections. For the main reflections (yellow) in the 0klm layer it is seen that k=2n, and no conditions arise for these reflections from the 1klm layer, giving the condition 0kl0:
k=2n. For the satellite reflections (red) extinctions are seen in both images, giving the condition hklm: h+k+m=2n. Finally, as the unit cell is metrically tetragonal, the hhlm layer should be investi-gated. The extinctions from the hhl layer give the condition hhlm: m=2n. To summarice: 0kl0: k=2n
hklm: h+k+m =2n
hhlm: m=2n
This results in the 3+1D super space group P4/mbm (00γ) 00ss
Figure 4-4 The reconstructed Laue images of the 0klm, 1klm and hhlm layers with the unit cell grid over-laid and allowed main- (yellow) and satellite- (red) reflections indi-cated. The reflection condition is seen to be 0kl0: k=2n hklm: h+k+m =2n and hhlm: m=2n.

50
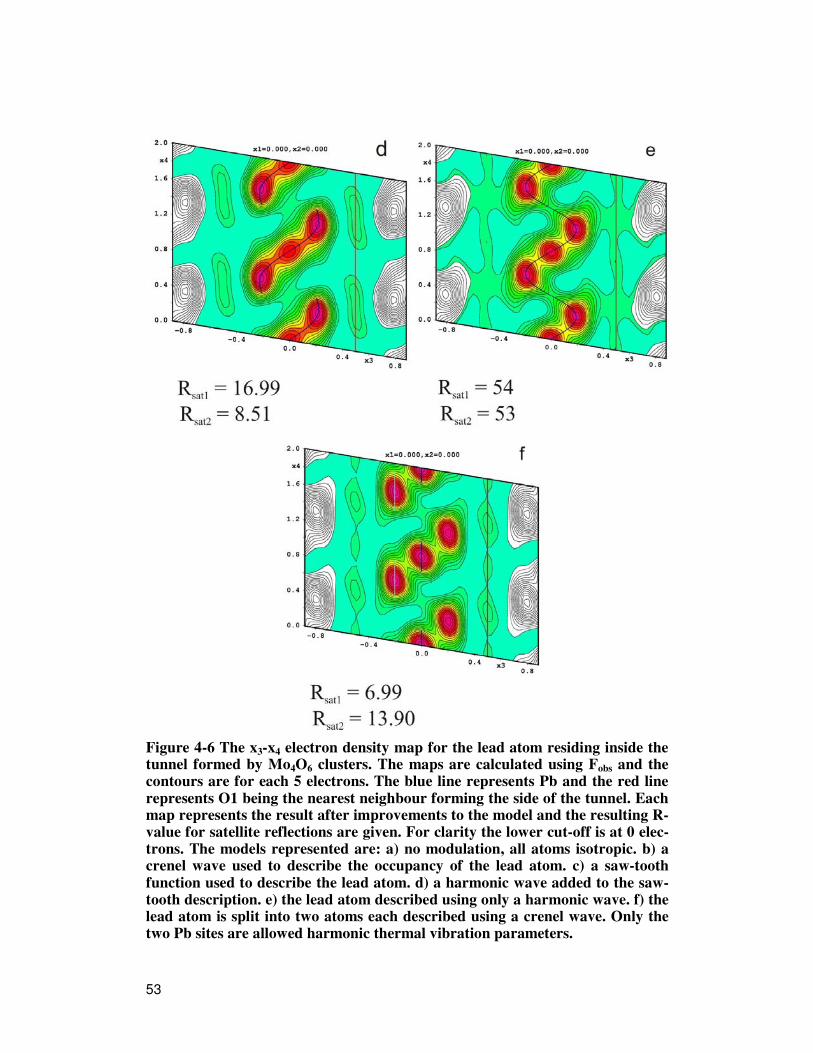
First the basic structure is solved using the main reflections hkl0. This ap-proach results in a structure identical to the one obtained from the automated approach mentioned earlier. To make the structure useful for refinements in the 3+1D approach, the disordered lead atom is moved to it's ideal position on the mirror plane, as in the parent NaMo4O6 structure shown in Figure 3-9. The refinements now proceeds as follows; after initial refinement, an elec-tron density map of the lead atom is generated, Figure 4-6a. The smearing of the density indicates that the atom position is a function of x4, and is better treated with a modulation function. From here two "roads" are possible, we will describe them one at a time: The lead atoms occupancy may be de-scribed with a crenel functions as the density map indicates unique atoms along x4. The starting values of the parameters may be extracted from the density map, giving x4
0 = 0 and ∆x4 = 0.5. The crenel function is described in section 3.4.2. The electron density map after refinement is shown in Figure 4-6b. In this map the deepest hole of -45 electrons is between the Pb atoms. The map also indicates that a better description would be to use a saw tooth function to describe the positional modulation, again the initial parameter values can be extracted from the map. The centre is still x4
0 = 0, the exten-sion in x4 is ∆x4=0.5 and the extension in x3 is = 0.18. The saw tooth function is defined in Equation 4-1 and a principal drawing is given in Figure 4-5.
Equation 4-1 ( )0
4 40
4
2x
x x−=
∆U U
Figure 4-5 Principal drawing of a saw tooth function with indication of the parameters.

51
After refinement a much better description is obtained as shown in Figure 4-6c. Though the over all agreement looks good, the saw tooth function is off at the point of termination, this may be corrected by adding a harmonic function. From the refinement three discrete atomic positions appear in the density map in Figure 4-6d. Going back to the previous density map, a ten-dency for this is already visible. To complete the model a new atom is added and the occupancies of both atoms are described using a crenel function. The parameter values read from the density map are for the new atom Pb1: (x1,x2,x3) = (0, 0, -0.21), x4
0 = 0.67 and ∆x4 = 0.3 . And for the original atom Pb: x4
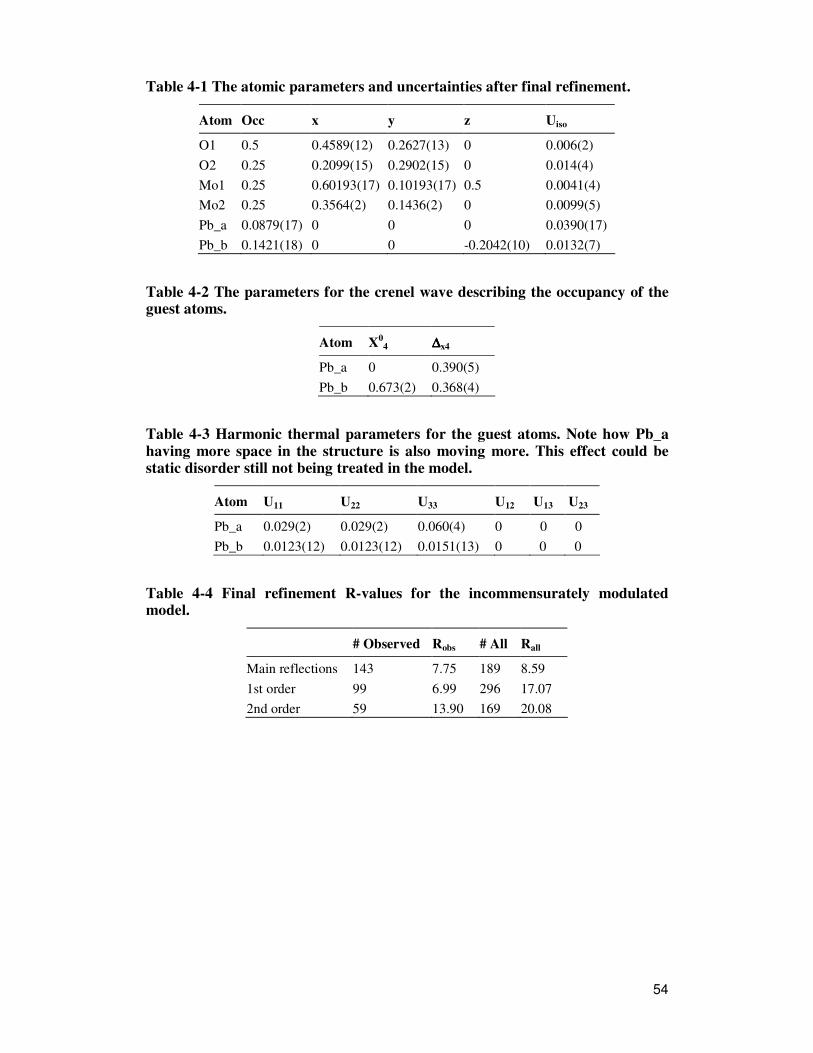
0 = 0 and ∆x4 = 0.3 . The parameters are refined and finally the Pb at-oms are allowed harmonic thermal parameters. The final density map is shown in Figure 4-6f. As mentioned, a second refinement route exists. After refinement of the ba-sic structure, the Pb atom is allowed to move in the x3-x4 plane using a har-monic modulation wave. The resulting density map, Figure 4-6e, is strik-ingly similar to Figure 4-6d, and the procedure is the same as for that de-scription, again arriving at the density map in Figure 4-6f. As the q-vector is metrically commensurate to the c-axis, it should be tested how the model refines as a commensurate structure, and as a superstructure. Both these results yield worse refinement R-values, and the final result is the incommensurately modulated structure. The structural parameters after the final refinement are given in Table 4-1, Table 4-2 and Table 4-3. The R-values are given in Table 4-4. We can now compare with the structural model that has been published46 and for which the structural parameters were given in Table 3-2. The published superstructure model uses 45 parameters compared to the 22 parameters used in the 3+1D model we have just de-rived, and further more the present model is ordered compared to the 3D model.

52
53
Figure 4-6 The x3-x4 electron density map for the lead atom residing inside the tunnel formed by Mo4O6 clusters. The maps are calculated using Fobs and the contours are for each 5 electrons. The blue line represents Pb and the red line represents O1 being the nearest neighbour forming the side of the tunnel. Each map represents the result after improvements to the model and the resulting R-value for satellite reflections are given. For clarity the lower cut-off is at 0 elec-trons. The models represented are: a) no modulation, all atoms isotropic. b) a crenel wave used to describe the occupancy of the lead atom. c) a saw-tooth function used to describe the lead atom. d) a harmonic wave added to the saw-tooth description. e) the lead atom described using only a harmonic wave. f) the lead atom is split into two atoms each described using a crenel wave. Only the two Pb sites are allowed harmonic thermal vibration parameters.
54
Table 4-1 The atomic parameters and uncertainties after final refinement.
Atom Occ x y z Uiso
O1 0.5 0.4589(12) 0.2627(13) 0 0.006(2)
O2 0.25 0.2099(15) 0.2902(15) 0 0.014(4)
Mo1 0.25 0.60193(17) 0.10193(17) 0.5 0.0041(4)
Mo2 0.25 0.3564(2) 0.1436(2) 0 0.0099(5)
Pb_a 0.0879(17) 0 0 0 0.0390(17)
Pb_b 0.1421(18) 0 0 -0.2042(10) 0.0132(7)
Table 4-2 The parameters for the crenel wave describing the occupancy of the guest atoms.
Atom X04 ∆∆∆∆x4
Pb_a 0 0.390(5)
Pb_b 0.673(2) 0.368(4)
Table 4-3 Harmonic thermal parameters for the guest atoms. Note how Pb_a having more space in the structure is also moving more. This effect could be static disorder still not being treated in the model.
Atom U11 U22 U33 U12 U13 U23
Pb_a 0.029(2) 0.029(2) 0.060(4) 0 0 0
Pb_b 0.0123(12) 0.0123(12) 0.0151(13) 0 0 0
Table 4-4 Final refinement R-values for the incommensurately modulated model.
# Observed Robs # All Rall
Main reflections 143 7.75 189 8.59
1st order 99 6.99 296 17.07
2nd order 59 13.90 169 20.08

55
4.2. The structure of (Mo,Ti)xMo4O6
A similar compound also being a variation on the NaMo4O6 structure type is the (Mo,Ti)xMo4O6 with a mixture on the guest atom position. Following what we have just learned in section 4.1, we begin by investigating recipro-cal space by means of the reconstructed Laue images shown in Figure 4-7.
Figure 4-7 The Laue images for the principal axes of (Mo,Ti)xMo4O6, together with the extinction conditions.
There are no indications of superstructure reflections or special extinction conditions so we proceed in 3D and determine the unit cell parameters a=9.7962(2)Å b=9.4497(1)Å c=8.5815(1)Å. The space group is determined from the extinction conditions listed in Figure 4-7 to Pbam(no. 55). Solving the structure with Shelx9766 using the winGX67 interface results in the disor-dered structure shown in Figure 4-8.

56
Figure 4-8 The structure of (Mo,Ti)xMo4O6, solved in the 3D space group Pbam.
What went wrong? To analyze this, we go back and investigate the data once more. By careful inspection of the 0kl, 1kl, 2kl, and 3kl layers shown in Figure 4-9 it is seen that a 3-fold superstructure is present. The extinction conditions found ear-lier translates to
h000: h=2n
0k00: k=2n
h0lm: h=2n
0klm: k=2n
This results in the 3+1D superspace group Pbam(00γ)000 and the unit cell parameters are now a=9.7962(2)Å b=9.4497(1)Å c=2.8564(1)Å

57
Figure 4-9 The reconstructed Laue images for 0 ≥≥≥≥ h ≥≥≥≥ 3, indicating a 3-fold superstructure.
From here we follow the same procedure as in the previous section. After refinement of the basic structure, the electron density map of the trouble-some atom is drawn (Figure 4-10a). The interpretation of the density map in Figure 4-10a is that the occupation should be described using a crenel wave with x4
0=0 and ∆=0.6 as the initial parameter values. After several refine-ment cycles where modulation functions are added to the remaining atoms the electron density for the Mo/Ti site is unchanged, and the remaining at-oms show the electron density maps presented in Figure 4-11.

58
Figure 4-10 a) The electron density of the mixed Mo/Ti site after refinement of the basic model. b) The same position after refinement using a crenel wave.

59
Figure 4-11 The final density maps for a) and b) the Mo1 c) the Mo2.
Once again, as the q-vector is commensurate with the c-axis, the final 3+1D model is transformed to a 3D superstructure and refined. In contrast to the Pb0.69Mo4O6 structure that gave worse R-values in a supercell description, we now obtain R-values that are similar to the modulated approach. This behaviour reminds us of the β'-Mg2Al3 structure where the cubic pseudo-symmetry is so strong that the initial Direct Methods solution is cu-bic. In the present example we cannot obtain the ordered supercell model using Direct Methods as tested in the beginning of this section. Instead we have to use a 3+1D superspace approach to phase all the superstructure re-flections correctly, and then transform the solution back into 3D. The final parameter values for both models are presented in the tables below.

60
Table 4-5 The atomic parameters and uncertainties after final refinement of the 3+1D model.
Atom Occ x y z Uiso
O1 0.5 0.31699(17) 0.23098(17) 0.5 0.0066(3)
O2 0.5 -0.24346(16) 0.02323(16) 0 0.0054(3)
O3 0.5 -0.43595(17) 0.25886(17) 0 0.0055(3)
Mo1 0.5 0.408387(17) 0.111053(18) 0 0.00416(5)
Mo2 0.5 -0.349354(18) 0.133017(18) 0.5 0.00434(5)
Mo3 0.780(3) 0 0 0.36686(8) 0.00712(6)
Table 4-6 The parameters for the crenel wave describing the occupancy of the guest atom, and the parameters describing the harmonic modulation of the framework atoms.
Atom X04 ∆∆∆∆x4
Mo3 0.7900(2) 0.3095(10)
Atom Zsin1 Xcos1 Ycos1 Zsin2 Xcos2 Ycos2
O1 0.0061(7) -0.0002(2) 0.0043(2)
O2 -0.0004(8) 0.0105(2) -0.0092(2)
O3 0.0024(7) -0.0093(9) 0.0120(2)
Mo1 0.00381(10) -0.00362(3) 0.00359(3) -0.0025(3) -0.00136(11) 0.00162(11)
Mo2 -0.04922(10) -0.00018(4) 0.00061(4) -0.02055(18) -0.00007(10) -0.00033(10)
Table 4-7 Harmonic thermal parameters for all atoms
Atom U11 U22 U33 U12 U13 U23
O1 0.0070(6) 0.0081(6) 0.0049(6) 0.0038(5) 0 0
O2 0.0041(6) 0.0063(6) 0.0058(6) 0.0005(4) 0 0
O3 0.006086) 0.0046(6) 0.0058(6) 0.0003(5) 0 0
Mo1 0.00356(8) 0.00383(8) 0.00508(9) 0.00025(5) 0 0
Mo2 0.00377(8) 0.00409(7) 0.00516(9) -0.00024(4) 0 0
Mo3 0.00588(10) 0.00652(9) 0.00896(12) -0.00052(6) 0 0
Table 4-8 Final refinement R-values for the incommensurately modulated model containing 59 refined parameters
# Observed Robs # All Rall
Main reflections 820 1.67 895 1.84
1st order 1202 2.52 1562 3.39

61
Table 4-9 The atomic parameters and uncertainties after final refinement of the supercell model.
Atom Occ x y z Uiso
O1_a 1 0.31679(13) 0.23279(13) 0.16836(11) 0.0066(3)
O1_b 0.5 0.31715(17) 0.22710(17) 0.5 0.0068(4)
O2_a 0.5 -0.23358(17) 0.01530(16) 0 0.0058(4)
O2_b 1 -0.24812(14) 0.02761(13) 0.33320(12) 0.0061(3)
O3_a 0.5 -0.44391(16) 0.26973(17) 0 0.0061(4)
O3_b 1 -0.43123(13) 0.25300(14) 0.33381(11) 0.0063(3)
Mo1_a 0.5 0.404526(18) 0.115005(18) 0 0.00394(4)
Mo1_b 1 0.410309(14) 0.109075(15) 0.334609(13) 0.00422(4)
Mo2_a 1 -0.349405(14) 0.133371(14) 0.151482(16) 0.00418(4)
Mo2_b 0.5 -0.349183(19) 0.132358(19) 0.5 0.00496(5)
Mo3 0.7220(9) 0 0 0.788928(16) 0.00734(4)
Table 4-10 Harmonic thermal parameters for all atoms.
Atom U11 U22 U33 U12 U13 U23
O1_a 0.0071(5) 0.0076(5) 0.0051(5) 0.0045(4) 0.0003(3) -0.0002(3)
O1_b 0.0068(6) 0.0083(6) 0.0053(6) 0.0032(5) 0 0
O2_a 0.0053(6) 0.0066(6) 0.0053(6) -0.00013(48) 0 0
O2_b 0.0059(5) 0.0072(5) 0.0052(5) -0.0007(4) 0.00011(32) -0.00021(31)
O3_a 0.0069(7) 0.0060(6) 0.0053(6) -0.0003(5) 0 0
O3_b 0.0069(5) 0.0061(5) 0.0058(5) -0.0004(4) -0.0006(3) 0.00003(32)
Mo1_a 0.00356(8) 0.00374(7) 0.00453(7) 0.00041(5) 0 0
Mo1_b 0.00355(6) 0.00383(6) 0.00527(7) 0.00020(4) -0.00015(3) 0.00024(3)
Mo2_a 0.00345(6) 0.00379(6) 0.00529(6) -0.00025(4) -0.00006(37) 0.00010(4)
Mo2_b 0.00433(8) 0.00455(7) 0.00599(8) -0.00024(5) 0 0
Mo3 0.00616(6) 0.00684(6) 0.00902(7) -0.00054(4) 0 0
Table 4-11 Final refinement R-values for the supercell model containing 81 refined parameters.
# Observed Robs # All Rall
Main reflections 2022 1.55 2457 2.01

62
5. Conclusions
Through this thesis we have seen many examples on how the black box of standard crystallography breaks down. Some of the problems can be handled within 3D and some cannot. This also shows that even when we do get an output, it should always be evaluated critically. Crystallography is still far from being a finished book; some chapters are still in the writing and new ones are just emerging. The observation of satellite reflections has led to the development of general crystallography in arbitrary dimensions, and structure determination of modulated phases and quasicrystals is still developing. An issue only touched briefly in this thesis is the observation of diffuse scattering. Diffuse scattering has been observed in electron microscopy for many decades, but quantification and more importantly refinement of a structural model using the information from the diffuse scattering is still lacking. The development of highly sensitive area detectors has the consequence that we now with x-rays see things that were not visible during the era of point detectors. As a consequence people from a different background than electron microscopy are beginning to observe diffuse scattering more regularly, and it is time to join forces on the issue. To date there is no standard for quantitatively dealing with diffuse scattering at any step of a structure determination. This area of crystallography is now evolving, using a combination of complementary techniques, and the next decade we should expect to see the development of an even more general crystallography.
It is at the frontier that 'standard' no longer applies, and research begins.

63
Acknowledgements
First of all I would like to thank my supervisor Sven Lidin, for introducing me to higher dimensional crystallography and for being the link to a group of very interesting people working in this area.
Many people have contributed either directly or indirectly to the work pre-sented in this thesis. I would like to acknowledge my collaborators who have provided the samples, without which there would be no thesis:
• Professor Holger Kleinke from University of Waterloo, Ontario, Canada, provided the samples for the MexMo4O6 study.
• Professor Bernard Malaman and Dr. Gérard Venturini from Uni-versité Henri Poincaré, Nancy, France, provided the samples and powder diffraction data for the ErGe2-x study, and the study of ScFe6Ge6-ScFe6Ga6 intergrowth structures.
• The CMA network of Excellence, providing the β-Mg2Al3 sam-ple. Especially the members with whom I have had fruitful dis-cussions about not only the β'-Mg2Al3 structure but also the other samples I have studied, and on general aspects of materials re-search.
I would like to thank all of my colleagues at FOOS for providing an inspira-tional workplace. A special thanks to all of you who have asked questions relating to your own samples and projects, this has assisted in building the knowledge behind this thesis.
Finally I would like to thank my wife and daughters for being so supportive and understanding, when my research has led me to travel to meetings or to bring work home. My wife, Kirsten, is especially acknowledged for reading several drafts of the thesis and providing valuable comments on it.

64
References
1 "A Fourier series method for the determination of the components of
interatomic distances in crystals" Patterson, A.L., Phys. Rev. 46 (1934) 372-376
2 "Systematic analysis of the Patterson function" Borisov, S.V., Golovachev, V.P., Ilyukhin, V.V., Kuz'min, É.A., Belov, N.V., J. Struc. Chem. Vol 13/1 (1972) 166-182 (Translated from Strukturnoi Khimii, Vol. 13, No. 1, pp. 175–190, January–February, 1972.)
3 "Structure solution with SHELXD" Schneider, T.R., Sheldrick, G.M., Acta Cryst. D58 (2002) 1772-1779
4 "SHELX for macromolecules" Sheldrick, G.M., http://www.iucr.ac.uk/iucr-top/comm/ccom/School96/pdf/gs2.pdf
5 Several textbooks exist on the subject.
a. "Direct methods in crystallography" Woolfson, M. Monographs on the physics and chemistry of materials. 1961
b. "Direct phasing in crystallography" Giacovazzo, C. IUCr Monographs on Crystallography no. 8
6 "Direct methods - from birth to maturity" Woolfson, M.M., Acta Cryst. A43 (1987) 593-612
7 "The squaring method: a new method for phase determination" Sayre, D., Acta Cryst. 5 (1952) 60-65
8 "A theory of phase determination for the four types of non-centrosymmetric space groups 1P222, 2P22, 3P12, 3P22" Karle, J., Hauptman, H., Acta Cryst. 9 (1956) 635-651

65
9 "Direct phase determination in protein crystallography" Kyriakidis, C.E., Ph.D. Theis (1993). Abstract available at: http://www.science.uva.nl/research/crystallography/thesis/christos.htm
10 "Crambin: a direct solution for a 400-atom structure" Weeks, C.M., Hauptman, H.A., Smith,G.D., Blessing, R.H., Teeter, M.M., Miller, R., Acta Cryst. D51 (1995) 33-38
11 "The application of direct methods and Patterson interpretation to high-resolution native protein data" Sheldrick, G.M., Dauter, Z., Wilson, H.S., Hope, H., Sieker, L.C., Acta
cryst. D49 (1993) 18-23
12 "Holographic analysis of diffraction structure factors" Marchesini, S., Mannella, N., Fadley, C.S., van Hove, M.A., Bucher, J.J., Shuh, D.K., Fabris, L., Press, M.J., West, M.W., Stolte, W.C., Hussain, Z., Phys. Rev. B 66 (2002) 094111
13 "The problem with phase ambiguity in single crystal structure analy-sis" Hai-Fu, F., The Rigaku Journal, Vol.1 no.2 (1984) 15-21
14 "Kristallographische konsequenzen von pseudosymmetrie in kristall-strukturen" Ruck, M., Z. Kristallogr. 215 (2000) 148-156
15 "Direct phasing in crystallography" Giacovazzo, C., IUCr monographs on crystallography no. 8. p. 56-69
16 "Three-dimensional reconstruction of the νννν-AlCrFe phase by electron crystallography" Zou, XD. Mo, Z.M., Hovmöller, S., Li, X.Z., Kou, K.H., Acta Cryst. A59 (2003) 526-539
17 "The crystal structure of l-Al4Mn" Kreiner, G., Franzen, H.F., J. Alloys comp. 261 (1997) 83-104
18 "Solving approximant structures using a strong reflections approach" Christensen, J., Oleynikov, P., Hovmöller, S., Zou, XD., Ferroelectrics 305 (2004) 273-277
19 "Strong reflections in quasicrystal approximants" Christensen, J., Licentiate Thesis 2004 http://www.fos.su.se/documents/publications/Lic_Thesis_Christensen_J.pdf

66
20 "Structure model for the tau(mu) phase in Al-Cr-Si alloys deduced from the lambda phase by the strong-reflections approach" Zhang, H., He, ZB., Oleynikov, P., Zou, XD., Hovmoller, S., Kuo, KH., Acta Cryst. B62 (2006) 16-25
21 "Structure relations in real and reciprocal space of hexagonal phases related to i-ZnMgRE quasicrystals" Zhang, H., Zou, XD., Oleynikov, P., Hovmoller, S., Phil. Mag. 86 (2006) 543-548
22 "Structure determination of the hexagonal quasicrystal approximant mu'-(Al,Si)(4)Cr by the strong reflections approach" He, ZB., Zou, XD., Hovmoller, S., Oleynikov, P., Kuo, KH., Ultramicro-
scopy 107 (2007) 495-500
23 "On the solution of the phase problem in quasiperiodic crystals" Jarić, M.V., Qiu, SY., Acta Cryst. A49 (1993) 576-585
24 "Approximants - the key to the structure of quasicrystals" Steurer, W., Mat. Res. Soc. Symp. Vol 643 (2001) K3.2.1-K3.2.12
25 "Ab initio structure solution by charge flipping" Oszlányi, G., Sütő, A., Acta Cryst. A60 (2004) 134-141
26 "Charge flipping at work: a case of pseudosymmetry" Oszlányi, G., Sütő, A., Czugler, M., Párkányi, L., J. Am. Chem. Soc. 128 (2006) 8392-8393
27 "Ab initio determination of incommensurately modulated structures by charge flipping in superspace" Palatinus, L., Acta Cryst. A60 (2004) 604-610
28 "Structural chemistry of the neptunium-silicon binary system" Boulet, P., Bouexiere, D., Rebizant, J., Wastin, F., J. Alloys comp. 349 (2003) 172-179
29 "Neutron diffraction study of magnetic ordering in the system NdSix (1.67≤≤≤≤x≤≤≤≤2.00)" Schobinger-Papamantellos, P., Buschow, K.H.J., Fischer, P., J. Magn.
Magn. Mat. 97 (1991) 53-68
30 Several texts on superspace crystallography exists, and are highly recom-mended reading for someone who wish to enter the field. The four main references are
a. "Incommensurate crystal structures"
van Smaalen, S. Cryst. Rev vol. 4 (1995) 79-202
b. Z. Kristallogr. Special issue on incommensurate crystallogra-phy.

67
Multiple authors. Z. Kristallogr. 219 (2004) 680-767
c. "Aperiodic crystals: from modulated phases to quasicrystals"
Janssen, T., Chapuis, G., de Boissieu, M.
IUCr Monographs on Crystallography no. 20
d. "Incommensurate crystallography"
van Smaalen, S.
IUCr Monographs on Crystallography no. 21
31 "Modulated structure of CuAu II (one-dimensional modulation)" Yamamoto, A., Acta Cryst. B38 (1982) 146-1451
32 "Structure determination of a mixed-layer bismuth titanate, Bi7Ti4NbO21, by super-high-resolution electron microscopy" Horiuchi, S., Kikuchi, T., Goto, M., Acta Cryst. A33 (1977) 701-703
33 "Electron-microscopy study of crystal structures of mixed oxides in the sys-tem Rb2O-Ta2O5, Rb2O-Nb2O5 and K2O-Ta2O5 with composition rations near 1:3"
"I. Stacking characteristics of MO6 layers" "II. Various intergrowth phases and two-dimensional ordering of pen-tavalent ions"
Yagi, K., Roth, R.S., Acta Cryst. A34 (1978) 765-773, 773-781
34 Three papers on Direct Methods on incommensurate intergrowth structures
a. "Direct methods for incommensurate intergrowth compounds. I. Determination of the modulation" Hai-Fu, F., van Smaalen, S., Lam, E.J.W., Beurskens, P.T., Acta
Cryst. A49 (1993) 704-708
b. "Direct methods for incommensurate intergrowth compounds. II. Determination of the modulation using only main reflec-tions" Bing-Dong, S., Hai-Fu, F., van Smaalen, S., Lam, E.J.W., Beur-skens, P.T., Acta Cryst. A50 (1994) 511-515
c. "Direct methods for incommensurate intergrowth compounds. III. Solving the average structure in multidimensional space" You-De, M., Zheng-Qing, F., Hai-Fu, F., van Smaalen, S., Lam, E.J.W., Beurskens, P.T., Acta Cryst. A52 (1996) 640-644
35 "Chalcogenide misfit layer compounds" Rouxel, J., Meerschaut, A., Wiegers, G., J. Alloys Comp. 229 (1995) 144-157
68
36 "Studies on Ba2Nb5-xTixO9 (0 ≤≤≤≤x≤≤≤≤1.75)" Svenson, G., Eriksson, L., Olofsson, C., Holm, W., J. Alloys Comp. 248 (1997) 33-41
37 " 'Inverted twinning' in intergrowth tungsten bronzes" Kihlborg, L., Sundberg, M., Acta Cryst. B53 (1997) 95-101
38 "Structure refinements of the layered intergrowth phases SbIIISbVxA1-
xTiO6 (x≈≈≈≈0, A = Ta, Nb) using synchrotron x-ray powder diffraction data" Ling, C.D., Thompson, J.G., Schmid, S., Cookson, D.J., Withers, R.L., Acta Cryst. B53 (1997) 861-869
39 "New HfFe6Ge6-ScFe6Ga6 intergrowth structures in ScFe6Ga6-xGax compounds (0.5≤≤≤≤x≤≤≤≤5.5)" Venturini, G., J. Alloys Comp. 322 (2001) 190-197
40 "Neutron diffraction studies of the binary uranium stannides USn2 and U3Sn7" Boulet, P., André, G., Bourée, F., Noël, H., J. Alloys Comp. 329 (2001) 47-49
41 "Structures of Ce2Sn5 and Ce3Sn7, Two superstructures of CeSn3" Boucherle, J.X., Givord, F., Lejard, P., Schweizer, J., Sunault, A., Acta
Cryst. B44 (1988) 377-380
42 "The structure of some metal compounds of uranium" Rundle, R.E., Wilson, A.S., Acta Cryst. 2 (1949) 148-150
43 "The crystal structure of the phase ββββ Mg2Al3" Samson, S., Acta Cryst. 19 (1965) 401-413
44 European Commissions Network of Excellence on Complex metal Alloys (ECNoE-CMA). For more information see http://www.cma-ecnoe.org/
45 Institut fyr Mikrostrukturforschung, Forschungszentrum Jülich GmbH, 52425 Jülich, Germany.
46 The program SUBGROUPGRAPH is available freely from the Bilbao Crystallographic Server http://www.cryst.ehu.es/ together with many other useful crystallography programs.
47 "Sodium tetramolybdenum hexaoxide (NaMo4O6). A metallic infinite-chain polymer derived by condensation of octahedral clusters" Torardi, C.C., McCarley, R.E., J. Am. Chem. Soc. 101 (1979) 3963-3964
48 "La1.16Mo8O16: a Hollandite-related compound with an incommensu-rate modulated structure" Leligny, H., Labbé, Ph., Ledésert, M., Raveau, B., Acta Cryst. B48 (1992) 134-144

69
49 "Synthesis and characterization of a new modification of the quasi-low-dimensional compound Kmo4O6" Ramanujachary, K.V., Greenblatt, M., Jones, E.B., HcCarroll, W.H., J.
Solid state chem. 102 (1993) 69-78.
50 "Synthesis, characterization, and electronic structure of a new molyb-denum bronze SnMo4O6" Jung, D., Lee, B.H., Kim, S.J., Kang, W., Chem. Mater. 13 (2001) 1625-1629
51 "Pb2+ Cation Ordering in Pb3(Mo4O6)4" Wang, S.L., Yeh, J.Y., Acta Cryst. (1991) B47 446-451
52 "Microdiffraction from anti-phase domain boundaries in Cu3Au" Zhu, J., Cowley, J.M., Acta Cryst. A38 (1982) 718-724
53 "The local domain configuration in partially ordered AuCu3" Rahman, S.H., Acta Cryst. A49 (1993) 68-79
54 "Crystal chemistry and magnetism of neodymium stannides including compounds of the structural series REnSn3n-2" Weitzer, F., Hiebl, K., Rogl, P., J. Solid state chem. 98 (1992) 291-300
55 "Constitution and thermodynamics of the antimony-tin system" Predel, B., Schwermann, W., J. Inst. Met. 99 (1971) 169-173
56 "A method for determination of the rhombohedral angle of SbSn" MacKay, C.A., J. Appl. Cryst. 2 (1969) 295-297
57 Hägg, G., Hybinette, A.G., Pil. Mag., Ser.7, vol.20 (1935) 913-929
58 "Old friends in a new light: “SnSb” revisited" Norén, L., Withers, R.L., Schmid, S., Brink, J.F., Ting, V., J. Solid State
Chem., Vol.179, Issue 2 (2006), Pages 404-412
59 "Structural chemistry of the neptunium-silicon binary system" Boulet, P., Bouëxière, D., Rebizant, J., Wastin, F., J. Alloys Comp. 349 (2003) 172-179
60 "Hexagonal Y3Ge5 with a new AlB2 derivative structure" Venturini, G., Ijjaali, I., Malaman, B., J. Alloys Comp. 289 (1999) 116-119
61 "The crystal structure of Yb3Ge5" Smith, G.S., Johnson, Q., Tharp, A.G., Acta Cryst. 18 (1965) 1085-1086
62 "Vacancy ordering in AlB2-type RGe2-x compounds (R = Y, Nd, Sm, Gd - Lu)" Venturini, G., Malaman, B., J. Alloys comp. 284 (1999) 262-269
63 "Single crystal x-ray analysis of YGex compounds (1<x<3)" Ijjaali, I., Venturini, G., Malaman, B., J. Alloys comp. 284 (1999) 237-242

70
64 "On the use of crenel functions for occupancy modulated structures" Petříček, V., van der Lee, A., Evain, M., Acta Cryst. A51 (1995) 529-535
65 "Structure and magnetic ordering in the defect compound ErGe1.83" Oleksyn, O., Schobinger-Papamantellos, P., Ritter, C., de Groot, C.H., Buschow, K.H.J., J. Alloys Comp. 252 (1997) 53-58
66 SHELX97 Sheldrick, G. M. (1997). SHELX97. Programs for Crystal Structure Analy-sis (Release 97-2). University of Göttingen, Germany.sdf
67 "WinGX suite for small-molecule single-crystal crystallography" Farrugia, L. J., J. Appl. Cryst., 32 (1999) 837-838