Embed Size (px)
Citation preview

Mariia S. Evdokimova, Sergey A. Kuzubov
NON-FINANCIAL REPORTING AND
THE COST OF CAPITAL IN BRICS
COUNTRIES
BASIC RESEARCH PROGRAM
WORKING PAPERS
SERIES: FINANCIAL ECONOMICS
WP BRP 83/FE/2021
This Working Paper is an output of a research project implemented at the National Research University Higher School
of Economics (HSE). Any opinions or claims contained in this Working Paper do not necessarily reflect the views of
HSE.

2
Mariia S. Evdokimova1,1 Sergey A. Kuzubov22
NON-FINANCIAL REPORTING AND THE COST OF CAPITAL IN
BRICS COUNTRIES33
This paper considers the impact of non-financial reporting (NFR) on the cost of capital (COC) in the
forms of the cost of equity (COE), the cost of debt (COD), and the weighted average cost of equity
(WACC). It was revealed that companies publishing non-financial reports have a lower COC. COD,
COE, and WACC reduce after NFR. Six industries, where the cost of equity and debt capital is lower
for companies publishing NFR, were determined: consumer discretionary, energy, industrials,
information technology, healthcare, and materials. According to the analysis, companies that issued
non-financial reports have a lower COE capital growth rate.
JEL Classification: G32, M40.
Keywords: non-financial reporting, CSR, cost of capital, BRICS countries.
11National Research University Higher School of Economics. School of Finance. PhD student and
lecturer; E-mail: [email protected], [email protected] 22National Research University Higher School of Economics. School of Finance. Associate
professor; E-mail: [email protected] 33The authors are grateful to Global Reporting Initiative for providing data.

3
1. Introduction Since the end of the last century, non-financial reporting (NFR) has become increasingly
important due to internalization, digitalization, and the increased role of intangibles in company
valuation. NFR covers environmental, social, and governance information [Yeh et al., 2019]. Initially,
companies prepared reports about environmental and social responsibilities, but it was difficult to
compare information, so some organizations created standards for NFR. The most popular are GRI
(Global Reporting Initiative), IIRC (International Integrated Reporting Council), and SASB
(Sustainability Accounting Standards Board). The purpose of voluntarily prepared non-financial
reports is to show how an organization creates value over the short, medium, and long terms, which
coincides with signaling theory [Bae, 2018], and reduces information asymmetry [Hung et al., 2013].
One of the most interesting questions regarding NFR is whether it is value relevant? Many
authors have found positive correlations between NFR prepared according to different standards and
company value, using and developing different approaches [Schadewitz (2010), de Klerk and de
Villier (2012), Iatridis (2013), Dimson at el. (2015), Fatemi et al. (2015), Oshika (2015), De Villiers
et al. (2017), Fuente et al. (2017), Albuquerque (2019)]. The endogeneity problem was raised in most
of these studies: whether the firm’s value has increased after NFR or companies with higher values
issued non-financial reports? The authors used different methods to resolve this issue. Another branch
of studies investigates the quality of information disclosed which can be measured through the
number of points disclosed in the report [Dhaliwal et al., 2011], the presence of NFR assurance
[Cohen and Simnett, 2015], and ratings [Dorfleitner et al. (2015), Gao et al. (2016)]. However, the
current paper considers only the presence of NFR, and this is a limitation of the study.
When a positive relationship between company value and NFR was proven in many papers,
researchers began studying more detailed aspects of NFR. Such topics as earnings quality
improvement [García-Sánchez and Noguera-Gámez, 2017], attractiveness for institutional investors
[Dhaliwal et al., 2011], a reduction in information asymmetry [El Ghoul et al., 2011; Cho et al., 2014]
and risk reduction [Nguyen and Nguyen, 2015] were considered in connection with NFR. But the
dependence of the cost of capital on NFR is still being studied [Suto and Takehara, 2017; Bhuiyan
and Nguyen, 2019; Savi et al., 2020; Yen et al., 2020]. Also, other terms are used instead of NFR,
such as CSR (corporate social responsibility), ESG (environment, society, and governance), or IR
(integrated report), but similar methodologies are used.
Classically company value can be measured as the sum of discounted cash flows [Copeland et
al., 1994]. This research does not consider the cash flow aspect but concentrates on discount factors—
the cost of capital (COC) in the forms of the cost of equity (COE), cost of debt (COD), and the
weighted average cost of capital (WACC). Some authors have revealed a positive relationship
between COC, in different forms, and NFR using different samples: El Ghoul et al. (2011) in the US,

4
Suto and Takehara (2017) in Japan, Bhuiyan and Nguyen (2020) in Australia, Yen et al. (2020) in
China. We consider a multinational sample of developing countries: Brazil, Russia, India, China, and
South Africa (the BRICS countries). Earlier multinational samples were analyzed to test the
relationship between COC and NFR (Dhaliwal, 2012, 2014; García-Sánchez and Noguera-Gámez,
2017). In China and South Africa NFR is mandatory (Ioannou & Serafeim, 2017). The effects of
obligatory NFR are estimated differently. On the one hand, Ackers and Eccles (2015) found that the
mandatory NFR requirements for public companies in South Africa imposed by the King Code on
Corporate Governance (King III, 2009) led to weaknesses of stakeholders’ certainty. Manchiraju and
Rajgopal (2017) investigated the impact of the Indian Companies Act (2013) which obliged large
firms in India to spend at least 2% of net income on CSR and revealed that this led to a reduction in
shares price of 4%. Other authors highlighted that when firms can choose their optimal CSR
expenditures, it maximizes their value. Ioannou and Serafeim (2017) demonstrated the correlation
between a company’s value growth and mandatory NFR which shows a decrease in information
asymmetry.
There are some reasons for a reduction in COC caused by NFR. First, according to agency
theory, it reduces a corporation's environmental risk and the information asymmetry between
shareholders and management, and between the company and potential investors (Jensen and
Meckling, 1976). Second, according to signaling theory, investors cannot accurately predict the future
earnings of a company, but they are interested in those companies which can provide more
information to estimate future earnings. If a company makes high-quality signals about expected
earnings, investors will be ready to provide capital at a lower rate because they estimate its risk as
lower than the industry average (Hahn and Kühnen, 2013). Therefore, the main goal of this study is
to test the significance of NFR for COC.
Using a sample of 1,038 firms from the BRICS countries, 2007–2017, we examine the
relationship between NFR prepared according to GRI, IIRC, SASB, and other standards, and COE,
COD, and WACC. We found a negative relationship between NFR publication and COC, a decrease
in COC after non-financial information (NFI) disclosure and a reduction in the COE growth rate after
NFR. These results are consistent with previous studies and theories and contribute to the literature
in several ways. First, according to our knowledge, this study is the first which analyzed the reaction
of the Russian capital market to NFR using COC, and as an international sample was used the results
may be relevant for other developing countries. Second, COC was considered in 3 forms: COE, COD,
and WACC, when usually only COE and COD are analyzed. Third, a dynamic model was tested and
revealed a decrease in the COE growth rate.
The current study contains 5 parts. Part 1 is an introduction, part 2 contains a literature review
and hypotheses formulation. Part 3 contains the models, which have been modified to test the
5
hypotheses, and a description of the general sample. The results are presented in part 4, the conclusion
and ideas for further research are in part 5.
2. Literature review and hypotheses formulation
Nowadays, NFI is very important to maintain stakeholder’s confidence at all levels, because
the less somebody trusts, the greater the incentive they have to switch to another partner or producer.
Before a detailed literature review let us consider what incentives a company has to report NFI.
Clarkson et al. (2008) suggested two theoretical explanations: economic theory and socio-political
theory. Economic theory suggests that a firm preparing a detailed sustainability report receives a
competitive advantage both in comparison with competitors who prepared poorer reports and by
monitoring additional indicators. Socio-political theory considers information disclosure as a
manipulative mechanism for persuasion that the ‘‘plural user group’’ controls company performance.
Companies with lower environmental and social performance are interested in increasing less relevant
information, to change society's perception of the company. Based on these theories, the authors
concluded that stakeholders consider firms with a low level of NFR negatively because information
omission can be understood as an attempt to hide deviations from optimal behavior. Campbell (2007)
highlighted 8 highly cited propositions about the firm’s motives for NFR. He noticed that companies
are more likely to behave in a socially responsible way if (a) it is in a country with strong and well-
enforced state regulations, (b) there is a system of well-organized and effective industrial self-
regulation, (c) the calls for such behavior are institutionalized, (d) it is a private, independent
organization; (e) it belongs to trade or employer associations promoting socially responsible behavior,
(f) it is engaged in institutionalized dialogue with unions, employees, community groups, investors,
and other stakeholders. A company will prefer to behave opportunistically if its financials are unstable
and there is too much or too little competition. From an empirical point of view, Dhaliwal et al. (2012)
referred to motives for GRI reporting in 31 countries and showed that the effect of NFR is stronger
in countries where CSR performance can affect a firm’s financial performance and in countries with
obscure financial rules.
Frankel et al. (1995) was one of the earlier papers considering the impact of voluntary NFR on
COC. They found that the higher the level of voluntary disclosure, the lower the COC in the future.
Lambert et al. (2007) identified that COE can be affected by reducing the information asymmetry
between the company and its investors. The high quality of accounting information can decrease COC
directly and indirectly. The direct effect is determined by cash flow. The indirect effect influences the
firm’s decision-making process first of all, which has an impact on real business situations. The NFI
can be positive or negative, but, as the authors showed, all additional data affects COC.

6
Dhaliwal et al. (2011) proved that firms disclosing CSR expenditures have a lower COE, and
that CSR performance reduces information asymmetry. They then showed that a decreased COE
attracts new institutional investors which allows company-initiated CSR disclosure to raise more
equity capital. Reverte (2012) also found that CSR disclosure is negatively associated with COE.
Three years later, Dhaliwal et al. (2014) studied the relationships between CSR disclosure and COE,
comparing companies from 31 countries, combining two previous studies. Using the Corporate
Register, they received NFI measurement. According to their results, there is a negative relationship
between NFR and COE.
Dhaliwal’s 2011, 2012, 2014 papers have become the basis for many studies. Zhou et al. (2017)
showed that the higher the alignment with the integrated report’s framework, the lower the COC.
However, Bath et al. (2017) extended their earlier research (Bath et al., 2016) by considering the
NFR quality in the form of the impact of integrated reports on different financial indicators separately.
In the sample of South African companies, they found positive effects of NFR quality on liquidity
and expected future cash flows and no relationship with COC. Mokhova et al. (2018) highlighted
NFR as one of the COE determinants. However, Humphrey et al. (2012) found no relationship
between NFR and COC.
Stellner et al. (2015) studied whether CSR performance is connected with lower credit risk.
They found weak relationships but concluded that CSR practice reduces corporate bond z-spreads if
a company is domiciled in a country with a high ESG rating. Ge and Liu (2015) proved that a higher
CSR score is associated with a lower yield spread. Sustainability, according to our view, is the ability
to meet liabilities, regardless of the conditions in the market. It is especially important, therefore, to
track how sustainable firms overcome crises. Cornett (2016) studied banks’ financial indicators
during the 2008–2009 crisis and their relationship with CSR practice. He found that banks which
invest in sustainable firms (with a high CSR score) were more stable and had lower losses during the
crisis. Bhuiyan and Nguyen (2019) and Yeh et al. (2020) detected negative relationships between
CSR performance quality and COE and COD in Australia and China respectively.
From Dhaliwal et al. 2011, 2012, 2014; Steliner et. al. (2015); Bhuiyan and Nguyen (2019); and
Yeh et al. (2020), we assume that NFR is negatively associated with COE and COD. Consequently,
it should be negatively correlated with WACC (Suto and Takehara, 2017).
H1: COE, COD, and WACC are lower if the company published NFR.
Sletten (2012) confirmed that a fall in the stock price implies an increase in COE and induces
managers to disclose more information. She also confirmed that publicly available information is
biased, because managers prefer to release only good news. She found that a fall in the stock price

7
reflects hidden negative information and demonstrates that the market takes insiders information into
account also, but with a time lag. Hajawiyah et al. (2019) studied Indonesian firms and proved that
firms that issued NFR have a lower COE the year after report publication.
H2: COE, COD, and WACC decrease after NFR publication.
Some previous papers found different effects from CSR practices across industries and
explained the logic behind it. For example, Hong and Kacperczyk (2009), proved that large
institutional investors neglect sin shares involved in gaming and producing alcohol or tobacco, which
have a 19.3% higher leverage ratio than a typical company. The nonparticipation of institutional
investors occurs with a significant negative price effect on the order of 15–20%. Clarkson et al. (2008)
highlighted the importance of NFR in environmentally dangerous industries, we include these in the
list of NFR-sensitive industries which we determine in the current study. Prado-Lorenzo and García-
Sanchez (2010), Hahn and Kühnen (2013), Cho et al. (2014), Sierra-García et al. (2015), and Kuzey
and Uyar (2017) noticed that NFR has a different significance across industries.
H3: COE and COD decreased after NFR only in NFR-sensitive industries.
To justify the fourth hypothesis, we expand the existing empirical results related to nominal
COC (measured in percentage points) to the COC growth rate. Mathematically COC growth can be
calculated as ∆ COC = 𝐶𝑂𝐶𝑡 − COC𝑡−1.
Based on the literature, we suppose there is a negative relationship between COC growth rate
and NFR, consequently, independently from the direction of changes in COC, NFR should also
reduce the COC growth rate.
H4: NFR decreases the COC growth rate.
Now when all hypotheses are explained and formalized, we can move to the models’
descriptions and sample descriptive statistics.

8
3. Methodology
3.1 Model
COC consists of COD and COE. For COE estimation we used the capital asset pricing model
(CAPM) [Fama & French, 1992]:
𝐶𝑂𝐸 = 𝑟𝑓 + β ∗ (𝑟𝑚 − 𝑟𝑓),
where 𝑟𝑓 is the risk-free rate measured as 10-year government bond returns, 𝑟𝑚 is the market
index returns, and β = 𝑐𝑜𝑣(𝐶𝑂𝐸,𝑟𝑚 )
𝑣𝑎𝑟(𝑟𝑚) is a systematic risk measure.
For testing the hypotheses, we created a modified model, based on El Ghoul (2011), Boujelbene
and Affes (2013), and Anderson et al. (2004). The necessity of such variables as size, leverage, and
market to book ratio, were firstly confirmed by Fama and French (1993). Long-term growth (LTG)
is taken from Dhaliwal (2011) and Zhou et al. (2017). Bhuiyan and Nguyen (2019) used 𝛽 as an
explained variable, but we decided to not take it into account as 𝛽 is used for calculating COE.
The equation for the cost of equity (COE) estimation:
𝐶𝑂𝐸𝑖,𝑡 = 𝛽0 + 𝛽1𝑁𝐹𝑅𝑖,𝑡 + 𝛽2𝑆𝑖𝑧𝑒𝑖,𝑡 + 𝛽3𝑀𝐵𝑖,𝑡 + 𝛽4𝐿𝑒𝑣𝑖,𝑡 + 𝛽5𝐿𝑇𝐺𝑖,𝑡 + 𝛽6𝑅𝑂𝐴𝑖,𝑡 +∑ 𝐼𝑛𝑑𝑢𝑠𝑡𝑟𝑦𝑗𝑗−1 + ∑ 𝑌𝑒𝑎𝑟𝑡𝑡−1 + ∑ 𝐶𝑜𝑢𝑛𝑡𝑟𝑦𝑘𝑘−1 + 𝜀𝑖,𝑡.
Based on Chan et al. (2017), the Altman z-score was added to the models for COD. COD was
calculated as the sum of long and short debt rates weighted on debt shares in total debt.
𝐶𝑂𝐷 = 𝐿𝑜𝑛𝑔−𝑡𝑒𝑟𝑚 𝐷𝑒𝑏𝑡
𝑇𝑜𝑡𝑎𝑙 𝐷𝑒𝑏𝑡∗ 𝑟𝑑 𝐿𝑇 +
𝑆ℎ𝑜𝑟𝑡−𝑡𝑒𝑟𝑚 𝐷𝑒𝑏𝑡
𝑇𝑜𝑡𝑎𝑙 𝐷𝑒𝑏𝑡∗ 𝑟𝑑 𝑆𝑇,
where 𝑟𝑑 𝐿𝑇 is the rate for long-term debt, 𝑟𝑑 𝑆𝑇 is the rate for short-term debt.
The equation for calculating COD is:
𝐶𝑂𝐷𝑖,𝑡 = 𝛽0 + 𝛽1𝑁𝐹𝑅𝑖,𝑡 + 𝛽2𝑆𝑖𝑧𝑒𝑖,𝑡 + 𝛽3𝑀𝐵𝑖,𝑡 + 𝛽4𝐿𝑒𝑣𝑖,𝑡 + 𝛽5𝐿𝑇𝐺𝑖,𝑡 + 𝛽6𝑅𝑂𝐴𝑖,𝑡 +
𝛽7𝐴𝑙𝑡𝑚𝑎𝑛_𝑧𝑖 + ∑ 𝐼𝑛𝑑𝑢𝑠𝑡𝑟𝑦𝑗𝑗−1 + ∑ 𝑌𝑒𝑎𝑟𝑡𝑡−1 + ∑ 𝐶𝑜𝑢𝑛𝑡𝑟𝑦𝑘𝑘−1 + 𝜀𝑖,𝑡.
The models were estimated using the panel OLS method for H1–H3 and the dynamic approach
(Arellano-Bond estimation) for H4. The proxy for NFR is changed according to the hypotheses.

9
Table 1. Variables description for Cost of capital models.
Variable Description
𝐶𝑜𝑠𝑡 𝑜𝑓 𝑐𝑎𝑝𝑖𝑡𝑎𝑙𝑖,𝑡
1) COE - Cost of equity estimated by the CAPM;
2) COD - Cost of debt equals the proportion of long and short debt in
total debt multiplied on the debt rates;
3) WACC - Weighted average cost of capital is the weighted
combination of cost of equity and cost of debt;
4) ∆COE - Cost of equity growth rate: 𝐶𝑂𝐸𝑖,𝑡 − 𝐶𝑂𝐸𝑖,𝑡−1
𝑁𝐹𝑅𝑖,𝑡
Proxies for non-financial report:
1) Dummy variable equals 1 if a company has a non-financial report
in the current year and 0 otherwise;
2) Lag of NFR dummy;
3) “After NFR” variable equals 1 for all periods after the moment
when the firm issued the first non-financial report.
𝑆𝑖𝑧𝑒𝑖,𝑡 The natural logarithm of the company’s total assets at the end of each
fiscal year;
𝑀𝐵𝑖,𝑡 The market-to-book ratio at fiscal year-end;
𝐿𝑒𝑣𝑖,𝑡 The ratio of total debt divided by total assets;
𝐿𝑇𝐺𝑖,𝑡 Long term growth rate is the average of the 3 years sales growth;
𝑅𝑂𝐴𝑖,𝑡 Return on assets calculated as net income divided by total assets at the end
of the fiscal year;
𝐴𝑙𝑡𝑚𝑎𝑛 𝑍 𝑠𝑐𝑜𝑟𝑒𝑖
Creditworthiness index calculated as a linear combination of current
liquidity ratio (current assets/current liabilities) and capitalization
coefficient ((long-term liabilities + short-term liabilities)/equity) at the end
of the fiscal year;
𝐼𝑛𝑑𝑢𝑠𝑡𝑟𝑦𝑗 Dummy variables for industries, may be included for 9 industries, the base
value is undefined industry includes multi-industries corporations;
𝐶𝑜𝑢𝑛𝑡𝑟𝑦𝑘
Dummy variables for countries, may be used for 4 countries, the base
value is China because firms from this country take up more than half of
the sample;
𝑌𝑒𝑎𝑟𝑡 Dummy variables for years included if significant.
Source: authors’ analysis

10
3.2 Sample
The sample contained listed companies from Brazil, Russia, India, China, and South Africa
between 2007 and 2017. Financial data was gathered from the Bloomberg database (in USD
according to IFRS), which only included fully disclosed figures for 2009–2016. Information about
the presence of NFR and its type (GRI, IR, or other) was taken from GRI, through a special dataset
available for students. The sample consists of 1,038 firms and 9,516 firm-year observations.
Companies from China make up more than half of the sample. The sample contains observations
from 10 sectors according to Global Industry Classification Standard (GICS) codes: consumer
discretionary, consumer staples, energy, health care, industrials, information technology, materials,
telecommunication services, undefined industry, utilities; and numerous subsectors. The financial
sector was excluded due to the different balance sheet structure.
Table 2. Descriptive statistics.
Variable Obs Mean Std. Dev. Min Max
Cost of equity 9,516 12.07 2.95 0.56 21.99
Cost of equity growth rate 8,224 0.53 2.83 -9.04 12.02
Cost of debt 9,516 4.59 3.28 0 16.98
WACC 9,516 10.29 2.85 0.6586 19.92
Non-financial report 9,516 0.17 0.38 0 1
L. Non-financial report 8,224 0.15 0.36 0 1
After_NFR 9,516 0.19 0.39 0 1
Size 9,516 6.85 1.50 2.25 11.60
ROA 9,516 5.11 7.11 -89.16 65.38
Leverage 9,516 2.73 1.75 1.03 36.29
Long term growth 7,702 8.09 12.19 -57.84 182.99
Market to book ratio 9,516 2.86 1.99 0.05 9.99
Altman Z-score 9,516 4.14 4.26 -5.1 34.83
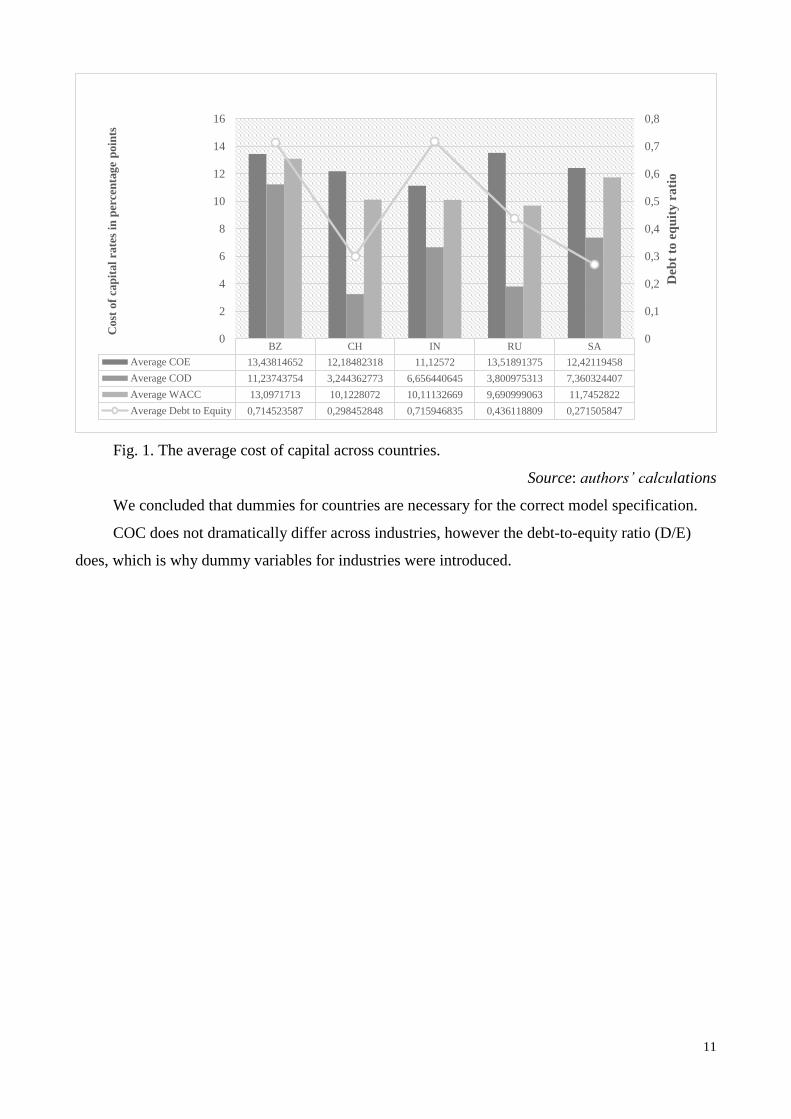
COC differs among the BRICS countries. COE is approximately the same, but the COD differs
dramatically: in China and Russia, it is less than 4%, and in Brazil, it is over 11%. COD is lower than
COE, which is in line with capital structure theory, assuming that debt is a less risky type of capital.
In dependence on the debt share WACC value differs.
11
Fig. 1. The average cost of capital across countries.
Source: authors’ calculations
We concluded that dummies for countries are necessary for the correct model specification.
COC does not dramatically differ across industries, however the debt-to-equity ratio (D/E)
does, which is why dummy variables for industries were introduced.
BZ CH IN RU SA
Average COE 13,43814652 12,18482318 11,12572 13,51891375 12,42119458
Average COD 11,23743754 3,244362773 6,656440645 3,800975313 7,360324407
Average WACC 13,0971713 10,1228072 10,11132669 9,690999063 11,7452822
Average Debt to Equity 0,714523587 0,298452848 0,715946835 0,436118809 0,271505847
0
0,1
0,2
0,3
0,4
0,5
0,6
0,7
0,8
0
2
4
6
8
10
12
14
16
Deb
t to
eq
uit
y r
ati
o
Cost
of
cap
ital
rate
s in
per
cen
tag
e p
oin
ts

12
Fig. 2. The average cost of capital across industries.
Source: authors’ calculations
COE capital differs from year to year, from 8% in 2007 to 15% in 2011 and requires dummy
variables for years. COD is stable among years, WACC duplicates the COE dynamic. The
covariance matrix is in Appendix 1.
Based on this sample, subsamples for models are formed. For the model in the first difference,
observations from 2007 were not taken into account, as they were used for gain/loss calculation
between 2007 and 2008.
4. Results
4.1 Static models
Initially, we estimated 2 panel OLS regressions with fixed and random effects and chose a
model with fixed effects for COE, WACC, and COD to take into account individual firm effects.
Three proxies for NFR were tested: (1) the dummy for NFR equals 1 if the report was issued in the
current year, and 0 otherwise; (2) the first lag of NFR equals 1 if the report was issued in the previous
year, and 0 otherwise; (3) the variable “After NFR” equals 1 for all years after the first NFR
publication, and 0 before publication which allows a comparison of the average values of the
0,490,34
0,50
0,230,42
0,17
0,52
4,33
0,86
0
0,5
1
1,5
2
2,5
3
3,5
4
4,5
5
0
2
4
6
8
10
12
14
Deb
t to
eq
uit
y r
ati
o
Cost
of
cap
ital
rate
s in
per
cen
tag
e p
oin
ts
Average COE Average COD Average WACC Average Debt to Equity

13
explained variables before and after NFR publication.
4.1.1 H1 and H2. Dummies for NFR and a lag of NFR
First, to check H1, that firms published NFR have lower COC, we estimated Model 1. COE,
WACC, and COD were estimated using a fixed-effects model. For COD, information about a
companies’ Altman Z-score was included to take into account bankruptcy probability. The inclusion
of credit ratings in the model for COD makes almost all variables insignificant.
To test H2, about the impact of a lag, the second proxy for NFR, which is the lag of NFR, was
included in Model 2. To determine the nature of the influence and to conclude for long the effect of
NFR lasts, we tested Model 3 including dummies for NFR and its first lag.
COE is measured by the CAPM model. COD is weighted by long- and short-term debt rates.
WACC is a weighted sum of COE and COD. The results confirm H1 and H2: companies publishing
NFI have lower COC; COC reduced a year after NFR publication. The lag impact may be explained
by market inefficiency, investors need time to assimilate information and to change their company
valuation. NFR reduces COC, not due to environmental and social disclosure and not by itself, it is
just a proxy for numerous non-financial aspects, like intellectual capital, brand value, reputation, and,
of course, sustainability. NFR is a signal that a company is sustainable or tries to behave in this way,
and investors react to it because they trust less risky projects and want to generate long-term profit.
Model 3 shows that a reduction in COC increases if company continues NFR. The inclusion of second
and third order lags reveals the insignificance of their impact.
Regarding the interpretation of the results, we found that companies publishing NFR have 0.5
percentage point lower COE and WACC, and 0.4 percentage point lower COD in comparison with
companies which did not disclose NFI. The presence of NFR in previous year decreases COE and
COD by 0.6 percentage points and COD by 0.4 percentage points. The publication of NFR for 2
consecutive years leads to a decrease in COE and WACC by 0.8 percentage points, and in COD by
0.55 percentage points.

14
Table 3. Models 1-3. Impact of financial indicators, a dummy for NFR, and lag of NFR on COC with corrected heteroscedasticity.
Model 1 Model 2 Model 3
VARIABLES COE WACC COD COE WACC COD COE WACC COD
Non-financial report -0.520*** -0.543*** -0.388*** -0.308** -0.351*** -0.235**
Standard error (0.131) (0.126) (0.102) (0.143) (0.129) (0.110)
L.Non-financial report -0.630*** -0.599*** -0.437*** -0.479*** -0.427*** -0.322**
Standard error (0.140) (0.134) (0.119) (0.149) (0.133) (0.126)
Size -0.547*** -0.968*** -0.270*** -0.637*** -1.057*** -0.371*** -0.630*** -1.049*** -0.365***
Standard error (0.105) (0.109) (0.0918) (0.118) (0.124) (0.0994) (0.118) (0.124) (0.0991)
ROA -0.00200 0.0235*** -0.0205*** -0.00259 0.0233*** -0.0194*** -0.00252 0.0234*** -0.0194***
Standard error (0.00587) (0.00671) (0.00616) (0.00627) (0.00738) (0.00637) (0.00627) (0.00739) (0.00636)
Leverage 0.0989*** -0.168** 0.166*** 0.0985*** -0.181* 0.202*** 0.0989*** -0.181* 0.202***
Standard error (0.0288) (0.0775) (0.0380) (0.0333) (0.0986) (0.0392) (0.0334) (0.0989) (0.0392)
Long term growth -0.000928 -0.000164 0.00297* -0.00178 -0.000353 0.00350 -0.00179 -0.000358 0.00350
Standard error (0.00225) (0.00224) (0.00161) (0.00314) (0.00305) (0.00226) (0.00314) (0.00305) (0.00226)
Market to book ratio -0.228*** 0.0601*** -0.0845*** -0.247*** 0.0581** -0.0991*** -0.246*** 0.0585** -0.0988***
Standard error (0.0210) (0.0227) (0.0190) (0.0225) (0.0243) (0.0201) (0.0225) (0.0243) (0.0201)
Altman Z-score No Yes Yes No Yes Yes No Yes Yes
Country effects Yes Yes Yes Yes Yes Yes Yes Yes Yes
Industry effects Yes Yes Yes Yes Yes Yes Yes Yes Yes
Year effects Yes Yes Yes Yes Yes Yes Yes Yes Yes
Constant 14.77*** 15.52*** 5.635*** 15.29*** 16.03*** 6.146*** 15.26*** 15.99*** 6.121***
Standard error (0.678) (0.657) (0.576) (0.758) (0.723) (0.628) (0.756) (0.721) (0.626)
Observations 7,702 7,657 7,657 7,356 7,316 7,316 7,356 7,316 7,316
R-squared 0.398 0.360 0.089 0.400 0.359 0.094 0.400 0.360 0.095
Number of Id 1,038 1,031 1,031 1,026 1,019 1,019 1,026 1,019 1,019
Robust standard errors in parentheses
*** p<0.01, ** p<0.05, * p<0.1
Source: authors’ calculation

15
Company size, measured as the natural logarithm of total assets, has a negative impact on all three
types of COC at 1% significance: the larger the company, the lower the cost of capital. Financial leverage
and ROA have different impacts on COD, COE, and WACC. Leverage, measured as total debt to total
assets, occurs with a positive impact on COE and COD, because the higher the company’s debt, the
riskier it is perceived to be, and new investors require higher compensation. Leverage has a negative
impact on WACC, which can be surprising at first view, however, WACC is a linear combination of
COE, the values of which are higher than COD, and COD. Consequently, despite the risks increasing
with the debt share, it also makes capital cheaper (WACC lower), due to the significant gap between
COE and COD average values (COE>COD). The ROA beta coefficient decreases COC and COD, as
the more profitable the company, the lower the risk and greater the value for shareholders, which allows
investors to decrease requirement rates. However, ROA increases WACC. A possible explanation is that
large and mature companies, whose ROA is higher, prefer equity financing, which is more expensive. A
positive sign for the market-to-book ratio in the equation for WACC also confirms the suggestion about
equity financing preferences.
The second difference is the sign of long-term growth (LTG) between the COE and COD models.
LTG decreases COE because investors agree to get less now if they know that in the future they will get
more. Debt holders, however, would not get a share of future income as almost every debt has a
settlement date. Therefore, the positive sign in the COD model demonstrates that, to support a high LTG
rate, more capital is needed. If a company makes a decision to raise it as debt, the borrower understands
that in the future the company will earn more and will re-distribute its profit intertemporally. The second
possible explanation is that a high LTG rate is normal for young companies, in which flows are unstable
and riskier, which makes borrowers increase their required rates. Also, the absence of credit history is
logically connected with young, fast-growing companies, which may be reflected in the positive sign of
LTG in the COD model.
However, the results require a resolution of the endogeneity problem. Did the company issue a
report and its COC subsequently decreased, or was the COC low and then the decision to make a report
was made? To check that COC decreases after an NFR publication, Model 4 was estimated, using a
variable equal to 1 for all years after the first NFR. COE, WACC, and COD were estimated using fixed-
effects regressions.
Table 4. Model 4: the impact of financial indicators and dummy variable “After NFR” on COC
with corrected heteroscedasticity.
VARIABLES COE WACC COD
After NFR -0.507*** -0.601*** -0.432***
Standard error (0.133) (0.128) (0.112)

16
Size -0.549*** -0.968*** -0.270***
Standard error (0.105) (0.109) (0.0917)
ROA -0.00233 0.0231*** -0.0208***
Standard error (0.00586) (0.00671) (0.00616)
Leverage 0.0994*** -0.167** 0.166***
Standard error (0.0289) (0.0774) (0.0379)
Long term growth -0.00101 -0.000268 0.00289*
Standard error (0.00225) (0.00223) (0.00159)
Market to book ratio -0.229*** 0.0597*** -0.0849***
Standard error (0.0209) (0.0227) (0.0190)
Altman Z-score No Yes Yes
Country effects Yes No Yes
Industry effects Yes No Yes
Year effects Yes Yes Yes
Constant 14.79*** 15.54*** 5.646***
Standard error (0.682) (0.659) (0.576)
Observations 7,702 7,657 7,657
R-squared 0.398 0.360 0.089
Number of Id 1,038 1,031 1,031
Robust standard errors in parentheses
*** p<0.01, ** p<0.05, * p<0.1
Source: authors’ calculation
These results are a type of double-check of the previous models. They show that, on average, the
COC falls after NFR. These results again confirm H2 and resolve the endogeneity problem. They show
that for all periods after NFR publication COE falls by 0.5 percentage points, WACC by 0.6 percentage
points and COD by 0.4 percentage points.
4.1.2 H3. Industry analysis
To check H3, regressions were tested separately for 9 different industries: Consumer
Discretionary, Consumer Staples, Energy, Health Care, Industrials, Materials, Information Technology,
Telecommunication Services, and Utilities. This was done to identify industries for which NFI disclosure
is important. We ran 54 regressions for COE and COD as explained variables, for 9 sectors and 3 proxies
for NFI disclosure: the presence of NFR (0/1), lag of NFR presence (0/1), and variable “After non-
financial report” (0/1). All regressions are significant but differ in results. They are especially poor for
Telecommunication Services. We do not analyze WACC because regression for WACC is weakly robust
(see 4.3). We can conclude that COE decreases in reaction to NFR in Consumer Discretionary, Energy,
Health Care, Industrials, Materials, and Information Technology industries. COD decreases in Health
Care, Industrials and Materials. This is logical because the latter industries are connected with threats to
the environment or health. Companies from Industrials, Energy and Materials are factories, extractive
companies, and power stations that can damage the environment incurring fines. Health Care and
Consumer Discretionary also may be potentially dangerous not for the environment, but for human
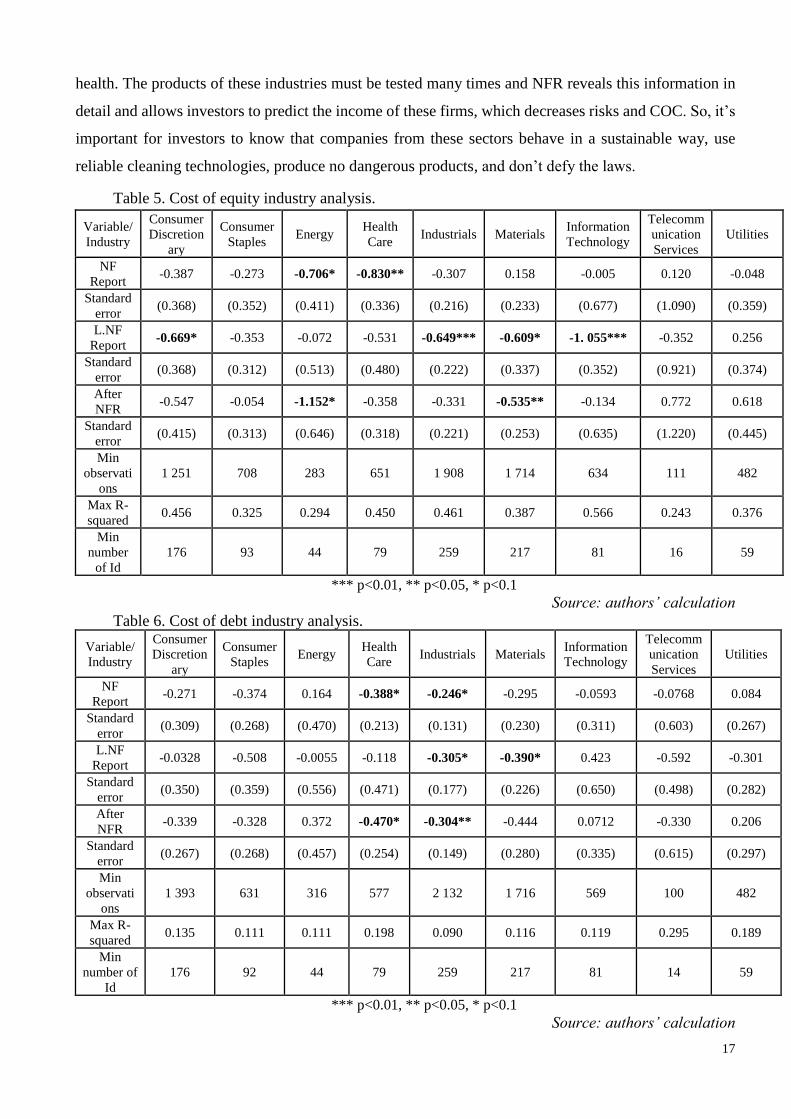
17
health. The products of these industries must be tested many times and NFR reveals this information in
detail and allows investors to predict the income of these firms, which decreases risks and COC. So, it’s
important for investors to know that companies from these sectors behave in a sustainable way, use
reliable cleaning technologies, produce no dangerous products, and don’t defy the laws.
Table 5. Cost of equity industry analysis.
Variable/
Industry
Consumer
Discretion
ary
Consumer
Staples Energy
Health
Care Industrials Materials
Information
Technology
Telecomm
unication
Services
Utilities
NF
Report -0.387 -0.273 -0.706* -0.830** -0.307 0.158 -0.005 0.120 -0.048
Standard
error (0.368) (0.352) (0.411) (0.336) (0.216) (0.233) (0.677) (1.090) (0.359)
L.NF
Report -0.669* -0.353 -0.072 -0.531 -0.649*** -0.609* -1. 055*** -0.352 0.256
Standard
error (0.368) (0.312) (0.513) (0.480) (0.222) (0.337) (0.352) (0.921) (0.374)
After
NFR -0.547 -0.054 -1.152* -0.358 -0.331 -0.535** -0.134 0.772 0.618
Standard
error (0.415) (0.313) (0.646) (0.318) (0.221) (0.253) (0.635) (1.220) (0.445)
Min
observati
ons
1 251 708 283 651 1 908 1 714 634 111 482
Max R-
squared 0.456 0.325 0.294 0.450 0.461 0.387 0.566 0.243 0.376
Min
number
of Id
176 93 44 79 259 217 81 16 59
*** p<0.01, ** p<0.05, * p<0.1
Source: authors’ calculation
Table 6. Cost of debt industry analysis.
Variable/
Industry
Consumer
Discretion
ary
Consumer
Staples Energy
Health
Care Industrials Materials
Information
Technology
Telecomm
unication
Services
Utilities
NF
Report -0.271 -0.374 0.164 -0.388* -0.246* -0.295 -0.0593 -0.0768 0.084
Standard
error (0.309) (0.268) (0.470) (0.213) (0.131) (0.230) (0.311) (0.603) (0.267)
L.NF
Report -0.0328 -0.508 -0.0055 -0.118 -0.305* -0.390* 0.423 -0.592 -0.301
Standard
error (0.350) (0.359) (0.556) (0.471) (0.177) (0.226) (0.650) (0.498) (0.282)
After
NFR -0.339 -0.328 0.372 -0.470* -0.304** -0.444 0.0712 -0.330 0.206
Standard
error (0.267) (0.268) (0.457) (0.254) (0.149) (0.280) (0.335) (0.615) (0.297)
Min
observati
ons
1 393 631 316 577 2 132 1 716 569 100 482
Max R-
squared 0.135 0.111 0.111 0.198 0.090 0.116 0.119 0.295 0.189
Min
number of
Id
176 92 44 79 259 217 81 14 59
*** p<0.01, ** p<0.05, * p<0.1
Source: authors’ calculation

18
In some regressions, a positive insignificant correlation between COC and NFR was found. To
explain it, we note that we do not control for the content of NFR, we assumed that companies issue them
as a signal that they behave in a sustainable way, and better than competitors, because they can generate
cash flow for longer periods, however, this assumption may be incorrect.
4.2 Dynamic models
Initially, we planned to test models in the first differences for 3 types of capital: COE, WACC,
and COD. Unfortunately, we received the correctly estimated equation only for the COE growth rate
dynamic. The estimations of COD and WACC models in differences are the field for future studies.
Before the dynamic model estimation, we checked that the difference between companies which
published NFR and those who did not is significant. We did a t-test on the mean (with different variances)
comparing the COE growth rate of companies which issued NFR at least once and companies which
never have.
Table 7. T-test on means for COE growth rate of companies with and without NFR.
COE with NFR COE without NFR
Mean 0,431 0,617
Variance 9,29 15,77
Observations 4 299 8 662
Hypothetical difference in means 0 Df 10 789 t-statistic -2,949 P(T<=t) one-sided 0,0016 t critical one-sided 1,645 P(T<=t) two-sided 0,0032 t critical two-sided 1,96
Source: authors’ calculation
The test showed that the calculated t-statistic (-2.949) is lower in modulus than both one-side
(1.645) and two-side (1.96) t-critical. It means that H0 about the similarity of samples is rejected.
The model was estimated in the first difference by a one-step dynamic panel data regression, using
the Arellano-Bond generalized method of moments. The complexity of the dynamic panel data
estimation is necessity to pass some tests for autocorrelation, Sargan or Hansen specification tests, and
two tests for the validity of independent and partially correlated (with the model residuals) instruments.
It shows the presence of a first-order autocorrelation, which is unavoidable white noise, which exists
during the lag of the explained variable in the model. As independent instrument variables, a risk-free
rate was measured as 10-year government bond returns or years to maturity, because both these variables
are not dependent on the company’s COE, but impact on it. As GMM instruments, all lags of leverage,
beta, and total assets were used, because these factors not only explain COE, but also pre-determine its

19
value in previous periods. There is no second-order autocorrelation in models, GMM and IV instruments
are valid at a 5% level of significance, and, according to the Hansen test, the instruments are valid, but
less significant with the use of too many of them (weakened instruments).
Table 8. The dynamic model, in the first differences, is estimated using the Arellano-Bond
approach with corrected heteroskedasticity.
VARIABLES ∆ Cost of equity
Co_with_NFR -0.871*
Standard error (0.492)
L.NF_Report -3.490***
Standard error (1.164)
After_NFR -2.100***
Standard error (0.254)
∆ Size -2.155** -0.945***
Standard error (0.950) (0.176)
∆ Market to book ratio -0.396*** -0.235*** -0.286***
Standard error (0.0459) (0.0579) (0.0408)
∆ Leverage 0.0999 0.127**
Standard error (0.0654) (0.0624)
∆ ROA -0.0910*** -0.0642* -0.168***
Standard error (0.0284) (0.0380) (0.0283)
∆ Long term growth 0.0327** -0.0500*
Standard error (0.0156) (0.0284)
Country effects Yes No No
Year effects Yes Yes Yes
Industry effects No No No
Constant 2.554*** 2.892*** 2.205***
Standard error (0.199) (0.369) (0.0705)
Observations 7,356 7,356 8,224
Number of Id 1,026 1,026 1,028
Robust standard errors in parentheses
*** p<0.01, ** p<0.05, * p<0.1
Source: authors’ calculation
Dynamic panel analysis allows us to bypass robustness checks because, if the models satisfy the
moment condition, then they are robust, as is the case with our regressions. The results confirmed H4,
that NFR publication decreases COC in the form of the COE growth rate. The COE growth rate of
companies which prepared NFR decreases by 0.87 percentage points, during the second year after the
NFR publication COE growth rate decreases by 3.5 percentage points and for all periods after the first
NFR issuing COE growth rate decreases by 2.1 percentage points.

20
4.3 Robustness check
The robustness check was done in 3 ways: including other variables in the model, discarding
significant variables, and cutting the sample by 1–5%. This was only done for the main static models 1–
3 (see Appendix 2). After the analysis, we can conclude that the COE 2 and WACC 3 models are not
robust, and that COD and WACC 2 models are weakly robust. Other models are robust.
5. Conclusion and further discussion
This paper considers the impact of non-financial reporting (NFR) on the cost of capital (COC), in
the forms of cost of equity (COE), cost of debt (COD), and the weighted average cost of capital (WACC).
Following the literature, four hypotheses were generated and tested in different specifications of the
modified model, based on the sample for 2007–2016, containing 1,038 companies from the BRICS
countries.
We confirmed the COC reduction for firms issuing NFR, both in robust static models for COE,
COD, and WACC, and in the dynamic model for COE. The impact of NFR with a one-year on the COC
is only partially confirmed: it was confirmed in a dynamic model for COE, and in static models for COE,
COD, and WACC. However, it is not robust for COE and weakly robust for WACC and COD in the
static models. Interestingly, the reduction in COE and WACC is higher than in COD after NFR.
However, the possible explanation may be that COE and WACC is higher than COD. Regarding industry
analysis, NFR-sensitive industries were revealed: consumer discretionary, energy, industrials,
information technology, materials, and health care. The fourth hypothesis on the reduction of the COE
growth rate after NFR was confirmed.
The results are in line with Zhou et al. (2017), Suto and Takehara (2017), Bhuiyan and Nguyen
(2019), and Yeh et al. (2020), but new regarding some points: (1) the testing of the lag effects of NFI
disclosure in static models which partially resolved the endogeneity problem; (2) analyzing not only
COE and COD, but also the relationship between WACC and NFR; (3) the study of the dependence of
the COE growth rate on NFR, using the dynamic panel model (Arellano-Bond GMM). This paper
provides empirical proof of the relevance of NFR to company value, which might be of interest to
company management and investors.
There are some limitations of the study: measuring only the presence of NFR, not the quality of
information disclosed and not considering cash flow, which is an important determinant of firm value.
Numerous influencing factors make it more difficult to provide reasoning for changes in cash flow
caused by NFR and to test it. On the one hand, we can imagine an increase in sales of “green” brands,
but it is most widespread for the B2C (business to customer) transactions. B2B (business to business)
differs dramatically, and it is hard to assume that, for example, an airline is ready to pay more for an
aircraft because the steel used in its assembly was produced with minimal environmental pollution. It

21
also seems unrealistic to suggest that employees would accept a lower salary to work in a “green”
company, or suppliers selling goods/services to such companies at lower prices. The effect, which would
be interesting to test, according to our view, analyzing cash flow is sustainability which may be
observable in crises such as the COVID-19 pandemic. The study also left many other fields for further
investigation: (1) our post-estimation tests failed for dynamic models of COD and WACC; another
specification might resolve this problem; (2) industry analysis sometimes gives very poor results, as in
the case of Telecommunication services, so a separate investigation, including key industry factors, may
be fruitful; (3) the quality of NFR is likely to have a significant impact on company value. There are 2
biases in our study: the first one relates to the sample which contains only companies from emerging
countries, and it would be interesting to compare the results with COC changes in developed countries;
the second one is connected with NFR in general: the problem is that companies have no incentives to
disclose negative information. Even controlling for the quality of information disclosed would not
resolve the problem caused by the difference between reported and actual company behavior.
Unfortunately, even today we hear about cases of environmental pollution that are not reflected in NFR.
The future of NFI investigation, according to our opinion, depends on the development of ESG indexes
based not on information disclosed but on the actions of a company which are often unobservable or
intentionally hidden.
References 1. Ackers, B., & Eccles, N. S. (2015). Mandatory corporate social responsibility assurance
practices. Accounting, Auditing & Accountability Journal.
2. Albuquerque, R., Koskinen, Y., & Zhang, C. (2019). Corporate social responsibility and
firm risk: Theory and empirical evidence. Management Science, 65(10), 4451-4469.
3. Anderson, R. C., Mansi, S. A., & Reeb, D. M. (2004). Board characteristics, accounting
report integrity, and the cost of debt. Journal of accounting and economics, 37(3), 315-
342.
4. Bae, S. M., Masud, M., Kaium, A., & Kim, J. D. (2018). A cross-country investigation of
corporate governance and corporate sustainability disclosure: A signaling theory
perspective. Sustainability, 10(8), 2611.
5. Barth, M. E., Cahan, S. F., Chen, L., & Venter, E. R. (2016). The economic consequences
associated with integrated report quality: early evidence from a mandatory
setting. University of Pretoria, unpublished working paper, 1-45.
6. Barth, M. E., Cahan, S. F., Chen, L., & Venter, E. R. (2017). The economic consequences
associated with integrated report quality: Capital market and real effects. Accounting,
Organizations and Society, 62, 43-64.
22
7. Bhuiyan, M. B. U., & Nguyen, T. H. N. (2019). Impact of CSR on cost of debt and cost of
capital: Australian evidence. Social Responsibility Journal.
8. Boujelbene, M. A., & Affes, H. (2013). The impact of intellectual capital disclosure on
cost of equity capital: A case of French firms. Journal of Economics Finance and
Administrative Science, 18(34), 45-53.
9. Camilleri, M. A. (2018). Theoretical insights on integrated reporting. Corporate
Communications: An International Journal.
10. Campbell, J. L. (2007). Why would corporations behave in socially responsible ways? An
institutional theory of corporate social responsibility. Academy of management
Review, 32(3), 946-967.
11. Chan, C. Y., Chou, D. W., & Lo, H. C. (2017). Do financial constraints matter when firms
engage in CSR?. The North American Journal of Economics and Finance, 39, 241-259.
12. Cho, C. H., Michelon, G., Patten, D. M., & Roberts, R. W. (2014). CSR report assurance
in the USA: An empirical investigation of determinants and effects. Sustainability
Accounting, Management and Policy Journal.
13. Clarkson, P. M., Li, Y., Richardson, G. D., & Vasvari, F. P. (2008). Revisiting the relation
between environmental performance and environmental disclosure: An empirical analysis.
Accounting, organizations and society, 33(4), 303-327.
14. Cohen, J. R., & Simnett, R. (2015). CSR and assurance services: A research
agenda. Auditing: A Journal of Practice & Theory, 34(1), 59-74.
15. Copeland Thomas, E., Koller, T., & Murrin, J. (1994). Valuation: measuring and managing
the value of companies. Wiley frontiers in finance.
16. Cornett, M. M., Erhemjamts, O., & Tehranian, H. (2016). Greed or good deeds: An
examination of the relation between corporate social responsibility and the financial
performance of US commercial banks around the financial crisis. Journal of Banking &
Finance, 70, 137-159.
17. de Klerk, M., & de Villiers, C. (2012). The value relevance of corporate responsibility
reporting: South African evidence. Meditari Accountancy Research,20(1), 21-38.
18. De Villiers, C., Venter, E. R., & Hsiao, P. C. K. (2017). Integrated reporting: background,
measurement issues, approaches and an agenda for future research. Accounting &
Finance, 57(4), 937-959.
19. Dorfleitner, G., Halbritter, G., & Nguyen, M. (2015). Measuring the level and risk of
corporate responsibility–An empirical comparison of different ESG rating
approaches. Journal of Asset Management, 16(7), 450-466.

23
20. Dhaliwal, D. S., Li, O. Z., Tsang, A., & Yang, Y. G. (2011). Voluntary nonfinancial
disclosure and the cost of equity capital: The initiation of corporate social responsibility
reporting. The accounting review, 86(1), 59-100.
21. Dhaliwal, D. S., Radhakrishnan, S., Tsang, A., & Yang, Y. G. (2012). Nonfinancial
disclosure and analyst forecast accuracy: International evidence on corporate social
responsibility disclosure. The Accounting Review, 87(3), 723-759.
22. Dhaliwal, D., Li, O. Z., Tsang, A., & Yang, Y. G. (2014). Corporate social responsibility
disclosure and the cost of equity capital: The roles of stakeholder orientation and financial
transparency. Journal of Accounting and Public Policy, 33(4), 328-355.
23. Dimson, E., Karakaş, O., & Li, X. (2015). Active ownership. The Review of Financial
Studies, 28(12), 3225-3268.
24. Eccles, R. G., Serafeim, G., & Krzus, M. P. (2011). Market interest in nonfinancial
information. Journal of Applied Corporate Finance, 23(4), 113-127.
25. El Ghoul, S., Guedhami, O., Kwok, C. C., & Mishra, D. R. (2011). Does corporate social
responsibility affect the cost of capital?. Journal of Banking & Finance, 35(9), 2388-2406.
26. Fama, E. F., & French, K. R. (1992). The cross‐section of expected stock returns. the
Journal of Finance, 47(2), 427-465.
27. Fama, E. F., & French, K. R. (1993). Common risk factors in the returns on stocks and
bonds. Journal of financial economics, 33(1), 3-56.
28. Fatemi, A., Fooladi, I., & Tehranian, H. (2015). Valuation effects of corporate social
responsibility. Journal of Banking & Finance, 59, 182-192.
29. Frankel, R., McNichols, M., & Wilson, G. P. (1995). Discretionary disclosure and external
financing. Accounting Review, 135-150.
30. Fuente, J. A., García-Sánchez, I. M., & Lozano, M. B. (2017). The role of the board of
directors in the adoption of GRI guidelines for the disclosure of CSR information. Journal
of Cleaner Production, 141, 737-750.
31. Fuhrmann, S., Ott, C., Looks, E., & Guenther, T. W. (2017). The contents of assurance
statements for sustainability reports and information asymmetry. Accounting and Business
Research, 47(4), 369-400.
32. Jensen, M. C., & Meckling, W. H. (1976). Theory of the firm: Managerial behavior, agency
costs and ownership structure. Journal of financial economics, 3(4), 305-360.
33. Gao, F., Dong, Y., Ni, C., & Fu, R. (2016). Determinants and economic consequences of
non-financial disclosure quality. European Accounting Review, 25(2), 287-317.
34. García-Sánchez, I. M., & Noguera-Gámez, L. (2017). Integrated information and the cost
of capital. International Business Review, 26(5), 959-975.

24
35. Ge, W., & Liu, M. (2015). Corporate social responsibility and the cost of corporate bonds.
Journal of Accounting and Public Policy, 34(6), 597-624
36. GRI. (2013). Sustainability Reporting Guidelines Version 4.0: Reporting Principles and
Standard Disclosures. Amsterdam: Global Reporting Initiative
37. Hahn, R., & Kühnen, M. (2013). Determinants of sustainability reporting: a review of
results, trends, theory, and opportunities in an expanding field of research. Journal of
cleaner production, 59, 5-21.
38. Hajawiyah, A., Adhariani, D., & Djakman, C. (2019). The sequential effect of CSR and
COE: family ownership moderation. Social Responsibility Journal.
39. Hong, H., & Kacperczyk, M. (2009). The price of sin: The effects of social norms on
markets. Journal of financial economics, 93(1), 15-36.
40. Humphrey, J. E., Lee, D. D., & Shen, Y. (2012). Does it cost to be sustainable?. Journal
of Corporate Finance, 18(3), 626-639.
41. Hung, M., Shi, J., & Wang, Y. (2013, September). The effect of mandatory CSR disclosure
on information asymmetry: Evidence from a quasi-natural experiment in China. In Asian
finance association (AsFA) 2013 conference.
42. Iatridis, G. E. (2013). Environmental disclosure quality: Evidence on environmental
performance, corporate governance and value relevance. Emerging Markets Review, 14,
55-75.
43. Ioannou, I., & Serafeim, G. (2017). The consequences of mandatory corporate
sustainability reporting. Harvard Business School research working paper, (11-100).
44. Kuzey, C., & Uyar, A. (2017). Determinants of sustainability reporting and its impact on
firm value: Evidence from the emerging market of Turkey. Journal of Cleaner Production,
143, 27-39.
45. Lambert, R., Leuz, C., & Verrecchia, R. E. (2007). Accounting information, disclosure,
and the cost of capital. Journal of accounting research, 45(2), 385-420.
46. Manchiraju, H., & Rajgopal, S. (2017). Does corporate social responsibility (CSR) create
shareholder value? Evidence from the Indian Companies Act 2013. Journal of Accounting
Research, 55(5), 1257-1300.
47. Milne, M. J., & Gray, R. (2013). W (h) ither ecology? The triple bottom line, the global
reporting initiative, and corporate sustainability reporting. Journal of business ethics,
118(1), 13-29.
48. Mokhova, N., Zinecker, M., & Meluzín, T. (2018). Internal factors influencing the cost of
equity capital.

25
49. Nguyen, P., & Nguyen, A. (2015). The effect of corporate social responsibility on firm
risk. Social Responsibility Journal.
50. Oshika, T., & Saka, C. (2015). Created Value as Sustainability KPIs for Integrated
Reporting. Available at SSRN 2547339.
51. Prado-Lorenzo, J. M., & Garcia-Sanchez, I. M. (2010). The role of the board of directors
in disseminating relevant information on greenhouse gases. Journal of business ethics,
97(3), 391-424.
52. Reverte, C. (2012). The impact of better corporate social responsibility disclosure on the
cost of equity capital. Corporate Social Responsibility and Environmental Management,
19(5), 253-272.
53. Schadewitz, H., & Niskala, M. (2010). Communication via responsibility reporting and its
effect on firm value in Finland. Corporate Social Responsibility and Environmental
Management, 17(2), 96-106.
54. Sierra‐García, L., Zorio‐Grima, A., & García‐Benau, M. A. (2015). Stakeholder
engagement, corporate social responsibility and integrated reporting: An exploratory
study. Corporate Social Responsibility and Environmental Management, 22(5), 286-304.
55. Sletten, E. (2012). The effect of stock price on discretionary disclosure. Review of
accounting studies, 17(1), 96-133.
56. Stellner, C., Klein, C., & Zwergel, B. (2015). Corporate social responsibility and Eurozone
corporate bonds: The moderating role of country sustainability. Journal of Banking &
Finance, 59, 538-549.
57. Suto, M., & Takehara, H. (2017). CSR and cost of capital: evidence from Japan. Social
Responsibility Journal.
58. Yeh, C. C., Lin, F., Wang, T. S., & Wu, C. M. (2020). Does corporate social responsibility
affect cost of capital in China?. Asia Pacific Management Review, 25(1), 1-12.
59. Zhou, S., Simnett, R., & Green, W. (2017). Does integrated reporting matter to the capital
market?. Abacus, 53(1), 94-132

26
Appendixes Appendix 1. Correlation matrix
Cost of
equity
Cost of
equity
growth
rate
Cost of
debt WACC
Non-
financial
report
L1.
Non-
financial
report
After
NFR Size ROA Leverage
Long
term
growth
Market
to book
ratio
Altman
Z-score
Cost of equity 1.00
Cost of equity
growth rate 0.36*** 1.00
Cost of debt -0.04* 0.08*** 1.00***
WACC 0.62*** 0.31*** 0.24*** 1.00
Non-financial
report -0.03*** 0.06*** 0.21*** -0.01*** 1.00
L1. Non-
financial report -0.03*** 0.08*** 0.23*** 0.01 0.86*** 1.00
After_NFR -0.02*** 0.07*** 0.22*** -0.01*** 0.93*** 0.86*** 1.00
Size 0.04*** 0.04*** 0.03*** -0.28*** 0.43*** 0.43*** 0.46*** 1.00
ROA -0.15*** -0.02*** 0.04*** 0.14*** 0.09*** 0.08*** 0.08*** -0.03** 1.00
Leverage 0.06*** 0.01* 0.09*** -0.32*** 0.05*** 0.05*** 0.04*** 0.29*** -0.28*** 1.00
Long term
growth -0.09*** -0.05*** 0.13*** 0.01 0.03** 0.02*** 0.02*** 0.08*** 0.32*** -0.01** 1.00
Market to book
ratio -0.03*** 0.068 -0.02*** 0.22*** -0.05*** -0.05*** -0.07*** -0.25*** 0.24*** -0.043 0.12*** 1.00
Altman Z-
score -0.10*** -0.01 -0.13*** 0.21*** -0.11*** -0.10*** -0.13*** -0.37*** 0.33*** -0.34*** 0.05 0.37*** 1.00

27
Appendix 2. Robustness check.
Proxy for
COC
Proxy for
NFR
Regression Testing method Variable/Percentage Result
COE NFR Model 1 Excluding ROA Robust
COE NFR Model 1 Including SALES GROWTH Robust
COE NFR Model 1 Compression top 1% Robust
WACC NFR Model 1 Excluding MARKET_TO_BV Robust
WACC NFR Model 1 Including SALES GROWTH Robust
WACC NFR Model 1 Compression top 5% Robust
COD NFR Model 1 Including SALES Robust
COD NFR Model 1 Excluding MARKET_TO_BV Robust
COD NFR Model 1 Compression top 5% Robust
COE L.NFR Model 2 Excluding LTG Weak Robust
COE L.NFR Model 2 Excluding Industry effects Robust
COE L.NFR Model 2 Including PPE Not Robust
WACC L.NFR Model 2 Including Rf_rate Weak Robust
WACC L.NFR Model 2 Excluding SALES GROWTH Robust
WACC L.NFR Model 2 Compression bottom 1% Robust
COD L.NFR Model 2 Excluding LN_TOT_ASSET Robust
COD L.NFR Model 2 Including SALES GROWTH Robust
COD L.NFR Model 2 Including TOBIN_Q Weak Robust, but
correlated
COE After_NFR Model 3 Excluding LTG Robust
COE After_NFR Model 3 Including SALES GROWTH Robust
COE After_NFR Model 3 Compression top 5% Robust
WACC After_NFR Model 3 Excluding SALES GROWTH Not Robust
WACC After_NFR Model 3 Including TOBIN_Q Robust
WACC After_NFR Model 3 Excluding FNCL_LVRG Robust
COD After_NFR Model 3 Excluding MARKET_TO_BV Robust
COD After_NFR Model 3 Including BS_LT_BORROW Robust
COD After_NFR Model 3 Compression bottom 5% Robust

28
Authors:
1. Evdokimova Mariia, National Research University Higher School of Economics (Moscow,
Russia). School of finance; PhD student and lecturer;
Student mail: [email protected]
Personal mail: [email protected]
2. Kuzubov Sergey, National Research University Higher School of Economics (Moscow,
Russia). School of finance; PhD in Accounting and Statistics; associate professor.
Email: [email protected]
Any opinions or claims contained in this Working Paper do not necessarily reflect the
views of HSE.
© Evdokimova, Kuzubov, 2021