Embed Size (px)
Citation preview
Capital Structureand Cost of Capital
CIMA
Shahin A. Shayan2004 - 2007
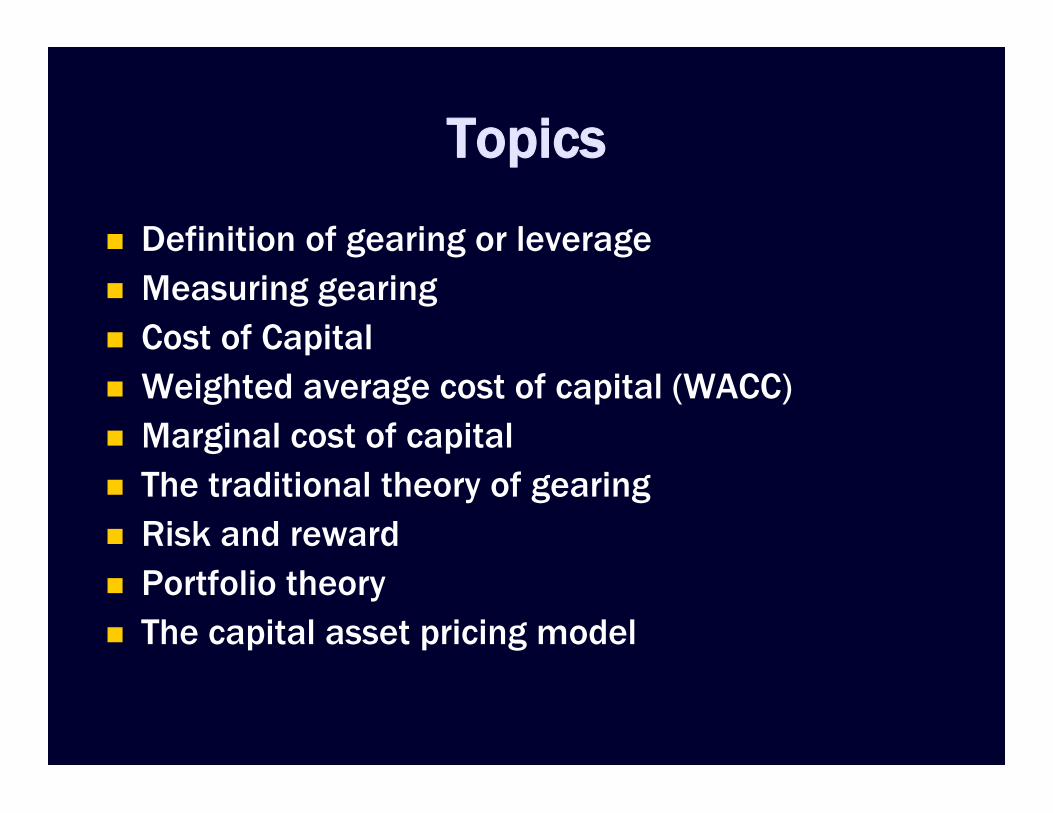
Topics
Definition of gearing or leverage Measuring gearing Cost of Capital Weighted average cost of capital (WACC) Marginal cost of capital The traditional theory of gearing Risk and reward Portfolio theory The capital asset pricing model
Definition of gearing or leverage
Financial gearing (called leverage in the US)is defined as follows:
“The use of debt finance to increase the return onequity by deploying borrowed funds in such a waythat the return generated is greater than the cost ofservicing the debt”.
Measuring gearing
Capital gearing Capital gearing is concerned with the level of debt in
a company’s capital structure and concentrates onthe following groups of capital: Equity (E) This is the portion of the company which is
financed by the ordinary shareholders; Prior charge capital (PCC) This is the capital which has to
be serviced prior to the equity capital receiving any return.Prior charge capital will be represented by preferenceshare capital plus all long-term liabilities.
Measuring gearing Wherever possible, market values should be used in preference to book
values for the capital gearing ratio. When using market values, care mustbe taken when calculating the market value of equity.
When equity is valued using book values it must include any reserves andretained profits which are attributable to the ordinary shareholders.
i.e. the book value of equity = ordinary share capital + reserves.
When market values are used, reserves must be excluded since they areconsidered to be already incorporated into the market price of the shares.
i.e. the market value of equity = number of shares x share price.
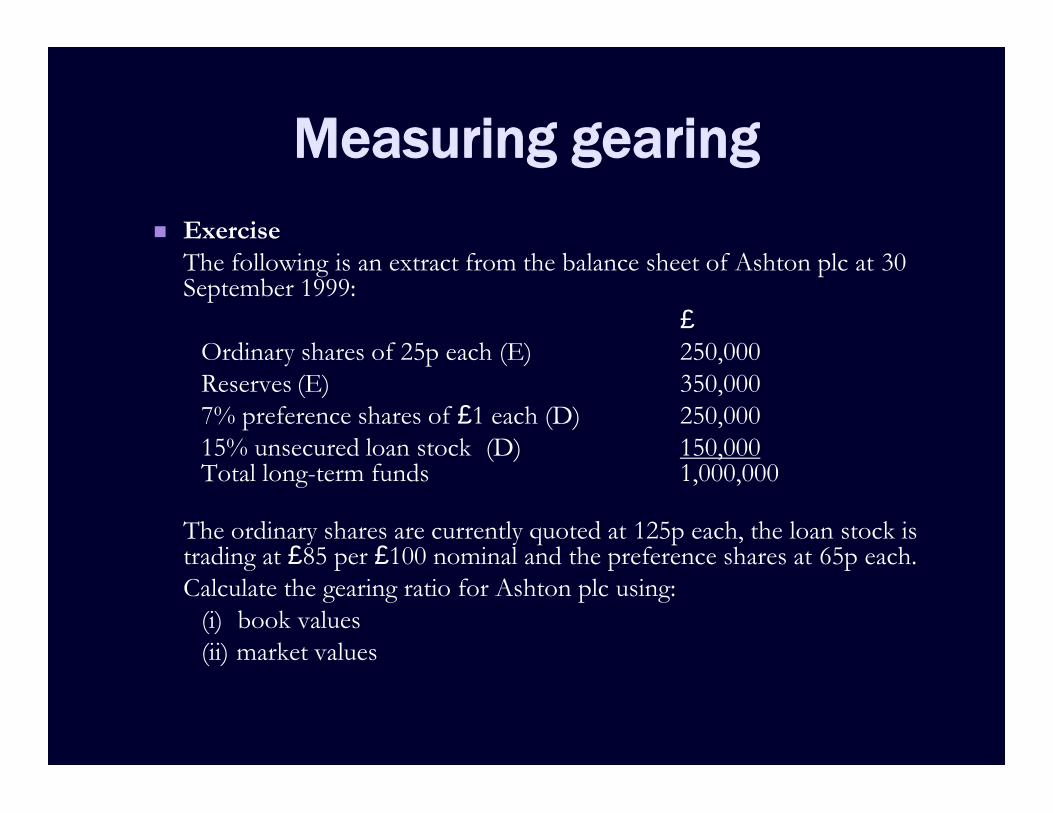
Measuring gearing Exercise
The following is an extract from the balance sheet of Ashton plc at 30September 1999:
£Ordinary shares of 25p each (E) 250,000Reserves (E) 350,0007% preference shares of £1 each (D) 250,00015% unsecured loan stock (D) 150,000Total long-term funds 1,000,000
The ordinary shares are currently quoted at 125p each, the loan stock istrading at £85 per £100 nominal and the preference shares at 65p each.Calculate the gearing ratio for Ashton plc using:
(i) book values(ii) market values
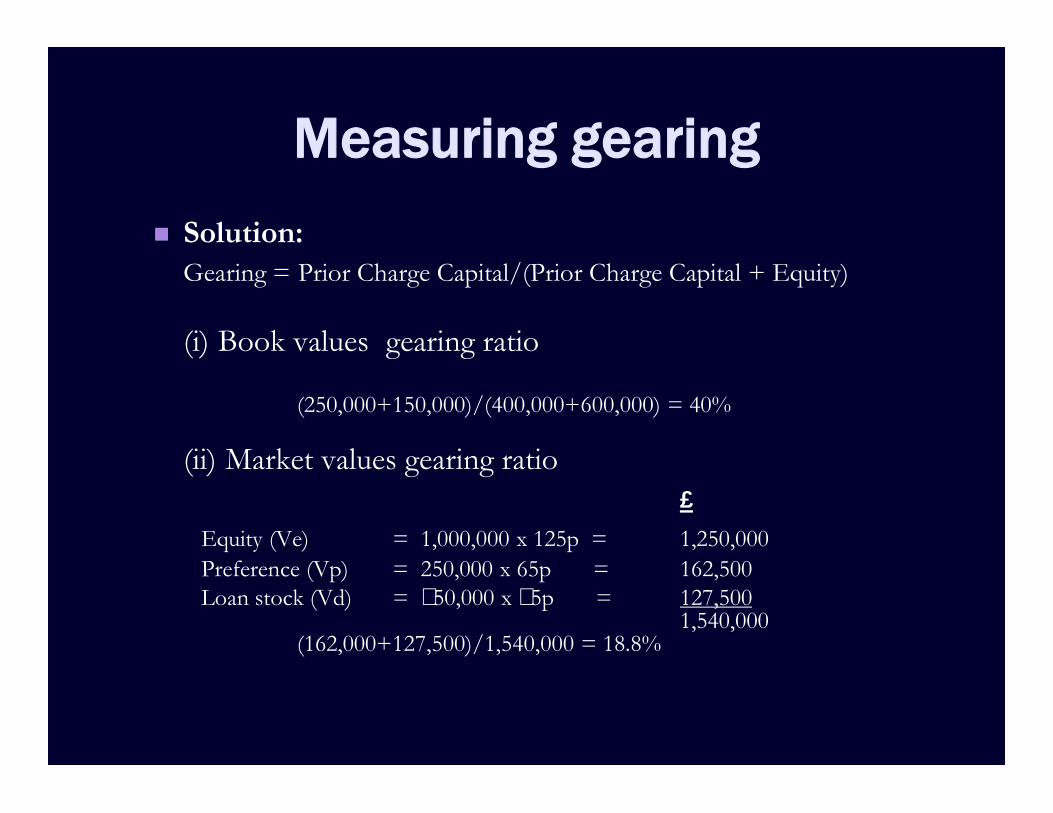
Measuring gearing Solution:
Gearing = Prior Charge Capital/(Prior Charge Capital + Equity)
(i) Book values gearing ratio
(250,000+150,000)/(400,000+600,000) = 40%
(ii) Market values gearing ratio£
Equity (Ve) = 1,000,000 x 125p = 1,250,000Preference (Vp) = 250,000 x 65p = 162,500Loan stock (Vd) = ١50,000 x ٨5p = 127,500
1,540,000(162,000+127,500)/1,540,000 = 18.8%
Measuring gearing
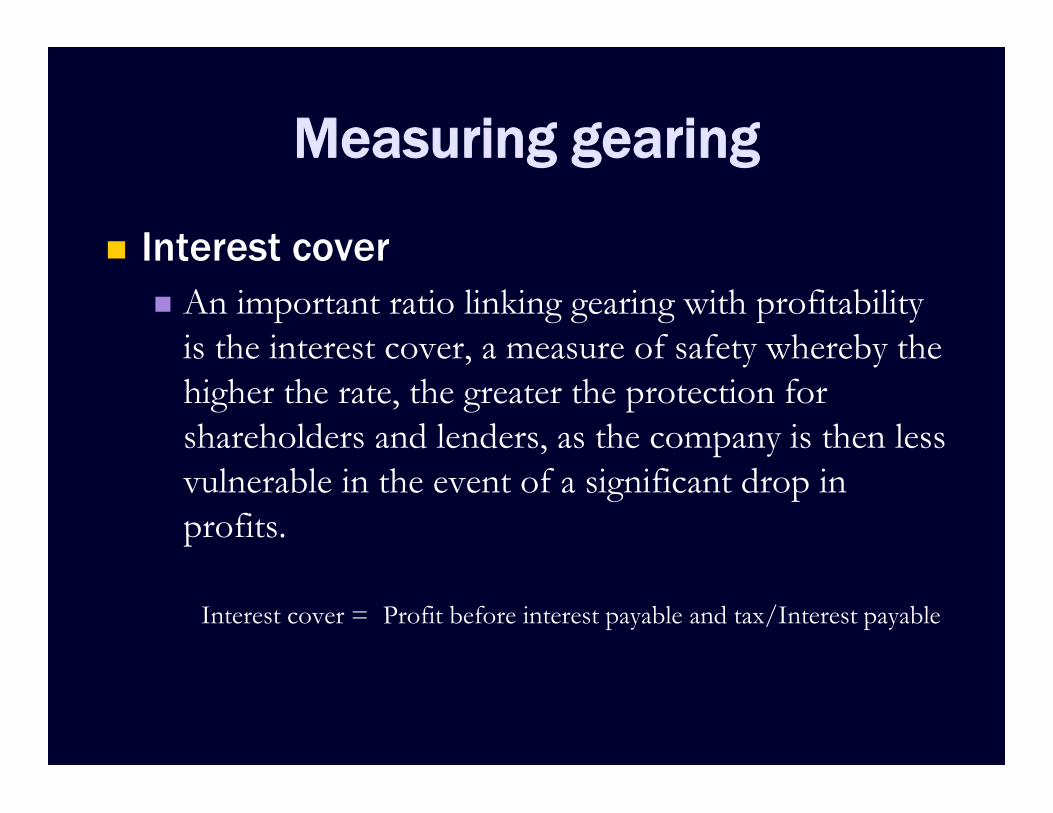
Interest cover An important ratio linking gearing with profitability
is the interest cover, a measure of safety whereby thehigher the rate, the greater the protection forshareholders and lenders, as the company is then lessvulnerable in the event of a significant drop inprofits.
Interest cover = Profit before interest payable and tax/Interest payable
Measuring gearing
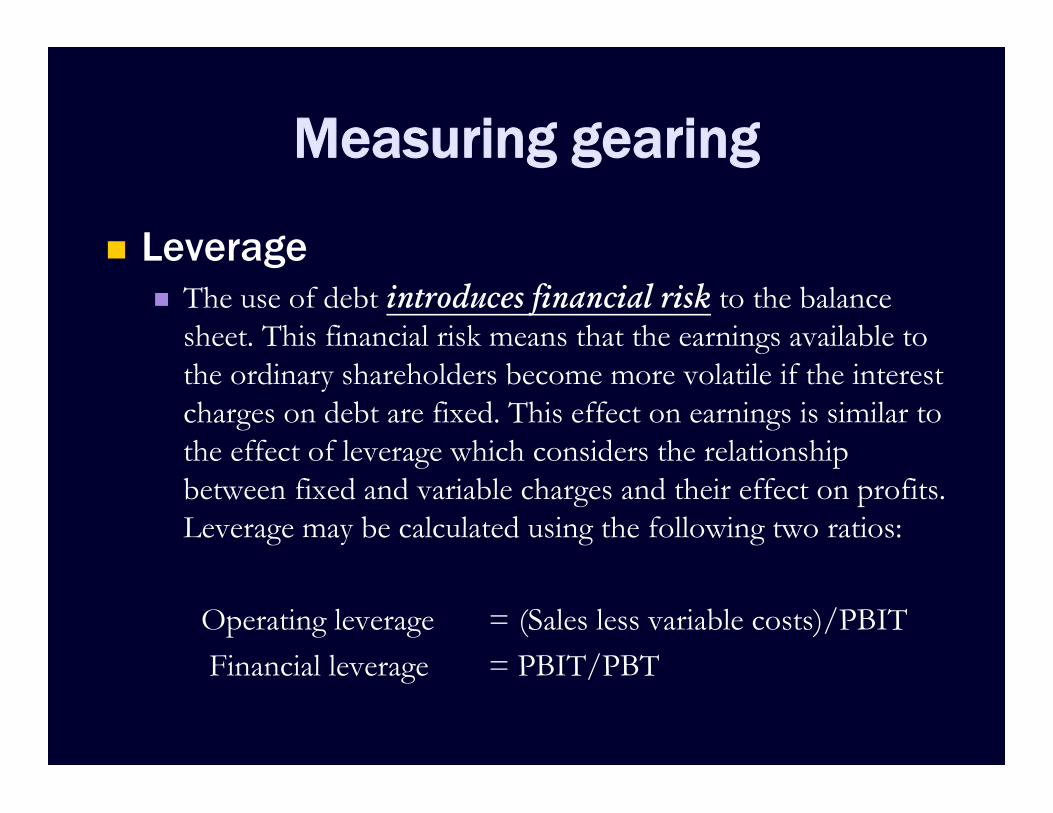
Leverage The use of debt introduces financial risk to the balance
sheet. This financial risk means that the earnings available tothe ordinary shareholders become more volatile if the interestcharges on debt are fixed. This effect on earnings is similar tothe effect of leverage which considers the relationshipbetween fixed and variable charges and their effect on profits.Leverage may be calculated using the following two ratios:
Operating leverage = (Sales less variable costs)/PBITFinancial leverage = PBIT/PBT
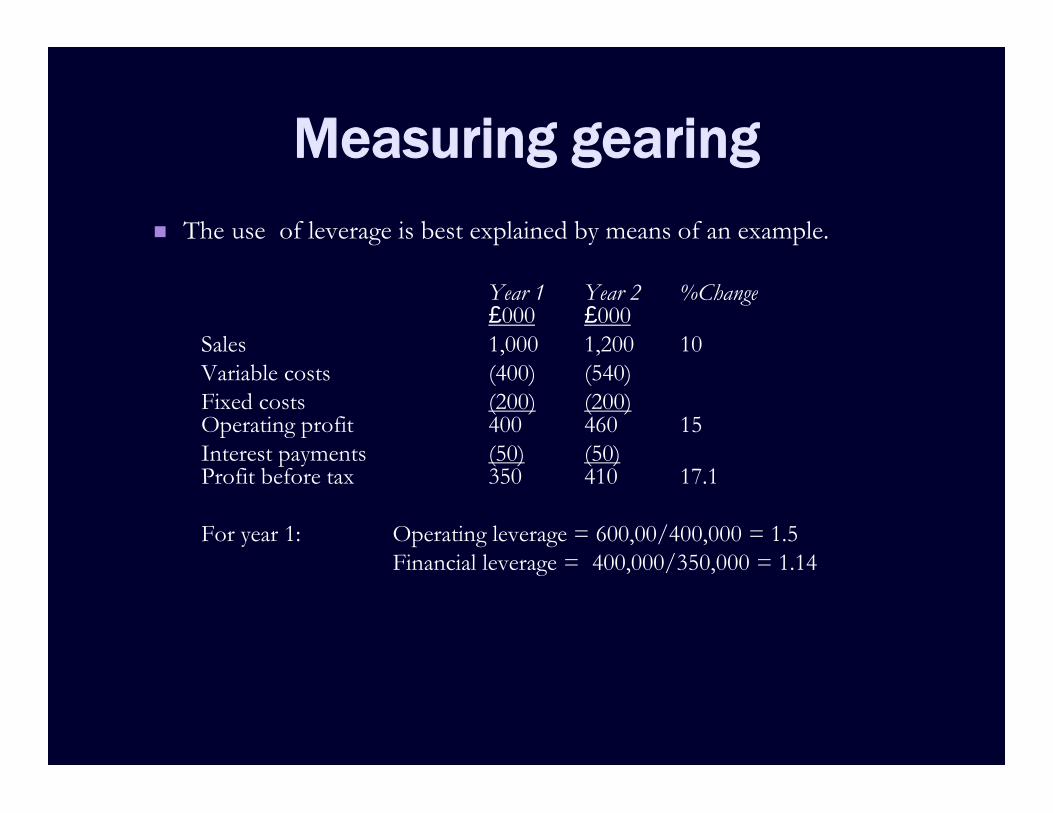
Measuring gearing The use of leverage is best explained by means of an example.
Year 1 Year 2 %Change£000 £000
Sales 1,000 1,200 10Variable costs (400) (540)Fixed costs (200) (200)Operating profit 400 460 15Interest payments (50) (50)Profit before tax 350 410 17.1
For year 1: Operating leverage = 600,00/400,000 = 1.5Financial leverage = 400,000/350,000 = 1.14
Cost of Capital
Definition We call the cut-off rate, which separates viable from non-
viable opportunities, the cost of capital and it is one of thefundamental disciplines of the capitalist market economy.
Cost of equity Equity may be raised externally through a share issue, or
internally through retained profits. Measuring the cost ofequity is a very difficult task. The cost of equity must relate tothe return which equity investors expect to reward them forthe risk taken by investing in the company.
Cost of Capital
Dِividend valuation modelWe begin this section with the basic form of the dividend
valuation model as a method of calculating cost of equity.This model makes the assumption that the market price ofa share is related to the future dividend income streamfrom that share in such a way that the market price isassumed to be the present value of that future dividendincome stream.
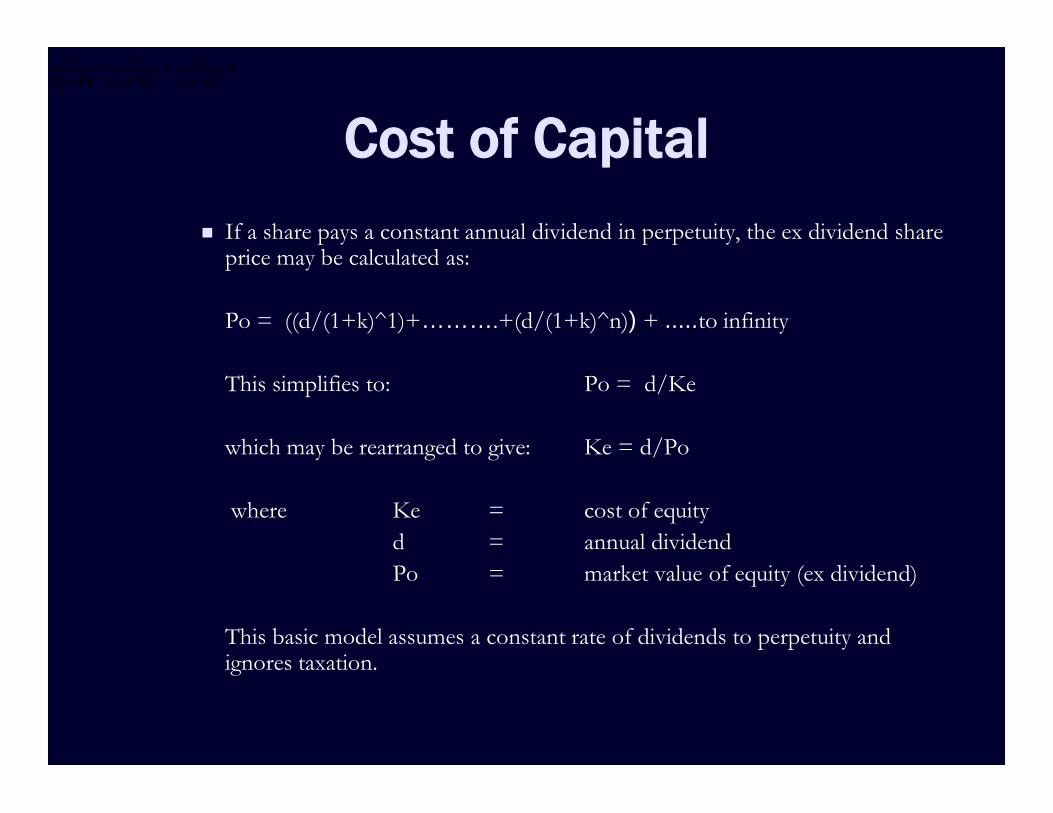
Cost of Capital If a share pays a constant annual dividend in perpetuity, the ex dividend share
price may be calculated as:
Po = ((d/(1+k)^1)+……….+(d/(1+k)^n)) + .....to infinity
This simplifies to: Po = d/Ke
which may be rearranged to give: Ke = d/Po
where Ke = cost of equityd = annual dividendPo = market value of equity (ex dividend)
This basic model assumes a constant rate of dividends to perpetuity andignores taxation.
32 k)(1
d
k)(1
d
k)(1
d
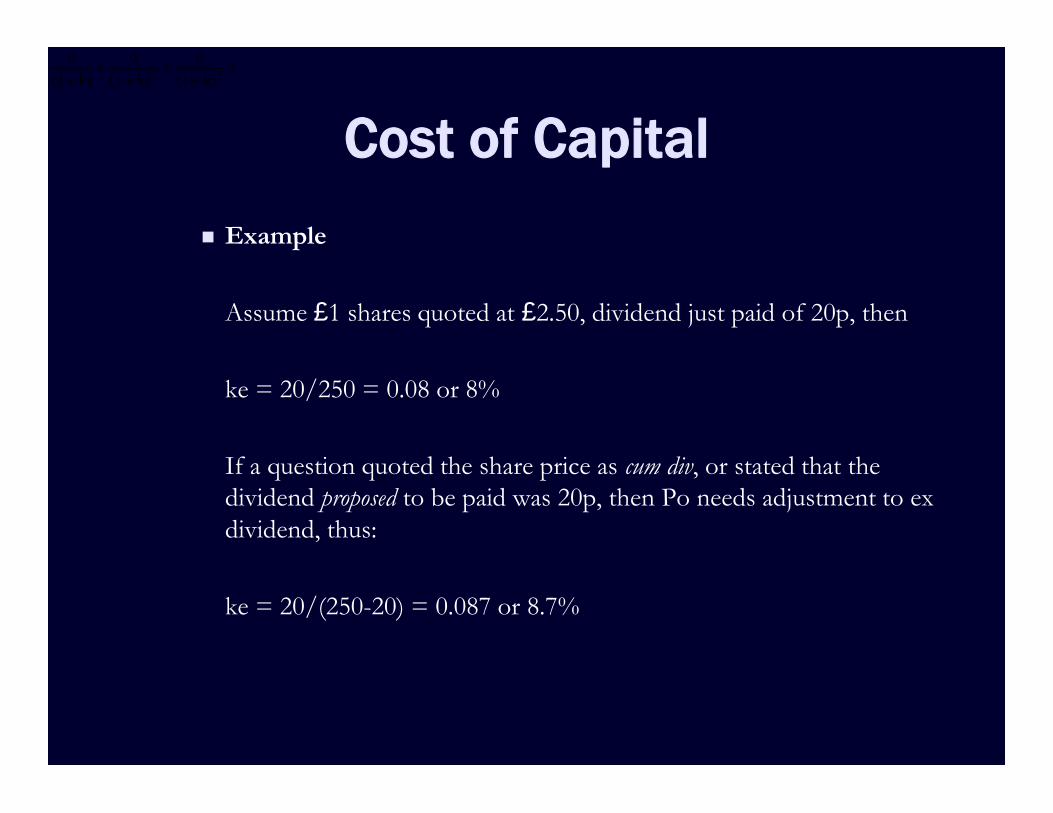
Cost of Capital Example
Assume £1 shares quoted at £2.50, dividend just paid of 20p, then
ke = 20/250 = 0.08 or 8%
If a question quoted the share price as cum div, or stated that thedividend proposed to be paid was 20p, then Po needs adjustment to exdividend, thus:
ke = 20/(250-20) = 0.087 or 8.7%
32 k)(1
d
k)(1
d
k)(1
d
Cost of Capital
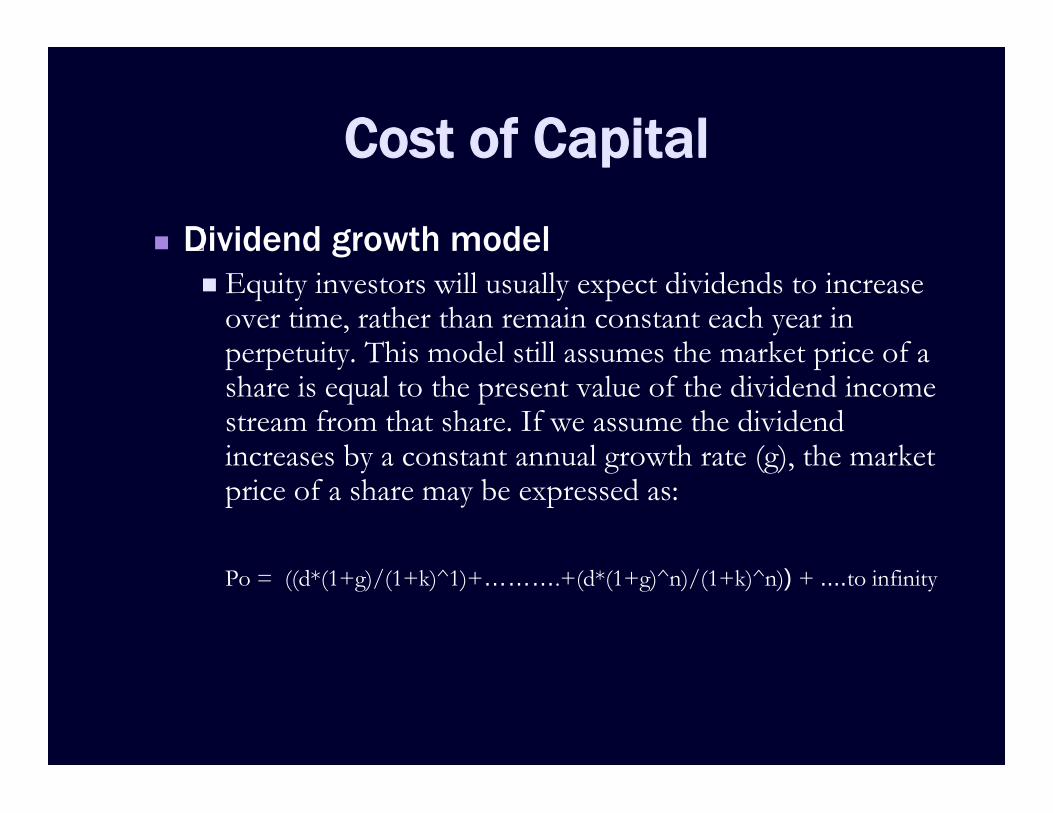
Dِividend growth model Equity investors will usually expect dividends to increase
over time, rather than remain constant each year inperpetuity. This model still assumes the market price of ashare is equal to the present value of the dividend incomestream from that share. If we assume the dividendincreases by a constant annual growth rate (g), the marketprice of a share may be expressed as:
Po = ((d*(1+g)/(1+k)^1)+……….+(d*(1+g)^n)/(1+k)^n)) + ....to infinity
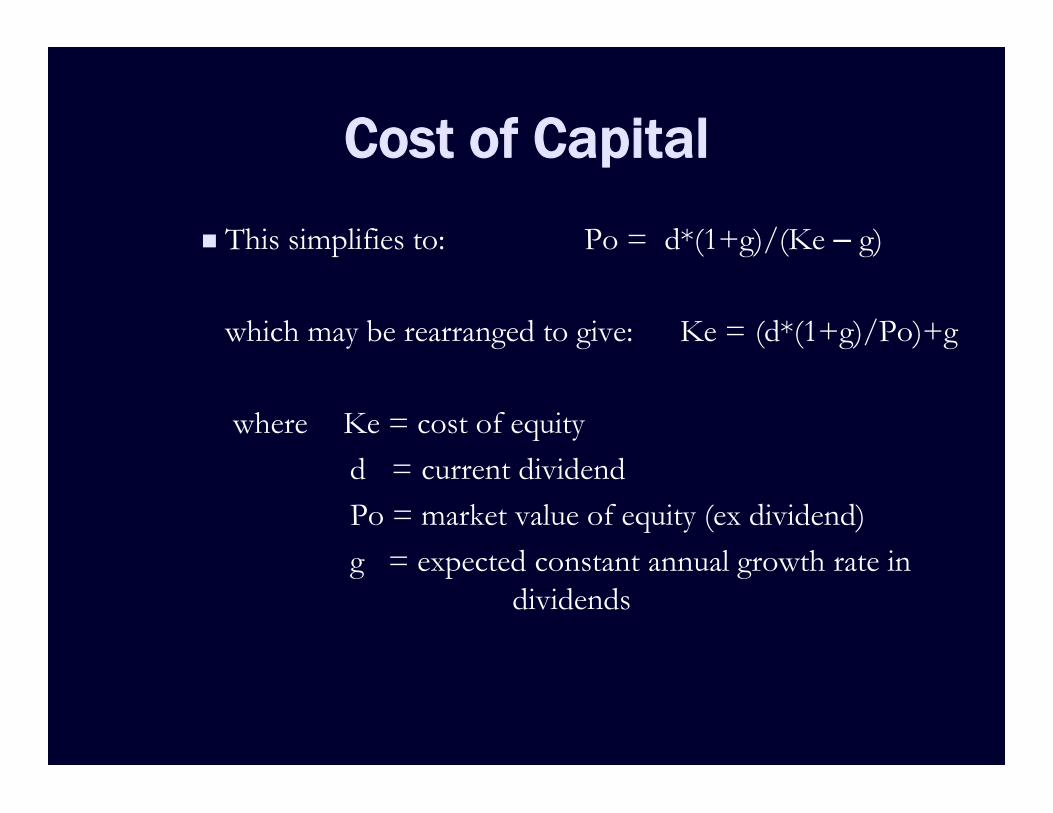
Cost of Capital This simplifies to: Po = d*(1+g)/(Ke – g)
which may be rearranged to give: Ke = (d*(1+g)/Po)+g
where Ke = cost of equityd = current dividendPo = market value of equity (ex dividend)g = expected constant annual growth rate in
dividends
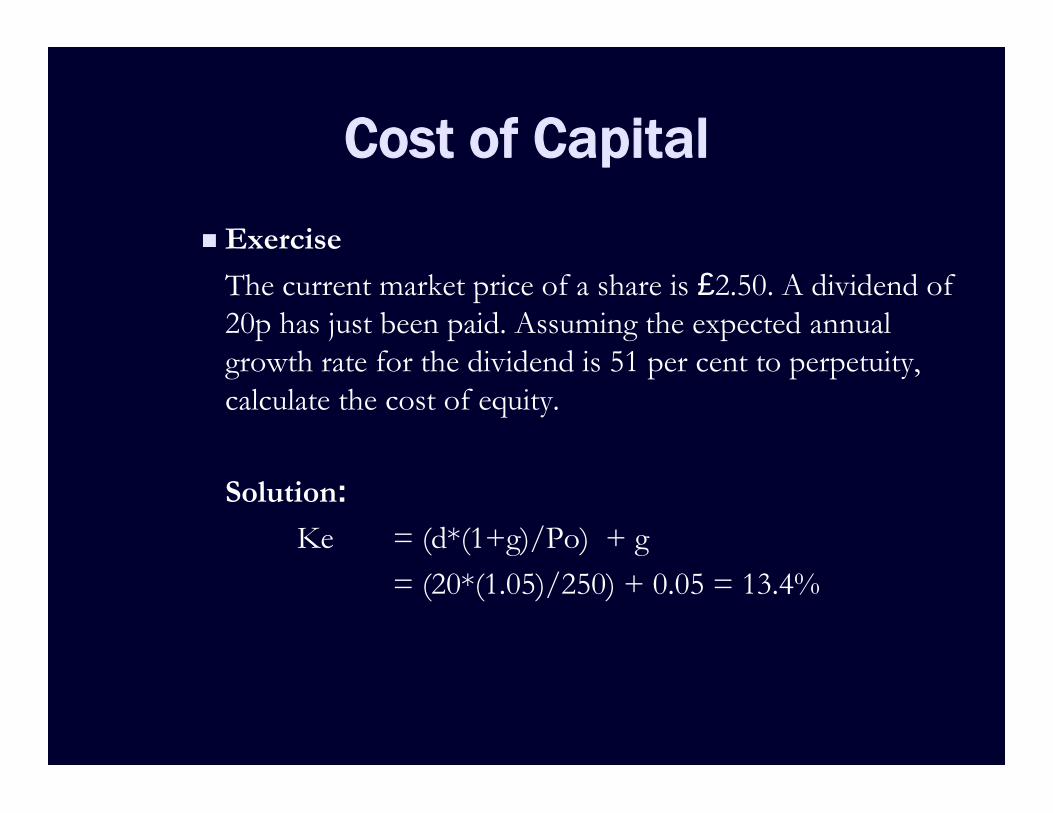
Cost of Capital Exercise
The current market price of a share is £2.50. A dividend of20p has just been paid. Assuming the expected annualgrowth rate for the dividend is 51 per cent to perpetuity,calculate the cost of equity.
Solution:Ke = (d*(1+g)/Po) + g
= (20*(1.05)/250) + 0.05 = 13.4%
Cost of Capital
Eِstimating the growth rate An examination question may require you to estimate the
growth rate in dividends. There are two possibleapproaches with which you need to be familiar.
You may need to extrapolate growth from historic data,assuming the historic average annual growth rate willcontinue in perpetuity.
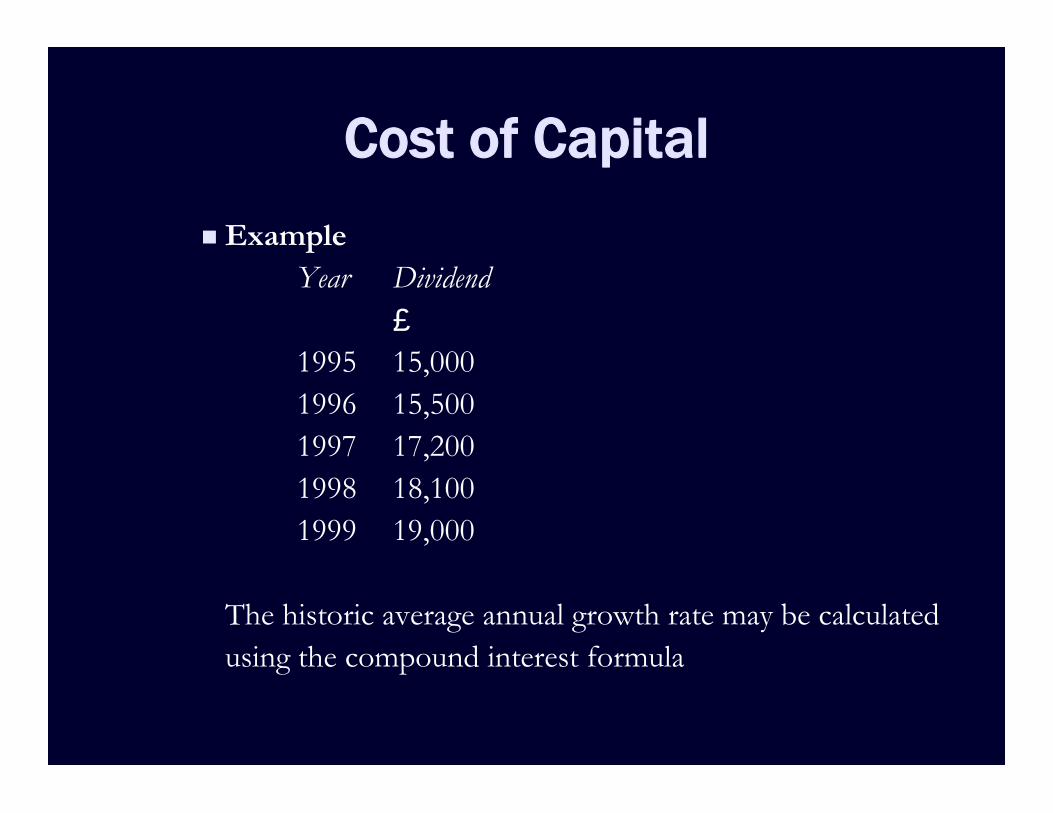
Cost of Capital Example
Year Dividend£
1995 15,0001996 15,5001997 17,2001998 18,1001999 19,000
The historic average annual growth rate may be calculatedusing the compound interest formula
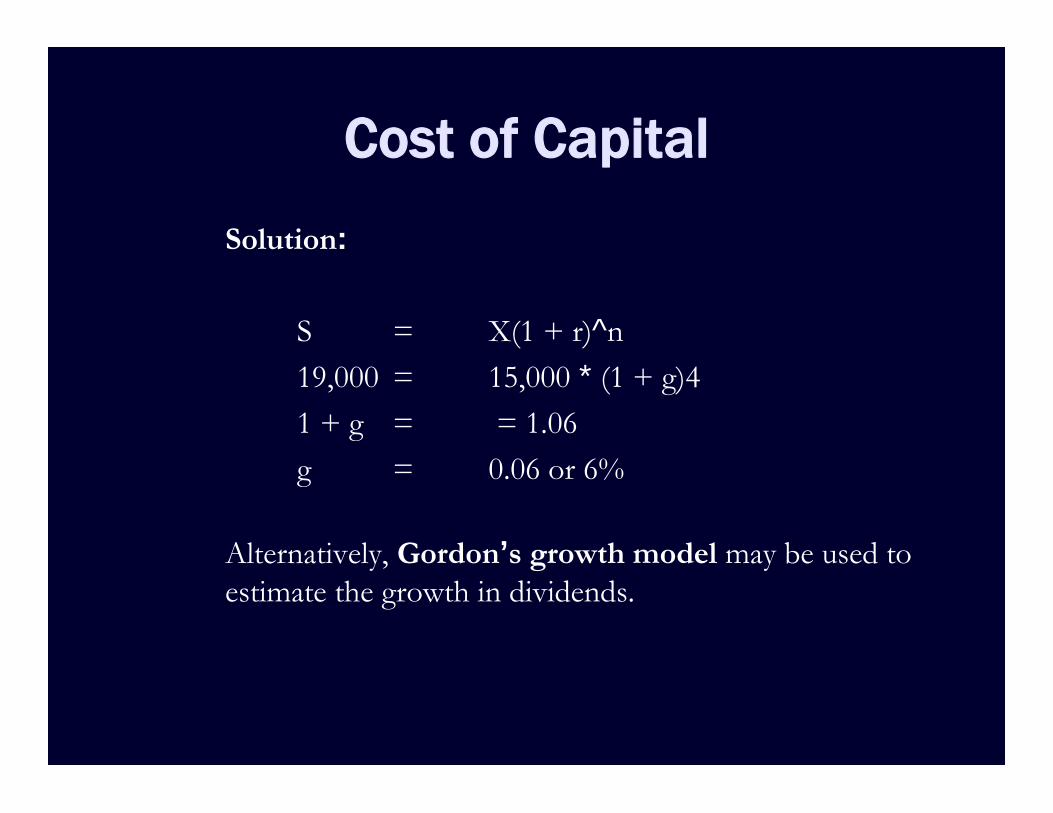
Cost of CapitalSolution:
S = X(1 + r)^n19,000 = 15,000 * (1 + g)41 + g = = 1.06g = 0.06 or 6%
Alternatively, Gordon’s growth model may be used toestimate the growth in dividends.
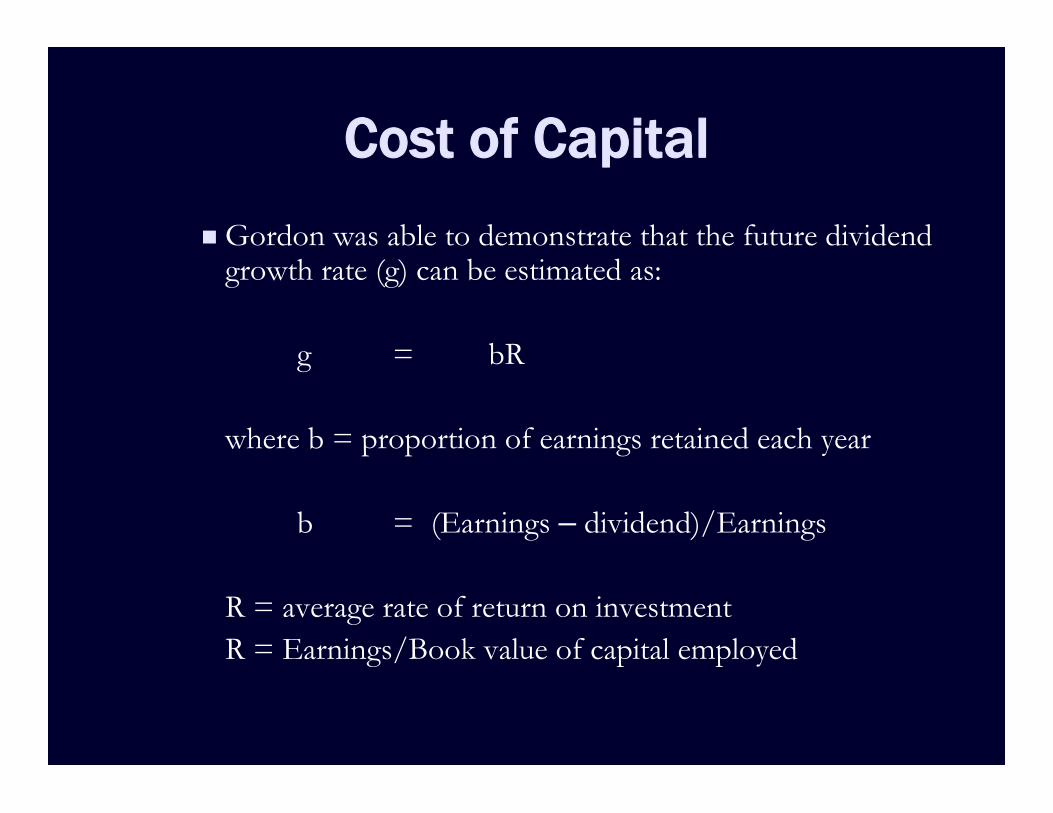
Cost of CapitalGordon was able to demonstrate that the future dividend
growth rate (g) can be estimated as:
g = bR
where b = proportion of earnings retained each year
b = (Earnings – dividend)/Earnings
R = average rate of return on investmentR = Earnings/Book value of capital employed
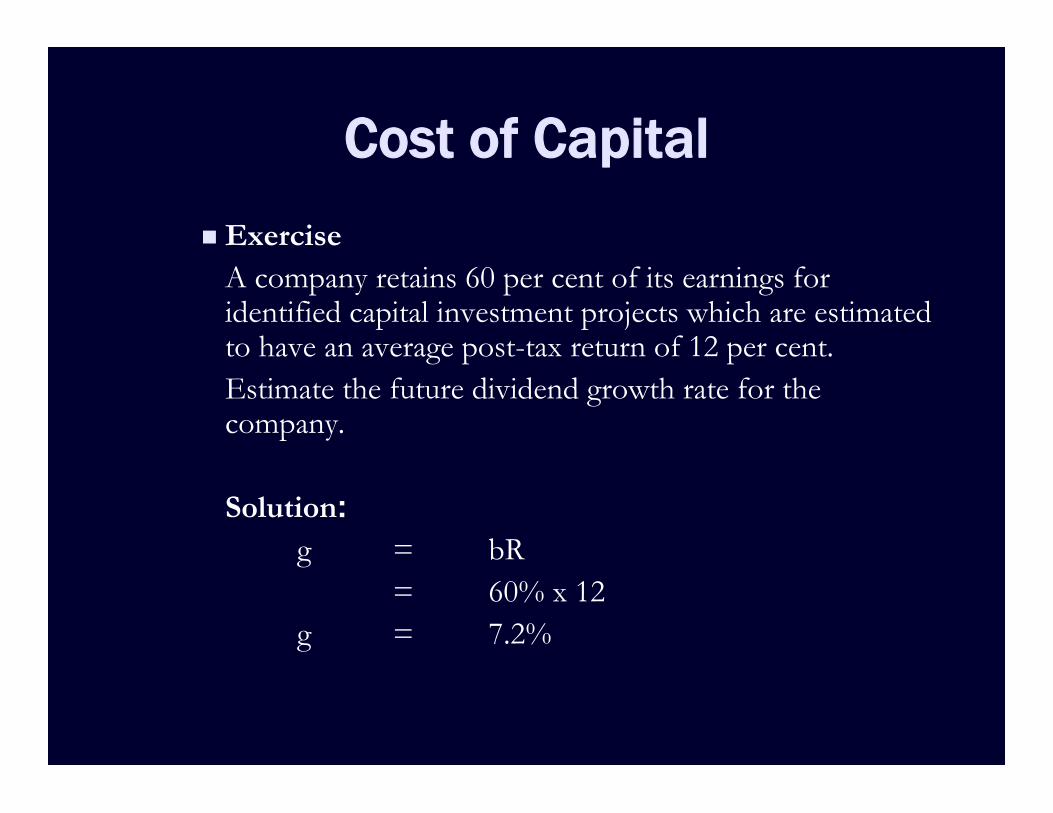
Cost of Capital Exercise
A company retains 60 per cent of its earnings foridentified capital investment projects which are estimatedto have an average post-tax return of 12 per cent.Estimate the future dividend growth rate for thecompany.
Solution:g = bR
= 60% x 12g = 7.2%
Cost of Capital
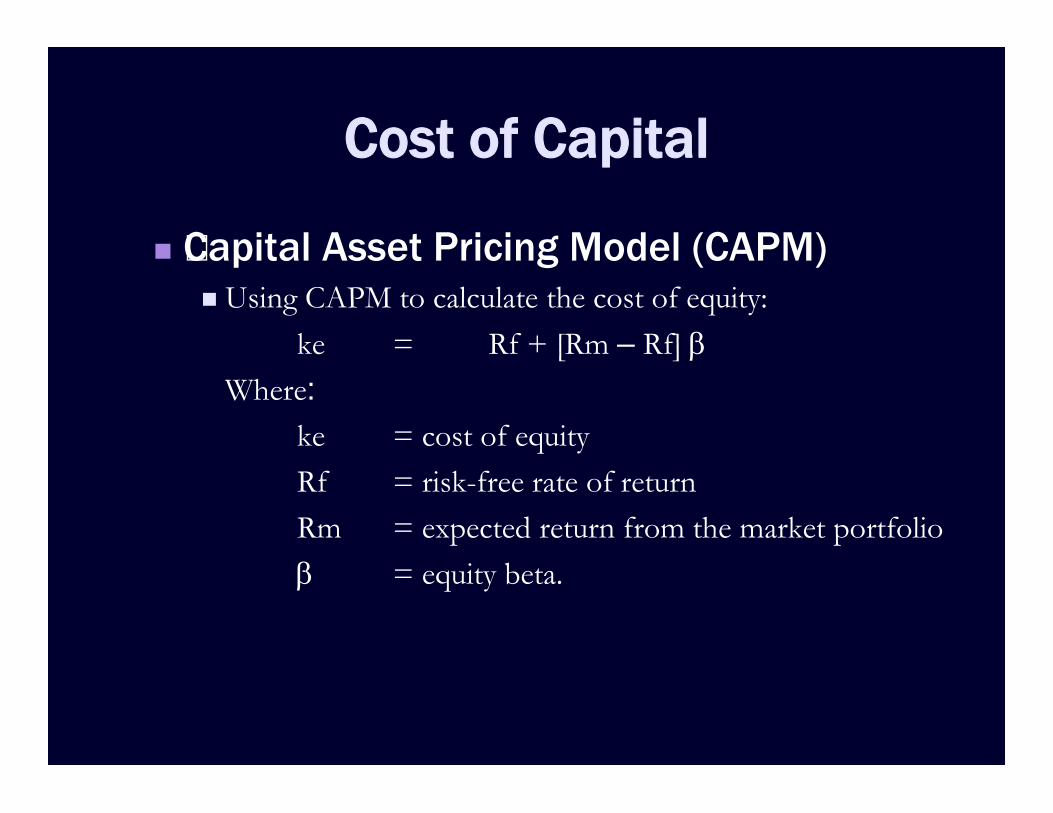
Cِapital Asset Pricing Model (CAPM) Using CAPM to calculate the cost of equity:
ke = Rf + [Rm – Rf] Where:
ke = cost of equityRf = risk-free rate of returnRm = expected return from the market portfolio = equity beta.
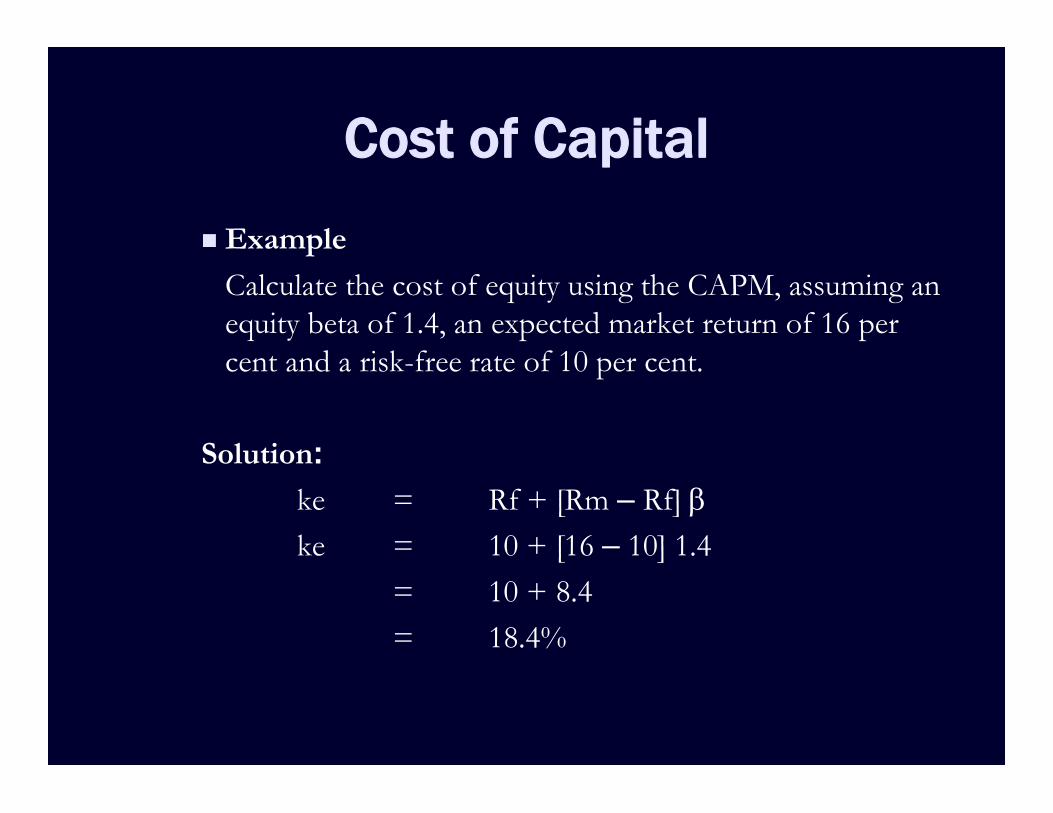
Cost of Capital Example
Calculate the cost of equity using the CAPM, assuming anequity beta of 1.4, an expected market return of 16 percent and a risk-free rate of 10 per cent.
Solution:ke = Rf + [Rm – Rf] ke = 10 + [16 – 10] 1.4
= 10 + 8.4= 18.4%
Cost of Capital
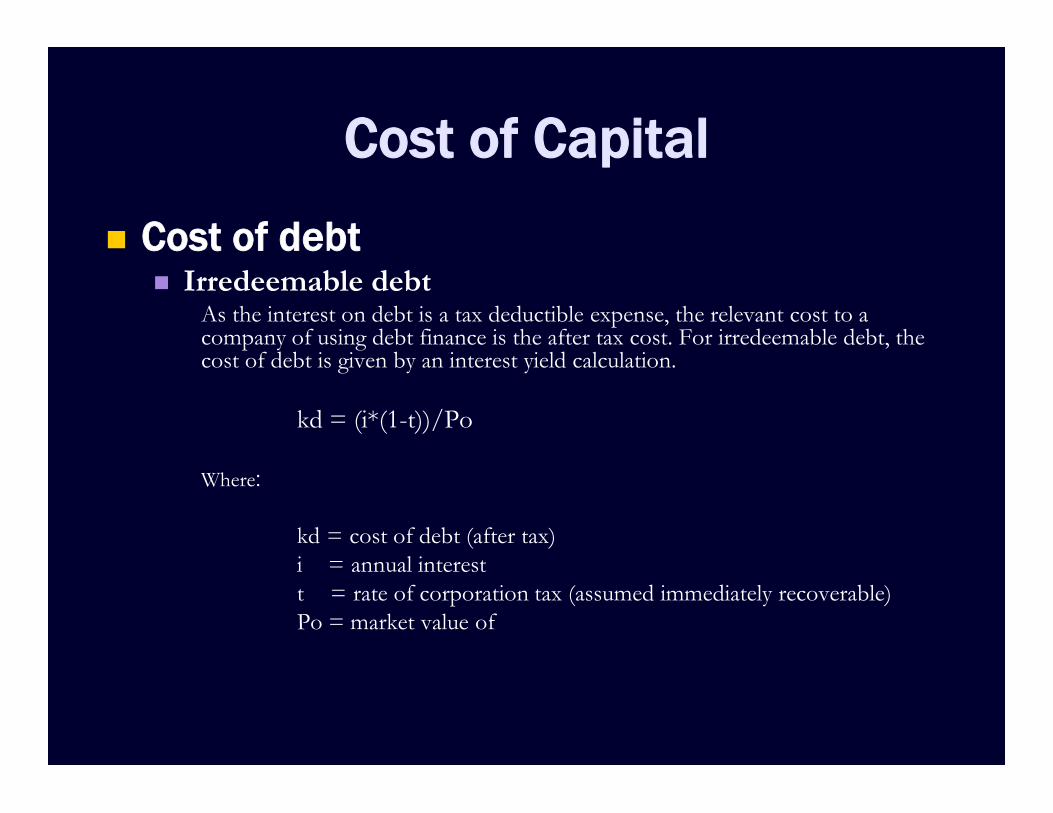
Cost of debt Irredeemable debt
As the interest on debt is a tax deductible expense, the relevant cost to acompany of using debt finance is the after tax cost. For irredeemable debt, thecost of debt is given by an interest yield calculation.
kd = (i*(1-t))/Po
Where:
kd = cost of debt (after tax)i = annual interestt = rate of corporation tax (assumed immediately recoverable)Po = market value of
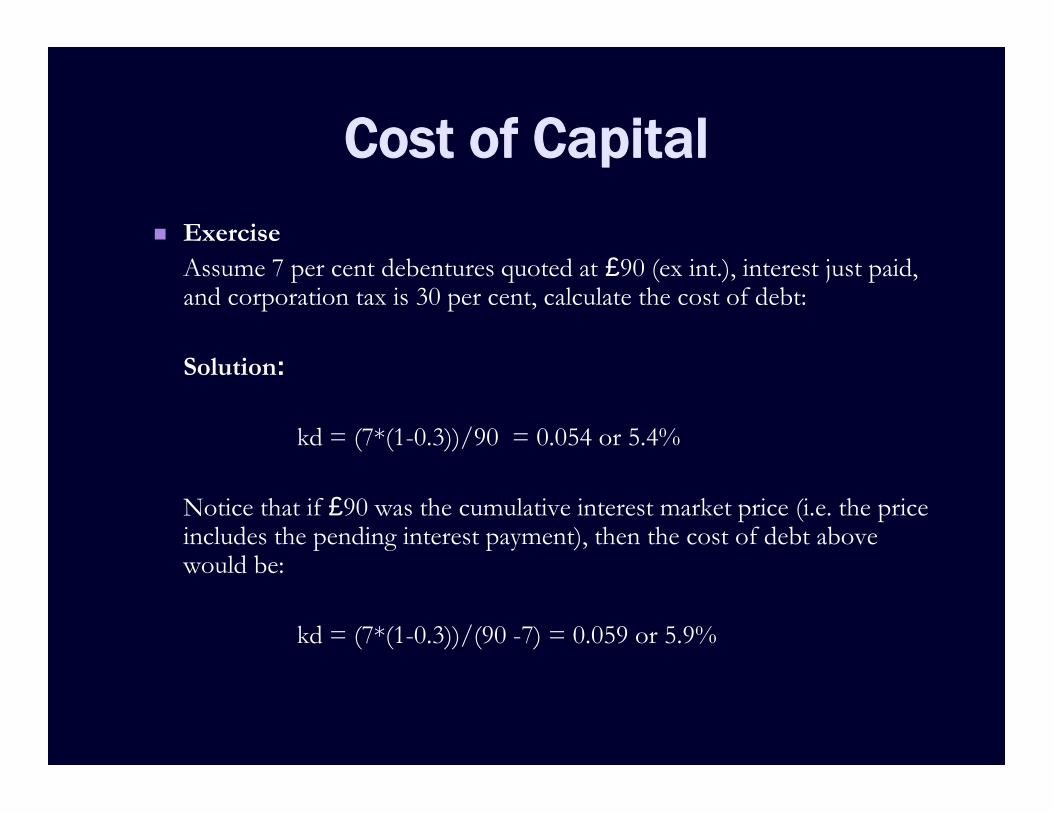
Cost of Capital Exercise
Assume 7 per cent debentures quoted at £90 (ex int.), interest just paid,and corporation tax is 30 per cent, calculate the cost of debt:
Solution:
kd = (7*(1-0.3))/90 = 0.054 or 5.4%
Notice that if £90 was the cumulative interest market price (i.e. the priceincludes the pending interest payment), then the cost of debt abovewould be:
kd = (7*(1-0.3))/(90 -7) = 0.059 or 5.9%
Cost of Capital
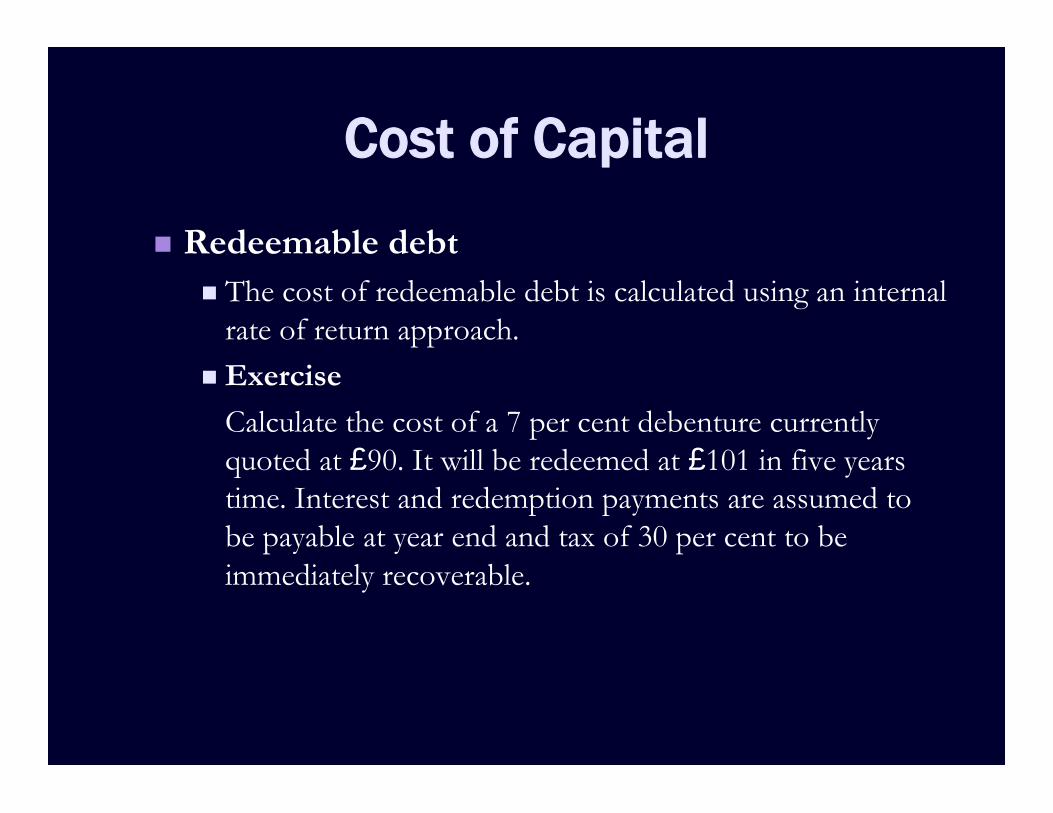
Redeemable debt The cost of redeemable debt is calculated using an internal
rate of return approach. Exercise
Calculate the cost of a 7 per cent debenture currentlyquoted at £90. It will be redeemed at £101 in five yearstime. Interest and redemption payments are assumed tobe payable at year end and tax of 30 per cent to beimmediately recoverable.
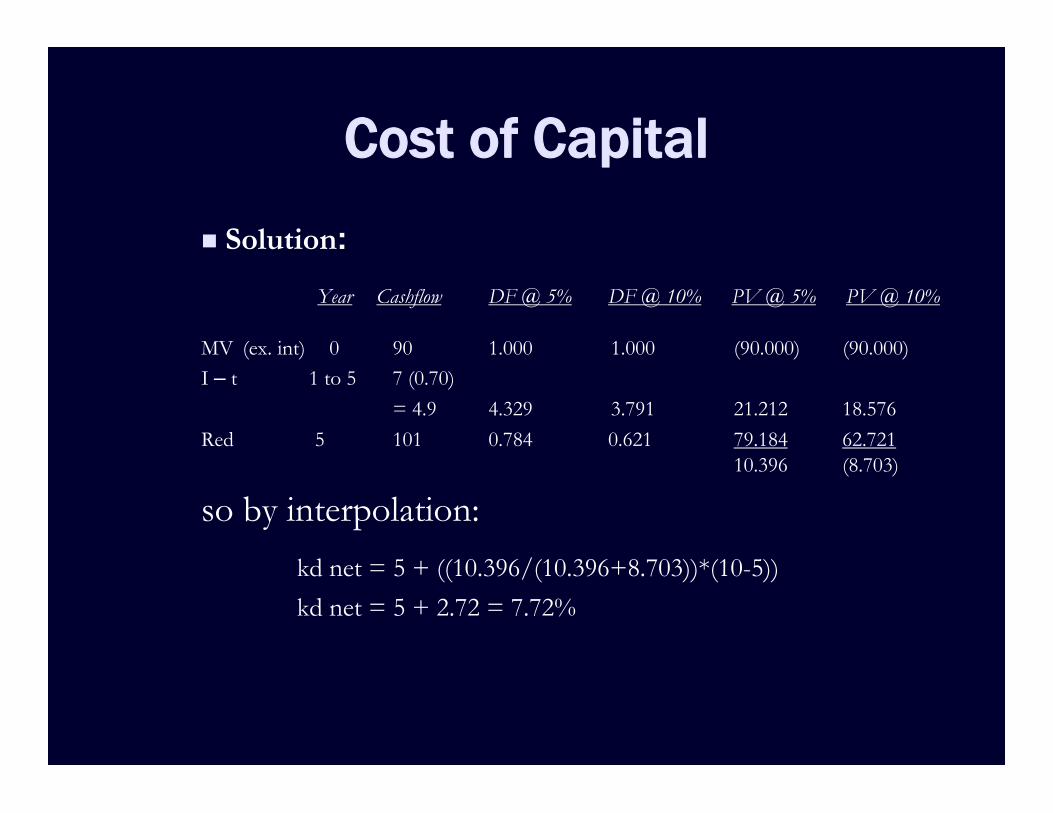
Cost of Capital Solution:
Year Cashflow DF @ 5% DF @ 10% PV @ 5% PV @ 10%
MV (ex. int) 0 90 1.000 1.000 (90.000) (90.000)I – t 1 to 5 7 (0.70)
= 4.9 4.329 3.791 21.212 18.576Red 5 101 0.784 0.621 79.184 62.721
10.396 (8.703)
so by interpolation:kd net = 5 + ((10.396/(10.396+8.703))*(10-5))kd net = 5 + 2.72 = 7.72%
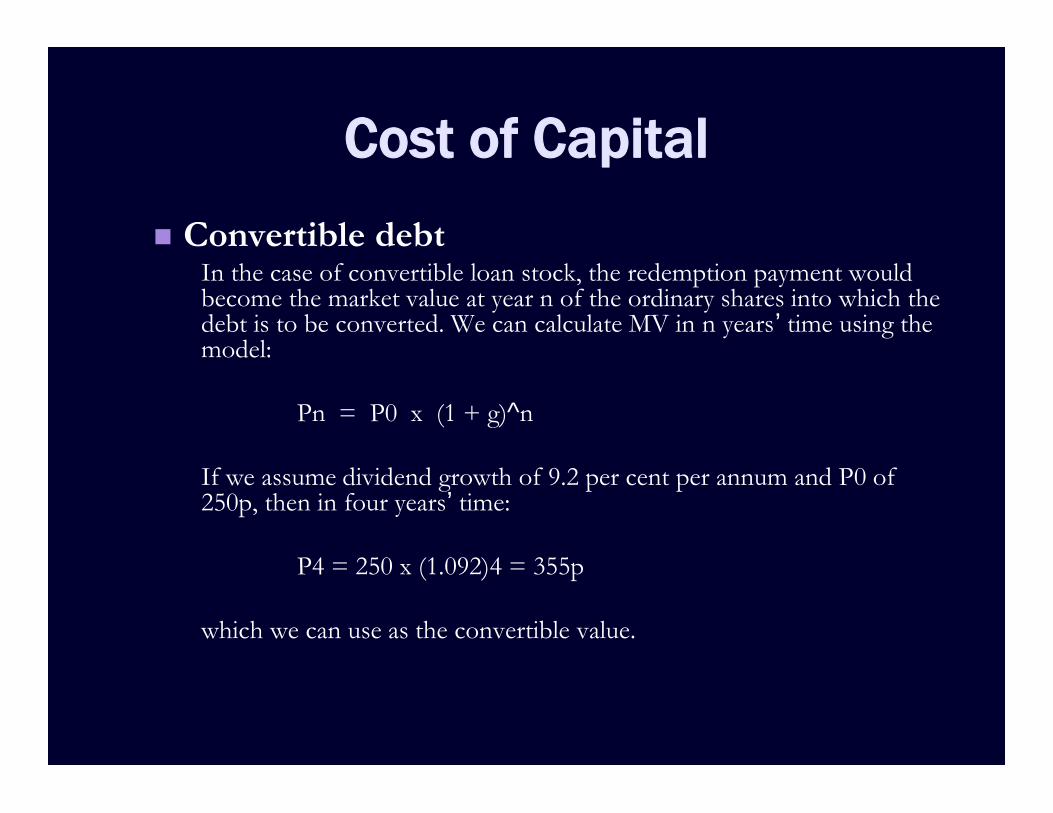
Cost of Capital Convertible debt
In the case of convertible loan stock, the redemption payment wouldbecome the market value at year n of the ordinary shares into which thedebt is to be converted. We can calculate MV in n years’ time using themodel:
Pn = P0 x (1 + g)^n
If we assume dividend growth of 9.2 per cent per annum and P0 of250p, then in four years’ time:
P4 = 250 x (1.092)4 = 355p
which we can use as the convertible value.
Cost of Capital
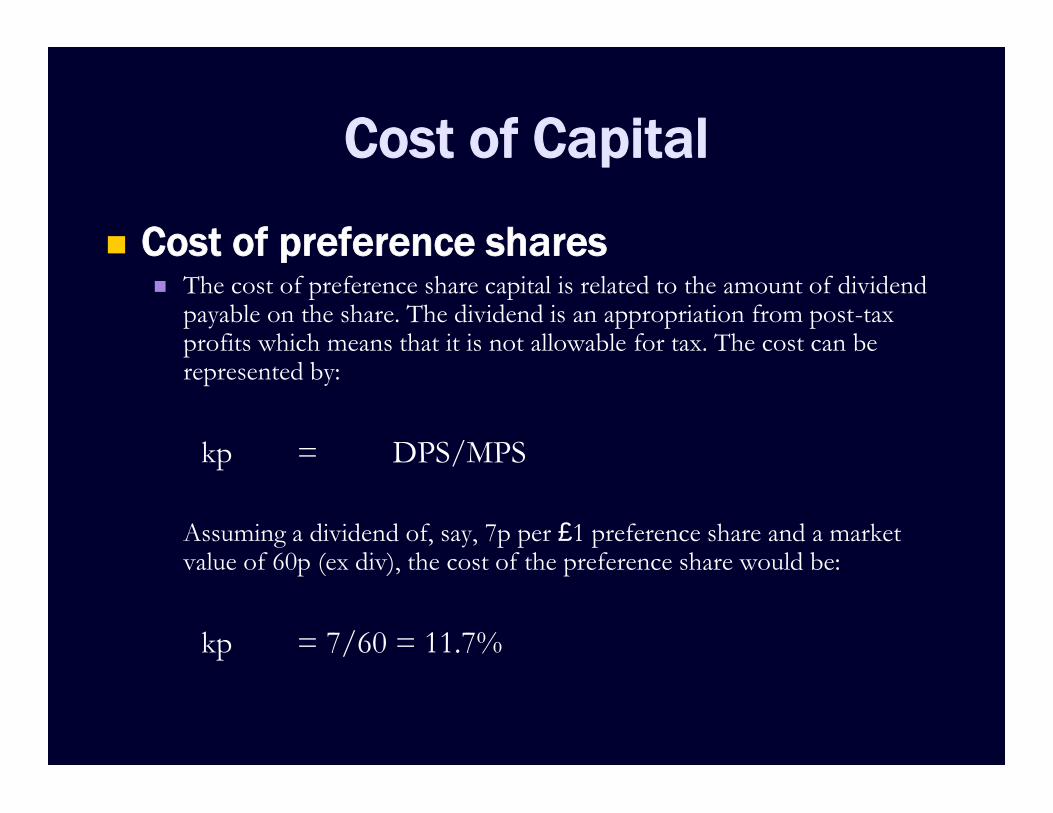
Cost of preference shares The cost of preference share capital is related to the amount of dividend
payable on the share. The dividend is an appropriation from post-taxprofits which means that it is not allowable for tax. The cost can berepresented by:
kp = DPS/MPS
Assuming a dividend of, say, 7p per £1 preference share and a marketvalue of 60p (ex div), the cost of the preference share would be:
kp = 7/60 = 11.7%
Weighted Average Cost of Capital
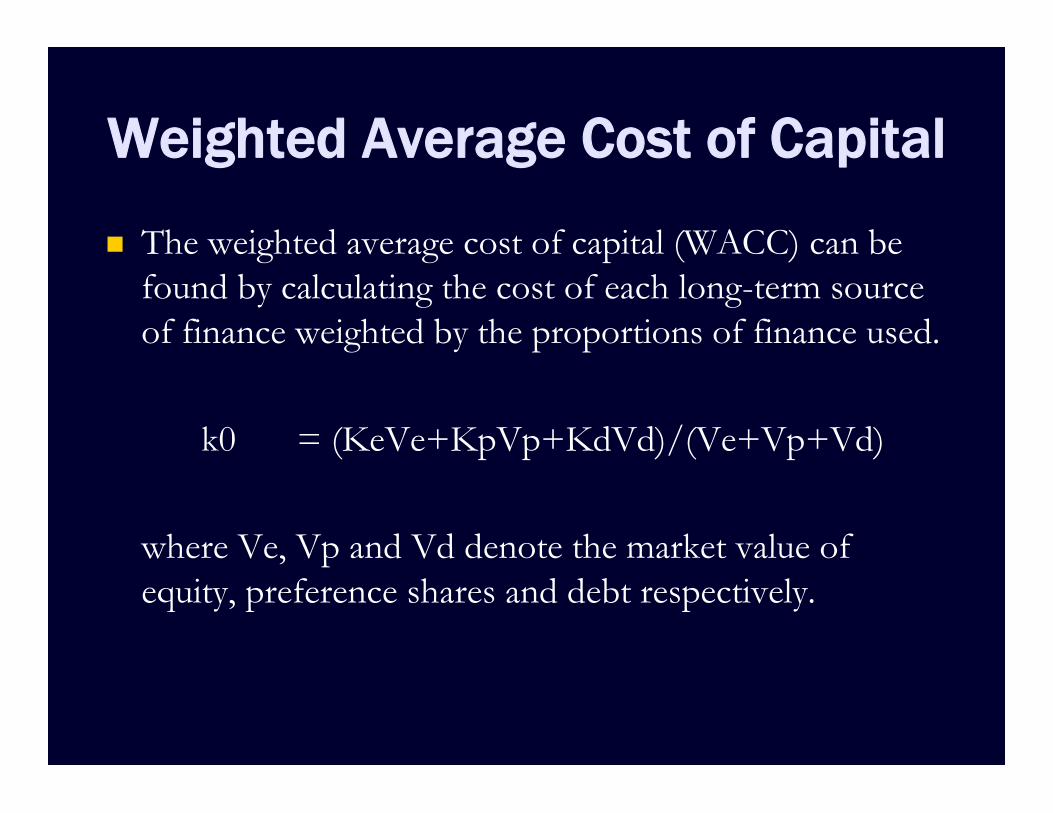
The weighted average cost of capital (WACC) can befound by calculating the cost of each long-term sourceof finance weighted by the proportions of finance used.
k0 = (KeVe+KpVp+KdVd)/(Ve+Vp+Vd)
where Ve, Vp and Vd denote the market value ofequity, preference shares and debt respectively.
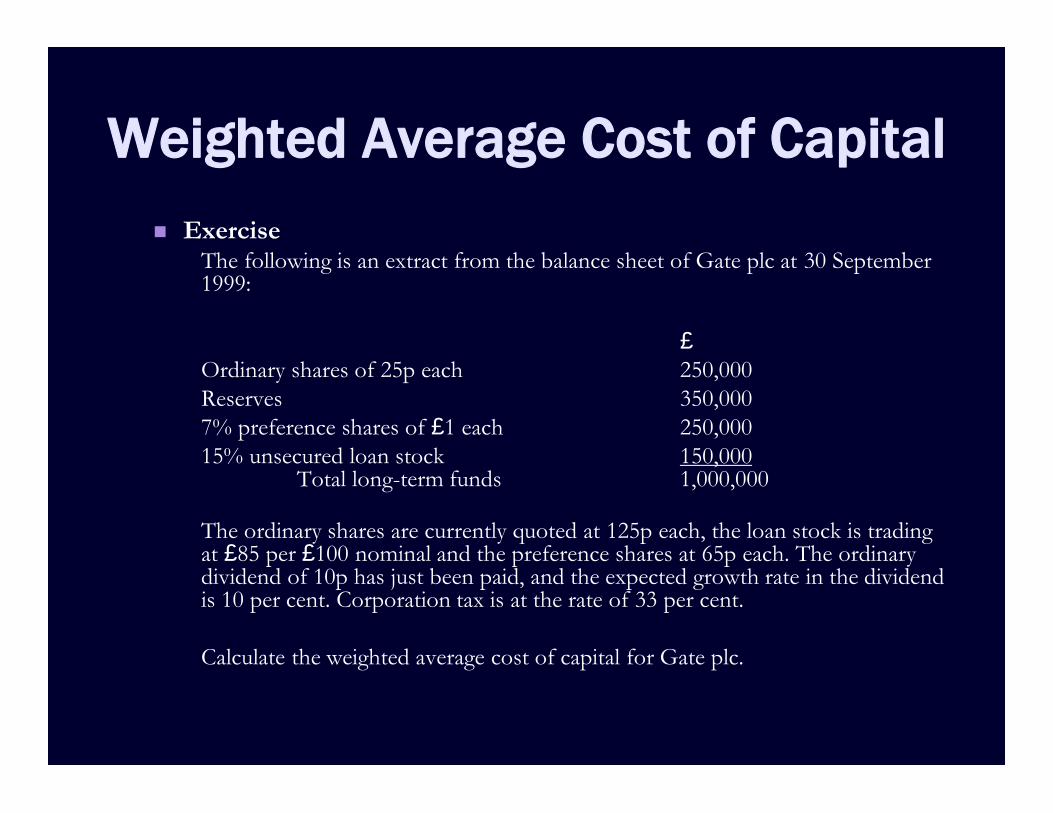
Weighted Average Cost of Capital Exercise
The following is an extract from the balance sheet of Gate plc at 30 September1999:
£Ordinary shares of 25p each 250,000Reserves 350,0007% preference shares of £1 each 250,00015% unsecured loan stock 150,000
Total long-term funds 1,000,000
The ordinary shares are currently quoted at 125p each, the loan stock is tradingat £85 per £100 nominal and the preference shares at 65p each. The ordinarydividend of 10p has just been paid, and the expected growth rate in the dividendis 10 per cent. Corporation tax is at the rate of 33 per cent.
Calculate the weighted average cost of capital for Gate plc.
Weighted Average Cost of Capital
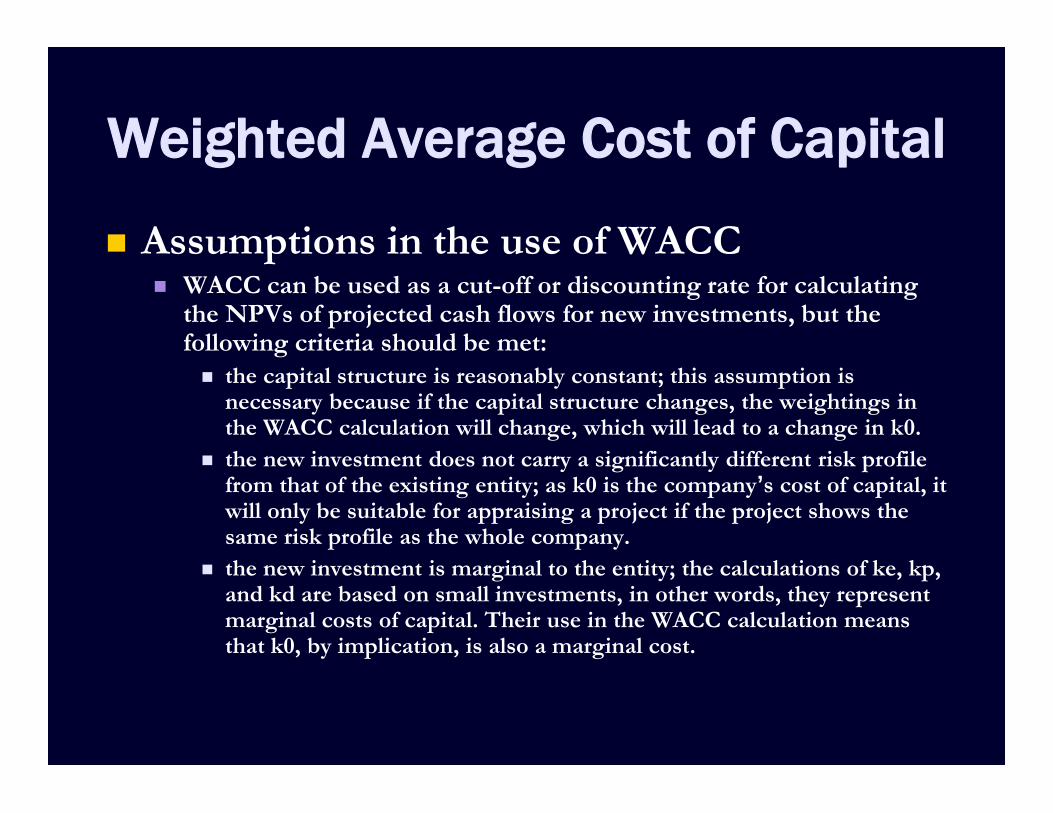
Assumptions in the use of WACC WACC can be used as a cut-off or discounting rate for calculating
the NPVs of projected cash flows for new investments, but thefollowing criteria should be met: the capital structure is reasonably constant; this assumption is
necessary because if the capital structure changes, the weightings inthe WACC calculation will change, which will lead to a change in k0.
the new investment does not carry a significantly different risk profilefrom that of the existing entity; as k0 is the company’s cost of capital, itwill only be suitable for appraising a project if the project shows thesame risk profile as the whole company.
the new investment is marginal to the entity; the calculations of ke, kp,and kd are based on small investments, in other words, they representmarginal costs of capital. Their use in the WACC calculation meansthat k0, by implication, is also a marginal cost.
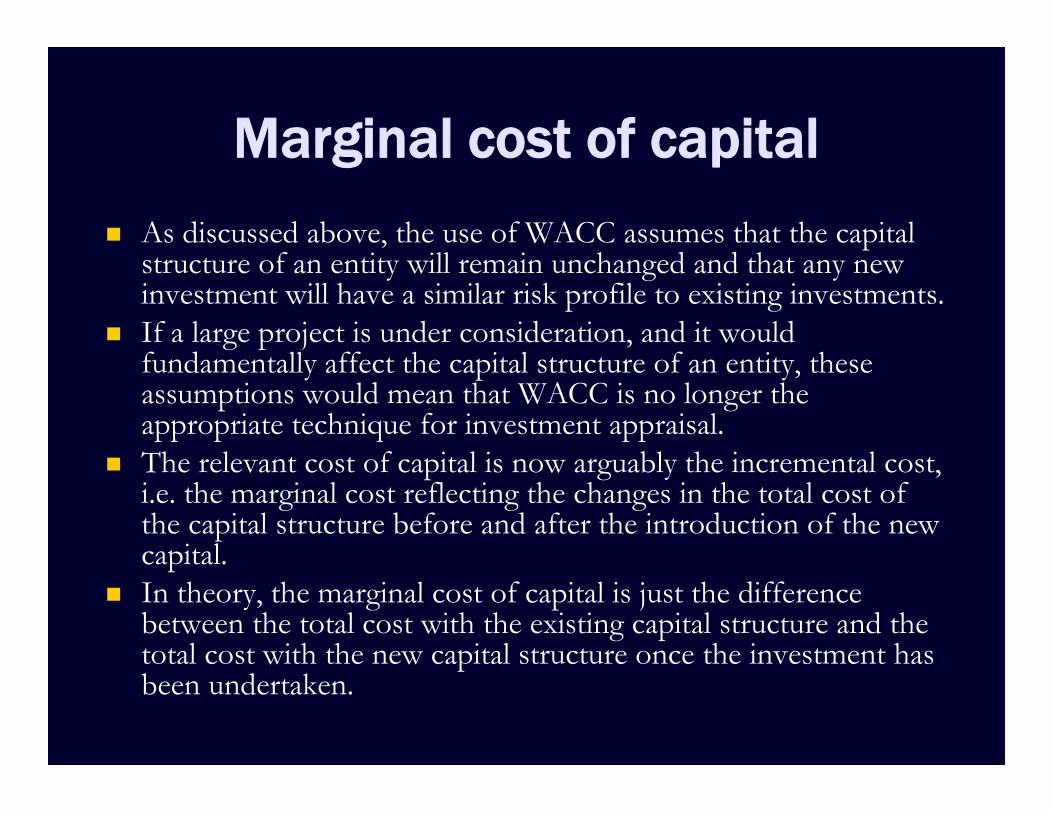
Marginal cost of capital As discussed above, the use of WACC assumes that the capital
structure of an entity will remain unchanged and that any newinvestment will have a similar risk profile to existing investments.
If a large project is under consideration, and it wouldfundamentally affect the capital structure of an entity, theseassumptions would mean that WACC is no longer theappropriate technique for investment appraisal.
The relevant cost of capital is now arguably the incremental cost,i.e. the marginal cost reflecting the changes in the total cost ofthe capital structure before and after the introduction of the newcapital.
In theory, the marginal cost of capital is just the differencebetween the total cost with the existing capital structure and thetotal cost with the new capital structure once the investment hasbeen undertaken.
The traditional theory of gearing The traditional theory of financial gearing considers the effect
that a change in gearing has on the weighted average cost ofcapital (WACC) and on the value of a company. It is based onthe following assumptions:
earnings remain constant in perpetuity and all investors have thesame expectations about future earnings;
taxation is ignored; risk remains constant, no matter how funds are invested; all earnings are paid out in dividends.
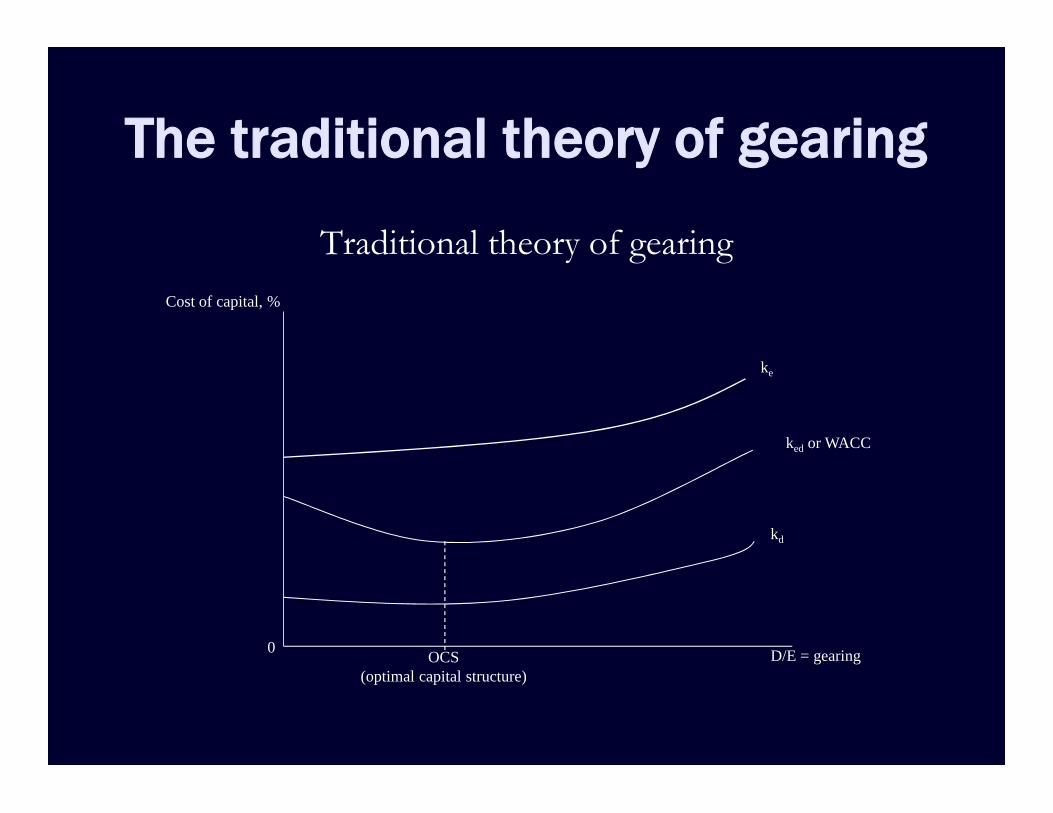
The traditional theory of gearing
Traditional theory of gearing
OCS(optimal capital structure)
D/E = gearing0
kd
ked or WACC
ke
Cost of capital, %
Risk and Reward
Another major topic in finance theory concerns therelationship between risk and reward. The conventionalwisdom is that investors (as distinct from gamblers whobet on football matches or horses, and customers oflotteries) are risk averse. Specifically, it is said that thehigher the risk they associate with a particularinvestment, the higher the return they will demand.Figure 3.3 portrays the general relationship.
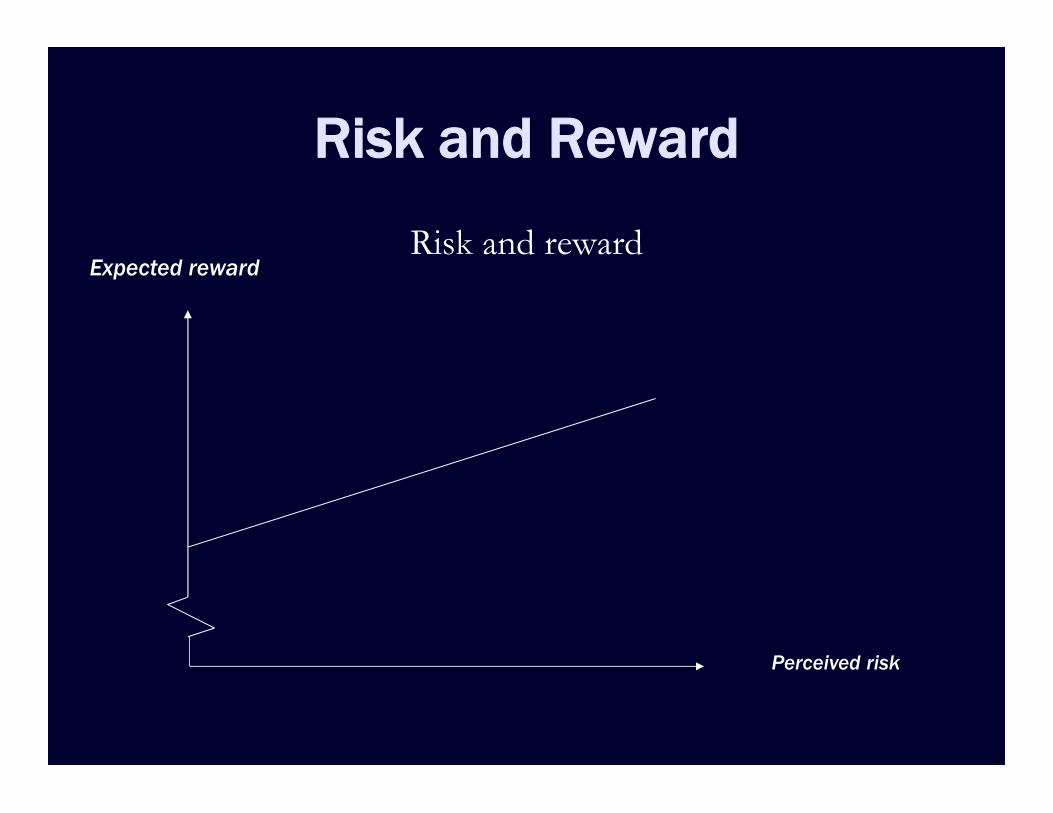
Risk and Reward
Risk and reward
Perceived risk
Expected reward
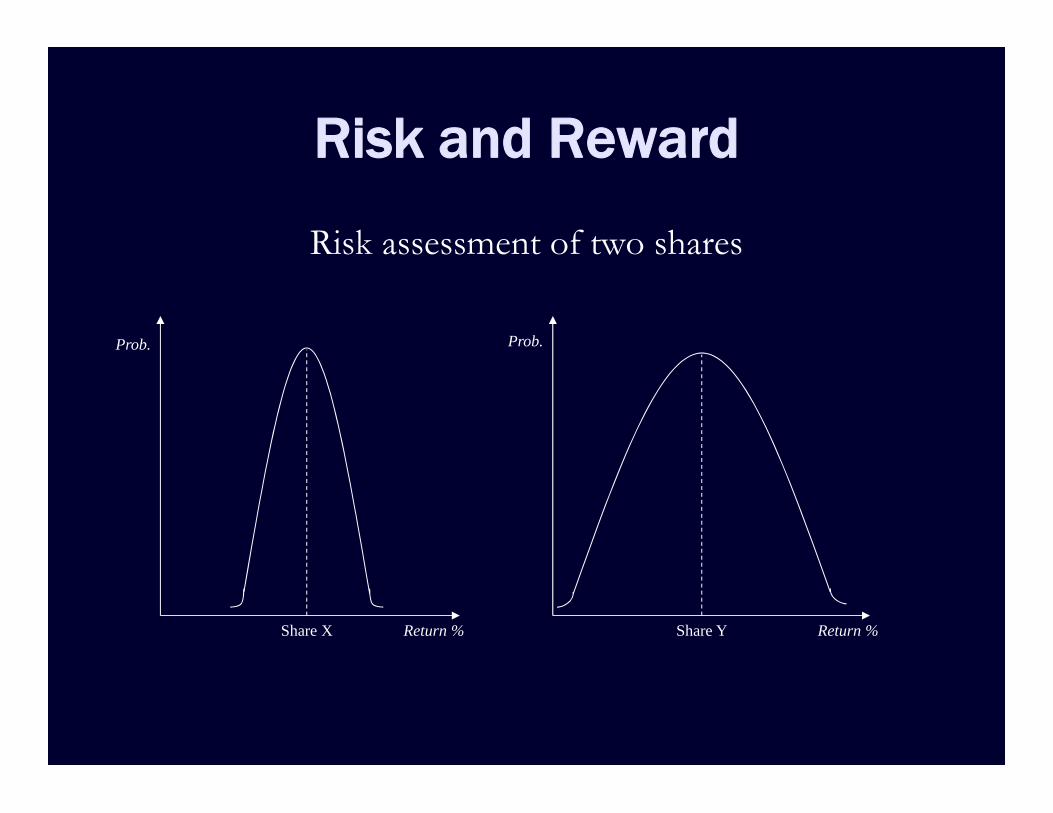
Risk and Reward
Risk assessment of two shares
Share X
Prob. Prob.
Return %Return % Share Y
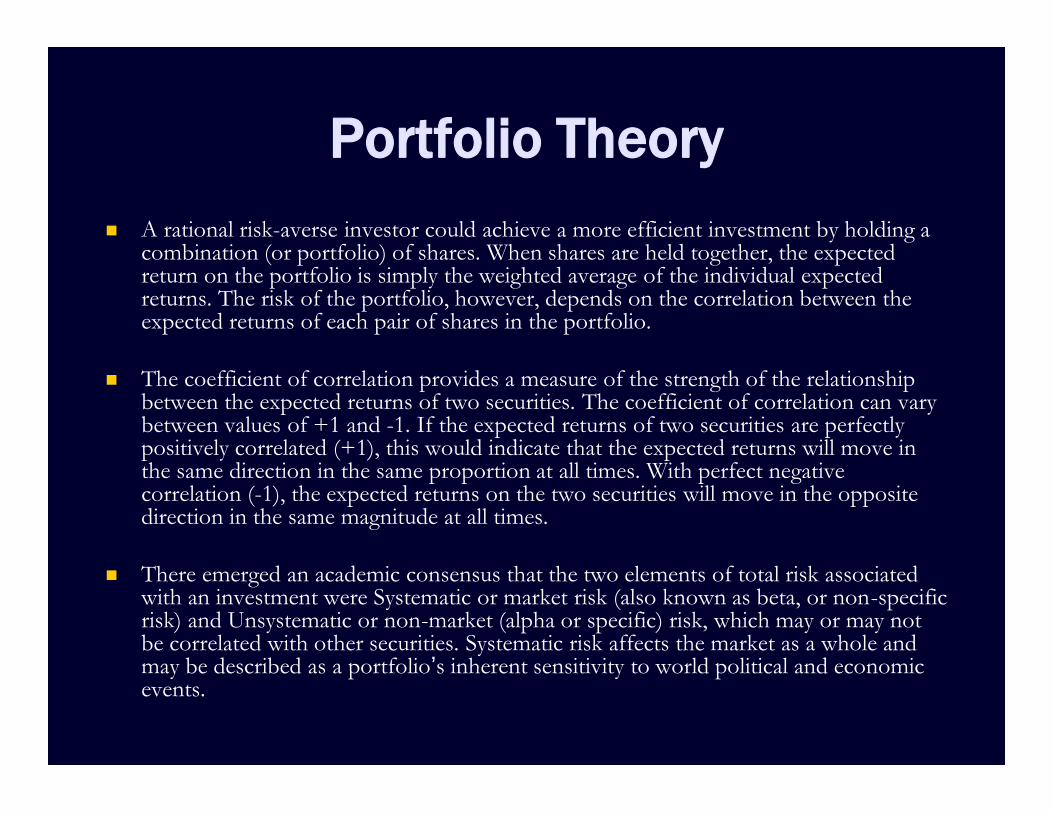
Portfolio Theory A rational risk-averse investor could achieve a more efficient investment by holding a
combination (or portfolio) of shares. When shares are held together, the expectedreturn on the portfolio is simply the weighted average of the individual expectedreturns. The risk of the portfolio, however, depends on the correlation between theexpected returns of each pair of shares in the portfolio.
The coefficient of correlation provides a measure of the strength of the relationshipbetween the expected returns of two securities. The coefficient of correlation can varybetween values of +1 and -1. If the expected returns of two securities are perfectlypositively correlated (+1), this would indicate that the expected returns will move inthe same direction in the same proportion at all times. With perfect negativecorrelation (-1), the expected returns on the two securities will move in the oppositedirection in the same magnitude at all times.
There emerged an academic consensus that the two elements of total risk associatedwith an investment were Systematic or market risk (also known as beta, or non-specificrisk) and Unsystematic or non-market (alpha or specific) risk, which may or may notbe correlated with other securities. Systematic risk affects the market as a whole andmay be described as a portfolio’s inherent sensitivity to world political and economicevents.
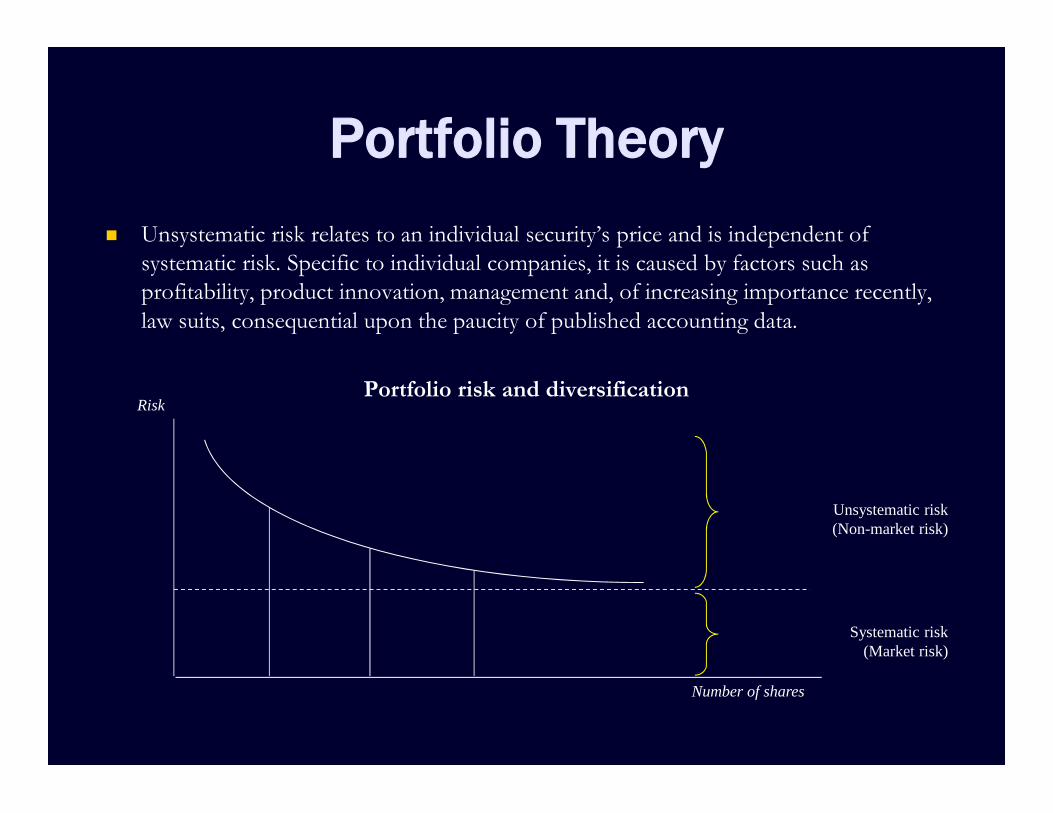
Portfolio Theory Unsystematic risk relates to an individual security’s price and is independent of
systematic risk. Specific to individual companies, it is caused by factors such asprofitability, product innovation, management and, of increasing importance recently,law suits, consequential upon the paucity of published accounting data.
Portfolio risk and diversification
Unsystematic risk(Non-market risk)
Systematic risk(Market risk)
Number of shares
Risk
The capital asset pricing model In the previous section we saw that risk could be reduced by
investing in a portfolio of securities. The total risk involved inany one investment is the sum of the impact of all the risk thatmight affect the return on a specific investment. The CAPMwould argue that investors do not need to suffer total riskinherent with individual investments as this could be reduced byholding a diversity of investments within a portfolio. The returnfrom a single investment in an ice-cream company will be subjectto changes in the weather – sunny weather producing goodreturns, cold weather poor returns. By itself the investment couldbe considered a high risk. If a second investment were made inan umbrella company which is also subject to weather changes,but in the opposite way, then the return from the portfolio ofthe two investments will have a much-reduced risk level. Thisprocess is known as diversification, and when continued canreduce portfolio risk to a minimum.
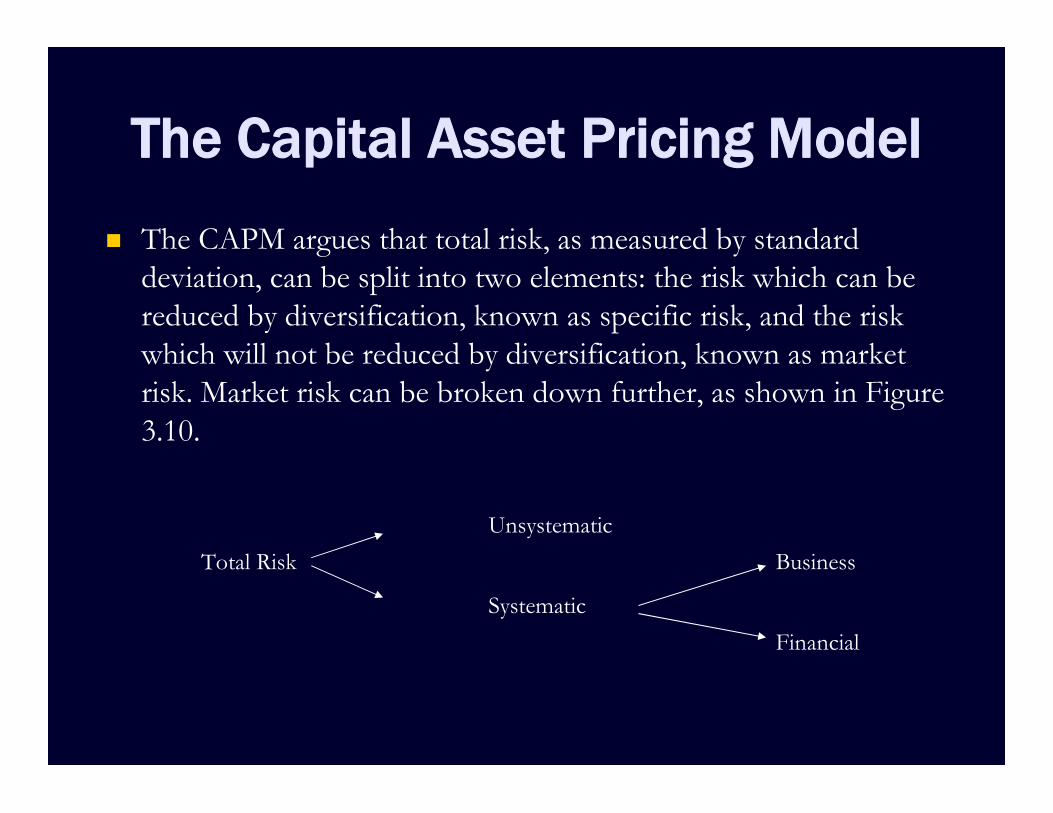
The Capital Asset Pricing Model The CAPM argues that total risk, as measured by standard
deviation, can be split into two elements: the risk which can bereduced by diversification, known as specific risk, and the riskwhich will not be reduced by diversification, known as marketrisk. Market risk can be broken down further, as shown in Figure3.10.
UnsystematicTotal Risk Business
SystematicFinancial
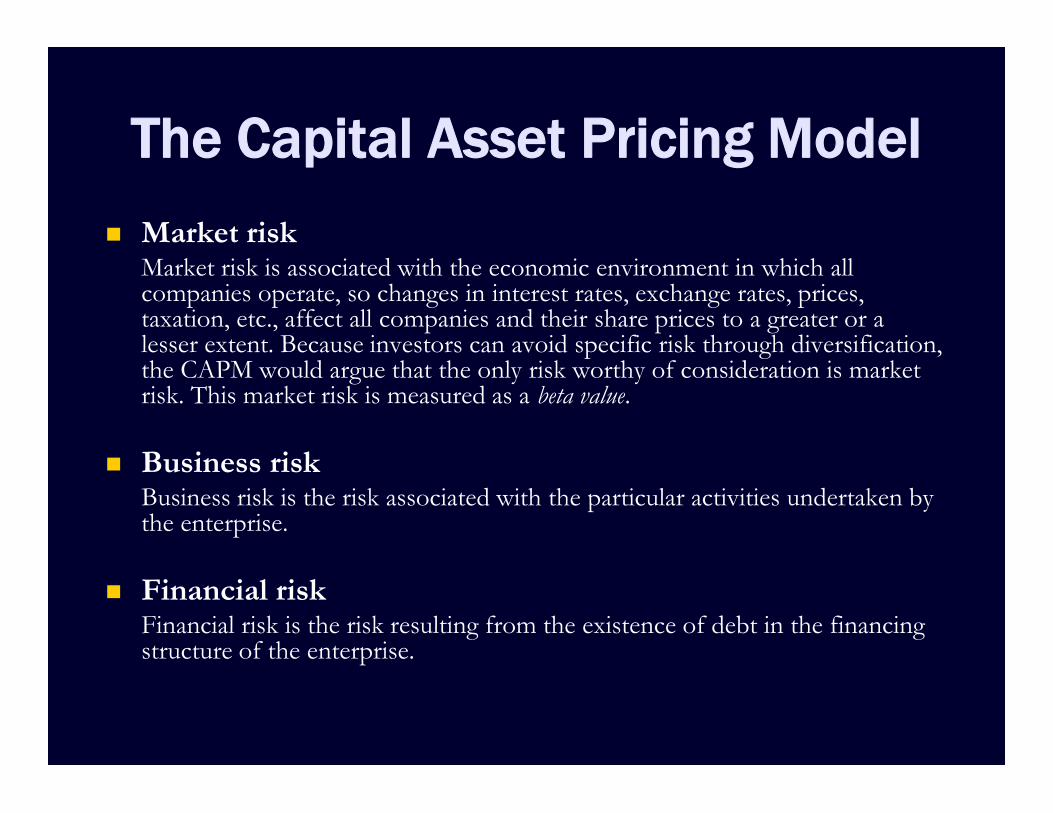
The Capital Asset Pricing Model Market risk
Market risk is associated with the economic environment in which allcompanies operate, so changes in interest rates, exchange rates, prices,taxation, etc., affect all companies and their share prices to a greater or alesser extent. Because investors can avoid specific risk through diversification,the CAPM would argue that the only risk worthy of consideration is marketrisk. This market risk is measured as a beta value.
Business riskBusiness risk is the risk associated with the particular activities undertaken bythe enterprise.
Financial riskFinancial risk is the risk resulting from the existence of debt in the financingstructure of the enterprise.
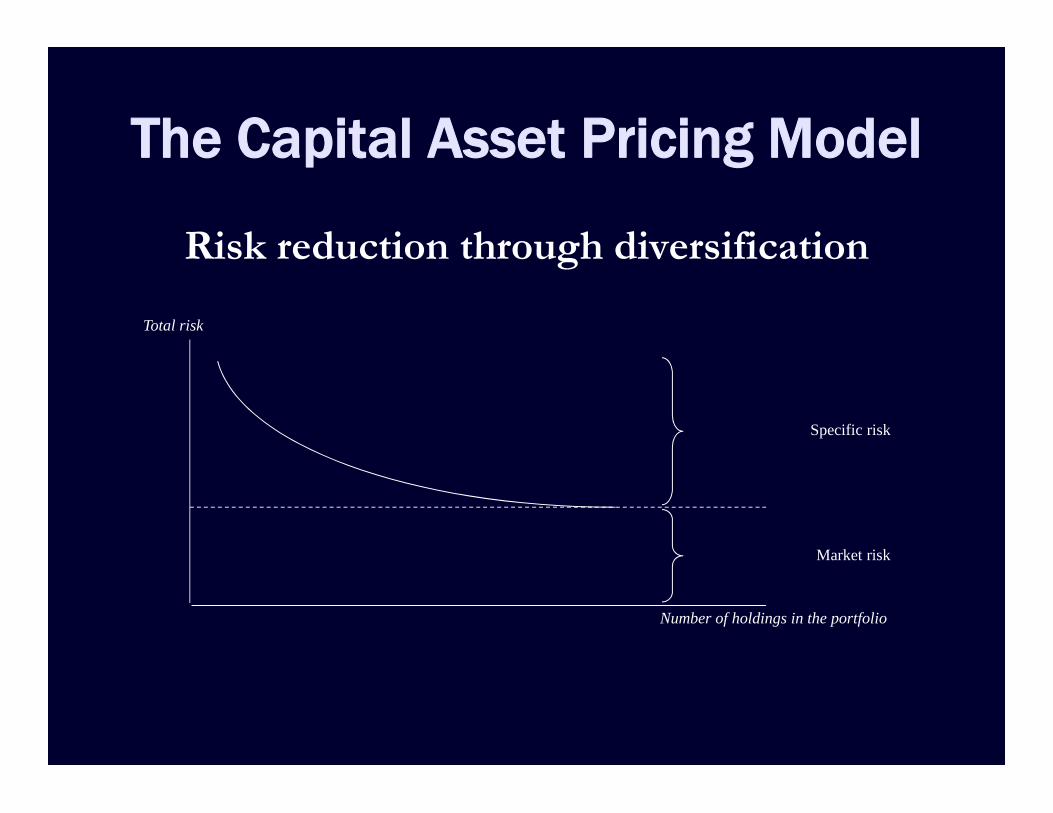
The Capital Asset Pricing Model
Risk reduction through diversification
Specific risk
Market risk
Number of holdings in the portfolio
Total risk
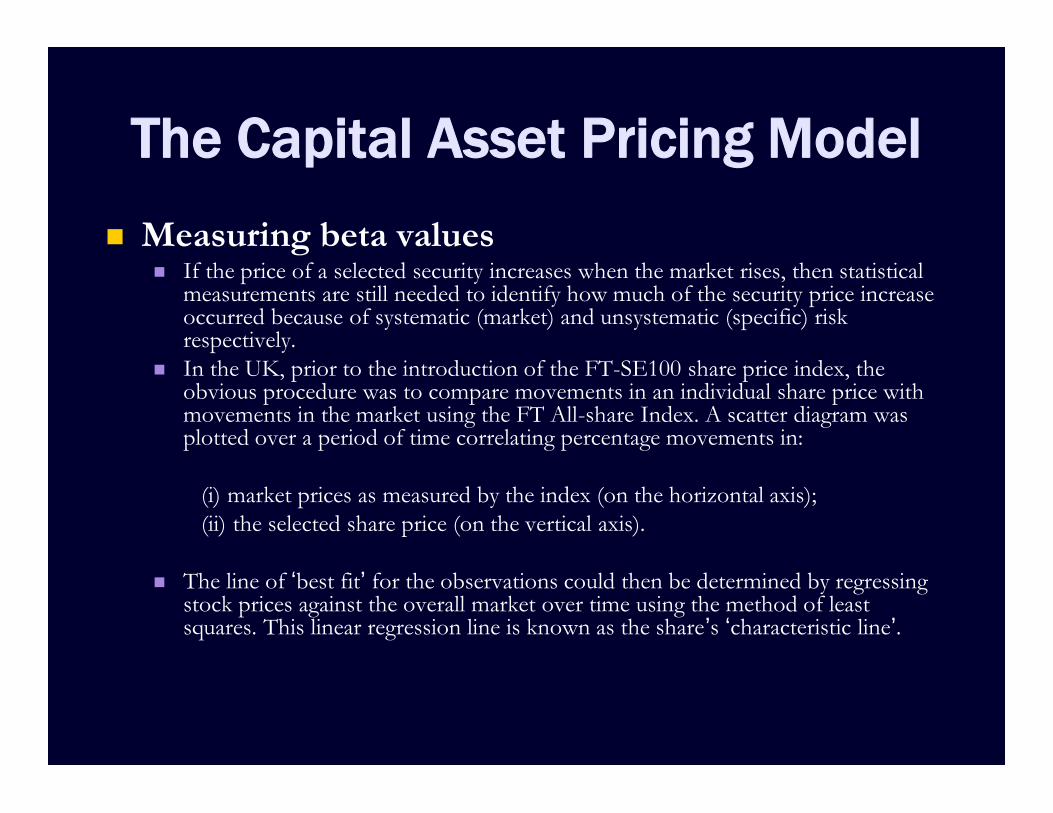
The Capital Asset Pricing Model Measuring beta values
If the price of a selected security increases when the market rises, then statisticalmeasurements are still needed to identify how much of the security price increaseoccurred because of systematic (market) and unsystematic (specific) riskrespectively.
In the UK, prior to the introduction of the FT-SE100 share price index, theobvious procedure was to compare movements in an individual share price withmovements in the market using the FT All-share Index. A scatter diagram wasplotted over a period of time correlating percentage movements in:
(i) market prices as measured by the index (on the horizontal axis);(ii) the selected share price (on the vertical axis).
The line of ‘best fit’ for the observations could then be determined by regressingstock prices against the overall market over time using the method of leastsquares. This linear regression line is known as the share’s ‘characteristic line’.
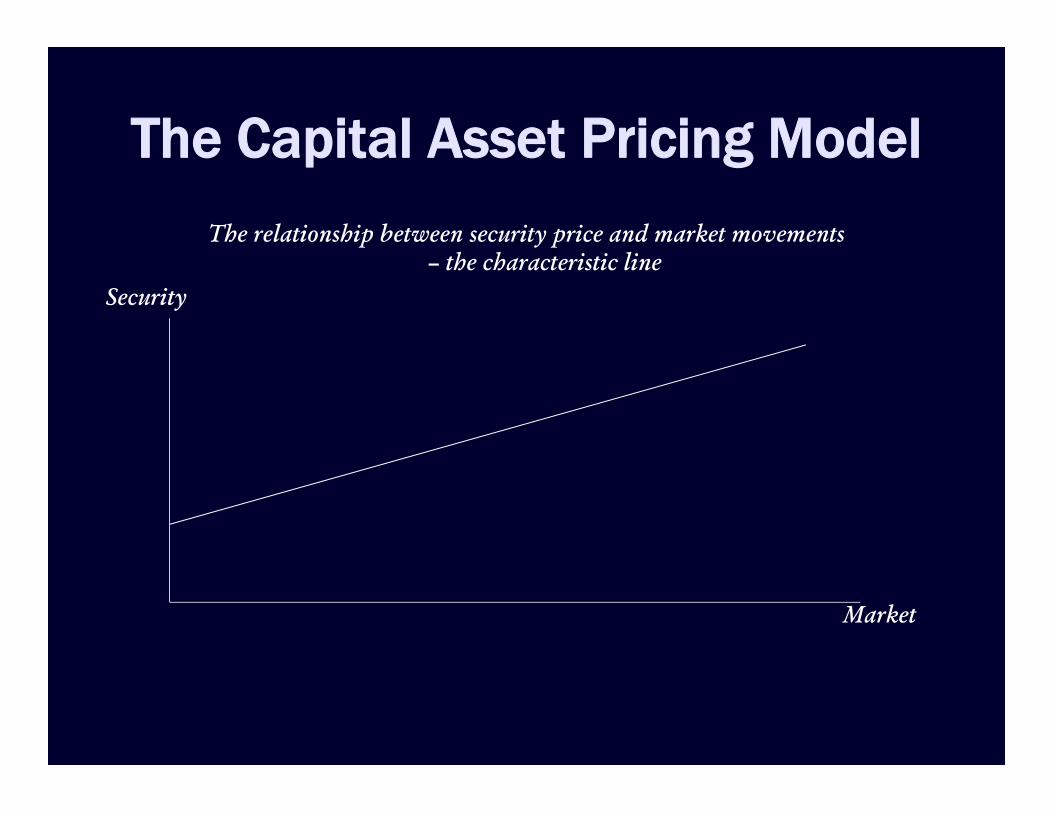
The Capital Asset Pricing Model
Market
The relationship between security price and market movements– the characteristic line
Security
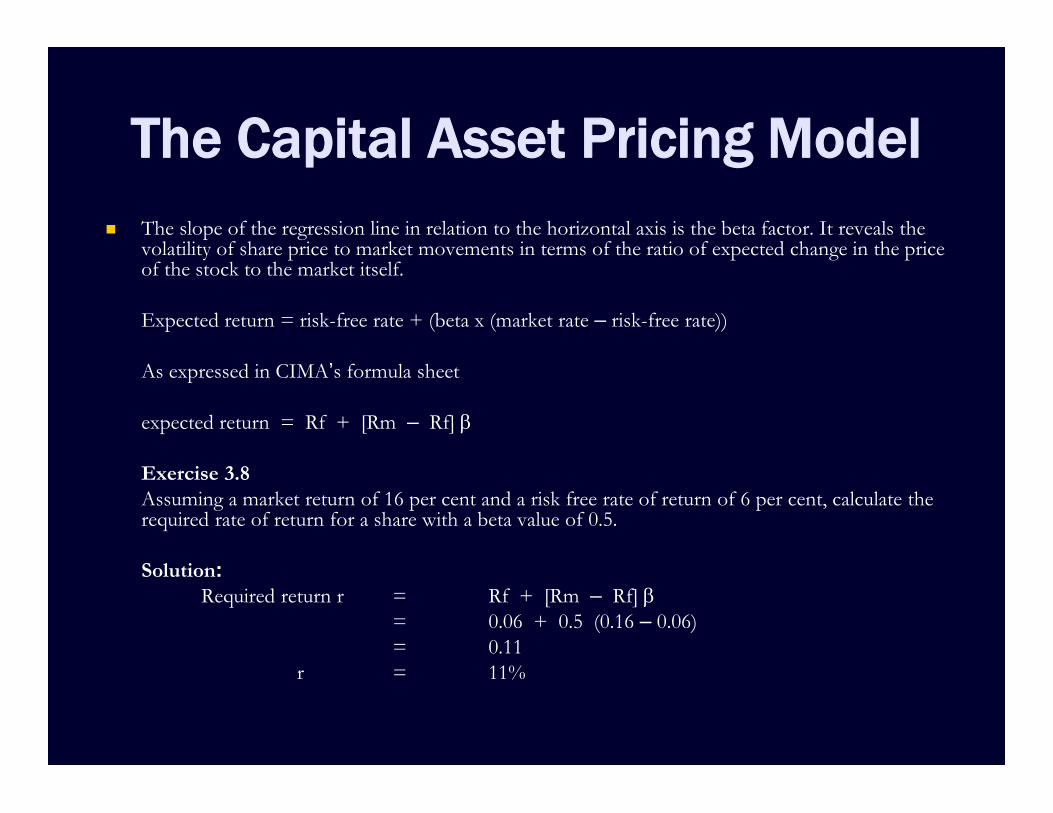
The Capital Asset Pricing Model The slope of the regression line in relation to the horizontal axis is the beta factor. It reveals the
volatility of share price to market movements in terms of the ratio of expected change in the priceof the stock to the market itself.
Expected return = risk-free rate + (beta x (market rate – risk-free rate))
As expressed in CIMA’s formula sheet
expected return = Rf + [Rm – Rf]
Exercise 3.8Assuming a market return of 16 per cent and a risk free rate of return of 6 per cent, calculate therequired rate of return for a share with a beta value of 0.5.
Solution:Required return r = Rf + [Rm – Rf]
= 0.06 + 0.5 (0.16 – 0.06)= 0.11
r = 11%
The Capital Asset Pricing Model
Using the CAPM as an investment tool Beta is a measure of responsiveness of the returns for a particular
investment when compared to the average market return, as summarisedin the Financial Times All Share Index. If the average market returnmoves up or down by (say) 10 per cent and the returns for a particularinvestment also move up and down by 10 per cent in parallel with marketmovements, then that investment is said to have a beta of 1.0 (10% ÷10%).
Such an investment shadows market movements and has identical risk onthe market as a whole. If the average market return moves up or down by(say) 20 per cent and the returns for a particular investment move up anddown by 15 per cent, then that investment is said to have a beta of 0.75(15% ÷ 20%). Such an investment is less risky than the market because itsoftens the impact of changes in market returns.
The Capital Asset Pricing Model
Using the CAPM as an investment tool The three key variables – rf, rm and beta – can be quantified from data
available from the market. The beta for a particular investment is availablefrom the London Business School Risk Analysis Service, which providesbetas and other data on all quoted UK company shares. The risk-free rateof interest (rf) is the expected rate for short-term government securities.The average return to the market (rm) can be calculated from theFinancial Times Actuaries All Share Index.
ExampleIf an investor was considering an investment in a company whose quotedordinary shares had a beta of 1.12 with the three-month Treasury Bill ratecurrently at 12 per cent and the average market return being 20 per cent,then the expected return from such an investment would be:
r = rf + (rm – rf)= 12% + 1.12 (20% – 12% ) = 20.96%
The Capital Asset Pricing Model Criticisms of the CAPM
As with most financial theories, there are a number of difficulties in putting them intopractice, and CAPM is no exception in this respect.Consider the following problems.
CAPM is a single-period model. CAPM ignores transaction costs. Although betas can be based on a very large number of observations over time, it must be
remembered that these are all related to the past, while future investment decisions areseldom made satisfactorily by using only information based specifically on the past.
Even within one year, there can be significant variations from the mean in respect of marketreturns and even in risk-free returns, so that it is often quite difficult to determine the excessreturn (rm – rf) or even the risk-free rate which is itself likely to vary for macroeconomicreasons.
CAPM depends on an efficient investment market, so that if such a market hasimperfections it is more difficult for investors to eliminate specific risk from their portfolios.
The assumption that well-diversified portfolios are subject only to systematic risk can also bequestioned.