Embed Size (px)
Citation preview

rpsgroup.com/uk
[Report Title]
Noise Assessment for Peaking Plant Facility
Saltholme North, Middlesbrough
For Statera Energy Limited
Report No. JAT10500-REPT-07-R0
04 September 2018

Noise Assessment for Peaking Plant Facility
JAT10500-REPT-07-R0 rpsgroup.com/uk 04/09/2018
Quality Management
Prepared by: Jon Baldwin
BSc (Hons) MIOA
Senior Consultant – Acoustics
04/09/2018
Reviewed, Checked & Authorised by:
Simon Stephenson
BSc (Hons), CEng, MIOA, ASA
Technical Director – Acoustics 04/09/2018
Report number: JAT10500-REPT-07-R0 Date of issue: 04/09/2018
Document file path:
O:\Jobs_10000-11000\10500t\3. PPF Sites\Saltholme\Rev0\JAT10500_Saltholme North_Rev1_20180904.docx
Revision History
Rev Date Status Reason for revision Additional comments
0 04/09/2018 Issue - -
Calculations or models filename, location or link: O:\Jobs_10000-11000\10500t\3. PPF Sites\Saltholme\Modelling
Prepared by: Jon Baldwin
BSc (Hons) MIOA
Senior Consultant – Acoustics
23/08/2018
Checked by: Stephen Scott
BEng (Hons) MIOA
Senior Consultant – Acoustics
31/08/2018
DISCLAIMER
RPS has used reasonable skill and care in completing this work and preparing this report, within the terms of its brief and contract
and taking account of the resources devoted to it by agreement with the client. We disclaim any responsibility to the client and
others in respect of any matters outside the stated scope. This report is confidential to the client and we accept no responsibility to
third parties to whom this report, or any part thereof, is made known. The opinions and interpretations presented in this report
represent our reasonable technical interpretation of the data made available to us. RPS accepts no responsibility for data provided
by other bodies and no legal liability arising from the use by other persons of data or opinions contained in this report.
Except for the provision of professional services on a fee basis, RPS does not have a commercial arrangement with any other
person or company involved in the interests that are the subject of this report.
COPYRIGHT © RPS
The material presented in this report is confidential. This report has been prepared for the exclusive use of the client and shall not
be distributed or made available to any other company or person without the knowledge and written consent of the client or RPS.

Noise Assessment for Peaking Plant Facility
JAT10500-REPT-07-R0 rpsgroup.com/uk 04/09/2018
Contents
1 Introduction ............................................................................................................. 1
2 Acoustic Terminology and Concepts.................................................................... 2
3 Summary of Relevant Policy, Consultation, Guidance, Standards and Consultation ................................................................................................................... 5
Noise Policy Statement for England ................................................................................................. 5
National Planning Policy Framework ................................................................................................ 6
Planning Practice Guidance - Noise .................................................................................................. 6
Local Planning Policy ......................................................................................................................... 9
BS 4142: 2014 Methods for rating and assessing industrial and commercial sound ................ 10
World Health Organisation (WHO) Guidelines ............................................................................... 12
Guidance on Assessment of Noise Disturbance upon Birds ....................................................... 13
4 Baseline Conditions ............................................................................................. 15
Site Description and Noise Sensitive Receptors ........................................................................... 15
Sound Monitoring Dates and Locations ......................................................................................... 15
5 Calculations and Modelling ................................................................................. 20
Noise Source Data & Noise Model Methodology ........................................................................... 20
Description of Sound Sources ......................................................................................................... 20
Operating Conditions ........................................................................................................................ 20
Incorporated Mitigation .................................................................................................................... 22
6 Results ................................................................................................................... 23
7 Assessment ........................................................................................................... 24
BS 4142:2014 Assessment ............................................................................................................... 24
Likely Operating Conditions and National Demand ...................................................................... 25
Noise Change and Absolute Noise Level Assessment ................................................................. 26
Noise Impact on Birds at RSPB Saltholme Wetlands .................................................................... 27
Discussion ......................................................................................................................................... 28
8 Cumulative Assessment ...................................................................................... 30
Cumulative Model Results................................................................................................................ 30
BS 4142:2014 Cumulative Assessment .......................................................................................... 30
Cumulative Noise Change and Absolute Noise Level Assessment ............................................ 32
Cumulative Noise Impact on Birds at RSPB Saltholme Wetlands ............................................... 33
9 Uncertainty ............................................................................................................ 34
10 Summary and Conclusions .................................................................................. 35
References

Noise Assessment for Peaking Plant Facility
JAT10500-REPT-07-R0 rpsgroup.com/uk 04/09/2018
Tables, Figures and Appendices
Tables
Table 3.1 Noise Exposure Hierarchy Based On the Likely Average Response ....................................... 8
Table 4.1 Measured Baseline Sound Levels, ST1 ................................................................................. 17
Table 4.2 Measured Baseline Sound Levels, ST2 ................................................................................. 17
Table 4.3 Measured Baseline Sound Levels, ST3 ................................................................................. 17
Table 4.4 Measured Baseline Sound Levels, ST4 ................................................................................. 17
Table 4.5 Baseline Sound Levels Adopted for the Assessment............................................................. 19
Table 5.1 Operational Breakdown of Existing PPF Site ......................................................................... 21
Table 6.1 Predicted Specific Sound Level at Residential Premises ....................................................... 23
Table 6.2 Partial Sound Pressure Levels, dBA ...................................................................................... 23
Table 7.1 BS 4142:2014 Assessment: Initial Estimate of Impact ........................................................... 24
Table 7.2 Ambient Noise Level Change Assessment ............................................................................ 26
Table 7.3 Predicted Octave Band Sound Levels at Wetland Receptor – Saltholme North .................... 27
Table 8.1 Predicted Cumulative Specific Sound Level at NSRs ............................................................ 30
Table 8.2 BS 4142:2014 Assessment: Cumulative Assessment ........................................................... 30
Table 8.3 Ambient Noise Level Change Assessment - Cumulative ....................................................... 32
Figures
Figure 2.1 Refraction of Sound Waves Due to Wind Gradients (increasing wind speed with height)
Figure 5.1 below indicates the anticipated average hours of operation per day in each month.
Figure 5.1 Average Operational Hours per Day Over a Year (Source – Statera Energy Ltd)
Appendices
Appendix A: Statement of qualifications, competency, professional memberships and experience directly
relevant to the application of British Standard 4142:2014 of all personnel contributing to this assessment
Appendix B: Survey Record Sheets
Appendix C: Model Input Data Including Mitigation
Appendix D: Noise Model Methodology

Noise Assessment for Peaking Plant Facility
JAT10500-REPT-07-R0 1 rpsgroup.com/uk 04/09/2018
1 Introduction
1.1 The Acoustics Team at RPS Planning and Environment has been commissioned by Statera
Energy Limited to undertake a noise assessment for a proposed gas-fired peaking plant facility at
land east of Cowpen Bewley Road, Middlesbrough. The site will be known as Saltholme North
and comprise of five gas-fired engines with a total output of 49 MW. The Application Site is
located within the administrative area of Stockton-On-Tees Borough Council (SoTDC).
1.2 The proposed development is for a gas-fired Peaking Plant Facility (PPF), which would operate at
times of peak demand and, in accordance with the requirements of the Environmental Permit
which will be required to operate the site, will be operational for no more than 2,750 hours in any
one year. Typically, the PPF would be switched off but on standby awaiting an instruction from
National Grid (NG) to power-up. These instructions could come as a result of system instability,
which may occur every three to five days and would require the PPF to operate for a period
ranging from one to seven hours, between 08.00 and 20.00 hrs. During the winter ‘peak’ periods
(November to February), the facility may generate energy to reduce stress on the electricity
transmission system; historically, these peaks, and hence additional generating times, last for up
to three hours, between 16.30 and 19.30 hrs.
1.3 Outside of these hours, such as during a major power shortage or system stress event, NG may
require the facility to step-in and provide generating support in an emergency situation. For
example, there have been three NISM (Notice of Insufficient Margin) warnings in the last six
years, all occurring in the early evening at peak demand. The likelihood of the facility being
required to start up at night is extremely low but has been considered in this assessment in
conjunction with use during the more likely times of the day and evening.
1.4 The assessment has been undertaken based upon appropriate information on the proposed
development provided by Statera Energy Limited and manufacturer’s data. RPS is a member of
the Association of Noise Consultants (ANC), the representative body for acoustics consultancies,
having demonstrated the necessary professional and technical competence. The assessment
has been undertaken with integrity, objectivity and honesty in accordance with the Code of
Conduct of the Institute of Acoustics (IOA) and ethically, professionally and lawfully in accordance
with the Code of Ethics of the ANC.
1.5 The technical content of this assessment has been provided by RPS personnel, all of whom are
corporate (MIOA) or non-corporate, associate members (AMIOA) of the IOA (the UK's
professional body for those working in acoustics, noise and vibration). Personnel and individual
qualifications are provided within the Quality Management table at the start of this report and in
Appendix A in accordance with the requirement of Section 12 of British Standard (BS) 4142:2014
‘Methods for rating and assessing industrial and commercial sound’ [1].This report has been peer
reviewed within the RPS team to ensure that it is technically robust and meets the requirements
of our Quality Management System.

Noise Assessment for Peaking Plant Facility
JAT10500-REPT-07-R0 2 rpsgroup.com/uk 04/09/2018
2 Acoustic Terminology and Concepts
2.1 This section provides an overview of the fundamentals of how sound propagates away from a
source.
2.2 Increasing the distance from a sound source normally results in the level of sound getting quieter,
due primarily to the spreading of the sound with distance, analogous to the way in which the
ripples in a pond spread after a stone has been thrown in. Another important factor relates to the
type of ground over which the sound is travelling. Acoustically “soft” ground, (such as grassland,
ploughed fields etc.) will result in lower levels of sound with increasing distance from the sound
source as compared to acoustically “hard” surfaces (e.g. concrete, water, paved areas). The
reduction in sound level depends, however, on the frequency of the sound.
2.3 Wind also affects the way in which sound propagates, with sound levels downwind of a source
being louder than upwind. This is partly due to the sound ‘rays’ being bent either upwards or
downwards by the wind in a similar way that light is bent by a lens, as shown in Figure 2.1.
Varying temperatures in the atmosphere can also cause sound ‘rays’ to be bent, adding to the
complexity of sound propagation.
Figure 2.1 Refraction of Sound Waves Due to Wind Gradients (increasing wind speed with height)
2.4 Another attenuation mechanism is absorption of sound by the molecules of the atmosphere.
Higher pitched (higher frequency) sounds are more readily absorbed than lower pitched (lower
frequency) sounds. The factors affecting the extent to which the sound is absorbed are the
temperature and the water content of the atmosphere (relative humidity).

Noise Assessment for Peaking Plant Facility
JAT10500-REPT-07-R0 3 rpsgroup.com/uk 04/09/2018
2.5 The effect of varying temperature and humidity is usually minimal when compared to other
factors, such as wind and ground effects. However, where high frequency sounds are
encountered, there may well be a significant variation between measured sound levels on
different days due to variations in temperature and humidity.
2.6 When hearing sound which occurs out in the open (e.g. from road traffic, aircraft, birds, wind in
the trees etc.), it is common experience that the sound level is not constant in loudness but is
changing in amplitude all of the time. Therefore, in order to numerically describe the sound levels,
it is beneficial to use statistical parameters. It has become practice to use indices which describe
the sound level which has been exceeded for a certain percentage of the measurement period,
and also an index which gives a form of average of the sound energy over a particular time
interval. The former are termed percentile noise levels and are notated LA90, LA50, LA10 etc. and
the latter is termed the equivalent continuous noise level and is notated by LAeq. It is worth noting
that if the noise level does not vary with time, then all the parameters, in theory, normalise to a
single value.
2.7 With regard to the percentile levels, the LA90 is the sound pressure level which is exceeded for
90% of the measurement time. It is generally used as the measure of background sound (i.e. the
underlying sound, sometimes referred to as background noise) in environmental noise standards.
2.8 The LAeq,T is the A-weighted equivalent continuous noise level and is an energy averaged value of
the actual time varying sound pressure level over the time interval, T. It is used in the UK as a
measure of the noise level of a specific industrial noise source when assessing the level of the
specific source against the background sound. It is also used as a measure of ambient sound
(i.e. the “all-encompassing” sound field).
2.9 Other useful parameters for describing sound levels include the maximum and minimum sound
pressure level encountered over the time period, denote LAmax and LAmin respectively.
2.10 The term 'A' weighting implies a measurement made using a filter with a standardised frequency
response which approximates the frequency response of the human ear at relatively low levels of
sound. The resulting level, expressed in 'A' weighted decibels, or dBA, is widely used in noise
standards, regulations and criteria throughout the world.
2.11 For a more detailed analysis of the frequency characteristics of a sound source, then sound
measurements can be made in bands of frequencies, usually one octave wide. The resulting
levels are termed octave band sound pressure levels. The standard octave band centre
frequencies range from 31.5 Hz (about three octaves below middle ‘C’ on the piano) to 8 kHz
(about five octaves above middle ‘C’). This covers most of the audible range of frequencies
(usually taken to be around 20 Hz to 20 kHz). Octave band sound levels are usually quoted as
linear data – i.e. without an ‘A’ weighting filter being applied. For more detailed analysis
narrowband filters are useful for analysing tones.

Noise Assessment for Peaking Plant Facility
JAT10500-REPT-07-R0 4 rpsgroup.com/uk 04/09/2018
2.12 The term decibel is a relative quantity and should always be referenced to an absolute level. In
this report, all sound pressure levels (denoted LP) are expressed in dB re 20 µPa. Hence, a
sound pressure level of 0 dBA refers to a pressure level of 20 µPa, which is generally taken as
the lowest level of sound that the human ear can detect. A negative dBA value usually implies
that the sound is below the threshold of human hearing.
2.13 Subjectively, and for steady noise levels, a change in noise level of 3 dB is normally just
discernible to the human ear. However, a noise change of less than 3 dB could be discernible if it
has particular frequency characteristics or if it varies in loudness over time. A difference of 10 dB
represents a doubling or halving of subjective loudness.
2.14 Sound power (denoted LW) is the acoustical power radiated from a sound source. The advantage
of using the sound power level, rather than the sound pressure level, in reporting noise from a
source is that the sound power is independent of the location of the source, distance from the
measurement point and environmental conditions. If the sound power of a source is known, then
it is possible to calculate the sound pressure level at a distance away from the source, accounting
for the attenuation due to propagation, as discussed above. Sound power levels are referenced
to power rather than pressure; hence sound power levels are expressed in dB re 1 pW.

Noise Assessment for Peaking Plant Facility
JAT10500-REPT-07-R0 5 rpsgroup.com/uk 04/09/2018
3 Summary of Relevant Policy, Consultation, Guidance,
Standards and Consultation
Noise Policy Statement for England
3.1 The Noise Policy Statement for England (NPSE) [2] sets out the long term overarching vision of
Government noise policy, which is to promote good health and a good quality of life through the
management of noise within the context of Government policy on sustainable development.
3.2 The NPSE is intended to aid decision makers by making explicit the implicit underlying principles
and aims regarding noise management and control that are to be found in existing policy
documents, legislation and guidance.
3.3 Where existing policy and guidance does not provide adequate guidance then decision makers
can go back to the aims of the policy statement to provide overriding guidance. The “Noise Policy
Vision” is to “promote good health and good quality of life through the effective management of
noise within the context of Government policy on sustainable development”. This long term vision
is supported by the following aims, through effective management and control of environmental,
neighbour and neighbourhood noise within the context of Government policy on sustainable
development:
i) avoid significant adverse impacts of health and quality of life;
ii) mitigate and minimise adverse impacts on health and quality of life; and
iii) where possible, contribute to the improvement of health and quality of life.
3.4 The aims of the policy differentiate between noise impacts on health (e.g. sleep disturbance,
hypertension, stress etc.) and noise impacts on quality of life (e.g. amenity, enjoyment of property
etc.). The aims also differentiate between “significant adverse impacts” and “adverse impacts”.
The explanatory note to the NPSE clarifies that a significant adverse impact is deemed to have
occurred if the “Significant Observed Adverse Effect Level” (SOAEL) is exceeded. An adverse
effect, on the other hand, lies between the “Lowest Observed Adverse Effect Level” (LOAEL) and
the SOAEL.
3.5 In assessing whether a development should be permitted, there are therefore four questions that
should be answered, with reference to the principles of sustainable development, viz. will the
development result in:
a) a significant adverse impact to health;
b) a significant adverse impact to quality of life;
c) an adverse impact to health; or
d) an adverse impact to quality of life?

Noise Assessment for Peaking Plant Facility
JAT10500-REPT-07-R0 6 rpsgroup.com/uk 04/09/2018
3.6 If the answer to question a) or b) is yes, then the NPSE provides a clear guidance that the
development should be viewed as being unacceptable (item i. above). If the answer to question
c) or d) is yes, then the NPSE provides a clear steer that the impact should be mitigated and
minimised (item ii. above).
National Planning Policy Framework
3.7 The National Planning Policy Framework (NPPF) [3] sets out the Government’s planning policies
for England and how these are expected to be applied. The emphasis of the Framework is to
allow development to proceed where it can be demonstrated to be sustainable. In relation to
noise, Paragraph 180 of the Framework states:
“180. Planning policies and decisions should ensure that new development is appropriate for
its location taking into account the likely effects (including cumulative effects) of pollution on
health, living conditions and the natural environment, as well as the potential sensitivity of the site
or the wider area to impacts that could arise from the development. In doing so they should::
a) mitigate and reduce to a minimum potential adverse impacts resulting from noise from the
development – and avoid noise giving rise to significant adverse impacts on health and
the quality of life;
b) identify and protect tranquil areas which have remained relatively undisturbed by noise
and are prized for their recreational and amenity value for this reason; and
c) limit the impact of light pollution from artificial light on local amenity, intrinsically dark
landscapes and nature conservation.’
recognise that development will often create some noise and existing businesses wanting to
develop in continuance of their business should not have unreasonable restrictions put on them
because of changes in nearby land uses since they were established; and
identify and protect areas of tranquillity which have remained relatively undisturbed by noise and
are prized for their recreational and amenity value for this reason.”
Planning Practice Guidance - Noise
3.8 Planning Practice Guidance on Noise (PPG-N) [4] provides guidance to local planning authorities
to ensure effective implementation of the planning policy set out in the National Planning Policy
Framework. The PPG-N suggests that planning authorities should ensure that unavoidable noise
emissions are controlled, mitigated or removed at source and establish appropriate noise limits
for extraction in proximity to noise sensitive properties.

Noise Assessment for Peaking Plant Facility
JAT10500-REPT-07-R0 7 rpsgroup.com/uk 04/09/2018
3.9 The PPG-N reiterates general guidance on noise policy and assessment methods provided in the
NPPF, NPSE and British Standards (BSs) and contains examples of acoustic environments
commensurate with various effect levels. Paragraph 006 of the PPG-N explains that:
“The subjective nature of noise means that there is not a simple relationship between noise levels
and the impact on those affected. This will depend on how various factors combine in any
particular situation.”
3.10 According to the PPG-N, factors that can influence whether noise could be of concern include:
the source and absolute level of the noise together with the time of day it occurs;
for non-continuous sources of noise, the number of noise events, and the frequency and
pattern of occurrence of the noise;
the spectral content and the general character of the noise;
the local topology and topography along with the existing and, where appropriate, the
planned character of the area;
where applicable, the cumulative impacts of more than one source should be taken into
account along with the extent to which the source of noise is intermittent and of limited
duration;
whether adverse internal effects can be completely removed by closing windows and, in
the case of new residential development, if the proposed mitigation relies on windows being
kept closed most of the time;
in cases where existing noise sensitive locations already experience high noise levels, a
development that is expected to cause even a small increase in the overall noise level may
result in a significant adverse effect occurring even though little to no change in behaviour
would be likely to occur;
where relevant, Noise Action Plans, and, in particular the Important Areas identified through
the process associated with the Environmental Noise Directive and corresponding
regulations;
the effect of noise on wildlife;
if external amenity spaces are an intrinsic part of the overall design, the acoustic
environment of those spaces; and
the potential effect of a new residential development being located close to an existing
business that gives rise to sound should be carefully considered. This is because existing
sound levels from the business, even if intermittent (for example, a live music venue), may
be regarded as unacceptable by the new residents and subject to enforcement action. To
help avoid such instances, appropriate mitigation should be considered, including
optimising the sound insulation provided by the new development’s building envelope. In

Noise Assessment for Peaking Plant Facility
JAT10500-REPT-07-R0 8 rpsgroup.com/uk 04/09/2018
the case of an established business or community facility, the (‘agent of change’) policy set
out in paragraph 182 of the NPPF should be followed.
3.11 The PPG-N provides a relationship between various perceptions of noise, effect level and
required action in accordance with the NPPF. This is reproduced in Table 3.1, below.
Table 3.1 Noise Exposure Hierarchy Based On the Likely Average Response
Perception Examples of Outcomes Increasing Effect Level Action
Not noticeable
No Effect No Observed Effect No specific measures required
Noticeable and
not intrusive
Noise can be heard, but does not cause any change in behaviour or attitude. Can slightly affect the
acoustic character of the area but not such that there is a perceived change in the quality of life.
No Observed Adverse Effect
No specific measures required
Lowest Observed Adverse Effect Level
Noticeable and
intrusive
Noise can be heard and causes small changes in behaviour and/or attitude, e.g. turning up volume of television; speaking more loudly; where there is no alternative ventilation, having to close windows for
some of the time because of the noise. Potential for some reported sleep disturbance. Affects the
acoustic character of the area such that there is a perceived change in the quality of life.
Observed Adverse Effect Mitigate and reduce to a minimum
Significant Observed Adverse Effect Level
Noticeable and
disruptive
The noise causes a material change in behaviour and/or attitude, e.g. avoiding certain activities during
periods of intrusion; where there is no alternative ventilation, having to keep windows closed most of the time because of the noise. Potential for sleep
disturbance resulting in difficulty in getting to sleep, premature awakening and difficulty in getting back to sleep. Quality of life diminished due to change in
acoustic character of the area.
Significant Observed Adverse Effect
Avoid
Noticeable and very
disruptive
Extensive and regular changes in behaviour and/or an inability to mitigate effect of noise leading to
psychological stress or physiological effects, e.g. regular sleep deprivation/awakening; loss of
appetite, significant, medically definable harm, e.g. auditory and non-auditory.
Unacceptable Adverse Effect
Prevent
3.12 The PPG-N describes noise that is not noticeable to be at levels below the No Observed Effect
Level (NOEL). It describes exposures that are noticeable but not to the extent there is a
perceived change in quality of life as below the LOAEL and need no specific mitigation measures.
Therefore, the audibility of noise from a development is not, in itself, a criterion to judge noise
effects that is commensurate with national planning policy.
3.13 The PPG-N suggests that noise exposures above the LOAEL cause small changes in behaviour.
Examples of noise exposures above the LOAEL provided in the PPG-N include having to turn up
the volume on the television; needing to speak more loudly to be heard; where there is no
alternative ventilation, closing windows for some of the time because of the noise; or, a potential

Noise Assessment for Peaking Plant Facility
JAT10500-REPT-07-R0 9 rpsgroup.com/uk 04/09/2018
for some reported sleep disturbance. In line with the NPPF and NPSE, the PPG-N states that
consideration needs to be given to mitigating and minimising effects above the LOAEL but taking
account of the economic and social benefits being derived from the activity causing the noise.
3.14 The PPG-N suggests that noise exposures above the SOAEL cause material changes in
behaviour. Examples of noise exposures above the SOAEL provided in the PPG-N are, where
there is no alternative ventilation, keeping windows closed for most of the time or avoiding certain
activities during periods when the noise is present; and/or there is a potential for sleep
disturbance resulting in difficulty in getting to sleep, premature awakening and difficulty in getting
back to sleep. In line with the NPPF and NPSE, the PPG-N states that effects above the SOAEL
should be avoided and that, whilst the economic and social benefits being derived from the
activity causing the noise must be taken into account, such exposures are undesirable.
3.15 The PPG-N suggests that a noise impact may be partially offset if the residents of affected
dwellings have access to a relatively quiet part of their dwelling, private external amenity area
and/or external public or private amenity space nearby.
Local Planning Policy
Stockton-on-Tees Local Plan
3.16 There are no policies within the currently adopted Stockton-on-Tees Local Plan that deal directly
with noise. However, there is saved text contained within the 1997 Local Plan which does refer to
noise. Objective 7 of the Stockton-on-Tess 1997 Local Plan states:
“2.80 To ensure that new development does not reverse the improvements to environmental
quality already made, all proposals likely to cause noise, grit, dust, fumes, smoke or vibration
will be referred to the relevant pollution control agency for advice. Any controls necessary will be
secured through the use of planning conditions or legal agreements.”
3.17 The emerging Local Plan has yet to be formally adopted by the Council, however, it was subject
to consultation in late 2016 and is expected to be fully adopted in Summer 2018. The document
contains the following Policies which reference noise:
“Policy SD5 – Environment and Climate Change Strategy
To ensure the conservation and enhancement of the environment alongside meeting the
challenge of climate change the Council will:
1. Conserve and enhance the natural, built and historic environment through a variety of
methods including:
…I. Preventing both new and existing development from contributing to or being put at
unacceptable risk from, or being adversely affected by unacceptable levels of ground, air,
water, light or noise pollution or land instability. Wherever possible proposals should seek to
improve ground, air and water quality.”

Noise Assessment for Peaking Plant Facility
JAT10500-REPT-07-R0 10 rpsgroup.com/uk 04/09/2018
“Policy ENV7 – Ground, Air, Water, Noise and Light Pollution
1. Development proposals that may cause groundwater, surface water, air (including
odour), noise or light pollution either individually or cumulatively will be required to
incorporate measures to prevent or reduce their pollution so as not to cause
unacceptable impacts on human health, amenity or the environment.”
3.18 On the basis of the above, if the assessment shows that the development does not adversely
affect neighbouring uses due to noise, individually or cumulatively, then the development should
be permitted.
3.19 In summary, compliance with the requirements of the local policies outlined above may be
demonstrated if the results of the assessment, indicate that the development will not give rise to
unacceptable adverse noise effects at neighbouring NSRs.
Consultation
3.20 Prior to undertaking the assessment, Jon Baldwin, Senior Consultant in the RPS Acoustics
Team, contacted Stephanie Landles, Environmental Health Officer at SoTDC, to discuss the
proposed survey and assessment methodology. It was confirmed via email, that the proposed
methodology was acceptable.
BS 4142: 2014 Methods for rating and assessing industrial and
commercial sound
3.21 BS 4142:2014 describes a method for rating and assessing sound of an industrial and/or
commercial nature. The standard is applicable to the determination of the rating level of industrial
or commercial sound as well as the ambient, background and residual noise levels for the
purposes of investigating complaints, assessing sound from proposed new, modified or additional
sources or assessing sound at proposed new dwellings or premises used for residential
purposes. The determination of whether a noise amounts to a nuisance is beyond the scope of
the standard, as is rating and assessment of indoor noise levels.
3.22 The standard compares the “rating level” of the noise (i.e. the specific noise level from the site
under investigation adjusted using penalties for acoustic character such as tonality or
impulsiveness) with the pre-existing background sound level.
3.23 BS 4142:2014 requires that the background sound levels adopted for the assessment be
representative for the period being assessed. The Standard recommends that the background
sound level should be derived from continuous measurements of normally not less than
15-minute intervals, which can be contiguous or disaggregated. However, the Standard states
that there is no ‘single’ background sound level that can be derived from such measurements. It
is particularly difficult to determine what is ‘representative’ of the night-time period is because it
can be subject to a wide variation in background sound level between the shoulder night periods.
The accompanying note to paragraph 8.1.4 states that “a representative level ought to account

Noise Assessment for Peaking Plant Facility
JAT10500-REPT-07-R0 11 rpsgroup.com/uk 04/09/2018
for the range of background sounds levels and ought not automatically to be assumed to be
either the minimum or modal value”.
3.24 The standard notes that where background sound levels and rating levels are both “low”,
absolute noise levels might be as, or more, relevant than the margin by which the rating level
exceeds the background, especially at night.
3.25 With regards to the rating correction, paragraph 9.2 of BS 4142:2014 states:
“Consider the subjective prominence of the character of the specific sound at the noise-sensitive
locations and the extent to which such acoustically distinguishing characteristics will attract
attention.”
3.26 The commentary to paragraph 9.2 of BS 4142:2014 suggests the following subjective methods
for the determination of the rating penalty for tonal, impulsive and/or intermittent specific sounds:
“Tonality - For sound ranging from not tonal to prominently tonal the Joint Nordic Method gives a
correction of between 0 dB and +6 dB for tonality. Subjectively, this can be converted to a rating
penalty of 2 dB for a tone which is just perceptible at the noise receptor, 4 dB where it is clearly
perceptible, and 6 dB where it is highly perceptible.
Impulsivity – A correction of up to +9 dB can be applied for sound that is highly impulsive,
considering both the rapidity of the change in sound level and the overall change in sound level.
Subjectively, this can be converted to a penalty of 3 dB for impulsivity which is just perceptible at
the noise receptor, 6 dB where it is clearly perceptible, and 9 dB where it is highly perceptible.
Other sound characteristics - Where the specific sound features characteristics that are neither
tonal nor impulsive, though otherwise are readily distinctive against the residual acoustic
environment, a penalty of 3 dB can be applied.
Intermittency - When the specific sound has identifiable on/off conditions, the specific sound level
ought to be representative of the time period of length equal to the reference time interval which
contains the greatest total amount of on time. … If the intermittency is readily distinctive against
the residual acoustic environment, a penalty of 3 dB can be applied.”
3.27 The standard specifies that:
typically, the greater the difference between rating level and background sound, the greater
the magnitude of impact;
a difference of around +10 dB or more is likely to be an indication of a significant adverse
impact, depending on the context;
a difference of around +5 dB is likely to be an indication of an adverse impact, depending
on the context; and
the lower the rating level is relative to the measured background sound level, the less likely
it is that the specific sound source will have an adverse impact or a significant adverse

Noise Assessment for Peaking Plant Facility
JAT10500-REPT-07-R0 12 rpsgroup.com/uk 04/09/2018
impact. Where the rating level does not exceed the background sound level, this is an
indication of the specific sound source having a low impact, depending on the context.
3.28 Whilst there is a relationship between the significance of impacts determined by the method
contained within BS 4142:2014 and the significance of effects described in the PPGN, there is
not a direct link. It is not appropriate to ascribe numerical rating / background level differences to
LOAEL and SOAEL because this fails to consider the context of the sound, which is a key
requirement of the Standard.
3.29 The significance of the effect of the noise in question (i.e. whether above or below SOAEL and
LOAEL) should be determined on the basis of the initial estimate of impact significance from the
BS 4142:2014 assessment with reference to the examples of outcomes described within the
PPGN and after having considered the context of the sound. It is necessary to consider all
pertinent factors, including:
the absolute level of the sound;
the character and level of the residual sound compared to the character and level of the
specific sound; and
the sensitivity of the receptor and whether dwellings or other premises used for residential
purposes will already incorporate design measures that secure good internal and/or
outdoor acoustic conditions, such as:
o facade insulation treatment;
o ventilation and/or cooling that will reduce the need to have windows open so as to
provide rapid or purge ventilation; and
o acoustic screening.
World Health Organisation (WHO) Guidelines
Guidelines for Community Noise
3.30 The World Health Organisation (WHO) published guidance on the desirable levels of
environmental noise in 2000. In this document, Guidelines for Community Noise (GCN) [5], the
following advice is provided regarding external ambient sound levels during the daytime:
“To protect the majority of people from being seriously annoyed during the daytime, the outdoor
sound level from steady, continuous noise should not exceed 55 dB LAeq on balconies, terraces,
and outdoor living areas. To protect the majority of people from being moderately annoyed during
the daytime, the outdoor sound level should not exceed 50 dB LAeq. Where it is practical and
feasible, the lower outdoor sound level should be considered the maximum desirable sound level
for new development.”

Noise Assessment for Peaking Plant Facility
JAT10500-REPT-07-R0 13 rpsgroup.com/uk 04/09/2018
Night Noise Guidelines
3.31 In 2009 a report was published presenting the conclusions of a World Health Organisation (WHO)
working group responsible for preparing guidelines for exposure to noise during sleep entitled
“Night Noise Guidelines for Europe” [6]. The document can be seen as an extension to the GCN.
Various effects are described including biological effects, sleep quality, and well-being. The
document gives threshold levels for observed effects expressed as Lmax, inside and Lnight, outside. The
Lnight is a year-long average night-time noise level, not taking into account the façade effect of a
building. In an exposed population a noise exposure of 40 dB Lnight, outside is stated as equivalent to
the “lowest observed adverse effect level” for night noise. Above this level adverse health effects
observed are self-reported sleep disturbance, environmental insomnia and increased use of
somnifacient drugs and sedatives. Above 55 dB Lnight, outside cardiovascular effects become the
major public health concern. Threshold levels for waking in the night, and/or too early in the
morning are given as 42 dB LAmax, inside. Lower thresholds are given that may change sleep
structure.
3.32 It is relevant to note that taking into account typical night to night variation in noise levels that will
often occur due to meteorological effects and the effects of a façade, the night noise guidelines
are similar to those previously given in the GCN (an external façade noise level of 45 dB LAeq),
although defined in a different way.
3.33 The major concern in Europe is with respect to noise from transportation systems, and most of
the studies on which these guidelines are based relate to this type of noise source. There can be
no certainty that the same effects will be observed from noise of an industrial nature, but in the
absence of any more detailed information some weight should be attached to the WHO guidance
when assessing industrial noise as well.
Guidance on Assessment of Noise Disturbance upon Birds
3.34 Whilst there is no specific national guidance on the effects of noise disturbance upon birds,
studies have been undertaken to assess the likely cause and thresholds at which disturbance is
likely to occur. In the majority of cases, the concept of disturbance relates to changes in feeding
and roosting behaviour as a result of a noise induced startle effect. In this situation the temporal
character of the noise (i.e. its impulsiveness) is more likely to lead to the disturbance rather than
the absolute noise level. The type of disturbance will be different to that experienced by birds
whose habitat is near a source of continuous noise and where high noise levels may lead to
masking or changing characteristics of bird song with an associated effect on species bonding.
3.35 In both of the above cases, it is important to consider the frequency characteristics of the noise
when determining the potential impact. The A-weighting scale is based on human sensitivity to
noise and as such, cannot automatically be assumed to be representative of the auditory
sensitivity of birds. It is therefore important to review the frequency characteristics of the noise
source in relation to the sensitivity of birds and also to consider the temporal variation of the
different noise sources.

Noise Assessment for Peaking Plant Facility
JAT10500-REPT-07-R0 14 rpsgroup.com/uk 04/09/2018
3.36 Data presented in the NREL Technical Report, ‘Avian Hearing and the Avoidance of Wind
Turbines’ [7], shows the average audiograms for different bird species relative to A-weighting
frequency characteristics and normalised to a frequency of 1 kHz. The data demonstrates that if a
noise with a given sound pressure level had predominantly low frequency characteristics, a bird
would be expected to exhibit less response to this than to a source of noise with the same overall
sound pressure level but with more higher frequency (>500 Hz) characteristics.
3.37 In a series of reports by IECS (2007) to the Saltend Cogeneration Company [8] into the effects of
piling noise on estuarine birds, the monitoring of noise related disturbance to birds was carried
out. The study concluded that on some occasions it was possible to detect some correlation
between construction activities and measured noise levels. It was thought probable that a greater
difference between the LAmax and the LAeq, could indicate a greater possibility for disturbance to
avifauna. Birds were also seen to, in general, accept a wide range of steady state noise level
from between 55 dBA to 85 dBA in some cases.
3.38 On the basis of the above, it is considered appropriate to apply a threshold of 50 dB LAeq below
which the impact of continuous noise is considered not to be significant on birds. However, in
addition, the context of the noise impact, i.e. the temporal variation of the source and the
frequency characteristics of the predicted level, will be taken into consideration as it cannot
automatically be considered that an exceedance over the 50 dB threshold constitutes a
significant impact.

Noise Assessment for Peaking Plant Facility
JAT10500-REPT-07-R0 15 rpsgroup.com/uk 04/09/2018
4 Baseline Conditions
Site Description and Noise Sensitive Receptors
4.1 The proposed site is located to the north of Middlesbrough, in a predominantly industrial area.
The residential Noise Sensitive Receptors (NSRs) in closest proximity to the site are:
dwellings on Charlton Close, located approximately 1.9 km to the west;
dwellings on Cowpen Bewley Road, located approximately 1.1 km to the north west;
dwellings on Cowpen Lane, located approximately 1.1 km to the north west;
Haverton Hill Hotel, located approximately 1.3 km to the south; and
dwellings on Lime Tree Close, located approximately 1.4 km to the south.
4.2 The NSRs identified above have all been considered in the assessment and are considered to be
of medium sensitivity in relation to noise effects. The approximate site location and nearest NSRs
are identified in Figure 1 at the end of this document.
4.3 In addition to the residential receptors listed above, RSPB Saltholme wetlands are located to the
south of the proposed site at a distance of approximately 400 m at the closest point. Due to the
ecological sensitivity of this site, the effects of noise from the proposed PPF have been
considered with respect to noise impact on birds within this area.
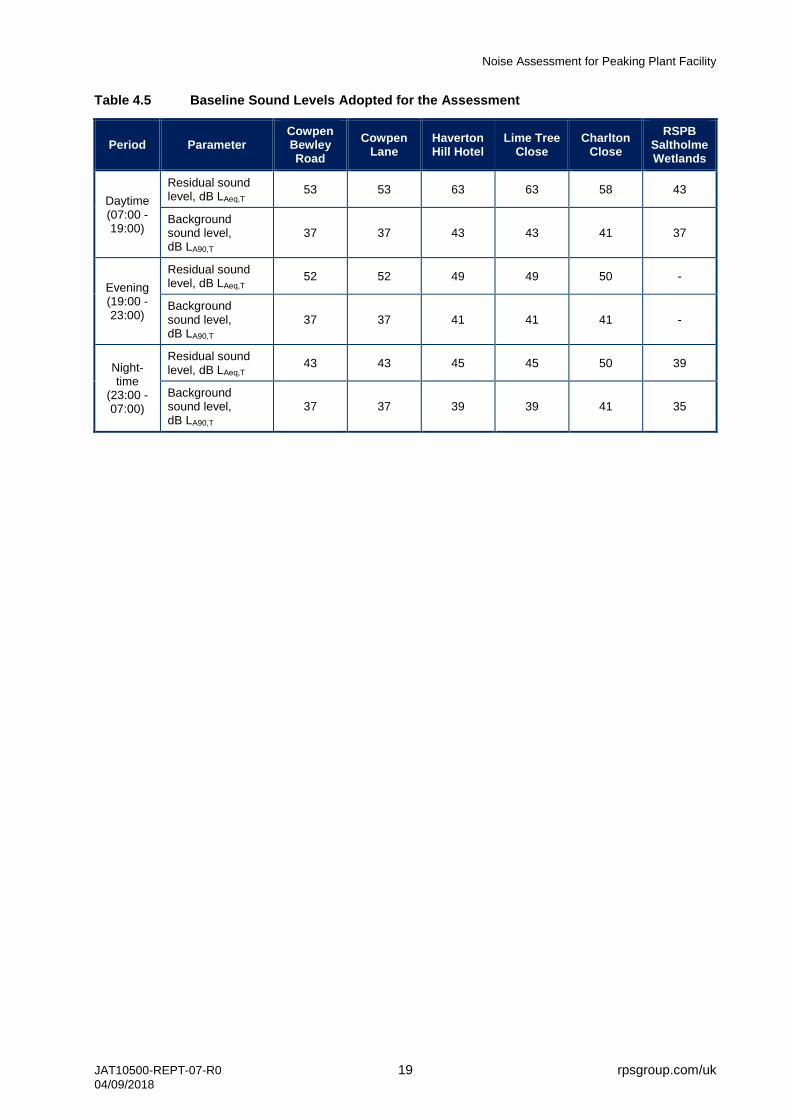
Sound Monitoring Dates and Locations
4.4 To establish baseline conditions in the vicinity of the site, short term attended sound monitoring
was undertaken from 21st to 22
nd August 2018 at four locations around the site. Measurements
comprised of:
3 x 15 minute measurements during the day between 11:30 and 17:00;
2 x 15 minute measurements during the evening between 19:30 and 22:45; and
2 x 15 minute measurements during the night between 01:00 and 04:00.
4.5 The monitoring locations are shown in Figure 1.
4.6 Short-term sound monitoring position 1 (‘ST1’) was located on adjacent to Cowpen Lane,
opposite the junction with Cowpen Bewley Road. The microphone was mounted on a tripod 1.2 m
above ground level in a free-field location (at least 3.5 m from any reflecting surface, excluding
the ground). The main sound source in the area was location road traffic and distant industrial
noise.

Noise Assessment for Peaking Plant Facility
JAT10500-REPT-07-R0 16 rpsgroup.com/uk 04/09/2018
4.7 Short-term sound monitoring position 2 (‘ST2’) was located on the entrance road to the RSPB
Saltholme visitor centre. The microphone was mounted on a tripod 1.2 m above ground level in a
free-field location. Due to issues with access, it was not possible to monitor at a location within
the wetlands area that was representative of the closest point to the proposed PPF site. Data
collected at ST2 is therefore presented for reference only.
4.8 Short-term sound monitoring position 3 (‘ST3’) was located on Line Tree Close, approximately
10 m from the junction with Port Clarence Road. The microphone was mounted on a tripod 1.2 m
above ground level in a free-field location. The main sound source in the area was local road
traffic.
4.9 Short-term sound monitoring position 4 (‘ST4’) was located on Charlton Close, approximately
20 m from the junction with Greenwood Road. The microphone was mounted on a tripod 1.2 m
above ground level in a free-field location. The main sound source in the area was local road
traffic and distant industrial noise.
Instrumentation
4.10 Sound level measurements were made using a ‘Class 1’ Rion NL-52 sound level meter in
accordance with BS 7445-2:1991 [9]. The monitor was programmed to measure various
parameters including the LAeq, LAFmax and LA90 values, logging at 15 minute intervals.
4.11 The equipment calibration level was checked prior to and after the monitoring periods – no
significant deviations were noted.
4.12 The measurements conformed to the requirements of BS 7445:2003 [10].
Meteorological Conditions
4.13 Meteorological conditions were monitored and logged using a handheld anemometer. During the
evening and night-time periods, wind speeds at survey locations ST2, ST3 and ST4 exceeded
5 m/s at times. As such, measurements undertaken during high wind periods have been removed
from the dataset to ensure wind speed did not influenced the measurements.
4.14 There were no recorded periods of precipitation during the survey period.
Results and Discussion
4.15 Survey record sheets for each measurement location are provided in Appendix B.
4.16 A summary of the measured short-term attended baseline sound levels at ST1, ST2, ST3 and
ST4 are presented in Table 4.1, Table 4.2, Table 4.3 and Table 4.4. For the purpose of this
assessment daytime is defined as 07.00 – 19.00 hrs, evening as 19.00 – 23.00 hrs and night-time
as 23.00 – 07.00 hrs.

Noise Assessment for Peaking Plant Facility
JAT10500-REPT-07-R0 17 rpsgroup.com/uk 04/09/2018
Table 4.1 Measured Baseline Sound Levels, ST1
Residual Sound Level,
dB LAeq,T Background Sound Level,
dB LA90,T
Maximum Sound Level,
dB LAmax,T
Day Eve Night Day Eve Night Day Eve Night
Range 52 - 54 46 - 54 43 - 43 37 - 38 38 - 41 38 - 39 69 - 77 70 - 79 53 - 66
Average 53 52 43 38 39 39 73 75 60
Table 4.2 Measured Baseline Sound Levels, ST2
Residual Sound Level,
dB LAeq,T Background Sound Level,
dB LA90,T
Maximum Sound Level,
dB LAmax,T
Day Eve Night Day Eve Night Day Eve Night
Range 44 - 47 0 - 0 42 - 42 40 - 41 0 - 0 38 - 38 58 - 67 0 - 0 56 - 56
Average 46 * 42 40 * 38 62 * 56
* - Insufficient survey data
Table 4.3 Measured Baseline Sound Levels, ST3
Residual Sound Level,
dB LAeq,T Background Sound Level,
dB LA90,T
Maximum Sound Level,
dB LAmax,T
Day Eve Night Day Eve Night Day Eve Night
Range 60 - 65 49 - 49 45 - 46 43 - 53 41 - 41 39 - 42 77 - 87 68 - 68 69 - 69
Average 63 49 45 47 41 40 81 68 69
Table 4.4 Measured Baseline Sound Levels, ST4
Residual Sound Level,
dB LAeq,T Background Sound Level,
dB LA90,T
Maximum Sound Level,
dB LAmax,T
Day Eve Night Day Eve Night Day Eve Night
Range 55 - 61 50 - 50 48 - 51 41 - 48 45 - 45 45 - 48 73 - 88 73 - 73 63 - 66
Average 58 50 50 45 45 46 78 73 64
4.17 As can be seen from Table 4.1 and Table 4.4, measured background sound levels at ST1 and
ST4 were lower during the day than in the evening and at night. Wind direction during the day
was from the south west, this changed to a north westerly direction during the evening.
Contributing noise sources downwind of the survey locations would therefore likely be different
between periods and as such, have had an affect on the baseline noise environment. In addition,
increased background sound levels during the evening and night-time periods may be as a result
of a temporal increase in surrounding activity and not representative of a typical quiet period in
these areas. Consequently, in order to ensure the assessment approach is precautionary and

Noise Assessment for Peaking Plant Facility
JAT10500-REPT-07-R0 18 rpsgroup.com/uk 04/09/2018
robust, it is considered appropriate to assume the lower daytime background LA90 sound level is
representative of all time periods at ST1 and ST4.
Determining Appropriate Baseline Levels
4.18 BS 4142:2014 requires that the background sound levels adopted for the assessment be
representative for the period being assessed. The Standard recommends that the background
sound level should be derived from continuous measurements of normally not less than
15-minute intervals, which can be contiguous or disaggregated. However, the Standard states
that there is no ‘single’ background sound level that can be derived from such measurements. It
is particularly difficult to determine what is ‘representative’ of the night-time period is because it
can be subject to a wide variation in background sound level between the shoulder night periods.
4.19 For the purpose of this assessment it is considered appropriate to use the minimum measured
LA90 values to characterise the background sound levels that have been used in the
BS 4142:2014 assessment.
4.20 Baseline ambient LAeq sound levels have been determined from the logarithmic average of the
15 minute LAeq measurements undertaken in the relevant period.
4.21 It is considered that the attended measurements undertaken at ST1 are representative of the
existing baseline sound environment at dwellings on Cowpen Bewley Road and dwellings on
Cowpen Lane.
4.22 Whilst measurements undertaken at ST2 are representative of the existing noise environment at
the RSPB Saltholme visitor centre, the receptor location for the wetlands area is taken as the
point closest to the proposed PPF site, located approximately 1.5 km west of ST2. For the
purpose of this assessment, a -3 dB correction has been applied to measured data at ST2 in
order to derive a representative baseline sound level at the wetlands receptor location.
4.23 It is considered that the attended measurements undertaken at ST3 are representative of the
existing baseline sound environment at Haverton Hill Hotel and dwellings on Lime Tree Close.
4.24 It is considered that the attended measurements undertaken at ST4 are representative of the
existing baseline sound environment at dwellings on Charlton Close.
4.25 Table 4.5 below presents a summary of the baseline sound levels that have been adopted for the
assessment at the identified receptors.
Noise Assessment for Peaking Plant Facility
JAT10500-REPT-07-R0 19 rpsgroup.com/uk 04/09/2018
Table 4.5 Baseline Sound Levels Adopted for the Assessment
Period Parameter Cowpen Bewley Road
Cowpen Lane
Haverton Hill Hotel
Lime Tree Close
Charlton Close
RSPB Saltholme Wetlands
Daytime (07:00 - 19:00)
Residual sound level, dB LAeq,T
53 53 63 63 58 43
Background sound level, dB LA90,T
37 37 43 43 41 37
Evening (19:00 - 23:00)
Residual sound level, dB LAeq,T
52 52 49 49 50 -
Background sound level, dB LA90,T
37 37 41 41 41 -
Night-time
(23:00 - 07:00)
Residual sound level, dB LAeq,T
43 43 45 45 50 39
Background sound level, dB LA90,T
37 37 39 39 41 35

Noise Assessment for Peaking Plant Facility
JAT10500-REPT-07-R0 20 rpsgroup.com/uk 04/09/2018
5 Calculations and Modelling
Noise Source Data & Noise Model Methodology
5.1 Noise source data for the assessment has been based on manufacturers data provided to the
project team by the equipment manufacturer, Rolls Royce. Where manufacturer’s data are not
available, measurement data obtained by RPS during the operational compliance surveys at the
Creyke Beck gas-fired engine reserve facility in Cottingham has been used to determine
appropriate sound power levels for the chosen equipment.
5.2 Manufacturer’s data on the broadband sound power level of the transformers has been
supplemented by a spectral shape from the RPS Source Term Library.
5.3 The sound power level data used in the assessment are provided in Appendix C, and the noise
model methodology is provided in Appendix D.
Description of Sound Sources
5.4 The design incorporates five gas engines with a total output of 49 MW, with each gas engine
housed within individual enclosures (27.8 (L) x 6.5 (W) x 7.5 (H) m). The engine enclosures will
provide a weighted sound reduction index of 58 dB Rw. Each engine enclosure has an associated
stack/exhaust terminating at 15 m above ground level (AGL), air inlet louvres at the ends of the
enclosures and air outlet louvres on the roof. The gas kiosk provides the connection from the
main gas network to the facility.
5.5 The radiators are positioned 5.5 m AGL. The measurement data used for the assessment are
representative of operating at 100% cooling capacity. As such, the predicted sound levels due to
the radiators are a worst case and representative of the site operating at full capacity with
ambient air temperatures in excess of 30 ºC. These conditions are most unlikely to occur at any
time, particularly during the evening and even less so during the night-time. Consequently, the
assessment is likely to be over precautionary for the evening and night-time periods.
5.6 Based on professional experience and review of available data, all sound sources associated
with the engines, including the air inlets, outlets and radiators, are considered to produce sound
with broadband frequency content. The transformers produce broadband sound with a tonal
component at 100 Hz and harmonics thereof at source.
Operating Conditions
5.7 The proposed development is planned to operate during peak periods of electricity demand or to
prevent system instability (i.e. typically for a period ranging from one to seven hours, between
08.00 and 20.00 hrs). However, there is the potential that the proposed development could be
required to operate during a major power shortage or system stress events (e.g. a NISM) at any

Noise Assessment for Peaking Plant Facility
JAT10500-REPT-07-R0 21 rpsgroup.com/uk 04/09/2018
time of the day or night. It should be noted that the likelihood of the facility being required to start
up at night is extremely low as peak demand does not occur overnight.
Figure 5.1 below indicates the anticipated average hours of operation per day in each month.
Figure 5.1 Average Operational Hours per Day Over a Year (Source – Statera Energy Ltd)
5.8 Table 5.1 presents the yearly breakdown of operating time for an existing PPF site owned by
Statera Energy Ltd.
Table 5.1 Operational Breakdown of Existing PPF Site
Season Period (Hours) Percentage Total Operational Time
Approx. Operational Hours (assuming 1,500 hr yearly total)
Winter
0400 – 0700 1% 15
0700 – 1600 19% 285
1600 – 1900 27% 405
1900 – 2300 6% 90
Summer
0400 – 0700 1% 15
0700 – 1600 22% 330
1600 – 1900 17% 255
1900 – 2300 6% 90
All 2300 - 0400 0.2% 2
5.9 As can be seen from Table 5.1, operational hours during night-time periods totalled 2 hrs over the
course of a year, assuming a 1,500 hr yearly total operating time, at a similar PPF site. Whilst the
Environmental Permit for the proposed development would allow the site to run for a yearly total
0
1
2
3
4
5
6
7
8
Jan Feb Mar Apr May Jun Jul Aug Sep Oct Nov Dec
Op
era
tio
na
l H
ou
rs
Month
Average Operational Hours Per Day Over a Year
Gas Engine Sites: Average No. of Operational Hours per Day

Noise Assessment for Peaking Plant Facility
JAT10500-REPT-07-R0 22 rpsgroup.com/uk 04/09/2018
of 2,750 hrs, it is considered that the majority of additional operating hours would be during the
day and evening periods and, as such, any increase in night-time operation would be minimal.
Incorporated Mitigation
5.10 Various mitigation measures have been incorporated within the design of the PPF with the
specific purpose of minimising noise emissions from the facility and the resultant noise impact at
NSRs; their effectiveness has been demonstrated at the Creyke Beck PPF site in Cottingham
and include:
enclosures surrounding the gas engines - each of the five engines will be housed within
enclosures specified to achieve an overall weighted sound reduction of 58 dB RW;
exhaust silencers will be fitted to each of the gas engine exhausts; these attenuate sound
levels from the exhausts by 53 dB;
all external exhaust ductwork will be acoustically lagged;
enhanced air inlet/outlet louvres - weatherproof louvres will be fitted to the air inlet/outlets
on the building facades; the louvres will attenuate sound levels from the air inlet/outlets by
32 dB; and
low noise transformer - standard transformers have a sound power level of around 87 dBA
or more; the transformer specified for this project has a sound power level of 83 dBA.
5.11 Where feasible, low noise items have been specified to fundamentally minimise generated noise.
Where not feasible, or practicable, measures have been included to attenuate noise emissions
from the site through the use of enclosures and silencers. As such, noise levels at NSRs are
considered to be as low as reasonably practicable.
5.12 It is considered that the above mitigation measures incorporated within the design demonstrate
that Best Available Techniques (BAT) methods have been employed to minimise noise emissions
and, combined, will act to significantly reduce noise levels at NSRs.

Noise Assessment for Peaking Plant Facility
JAT10500-REPT-07-R0 23 rpsgroup.com/uk 04/09/2018
6 Results
6.1 The predicted specific sound levels due to the operation of the facility are provided in Table 6.1.
Table 6.1 Predicted Specific Sound Level at Residential Premises
Location Predicted Specific Sound Level, dBA
Cowpen Bewley Road 34
Cowpen Lane 33
Haverton Hill Hotel 31
Lime Tree Close 30
Charlton Close 26
6.2 The model results indicating the partial sound pressure level contribution from each individual
source of noise from the facility to the first floor level of all receptors is presented in Table 6.2.
Table 6.2 Partial Sound Pressure Levels, dBA
Source Cowpen Bewley Road
Cowpen Lane Haverton Hill
Hotel Lime Tree
Close Charlton
Close
Air Inlet 18 20 17 19 14
Air Outlet 20 24 22 19 14
Engine Enclosure 28 26 25 25 21
Exhaust Outlets & Body 30 26 25 24 22
Radiators 26 28 23 23 14
Transformer 3 7 5 2 -
Gas Kiosk 21 22 15 14 0
6.3 The predicted source contribution levels given in Table 6.2, indicate that the transformer,
provides a negligible contribution to the overall noise level from the PPF. As it is considered that
the only source of tonal noise from the PPF is from the transformer, it is most unlikely that noise
levels at the nearby NSRs would be perceived or characterised as tonal.
6.4 Predicted noise contours are provided in Figure 2 and Figure 3 at the end of this report.

Noise Assessment for Peaking Plant Facility
JAT10500-REPT-07-R0 24 rpsgroup.com/uk 04/09/2018
7 Assessment
BS 4142:2014 Assessment
7.1 An initial estimate of impact undertaken in accordance with BS 4142:2014 is shown in Table 7.1
for the daytime, evening and night-time periods.
7.2 The subjective method for determining rating penalties has been used to determine appropriate
corrections for each receptor and assessment period. It is considered that the specific sound will
not be characterised as intermittent or impulsive, therefore no penalties have been applied for
intermittency or impulsivity. As it is considered that the only source of tonal noise from the PPF is
from the transformer and the contribution from this source to the overall specific sound is
negligible, it is most unlikely that noise levels at the nearby NSRs would be perceived or
characterised as tonal. As such, no penalties have been applied for tonality.
Table 7.1 BS 4142:2014 Assessment: Initial Estimate of Impact
Location
Representative Baseline Sound Levels
Specific Sound Level, dB LS
Rating Penalty,
dB
Rating Level,
dB LAr,Tr
Rating Level
Difference, dB
Background dB LA90,T
Residual dB LAeq,T
Day
Cowpen Bewley Road 37 53 34 0 34 -2
Cowpen Lane 37 53 33 0 33 -4
Haverton Hill Hotel 43 63 31 0 31 -12
Lime Tree Close 43 63 30 0 30 -14
Charlton Close Receptors
41 58 26 0 26 -15
Evening
Cowpen Bewley Road 37 52 34 0 34 -2
Cowpen Lane 37 52 33 0 33 -4
Haverton Hill Hotel 41 49 31 0 31 -9
Lime Tree Close 41 49 30 0 30 -11
Charlton Close Receptors
41 50 26 0 26 -15
Night
Cowpen Bewley Road 37 43 34 0 34 -2
Cowpen Lane 37 43 33 0 33 -4
Haverton Hill Hotel 39 45 31 0 31 -7
Lime Tree Close 39 45 30 0 30 -9
Charlton Close Receptors
41 50 26 0 26 -15
Figures rounded to the nearest decimal place

Noise Assessment for Peaking Plant Facility
JAT10500-REPT-07-R0 25 rpsgroup.com/uk 04/09/2018
7.3 The results of the initial estimate of impact in Table 7.1 show that:
During the daytime, when the PPF is most likely to operate, the rating level is 2 dB below
the background sound level at the most affected receptors, dwellings on Cowpen Bewley
Road. This is 7 dB below the BS 4142:2014 threshold level at which adverse impacts are
likely and 12 dB below the BS 4142:2014 threshold level at which significant adverse
impacts are likely. At the other receptors, predicted rating levels are between 4 dB and
15 dB below background sound levels. The results of the initial estimate of impact during
the daytime are therefore indicative of negligible impacts at all receptors, depending on the
context.
During the evening, the rating level is 2 dB below the background sound level at the most
affected receptors, dwellings on Cowpen Bewley Road. This is 7 dB below the
BS 4142:2014 threshold level at which adverse impacts are likely and 12 dB below the
BS 4142:2014 threshold level at which significant adverse impacts are likely. At the other
receptors, predicted rating levels are between 4 dB and 15 dB below background sound
levels. This is indicative of negligible impacts at all receptors, depending on the context.
During the night-time, when the PPF is least likely to operate, the rating level is 2 dB below
the background sound level at the most affected receptors, dwellings on Cowpen Bewley
Road. This is 7 dB below the BS 4142:2014 threshold level at which adverse impacts are
likely and 12 dB below the BS 4142:2014 threshold level at which significant adverse
impacts are likely. At the other receptors, predicted rating levels are between 4 dB and
15 dB below background sound levels. This is indicative of negligible impacts at all
receptors, depending on the context.
7.4 Whilst the outcome of the BS 4142:2014 assessment shows that a negligible impact is predicted
at NSRs during all time periods, in order to accord with the Standard and provide a thorough
assessment, consideration of the context of the scenario has been undertaken. Consideration of
the context is provided in terms of the assessment of the absolute noise levels and the change in
ambient sound due to the specific sound as addressed further on in this section.
Likely Operating Conditions and National Demand
7.5 Data which are currently available on the likely operating regime of the PPF indicates that it will
only ever run during the night-time in exceptional circumstances when there is insufficient
generation from alternative sources and there are significant unplanned outages in baseload
generation. As can be seen from the operating times of a similar PPF site given in Table 5.1,
night-time operating hours would be minimal.
7.6 The average operational hours per day provided in Figure 5.1 indicate that, during the more
sensitive warmer months (April to September) when people are more likely to have windows
open or to be outside, the PPF will operate for a fewer hours on any given day. The cooler
months (from October to March) are less sensitive because people are more likely to have

Noise Assessment for Peaking Plant Facility
JAT10500-REPT-07-R0 26 rpsgroup.com/uk 04/09/2018
windows closed or to be inside. During the cooler months, the PPF will operate, on average, five
hours per day with a minimum of around three hours per day in December and a maximum of
around seven hours per day in October.
7.7 Local and national demand for energy infrastructure of this type is being driven by changes in
how energy is generated, stored and distributed. Large, centralised, fossil fuel based energy
generation is in decline and the decline is projected to continue. Recent projections indicate
substantial increases in the proportion of energy which will be delivered by renewable energy
sources in the near future [11]; however, renewable energy generation can be intermittent. As
such, the demand for developments of this type which are able to step-in and provide support to
the network in periods of high demand has increased. The proposed PPF will be providing critical
support to meet local demand and to balance the national grid.
Noise Change and Absolute Noise Level Assessment
7.8 The ambient sound levels, with and without the facility in operation, are shown in Table 7.2. For
steady sources of a similar character, a 3 dB change is generally taken as the minimum change
which is perceptible to most people.
Table 7.2 Ambient Noise Level Change Assessment
Location Baseline
Residual Sound Level, dB LAeq,T
Specific Sound Level, dB LAeq,T
Combined Sound Level, dB LAeq,T
Change in Sound Level, dB
Day
Cowpen Bewley Road 53 34 53 +0
Cowpen Lane 53 33 53 +0
Haverton Hill Hotel 63 31 63 +0
Lime Tree Close 63 30 63 +0
Charlton Close Receptors 58 26 58 +0
Evening
Cowpen Bewley Road 52 34 52 +0
Cowpen Lane 52 33 52 +0
Haverton Hill Hotel 49 31 49 +0
Lime Tree Close 49 30 49 +0
Charlton Close Receptors 50 26 50 +0
Night
Cowpen Bewley Road 43 34 43 +1
Cowpen Lane 43 33 43 +0
Haverton Hill Hotel 45 31 46 +0
Lime Tree Close 45 30 46 +0
Charlton Close Receptors 50 26 50 +0
Figures rounded to the nearest decimal place

Noise Assessment for Peaking Plant Facility
JAT10500-REPT-07-R0 27 rpsgroup.com/uk 04/09/2018
7.9 During the night-time period, an increase of 1 dB above baseline residual sound levels would
occur as a result of the operation of the proposed PPF at dwellings on Cowpen Bewley Road. For
a steady sound source with no discernible impulsive or tonal characteristics, a 3 dB change is
generally taken as the minimum change which is perceptible to most people. As such, an
increase above baseline residual sound levels of 1 dB, as seen at dwellings on Cowpen Bewley
Road, is unlikely to be noticeable.
7.10 It has been demonstrated above that the specific sound level is significantly below the existing
ambient noise level during the day and will not contribute to or cause any change to ambient
noise levels. It is therefore considered that sound from the PPF is most unlikely to cause, or
significantly contribute to, any exceedance of the WHO criterion for the onset of annoyance
during the daytime, of 55 dB LAeq. It is therefore considered that the site will not result in an
adverse impact to amenity during the daytime.
7.11 The level for the onset of sleep disturbance during the night-time (i.e. lowest observed adverse
effect level) contained in the WHO Guidance is 45 dB LAeq (façade), equivalent to a free-field level
of 42 dB LAeq. This threshold level is exceeded at all receptors in the absence of the PPF, by up
to 8 dB. The contribution from the PPF at all receptors, however, is negligible and does not result
in an increase to baseline residual sound levels at the majority of receptors with the exception of
Cowpen Bewley Road. It is therefore considered that, whilst WHO guideline levels are already
exceeded for the baseline scenario, the impact from the operation of the PPF during the night on
sleep disturbance will be negligible.
Noise Impact on Birds at RSPB Saltholme Wetlands
7.12 The predicted sound level at the nearest point on the RSPB Saltholme Wetlands to the proposed
PPFs, as a result of the operation of the proposed facility, is 40 dBA. The residual sound level at
this location is assumed to be 43 dB LAeq during the day and 39 dB LAeq at night. The combined
cumulative sound level during the worst case daytime period would be 45 dB LAeq, which is 5 dB
below the 50 dB threshold and can therefore be considered unlikely to result in a significant
impact on nesting birds.
7.13 The spectral shape of the predicted sound level is presented in Table 7.3.
Table 7.3 Predicted Octave Band Sound Levels at Wetland Receptor – Saltholme North
Location
Predicted Overall Sound
Level, dBA
Linear Octave Band Sound Levels, dB
63 Hz 125 Hz 250 Hz 500 Hz 1k Hz 2k Hz 4k Hz
RSPB Saltholme Wetlands
40 61 44 36 31 33 32 20
7.14 As can be seen from Table 7.3, sound emissions from the proposed PPF contain more energy in
the lower frequency bands (<500 Hz). The potential impact on birds is therefore likely to be lower
than would be suggested by the overall dBA value. In addition, the sound source is not

Noise Assessment for Peaking Plant Facility
JAT10500-REPT-07-R0 28 rpsgroup.com/uk 04/09/2018
considered to be impulsive and, as such, it is unlikely that sound from the site would lead to a
startle response.
7.15 Based on the above, it is considered that the operation of the PPF will not result in a significant
impact on nesting birds within the north-west corner of RSPB Saltholme wetlands.
Discussion
7.16 This assessment determines whether the Government’s noise policy aims have been met for a
proposed development.
7.17 It is the daytime and evening periods that are of greatest concern with respect to the impact on
quality of life (amenity, enjoyment of property etc.). This is because people will tend to be indoors
or asleep during the night, whereas, during the day and evening, they are more likely to be using
outdoor spaces for amenity purposes. It should also be noted that the PPF is not expected to
operate frequently during the night-time.
7.18 It has been established that sound arising from the operation of the PPF will not result in ambient
noise level increases at any of the nearest NSRs during the day and evening, and the minor
increase during the night-time at Cowpen Bewley Road (+1 dB) is unlikely to be noticeable. It is
therefore considered that the results of the noise change assessment show that the operation of
the proposed PPF will result in a negligible impact and it is therefore unlikely that this would
seriously affect the health or quality of life of those in close proximity to the site.
7.19 In terms of the absolute noise level assessment, sound from the PPF will not contribute to or give
rise to any annoyance or adverse impacts on NSRs during the daytime or evening.
7.20 In the unlikely event of the PPF operating at night, ambient noise with the PPF in operation will
have a negligible contribution, if any, to ambient noise levels. It is therefore considered that the
operation of the PPF will not result in any significant impact based on WHO absolute noise
criteria for sleep disturbance.
7.21 Taking both the change in noise levels and the absolute sound levels during the day and night
into consideration, it is considered that sound from the facility will not result in any adverse
impacts on the quality of life of residents nearby.
7.22 The BS 4142:2014 initial estimate of impact indicates that sound from the facility is unlikely to
result in any adverse impacts during the day, evening or night-time periods. Taking into account
the results of the assessment and the context of the scenario discussed above (i.e. the likelihood
of operating at night is minimal), the results of the BS 4142:2014 assessment therefore indicate
that no significant adverse impacts are likely at any receptor during any time period.
7.23 The assessment of noise impact on birds has shown that sound arising as a result of the
operation of the PPF will not result in an adverse impact on nesting birds within the north-west
corner of the RSPB Saltholme wetlands area.

Noise Assessment for Peaking Plant Facility
JAT10500-REPT-07-R0 29 rpsgroup.com/uk 04/09/2018
7.24 On the basis of the above, it is concluded that levels of sound arising from the operation of the
proposed PPF will not result in an adverse or significant adverse impact at any of the nearby
noise sensitive receptors and that noise from site has been mitigated and minimised through the
application of best available techniques to be as low as practicable.
7.25 With regard to national and local planning policy, it is considered that the results of the
assessment demonstrate that the proposed PPF has been mitigated to ensure that noise from
the facility will not result in an adverse impact to amenity at the nearby receptors. It is therefore
considered that the development is compliant with the requirements of the NPSE, NPPF, PPG-N,
and Policies SD5 and ENV7 from the emerging Stockton-On-Tees Local Plan.

Noise Assessment for Peaking Plant Facility
JAT10500-REPT-07-R0 30 rpsgroup.com/uk 04/09/2018
8 Cumulative Assessment
8.1 The PPF has been assessed in conjunction with the neighbouring proposed gas-fired PPF,
‘Saltholme South’. The sound power data used to model the adjacent facility is based on the
same sound data and operating conditions as used in this assessment. The two developments
have been modelled in accordance with the methodology provided in Appendix D.
Cumulative Model Results
8.2 The predicted cumulative specific sound levels due to the simultaneous operation of the two
PPFs are provided below in Table 8.1, and predicted noise contours due to the simultaneous
operation of the two proposed PPFs are provided in Figure 3 at the end of this report. The results
indicate that, with both PPFs in operation, predicted sound levels are between 3 dB and 4 dB
higher than with the proposed development alone.
Table 8.1 Predicted Cumulative Specific Sound Level at NSRs
Location Predicted Specific
Sound Level (Saltholme North only) , dBA
Predicted Cumulative Specific Sound Level,
dBA Difference
Cowpen Bewley Road 34 37 +3
Cowpen Lane 33 36 +3
Haverton Hill Hotel 31 35 +4
Lime Tree Close 30 33 +3
Charlton Close Receptors 26 29 +3
BS 4142:2014 Cumulative Assessment
8.3 An initial estimate of impact for the cumulative assessment, undertaken in accordance with
BS 4142:2014, is shown in Table 8.2 for the day, evening and night-time periods.
Table 8.2 BS 4142:2014 Assessment: Cumulative Assessment
Location
Representative Baseline Sound Levels
Specific Sound Level, dB LS
Rating Penalty,
dB
Rating Level,
dB LAr,Tr
Rating Level
Difference, dB
Background dB LA90,T
Residual dB LAeq,T
Day
Cowpen Bewley Road 37 53 37 0 37 0
Cowpen Lane 37 53 36 0 36 -1
Haverton Hill Hotel 43 63 35 0 35 -9
Lime Tree Close 43 63 33 0 33 -10
Charlton Close Receptors
41 58 29 0 29 -12

Noise Assessment for Peaking Plant Facility
JAT10500-REPT-07-R0 31 rpsgroup.com/uk 04/09/2018
Location
Representative Baseline Sound Levels
Specific Sound Level, dB LS
Rating Penalty,
dB
Rating Level,
dB LAr,Tr
Rating Level
Difference, dB
Background dB LA90,T
Residual dB LAeq,T
Evening
Cowpen Bewley Road 37 52 37 0 37 0
Cowpen Lane 37 52 36 0 36 -1
Haverton Hill Hotel 41 49 35 0 35 -6
Lime Tree Close 41 49 33 0 33 -8
Charlton Close Receptors
41 50 29 0 29 -12
Night
Cowpen Bewley Road 37 43 37 0 37 0
Cowpen Lane 37 43 36 0 36 -1
Haverton Hill Hotel 39 45 35 0 35 -4
Lime Tree Close 39 45 33 0 33 -6
Charlton Close Receptors
41 50 29 0 29 -12
Figures rounded to the nearest decimal place
8.4 The results of the cumulative assessment in accordance with BS 4142:2014 indicate that the
predicted rating level would be equal to the background sound level at the worst affected
receptors, dwellings on Cowpen Bewley Road, during the day. At the other receptors, predicted
rating levels are between 1 dB and 12 dB below background sound levels. The results of the
initial estimate of impact during the daytime are therefore indicative of low to negligible impacts at
all receptors, depending on the context.
8.5 During the evening, the predicted rating level would be equal to the background sound level at
the worst affected receptors, dwellings on Cowpen Bewley Road. At the other receptors,
predicted rating levels are between 1 dB and 12 dB below background sound levels. The results
of the initial estimate of impact during the evening are therefore indicative of low to negligible
impacts at all receptors, depending on the context.
8.6 During the night, the predicted rating level would be equal to the background sound level at the
worst affected receptors, dwellings on Cowpen Bewley Road. At the other receptors, predicted
rating levels are between 1 dB and 12 dB below background sound levels. The results of the
initial estimate of impact during the evening are therefore indicative of low to negligible impacts at
all receptors, depending on the context.

Noise Assessment for Peaking Plant Facility
JAT10500-REPT-07-R0 32 rpsgroup.com/uk 04/09/2018
Cumulative Noise Change and Absolute Noise Level Assessment
8.7 The ambient sound levels, with both PPFs in operation, are shown in Table 8.3.
Table 8.3 Ambient Noise Level Change Assessment - Cumulative
Location Baseline
Residual Sound Level, dB LAeq,T
Specific Sound Level, dB LAeq,T
Combined Sound Level, dB LAeq,T
Change in Sound Level, dB
Day
Cowpen Bewley Road 53 37 53 0
Cowpen Lane 53 36 53 0
Haverton Hill Hotel 63 35 63 0
Lime Tree Close 63 33 63 0
Charlton Close Receptors 58 29 58 0
Evening
Cowpen Bewley Road 52 37 52 0
Cowpen Lane 52 36 52 0
Haverton Hill Hotel 49 35 49 0
Lime Tree Close 49 33 49 0
Charlton Close Receptors 50 29 50 0
Night
Cowpen Bewley Road 43 37 44 +1
Cowpen Lane 43 36 43 +1
Haverton Hill Hotel 45 35 46 0
Lime Tree Close 45 33 46 0
Charlton Close Receptors 50 29 50 0
Figures rounded to the nearest decimal place
8.8 During the night-time period, an increase of 1 dB above baseline residual sound levels would
occur as a result of the operation of both PPFs at Cowpen Bewley Road and Cowpen Lane. For a
steady sound source with no discernible impulsive or tonal characteristics, a 3 dB change is
generally taken as the minimum change which is perceptible to most people. As such, an
increase above baseline residual sound levels of 1 dB, as seen at these NSRs, would likely not
be noticeable.
8.9 With regard to absolute sound levels presented in Table 8.3, the predicted combined ambient
sound levels with the PPF in operation at Cowpen Bewley Road and Cowpen Lane will be 2 dB
lower than the 55 dB LAeq noise level specified in WHO guidance for the onset of annoyance
during the. Whilst the combined sound level at Haverton Hill Hotel, Lime Tree Close and Charlton
Close are 3 - 8 dB above the WHO guideline level during the day, the contribution from the PPF
does not result in a change in sound level at these receptors because the specific sound is more
than 10 dB lower than the residual. It is therefore considered that cumulative sound from the two

Noise Assessment for Peaking Plant Facility
JAT10500-REPT-07-R0 33 rpsgroup.com/uk 04/09/2018
PPFs is most unlikely to cause, or significantly contribute to, any exceedance of the WHO
criterion. It is therefore considered that the site will not result in an adverse impact to amenity
during the daytime.
8.10 During the night, ambient noise with the two PPFs in operation will have a negligible contribution,
if any, to ambient noise levels. It is therefore considered that the cumulative operation of the
PPFs will not result in any significant impact based on WHO absolute noise criteria for sleep
disturbance.
8.11 Based on the above, it is considered that, whilst the cumulative effects of the operation of both
PPFs increase the predicted specific noise levels, noise from the two proposed PPFs will not
result in an adverse or significant adverse impact at any of the nearby NSRs.
Cumulative Noise Impact on Birds at RSPB Saltholme Wetlands
8.12 The predicted sound level at the nearest point on the RSPB Saltholme Wetlands to the proposed
PPFs, as a result of the cumulative operation of the proposed facilities, is 44 dBA. The residual
sound level at this location is assumed to be 43 dB LAeq during the day and 39 dB LAeq at night.
The combined cumulative sound level during the worst case daytime period would be 47 dB LAeq,
which is 3 dB below the 50 dB threshold and can therefore be considered unlikely to result in a
significant impact on nesting birds.
8.13 As can be seen from Table 7.3, sound emissions from the proposed PPFs have a predominantly
low frequency characteristic. The potential impact on birds is therefore likely to be lower than
would be suggested by the overall dBA value. In addition, the results of the BS 4142:2014
assessment determined that the sound source is not considered to be impulsive or intermittent
and as such, the temporal variation in sound levels from site would be negligible.
8.14 Based on the above, it is considered that the cumulative operation of the two PPFs will not result
in a significant impact on nesting birds within the north west corner of RSPB Saltholme wetlands.

Noise Assessment for Peaking Plant Facility
JAT10500-REPT-07-R0 34 rpsgroup.com/uk 04/09/2018
9 Uncertainty
9.1 In all assessments, it is good practice to consider uncertainty which can arise from a number of
different aspects. There are degrees of uncertainty associated with: instrumentation used for
surveying; measurement technique and the variables influencing the measurement results such
as transmission path and weather conditions; source terms used for modelling; calculation
uncertainty; assessment uncertainty; and the subjective response of residents to noise sources.
9.2 Uncertainty due to instrumentation has been significantly reduced with the introduction of more
modern instrumentation and is reduced further by undertaking field calibration checks on sound
level meters before and after each measurement period and ensuring that all instrumentation is
within accepted laboratory calibration intervals.
9.3 Due to issues with access to RSPB Saltholme, a proxy measurement location was used to
determine appropriate baseline sound levels at the receptor representative of the worst affected
wetlands area. It is considered that due to the nature of the surrounding area and the fact that
a -3 dB correction factor has been applied, the baseline levels assumed at this receptor are
robust. Based on professional judgement including substantial experience of acquiring and
analysing baseline data for numerous sites in various locations, and a desk based review of the
site and surrounding area, it is considered that the baseline data acquired during the survey is
typical of the area.
9.4 Calculation uncertainty and assessment uncertainty have been reduced by peer review of all
baseline data, model input data, model results and assessment calculations, and by using the
appropriate level of precision at each stage of the assessment calculations.
9.5 A quantitative assessment has been undertaken based on source levels provided by the plant
manufacturer, measurement data, and data from the RPS Source Term Library. Where
assumptions have been made they have favoured a worst case scenario.
9.6 With regard to subjective response, the noise standards adopted for the assessment will have
been based upon the subjective response of the majority of the population or will be based upon
the most likely response of the majority of the population. This is considered to be the best that
can be achieved in a population of varying subjective response which will vary dependent upon a
wide range of factors.
9.7 Whilst there are uncertainties in the assessment of noise impact on local aviflora, resulting from
variability of response of different species and habituation, every effort has been made to ensure
the assessment methodology is robust and uncertainty has been minimised through the
consideration of context.
9.8 All areas and potential consequences of uncertainty have been minimised at every stage of the
assessment process. On the basis of the above, and in the context of subjective response, the
effects of uncertainty on the assessment are considered minimal.

Noise Assessment for Peaking Plant Facility
JAT10500-REPT-07-R0 35 rpsgroup.com/uk 04/09/2018
10 Summary and Conclusions
10.1 The results of the noise assessment carried out for the proposed development can be
summarised as follows:
The design of the facility incorporates in design mitigation measures to minimise noise
levels to the lowest reasonably practicable level.
The BS 4142:2014 initial estimate of impact indicates that, during the daytime and evening,
when the facility is most likely to operate, sound from the Peaking Plant Facility (PPF) is
unlikely to result in any adverse impacts. The BS 4142:2014 initial estimate of impact
during the night-time indicates that sound from the PPF is also unlikely to result in any
adverse impacts, depending on the context.
Consideration of context shows that it is unlikely that any adverse impacts would occur.
Absolute sound levels would be unlikely to cause any adverse impacts during any time
periods.
It is therefore considered that no significant adverse impact is likely during the day, evening
or night-time periods.
The operation of the proposed PPF will not result in a significant impact on nesting birds
within the RSPB Saltholme wetlands area.
Assessment of cumulative impacts due to the adjacent PPF (Saltholme South) indicates
that it is unlikely that cumulative adverse impacts will result in an adverse or significant
adverse impact.
10.2 On the basis of the above and in conclusion, noise from the proposed development will be
mitigated, through the application of best available techniques, such that it does not cause a
significant adverse impact, as defined by the NPSE and PPG-N. The results of the assessment
indicate that the development is acceptable in accordance with the requirements of
BS 4142:2014, national planning policy and local planning policy. There is, therefore, with
regards to noise, no reason the development should not be permitted.

Noise Assessment for Peaking Plant Facility
JAT10500-REPT-07-R0 rpsgroup.com/uk 04/09/2018
References
1 British Standards Institution. British Standard 4142:2014. Methods for rating and assessing
industrial and commercial sound.
2 Department for Environment, Food and Rural Affairs. Noise Policy Statement for England. Defra.
2010.
3 Ministry of Housing, Communities & Local Government: HSMO. National Planning Policy
Framework. July 2018.
4 Department for Communities and Local Government. National Planning Practice Guidance
5 Berglund, B. et al. Guidelines for Community Noise. World Health Organisation. 2000.
6 European Centre for Environment and Health. Night Noise Guidelines (NNGL) for Europe. World
Health Organisation. 2009.
7 National Renewable Energy Laboratory. Avian Hearing and the Avoidance of Wind Turbines
(NREL/TP-500-30844. R. Dooling, Ph.D., University of Maryland. 2002
8 Institute of Estuarine & Coastal Studies. Construction and Waterfowl Defining Sensitivity,
Response, Impacts and Guidance (ZBB710-F-2009. 2009
9 British Standards Institution. British Standard 7445-2:1991 Description and measurement of
environmental noise - Part 2: Guide to the acquisition of data pertinent to land use. 1991.
10 British Standards Institution. British Standard 7445-1:2003. Description and measurement of
environmental noise - Part 1: Guide to environmental quantities and procedures.
11 Department for Business, Energy & Industrial Strategy. Updated Energy and Emissions
Projections 2017. January 2018.

Noise Assessment for Peaking Plant Facility
Figures

Noise Assessment for Peaking Plant Facility
© 2018 RPS Group
Notes
1. This drawing has been prepared in accordance
with the scope of RPS' appointment with its client and
is subject to the terms and conditions of that
appointment. RPS accepts no liability for any use of
this document other than by its client and only for the
purposes for which it was prepared and provided.
2. If received electronically it is the recipient's
responsibility to print to correct scale. Only written
dimensions should be used.
6-7 Lovers Walk
Brighton East Sussex BN1 6AH
T 01273 546800
E [email protected] W rpsgroup.com
Client: Statera Energy
Project: Saltholme North PPF
Job Ref: 10500t
File location:
Date: 21/08/2018 Rev: 0
Drawn: JB Checked: SS
Figure 1: Location of Noise Sensitive Receivers and Survey Locations
NOT TO SCALE
rpsgroup.com/uk
Survey Location Approx. Site Location
Cowpen Bewley Road
Cowpen Lane
Charlton Close
Haverton Hill Hotel Lime Tree Close
RSPB Saltholme Receptor
ST2
ST3
ST4
ST1

Noise Assessment for Peaking Plant Facility
© 2018 RPS Group
Notes
1. This drawing has been prepared in accordance
with the scope of RPS' appointment with its client and
is subject to the terms and conditions of that
appointment. RPS accepts no liability for any use of
this document other than by its client and only for the
purposes for which it was prepared and provided.
2. If received electronically it is the recipient's
responsibility to print to correct scale. Only written
dimensions should be used.
6-7 Lovers Walk
Brighton East Sussex BN1 6AH
T 01273 546800
E [email protected] W rpsgroup.com
Client: Statera Energy
Project: Saltholme North PPF
Job Ref: 10500t
File location:
Date: 24/08/2018 Rev: 0
Drawn: JB Checked: SS
Figure 2: Noise Contour at GF Level – Saltholme North
NOT TO SCALE
rpsgroup.com/uk

Noise Assessment for Peaking Plant Facility
© 2018 RPS Group
Notes
1. This drawing has been prepared in accordance
with the scope of RPS' appointment with its client and
is subject to the terms and conditions of that
appointment. RPS accepts no liability for any use of
this document other than by its client and only for the
purposes for which it was prepared and provided.
2. If received electronically it is the recipient's
responsibility to print to correct scale. Only written
dimensions should be used.
6-7 Lovers Walk
Brighton East Sussex BN1 6AH
T 01273 546800
E [email protected] W rpsgroup.com
Client: Statera Energy
Project: Saltholme North PPF
Job Ref: 10500t
File location:
Date: 23/08/2018 Rev: 0
Drawn: JB Checked: SS
Figure 3: Noise Contour at GF Level – Cumulative (Saltholme North and South)
NOT TO SCALE
rpsgroup.com/uk

Noise Assessment for Peaking Plant Facility
JAT10500-REPT-07-R0 rpsgroup.com/uk 04/09/2018
Appendices

Noise Assessment for Peaking Plant Facility
JAT10500-REPT-07-R0 rpsgroup.com/uk 04/09/2018
Appendix A: Statement of qualifications, competency,
professional memberships and experience directly relevant to
the application of British Standard 4142:2014 of all personnel
contributing to this assessment
Simon Stephenson – Technical Director Acoustics
BSc (Hons) Physics; Chartered Engineer; Member of the Institute of Acoustics; Associate Member Acoustical Society of America
A.1 Simon is Technical Director of the RPS Acoustics Team. He is a specialist noise and vibration
consultant with a wide range of experience gained in the UK and worldwide. He has gained
particular experience in the fields of environmental noise, underwater acoustics, engineering noise
control, acoustic design of plant and industrial noise management, working within the industrial, oil
and gas, petro-chemical, power, renewables, construction, mineral extraction and waste industry
sectors.
A.2 Simon is a leading expert on the subject of industrial noise and has published many technical papers
on the subject. He was heavily involved with a research project for Defra to develop a new national
method for the noise mapping of industrial sources. He has also been actively involved in providing
technical advice to Defra regarding noise mapping of transportation sources and provided peer
review and advice relating to CNOSSOS and industrial noise. He has also provided technical advice
to the EA in relation to the effects of industrial and piling noise on birds. He has appeared as an
expert witness on many occasions, representing both developers and local authorities at public
inquiries and at parliamentary review.
A.3 Simon is currently a secretary of the Institute of Acoustics Noise and Vibration Engineering Group.
A.4 Simon has been involved in many BS 4142 noise assessments for both the previous and current
2014 version of BS 4142. He has given evidence at public inquiries where BS 4142 has been the
primary assessment methodology. On the basis of Simon’s overall experience in acoustics
(particularly in relation to industrial noise) combined with particular focus on BS 4142, he is deemed
competent for BS 4142 assessments.
A.5 For this project Simon has taken on the role of Project Director responsible for overseeing and
delivering the project. Simon was also responsible for reviewing the assessment and reviewing and
authorising the report figures and appendices.

Noise Assessment for Peaking Plant Facility
JAT10500-REPT-07-R0 rpsgroup.com/uk 04/09/2018
Phil Evans – Senior Director Acoustics
BSc (Hons) Geology; MSc Acoustics, Vibration and Noise Control; Fellow of the Geological Society; Member of the Institute of Acoustics; Associate Member Acoustical Society of America
A.6 Phil is a Senior Director and leads the RPS Acoustics Team. He is a specialist in environmental
acoustics and is active on a number of committees including the Association of Noise Consultants’
Vibration Working Group; British Standards Institution (BSi) Committee GME/21/6/4 - BS 6472:
Guide to Evaluation of Human Exposure to Vibration in Buildings; BSi Committee B/564/01 on BS
5228: Noise and Vibration Control on Construction and Open Sites which has now also revised and
issued BS 8233:2014 Guidance on sound insulation and noise reduction in buildings. He has been a
corporate Member of the Institute of Acoustics (MIOA) for over 20 years.
A.7 Phil has over 25 years’ experience in the project management of, and technical input to,
environmental noise and vibration impact assessments for major developments. He is an expert in
the industrial/commercial, transportation and construction sectors including the measurement,
calculation, evaluation and mitigation of environmental noise and vibration. Phil has significant
experience in the preparation and presentation of technical evidence and reports for public inquiries
and planning applications. He is experienced in consultation and liaison with government
departments, local authorities and other statutory bodies. He is an experienced expert witness. He
has a Continuous Professional Development Record to support this competency and experience.
A.8 Phil has been involved in many BS 4142 noise assessments for both the previous and current 2014
version of BS 4142. He has given evidence at public inquiries where BS 4142 has been the primary
assessment methodology. He is very familiar with the Standard and attended the joint ANC/BSi
launch of the 2014 version of the Standard. On the basis of Phil’s overall experience in acoustics
combined with particular focus on BS 4142, he is deemed competent for BS 4142 assessments.
A.9 For this project, Phil was responsible for reviewing and authorising the report, figures and
appendices.
Susan Hirst – Principal Acoustic Consultant
BSc (Hons) Acoustics; Member of the Institute of Acoustics
A.10 Susan is a Principal Acoustic Consultant and environmental acoustics specialist with over seven
years’ experience. She has been a member of the Institute of Acoustics since 2007 and a corporate
Member of the Institute of Acoustics (MIOA) since 2012.
A.11 Susan has managed projects and undertaken assessments for a variety of developments, including:
large scale mixed-use developments, incorporating commercial, retail, leisure and residential
elements; on-shore and off-shore windfarms and their associated infrastructure; energy from waste
facilities; manufacturing facilities; power stations; warehouses; minerals extraction and processing;
and road schemes.
A.12 She has provided input into Environmental Impact Assessments (EIAs) and undertaken noise
assessments to support planning applications, discharge planning conditions and planning appeals;

Noise Assessment for Peaking Plant Facility
JAT10500-REPT-07-R0 rpsgroup.com/uk 04/09/2018
provided technical advice on mitigation options and attended planning hearings. She has a
Continuous Professional Development Record to support this competency and experience.
A.13 Susan has carried out many BS 4142 noise assessments using both the previous and current 2014
version of the standard. On the basis of Susan’s overall experience in acoustics combined with
particular focus on BS 4142, she is deemed competent to undertake BS 4142 assessments.
A.14 Susan was also responsible for reviewing the report, figures and appendices.
Jon Baldwin – Senior Consultant - Acoustics
BSc (Hons) Sound Engineering; Member of the Institute of Acoustics
A.15 Jon is a Consultant in acoustics with over 6 years’ experience within the field of acoustic
engineering. Following completion of a degree in Sound Engineering, he worked within the Audio
Visual sector before moving into consultancy. He has been an associate member of the Institute of
Acoustics since 2013.
A.16 Jon has experience project managing and undertaking acoustics surveying and assessments for a
variety of industrial, commercial, residential and mixed-use developments, as well as for major
infrastructure projects.
A.17 He has provided input into Environmental Impact Assessments (EIAs) and undertaken noise
assessments to support planning applications and discharge planning conditions. He has a
Continuous Professional Development Record to support this competency and experience.
A.18 Jon has been involved with a number BS 4142 noise assessments using both the previous and
current 2014 version of the Standard. On the basis of Jon’s overall experience in acoustics
combined with his experience of BS 4142, he is deemed competent to undertake BS 4142:2014
assessments.
A.19 For this project Jon has taken on the role of Project Manager and has been responsible for
overseeing the project and preparing the report.
Stephen Scott – Senior Acoustic Consultant
MEng Engineering Acoustics and Vibration with Merit; Member of the Institute of Acoustics
A.20 Stephen is a Senior Acoustic Consultant and environmental acoustics specialist with over fifteen
years’ experience. He has been a member of the Institute of Acoustics since 1997 and a corporate
Member of the Institute of Acoustics (MIOA) since 2001.
A.21 Stephen has project managed and undertaken assessments for a variety of developments, including:
road and rail schemes; large scale mixed-use developments, incorporating commercial, retail, leisure
and residential elements; on-shore and off-shore windfarms and their associated infrastructure;
energy from waste facilities; manufacturing facilities; power stations and solar farms; retail units; and
minerals extraction.

Noise Assessment for Peaking Plant Facility
JAT10500-REPT-07-R0 rpsgroup.com/uk 04/09/2018
A.22 He has provided input into Environmental Impact Assessments (EIAs) and undertaken noise
assessments to support planning applications, discharge planning conditions and planning appeals;
He has also provided technical advice on mitigation options and provided expert witness. He has a
Continuous Professional Development Record to support this competency and experience.
A.23 Stephen has been involved in many BS 4142 noise assessments using both the previous and
current 2014 version of the standard. On the basis of Stephen’s overall experience in acoustics
combined with particular focus on BS 4142, he is deemed competent to undertake BS 4142
assessments.
A.24 For this project Stephen was responsible for reviewing the modelling.
Zachary Simcox – Assistant Acoustic Consultant
BEng (Hons) Acoustical Engineering; Associate Member of the Institute of Acoustics
A.25 Zach is an Assistant Acoustic Consultant and joined RPS in 2017. He is currently an Associate
Member of the Institute of Acoustics (AMIOA) and has been since 2017.
A.26 Since joining RPS he has undertaken acoustic surveying and assessments for a number of
commercial, residential, and industrial developments.
A.27 He has acoustic survey, data processing and noise modelling experience, and has a Continuous
Professional Development Record to support this competency and experience.
A.28 For this project Zachary has taken on the role of consultant responsible for carrying out the acoustic
surveying.

Noise Assessment for Peaking Plant Facility
JAT10500-REPT-07-R0 rpsgroup.com/uk 04/09/2018
Appendix B: Survey Record Sheets
Appendix B
Measurement Interval
Dynamic Range (dB)
15 mins
94.0Day 0.0 Night 2.0-3.0
8 down to 4 as time progressed
35B&K 42312665087
30/06/201894.0
as above
Description of site (location of equipment, general surroundings, nature of ground between NSR and sound source(s) (hard/ soft ground, topography, intervening features, reflecting surfaces))
On Grass by layby, middle of residential area. All tarmac and grass areas. Flat, trees, fields and housed between site and location
Description of sound environment at start of survey (principal environmental and natural sound sources, which sources are dominant, character of the sound environment cf. to the character of the new source)
Birds (gulls), local traffic, dogs barking, trains in distance, overhead planes, distant industry, helicopters
Description of sound environment at end of survey (principal environmental and natural sound sources, which sources are dominant, character of the sound environment cf. to the character of the new source)
Photographs of measurement location
Wind speed (m/s) & dir’n Av.
Relative Humidity (%)Subjective description / additional
details
Cloud cover (100%= 8 oktas)Temperature (degrees Celsius) 18 down to 12 as time progressed
high
Humid, no rain
Reference level (dB)Meter reading (dB)
Date / time
Cal
ibra
tor
RPS IDManufacturer / Model
Serial NumberDate last verification
21/08/2018 VariousPersonnel
Mic Height Time Weighting Frequency Weighting
START/ENDZS
Façade / Freefield Photo?
1.5 m f A ff
Sound Measurement System
RPS ID Manufacturer / Model Serial Number Last Lab Verification Filename Memory Card ID
127 Rion - NL52 164424 02/03/2018 0001,0005,0009, 0013,0017,0021,002
Location ST1 - Cowpen Brewery RdPurpose of Monitoring Baseline
Relevant Guidance / Standard 4142
O:\Jobs_10000-11000\10500t\3. PPF Sites\Saltholme\Saltholme Survey\NX-42RT\ST1 - Cowpen Brewery Rd\Survey Notes\Survey_Record_ST1_20180821~SurveySheet 04/09/2018

Appendix B
Measurement Interval
Dynamic Range (dB)
15 mins
Photographs of measurement location
Wind speed (m/s) & dir’n Av.
Relative Humidity (%)
as above
Description of site (location of equipment, general surroundings, nature of ground between NSR and sound source(s) (hard/ soft ground, topography, intervening features, reflecting surfaces))
Day - On foot path in RSPB site, grass and trees suround, gravel road to south Evening/ night, at gate of RSPB site adjacent to A road, tarmac roads surround
Description of sound environment at start of survey (principal environmental and natural sound sources, which sources are dominant, character of the sound environment cf. to the character of the new source)
Birds , road traffic, Wind in flora, children playing, distant industry, occasional aircraft
Description of sound environment at end of survey (principal environmental and natural sound sources, which sources are dominant, character of the sound environment cf. to the character of the new source)
21/08/2018 Various
Subjective description / additional details
Cloud cover (100%= 8 oktas)Temperature (degrees Celsius) 18 down to 12 as time progressed
high
Humid, no rain
Reference level (dB)Meter reading (dB)
Date / time
Cal
ibra
tor
RPS IDManufacturer / Model
Serial NumberDate last verification
Personnel
Mic Height Time Weighting Frequency Weighting
START/ENDZS
Façade / Freefield Photo?
1.5 m f A ff Y
Sound Measurement System
RPS ID Manufacturer / Model Serial Number Last Lab Verification Filename Memory Card ID
127 Rion - NL52 164424 02/03/2018 0002,0006,0010, 0016,0020,0024,002
Location ST2 - RSPB sitePurpose of Monitoring Baseline
Relevant Guidance / Standard 4142
94.0Day 0.0 Night 5.5 - 3.5
8 down to 4 as time progressed
35B&K 4231
30/06/20182665087
94.0
O:\Jobs_10000-11000\10500t\3. PPF Sites\Saltholme\Saltholme Survey\NX-42RT\ST2 - RSPB Site\Survey Notes\Survey_Record_ST2_20180821~SurveySheet 04/09/2018

Appendix B
Measurement Interval
Dynamic Range (dB)
15 mins
Photographs of measurement location
Wind speed (m/s) & dir’n Av.
Relative Humidity (%)
as above
Description of site (location of equipment, general surroundings, nature of ground between NSR and sound source(s) (hard/ soft ground, topography, intervening features, reflecting surfaces))
on foot way on the close. Mostly tarmac surrounds, trees and buildings surronds
Description of sound environment at start of survey (principal environmental and natural sound sources, which sources are dominant, character of the sound environment cf. to the character of the new source)
Traffic on 30 mph road, wood pidgeons, chatter of locals
Description of sound environment at end of survey (principal environmental and natural sound sources, which sources are dominant, character of the sound environment cf. to the character of the new source)
21/08/2018 Various
Subjective description / additional details
Cloud cover (100%= 8 oktas)Temperature (degrees Celsius) 18 down to 12 as time progressed
high
Humid, no rain
Reference level (dB)Meter reading (dB)
Date / time
Cal
ibra
tor
RPS IDManufacturer / Model
Serial NumberDate last verification
Personnel
Mic Height Time Weighting Frequency Weighting
START/ENDZS
Façade / Freefield Photo?
1.5 m f A ff Y
Sound Measurement System
RPS ID Manufacturer / Model Serial Number Last Lab Verification Filename Memory Card ID
127 Rion - NL52 164424 02/03/2018 0003,0007,0011, 0015,0019,0023,002
Location ST3 - Limetrees ClPurpose of Monitoring Baseline
Relevant Guidance / Standard 4142
94.0Day 0.0 - 1.0 Night 5.0 - 3.0
8 down to 4 as time progressed
35B&K
266508730/06/2018
94.0
O:\Jobs_10000-11000\10500t\3. PPF Sites\Saltholme\Saltholme Survey\NX-42RT\ST3 - Limetrees Cl\Survey Notes\Survey_Record_ST3_20180821~SurveySheet 04/09/2018

Appendix B
Measurement Interval
Dynamic Range (dB)
15 mins
94.0day 0.0 night 5.5 - 3.0
8 down to 4 as time progressed
35B&K 42312665087
30/06/201894.0
as above
Description of site (location of equipment, general surroundings, nature of ground between NSR and sound source(s) (hard/ soft ground, topography, intervening features, reflecting surfaces))
on foot way on the close. Mostly tarmac surrounds, trees and buildings surronds
Description of sound environment at start of survey (principal environmental and natural sound sources, which sources are dominant, character of the sound environment cf. to the character of the new source)
Traffic on 40 mph road, birds, wind in flora chatter of locals, whistle from industrial plant somewhere
Description of sound environment at end of survey (principal environmental and natural sound sources, which sources are dominant, character of the sound environment cf. to the character of the new source)
Photographs of measurement location
Wind speed (m/s) & dir’n Av.
Relative Humidity (%)Subjective description / additional
details
Cloud cover (100%= 8 oktas)Temperature (degrees Celsius) 18 down to 12 as time progressed
high
Humid, no rain
Reference level (dB)Meter reading (dB)
Date / time
Cal
ibra
tor
RPS IDManufacturer / Model
Serial NumberDate last verification
21/08/2018 Various Personnel
Mic Height Time Weighting Frequency Weighting
START/ENDZS
Façade / Freefield Photo?
1.5 m f A ff Y
-
Sound Measurement System
RPS ID Manufacturer / Model Serial Number Last Lab Verification Filename Memory Card ID
127 Rion - NL52 164424 02/03/2018 0004,0008,0012, 0014,0018,0022,002
Location ST4 - Charlton ClPurpose of Monitoring Baseline
Relevant Guidance / Standard 4142
O:\Jobs_10000-11000\10500t\3. PPF Sites\Saltholme\Saltholme Survey\NX-42RT\ST4 - Charlton Cl\Survey_Record_ST4_20180821~SurveySheet 04/09/2018

Noise Assessment for Peaking Plant Facility
JAT10500-REPT-07-R0 rpsgroup.com/uk 04/09/2018
Appendix C: Model Input Data Including Mitigation
Source
Nu
mb
er
Source Type Height above Ground (m)
Overall (dBA)
Linear Octave Band Sound Power Levels, dB On time/ Other Inputs 31.5 63 125 250 500 1k 2k 4k 8k
Engine Enclosure
5 Industrial
Building 7.5 (building
height) 100 - 124 109 102 89 81 70 60 61
100% Cd = -6 dB
Exhaust Body &
Ductwork 5 Line Source
1.75 - 15
(34 m length duct) 85 - 85 - 95 86 88 79 76 72 78
Exhaust Outlet
5 Point Source 15.0 90 127 111 90 80 50 51 54 46 35 100%
Calc'd DI
Radiators
10
(2 per engine)
Area Source 5.5 94 - 96 90 90 90 92 84 78 73 100%
Air Inlet
20
(4 per engine
enclosure)
Point Source 2.9 87 - 96 94 89 81 73 72 82 75 100%
Air Outlet 10 Point Source 9.9 90 - 101 94 88 89 76 81 84 79 100%
Transformer 1 Point Source 2 83 - 79 84 83 83 77 72 67 60 100%
Gas Kiosk 1 Point Source 1.5 103 - 79 75 76 84 92 101 92 80 100%

Noise Assessment for Peaking Plant Facility
JAT10500-REPT-07-R0 rpsgroup.com/uk 04/09/2018
Appendix D: Noise Model Methodology
D.1 The noise emissions from the facility have been modelled using the SoundPLAN 7.4 environmental
noise prediction software package. The model calculates the contribution from each noise source at
specified NSR locations. The contribution from each noise source is calculated based on the octave
band sound power levels and the source type (e.g. point, line, area). The model predicts noise levels
under light down-wind conditions based on hemispherical propagation, atmospheric absorption,
ground effects, screening and directivity based on the procedure detailed in ISO 9613-2:19961.
D.2 Terrain contour data have been entered in the model based on OS land contours. The ground
between the site and the receiver locations has been assumed to be soft although the site area has
been assumed to be hard. The site buildings have been included and these provide some degree of
screening as well as reflecting surfaces.
D.3 Receivers have been modelled at ground floor level at a height of 1.5 m above local ground level
(AGL) and at first floor level at a height of 4 m AGL. The maximum predicted level at either floor level
has been used in the assessment.
D.4 The same noise modelling techniques have been used by RPS on numerous sites in the UK and
worldwide and there is a high degree of confidence in the model.
1 International Organization for Standardization. ISO 9613-2:1996 Acoustics - Attenuation of sound during
propagation outdoors - Part 2: General method of calculation.

789
3-6
6
rpsgroup.com
Contact
RPS Planning & Development
6-7 Lovers Walk
Brighton
East Sussex
BN1 6AH
T: +44 (0) 1273 546 800