Embed Size (px)
Citation preview

Antonia Gambacorta (1), Chris Barnet (1), Nadia Smith (1), Jonathan Smith (1), Walter Wolf (2), Mark Liu (2), Tony Reale (2), Tom King (2), Michael Wilson (2), LeGGa Suillard (2), Nick Nalli (2), Bomin San (2), Kexin Zhang (2), Changyi Tan (2), Flavio Iturbide-‐Sanchez (2), Xiaozhen Xiong (2), Mitch Goldberg (3)
NOAA Long-‐term Strategy of trace gases from hyper-‐spectral thermal sounders
1
1. Science and Technology CorporaGon, STC 2. NOAA NESDIS STAR 3. NOAA JPSS Project ScienGst
3rd JPSS Annual MeeGng August 11, 2016

Aqua (2002)
MetOp A (2006), B (2012), C (2018)
Suomi NPP (2011)
JPSS 1,2,3,4 (2017 -‐ 2032) EPS SG (2020, 2040) NUCA
PS
Pre-‐Processor
NOAA long-‐term strategy of trace gases from hyper spectral sounders
The NOAA Unique Combined Atmospheric Processing System
(NUCAPS) Same exact executable
Same underlying Spectroscopy Same look up table methodology
for all pla[orms

Philosophy of NUCAPS
3
• The challenge: high computaGonally efficiency and sophisGcated inversion methods to maximize uGlizaGon of large volumes of data for real Gme weather and long-‐term climate applicaGons
• Philosophy of NUCAPS: developing a mathemaGcally sound and globally applicable (land/ocean, day/night, all season, all sky, TOA-‐surface) retrieval algorithm that can fully exploit all available satellite assets (infrared, microwave, visible) to retrieve the full suite of surface temperature and verGcal profiles of temperature, moisture and trace gases. These are among the essenGal metrics defining a modern, physical and independent data record of atmospheric variables, suitable for both weather and climate applicaGons.

4
Hyper spectral sounders sensiGvity to trace gases
5
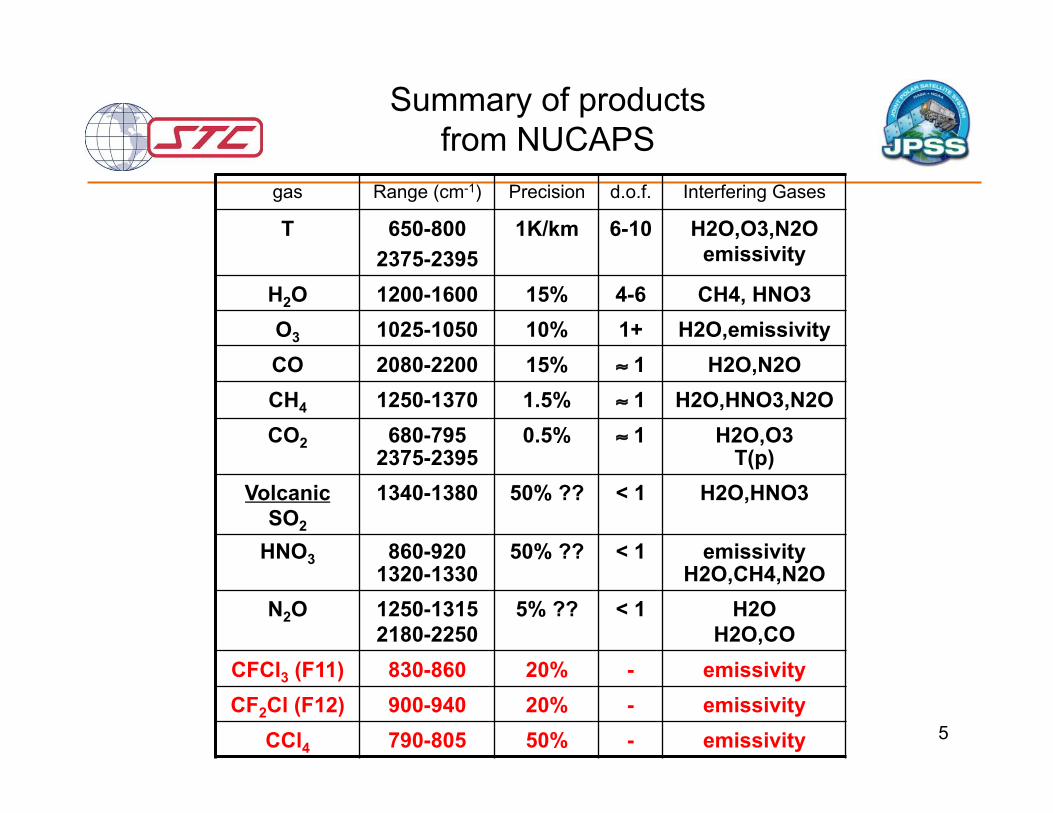
Summary of products from NUCAPS
gas Range (cm-1) Precision d.o.f. Interfering Gases
T 650-800 2375-2395
1K/km 6-10 H2O,O3,N2O emissivity
H2O 1200-1600 15% 4-6 CH4, HNO3 O3 1025-1050 10% 1+ H2O,emissivity CO 2080-2200 15% ≈ 1 H2O,N2O CH4 1250-1370 1.5% ≈ 1 H2O,HNO3,N2O CO2 680-795
2375-2395 0.5%
≈ 1 H2O,O3
T(p) Volcanic
SO2
1340-1380 50% ?? < 1 H2O,HNO3
HNO3 860-920 1320-1330
50% ?? < 1 emissivity H2O,CH4,N2O
N2O 1250-1315 2180-2250
5% ?? < 1 H2O H2O,CO
CFCl3 (F11) 830-860 20% - emissivity CF2Cl (F12) 900-940 20% - emissivity
CCl4 790-805 50% - emissivity

The challenge of trace gas retrievals from hyper spectral sounders
6
• Retrieving trace gases from hyper spectral sounders is a highly non linear and ill-‐condiGoned problem
• Trace gas signals are small and characterized by strong spaGal and seasonal variability • In some cases trace gases are physically correlated with other geophysical variables – for
example in respiraGon of soil CO2 is correlated with surface temperature; Ts/CH4; CO/CH4/O3;
• Most of geophysical correlaGons in nature are non-‐linear. • With trace gases geophysical a-‐priori informaGon is limited. • Lack of informaGon content is problemaGc especially in presence of cloudy, cold, isothermal
scenes. • Trace gases are highly spectrally correlated (CO2,O3,H2O in 15 um band, etc.) • Errors in spectroscopy and geophysical state.
– All trace gases dependent on temperature profile. – CO2 and temperature are inGmately correlated since CO2 absorpGon is used to derive temperature – CO2 can be correlated with clouds both in the retrieval and geophysical sense.
• SGtching satellite instruments together with different – SpaGal sampling, – Spectral sampling, and – Noise characterisGcs
• Ground truth – Need full atmospheric state – up to ≥ 30 km.

Spectral SensiGvity Analysis (LW band)
7
SST 1K
T 1K
H2O 10%
O3 10%
CH4 2%
CO 1%
PerturbaSon Applied
Brightness temperature difference ( ΔBT ) terms represent the sensiGvity of each channel to a given perturbaGon species and are indicaGve of the degree of “spectral purity” of each channel.
• For each atmospheric species, we select channels with: • the highest degree of spectral purity (the highest sensiGvity to the species of interest and the lowest sensiGvity to all other interfering species). • the lowest noise sources (NEDT, calibraGon & apodizaGon corr., RTA errors. See ahead.) • unique spectral features (to capture atmospheric variability, maximize verGcal resoluGon)
8
• A minimum dependence on the geophysical a priori and full exploitaGon of the measurement and knowledge of the physics of radiaGve transfer. • Channel selecGon aimed at maximizing spectral purity and informaGon content. • Spectral correlaGon, cloud clearing errors and instrument noise used as terms of the measurement
error covariance in a weighted least square minimizaGon
• A sequenGal approach, solving for most linear (including cloud clearing) or high S/N parameters first and a formal error propagaGon from one step to the next
• A retrieval is a signal averaging process over many channels and only makes changes where we have informaGon content. VerGcal averaging kernels, Aj,j, define where the instrument has skill.
• Users need to know verGcal and spaGal error covariance and verGcal weighGng funcGons. – Many of the “signals” we see have seasonal or spaGal variability in the informaGon content. – Broad verGcal weighGng funcGons tend to mix stratospheric and upper tropospheric contribuGons
together. • Trace gas retrievals are sensiGve to stratospheric-‐tropospheric exchange.
• Reprocessing capability to study long-‐term stability of algorithm. – All archived data (“granule” processing) – Global “gridded” data sub-‐sets (for rapid evaluaGon of algorithm modificaGons) – All validaGon datasets (including radio-‐sonde, aircrao match up datasets)
NUCAPS long-‐term strategy of trace gases from hyper spectral sounders

9
NUCAPS Flow Diagram
Microwave Physical for T(p), q(p), LIQ(p), ε(f)
Climatological First Guess for all
products
Initial Cloud Clearing, ηj, Rccr
Improved Cloud Clearing, ηj, Rccr
Final Cloud Clearing, ηj, Rccr
IR Regression for Ts, ε(ν), T(p), q(p)
IR Physical Ts, ε(ν), ρ(ν)
IR Physical Ts, ε(ν), ρ(ν)
IR Physical T(p)
IR Physical T(p)
IR Physical Ts, ε(ν), ρ(ν)
IR Physical q(p)
IR Physical O3(p)
IR Physical CO(p)
IR Physical HNO3(p)
IR Physical CH4(p)
IR Physical CO2(p)
IR Physical N2O(p)
Note: Physical retrieval steps that are repeated always use same startup for that product, but it uses retrieval products and error estimates from all other retrievals.
MIT
FG CCR
RET
The path forward
• We have built a retrieval system aimed at making the best use of hyper spectral data.
• Previous validaGon efforts have proven that we can meet requirements. • With temperature and water vapor, users are clearly idenGfiable. • What defines the operaGonal need for these trace gas products instead?
– Just because we can do it, it does not mean that we shall do it. – We would like to support any project supported by the NOAA AC4 Program to
engage new potenGal users and gain insights on the applicability of our products. This will ulGmately lead to a user requirement to jusGfy the effort of transiGoning products into operaGons.
– NOAA JPSS is funding an unprecedented list of Proving Ground and Risk ReducGon (PGRR) iniGaGves to demonstrate the operaGonal need of our products. This is not validaGon in the tradiGonal sense, it is developing new user’s applicaGons.
• What defines a trace gas operaGonal user? – We need a real Gme, vered, insGtuGonal user: EPA, NaGonal Forest Service,
DOA, etc. – We need users that need archived consistent products: NUCAPS CO2 might
serve as forecast climatology for the NaGonal Weather Service. 10

Main goal of this session
• This session should discuss what trace gases should be explored in a research sense and what trace gases should be distributed operaGonally.
• NASA and NOAA have different research mandates, goals and intended
users. – NASA’s focus is primarily on new instrument concepts and fundamental
research. – NOAA leverages on NASA’s research to develop a real Gme, operaGonal and
archival product, intended for specific end users applicaGons of societal benefits.
• We are now looking for those user applicaGons that will (1) verify the applicability of our trace gas products, (2) educate us on the need for new or improved products, QCs and formatng, (3) jusGfy new efforts for algorithm improvements and transiGon to operaGons.
• The ulGmate result is a conGnued and intelligent use of hyper-‐spectral trace gas products, both for real Gme and long-‐term applicaGons.
11

Back Up slides
12
13
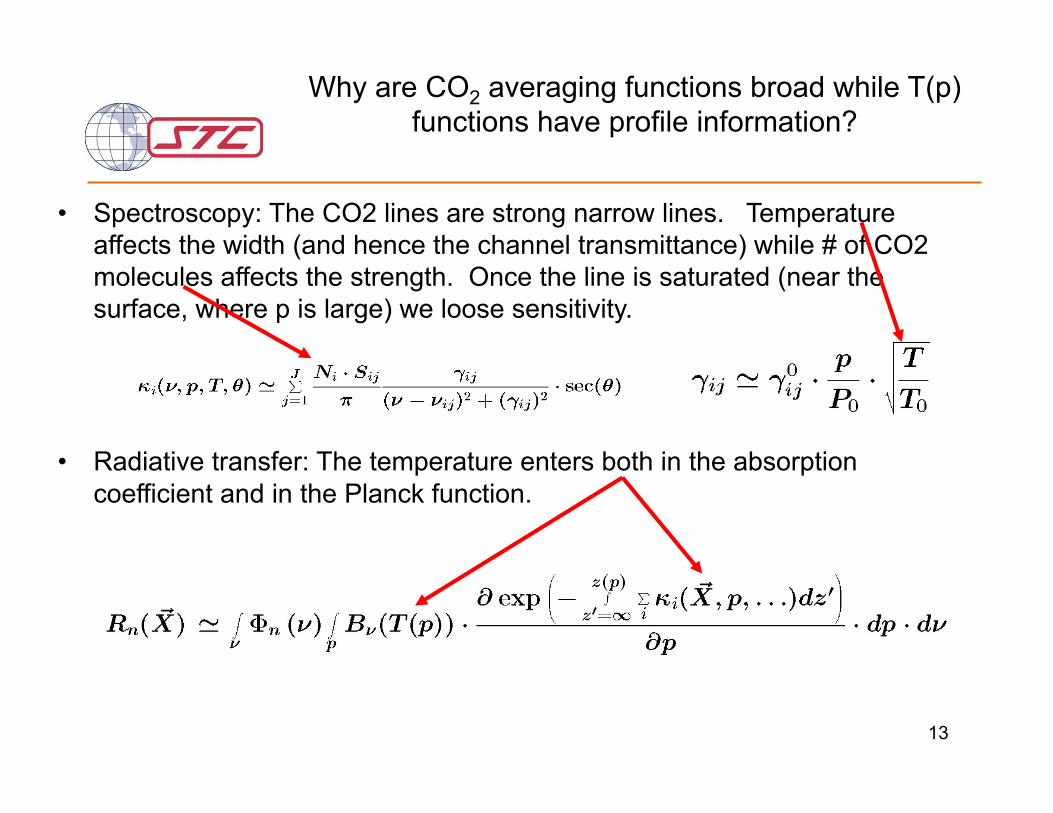
Why are CO2 averaging functions broad while T(p) functions have profile information?
• Spectroscopy: The CO2 lines are strong narrow lines. Temperature affects the width (and hence the channel transmittance) while # of CO2 molecules affects the strength. Once the line is saturated (near the surface, where p is large) we loose sensitivity.
• Radiative transfer: The temperature enters both in the absorption coefficient and in the Planck function.

NUCAPS Flow Chart
14
• I. A microwave retrieval module which computes Temperature, water vapor and cloud liquid water (Rosenkranz, 2000) • II. A fast eigenvector regression retrieval that is trained against ECMWF and CrIS all sky radiances which computes temperature and water vapor (Goldberg et al., 2003) • III. A cloud clearing module (Chahine, 1974) • IV. A second fast eigenvector regression retrieval that is trained against ECMWF analysis and CrIS cloud cleared radiances • V. The final infrared physical retrieval based on a regularized iterated least square minimizaGon: temperature, water vapor, trace gases (O3, CO, CH4, CO2, SO2, HNO3, N2O) (Susskind, Barnet, Blaisdell, 2003)