Embed Size (px)
Citation preview
Good Practice Guidance and Uncertainty Management in National Greenhouse Gas Inventories
CO2, CH4 and N2O Emissions from Transportation-Water-borne Navigation 71
CO2, CH4, AND N 2O EMISSIONS FROM TRANSPORTATION-WATER-BORNE NAVIGATION ACKNOWLEDGEMENTS This paper was written by Paul Jun1, Michael Gillenwater1, and Wiley Barbour2. It was reviewed by Kristin Rypdal (Statistics Norway).
A B S T R A C T National and international navigation in the transportation sector includes ocean-going, in port, and inland waterway vessel activities. The combustion of fossil fuels for these activities produces emissions of various greenhouse gases, including carbon dioxide (CO2), methane (CH4), nitrous oxide (N2O), carbon monoxide (CO), oxides of nitrogen (NOx), non-methane volatile organic compounds (NMVOCs), and sulphur dioxide (SO2). Currently, emissions resulting from the combustion of fuels used for international transport activities, termed international bunker fuels under the UN Framework Convention on Climate Change (UNFCCC), are not included in national emission totals, but are to be reported separately based upon location of fuel sales.
The Revised 1996 IPCC Guidelines for National Greenhouse Gas Inventories (IPCC Guidelines) recommend that emissions from navigation be estimated by multiplying the amount of fuel consumed by an appropriate emissions factor. To accurately reflect the diversity in these activities, it is recommended that country-specific emission factors be used where it is possible. Recent research efforts may provide opportunities to improve the IPCC emission factors.
Reporting of emission estimates for both methane and nitrous oxide is clearly described in the IPCC Guidelines. With few exceptions, confidentiality is not expected to pose a challenge.
Ensuring the quality of the inventory will be an important activity. The most important aspect of quality assurance and quality control is thorough and transparent documentation of the emissions calculation steps, including all activity data and emission factor values.
1 ICF Global Environmental Issues Group 2 U.S. Environmental Protection Agency
Background Paper
Energy Sector 72
1 I N T R O D U C T I O N Most countries have a national and international navigation component of their transportation sector. Navigation is defined here as the transportation sector’s water mode, which includes ocean-going, in-port, and inland waterway activities. Ocean-going vessels are generally classified as cargo and passenger carrying, military (i.e., navy), miscellaneous support ships (e.g., tugboats), and smaller boats and recreational watercraft. While in port, these vessels often continue to operate their main engines or separate shore or auxiliary engines to provide energy. Vessels operating in inland rivers, lakes, canals, and reservoirs include the categories listed for ocean-going ships, but in most countries include a higher proportion of smaller boats and recreational watercraft.
The combustion of fossil fuels for these activities produces emissions of various greenhouse gases, including carbon dioxide (CO2), methane (CH4), and nitrous oxide (N2O). These activities also produce other air pollutants such as carbon monoxide (CO), oxides of nitrogen (NOx), non-methane volatile organic compounds (NMVOCs), particulate matter, and sulphur dioxide (SO2). Although these gases are not direct greenhouse gases, some (CO, NOx, NMVOCs) do contribute to climate change. Moreover, much of the emissions research for this source has focused on these pollutants, which have been targeted for reduction (IMO measures, Annex 1). The authors feel that the added value of incorporating this important and relevant research provides sufficient justification to include these gases in the discussion.
The amount of emissions produced is primarily a function of the amount of fuel consumed, the characteristics of the fuel, the engine technology employed, and any post-combustion emission controls in place. Carbon dioxide is the primary greenhouse gas emitted from navigation.
Emissions resulting from the combustion of fuels used for international transport activities, termed international bunker fuels under the UN Framework Convention on Climate Change (UNFCCC), are currently not included in national emission totals, but are to be reported separately according to the country from which the fuel was sold. The decision to report emissions from international bunker fuels separately, instead of allocating them to a particular country, was made by the Intergovernmental Negotiating Committee in establishing the Framework Convention on Climate Change.1 These decisions are reflected in the IPCC Guidelines in which countries are requested to report emissions from fuel sold to ships or aircraft that depart from their ports and are engaged in international transport separately from national totals (IPCC/UNEP/OECD/IEA 1997). The Parties to the UNFCCC have yet to decide on a methodology for allocating these emissions.2
In general, the methodology in the IPCC Guidelines recommends that emissions from navigation be estimated by multiplying the amount of fuel consumed by an appropriate emission factor. Although some default emission factors are presented, it is recommended that country-specific factors be used if possible.
Quality assurance and quality control (QA/QC) activities also need to occur at several steps in the emission estimation process. Key activities requiring QA/QC include the gathering and compilation of the fuel consumption data, the identification of fuel characteristics and emission factors, as well as documenting transparently the data and methods for reviewers. The inventory agency must ensure the accuracy of the activity data and relevancy of the emissions factors, and verify that the calculations of the emission estimates have been performed correctly. It is also responsible for providing documentation and sufficient information to the UNFCCC. One or more types of external review may also be appropriate.
1 . 1 Ov e r v iew o f na v i ga t io n a c t iv i ty The IPCC Guidelines under the common reporting framework provide definitions of the categories that should be used when countries prepare their national greenhouse gas inventory.3 These categories distinguish between emissions from domestic (i.e., national navigation) and international marine bunkers, as presented below:
1 See report of the Intergovernmental Negotiating Committee for a Framework Convention on Climate Change
on the work of its ninth session, held at Geneva from 7 to 18 February 1994 (A/AC.237/55, annex I, para. 1c) (contact [email protected]).
2 See FCCC/SBSTA/1996/9/Add.1 and Add.2 for a discussions of allocation options for international bunker fuels (see http://www.unfccc.de/fccc/docs/1996/sbsta/09a01.pdf and /09a02.pdf).
3 Revised 1996 IPCC Guidelines for National Greenhouse Gas Inventories, Reporting Instructions, volume 1, Common Reporting Framework.
Good Practice Guidance and Uncertainty Management in National Greenhouse Gas Inventories
CO2, CH4 and N2O Emissions from Transportation-Water-borne Navigation 73
Navigation Emissions from fuels used to propel water-borne vessels, including hovercraft and hydrofoils. National Navigation Emissions from fuel used for navigation of all vessels not engaged in international transport, except fishing (which should be reported under fuel combustion for Agriculture, Forestry, and Fishing [1 A 4 c iii]). Note that this may include journeys of considerable length between two ports of a country (e.g., San Francisco and Honolulu).
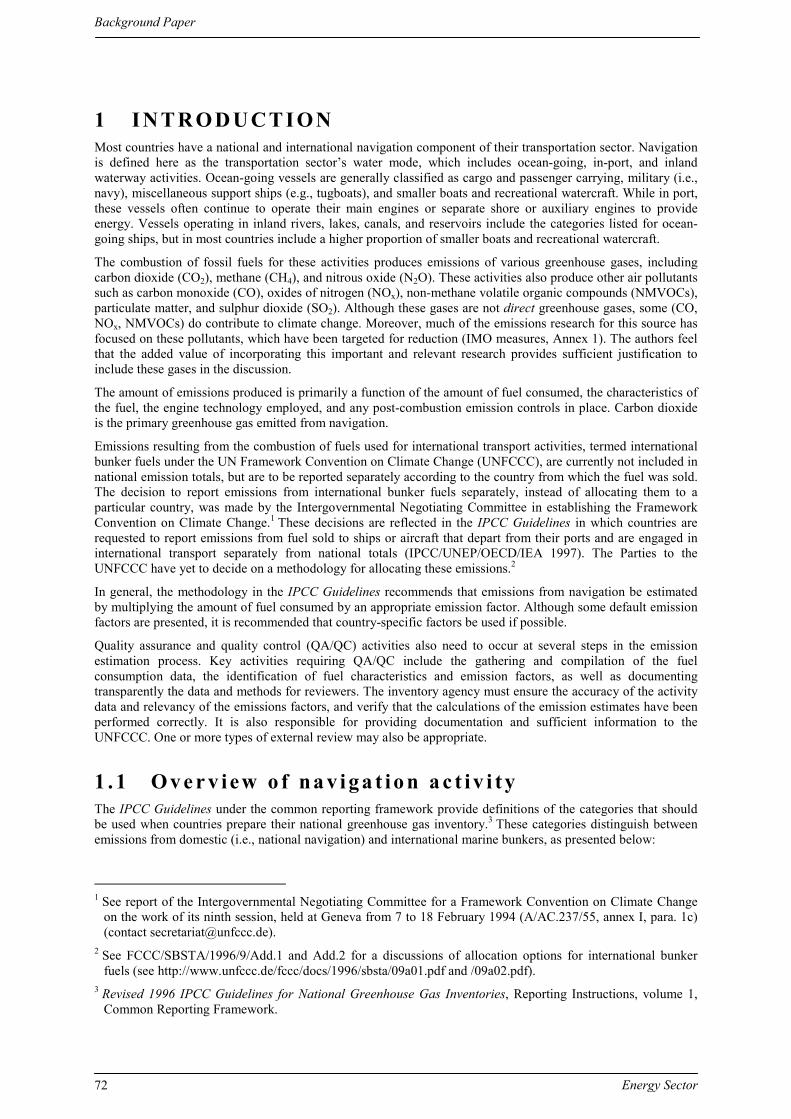
International Marine (Bunkers) Comprises emissions from fuels burned by sea-going ships of all flags that are engaged in international transport. Based on current guidelines, these emissions should, as far as possible, be excluded from national totals and reported separately. In terms of function, the principal division of the marine industry is between transport and non-transport vessels. Transport, or cargo-carrying vessels, comprise bulk liquid, bulk dry cargo, passenger and other general cargo vessels. Non-transport vessels cover a variety of miscellaneous activities including fishing, military, and offshore and harbour support services. The world fleet by percentage of vessel type is shown in Table 1.
TABLE 1
WORLD MARINE SHIPPING FLEET BY VESSEL TYPE
Contribution to fleet (%)
Vessel Type Ships Tonnage
Transport 42 86
Bulk cargo 15 67
General cargo 23 18
Passenger 4 <1
Non-transport 58 14
Fishing 23 1
Service craft 15 1
Military 19 11
Other 1 1
Source: Corbett and Fischbeck, 1997.
As defined in the IPCC Guidelines, fuel consumption by fishing vessels is to be reported under the Agriculture, Forestry and Fishing category. However, it is recommended that the fuel consumption data collection be conducted for all water-borne vessels jointly.
In 1995, it was estimated that the marine shipping industry was composed of about 82,000 ocean-going vessels with a gross tonnage of 491 million metric tonnes, excluding vessels under 100 gross metric tons (Lloyd's 1993, 1995). Of these nearly 59 percent of the cargo vessels were of less than 5,000 deadweight tons (dwt). They accounted for just over 5 percent of total tonnage, while 1,339 vessels (3 percent by number) were of greater than 100,000 dwt, representing 36 percent of deadweight tonnage.
The cargo shipping industry is characterized by complex economic relationships. A ship can be owned by a company in one country, which itself is owned by other companies in other countries, registered in another, operated by a ship-management company in a third country and crewed from a manning agency in a fourth country with nationals from yet other countries. Furthermore, carriage can be paid for by charterers, and in some cases a number of sub-charterers, based in other countries. Again, the reporting of international bunker fuel emissions are done so for informational purposes by the country where the fuel was sold, while the differentiation of international bunker versus domestic is done according to the departure and arrival locations. This definition is independent of the nationality or flag of the ship or carrier. It should be noted that this definition includes departures from territories held by a country; however navigation segments travelled between the “mainland” and a territory or between territories should be categorized as national and not reported under international bunker fuels.
Based on country of ownership, the largest fleet of marine cargo vessels is held by Japan, with roughly 18 percent of the world's ocean-going cargo vessels. The next closest nation is Greece, with 8 percent, followed by Russia and Norway. (Lloyd's 1993, 1995) Based on country of registration, Panama and Japan have the largest share of vessels. However, in terms of tonnage, Panama is followed closely by Liberia, and then by Greece. (Lloyd's 1993, 1995)
Globally, the fuel consumed for national shipping activities (i.e., in-between domestic ports or on inland waterways) is relatively small compared to international shipping activities. However, for some countries
Background Paper
Energy Sector 74
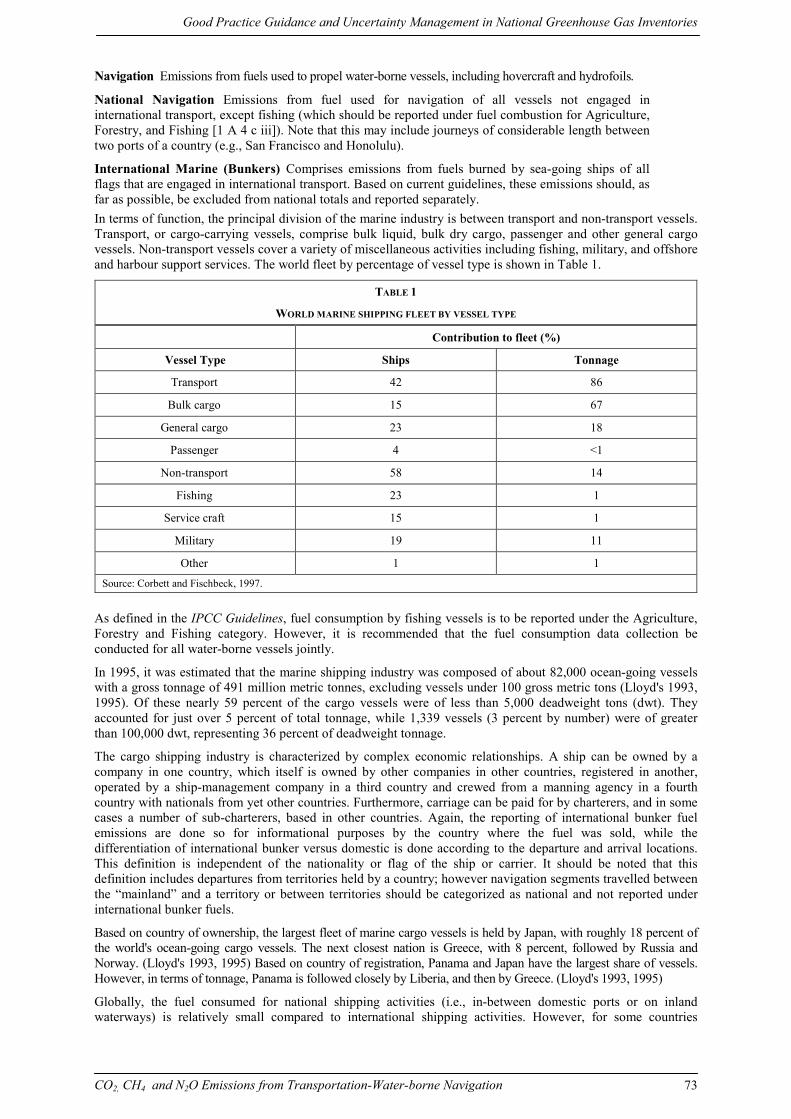
national shipping activities may be larger consumers of fuel than international shipping. Table 2 provides a simple classification scheme and description of the navigation sub-sector.
TABLE 2
TYPICAL MARINE AND INLAND VESSEL CHARACTERISTICS
Vessel Classification
Usage Classification
Activity Class Primary Fuel Type Primary Engine Type
Auxiliary Power
Lake craft Pleasure Recreation, water sports
Gasoline (petrol) 2 or 4 stroke Rare
River vessels Pleasure or Commercial
Recreation, cargo or passenger
Gasoline (petrol), or diesel
4 stroke or diesel
Diesel engine
Coastal vessels Commercial Support, fishing Diesel (200-3,600Hp) Diesel Diesel engine
Marine or ocean-going vessels
Commercial or Military
Cargo Residual or distillate Diesel Diesel
1 . 2 P r o c e s s d es c r i p t i o n Fuel combustion for navigation activities, like other fuel combustion processes, produces CO2, CH4, N2O, CO, NOx, NMVOCs, and SO2. Two main types of fuels are generally used on larger sea-going vessels - distillate diesel fuel (i.e., gas oil) and residual fuel oil (i.e., heavy fuel oil) - while motor gasoline is often used by smaller boats and recreational watercraft. The former two are employed primarily because of their relatively low cost and ease of handling. It is estimated that in 1990, 40 million metric tons of distillate diesel fuel and 100 million metric tons of residual fuel oil were consumed for this purpose (FCCC/SBSTA/1996/9/Add.2 1996). Marine fuels are not necessarily loaded at the outset of a voyage but rather they may be loaded at various times in the ship's operating schedule, depending on convenience and availability. Fuel costs can represent a substantial part of a ship's operating costs, in excess of 50 percent in some cases. Oil prices can vary considerably within and between ports, and can fluctuate at any given time. The quantity of fuel loaded at any given port depends not only on the size of the ship and distance to be travelled, but also on the price and availability of fuel, as refueling may not occur at each port. Fuels are rarely purchased directly from the manufacturer (i.e., the refinery). Fuel purchases generally involve oil traders, brokers and suppliers acting as intermediaries.
Marine diesel engines are the predominant engine technology used for both propulsion and auxiliary power generation in all but the smallest ocean-going watercraft, which tend to use 2 or 4 stroke spark ignition gasoline engines.
Large ocean-going cargo ships are driven primarily by large, slow-speed and medium-speed diesel engines. Some vessels, such as fast ferries and warships, use steam turbines or gas turbines to support high power to weight ratio requirements. The number of vessels equipped with turbine propulsion is small, however, since these vessels are unable to compete with the more efficient diesels in most applications. In 1991, diesel engine powered vessels accounted for around 98 percent of the total world merchant fleet; the remaining 2 percent of vessels were powered by steam driven engines.
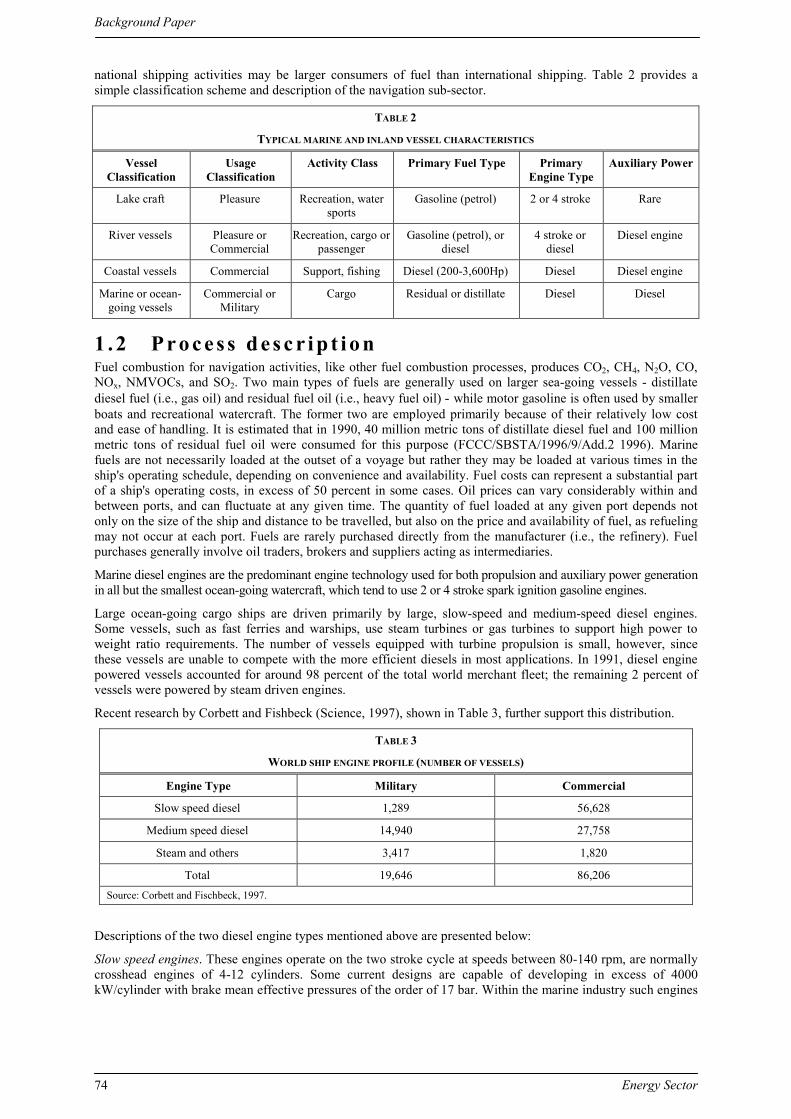
Recent research by Corbett and Fishbeck (Science, 1997), shown in Table 3, further support this distribution.
TABLE 3
WORLD SHIP ENGINE PROFILE (NUMBER OF VESSELS)
Engine Type Military Commercial
Slow speed diesel 1,289 56,628
Medium speed diesel 14,940 27,758
Steam and others 3,417 1,820
Total 19,646 86,206 Source: Corbett and Fischbeck, 1997.
Descriptions of the two diesel engine types mentioned above are presented below:
Slow speed engines. These engines operate on the two stroke cycle at speeds between 80-140 rpm, are normally crosshead engines of 4-12 cylinders. Some current designs are capable of developing in excess of 4000 kW/cylinder with brake mean effective pressures of the order of 17 bar. Within the marine industry such engines
Good Practice Guidance and Uncertainty Management in National Greenhouse Gas Inventories
CO2, CH4 and N2O Emissions from Transportation-Water-borne Navigation 75
are exclusively used for main propulsion purposes and comprise the greater proportion of installed power and hence fuel consumption within the industry (Lavender, et al. 1999).
Medium speed engines. These generally operate on the four stroke cycle at speeds ranging from 400-1000 rpm, are normally trunk piston engines of up to 12 cylinders in line or 20 cylinders in “V” formation. Current designs develop powers between 100-2000 kW/cylinder with brake mean effective pressures in the range 10-25 bar. Engines of this type may be used for both main propulsion and auxiliary purposes in the marine industry. For propulsion purposes such engines may be used in multi-engine installations and will normally be coupled to the propeller via a gearbox. Engines of this type will also be used in diesel electric installations (Lavender, et al. 1999).
1 . 3 Ga s e s e mi t t e d Carbon Dioxide (CO2)
As fossil fuels are combusted, the carbon stored in them is almost entirely emitted as CO2. The amount of carbon in fuels with a given energy content varies by fuel type. In general, emissions of CO2 from the combustion of fossil fuels in ships, boats, and other vessels used for navigation is a function of the carbon content of the fuel rather than the engine or combustion technology.
Methane (CH4)
Small quantities of methane can be produced when the hydrocarbons in fuels are not completely combusted. The methane content of the fuel, the engine type, the amount of non-combusted hydrocarbons passing through the engine, and post-combustion emission controls influence methane emissions. In uncontrolled engines the proportion of methane emissions is generally highest at low speeds and when the engine is at idle. Poorly tuned engines may have a particularly high output of methane.
Nitrous Oxide (N2O)
Nitrous oxide is produced during fossil fuel combustion when nitrogen in the air or fuel is oxidized in the high temperature environment of the engine. Although the extent of emissions from ships, boats, and other vessels is highly uncertain, they are thought to be small. Emissions are likely to be affected by fuel type and engine type. Emissions of N2O from ships, boats, and other navigation vessels are expected to be small, but may increase if post-combustion catalytic controls are installed. Such controls, however, are not common at this time.
Carbon Monoxide (CO)
Carbon monoxide is produced by the incomplete combustion of carbon in fossil fuels. Emissions of CO are a function of the efficiency of both the combustion and post-combustion emission controls. Emissions are highest when air-fuel mixtures are rich, i.e., with less oxygen than required for complete combustion. This condition generally occurs at idle, low speed, and cold start conditions in spark ignition engines. Once emitted, CO contributes to tropospheric ozone formation before the molecules are further oxidized to CO2 through natural processes in the atmosphere. When ships are in port, these emissions can add to an already degraded air quality condition. Carbon monoxide also interacts with the hydroxyl radicalthe major atmospheric sink for methane emissionsto form CO2. Therefore, increased atmospheric concentrations of CO limit the number of hydroxyl molecules (OH) available to destroy methane. CO emissions are likely to be affected by fuel type and engine type.
Nitrogen Oxides (NOx)
Nitrogen oxides include the chemical species NO and NO2. They also promote the formation of ozone in the troposphere. Emissions are related to the air fuel mix and combustion temperatures, as well as any emission control technologies employed. They are likely to be affected by fuel type and engine type. For uncontrolled vehicles the proportion of NOx emissions from a diesel-fueled vehicle is generally lower than that for a gasoline-fueled vehicle and lower from a light-duty vehicle than for a heavy-duty vehicle. (See Annex I for discussion of agreement to reduce NOx emissions under the IMO.)
Non-Methane Volatile Organic Compounds (NMVOCs)
Non-methane volatile organic compounds include compounds such as propane, butane, and ethane. These compounds participate, along with NOx, in the formation of tropospheric ozone and other photochemical oxidants. Emissions of NMVOCs are a function of the amount of hydrocarbons passing unburnt through the engine. This condition depends upon the engine type, fuel type, and use of post-combustion emission controls. Emissions are generally highest at low speeds and when the engine is at idle. Poorly tuned engines may have a particularly high output of NMVOCs.
Background Paper
Energy Sector 76
Sulphur Dioxide (SO2)
Emissions of sulphur dioxide are primarily a function of the sulphur content of the fuel. The sulphur content of petroleum-based fuels can vary from less than 0.3 percent to more than 5 percent. On average, distillate diesel fuel contains 0.3-0.5 percent sulphur and residual fuel oil around 2.3-3.0 percent. Emissions of SO2 can be reduced through changes in fuel sulphur contents or the use of sea water scrubbing (See Annex I for discussion of agreement to reduce SOx emissions under the IMO).
2 M E T H O D O L O G I C A L I S S U E S The IPCC Guidelines provide a general approach to estimate emissions from the combustion of fossil fuels for navigation. The activity data used is generally fuel consumption. The emission factor may be fuel type and/or technology type specific. The basic equation is:
Emissions = Fuel Consumption ● Emission Factor
The IPCC Guidelines provides two approaches, Tier 1 and 2. Both tiers use fuel consumption data. The Tier 1 approach does not use fuel type or engine type specificity for the non-CO2 gases (although it does for CO2), and therefore is assumed to be less accurate for the non-CO2 gases. The Tier 2 approach requires that calculations be performed with some fuel or vehicle type specificity and in some cases discusses engine type specificity. (Note: The authors recommend that additional engine type specificity be included in the Tier 2 methodology and improved default factors be provided.)
2 . 1 T i e r I Carbon Dioxide (CO2)
The IPCC Tier 1 or Reference approach for estimating CO2 emissions from the combustion of fossil fuels used for navigation is the same approach used for other energy sources. It is a "top-down" method that estimates emissions based on the consumption of fuels.
The steps in the methodology are as follows:
Step 1 - Estimate consumption of fuel
Fuel consumption data is generally collected and published by national or international agencies. The amount of fuel consumed in ships, boats and other vessels for navigation may have to be approximated using proxy data on the marine shipping industry or other metric.
Step 2 - Convert the fuel data to a common energy unit (TJ), if necessary
The fuel consumption data may not be reported in common units.
Step 3 - Select the carbon content factor for the fuel and estimate the total carbon content of the fuel.
Although default IPCC carbon emission factors are available, country-specific values should be used if possible.
Step 4 - Estimate the amount of carbon stored in products for long periods of time
If lubricants have been included in the estimates of fuel consumption, then the fraction of those lubricants which remain uncombusted should be subtracted from the consumption total. The oxidation of lubricants in ships is expected to be an extremely minor source of CO2 emissions.
Step 5 - Account for carbon not oxidized during combustion
The fraction unoxidized is a function of the type of fuel, the combustion technology, and the operation and maintenance practices. The default value for most common petroleum fuels combusted in typical engines is near 1 percent.
Step 6 - Convert emissions of carbon to full molecular weight of CO2
This step is done by multiplying by the molecular weight ratio of carbon to CO2, which is approximately 12/44.
Non-CO2 gases (CH4, N2O, CO, NOx, NMVOCs, and SO2)
The simple default Tier 1 methodology for estimating emissions of non-CO2 gases from the navigation component of the transport sector uses aggregate petroleum-based fuel consumption data weighted on an energy content basis. No detailed fuel type of engine type specificity is made except in the case of SO2 emissions, where additional fuel type specificity is needed to estimate the sulphur content of the fuels combusted.
Good Practice Guidance and Uncertainty Management in National Greenhouse Gas Inventories
CO2, CH4 and N2O Emissions from Transportation-Water-borne Navigation 77
2 . 2 T i e r 2 The Tier 2 IPCC approach requires only minor additional specificity. The IPCC Guidelines do not currently provide Tier 2 default emission factors by fuel type and engine type. In theory, the IPCC approach would use the equation below to estimate emissions of non-CO2 gases.
EQUATION 1
Emissions = Σ (EFij ● Activityij)
Where: EF: Emission Factor (g/MJ or g/kg fuel) Activity: Fuel Consumption (MJ or kg) i: Fuel type j: Engine type
Estimates for CO2 using the Tier 1 methodology already require fuel type specificity, and the accuracy of those estimates are unlikely to be improved by the addition of engine type specificity. Emissions of non-CO2 gases are far more dependent upon the engine characteristics and technology than CO2 emissions. In the case of SO2, the sulphur content of the fuel is the primary factor.
It is important to note that the existing default emission factors presented in the IPCC Guidelines are currently inadequate to estimate emissions of non-CO2 gases using well characterized activity data by fuel and engine type.
2 . 3 E mi s s i o n s fa c t o r s The IPCC Guidelines provides default emission factors for each fuel type across broad categories of sectors. These values are based on published research and expert recommendations. However, fuel quality and composition can vary widely between countries, resulting in a similarly wide range of emission factors. Thus country-specific emission factors should be used whenever possible.
2.3.1 Tier 1 Carbon Dioxide (CO2)
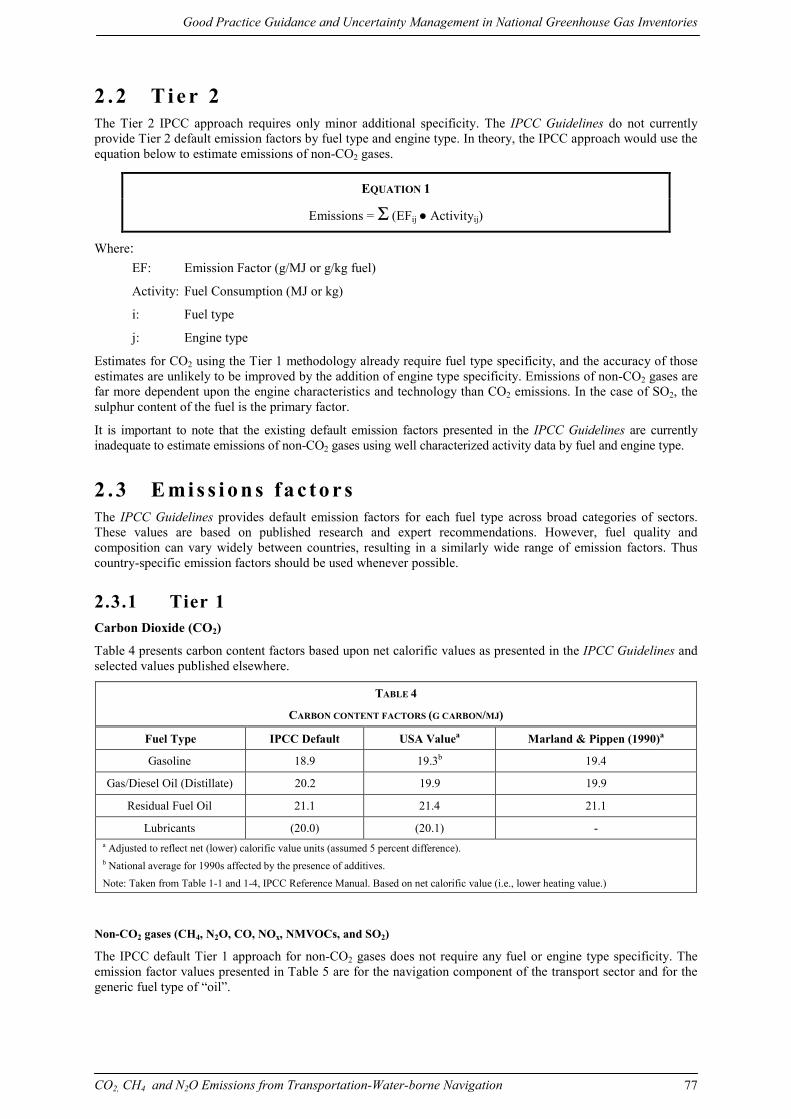
Table 4 presents carbon content factors based upon net calorific values as presented in the IPCC Guidelines and selected values published elsewhere.
TABLE 4
CARBON CONTENT FACTORS (G CARBON/MJ)
Fuel Type IPCC Default USA Valuea Marland & Pippen (1990)a
Gasoline 18.9 19.3b 19.4
Gas/Diesel Oil (Distillate) 20.2 19.9 19.9
Residual Fuel Oil 21.1 21.4 21.1
Lubricants (20.0) (20.1) - a Adjusted to reflect net (lower) calorific value units (assumed 5 percent difference). b National average for 1990s affected by the presence of additives. Note: Taken from Table 1-1 and 1-4, IPCC Reference Manual. Based on net calorific value (i.e., lower heating value.)
Non-CO2 gases (CH4, N2O, CO, NOx, NMVOCs, and SO2)
The IPCC default Tier 1 approach for non-CO2 gases does not require any fuel or engine type specificity. The emission factor values presented in Table 5 are for the navigation component of the transport sector and for the generic fuel type of “oil”.
Background Paper
Energy Sector 78
TABLE 5
CH4, N2O, CO, NOX, AND NMVOCS EMISSION FACTORS FOR NAVIGATION (KG/TJ)
Gas (uncontrolled) IPCC Defaults
CH4 5
N2O 0.6
CO 1,000
NOx 1,500
NMVOCs 200 Note: Taken from Table 1-7, 1-8, 1-9, 1-10, and 1-11, IPCC Reference Manual. Based on net calorific value (i.e., lower heating value.)
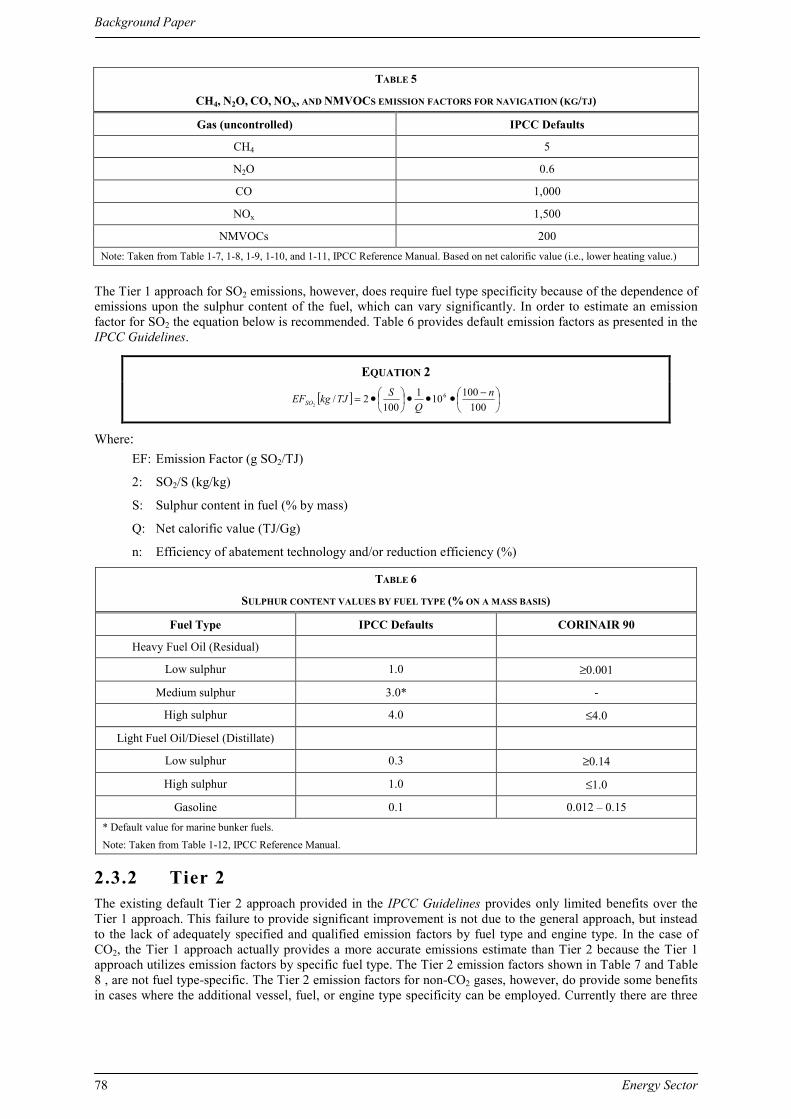
The Tier 1 approach for SO2 emissions, however, does require fuel type specificity because of the dependence of emissions upon the sulphur content of the fuel, which can vary significantly. In order to estimate an emission factor for SO2 the equation below is recommended. Table 6 provides default emission factors as presented in the IPCC Guidelines.
EQUATION 2
[ ]
−
= ••••100
100101100
2/ 62
nQ
STJkgEFSO
Where: EF: Emission Factor (g SO2/TJ) 2: SO2/S (kg/kg)
S: Sulphur content in fuel (% by mass) Q: Net calorific value (TJ/Gg)
n: Efficiency of abatement technology and/or reduction efficiency (%)
TABLE 6
SULPHUR CONTENT VALUES BY FUEL TYPE (% ON A MASS BASIS)
Fuel Type IPCC Defaults CORINAIR 90
Heavy Fuel Oil (Residual)
Low sulphur 1.0 ≥0.001
Medium sulphur 3.0* -
High sulphur 4.0 ≤4.0
Light Fuel Oil/Diesel (Distillate)
Low sulphur 0.3 ≥0.14
High sulphur 1.0 ≤1.0
Gasoline 0.1 0.012 – 0.15 * Default value for marine bunker fuels. Note: Taken from Table 1-12, IPCC Reference Manual.
2.3.2 Tier 2 The existing default Tier 2 approach provided in the IPCC Guidelines provides only limited benefits over the Tier 1 approach. This failure to provide significant improvement is not due to the general approach, but instead to the lack of adequately specified and qualified emission factors by fuel type and engine type. In the case of CO2, the Tier 1 approach actually provides a more accurate emissions estimate than Tier 2 because the Tier 1 approach utilizes emission factors by specific fuel type. The Tier 2 emission factors shown in Table 7 and Table 8 , are not fuel type-specific. The Tier 2 emission factors for non-CO2 gases, however, do provide some benefits in cases where the additional vessel, fuel, or engine type specificity can be employed. Currently there are three
Good Practice Guidance and Uncertainty Management in National Greenhouse Gas Inventories
CO2, CH4 and N2O Emissions from Transportation-Water-borne Navigation 79
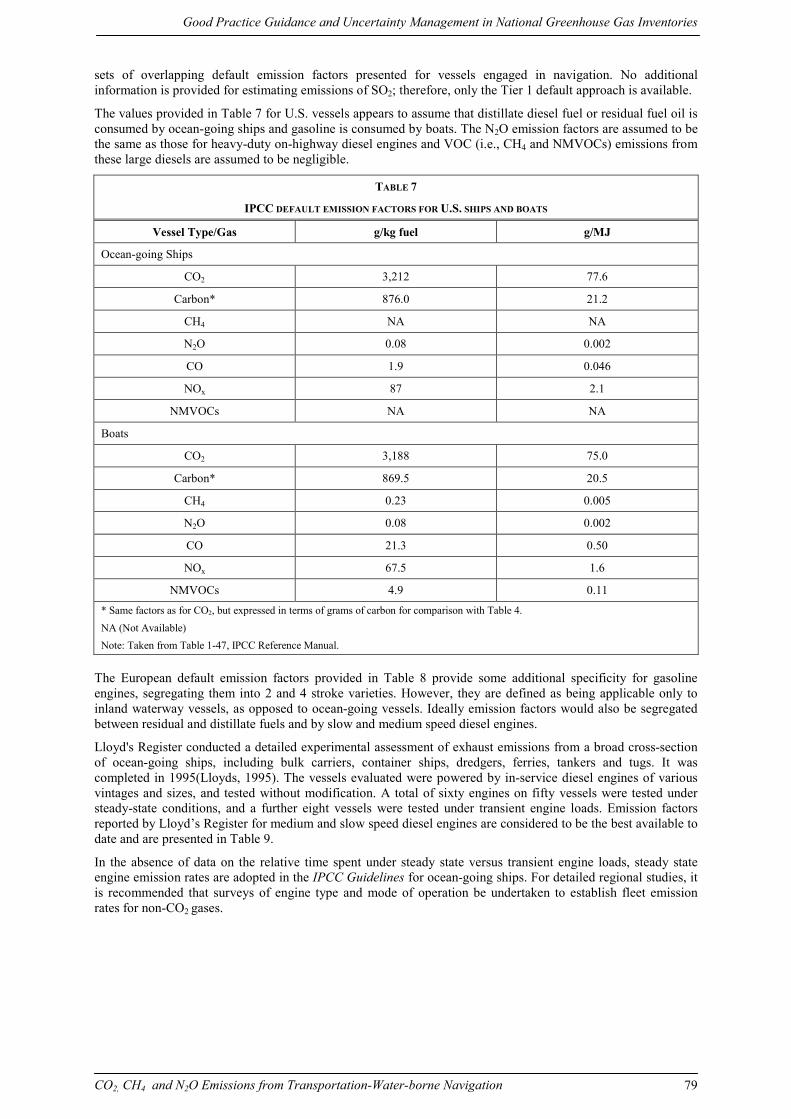
sets of overlapping default emission factors presented for vessels engaged in navigation. No additional information is provided for estimating emissions of SO2; therefore, only the Tier 1 default approach is available.
The values provided in Table 7 for U.S. vessels appears to assume that distillate diesel fuel or residual fuel oil is consumed by ocean-going ships and gasoline is consumed by boats. The N2O emission factors are assumed to be the same as those for heavy-duty on-highway diesel engines and VOC (i.e., CH4 and NMVOCs) emissions from these large diesels are assumed to be negligible.
TABLE 7
IPCC DEFAULT EMISSION FACTORS FOR U.S. SHIPS AND BOATS
Vessel Type/Gas g/kg fuel g/MJ
Ocean-going Ships
CO2 3,212 77.6
Carbon* 876.0 21.2
CH4 NA NA
N2O 0.08 0.002
CO 1.9 0.046
NOx 87 2.1
NMVOCs NA NA
Boats
CO2 3,188 75.0
Carbon* 869.5 20.5
CH4 0.23 0.005
N2O 0.08 0.002
CO 21.3 0.50
NOx 67.5 1.6
NMVOCs 4.9 0.11
* Same factors as for CO2, but expressed in terms of grams of carbon for comparison with Table 4. NA (Not Available) Note: Taken from Table 1-47, IPCC Reference Manual.
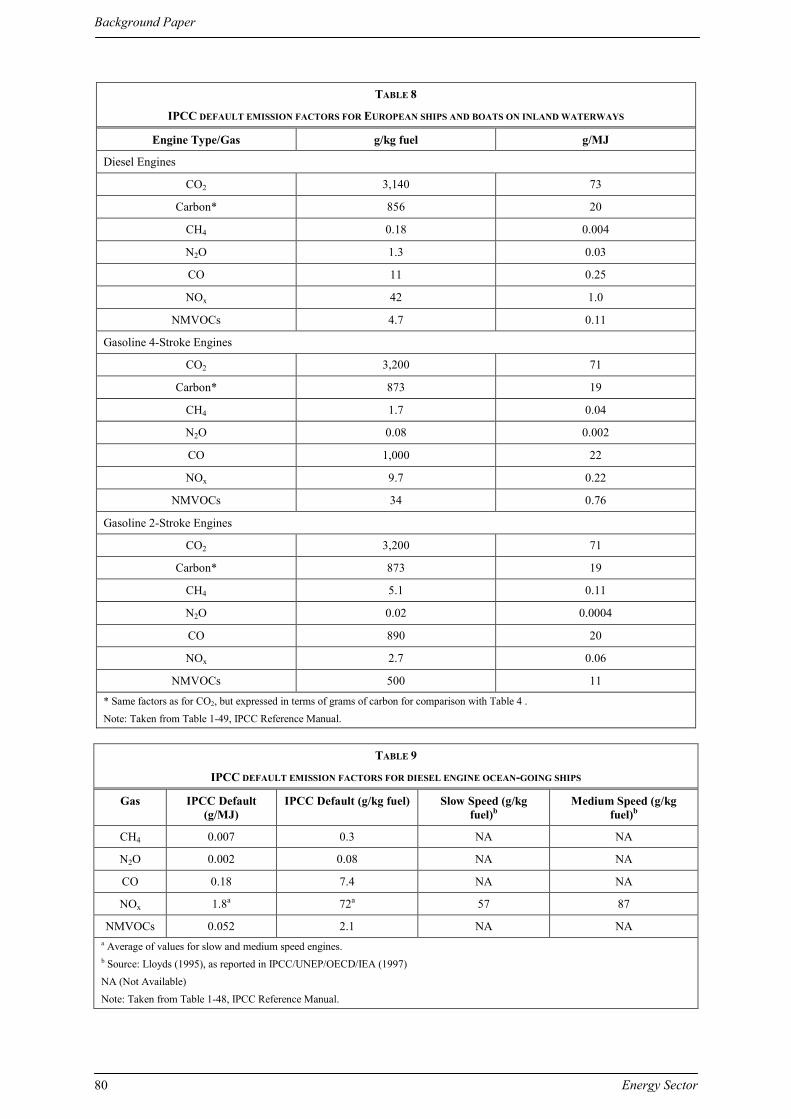
The European default emission factors provided in Table 8 provide some additional specificity for gasoline engines, segregating them into 2 and 4 stroke varieties. However, they are defined as being applicable only to inland waterway vessels, as opposed to ocean-going vessels. Ideally emission factors would also be segregated between residual and distillate fuels and by slow and medium speed diesel engines.
Lloyd's Register conducted a detailed experimental assessment of exhaust emissions from a broad cross-section of ocean-going ships, including bulk carriers, container ships, dredgers, ferries, tankers and tugs. It was completed in 1995(Lloyds, 1995). The vessels evaluated were powered by in-service diesel engines of various vintages and sizes, and tested without modification. A total of sixty engines on fifty vessels were tested under steady-state conditions, and a further eight vessels were tested under transient engine loads. Emission factors reported by Lloyd’s Register for medium and slow speed diesel engines are considered to be the best available to date and are presented in Table 9.
In the absence of data on the relative time spent under steady state versus transient engine loads, steady state engine emission rates are adopted in the IPCC Guidelines for ocean-going ships. For detailed regional studies, it is recommended that surveys of engine type and mode of operation be undertaken to establish fleet emission rates for non-CO2 gases.
Background Paper
Energy Sector 80
TABLE 8
IPCC DEFAULT EMISSION FACTORS FOR EUROPEAN SHIPS AND BOATS ON INLAND WATERWAYS
Engine Type/Gas g/kg fuel g/MJ
Diesel Engines
CO2 3,140 73
Carbon* 856 20
CH4 0.18 0.004
N2O 1.3 0.03
CO 11 0.25
NOx 42 1.0
NMVOCs 4.7 0.11
Gasoline 4-Stroke Engines
CO2 3,200 71
Carbon* 873 19
CH4 1.7 0.04
N2O 0.08 0.002
CO 1,000 22
NOx 9.7 0.22
NMVOCs 34 0.76
Gasoline 2-Stroke Engines
CO2 3,200 71
Carbon* 873 19
CH4 5.1 0.11
N2O 0.02 0.0004
CO 890 20
NOx 2.7 0.06
NMVOCs 500 11
* Same factors as for CO2, but expressed in terms of grams of carbon for comparison with Table 4 . Note: Taken from Table 1-49, IPCC Reference Manual.
TABLE 9
IPCC DEFAULT EMISSION FACTORS FOR DIESEL ENGINE OCEAN-GOING SHIPS
Gas IPCC Default (g/MJ)
IPCC Default (g/kg fuel) Slow Speed (g/kg fuel)b
Medium Speed (g/kg fuel)b
CH4 0.007 0.3 NA NA
N2O 0.002 0.08 NA NA
CO 0.18 7.4 NA NA
NOx 1.8a 72a 57 87
NMVOCs 0.052 2.1 NA NA a Average of values for slow and medium speed engines. b Source: Lloyds (1995), as reported in IPCC/UNEP/OECD/IEA (1997) NA (Not Available) Note: Taken from Table 1-48, IPCC Reference Manual.
Good Practice Guidance and Uncertainty Management in National Greenhouse Gas Inventories
CO2, CH4 and N2O Emissions from Transportation-Water-borne Navigation 81
For slow to medium speed diesel engines, considered to be representative of large ocean-going cargo ships, Lloyd’s Register (1995) reported NOx emission rates of 57 and 87 g/kg (i.e., 1.4 and 2.2 g/MJ) of fuel, respectively. In the absence of data on the fleet composition of slow versus medium speed diesel engines for ocean going fleets, a NOx emission factor of 72 g/kg of fuel (i.e., 1.8 g/MJ) is recommended in the IPCC Guidelines, which is simply the mean of the two values. In the Lloyds (1995) study, CH4 and NMVOCs emission rates are estimated from hydrocarbon (HC) data as CH4 = 0.12 • HC and NMVOCs = HC - CH4.
Lloyd’s Register reported a CO emission rate of 7.4 g/kg (0.18 g/MJ) of fuel for slow to medium speed diesel engines. The IPCC Guidelines recommends the use of this value.
In general, the differences in these emission factors illustrate the need to better characterize vessel engine types and fuel use for emissions from navigation vessels. Emission factors for CH4 and N2O are especially uncertain.
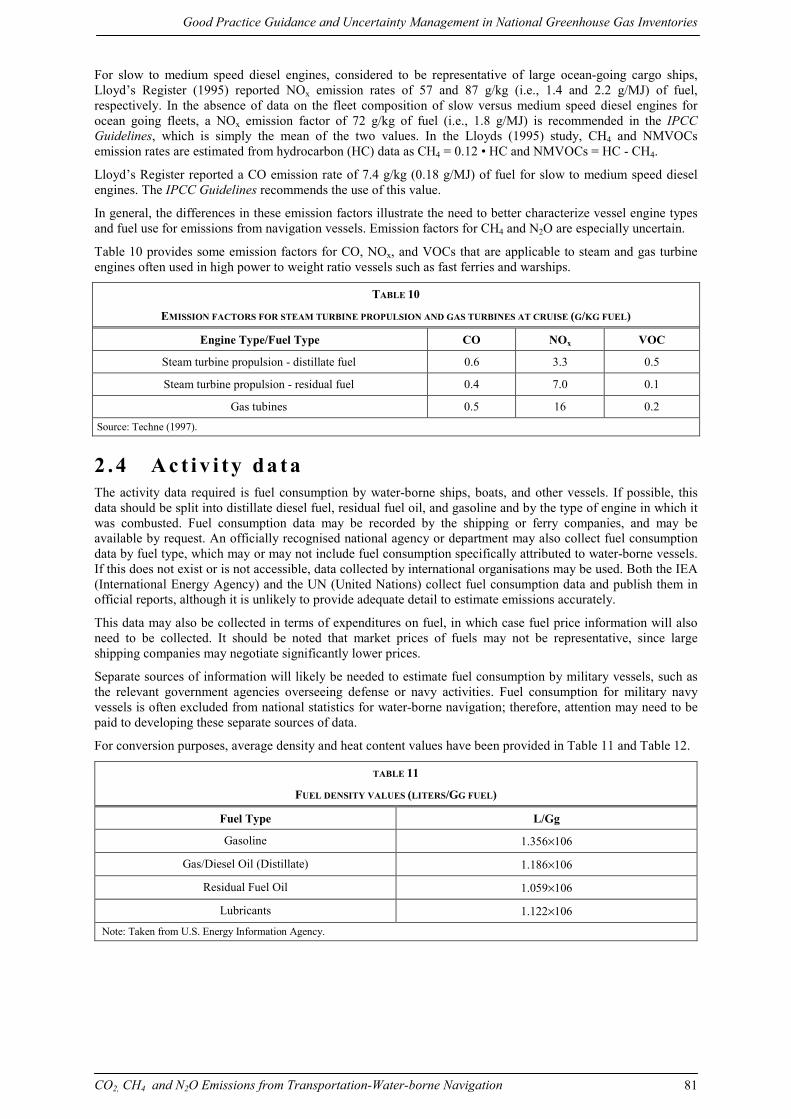
Table 10 provides some emission factors for CO, NOx, and VOCs that are applicable to steam and gas turbine engines often used in high power to weight ratio vessels such as fast ferries and warships.
TABLE 10
EMISSION FACTORS FOR STEAM TURBINE PROPULSION AND GAS TURBINES AT CRUISE (G/KG FUEL)
Engine Type/Fuel Type CO NOx VOC
Steam turbine propulsion - distillate fuel 0.6 3.3 0.5
Steam turbine propulsion - residual fuel 0.4 7.0 0.1
Gas tubines 0.5 16 0.2
Source: Techne (1997).
2 . 4 A c t i v i ty da t a The activity data required is fuel consumption by water-borne ships, boats, and other vessels. If possible, this data should be split into distillate diesel fuel, residual fuel oil, and gasoline and by the type of engine in which it was combusted. Fuel consumption data may be recorded by the shipping or ferry companies, and may be available by request. An officially recognised national agency or department may also collect fuel consumption data by fuel type, which may or may not include fuel consumption specifically attributed to water-borne vessels. If this does not exist or is not accessible, data collected by international organisations may be used. Both the IEA (International Energy Agency) and the UN (United Nations) collect fuel consumption data and publish them in official reports, although it is unlikely to provide adequate detail to estimate emissions accurately.
This data may also be collected in terms of expenditures on fuel, in which case fuel price information will also need to be collected. It should be noted that market prices of fuels may not be representative, since large shipping companies may negotiate significantly lower prices.
Separate sources of information will likely be needed to estimate fuel consumption by military vessels, such as the relevant government agencies overseeing defense or navy activities. Fuel consumption for military navy vessels is often excluded from national statistics for water-borne navigation; therefore, attention may need to be paid to developing these separate sources of data.
For conversion purposes, average density and heat content values have been provided in Table 11 and Table 12.
TABLE 11
FUEL DENSITY VALUES (LITERS/GG FUEL)
Fuel Type L/Gg
Gasoline 1.356×10⁶
Gas/Diesel Oil (Distillate) 1.186×10⁶
Residual Fuel Oil 1.059×10⁶
Lubricants 1.122×10⁶
Note: Taken from U.S. Energy Information Agency.
Background Paper
Energy Sector 82
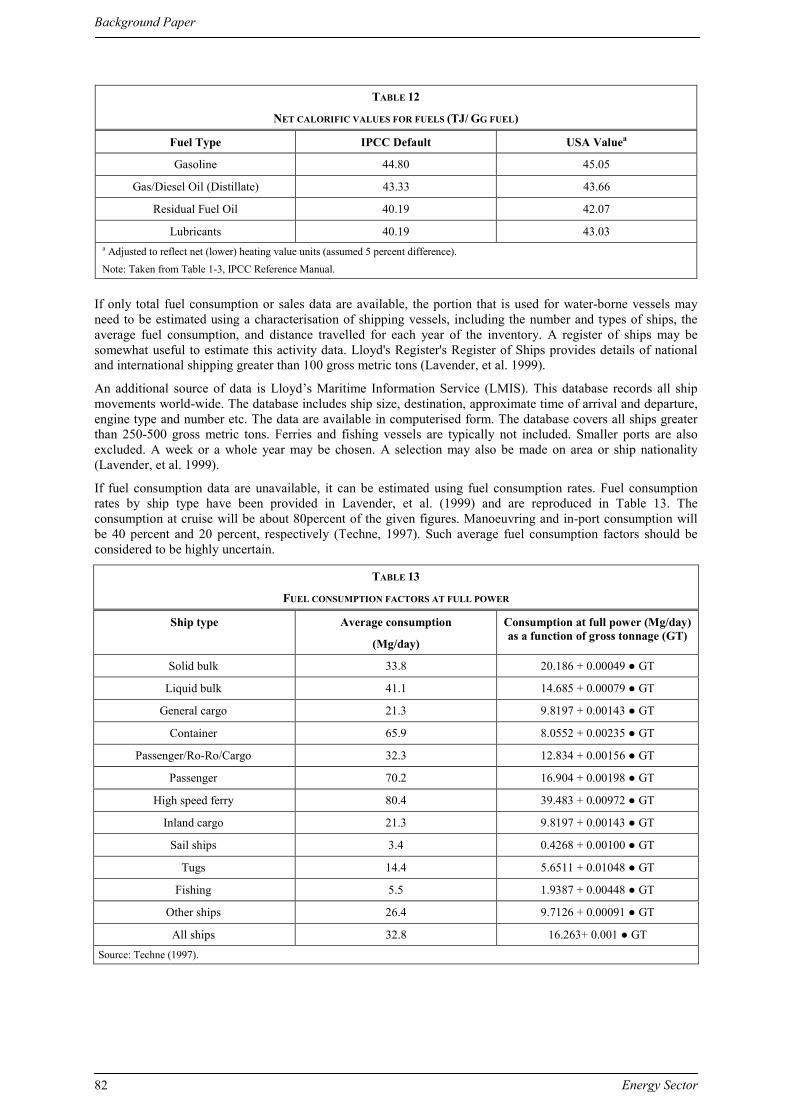
TABLE 12
NET CALORIFIC VALUES FOR FUELS (TJ/ GG FUEL)
Fuel Type IPCC Default USA Valuea
Gasoline 44.80 45.05
Gas/Diesel Oil (Distillate) 43.33 43.66
Residual Fuel Oil 40.19 42.07
Lubricants 40.19 43.03 a Adjusted to reflect net (lower) heating value units (assumed 5 percent difference). Note: Taken from Table 1-3, IPCC Reference Manual.
If only total fuel consumption or sales data are available, the portion that is used for water-borne vessels may need to be estimated using a characterisation of shipping vessels, including the number and types of ships, the average fuel consumption, and distance travelled for each year of the inventory. A register of ships may be somewhat useful to estimate this activity data. Lloyd's Register's Register of Ships provides details of national and international shipping greater than 100 gross metric tons (Lavender, et al. 1999).
An additional source of data is Lloyd’s Maritime Information Service (LMIS). This database records all ship movements world-wide. The database includes ship size, destination, approximate time of arrival and departure, engine type and number etc. The data are available in computerised form. The database covers all ships greater than 250-500 gross metric tons. Ferries and fishing vessels are typically not included. Smaller ports are also excluded. A week or a whole year may be chosen. A selection may also be made on area or ship nationality (Lavender, et al. 1999).
If fuel consumption data are unavailable, it can be estimated using fuel consumption rates. Fuel consumption rates by ship type have been provided in Lavender, et al. (1999) and are reproduced in Table 13. The consumption at cruise will be about 80percent of the given figures. Manoeuvring and in-port consumption will be 40 percent and 20 percent, respectively (Techne, 1997). Such average fuel consumption factors should be considered to be highly uncertain.
TABLE 13
FUEL CONSUMPTION FACTORS AT FULL POWER
Ship type Average consumption
(Mg/day)
Consumption at full power (Mg/day) as a function of gross tonnage (GT)
Solid bulk 33.8 20.186 + 0.00049 ● GT
Liquid bulk 41.1 14.685 + 0.00079 ● GT
General cargo 21.3 9.8197 + 0.00143 ● GT
Container 65.9 8.0552 + 0.00235 ● GT
Passenger/Ro-Ro/Cargo 32.3 12.834 + 0.00156 ● GT
Passenger 70.2 16.904 + 0.00198 ● GT
High speed ferry 80.4 39.483 + 0.00972 ● GT
Inland cargo 21.3 9.8197 + 0.00143 ● GT
Sail ships 3.4 0.4268 + 0.00100 ● GT
Tugs 14.4 5.6511 + 0.01048 ● GT
Fishing 5.5 1.9387 + 0.00448 ● GT
Other ships 26.4 9.7126 + 0.00091 ● GT
All ships 32.8 16.263+ 0.001 ● GT Source: Techne (1997).
Good Practice Guidance and Uncertainty Management in National Greenhouse Gas Inventories
CO2, CH4 and N2O Emissions from Transportation-Water-borne Navigation 83
2 . 5 A l l o ca t io n o f n a t io na l ve r su s i n t e r na t ion a l b u n ke r f u e l emi s s i o n s
One of the most important steps in estimating emissions from water-borne navigation under the framework established by the IPCC Guidelines is the allocation of fuel consumption, and therefore emissions, between national and international marine bunkers. Again, fuel consumption for international marine bunkers is to be reported by country from which the fuel was sold for the direct purpose of being used as an international bunker fuel; independent of the registry or ownership of the ship.
There are some issues related to the definition of international bunker fuels in regard to military activities. Clear definitions of what portion of fuel consumed by military ships and boats should be allocated as international marine bunker fuels are needed. The nature of military activities do not always fit the existing point to point model applied to cargo shipping, as military vessels often stay at sea for long periods of time and then return to the same port from which they departed.
2 . 6 U n c e r t a in t y Parallel to the IPCC sector-specific workshops on good practice guidance, the IPCC is completing a programme of work on emissions inventory uncertainty. This work will result in recommendations to the UNFCCC on approaches to assessing and managing uncertainty. During the IPCC Inventory Experts Group Meeting in Paris (October 1998), technical experts in the uncertainty programme came up with a series of questions to be answered in the sector workshops. Specifically, the sector workshops should provide answers to these questions in the individual source context. The questions are listed in the general background paper.
Uncertainty in activity data will depend upon the reliability of the data collection agent and the degree to which all fuel consumed in water-borne vessels is captured. If actual fuel consumption data is not available and instead proxy data such as fuel expenditures is used, then the overall uncertainty in the emissions estimate would be expected to be greater.
The uncertainty in emission factors varies by gas. The uncertainty in the N2O emission factors for water-borne vessels are considerably higher than for CH4, CO, NOx, or NMVOCs. All of these gases involve far more uncertainty than the carbon content factors for CO2 emissions. The carbon content factors by specific fuel type are likely to be accurate to within ±5 percent.
Possibly the greatest determinant of the overall uncertainty in these estimates is the allocation of fuel consumption between national and international marine bunker fuels. For most countries, the portion of total emissions from water-borne vessels that is reported separately as international marine bunkers is expected to be large. The detailed data to quantify this allocation is expected to be difficult to obtain, and is complicated by diverse ship registrations, dispersed ship ownership, and fuel purchases abroad.
2 . 7 C o mp l e t e n e s s Given that fuel consumption data are generally available, each country is expected to create a complete inventory of emissions estimates for all water-borne vessel fuel combustion-related emissions. If fuel consumption data are unavailable, countries may use other data such as ship routing and distance travelled information as a proxy for fuel consumption, for example from Lloyd’s LMIS database. This approach, however, would not capture national in-port fuel consumption or consumption on in-land waterways.
A complete inventory should include emissions of non-CO2 gases. The IPCC has provided default emission factors that can be applied to the same fuel consumption data used to estimate CO2 emissions. Again, it should be noted that the existing Tier 2 default emission factors are not adequate to develop a detailed inventory of non-CO2 gas emissions by fuel and engine type.
2 . 8 O t h e r i mp o r t a n t i s s u es
2.8.1 Baseline An emissions baseline is an important component of an inventory programme. Below is a description of issues related to creating a baseline for the method recommended by the IPCC:
• Fuel consumption data are not available for the baseline period;
Background Paper
Energy Sector 84
• Fuel consumption data are not broken out into the types used by ships, boats, and other vessels versus the overall transport sector;
• Inadequate data exists to estimate fuel consumption by ships departing domestic ports and segregating that data by ships departing on domestic and international voyages;
• Over time, changes in engine technology lead to the need to revise emission factors;
• Over time, changes in fuel composition change emission factors, especially for sulphur dioxide, and
• Emissions estimation methods used during the baseline period differ from the methods used after the baseline.
Approaches to overcoming issues of data include collecting aggregate historical fuel consumption data and using current data to break out historical population data into the fuel types. Changes in technology and fuel composition should be reflected in the emission factors. If the default emission factors do not accurately represent the current technologies, alternate, country-specific factors should be used with documentation. If the estimation methods used during the baseline period differ from methods used after the baseline period, baseline and all historical, post-baseline emissions should be estimated and reported using the new methodology. Generally, an appropriate method involves creating trends on fuel consumption and industry characteristics with data collected with the post-baseline methods. The trends can be used to back-estimate the fuel consumption and for the baseline and historical, post-baseline periods. The estimated characteristics are then used to estimate baseline emissions.
2.8.2 Reconciliation of fuel consumption data The estimates of fuel consumption by the water-borne navigation sub-sector of the transport sector should be cross-checked with total fuel consumption across all transport sub-sectors to ensure that the sum of the parts does not exceed the reported totals. In particular, the consumption of residual fuel oil by marine shipping vessels is likely to be a large proportion of total consumption of residual fuel by the transport sector. Similarly, total navigation fuel consumption data should be cross-checked with total fuel consumption across all energy sectors.
2.8.3 Accounting for the effects of mitigation options Emissions mitigation measures may include changes in specific fuel use (i.e., towards fuel with lower emission factors or a reduction of total fuel consumption). These changes should be captured by the estimating methodology.
The extent to which a national inventory is sensitive to the effects of mitigation efforts depends on the quality of both the data and the characterisation of the international marine industry. A national inventory that is based on a well-characterised marine industry will reflect efforts to mitigate methane emissions. In contrast, an inventory based on a poorly characterised marine industry with poor data will likely not be sensitive to mitigation efforts.
3 R E P O R T I N G A N D D O C U M E N T A T I O N A recent report from the UNFCCC Secretariat “Methodological Issues Identified While Processing Second National Communications” (UNFCCC/SBSTA/1998/7) noted that 22 Parties reported emissions from bunker fuels, but only 8 differentiated between aviation and marine bunker fuel emissions. In addition, not all off these countries reported non-CO2 gases as well as CO2.
Reporting methods transparently is an important part of the inventory process. Towards this end, countries should indicate whether they use default IPCC emission factors to estimate emissions for any of the gases. In addition, it is important that all information used to estimate emissions be available either directly in National Communications or indirectly by citing other documents. Countries should report the fuel consumption amount for each fuel type. Countries should also report the source of the activity data and describe the data collection methods. It is also recommended that fuel consumption by water-borne vessels be reported in either the National Communication or in another document cited in the National Communication. Countries should pay particular attention to reporting and documenting how they allocated their fuel consumption data to either national or international marine bunkers.
3 . 1 C u r r e n t I P CC r e p o r t in g g u i d e l i ne s The IPCC Guidelines are used to guide countries in the preparation and submissions of annual greenhouse gas emissions inventories to the UNFCCC. The Guidelines establish:
Good Practice Guidance and Uncertainty Management in National Greenhouse Gas Inventories
CO2, CH4 and N2O Emissions from Transportation-Water-borne Navigation 85
• Standard tables, definitions, units, and time intervals for reporting all types of emissions;
• Necessary documentation to enable comparison of national inventories, including worksheets, major assumptions, methodological descriptions, and enough data to allow a third party to reconstruct the inventory from national activity data and assumptions; and
• An uncertainty assessment.
Emission estimates for CO2, CH4, N2O, CO, NOx, NMVOCs, and SO2 from the combustion of fossil fuels for national navigation and international marine bunkers are reported in Table 1: Sectoral Report for Energy.
3 . 2 C o n f i d en t i a l b u s i n es s i n f o rma t i o n In the case where there are very few marine shipping and transportation companies, disclosure of confidential information may be an issue. This issue may be especially problematic if information is collected directly from ships or companies, or if fuel expenditure data and fuel purchase price data are used as a proxy for fuel consumption.
4 I N V E N T O R Y Q U A L I T Y
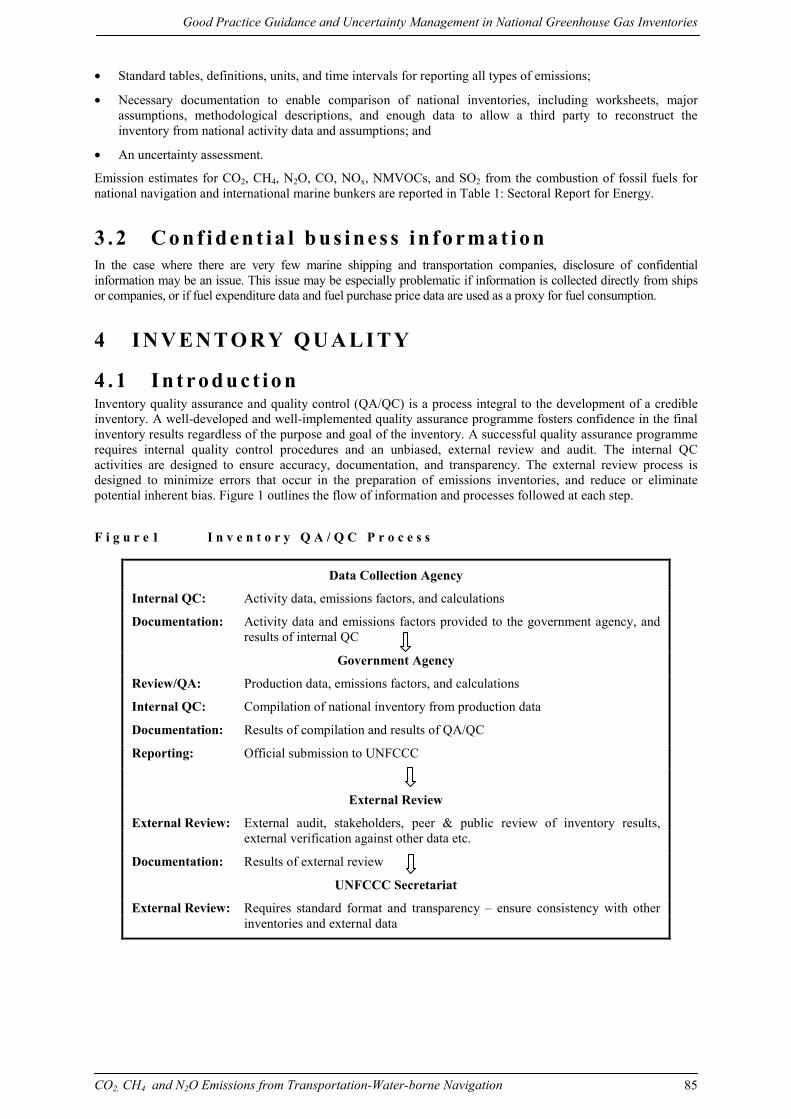
4 . 1 I n t r o d u c t i o n Inventory quality assurance and quality control (QA/QC) is a process integral to the development of a credible inventory. A well-developed and well-implemented quality assurance programme fosters confidence in the final inventory results regardless of the purpose and goal of the inventory. A successful quality assurance programme requires internal quality control procedures and an unbiased, external review and audit. The internal QC activities are designed to ensure accuracy, documentation, and transparency. The external review process is designed to minimize errors that occur in the preparation of emissions inventories, and reduce or eliminate potential inherent bias. Figure 1 outlines the flow of information and processes followed at each step.
F i g u r e 1 I n v e n t o r y Q A / Q C P r o c e s s
Data Collection Agency
Internal QC: Activity data, emissions factors, and calculations
Documentation: Activity data and emissions factors provided to the government agency, and results of internal QC
Government Agency
Review/QA: Production data, emissions factors, and calculations
Internal QC: Compilation of national inventory from production data
Documentation: Results of compilation and results of QA/QC
Reporting: Official submission to UNFCCC
External Review
External Review: External audit, stakeholders, peer & public review of inventory results, external verification against other data etc.
Documentation: Results of external review
UNFCCC Secretariat
External Review: Requires standard format and transparency – ensure consistency with other inventories and external data
Background Paper
Energy Sector 86
4 . 2 I n t e r na l i nv en t o ry QA / QC s ys t e ms
4.2.1 Emissions factors
Emissions Factors QC
The emissions factors are based on default data. QC procedures include reviewing the available default values and documenting the rationale for selecting alternate values, which may include country-specific values that may be a more accurate. Other QC procedures are not required.
Emissions Factors Documentation
Documentation is a crucial component of the review process because it enables reviewers to identify mistakes and suggest improvements. Among others, a detailed description of the equations used to estimate emissions factors is needed. In addition, a standardized reporting form is recommended to provide transparent information on the steps taken to calculate the emissions factor. Each step should contain the numbers used in each calculation, including the source of any data collected.
4.2.2 Activity data
Activity Data QC
Fuel consumption data are generally collected by a country’s ministry of energy, transportation, trade, or a similar organisation focused on these sectors. The data are generally not collected for greenhouse gas inventories. The personnel that collect data are responsible for reviewing the data collection methods, checking the data to ensure they were collected and aggregated correctly, and cross-checking the data with previous years to ensure the data are reasonable. In addition to a description of weak spots and suggestions for improvement, the basis for the estimates, whether statistical surveys or “desk estimates,” must be reviewed and described as part of the QC effort.
It is recommended that activity data QC take place annually. Even if data collection methods remain constant, it is important to assess annually whether the data collection methods, such as surveys and interviews, accurately represent the marine shipping and transportation industry.
Activity Data Documentation
Documentation is a crucial component of the review process, because it enables reviewers to identify mistakes and suggest improvements. Among others, the following information is needed by the reviewing/auditing agency:
• A highly detailed description of the methods used to collect the activity data, and
• A discussion of potential areas of bias in the data, including a discussion of whether the fuel consumption estimates are representative of the country.
4.2.3 Inventory agency level activities
Inventory Agency Review (QA) of Activity Data
Before accepting the activity data, the inventory agency should assess the activity data, including all data on fuel consumption and fuel characteristics. This review involves close cooperation with the personnel responsible for collecting, compiling, and analysing the data. The assessment should include a review of the detailed methods used to collect the data, including a review of any surveys and interviews performed to collect the data. In addition, the assessment should include a comparison of the activity data with historical data, a discussion of the potential for bias, and recommendations for improvement.
Inventory Agency QC on Compiling National Emissions
In addition to a thorough quality assessment of data discussed above, the inventory agency should ensure that the process of aggregating data to develop the national inventory undergoes quality control. This should include, among other things:
• Cross-referencing the aggregated fuel consumption data with the national totals;
Good Practice Guidance and Uncertainty Management in National Greenhouse Gas Inventories
CO2, CH4 and N2O Emissions from Transportation-Water-borne Navigation 87
• Checking the allocation of fuels to navigation activities and then the further allocation of national and international bunker fuel-related fuel consumption, and
• Comparing with national trends to look for anomalies.
Inventory Agency Documentation on Compiling National Emissions
A QA/QC management plan should address the specific items needed to perform audits and reviews. Examples of the types of information needed for documentation and external audit include:
• A detailed description of the inventory methodology;
• Identification of the input parameters that are needed and how the input parameters are obtained, and
• Frequency of data collection and estimation and results of determinations of accuracy and precision.
4 . 3 E x t e r na l I nv en t o ry QA / QC S y s t e ms External QA activities include a planned system of review and audit procedures conducted by personnel not actively involved in the inventory development process. The key concept is independent, objective review to assess the effectiveness of the internal QC programme, the quality of the inventory, and to reduce or eliminate any inherent bias in the inventory processes. Several types of external reviews, or audits, may be appropriate for the emissions inventory. Reviews should always occur when methods change. If methods do not change, it is recommended that countries review the methods annually, or, if resources are limited, every three to four years.
• Third party audit by an accredited organization, expert, independent third party: An audit of the documentation and calculations ensures that each number is traceable to its origin.
• Expert (peer) review: Although a detailed peer review would be appropriate when a procedure for determining CH4 emissions is first adopted or revised; it would not be needed on an annual basis. Such a review is designed to ensure that the methodology is rigorous, accurate, and that the data and assumptions reflect the best available information.
• Stakeholder review: Review by industrial organisations and government can provide a forum for review of the methods used, such as a review of the fuel consumption data and allocation.
• Public review: Some countries make their entire inventory available for public review and comment. This process may result in a range of comments and issues broader than those from other review processes.
Confidential Business Information Issues
Confidentiality may become an issue in cases where there are a small number of organisations. In these cases there may be opposition or legal constraints to releasing activity data to the public.
5 C O N C L U S I O N S Most countries have a national and international navigation component of their transportation sector. The combustion of fossil fuels for these activities produces emissions of various greenhouse gases, including carbon dioxide (CO2), methane (CH4), and nitrous oxide (N2O). Carbon dioxide is the primary direct greenhouse gas emitted from navigation.
Emissions resulting from the combustion of fuels used for international transport activities, termed international bunker fuels under the UN Framework Convention on Climate Change (UNFCCC), are currently not included in national emission totals, but are to be reported separately according to the country from which the fuel was sold. In general, the methodology in the IPCC Guidelines recommends that emissions from navigation be estimated by multiplying the amount of fuel consumed by an appropriate emissions factor. Although some default emission factors are presented, it is recommended that country-specific factors be used if possible.
Quality assurance and quality control (QA/QC) activities also need to occur at several steps in the emission estimation process. Key activities requiring QA/QC include the gathering and compilation of the fuel consumption data, the identification of fuel characteristics and emission factors, as well as documenting transparently the data and methods for reviewers.
Background Paper
Energy Sector 88
R E F E R E N C E S FCCC/SBSTA/1996/9/Add.1, Subsidiary Body for Scientific and Technological Advice, Third session, 9-16
July 1996, Geneva, “Communications from Parties included in Annex I to the Convention: Guidelines, schedule and process for consideration, Addendum”
FCCC/SBSTA/1996/9/Add.2, Subsidiary Body for Scientific and Technological Advice, Third session, 9-16 July 1996, Geneva, “Communications from Parties included in Annex I to the Convention: Guidelines, schedule and process for consideration, Addendum”
FCCC/SBSTA/1998/7, Subsidiary Body for Scientific and Technological Advice, Ninth session, 2-13 November, 1998, Buenos Aires, “Methodological issues identified while processing 2nd National Communications: Greenhouse Gas Emissions,” Note by the secretariat
IPCC/UNEP/OECD/IEA (1997) Revised 1996 IPCC Guidelines for National Greenhouse Gas Inventories, Paris: Intergovernmental Panel on Climate Change, United Nations Environment Programme, Organization for Economic Co-Operation and Development, International Energy Agency.
Lloyds Register (1993) Lloyd's Fleet Statistics, December 1992, London, 1993.
Lloyds Register (1995) Marine Exhaust Emissions Research Programme, Lloyd’s Register House, Croydon, England.
Marland, G. and A. Pippin (1990), “ United States emissions of carbon dioxide to the Earth’s atmosphere by economic activity,” Energy Systems and Policy, volume 14, pp. 319-336.
Lavender, K., G. Reynolds, K. Rypdal, and A. Webster, “UNECE Shipping Activities,” Emission inventory guidebook, European Environmental Agency, 1999.
Corbett, James J. and Paul Fischbeck, "Emissions from Ships," Science, Volume 278, October 31, 1999, pp.823-824.
Techne (1997): Trozzi, C., Vaccaro, R.: Methodologies for Estimating Air Pollutant Emissions from Ships. MEET Deliverable No. 19. European Commission DG VII, June 1997.
Good Practice Guidance and Uncertainty Management in National Greenhouse Gas Inventories
CO2, CH4 and N2O Emissions from Transportation-Water-borne Navigation 89
ANNEX 1 INTERNATIONAL MARITIME ORGANIZATION (IMO) PRESS RELEASE ON AGREEMENT TO LIMIT AIR EMISSIONS4
BOX 1
IMO adopts measures to limit air pollution from ships The International Maritime Organization, the United Nations specialized agency with responsibility for the safety of shipping and the protection of the marine environment, has adopted new measures which will reduce air pollution from ships, in the form of a new Annex VI to the International Convention for the Prevention of Pollution from Ships, 1973, as modified by the Protocol of 1978 (MARPOL 73/78).
The rules, when they come into force, will set limits on sulphur oxide and nitrogen oxide emissions from ship exhausts and prohibit deliberate emissions of ozone depleting substances. They were signed today at the headquarters of IMO, following a Conference of Parties to the MARPOL Convention. The Conference was held over seven days between 15-26 September.
IMO Secretary-General, Mr. William A. O'Neil said the adoption of the air pollution rules by the Conference represented the conclusion of six years of work on the issue.
"But this Conference is not an isolated event. All Member States and international bodies have been deeply concerned with the phenomena of depletion of the ozone layer, atmospheric pollution and global warming. These new rules represent a contribution from the maritime community to international determination to solve regional and global environmental problems related to air pollution," Mr. O'Neil said.
Mr. O'Neil referred to the United Nations Framework Convention on Climate Change adopted in Rio de Janeiro in 1992, which provided a basis for efforts to combat global warming, the special session of the United Nations General Assembly held in June this year to review progress achieved since the Rio Earth Summit of 1992, and the Third Session of the Conference of Parties to the Framework Convention on Climate Change to be held in December 1997 in Kyoto, Japan, where a timetable and specific goals for tackling atmospheric pollution and global warming will be negotiated.
The air pollution rules signed today are included in a new Annex VI, Regulations for the Prevention of on Air Pollution from Ships, to MARPOL 73/78, contained in a Protocol of 1997 to the MARPOL Convention.
MARPOL, which has been ratified by 100 countries representing 93 percent of the world's tonnage of merchant shipping, is the most important international convention concerned with controlling pollution of the seas from ships. It currently consists of five technical annexes containing measures to prevent pollution by oil, chemicals, other harmful substances, garbage and sewage.
Entry into force The 1997 Protocol will enter into force twelve months after the date on which not less than fifteen States, the combined tonnage of which shall be not less than 50 percent of the gross tonnage of the world's merchant shipping fleet, have become parties to the Protocol.
The Conference also adopted a Resolution which invites IMO's Marine Environment Protection Committee (MEPC) to identify any impediments to entry into force of the Protocol, if the conditions for entry into force have not been met by 31 December 2002.
Sulphur content of fuel oil
The Conference adopted a global cap of 4.5 percent m/m on the sulphur content of fuel oil and agreed to monitor the worldwide average sulphur content of fuel once the Protocol come into force.
SOx Emission Control Areas The Conference adopted provisions allowing for special 'SOx Emission Control Areas' to be established with more stringent control on sulphur emissions. In these areas, the sulphur content of fuel oil used on board ships must not exceed 1.5 percent m/m. Alternatively, ships must fit an exhaust gas cleaning system or use any other technological method to limit SOx emissions. The Baltic Sea is designated as a SOx Emission Control area in the Protocol.
4 International Conference on Air Pollution Prevention 15-26 September 1997
Background Paper
Energy Sector 90
BOX 1 (CONTINUED)
Ozone depleting substances
The Protocol prohibits deliberate emissions of ozone depleting substances, which include halons and chlorofluorocarbons (CFCs). New installations containing ozone depleting substances are prohibited on all ships. But new installations containing hydro-chlorofluorocarbons (HCFCs) are permitted until 1 January 2020.
The requirements of the IMO protocol are in accordance with the Montreal Protocol of 1987, as amended in London in 1990. The Montreal Protocol is an international environmental treaty, drawn up under the auspices of the United Nations, under which nations agreed to cut CFC consumption and production in order to protect the ozone layer.
Nitrogen oxides
The Protocol sets limits on emissions of nitrogen oxides (NOx) from diesel engines. A mandatory NOx Technical Code, developed by IMO, defines how this is to be done.
Shipboard incineration
The Protocol prohibits the incineration on board ship of certain products, such as contaminated packaging materials and polychlorinated biphenyls (PCBs).
Format of the new Annex VI
The new Annex VI consists of three Chapters and a number of Appendices:
Chapter 1 - Generally states that the Annex should apply to all ships and notes that the controls on emissions will not apply where any emission is necessary for saving life at sea or for securing the safety of a ship or where damage to the ship has occurred provided all reasonable precautions have been taken and there is no intent to cause damage.
Chapter II - Survey, Certification and Means of Control covers requirements for ships to be surveyed to ensure they comply with the regulations; the issuing of Air Pollution prevention Certificates to show a ship's compliance with the rules; and enforcement of the rules.
Chapter III - Requirements for Control of Emissions from Ships covers the specific regulations regarding preventing air pollution from ships, as regards ozone depleting substances; nitrogen oxides (NOx); Sulphur Oxides (SOx); and volatile organic compounds. It also covers requirements for shipboard incineration; provision of reception facilities at ports to receive substances removed from ships; fuel oil quality; and requirements for drilling rigs and other platforms.
Appendices include the form of the International Air Pollution Prevention Certificate; criteria and procedures for designation of SOx emission control areas; information for inclusion in the bunker delivery note; approval and operating limits for shipboard incinerators; test cycles and weighting factors for verification of compliance of marine diesel engines with the NOx limits; and details of surveys and inspections to be carried out.
Conference Resolutions
The Conference also adopted a number of Resolutions, including:
• a Resolution to adopt the Technical Code on Control of Emission of Nitrogen Oxides from Marine Diesel Engines;
• a Resolution inviting the MEPC to develop Guidelines for monitoring the worldwide sulphur content of residual fuel oil supplied for use on board ships;
• a Resolution inviting the MEPC to develop a harmonized system of survey and certification;
• a Resolution inviting the MEPC and Maritime Safety Committee (MSC) of IMO to consider measures to restrict the use of perfluorocarbons on board ships, and
• a Resolution inviting the MEPC to consider strategies to reduce carbon dioxide emissions from ships.
Reference: http://www.imo.org/briefing/1997/fax1797.htm, downloaded on April 6, 1999
Good Practice Guidance and Uncertainty Management in National Greenhouse Gas Inventories
CO2, CH4 and N2O Emissions from Transportation-Water-borne Navigation 91
ANNEX 2 ALLOCATION OPTIONS AND CONTROL OF EMISSIONS FROM INTERNATIONAL MARINE BUNKERS5
A preliminary discussion of allocation options which attempted to take into account the characteristics of the shipping industry was presented in the SBSTA document - FCCC/SBSTA/1996/9/Add.2, 26 June 1996) -referenced in the title of this Annex. It addresses some of the methodological issues related to the various options. Good practice inventory methodologies for marine bunkers will need to keep in mind these potential future allocation options. The options as presented in the FCCC/SBSTA/1996/9/Add 2.2, document are:
Option 1: No allocation
As in the case of aviation bunkers, this option represents the status quo, that is reporting of emissions by Parties in a separate category. In the case of no allocation, the emissions from international marine bunkers would still need to be considered in relation to Article 4.2 of the Convention. In that case, IMO may be able to be of assistance. However, Parties would need to consider the extent to which emissions could and should be controlled, and perhaps the approach, for example, voluntary measures, taxes, or standards. The attribution of the final responsibility for the control of international emissions would also have to be considered in lieu of IMO, because IMO is not a Party.
Option 2: Allocation to Parties in proportion to their national emissions
This option would allocate emissions in proportion to the contribution of a Party to global emissions. For example, international marine bunkers contributed about 2 percent of the global emissions from all sources in 1990. With proportional allocation, each Party would add about 2 percent to its national emissions inventory, in order to cover all international emissions jointly. This option may, however, distort the emissions inventories of some countries for example, land-locked countries or small countries with sizeable sea ports. Other allocation methods could lead to higher allocations for some Parties and lower allocations for others.
This option acknowledges the international character of marine bunker emissions, while still allocating them. It may create an incentive for international control measures, and leaves the basis for control open, since it does not relate emissions to an activity such as bunker fuel sales or ship movements.
Option 3: Allocation to Parties according to the country where the bunker fuel is sold.
This option would allocate emissions to Parties on the basis of marine fuel sales for which data are generally available. The option appears to have a precedent, namely in the allocation of emissions from fuel use in road transport, since fuel may be sold in one country and the emissions may occur in another, although the number of vehicles and decision -making processes are different.
With regard to its effect on possible controls, the option would provide little room for affecting emissions through national policies and measures. For example, a Party could not significantly influence vessel emissions through national standards. Other measures such as taxes might not be effective, since a ship could take on extra fuel elsewhere to avoid taxes or levies. Such a measure might need consideration at international level.
Option 4: Allocation to Parties according to the nationality of the transporting company, or to the country where the vessel is registered, or to the country of the operator
This set of three cases has the common feature that the owner/operator relationship is a primary determinant for allocation. In the first case, it would be necessary for each Party in which ship -owning companies are based, to collect annual data on oil consumption. Also, some countries such as Japan, the United States of America and the United Kingdom of Great Britain and Northern Ireland export and import large quantities of materials by sea in ships registered, owned and/or operated by other countries. Others such as Greece and Norway, are rarely visited by ships of the country of registration or ownership, since these are engaged in cross trading. Consequently, the allocation of emissions to these countries may not accurately reflect the economic benefits derived from the vessel. Data collection systems would have to be improved or developed by some Parties.
In the second case, allocation by country of registration, the basis for estimating oil fuel consumption could be a ship's oil record book which is a logbook required under the provisions of MARPOL Annex I. Under this regulation, it is necessary for all fuel deliveries to be logged and reported to the country of registration. This option is attractive because the country of registration already collects a certain amount of data on each of the ships under its jurisdiction, if only for the purposes of assessing fees. However, while many of the countries listed in table 6 derive some benefits from the ships under their registration, they often have little direct
5 FCCC/SBSTA/1996/ADD.2, 26 JUNE 1996
Background Paper
Energy Sector 92
responsibility for their operations. Information collection systems may also vary among countries and would need to be improved.
In the third case, allocation by country of the operator, a mechanism for data collection is much removed, as is the principal responsibility for maintenance and financial operations. This appears to be an important limitation.
With regard to the relationship to control options, only the first case appears to offer the possibility of providing incentives and mechanisms for national policies to affect emissions. As in other cases, the effectiveness of national action would appear to be limited.
Option 5*: Allocation to Parties according to the country of departure or destination of a vessel. Alternatively the emissions related to the journey of a vessel could be shared between the country of departure and the country of arrival
This option would require sharing information between Parties. It might be feasible for long voyages, but it would be much more complex for ships making multiple short stops. It would require breaking fuel intake or consumption down by country of departure and destination. Also, it would not take into consideration the speed of a ship or other operational characteristics. Methodologies for calculating emissions, on this basis are not available and would need to be developed. As in option 3, there would appear to be little room for affecting emissions through national policies and measures.
Option 6*: Allocation to Parties according to the country of departure or destination of passenger or cargo. Alternatively, the emissions related to the journey of a passenger or cargo could be shared by the country of departure and the country of arrival
This option would require Parties to compile information on the destination of cargo and passengers. The statistics would have to be correlated to fuel use. While conceptually possible, at the present time there is no system to acquire the data or methodology to calculate the emissions. Acquiring the detailed information would involve additional administration and some extra cost.
Option 7*: Allocation to Parties according to the country of that owns the cargo or origin of the passenger
This option requires the same statistics as option 5, but would have to be supplemented with data on the country of origin of passengers and owner of cargoes. Moreover, the owner of a cargo may change during transport, adding further complexity. This higher level of detail would involve additional administration and could be costly. There is no methodology for calculating emissions and no precedent among existing IPCC methods for the approach.
Option 8*: Allocation to the Party of emissions generated in its national space
As in the case of aviation, this option has a precedent in other sectors where emissions are allocated to the Party where they occur as per the Revised 1996 IPCC Guidelines. In the case of the marine industry, it would require correlation of fuel consumption and voyage routes. A breakdown by vessel type would lead to more accuracy. However, this option would not lead to full global coverage of emissions from international marine bunkers, many of which occur in international waters. It is therefore not seen as a feasible option.
* Options considered to be less practical because of data requirements or inadequate global coverage.