Embed Size (px)
Citation preview

Highlights> The Tucson multifamily market recorded healthy performance
during the second quarter with a rapid pace of absorption putting signifi cant upward pressure on rents. Demand is forecast to remain elevated in the coming quarters, while new units will be delivered to boost the inventory of available units.
> Vacancy inched up 10 basis points during the second quarter, but at 4.4 percent, the rate is only slightly higher than the market’s all-time low. Year over year, area vacancy has declined 90 basis points.
> Rent growth spiked during the second quarter, as owners responded to tight conditions and a surge in renter demand to implement healthy rent gains. Average rents ended the second quarter at $992 per month, up more than $100 per month since the end of last year.
> The number of property sales slowed during the second quarter, following more than a year of steady activity. Despite the recent dip in transactions, prices are on the rise, and cap rates have compressed to just 5.1 percent.
Tucson Multifamily Market OverviewRenter demand for apartments in Tucson has accelerated during the past 12 months and was particularly strong during the second quarter. Net absorption has topped 1,700 units in the past year, which is the largest 12-month period of absorption since 2016. These conditions have kept vacancies historically low for the past few quarters, leading to a spike in asking rents. Demand is being fueled by a recovering labor market. Tucson’s growing transportation and distribution sectors have been key drivers in fueling the economy.
M A R K E T R E P O R T | 2 Q / 2 0 2 1
Greater TucsonMultifamily
N O R T H M A R Q . C O M
Low Vacancy, Elevated Absorption Fuel Rising Rents
Market Fundamentals
Vacancy ...................................................................... 4.4%
- Year Over Year Change ........................................-90 bps
Asking Rent .................................................................$992
- Year Over Year Change .......................................... 18.2%
Transaction Activity
Median Sales Price Per Unit (YTD) ..........................$89,500
Cap Rates (Avg YTD) .................................................. 5.1%
Construction Activity
Units Under Construction ...........................................1,566
Units Delivered YTD ......................................................736
Q2 Snapshot Tucson Market
While the overall transaction activity cooled in the second quarter, the local investment market has recorded a strong performance thus far in 2021. To this point, prices have pushed higher and cap rates compressed. The continued momentum in rent growth has driven up prices. The development pipeline shows approximately 1,600 units under construction that will be delivered within the coming quarters. These future projects will help meet renter demand and could increase sales volume as new developments are successfully leased up.

Employment> The employment market in Tucson is adding back workers at
an active pace. Year over year through the second quarter, employment growth has expanded by 2.4 percent with the addition of nearly 9,000 jobs.
> One sector of the local economy that has continued to expand in recent years, despite economic volatility, has been the trade, transportation, and utilities sector. After growing by approximately 5 percent in 2020, the sector has expanded by nearly 9 percent year over year through the second quarter. Some of the growth in the sector has been fueled by new Amazon facilities in the Tucson area.
> In May, electronics manufacturer CIS Global announced that the company will expand its headquarters in Tucson, adding another 100 jobs to its local workforce.
> Forecast: Employers are on pace to add approximately 12,000 jobs in the Tucson area by the end of this year. This would mark an annual increase to payrolls of 3.2 percent.
Vacancy> Following an extended period of tightening, apartment vacancy in
Tucson has remained very steady throughout 2021. Vacancy held steady at the start of this year and ticked up 10 basis points in the second quarter, reaching 4.4 percent.
> During the past 12 months, the Tucson area has posted strong renter demand with absorption topping 1,700 units. These elevated absorption levels have driven the vacancy rate down 90 basis points year over year.
> Vacancy in the Class A segment of the market ended the second quarter at 3.1 percent, 210 basis points lower than the rate one year ago. Class A vacancy in the market typically ranges between 4.5 percent and 5.5 percent, and continued tight vacancy conditions at the high end of the market are prompting additional development.
> Forecast: Multifamily developers are forecast to remain active in Tucson in the second half of this year, which will likely put modest upward pressure on vacancy. The rate is forecast to end the year at 4.5 percent, 20 basis points higher than at the end of 2020.
N O R T H M A R Q . C O M / M U L T I F A M I L Y
G R E A T E R T U C S O N M U L T I F A M I L Y M A R K E T R E P O R T | 2 Q / 2 0 2 1
N O R T H M A R Q I N V E S T M E N T S A L E S | P A G E 2
Elevated absorption levels have driven the vacancy rate down 90 basis points year over year
Year over year, employment growth has expanded by 2.4 percent
Employment Overview
Vacancy Trends
-7%
-6%
-5%
-4%
-3%
-2%
-1%
0%
1%
2%
3%
4%
5%
-30
-25
-20
-15
-10
-5
0
5
10
15
20
2Q16
4Q16
2Q17
4Q17
2Q18
4Q18
2Q19
4Q19
2Q20
4Q20
2Q21
YYeeaarr--oovveerr--YYeeaarr EEmmppllooyymm
eenntt CChhaannggeeYYeeaarr
--oovvee
rr--YYee
aarr JJ
oobbss
AAdddd
eedd ((00
0000ss))
Number of Jobs Annual ChangeSources: NorthMarq, Bureau of Labor Statistics
3.0%
3.5%
4.0%
4.5%
5.0%
5.5%
6.0%
6.5%
7.0%
7.5%
2Q2016
4Q2016
2Q2017
4Q2017
2Q2018
4Q2018
2Q2019
4Q2019
2Q2020
4Q2020
2Q2021
Sources: NorthMarq, Apartment Insights
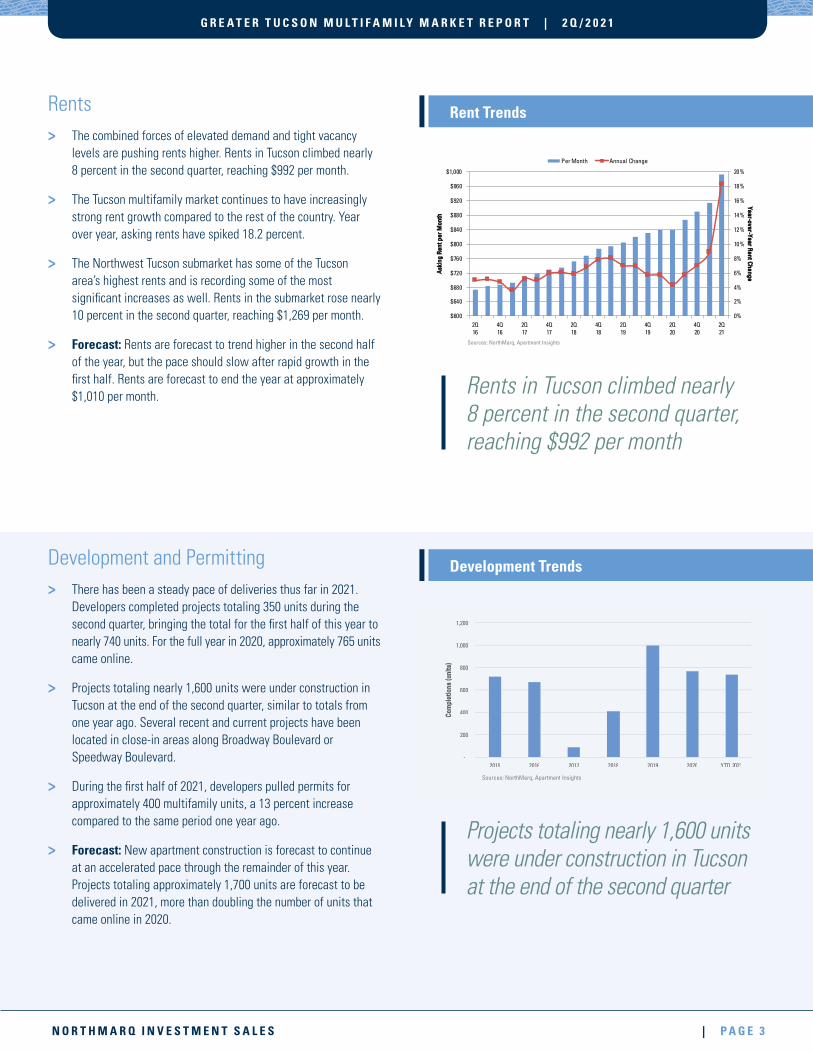
Rents> The combined forces of elevated demand and tight vacancy
levels are pushing rents higher. Rents in Tucson climbed nearly 8 percent in the second quarter, reaching $992 per month.
> The Tucson multifamily market continues to have increasingly strong rent growth compared to the rest of the country. Year over year, asking rents have spiked 18.2 percent.
> The Northwest Tucson submarket has some of the Tucson area’s highest rents and is recording some of the most signifi cant increases as well. Rents in the submarket rose nearly 10 percent in the second quarter, reaching $1,269 per month.
> Forecast: Rents are forecast to trend higher in the second half of the year, but the pace should slow after rapid growth in the fi rst half. Rents are forecast to end the year at approximately $1,010 per month.
Development and Permitting> There has been a steady pace of deliveries thus far in 2021.
Developers completed projects totaling 350 units during the second quarter, bringing the total for the fi rst half of this year to nearly 740 units. For the full year in 2020, approximately 765 units came online.
> Projects totaling nearly 1,600 units were under construction in Tucson at the end of the second quarter, similar to totals from one year ago. Several recent and current projects have been located in close-in areas along Broadway Boulevard or Speedway Boulevard.
> During the fi rst half of 2021, developers pulled permits for approximately 400 multifamily units, a 13 percent increase compared to the same period one year ago.
> Forecast: New apartment construction is forecast to continue at an accelerated pace through the remainder of this year. Projects totaling approximately 1,700 units are forecast to be delivered in 2021, more than doubling the number of units that came online in 2020.
G R E A T E R T U C S O N M U L T I F A M I L Y M A R K E T R E P O R T | 2 Q / 2 0 2 1
N O R T H M A R Q . C O M / M U L T I F A M I L YN O R T H M A R Q I N V E S T M E N T S A L E S | P A G E 3
Projects totaling nearly 1,600 units were under construction in Tucson at the end of the second quarter
Rents in Tucson climbed nearly 8 percent in the second quarter, reaching $992 per month
Rent Trends
Development Trends
0%
2%
4%
6%
8%
10%
12%
14%
16%
18%
20%
$600
$640
$680
$720
$760
$800
$840
$880
$920
$960
$1,000
2Q16
4Q16
2Q17
4Q17
2Q18
4Q18
2Q19
4Q19
2Q20
4Q20
2Q21
YYeeaarr--oovveerr--YYeeaarr RReenntt CChhaannggee
AAsskk
iinngg
RReenntt
ppeerr
MMoonn
tthh
Per Month Annual Change
Sources: NorthMarq, Apartment Insights
-
200
400
600
800
1,000
1,200
2015 2016 2017 2018 2019 2020 YTD 2021
Completions
(units)
Sources: NorthMarq, Apartment Insights
G R E A T E R T U C S O N M U L T I F A M I L Y M A R K E T R E P O R T | 2 Q / 2 0 2 1
N O R T H M A R Q . C O M / M U L T I F A M I L YN O R T H M A R Q I N V E S T M E N T S A L E S | P A G E 4
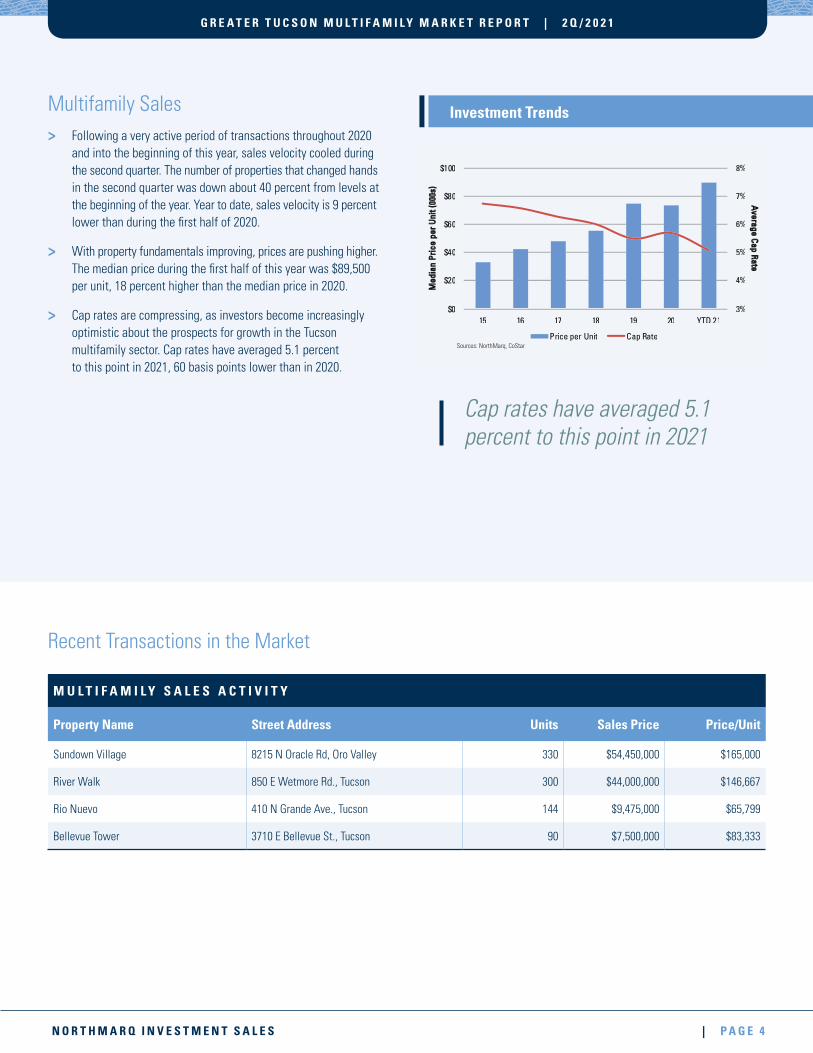
Cap rates have averaged 5.1 percent to this point in 2021
Multifamily Sales> Following a very active period of transactions throughout 2020
and into the beginning of this year, sales velocity cooled during the second quarter. The number of properties that changed hands in the second quarter was down about 40 percent from levels at the beginning of the year. Year to date, sales velocity is 9 percent lower than during the fi rst half of 2020.
> With property fundamentals improving, prices are pushing higher. The median price during the fi rst half of this year was $89,500 per unit, 18 percent higher than the median price in 2020.
> Cap rates are compressing, as investors become increasingly optimistic about the prospects for growth in the Tucson multifamily sector. Cap rates have averaged 5.1 percent to this point in 2021, 60 basis points lower than in 2020.
M U L T I F A M I L Y S A L E S A C T I V I T Y
Property Name Street Address Units Sales Price Price/Unit
Sundown Village 8215 N Oracle Rd, Oro Valley 330 $54,450,000 $165,000
River Walk 850 E Wetmore Rd., Tucson 300 $44,000,000 $146,667
Rio Nuevo 410 N Grande Ave., Tucson 144 $9,475,000 $65,799
Bellevue Tower 3710 E Bellevue St., Tucson 90 $7,500,000 $83,333
Recent Transactions in the Market
Investment Trends
3%
4%
5%
6%
7%
8%
$0
$20
$40
$60
$80
$100
15 16 17 18 19 20 YTD 21
Average
CapRate
Med
ian
Pric
epe
rUni
t(00
0s)
Price per Unit Cap RateSources: NorthMarq, CoStar
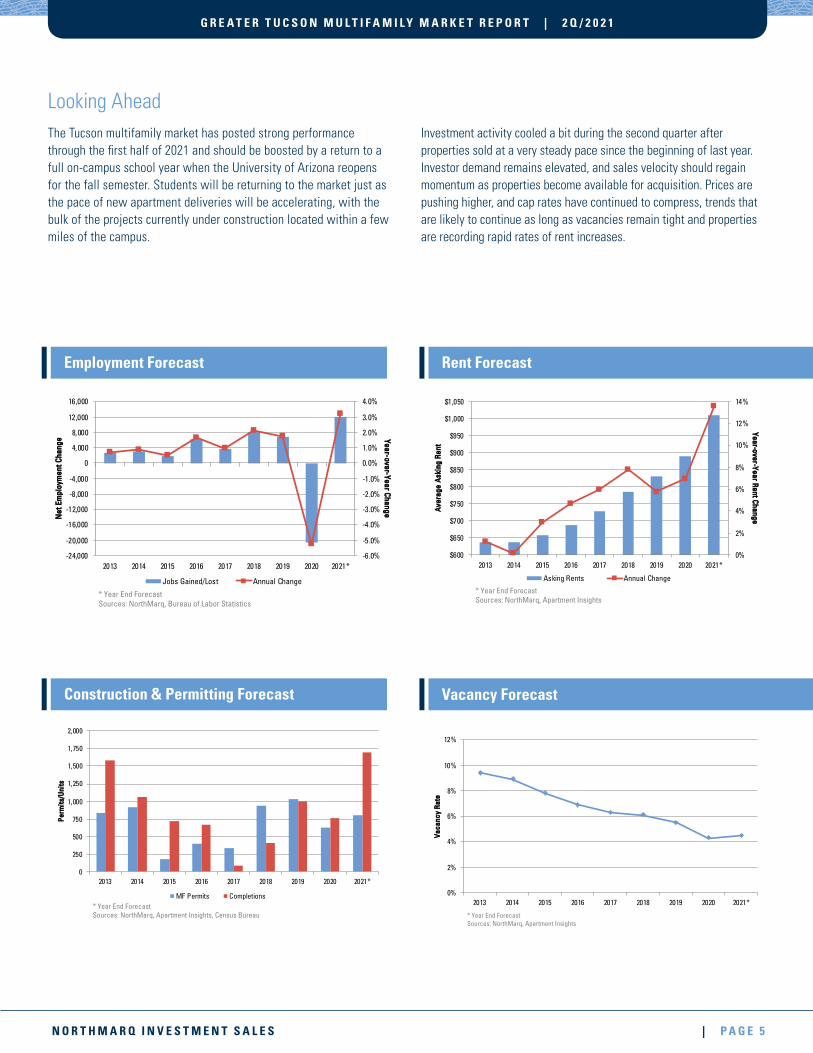
Looking AheadThe Tucson multifamily market has posted strong performance through the fi rst half of 2021 and should be boosted by a return to a full on-campus school year when the University of Arizona reopens for the fall semester. Students will be returning to the market just as the pace of new apartment deliveries will be accelerating, with the bulk of the projects currently under construction located within a few miles of the campus.
Investment activity cooled a bit during the second quarter after properties sold at a very steady pace since the beginning of last year. Investor demand remains elevated, and sales velocity should regain momentum as properties become available for acquisition. Prices are pushing higher, and cap rates have continued to compress, trends that are likely to continue as long as vacancies remain tight and properties are recording rapid rates of rent increases.
G R E A T E R T U C S O N M U L T I F A M I L Y M A R K E T R E P O R T | 2 Q / 2 0 2 1
N O R T H M A R Q I N V E S T M E N T S A L E S | P A G E 5
Rent Forecast
Vacancy Forecast
Employment Forecast
Construction & Permitting Forecast
-6.0%
-5.0%
-4.0%
-3.0%
-2.0%
-1.0%
0.0%
1.0%
2.0%
3.0%
4.0%
-24,000
-20,000
-16,000
-12,000
-8,000
-4,000
0
4,000
8,000
12,000
16,000
2013 2014 2015 2016 2017 2018 2019 2020 2021*
YYeeaarr--oovveerr--YYeeaarr CChhaannggee
NNeett
EEmm
ppllooyy
mmeenn
tt CChhaa
nnggee
Jobs Gained/Lost Annual Change
* Year End ForecastSources: NorthMarq, Bureau of Labor Statistics
0
250
500
750
1,000
1,250
1,500
1,750
2,000
2013 2014 2015 2016 2017 2018 2019 2020 2021*
PPeerrmm
iittss//UU
nniittss
MF Permits Completions* Year End ForecastSources: NorthMarq, Apartment Insights, Census Bureau
0%
2%
4%
6%
8%
10%
12%
2013 2014 2015 2016 2017 2018 2019 2020 2021*
VVaaccaa
nnccyy
RRaattee
* Year End ForecastSources: NorthMarq, Apartment Insights
0%
2%
4%
6%
8%
10%
12%
14%
$600
$650
$700
$750
$800
$850
$900
$950
$1,000
$1,050
2013 2014 2015 2016 2017 2018 2019 2020 2021*
YYeeaarr--oovveerr--YYeeaarr RReenntt CChhaannggee
AAvvee
rraaggee
AAsskk
iinngg
RReenntt
Asking Rents Annual Change
* Year End ForecastSources: NorthMarq, Apartment Insights

G R E A T E R T U C S O N M U L T I F A M I L Y M A R K E T R E P O R T | 2 Q / 2 0 2 1
About NorthMarqAs a capital markets leader, NorthMarq offers commercial real estate investors access to experts in debt, equity, investment sales, and loan servicing to protect and add value to their assets. For capital sources, we offer partnership and fi nancial acumen that support long- and short-term investment goals. Our culture of integrity and innovation is evident in our 60-year history, annual transaction volume of more than $16 billion, loan servicing portfolio of more than $65 billion and the multi-year tenure of our nearly 600 people.
For more information, contact:
Bill HahnEXECUTIVE VICE PRESIDENT – INVESTMENT SALES602.952.4041 [email protected]
Brandon HarringtonMANAGING DIRECTOR – MULTIFAMILY DEBT & [email protected]
Trevor KoskovichPRESIDENT – INVESTMENT SALEST 602.952.4040 [email protected]
Pete O’NeilDIRECTOR OF [email protected]
Copyright © 2021 NorthMarq Multifamily, LLC.
The information contained herein has been obtained from sources deemed reliable. While every reasonable effort has been made to ensure its accuracy, we cannot guarantee it. No responsibility is assumed for any inaccuracies. Readers are encouraged to consult their professional advisors prior to acting on any of the material contained in this report.
L E A R N M O R E A B O U T U S @ N O R T H M A R Q . C O M