Embed Size (px)
Citation preview

Second-Quarter 2021
Financial & Operational Supplement

Notice to Investors
Certain statements in this earnings supplement contain "forward-looking statements" within the meaning of Section 27A of the Securities Act of 1933 and Section 21E of the Securities Exchange Act of 1934 including, without limitation, expectations, beliefs, plans, and objectives regarding anticipated financial and operating results, asset divestitures, estimated reserves, drilling locations, capital expenditures, price estimates, typical well results and well profiles, type curve, and production and operating expense guidance included in this earnings supplement. Any matters that are not historical facts are forward looking and, accordingly, involve estimates, assumptions, risks, and uncertainties, including, without limitation, risks, uncertainties, and other factors discussed in our most recently filed Annual Report on Form 10-K, recently filed Quarterly Reports on Form 10-Q, recently filed Current Reports on Form 8-K available on our website, www.apacorp.com, and in our other public filings and press releases. These forward-looking statements are based on APA Corporation’s (APA) current expectations, estimates, and projections about the company, its industry, its management’s beliefs, and certain assumptions made by management. No assurance can be given that such expectations, estimates, or projections will prove to have been correct. A number of factors could cause actual results to differ materially from the projections, anticipated results, or other expectations expressed in this earnings supplement, including the company’s ability to meet its production targets, successfully manage its capital expenditures and to complete, test, and produce the wells and prospects identified in this earnings supplement, to successfully plan, secure necessary government approvals, finance, build, and operate the necessary infrastructure, and to achieve its production and budget expectations on its projects.
Whenever possible, these “forward-looking statements” are identified by words such as “anticipates,” “intends,” “plans,” “seeks,” “believes,” “continues,” “could,” “estimates,” “expects,” “guidance,” “may,” “might,” “outlook,” “possible,” “potential,” “projects,” “prospects,” “should,” “would,” “will,” and similar phrases, but the absence of these words does not mean that a statement is not forward-looking. Because such statements involve risks and uncertainties, the company’s actual results and performance may differ materially from the results expressed or implied by such forward-looking statements. Given these risks and uncertainties, you are cautioned not to place undue reliance on such forward-looking statements, which speak only as of the date hereof. Unless legally required, we assume no duty to update these statements as of any future date. However, you should review carefully reports and documents that the company files periodically with the Securities and Exchange Commission.
Cautionary Note to Investors: The United States Securities and Exchange Commission (SEC) permits oil and gas companies, in their filings with the SEC, to disclose only proved, probable, and possible reserves that meet the SEC's definitions for such terms. We may use certain terms in this earnings supplement, such as “resource,” “resource potential,” “net resource potential,” “potential resource,” “resource base,” “identified resources,” “potential net recoverable,” “potential reserves,” “unbooked resources,” “economic resources,” “net resources,” “undeveloped resource,” “net risked resources,” “inventory,” “upside,” and other similar terms that the SEC guidelines strictly prohibit us from including in filings with the SEC. Such terms do not take into account the certainty of resource recovery, which is contingent on exploration success, technical improvements in drilling access, commerciality, and other factors, and are therefore not indicative of expected future resource recovery and should not be relied upon. Investors are urged to consider carefully the disclosure in Apache Corporation’s Annual Report on Form 10-K for the fiscal year ended December 31, 2020 available at www.apacorp.com or by writing at: 2000 Post Oak Blvd., Suite 100, Houston, Texas 77056 (Attn: Corporate Secretary). You can also obtain this report from the SEC by calling 1-800-SEC-0330 or from the SEC's website at www.sec.gov.
Certain information may be provided in this earnings supplement that includes financial measurements that are not required by, or presented in accordance with, generally accepted accounting principles (GAAP). These non-GAAP measures should not be considered as alternatives to GAAP measures, such as net income, total debt or net cash provided by operating activities, and may be calculated differently from, and therefore may not be comparable to, similarly titled measures used at other companies. For a reconciliation to the most directly comparable GAAP financial measures, please refer to APA’s second quarter 2021 earnings release at www.apacorp.com and “Non-GAAP Reconciliations” of this earnings supplement.
None of the information contained in this document has been audited by any independent auditor. This earnings supplement is prepared as a convenience for securities analysts and investors and may be useful as a reference tool. We may elect to modify the format or discontinue publication at any time, without notice to securities analysts or investors.
2
2Q 2021 Key Metrics
3
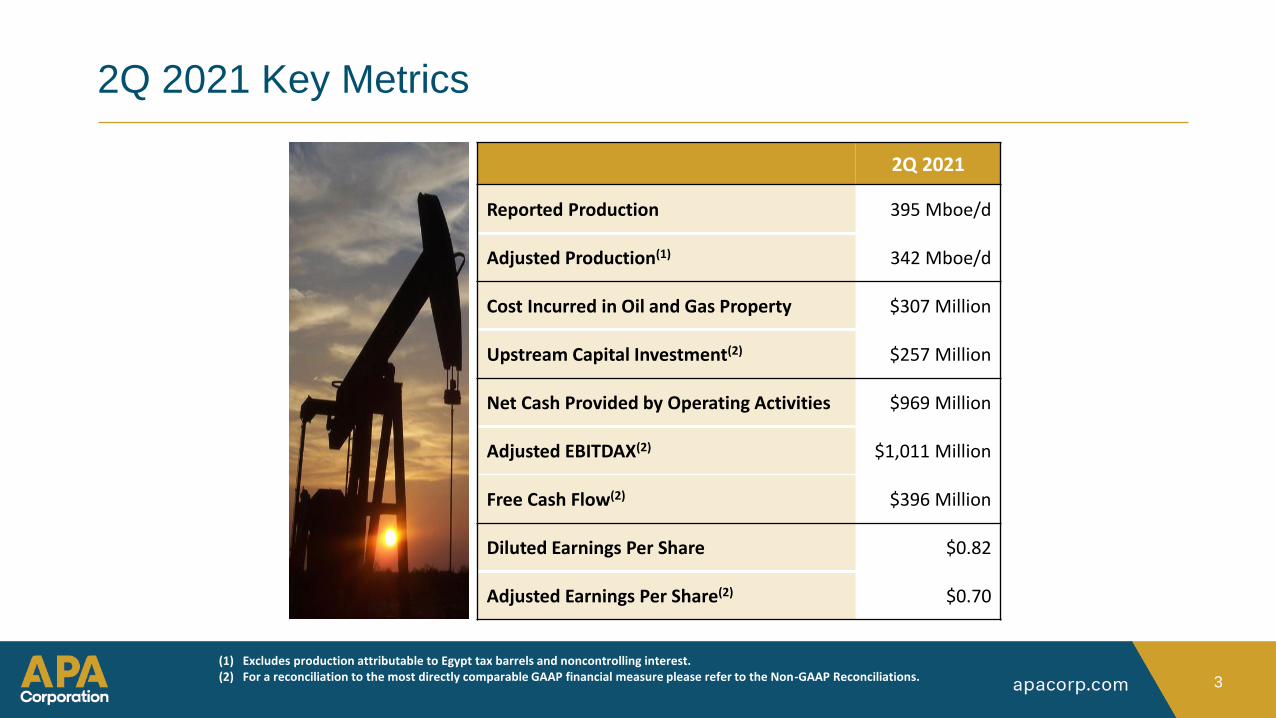
2Q 2021
Reported Production 395 Mboe/d
Adjusted Production(1) 342 Mboe/d
Cost Incurred in Oil and Gas Property $307 Million
Upstream Capital Investment(2) $257 Million
Net Cash Provided by Operating Activities $969 Million
Adjusted EBITDAX(2) $1,011 Million
Free Cash Flow(2) $396 Million
Diluted Earnings Per Share $0.82
Adjusted Earnings Per Share(2) $0.70
(1) Excludes production attributable to Egypt tax barrels and noncontrolling interest.(2) For a reconciliation to the most directly comparable GAAP financial measure please refer to the Non-GAAP Reconciliations.

APA’s Strategy
4
• Aggressively managing cost structure
• Retaining cash to reduce debt; targeting a return to investment grade
• Targeting development capital at a level that will sustain production
Disciplined
Financial
Approach
• Prioritize long-term returns
• Position the balance sheet and portfolio for increasing cash returns to investors
• Focus where APA can have the greatest impact on the most salient ESG matters
Foundation For
Long-Term
Success
Leveraging
Diversified
Portfolio
• Modernizing Egypt PSCs(1)
• Increasing activity levels in the U.S. to stabilize/sustain oil production
• Directing a significant percentage of capital budget to Suriname
• Diversifying risk through a balanced commodity profile and geographic pricing points
(1) Pending certain approvals within the Government of Egypt and ratification by the Egyptian Parliament.

ESG Leadership: Primary Areas of Focus
ESG Vision 2021 Goal
AIR
Be at the forefront of industry’s efforts
to measure, disclose and
mitigate emissions
Eliminating routine U.S. onshore flaring and targeting
< 1% flaring intensity in the U.S.
WATER
Preserve freshwater resources
and leverage technology
to maximize water reuse
Targeting freshwater consumption < 20% of
total water consumed in the U.S.
COMMUNITIES
+PEOPLE
Provide fulfilling and rewarding careers for our
employees and create shared value in the
communities where we operate
Further progress
diversity & inclusion programs
GOVERNANCE
• 20% of 2021 annual incentive compensation plan is tied to ESG and safety goals
• Enhancing disclosures to more closely align with TCFD
• Performance measured against S&P 500 as well as broad index of upstream and major-integrated producers
Eliminating routine U.S. onshore flaring by end of 3Q 2021
5
Highlights
6
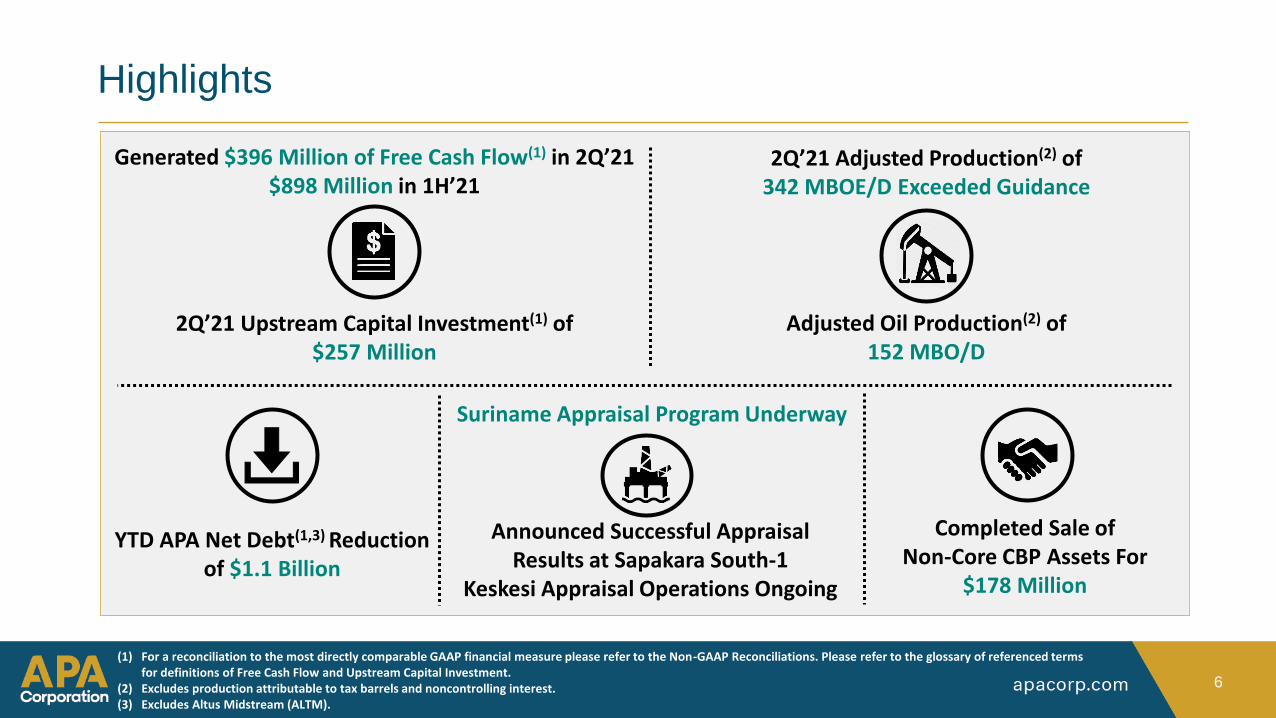
2Q’21 Upstream Capital Investment(1) of $257 Million
Generated $396 Million of Free Cash Flow(1) in 2Q’21$898 Million in 1H’21
2Q’21 Adjusted Production(2) of 342 MBOE/D Exceeded Guidance
Completed Sale of Non-Core CBP Assets For
$178 Million
Adjusted Oil Production(2) of 152 MBO/D
Announced Successful Appraisal Results at Sapakara South-1
Keskesi Appraisal Operations Ongoing
(1) For a reconciliation to the most directly comparable GAAP financial measure please refer to the Non-GAAP Reconciliations. Please refer to the glossary of referenced terms for definitions of Free Cash Flow and Upstream Capital Investment.
(2) Excludes production attributable to tax barrels and noncontrolling interest.(3) Excludes Altus Midstream (ALTM).
YTD APA Net Debt(1,3) Reduction of $1.1 Billion
Suriname Appraisal Program Underway

Block 58 Offshore Suriname Update
• Announced successful appraisal results at SapakaraSouth-1o Encountered ~30 meters (98 feet) of net black oil pay in a
single zone of high-quality Campano-Maastrichtian reservoir
• Bonboni exploration prospect scheduled to be drilled with the Maersk Valiant following completion of operations at Sapakara South-1
• Maersk Developer spud the Keskesi South-1 appraisal well in late May
7

3Q21 Guidance
8
(1) Refer to glossary of referenced terms for definition of Upstream Capital Investment.(2) Consists of transport & fuel costs, net purchased oil and gas sales/costs and impact of natural gas basis hedges.
New
Production (Mboe/d)
United States…………………………………………………………………………………. 233
International (Adjusted)………………………………………………………………… 102
Total Adjusted Production……………………………………………………… 335
United States Oil (Mbo/d)…………....................................................... 75
Upstream Capital Investment ($ in millions)(1)…………........................ $280
Upstream Lease Operating Expense ($ in millions)………………………… $325
DD&A ($ in millions)………………………………………………………………………. $350
General & Administrative Expenses ($ in millions)…………………………. $80
North Sea Current Tax Expense ($ in millions)……………………………….. $40
Gathering, Processing & Transmission Expense ($ in millions)………… $65
Net Loss on Oil and Gas Purchases and Sales ($ in millions)(2)……….. $35
U.S. Total Production: 4 Mboe/dU.S. Oil: 3 Mbo/d
3Q21 CBP Sale Production Impact
2021 Guidance
9
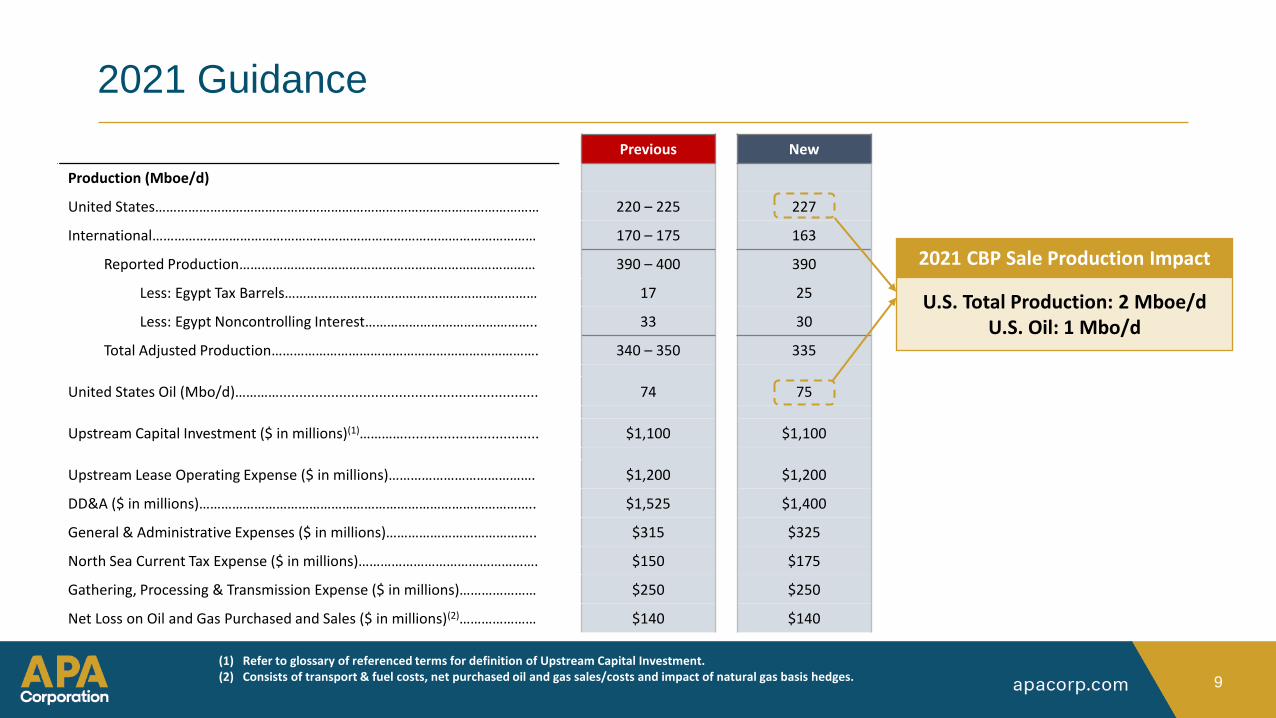
Previous New
Production (Mboe/d)
United States…………………………………………………………………………………………… 220 – 225 227
International…………………………………………………………………………………………… 170 – 175 163
Reported Production……………………………………………………………………… 390 – 400 390
Less: Egypt Tax Barrels…………………………………………………………… 17 25
Less: Egypt Noncontrolling Interest……………………………………….. 33 30
Total Adjusted Production………………………………………………………………. 340 – 350 335
United States Oil (Mbo/d)…………................................................................. 74 75
Upstream Capital Investment ($ in millions)(1)………….................................. $1,100 $1,100
Upstream Lease Operating Expense ($ in millions)…………………………………. $1,200 $1,200
DD&A ($ in millions)……………………………………………………………………………….. $1,525 $1,400
General & Administrative Expenses ($ in millions)………………………………….. $315 $325
North Sea Current Tax Expense ($ in millions)…………………………………………. $150 $175
Gathering, Processing & Transmission Expense ($ in millions)………………… $250 $250
Net Loss on Oil and Gas Purchased and Sales ($ in millions)(2)………………… $140 $140
(1) Refer to glossary of referenced terms for definition of Upstream Capital Investment.(2) Consists of transport & fuel costs, net purchased oil and gas sales/costs and impact of natural gas basis hedges.
U.S. Total Production: 2 Mboe/dU.S. Oil: 1 Mbo/d
2021 CBP Sale Production Impact

2Q Asset Update
10
2Q 2021 Global Portfolio
11
April 2015 June 2015 September
2016
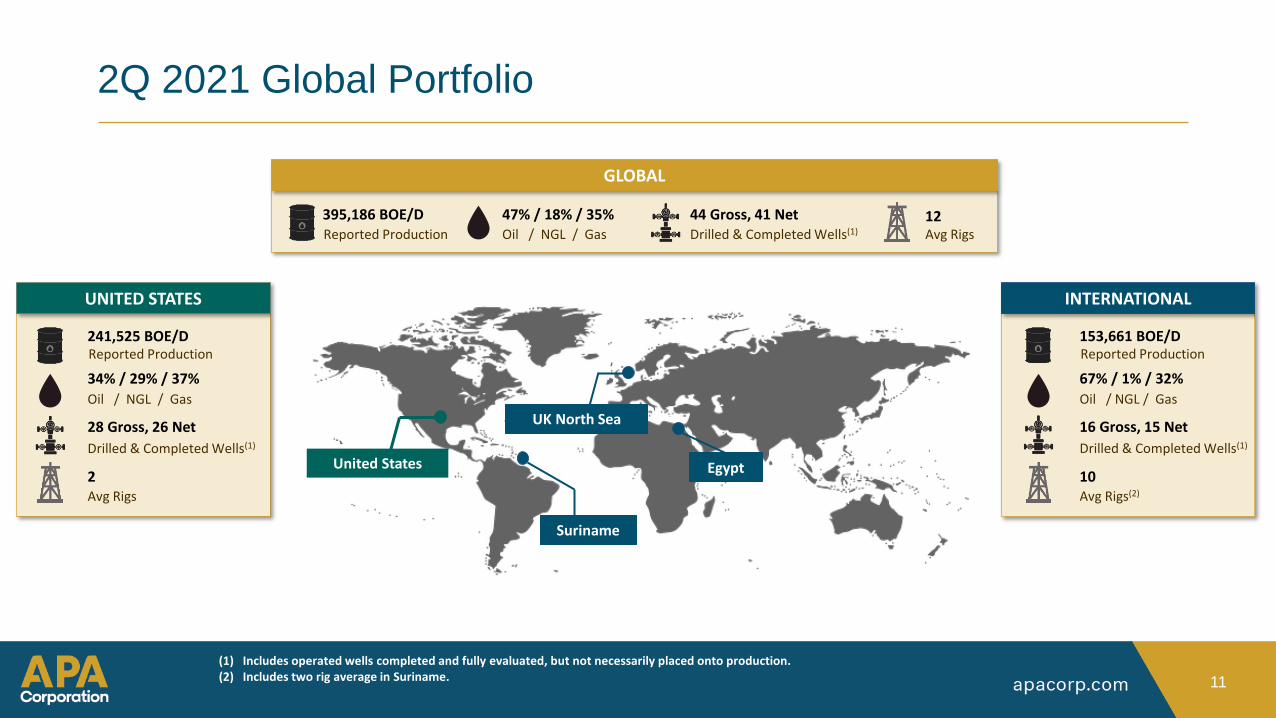
Reported Production
395,186 BOE/D
GLOBAL
47% / 18% / 35%Oil / NGL / Gas
44 Gross, 41 NetDrilled & Completed Wells(1)
12Avg Rigs
Reported Production153,661 BOE/D
16 Gross, 15 Net
Drilled & Completed Wells(1)
67% / 1% / 32%
Oil / NGL / Gas
10Avg Rigs(2)
INTERNATIONAL
Reported Production241,525 BOE/D
28 Gross, 26 Net
Drilled & Completed Wells(1)
34% / 29% / 37%
Oil / NGL / Gas
2Avg Rigs
UNITED STATES
United States
UK North Sea
Egypt
Suriname
(1) Includes operated wells completed and fully evaluated, but not necessarily placed onto production.(2) Includes two rig average in Suriname.

$0
$10
$20
$30
$40
$50
$60
$70
$48 / Boe
$11 / Boe
$39Per Boe
$25Per Boe
North SeaEgypt United States(2)
$69 / Boe
$30 / Boe $35 / Boe
$10 / Boe
Operating Cash Margin(1) Avg Realization Cash Operating Cost
2Q 2021 Operating Cash Margins
12
(1) Operating cash margins calculated as price realizations less lease operating expenses, gathering, processing, & transmission costs, and taxes other than income.
(2) Excludes Altus Midstream (ALTM).
$37Per Boe
- $1vs. 1Q
+ $3vs. 1Q
- $1vs. 1Q
North Sea cash operating cost per Boe increase largely driven
by a 26% decrease in production

251 258233
210242
0
50
100
150
200
250
300
350
2Q20 3Q20 4Q20 1Q21 2Q21
2Q U.S. Update
• Exceeded U.S. oil production guidance provided in May by 6% with better than expected performance from the DUC completion program
• Brought online 27 wells in the Permian Basin, 5 of which were at Alpine High
• Drilled 3 Austin Chalk wells in Brazos and Washington counties
• Completed sale of non-core CBP assets in Crane & Ector counties for $178 million
o 2Q’21 production: ~4,000 BOE/D (61% oil)
• Added 2nd rig in the Permian Basin in late June as planned
13
ASSET STATSASSET HIGHLIGHTS
(1) Includes operated wells completed and fully evaluated, but not necessarily placed onto production.
NET PRODUCTION MBOE/D
Reported Production
Drilled & Completed Wells(1)
241,525 BOE/D
Avg Rigs
28 Gross, 26 Net
2
34% / 29% / 37%Oil / NGL / Gas

2Q Egypt Update
• Drilling success rate of 85% (11 of 13 wells)o WKAL-O2 development well naturally flowing at 4,200 BOPDo Fustat-N 1X exploration well commenced production at a rate of 3,130 BOPD and
32 MMCFD
• Secured development lease for Hadid oil discovery, expect first oil in 2H’21
o Test flowed at 3,800 BOPD and 2.5 MMCFD
• Gross production expected to trend up in 2H’21o Currently operating 8 drilling rigso Following completion of facilities expansion, well connections are expected to
nearly double in 2H’21 compared to only 15 well connections in 1H’21
• Final draft of new PSC has been completed and will be presented to Parliament in the fall
14
Reported Production
Drilled & Completed Wells(1)
114,445 BOE/D
Avg Rigs
13 Gross, 13 Net
6
62% / 1% / 37%Oil / NGL / Gas
ASSET STATS
86
7670
63 61
0
20
40
60
80
100
2Q20 3Q20 4Q20 1Q21 2Q21
ADJUSTED PRODUCTION MBOE/D (2)
ASSET HIGHLIGHTS
(1) Includes operated wells completed and fully evaluated, but not necessarily placed onto production.(2) Excludes production attributable to tax barrels and noncontrolling interest.

58 60 6253
39
0
20
40
60
80
100
2Q20 3Q20 4Q20 1Q21 2Q21
2Q North Sea Update
• 2Q’21 production impacted by:
o 3rd party pipeline outages and extended compressor downtime
o 9-day extension of the planned maintenance turnaround at Forties
• Anticipate a modest increase in 3Q’21 production as scheduled maintenance turnaround activity shifts from Forties to Beryl
• An uptick in production expected in 4Q’21 with the resumption of normal operations
15
ASSET STATSASSET HIGHLIGHTS
Reported Production
Drilled & Completed Wells(1)
39,216 BOE/D
Avg Rigs
3 Gross, 2 Net
2
82% / 3% / 15%Oil / NGL / Gas
(1) Includes operated wells completed and fully evaluated, but not necessarily placed onto production.
NET PRODUCTION MBOE/D

Appendix
16

Open Commodity Derivative Positions (As of August 4, 2021)
17
Production Period Trade Type Index Units Daily VolumeWeighted Avg Price
$ / Unit
WTI Hedges
July – September 2021 Fixed Swap NYMEX WTI BBL 22,000 $60.15
October – December 2021 Fixed Swap NYMEX WTI BBL 11,000 $58.59
Brent Hedges
July – September 2021 Fixed Swap Dated Brent BBL 18,000 $63.08
October – December 2021 Fixed Swap Dated Brent BBL 9,000 $61.44
Midland Basis Hedges
July – September 2021 Basis Swap Midland / WTI BBL 22,000 $0.61
October – December 2021 Basis Swap Midland / WTI BBL 11,000 $0.70
Natural Gas Basis Hedges
July 2021 – December 2021 Basis Swap IF Waha / IF HSC MMBtu 130,054 ($0.35)
January 2022 – December 2022 Basis Swap IF Waha / IF HSC MMBtu 120,000 ($0.37)
January 2023 – December 2023 Basis Swap IF Waha / IF HSC MMBtu 80,000 ($0.42)
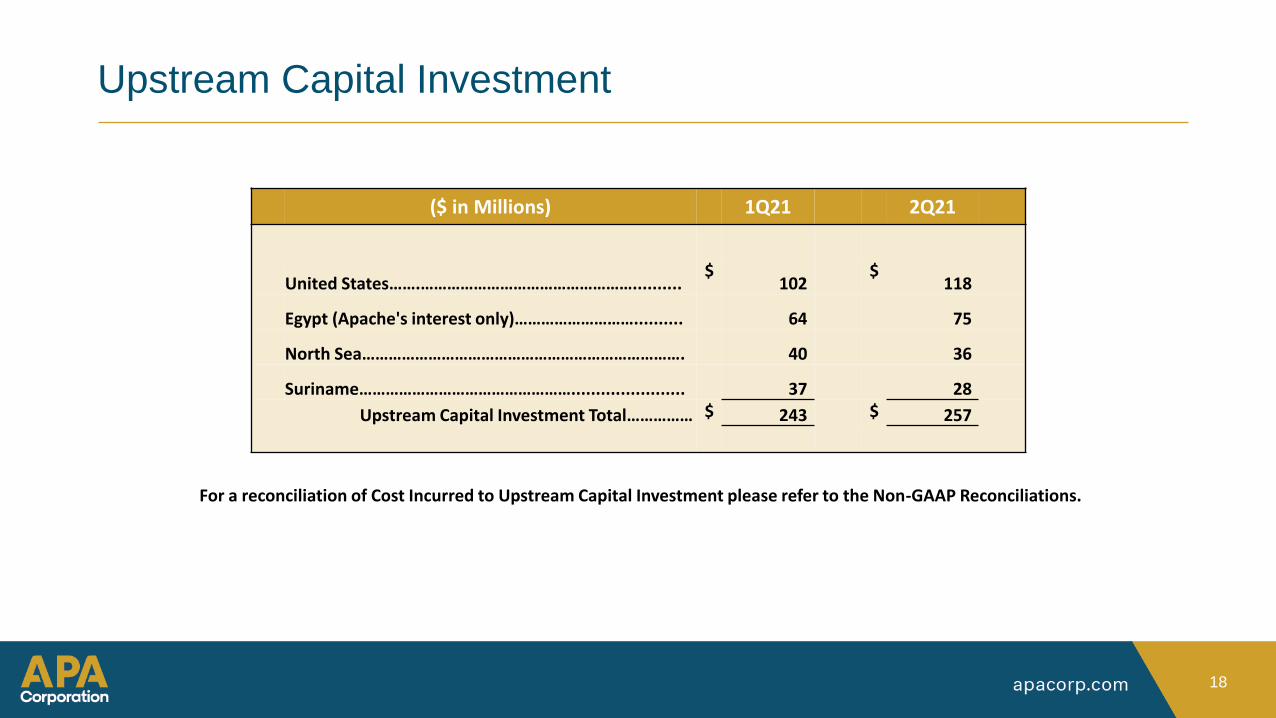
Upstream Capital Investment
18
($ in Millions) 1Q21 2Q21
United States…….…………………………………………..........$
102$
118
Egypt (Apache's interest only)……………………….......... 64 75
North Sea………………………………………………………………. 40 36
Suriname…………………………………………....................... 37 28
Upstream Capital Investment Total…………… $ 243 $ 257
For a reconciliation of Cost Incurred to Upstream Capital Investment please refer to the Non-GAAP Reconciliations.

Egypt: Production Detail
19
1Q 2021 2Q 2021
Liquids (Bbls/d)
Gas (Mcf/d) Boe/d
Liquids (Bbls/d)
Gas (Mcf/d) Boe/d
Gross Production 136,217 603,269 236,762 136,360 578,380 232,757
Reported Production 72,753 278,149 119,111 71,735 256,262 114,445
% Gross 53% 46% 50% 53% 44% 49%
Less: Tax Barrels 16,758 48,538 24,847 16,154 39,193 22,687
Net Production Excluding Tax Barrels 55,995 229,612 94,264 55,580 217,069 91,758
% Gross 41% 38% 40% 41% 38% 39%
Less: Noncontrolling Interest 18,665 76,537 31,421 18,527 72,356 30,586
Adjusted Production 37,330 153,075 62,843 37,053 144,712 61,172
% Gross 27% 25% 27% 27% 25% 26%
MBOE/D
2019 2020 2021
1Q 2Q 3Q 4Q 1Q 2Q 3Q 4Q 1Q 2Q
Gross Production 332 322 301 300 295 281 269 245 237 233
Reported Production 145 131 131 126 117 127 128 116 119 114
Adjusted Production 79 72 72 69 72 86 76 70 63 61
Brent Oil Benchmark Pricing $64 $68 $62 $62 $50 $33 $43 $45 $61 $69

Glossary of Referenced Terms
• Upstream Capital Investment: Includes exploration, development, gathering, processing, and transmission capital, capitalized overhead, and settled asset retirement obligations, and excludes capitalized interest, non-cash asset retirement additions and revisions, and Egypt noncontrolling interest, in each case associated with Apache’s upstream business.
• Free Cash Flow: Cash flow from operations before changes in operating assets and liabilities (including Egypt minority interest) plus dividends received from Altus (ALTM), minus:o Upstream capital investment (including Egypt minority interest)
o Distributions to noncontrolling interest (Egypt)
o APA Corp. dividend payments
o Cash flow impacts of ALTM
• In addition to the terms above, a list of commonly used definitions and abbreviations can be found in Apache Corporation’s Form 10-K for the year ended December 31, 2020.
20

Non-GAAP Reconciliations
21
Non – GAAP ReconciliationAdjusted Earnings
22
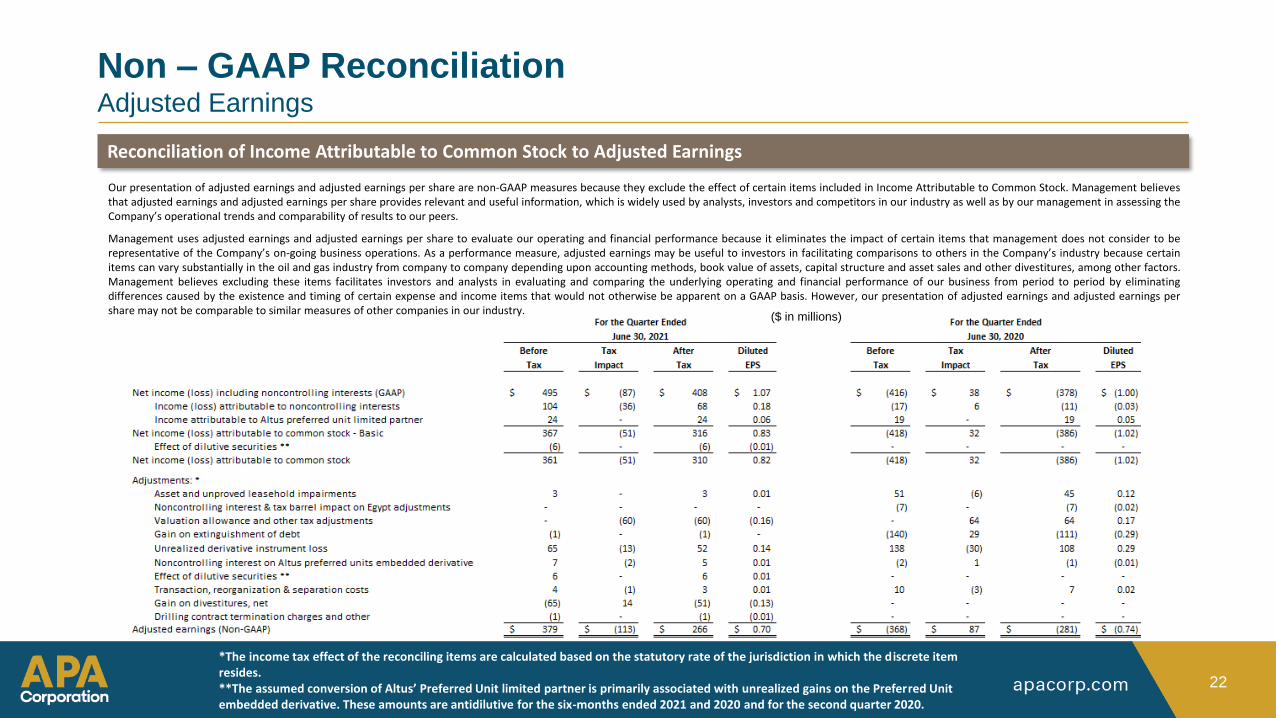
Our presentation of adjusted earnings and adjusted earnings per share are non-GAAP measures because they exclude the effect of certain items included in Income Attributable to Common Stock. Management believesthat adjusted earnings and adjusted earnings per share provides relevant and useful information, which is widely used by analysts, investors and competitors in our industry as well as by our management in assessing theCompany’s operational trends and comparability of results to our peers.
Management uses adjusted earnings and adjusted earnings per share to evaluate our operating and financial performance because it eliminates the impact of certain items that management does not consider to berepresentative of the Company’s on-going business operations. As a performance measure, adjusted earnings may be useful to investors in facilitating comparisons to others in the Company’s industry because certainitems can vary substantially in the oil and gas industry from company to company depending upon accounting methods, book value of assets, capital structure and asset sales and other divestitures, among other factors.Management believes excluding these items facilitates investors and analysts in evaluating and comparing the underlying operating and financial performance of our business from period to period by eliminatingdifferences caused by the existence and timing of certain expense and income items that would not otherwise be apparent on a GAAP basis. However, our presentation of adjusted earnings and adjusted earnings pershare may not be comparable to similar measures of other companies in our industry.
Reconciliation of Income Attributable to Common Stock to Adjusted Earnings
($ in millions)
*The income tax effect of the reconciling items are calculated based on the statutory rate of the jurisdiction in which the discrete item resides.**The assumed conversion of Altus’ Preferred Unit limited partner is primarily associated with unrealized gains on the Preferred Unit embedded derivative. These amounts are antidilutive for the six-months ended 2021 and 2020 and for the second quarter 2020.
Non – GAAP ReconciliationAdjusted EBITDAX
23
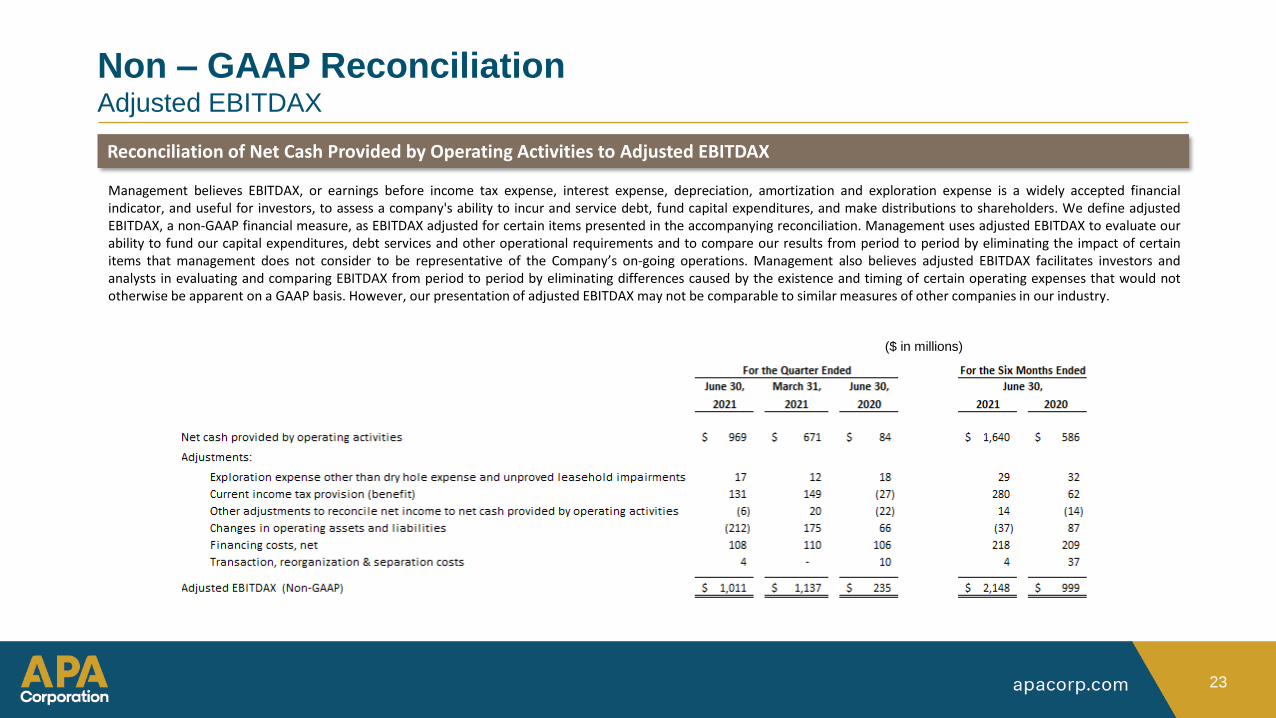
Management believes EBITDAX, or earnings before income tax expense, interest expense, depreciation, amortization and exploration expense is a widely accepted financialindicator, and useful for investors, to assess a company's ability to incur and service debt, fund capital expenditures, and make distributions to shareholders. We define adjustedEBITDAX, a non-GAAP financial measure, as EBITDAX adjusted for certain items presented in the accompanying reconciliation. Management uses adjusted EBITDAX to evaluate ourability to fund our capital expenditures, debt services and other operational requirements and to compare our results from period to period by eliminating the impact of certainitems that management does not consider to be representative of the Company’s on-going operations. Management also believes adjusted EBITDAX facilitates investors andanalysts in evaluating and comparing EBITDAX from period to period by eliminating differences caused by the existence and timing of certain operating expenses that would nototherwise be apparent on a GAAP basis. However, our presentation of adjusted EBITDAX may not be comparable to similar measures of other companies in our industry.
Reconciliation of Net Cash Provided by Operating Activities to Adjusted EBITDAX
($ in millions)

Non – GAAP ReconciliationCash Flow Before Changes in Operating Assets & Liabilities and Free Cash Flow
24
Cash flows from operations before changes in operating assets and liabilities and free cash flow are non-GAAP financial measures. APA uses these measures internally and providesthis information because management believes it is useful in evaluating the company's ability to generate cash to internally fund exploration and development activities, funddividend programs, and service debt, as well as to compare our results from period to period. We believe these measures are also used by research analysts and investors to valueand compare oil and gas exploration and production companies and are frequently included in published research reports when providing investment recommendations. Cash flowsfrom operations before changes in operating assets and liabilities and free cash flow are additional measures of liquidity but are not measures of financial performance under GAAPand should not be considered as an alternative to cash flows from operating, investing, or financing activities. Additionally, this presentation of free cash flow may not becomparable to similar measures presented by other companies in our industry.
Reconciliation of Net Cash Provided by Operating Activities to Cash Flows from Operations before Changes in Operating Assets and Liabilities and Free Cash Flow
($ in millions)

Non – GAAP ReconciliationSegment Cash Flows
25
Cash flows from operations before changes in operating assets and liabilities is a non-GAAP financial measure. The Company uses it internally and provides the information becausemanagement believes it is useful for investors and widely accepted by those following the oil and gas industry as a financial indicator of a company's ability to generate cash tointernally fund exploration and development activities, fund dividend programs, and service debt. It is also used by research analysts to value and compare oil and gas explorationand production companies and is frequently included in published research when providing investment recommendations. Cash flows from operations before changes in operatingassets and liabilities, therefore, is an additional measure of liquidity but is not a measure of financial performance under GAAP and should not be considered as an alternative tocash flows from operating, investing, or financing activities.
Reconciliation of Net Cash Provided by Operating Activities to Cash Flows from Continuing Operations before Changes in Operating Assets and Liabilities

Non – GAAP ReconciliationNet Debt
26
Net debt, or outstanding debt obligations less cash and cash equivalents, is a non-GAAP financial measure. Management uses net debt as a measure of the Company's outstandingdebt obligations that would not be readily satisfied by its cash and cash equivalents on hand. The Altus Midstream LP credit facility is unsecured and is not guaranteed by theCompany or any of its other subsidiaries.
Reconciliation of Debt to Net Debt
($ in millions)
Non – GAAP ReconciliationUpstream Capital Investment
27
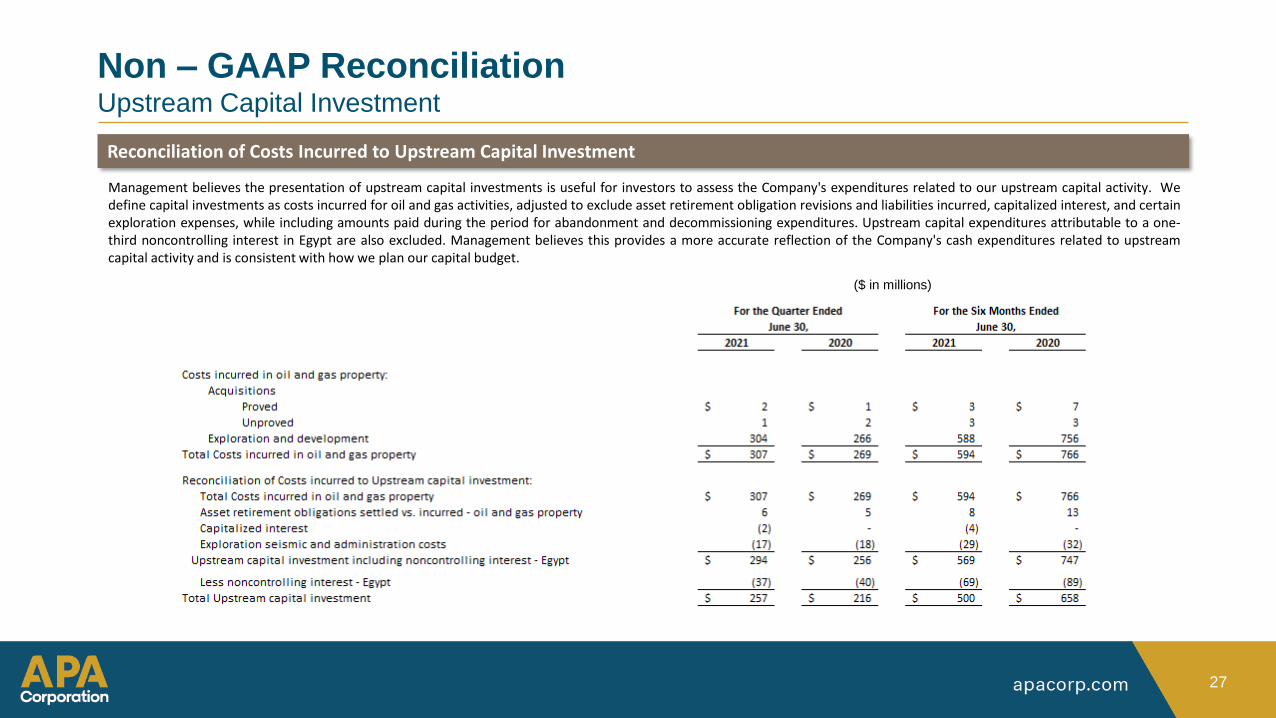
Management believes the presentation of upstream capital investments is useful for investors to assess the Company's expenditures related to our upstream capital activity. Wedefine capital investments as costs incurred for oil and gas activities, adjusted to exclude asset retirement obligation revisions and liabilities incurred, capitalized interest, and certainexploration expenses, while including amounts paid during the period for abandonment and decommissioning expenditures. Upstream capital expenditures attributable to a one-third noncontrolling interest in Egypt are also excluded. Management believes this provides a more accurate reflection of the Company's cash expenditures related to upstreamcapital activity and is consistent with how we plan our capital budget.
Reconciliation of Costs Incurred to Upstream Capital Investment
($ in millions)