Embed Size (px)
Citation preview

NJCAT TECHNOLOGY VERIFICATION
(See Disclaimer in Section 1.2)
Downstream Defender® Stormwater Treatment Device
Percent Removal of Sediment for Varying Particle
Size Distributions
Hydro International
December, 2015

i
TABLE OF CONTENTS
List of Figures ii List of Tables iii 1. Introduction 1
1.1 NJCAT Program 1 1.2 Technology Verification Report 2 1.3 Applicant Profile 2 1.4 Key Contacts 3
2. The Downstream Defender 3 3. Downstream Defender Performance Evaluation 5
3.1 Laboratory Setup 5 3.2 Test Sediment 10 3.3 Testing Procedure 13 4. Performance Test Results 16
4.1 Flow Rate 16 4.2 Sediment Dosing Rate 17 4.3 Background Concentration 17 4.4 Removal Efficiency 18
5. Conclusions 21
6. References 23 Appendix: Effluent Particle Size Distributions 24

ii
List of Figures Page
Figure 1 Swirling Flow Path of the Downstream Defender .............................................4
Figure 2 4-ft Downstream Defender ................................................................................6
Figure 3 Laboratory Testing Arrangement .......................................................................7
Figure 4 Effluent Sampling Location Situated above the Filter Box ...............................8
Figure 5 a) Influent Feed Port for Removal Efficiency Testing, b) False Bottom
Locations ..........................................................................................................9
Figure 6 a) Schematic Showing Location of Sump Access Port below Active Separation
Zone, b) Photo of the Sump through the Sump Clean-Out Port ........................9
Figure 7 Sump Access Port sits Flush with Interior Manhole Wall ...............................10
Figure 8 Particle Size Distribution of Test Sediment ....................................................13
Figure 9 Background Concentrations .............................................................................18
Figure 10 Downstream Defender Particle Size Band Removal Rates vs. Flow Rate .......22

iii
List of Tables
Page
Table 1 Specifications of Standard Downstream Defender Model Sizes. ......................4
Table 2 NJDEP Test Feed Sediment Particle Size Distribution ...................................11
Table 3 Test Feed Sediment Particle Size Distributions ...............................................12
Table 4 Flow Rate Summary Results ........................................................................... 16
Table 5 Sediment Flow Rate Dosing Rates ................................................................. 17
Table 6 Background Concentrations ............................................................................ 17
Table 7 NJDEP Test Sediment Removal Efficiency Results ....................................... 18
Table 8 0.27 cfs Test Results by Particle Size Band ....................................................19
Table 9 0.54 cfs Test Results by Particle Size Band .....................................................19
Table 10 0.82 cfs Test Results by Particle Size Band .....................................................20
Table 11 1.07 cfs Test Results by Particle Size Band .....................................................20
Table 12 1.38 cfs Test Results by Particle Size Band .....................................................21
Table 13 Flow Rates for >80% TSS Removal of Test Sediment in the 1000-50 µm
Particle Size Range (d50 of 146 µm) ................................................................22

1
1. Introduction
1.1 New Jersey Corporation for Advanced Technology (NJCAT) Program NJCAT is a not-for-profit corporation to promote in New Jersey the retention and growth of technology-based businesses in emerging fields such as environmental and energy technologies. NJCAT provides innovators with the regulatory, commercial, technological and financial assistance required to bring their ideas to market successfully. Specifically, NJCAT functions to:
• Advance policy strategies and regulatory mechanisms to promote technology commercialization;
• Identify, evaluate, and recommend specific technologies for which the regulatory and commercialization process should be facilitated;
• Facilitate funding and commercial relationships/alliances to bring new technologies to market and new business to the state; and
• Assist in the identification of markets and applications for commercialized technologies.
The technology verification program specifically encourages collaboration between vendors and users of technology. Through this program, teams of academic and business professionals are formed to implement a comprehensive evaluation of vendor specific performance claims. Thus, suppliers have the competitive edge of an independent third party confirmation of claims. Pursuant to N.J.S.A. 13:1D-134 et seq. (Energy and Environmental Technology Verification Program) the New Jersey Department of Environmental Protection (NJDEP) and NJCAT have established a Performance Partnership Agreement (PPA) whereby NJCAT performs the technology verification review and NJDEP certifies the net beneficial environmental effect of the technology. In addition, NJDEP/NJCAT work in conjunction to develop expedited or more efficient timeframes for review and decision-making of permits or approvals associated with the verified/certified technology. The PPA also requires that: • The NJDEP shall enter into reciprocal environmental technology agreements concerning the
evaluation and verification protocols with the United States Environmental Protection Agency, other local required or national environmental agencies, entities or groups in other states and New Jersey for the purpose of encouraging and permitting the reciprocal acceptance of technology data and information concerning the evaluation and verification of energy and environmental technologies; and
• The NJDEP shall work closely with the State Treasurer to include in State bid specifications,
as deemed appropriate by the State Treasurer, any technology verified under the Energy and Environment Technology Verification Program.

2
1.2 Technology Verification Report The Downstream Defender® is an advanced vortex separator designed to utilize the principles of swirl-enhanced gravity separation to remove Total Suspended Solids (TSS), trash and hydrocarbons from stormwater runoff. It is a structural Best Management Practice (BMP) installed underground as a permanent part of the storm drain line to reduce the overall load of oil, solids and floatables conveyed through the storm drain to receiving waters. Hydro International received New Jersey Corporation for Advanced Technology (NJCAT) verification of claims for the Downstream Defender in August 2015 (1) based on the New Jersey Department of Environmental Protection Laboratory Protocol to Assess Total Suspended Solids Removal by a Hydrodynamic Sedimentation Manufactured Treatment Device (2) dated January 25, 2013. The report was submitted to NJDEP and the Downstream Defender was subsequently NJDEP certified for use as a 50% TSS removal device on August 18, 2015. This report summarizes subsequent Downstream Defender TSS removal efficiency testing and performance results, which were conducting according to the NJDEP protocol with three significant exceptions:
• As vortex separators such as the Downstream Defender are typically used to remove the coarser “settleable” fraction of solids in stormwater runoff, this testing evaluated the removal efficiencies of the NJDEP test sediment down to 50 µm at five tested flow rates up to a maximum tested flow rate of 1.38 cfs. Under the NJDEP protocol, performance is verified based on a broad particle size distribution with particles ranging from 0.45 µm to 1000 µm where 45% of the material is finer than 50 µm, and performance is expressed as an “annualized weighted removal efficiency” calculated by weighting the removal efficiency results from five tested flow rates.
• Over and above the requirements of the NJDEP protocol, the effluent water quality samples from the removal efficiency tests were analyzed for particle size distribution so that the TSS removal efficiency results for discrete particle size bands could be calculated.
• The Scour Testing portion of the protocol was not conducted.
Since the performance testing does not fully comply with the NJDEP Protocol, it is an inadequate basis for NJDEP certification. Consequently, Hydro International will not be submitting this NJCAT Downstream Defender verification report to NJDEP for certification.
1.3 Applicant Profile
Hydro International, founded in 1980 in the United Kingdom, was formed to promote hydrodynamic vortex separators and vortex flow controls around the world. Today the company provides a wide range of technologies to the wastewater, stormwater, industrial and combined sewer overflow sectors of the water industry. The company is headquartered in Clevedon, England and has been publicly listed on the Alternative Investment Market of the London Stock

3
Exchange since 2005. Hydro International has state-of-the-art laboratory facilities located in Clevedon, England and Portland, Maine, where research and product engineers conduct development and verification programs to evaluate new and existing products. Hydro currently has 170 employees in the United Kingdom, United States, the Middle East and Asia. Its office locations include: Americas Stormwater 94 Hutchins Drive Portland, Maine 04102 Tel: +1 (207) 756-6200
Americas Wastewater 2925 NW Aloclek Drive, Suite 140 Hillsboro, OR 97124 Tel: +1 (503) 615-8130
Headquarters, European Stormwater Shearwater House Clevedon Hall Estate Victoria Road, Clevedon BS21 7RD Tel: +44 (0) 1275 878371
European Wastewater Prickwillow Road Ely, Cambridgeshire CB7 4TX Tel: +44 (0) 1353 645700
1.4 Key Contacts
Dr. Richard S. Magee, P.E., BCEE Executive Director NJ Corporation for Advanced Technology Center for Environmental Systems Stevens Institute of Technology Castle Point on Hudson Hoboken, NJ 07030 201-216-8081 973-879-3056 mobile
Lisa Lemont, CPSWQ Business Development Manager Hydro International 94 Hutchins Drive Portland, ME 04102 207-321-3740 [email protected]
2. The Downstream Defender The Downstream Defender® is an advanced vortex separator designed to utilize the principles of swirl-enhanced gravity separation to remove Total Suspended Solids (TSS), trash and hydrocarbons from stormwater runoff. The Downstream Defender has a tangential inlet to introduce a rotary flow path to the precast treatment chamber while crosslink polyethylene (PEX) flow-modifying internal components stabilize the swirling flow path to reduce turbulence (Fig.1).

4
Figure 1 Swirling Flow Path of the Downstream Defender Stormwater enters the Downstream Defender through a submerged tangential inlet. Hydrocarbons and other floatable solids rise to the surface where they are captured in the chamber as the stormwater spirals downward around the interior cylindrical baffle. When it reaches the center cone the flow changes direction from downward to upward, passing through a zero flow velocity “shear” zone where solids fall out of the flow and into the pollutant storage sump. After flow is deflected upward by the center cone, it spirals upwards around the center shaft inside the cylindrical baffle and discharged via the effluent pipe. To prevent washout, a benching skirt protects settled particles in the pollutant storage sump from high scour velocities. The Downstream Defender is available in five standard model sizes as shown in Table 1.
Table 1 Specifications of Standard Downstream Defender Model Sizes
Downstream Defender Model
Manhole Diameter
(ft)
Hydraulic Capacity (cfs)
Maximum Pipe Diameter (in)
Oil Storage Capacity
(gal)
Sediment Storage
Capacity (yd3) 4-ft 4-ft 3.0 12 70 0.70
6-ft 6-ft 8.0 18 216 2.10
8-ft 8-ft 15.0 24 540 4.65
10-ft 10-ft 25.0 30 1,050 8.70
12-ft 12-ft 38.0 36 1,770 14.70
Influent Effluent

5
3. Downstream Defender Performance Evaluation The objective of this performance evaluation was to determine the maximum flow rate at which the Downstream Defender removes >80% Total Suspended Solids when considering NJDEP test sediment in the 50 µm to 1000 µm particle size range. The test setup and procedures were conducted in accordance with the New Jersey Department of Environmental Protection Laboratory Protocol to Assess Total Suspended Solids Removal by a Hydrodynamic Sedimentation Manufactured Treatment Device dated January 25, 2013. The testing was conducted on a 4-ft Downstream Defender at Hydro International’s hydraulic testing facility at 94 Hutchins Drive, Portland, Maine 04102 from May to June of 2015. In compliance with the requirement that the performance evaluation be independent, all testing was conducted under the supervision of third party witnesses from FB Environmental Associates, Inc. The particle size distributions of the feed sediment samples were analyzed by the independent analytical laboratory GeoTesting Express in Acton, Massachusetts. The particle size distributions of the effluent samples were analyzed by the independent analytical laboratory Microtrac, Inc. in York, Pennsylvania. Hydro opted to follow the sediment analysis methods as required by the ETV-Canada protocol, which uses the New Jersey Particle Size Distribution as a test blend, for analyzing the feed sediment and the effluent sediment. The ETV-Canada procedure was written by a panel of independent governing bodies, independent testing laboratories and manufacturers. The procedure requires that the influent determinations be based on the ASTM D422-63 method because of the test blend’s broad spectrum of particle sizes. This method, which uses a hydrometer, was deemed the best fit to analyze concentrations at particle sizes at the specified cut points, though one of the limitations of the method is its accurateness below 20 micron. For the effluent, however, the assumption is that much of the coarse material (>250 microns) has been removed and therefore the ISO 13320 (2009) method is preferable because laser diffraction is more accurate at analyzing fines (at many different cut points) than a hydrometer. All water quality samples for the removal efficiency testing were collected, labeled and sealed under the direct supervision of the independent observer from FB Environmental and analyzed by Maine Environmental Laboratory, an independent laboratory located in Yarmouth, Maine. 3.1 Laboratory Setup The test unit was a 4-ft Downstream Defender comprised of full scale, commercially available 4-ft Downstream Defender internal components installed in a 4-ft round plastic manhole chamber with a sump access/viewing port, which was consistent in all key dimensions with the precast chambers used for commercial sales (Fig. 2). Measurements of the key dimensions were independently confirmed by FB Environmental Associates, Inc.

6
Figure 2 4-ft Downstream Defender The laboratory setup consisted of a recirculating closed loop system with an 8-inch submersible Flygt pump that conveyed water from a 23,000 gallon reservoir through a PVC pipe network to the 4-ft Downstream Defender (Fig. 3). The flow rate of the pump was controlled by a GE Fuji Electric AF-300 P11 Adjustable Frequency Drive motor and measured by an EMCO Flow Systems 4411e Electromagnetic Flow Transmitter.

7
Figure 3 Laboratory Testing Arrangement
A series of three flow isolation valves were located between the Flygt pump and the Downstream Defender, which allows flow to bypass the Downstream Defender if fully opened. These valves were installed as part of the piping network to direct flow to three other manufactured stormwater and wastewater treatment systems installed at the test facility along the same piping network, and were fully closed throughout the entire period from May to June 2015 when the Downstream Defender testing was conducted. A background sampling port was installed about 27 feet upstream of the Downstream Defender. The Downstream Defender effluent discharged freely from the effluent pipework, where grab samples were taken. The free discharge flowed through a filter box fitted with 1 micron filter socks in order to remove the majority of fine sediment that remained in the flow stream (Fig.4). The filter box was located on the opposite side of the reservoir as the submersible pump in order to keep the background TSS concentrations low over the duration of the removal efficiency tests.

8
Figure 4 Effluent Sampling Location Situated above the Filter Box
The water temperature within the reservoir was regulated by a Hayward 350FD pool heater, which is used to reduce any volatility in the test data that could potentially be caused by variability in water temperatures between test runs. The night before a test run the Hayward 350FD was set to 80°F. It was then turned off the morning of each test run at least one hour before the test began. The Hayward 350FD assembly includes a small recirculation pump that causes a gentle current in the reservoir, which could potentially cause high background concentration readings during testing by carrying sediment discharged during a test run back to the main reservoir feed pump more quickly. Turning the heater off allowed any water movement in the reservoir to stop before the beginning of testing. The Hayward 350FD remained off throughout the entire duration of each test run. The test reservoir temperature was measured and recorded at 30 second intervals by a Lascar thermometer and temperature logger over the duration of each test. During the test runs, test sediment was introduced into the flow at a consistent, calibrated rate by an Auger Feeder Model VF-2 volumetric screw feeder situated atop a 4-inch port located 5 feet upstream of the Downstream Defender test unit. The location of the port is shown in Fig. 5a. The Downstream Defender sump measures 18 inches in height from the bottom of the internal components. It was fitted with a false bottom positioned 9 inches from the true sump bottom to simulate a 50% full condition (Fig. 5b). This is the test condition required by the NJDEP test protocol. The false bottom was secured to the chamber and sealed around the edges to prevent any material from collecting below. Since scour testing was not conducted during this testing, the scour test false bottom shown in Figure 5b was not installed. It was used in prior testing to comply with the NJDEP test protocol. The test vessel has a rectangular access port located on the sump wall (Fig. 6a-b). The access port eliminates the need for confined space entry into the Downstream Defender to clean the unit between test events.

9
Figure 5 a) Influent Feed Port for Removal Efficiency Testing, b) False Bottom Locations
Figure 6 a) Schematic Showing Location of Sump Access Port below Active Separation
Zone, b) Photo of the Sump through the Sump Clean-Out Port
To ensure dimensional consistency with a commercial unit, the inside of the sump access port is fitted with an insert fabricated to be flush with the interior of the cylindrical manhole wall (Fig.7). Therefore the viewing port did not provide any additional sump storage capacity and the interior of the test vessel is dimensionally consistent with a standard commercial Downstream Defender.
a. b. a
a. b.

10
Figure 7 Sump Access Port sits Flush with Interior Manhole Wall
3.2 Test Sediment
The feed sediment used for the removal efficiency testing was high purity silica (SiO2 99.8%) supplied by two different commercial silica suppliers, blended in the proportions required to comply with the particle size distribution required by the NJDEP protocol. Prior to the start of the removal efficiency testing, 4 large batches of test sediment were blended by Hydro International in the presence of the independent observer. Three sediment samples approximately 400 mL in volume were composited from 100 mL subsamples collected from each of the four batches under the supervision of the independent observer. Under the supervision of the independent observer, the 4 batches were sealed in 5 gallon buckets and set aside until testing began. The three composited samples were sealed, signed and packaged for independent transport to the outside laboratory under the supervision of the independent observer. The independent laboratory, GeoTesting Express, analyzed the particle size distribution of each of the three samples using ASTM D 422-63. The three samples were then averaged and the results shown in Table 2.

11
Table 2 NJDEP Test Feed Sediment Particle Size Distribution
Particle Size Particle Size Distribution (% Finer Than)
(µm)
Sample 1 Sample 2 Sample 3 Test Sediment Average
1000 100 100 100 100.00
500 95 95 95 95.00
250 90 90 90 90.00
150 74 76 74 74.67
110 64 66 64 64.67
75 52 53 52 52.33
53 48 48 48 48.00
32.1 43 45 44 44.00
21 35 37 38 36.67
12.3 29 32 27 29.33
8.9 23 23 21 22.33
6.4 18 19 16 17.67
4.5 13 14 13 13.33
3.3 9 11 8 9.33
1.4 5 5 4 4.67
d50 (µm) 64.3 60.3 63.3 62.6
Because the verification goal was to verify the removal rate of the Downstream Defender down to 50 micron, the test sediment particle size distribution results are expressed in Table 3 and Fig. 8 below as both the entire particle size distribution range and the fraction of sediment greater than or equal to 50 µm.

12
Table 3 Test Feed Sediment Particle Size Distributions
Particle Size
Particle Size Distribution (%Finer Than)
(µm) NJDEP PSD
Feed Sediment Down to 250 µm
Feed Sediment Down to 150 µm
Feed Sediment Down to 100 µm
Feed Sediment Down to 75 µm
Feed Sediment
Down to 50 µm
1000 100.00 100.00 100.00 100.00 100.00 100.00
500 95.00 50.00 80.26 87.13 89.51 90.49
250 90.00 0.00 60.52 74.27 79.02 80.98
150 74.67 0.00 0.00 34.82 46.86 51.82
100 61.14 0.00 0.00 0.00 18.48 26.08
75 52.33 0.00 0.00 0.00 0.00 9.33
50 47.43 0.00 0.00 0.00 0.00 0.00
20 35.92 0.00 0.00 0.00 0.00 0.00
8 20.62 0.00 0.00 0.00 0.00 0.00
5 14.41 0.00 0.00 0.00 0.00 0.00
2 6.14 0.00 0.00 0.00 0.00 0.00
d50 (µm) 63 500 233 188 160 146

13
Figure 8 Particle Size Distribution of Test Sediment
3.3 Testing Procedure
Removal efficiency testing was conducted in accordance with Section 5 of the NJDEP Laboratory Protocol for HDS MTDs. Captured sediment was removed from the sump between each flow rate trial. Flow Rate A total of five flow rates were tested: 0.27 cfs (7.66 L/s), 0.54 cfs (15.29 L/s), 0.82 cfs (23.18 L/s), 1.07 cfs (30.31 L/s), and 1.38 cfs (39.19 L/s). During each flow rate test, the flow meter data logger recorded flow rate at a minimum of once per minute. Up to the maximum tested flow rate of 1.38 cfs, the target treatment goal was to remove at least 80% of test sediment particles > 50 µm. An additional objective was to determine removal performance within specific particle size bands: 1000-250 µm, 1000-150 µm, 1000-100 µm, 1000-75 µm, and 1000-50 µm.

14
Temperature The Hayward 350FD pool heater remained off throughout the entire duration of each test run. The water temperature was recorded at 30 second intervals by a Lascar thermometer and temperature logger over the duration of each test to ensure that the temperature did not exceed 80 degrees Fahrenheit at any time during the test. Influent Concentration The test sediment mass was fed into the flow stream at a known rate that would generate a total influent concentration of 200 ±10% mg/L using a screw auger with a calibrated funnel. To ensure that sediment was introduced at a rate within 10% of the targeted value of 200 mg/L influent concentration throughout the duration of the testing, six calibration samples were taken from the injection point over the course of the testing for each tested flow rate. The calibration samples were timed at evenly spaced intervals over the total duration of the test for each tested flow rate and timed such that no collection interval would exceed 1 minute in duration. Each calibration sample was a minimum of 100 mL collected in a clean 1-liter container over an interval timed to the nearest second. These samples were weighed to the nearest milligram. The average influent TSS concentration was calculated using the total mass of the test sediment added during dosing divided by the volume of water that flowed through the MTD during dosing (Equation 1). The mass extracted for calibration samples was subtracted from the total mass introduced to the system to determine the total mass of test sediment added during dosing when removal efficiency was subsequently calculated. The volume of water that flows through the MTD was calculated by multiplying the average flow rate by the time of sediment injection only.
Equation 1 Calculation for Average Influent Concentration
Influent Concentration within Particle Size Bands Since an additional objective of the testing was to quantify the Downstream Defender removal performance within specific particle size bands, the influent concentration within those specific particle size bands had to be determined. Equation 2 was used to determine the influent concentration within a specific particle size band. The total influent concentration calculated in Equation 1 was multiplied by the % of sediment within the particle size range from Table 3.
Influent Concentration in Range = (% Particles in Range) * (Average Influent Concentration)
Equation 2 Calculation for Influent Concentration in Particle Size Band

15
Collection and Analysis of Effluent Samples The Effluent Grab Sampling Method was used as per Section 5D of the NJDEP protocol. Once a constant rate of flow and test sediment feed were established, a minimum of three MTD detention times passed before the first effluent water quality sample was collected. The time interval between sequential effluent water quality samples was evenly spaced during the test sediment feed period to obtain a total of 15 water quality samples for each flow rate. Duplicate effluent samples were collected with the first, middle and last water quality samples so they could be composited and analyzed for particle size distribution. All effluent samples were collected in clean half-liter bottles using a sweeping grab sampling motion through the effluent discharge as described in Section 5D of the protocol. Samples were then time stamped and placed into separate boxes for transportation to the water quality analytical laboratory and the particle size analytical laboratory. The collection time for each effluent sample was recorded. Each collected sample was time stamped, sealed and signed by the independent observer. Collection and Analysis of Background Samples Background samples were taken at the background sample port located upstream of the Downstream Defender test setup. Influent background samples were taken at the same time as odd numbered effluent grab samples (first, third, fifth, etc.). The collection time for each background sample was recorded. Each collected sample was time stamped, sealed and signed by the independent observer. Quality Assurance and Chain of Custody FB Environmental acted as the independent observer for the duration of all testing and packing of the water quality samples for shipment to the independent lab for analysis. At the conclusion of the test when all of the collected effluent and background water quality samples were placed into the delivery box, the box was sealed and the seal was signed by the independent observer. All water quality samples were analyzed by Maine Environmental Laboratory in accordance with ASTM D3977-97 (re-approval 2007) “Standard Test Methods for Determining Sediment Concentrations in Water Samples”. Effluent particle size samples were collected and sent to Microtrac, Inc. of York, Pennsylvania to be analyzed for particle size distribution in accordance with ISO 13320 (2009). Removal Efficiency Calculation The background data were plotted on a curve for use in adjusting the effluent samples for background concentration. The overall removal efficiency of the Downstream Defender was then calculated as per Equation 3.
16
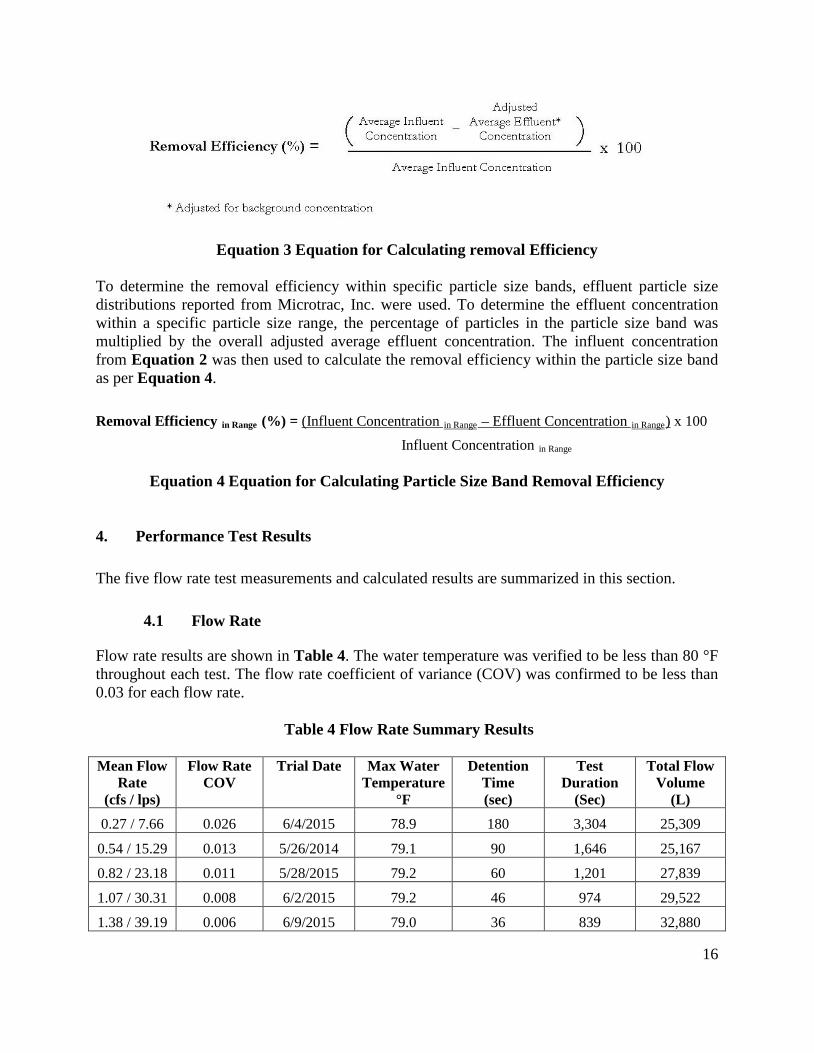
Equation 3 Equation for Calculating removal Efficiency
To determine the removal efficiency within specific particle size bands, effluent particle size distributions reported from Microtrac, Inc. were used. To determine the effluent concentration within a specific particle size range, the percentage of particles in the particle size band was multiplied by the overall adjusted average effluent concentration. The influent concentration from Equation 2 was then used to calculate the removal efficiency within the particle size band as per Equation 4. Removal Efficiency in Range (%) = (Influent Concentration in Range – Effluent Concentration in Range) x 100 Influent Concentration in Range
Equation 4 Equation for Calculating Particle Size Band Removal Efficiency
4. Performance Test Results The five flow rate test measurements and calculated results are summarized in this section.
4.1 Flow Rate Flow rate results are shown in Table 4. The water temperature was verified to be less than 80 °F throughout each test. The flow rate coefficient of variance (COV) was confirmed to be less than 0.03 for each flow rate.
Table 4 Flow Rate Summary Results
Mean Flow Rate
(cfs / lps)
Flow Rate COV
Trial Date Max Water Temperature
°F
Detention Time (sec)
Test Duration
(Sec)
Total Flow Volume
(L) 0.27 / 7.66 0.026 6/4/2015 78.9 180 3,304 25,309
0.54 / 15.29 0.013 5/26/2014 79.1 90 1,646 25,167
0.82 / 23.18 0.011 5/28/2015 79.2 60 1,201 27,839
1.07 / 30.31 0.008 6/2/2015 79.2 46 974 29,522
1.38 / 39.19 0.006 6/9/2015 79.0 36 839 32,880

17
4.2 Sediment Dosing Rate
Sediment dosing rate data is shown in Table 5. Sediment was introduced at the targeted feed rate required for an average influent concentration of 200 mg/L ±10%. The average influent concentrations ranged from 196 mg/L to 213 mg/L, a variation of -2% to 6.5% from the target. Six calibration samples were collected to verify the sediment feed rate for each flow rate trial. The feed rate COVs ranged from 0.015 to 0.04 well below the <0.10 COV requirement..
Table 5 Sediment Flow Rate Dosing Rates
Mean Flow Rate
(cfs / lps)
No. Calibration
Samples
Calibration Sample Time (sec)
Mass of Feed Sediment Used (g)
Dosing Rate
(mg/min)
Feed Rate COV
Average Influent
Concentration (mg/L)
0.27 / 7.66 6 60 5,159 93,689 0.04 204
0.54 / 15.29 6 60 5,264 191,883 0.017 209
0.82 / 23.18 6 60 5,929 296,189 0.015 213
1.07 / 30.31 6 60 6,158 379,569 0.02 209
1.38 / 39.19 6 45 6,452 461,416 0.04 196
4.3 Background Concentration
Eight background samples were taken during each flow rate trial. Background concentrations ranged from ND (2 mg/L) to 16 mg/L. At no point was the background concentration shown to exceed the 20 mg/L maximum allowed by the protocol. Background concentrations are shown in Table 6 and Figure 9.
Table 6 Background Concentrations
Mean Flow Rate
(cfs / lps)
No. Background
Samples
Measured Background Suspended Sediment Concentration (mg/L)
Min. Max. Mean Median 0.27 / 7.66 8 2.0 11.0 6.4 6
0.54 / 15.29 8 2.0 16.0 8.3 7.5
0.82 / 23.18 8 2.0 13.0 5.6 3.0
1.07 / 30.31 8 2.0 15.0 5.5 3.0
1.38 / 39.19 8 2.0 11.0 4.9 2.0

18
1.381.070.820.540.27
16
14
12
10
8
6
4
2
0
Flow Rate (cfs)
Back
grou
nd C
once
ntra
tion
(m
g/L)
Background Concentrations of Flow Rate Trials
Figure 9 Background Concentrations
4.4 Removal Efficiency
This section summarizes the overall TSS removal efficiency and the removal efficiency by particle size band width for each of the five flow rates. Overall Removal Efficiency The effluent concentrations from each water quality sample were adjusted by subtracting the background concentration at the time the sample was taken. The overall removal efficiencies for each flow rate trial were calculated as per Equation 3 from Section 3.3 and shown in Table 7.
Table 7 NJDEP Test Sediment Removal Efficiency Results
Flow Rate Trial (cfs / lps)
Average Influent Concentration
(mg/L)
Adjusted Effluent Concentration
(mg/L)
Removal Efficiency (%)
0.27 / 7.66 204 81 60.3
0.54 / 15.29 209 100 52.2
0.82 / 23.18 213 110 48.4
1.07 / 30.31 209 122 41.6
1.38 / 39.19 196 118 39.8

19
Removal Efficiency by Particle Size Band
The effluent particle size distributions were analyzed for each flow rate trial. The concentrations of sediment in the effluent down to 250, 150, 100, 75 and 50 µm were calculated using the reported PSDs, which can be found in Appendix A. The removal efficiency within each particle size band was then calculated as per Equation 4 from Section 3.3. Results are shown in Tables 8-12.
Table 8 - 0.27 cfs Test Results by Particle Size Band
D50 for Each Band (µm)
Influent Effluent % Remov
al of TSS in Range
Particle Size Band Concentration (mg/L)
Concentration (mg/L)
1,000 µm to 250 µm 500 20.4 0.0 100.0 1,000 µm to 150 µm 233 51.6 0.1 99.8 1,000 µm to 100 µm 188 79.2 0.9 98.8 1,000 µm to 75 µm 160 97.2 2.0 98.0 1,000 µm to 50 µm 146 107.2 5.2 95.2
At a flow rate of 0.27 cfs, the 4-ft Downstream Defender removed 100.0% of all test sediment down to 250 µm, 99.8% of all test sediment down to 150 µm, 98.8% of all test sediment down to 100 µm, 98.0% of all test sediment down to 75 µm and 95.2% of all test sediment down to 50 µm (Table 8).
Table 9 – 0.54 cfs Test Results by Particle Size Band
D50 for Each
Band (µm)
Influent Effluent % Removal of TSS
in Range
Particle Size Band Concentration (mg/L)
Concentration (mg/L)
1,000 µm to 250 µm 500 20.9 0.0 100.0 1,000 µm to 150 µm 233 53.0 1.3 97.6 1,000 µm to 100 µm 188 81.3 3.3 96.0 1,000 µm to 75 µm 160 99.7 6.6 93.3 1,000 µm to 50 µm 146 110.0 11.0 90.0
At a flow rate of 0.54 cfs, the 4-ft Downstream Defender removed 100.0% of all test sediment down to 250 µm, 97.6% of all test sediment down to 150 µm, 96.0% of all test sediment down to 100 µm, 93.3% of all test sediment down to 75 µm and 90.0% of all test sediment down to 50 µm. A summary of performance results by particle size range are shown in Table 9.

20
Table 10 – 0.82 cfs Test Results by Particle Size Band
D50 for Each
Band (µm)
Influent Effluent % Removal of TSS
in Range
Particle Size Band Concentration (mg/L)
Concentration (mg/L)
1,000 µm to 250 µm 500 21.3 0.4 98.3 1,000 µm to 150 µm 233 54.0 2.3 95.7 1,000 µm to 100 µm 188 82.8 5.6 93.3 1,000 µm to 75 µm 160 101.5 9.3 90.8 1,000 µm to 50 µm 146 112.0 18.0 84.0
At a flow rate of 0.0.82 cfs, the 4-ft Downstream Defender removed 98.3% of all test sediment down to 250 µm, 95.7% down to 150 µm, 93.3% down to 100 µm, 90.8% down to 75 µm and 84.0% down to 50 µm. A summary of performance results by particle size range are shown in Table10.
Table 11 – 1.07 cfs Test Results by Particle Size Band
D50 for Each
Band (µm)
Influent Effluent % Removal of TSS
in Range
Particle Size Band Concentration (mg/L)
Concentration (mg/L)
1,000 µm to 250 µm 500 20.9 0.4 98.0 1,000 µm to 150 µm 233 52.8 2.6 95.1 1,000 µm to 100 µm 188 81.1 6.0 92.6 1,000 µm to 75 µm 160 99.4 9.8 90.2 1,000 µm to 50 µm 146 109.7 17.2 84.3
At a flow rate of 1.07 cfs, the 4-ft Downstream Defender removed 98.0% of all test sediment down to 250 µm, 95.1% down to 150 µm, 92.6% down to 100 µm, 90.2% down to 75 µm and 84.3% down to 50 µm. A summary of performance results by particle size range are shown in Table 11.

21
Table 12 – 1.38 cfs Test Results by Particle Size Band
D50 for Each
Band (µm)
Influent Effluent % Removal of TSS
in Range
Particle Size Band Concentration (mg/L)
Concentration (mg/L)
1,000 µm to 250 µm 500 19.6 0.4 97.8 1,000 µm to 150 µm 233 49.7 2.9 94.3 1,000 µm to 100 µm 188 76.2 7.0 90.8 1,000 µm to 75 µm 160 93.5 11.6 87.6 1,000 µm to 50 µm 146 103.2 20.2 80.4
At a flow rate of 1.38 cfs, the 4-ft Downstream Defender removed 97.8% of all test sediment down to 250 µm, 94.3% down to 150 µm, 90.8% down to 100 µm, 87.6% down to 75 µm and 80.4% down to 50 µm. A summary of performance results by particle size range are shown in Table 12. 5. Conclusions As stated earlier, the objective of this performance evaluation was to determine the maximum flow rate at which the Downstream Defender removes >80% test sediment Total Suspended Solids in the 50 µm to 1000 µm particle size range with a d50 of 146 µm. The five flow rate trials showed that at all tested flow rates up to 1.38 cfs; the Downstream Defender removed at least 97.88% of the test sediment down to 250 µm (d50 of 500 µm), 94.3% down to 150 µm (d50 of 233 µm), 90.8% down to 100 µm (d50 of 188 µm), 87.6% down to 75 µm (d50 of 160 µm), and 80.4% down to 50 µm (d50 of 146 µm). The removal efficiency versus flow rate correlation for each particle size band is shown in Figure 10.

22
Figure 10 Downstream Defender Particle Size Band Removal Rates vs. Flow Rate
Scaling The 4-ft Downstream Defender was found to remove 80.4% of test sediment (d50 of 146 µm) in the 50 µm to 1000 µm particle size range at a tested flow rate of 1.38 cfs, which corresponds to a 49.3 gpm/ft2 loading rate. This surface loading rate is applied to the larger Downstream Defender model sizes to determine the flow rate at which they provide equivalent treatment (Table 13).
Table 13 Flow Rates for >80% TSS Removal of Test Sediment in the 1000-50 µm Particle Size Range (d50 of 146 µm)
Downstream Defender Model
Manhole Diameter
(ft)
Flow Rate for 80% TSS Removal Down to 50
µm (cfs)
Treatment Area (ft2)
Loading Rate (gpm/ft2)
4-ft 4-ft 1.38 12.6 49.3
6-ft 6-ft 3.11 28.3 49.3
8-ft 8-ft 5.52 50.3 49.3
10-ft 10-ft 8.62 78.5 49.3
12-ft 12-ft 12.42 113.1 49.3

23
NJDEP only certifies stormwater treatment devices that satisfy all aspects of their laboratory test protocols. Since this verification report does not qualify for NJDEP certification it will not be submitted by NJCAT to the Department. 6. References ASTM D422-63. Standard Test Method for Particle-size Analysis of Soils. ASTM D3977-97. Standard Test Methods for Determining Concentrations in Water Samples. Hydro International 2015. Quality Assurance Project Plan for Downstream Defender® NJDEP Testing. Prepared by H.I.L. Technology, Inc. dba Hydro International. March 20, 2015. Canadian Environmental Technology Verification Program 2014. Procedure for laboratory Testing of Oil-Grit Separators. Prepared by the Toronto and Region Conservation Authority, September 2013. Revised: June 6, 2014 – Version 3.0 Hydro International 2015. Verification Testing Report for the Downstream Defender® Stormwater Treatment Device. Prepared by H.I.L. Technology, Inc. dba Hydro International. May 26, 2015. New Jersey Corporation for Advanced Technology. Downstream Defender® Stormwater Treatment Device: Hydro International. August 2015. NJDEP 2013. New Jersey Department of Environmental Protection Procedure for Obtaining Verification of a Stormwater Manufactured Treatment Device from New Jersey Corporation for Advanced Technology. Trenton, NJ. January 25, 2013. NJDEP 2013. New Jersey Department of Environmental Protection Laboratory Protocol to Assess Total Suspended Solids Removal by a Hydrodynamic Sedimentation Manufactured Treatment Device. Trenton, NJ. January 25, 2013.

24
APPENDIX
Effluent Particle Size Distributions
DD Test 723 – 0.54 cfs DD Test 724 – 0.82 cfs DD Test 725 – 1.07 cfs DD Test 726 – 0.27 cfs DD Test 727 – 1.38 cfs

Data Value
MV(um): 23.71
MN(um): 1.377
MA(um): 7.04
CS:8.52E-
01
SD: 17.48
Mz: 19.18
20.51
Ski: 0.546
Kg: 1.447
Size(um) %Tile
%Tile Size(um)
10.00 2.808
20.00 5.05
30.00 7.62
40.00 10.70
50.00 14.37
60.00 18.74
70.00 24.45
80.00 33.41
90.00 53.06
95.00 79.54
Dia(um) Vol% Width
14.37 100.0 34.96
Size(um) %Chan % Pass Size(um) %Chan % Pass Size(um) %Chan % Pass Size(um) %Chan % Pass
2000 0.00 100.00 104.6 0.56 97.05 5.50 1.88 21.83 0.2890 0.00 0.001826 0.00 100.00 95.95 0.63 96.49 5.04 1.76 19.95 0.2650 0.00 0.001674 0.00 100.00 87.99 0.73 95.86 4.62 1.64 18.19 0.2430 0.00 0.001535 0.00 100.00 80.69 0.82 95.13 4.24 1.53 16.55 0.2230 0.00 0.001408 0.00 100.00 73.99 0.93 94.31 3.89 1.43 15.02 0.2040 0.00 0.001291 0.00 100.00 67.85 1.06 93.38 3.57 1.36 13.59 0.1870 0.00 0.001184 0.00 100.00 62.22 1.20 92.32 3.27 1.29 12.23 0.1720 0.00 0.001086 0.00 100.00 57.05 1.34 91.12 2.999 1.23 10.94 0.1580 0.00 0.00995.5 0.00 100.00 52.32 1.50 89.78 2.750 1.17 9.71 0.1450 0.00 0.00912.9 0.00 100.00 47.98 1.68 88.28 2.521 1.10 8.54 0.1330 0.00 0.00837.1 0.00 100.00 44.00 1.86 86.60 2.312 1.03 7.44 0.1220 0.00 0.00767.6 0.00 100.00 40.34 2.05 84.74 2.120 0.96 6.41 0.1110 0.00 0.00703.9 0.00 100.00 37.00 2.25 82.69 1.944 0.87 5.45 0.1020 0.00 0.00645.5 0.00 100.00 33.93 2.47 80.44 1.783 0.78 4.58 0.0940 0.00 0.00591.9 0.00 100.00 31.11 2.68 77.97 1.635 0.68 3.80 0.0860 0.00 0.00542.8 0.00 100.00 28.53 2.89 75.29 1.499 0.59 3.12 0.0790 0.00 0.00497.8 0.00 100.00 26.16 3.09 72.40 1.375 0.50 2.53 0.0720 0.00 0.00456.4 0.00 100.00 23.99 3.21 69.31 1.261 0.42 2.03 0.0660 0.00 0.00418.6 0.00 100.00 22.00 3.27 66.10 1.156 0.36 1.61 0.0610 0.00 0.00383.8 0.00 100.00 20.17 3.31 62.83 1.060 0.30 1.25 0.0560 0.00 0.00352.0 0.00 100.00 18.50 3.32 59.52 0.972 0.26 0.95 0.0510 0.00 0.00322.8 0.00 100.00 16.96 3.28 56.20 0.891 0.22 0.69 0.0470 0.00 0.00296.0 0.00 100.00 15.55 3.19 52.92 0.817 0.21 0.47 0.0430 0.00 0.00271.4 0.00 100.00 14.26 3.08 49.73 0.750 0.16 0.26 0.0390 0.00 0.00248.9 0.14 100.00 13.08 2.95 46.65 0.687 0.07 0.10 0.0360 0.00 0.00228.2 0.20 99.86 11.99 2.83 43.70 0.630 0.03 0.03 0.0330 0.00 0.00209.3 0.20 99.66 11.00 2.72 40.87 0.578 0.00 0.00 0.0300 0.00 0.00191.9 0.23 99.46 10.09 2.62 38.15 0.530 0.00 0.00 0.02790 0.00 0.00176.0 0.26 99.23 9.25 2.53 35.53 0.486 0.00 0.00 0.02550 0.00 0.00161.4 0.29 98.97 8.48 2.44 33.00 0.446 0.00 0.00 0.02340 0.00 0.00148.0 0.33 98.68 7.78 2.35 30.56 0.409 0.00 0.00
135.7 0.38 98.35 7.13 2.24 28.21 0.375 0.00 0.00
124.4 0.43 97.97 6.54 2.13 25.97 0.344 0.00 0.00
114.1 0.49 97.54 6.00 2.01 23.84 0.315 0.00 0.00
10.6.2
Hydro InternationalDD Test 723
MT11910, File P3529
Distribution: Volume Run Time: 30 Sec Fluid: WATER
Progression: Geom 8 Root Run#: Avg of 3 Fluid Ref Index: 1.333 Loading Factor: 0.0469
Up Edge(um): 2000 Particle: SILICA Above Residual: 0 Transmission: 0.922
Low Edge(um): 0.0215 Transparency: Transparent Below Residual: 0 RMS Residual: 0.405%
Residuals: Disabled Part. Ref. Index: 1.54 Flow: 50 %
#Channels: 132 Particle Shape: Irregular Cell ID: 1518 Usonic Power: N/A
Analysis Mode: S3000/3500 Multi Run Delay: 0 Min. Usonic Time: N/A
Filter: Enabled DB Record: 38 Recalc Status: Original Serial Number: S4629
Analysis Gain: Default(2) Database: E:\Microtrac\Hydro International\Hydro International.MDB
S3000/S350006/25/2015 08:49S4629
-Warnings: NONE
38DB Rec:
UDefName UDefData
SOP Name: HYDRO INTERNATIONAL(*)

Data Value
MV(um): 29.76
MN(um): 1.785
MA(um): 9.80
CS:6.12E-
01
SD: 21.30
Mz: 24.40
25.47
Ski: 0.564
Kg: 1.593
Size(um) %Tile
%Tile Size(um)
10.00 4.35
20.00 7.50
30.00 10.76
40.00 14.27
50.00 18.10
60.00 22.82
70.00 29.41
80.00 41.08
90.00 67.62
95.00 100.5
Dia(um) Vol% Width
18.10 100.0 42.59
Size(um) %Chan % Pass Size(um) %Chan % Pass Size(um) %Chan % Pass Size(um) %Chan % Pass
2000 0.00 100.00 104.6 0.84 95.38 5.50 1.44 13.57 0.2890 0.00 0.001826 0.00 100.00 95.95 0.95 94.54 5.04 1.30 12.13 0.2650 0.00 0.001674 0.00 100.00 87.99 1.06 93.59 4.62 1.16 10.83 0.2430 0.00 0.001535 0.00 100.00 80.69 1.18 92.53 4.24 1.05 9.67 0.2230 0.00 0.001408 0.00 100.00 73.99 1.29 91.35 3.89 0.95 8.62 0.2040 0.00 0.001291 0.00 100.00 67.85 1.42 90.06 3.57 0.87 7.67 0.1870 0.00 0.001184 0.00 100.00 62.22 1.54 88.64 3.27 0.80 6.80 0.1720 0.00 0.001086 0.00 100.00 57.05 1.67 87.10 2.999 0.73 6.00 0.1580 0.00 0.00995.5 0.00 100.00 52.32 1.81 85.43 2.750 0.68 5.27 0.1450 0.00 0.00912.9 0.00 100.00 47.98 1.95 83.62 2.521 0.63 4.59 0.1330 0.00 0.00837.1 0.00 100.00 44.00 2.12 81.67 2.312 0.58 3.96 0.1220 0.00 0.00767.6 0.00 100.00 40.34 2.31 79.55 2.120 0.54 3.38 0.1110 0.00 0.00703.9 0.00 100.00 37.00 2.53 77.24 1.944 0.48 2.84 0.1020 0.00 0.00645.5 0.00 100.00 33.93 2.76 74.71 1.783 0.44 2.36 0.0940 0.00 0.00591.9 0.00 100.00 31.11 3.02 71.95 1.635 0.39 1.92 0.0860 0.00 0.00542.8 0.00 100.00 28.53 3.28 68.93 1.499 0.34 1.53 0.0790 0.00 0.00497.8 0.00 100.00 26.16 3.53 65.65 1.375 0.29 1.19 0.0720 0.00 0.00456.4 0.00 100.00 23.99 3.68 62.12 1.261 0.26 0.90 0.0660 0.00 0.00418.6 0.00 100.00 22.00 3.73 58.44 1.156 0.23 0.64 0.0610 0.00 0.00383.8 0.00 100.00 20.17 3.76 54.71 1.060 0.19 0.41 0.0560 0.00 0.00352.0 0.00 100.00 18.50 3.78 50.95 0.972 0.14 0.22 0.0510 0.00 0.00322.8 0.00 100.00 16.96 3.70 47.17 0.891 0.08 0.08 0.0470 0.00 0.00296.0 0.14 100.00 15.55 3.50 43.47 0.817 0.00 0.00 0.0430 0.00 0.00271.4 0.20 99.86 14.26 3.30 39.97 0.750 0.00 0.00 0.0390 0.00 0.00248.9 0.21 99.66 13.08 3.09 36.67 0.687 0.00 0.00 0.0360 0.00 0.00228.2 0.23 99.45 11.99 2.88 33.58 0.630 0.00 0.00 0.0330 0.00 0.00209.3 0.28 99.22 11.00 2.70 30.70 0.578 0.00 0.00 0.0300 0.00 0.00191.9 0.32 98.94 10.09 2.52 28.00 0.530 0.00 0.00 0.02790 0.00 0.00176.0 0.37 98.62 9.25 2.37 25.48 0.486 0.00 0.00 0.02550 0.00 0.00161.4 0.42 98.25 8.48 2.21 23.11 0.446 0.00 0.00 0.02340 0.00 0.00148.0 0.49 97.83 7.78 2.07 20.90 0.409 0.00 0.00
135.7 0.57 97.34 7.13 1.91 18.83 0.375 0.00 0.00
124.4 0.65 96.77 6.54 1.75 16.92 0.344 0.00 0.00
114.1 0.74 96.12 6.00 1.60 15.17 0.315 0.00 0.00
10.6.2
Hydro InternationalDD Test 724
MT11911, File P3529
Distribution: Volume Run Time: 30 Sec Fluid: WATER
Progression: Geom 8 Root Run#: Avg of 3 Fluid Ref Index: 1.333 Loading Factor: 0.0632
Up Edge(um): 2000 Particle: SILICA Above Residual: 0 Transmission: 0.914
Low Edge(um): 0.0215 Transparency: Transparent Below Residual: 0 RMS Residual: 0.404%
Residuals: Disabled Part. Ref. Index: 1.54 Flow: 50 %
#Channels: 132 Particle Shape: Irregular Cell ID: 1518 Usonic Power: N/A
Analysis Mode: S3000/3500 Multi Run Delay: 0 Min. Usonic Time: N/A
Filter: Enabled DB Record: 46 Recalc Status: Original Serial Number: S4629
Analysis Gain: Default(2) Database: E:\Microtrac\Hydro International\Hydro International.MDB
S3000/S350006/25/2015 09:00S4629
-Warnings: NONE
46DB Rec:
UDefName UDefData
SOP Name: HYDRO INTERNATIONAL(*)

Data Value
MV(um): 26.74
MN(um): 1.474
MA(um): 7.24
CS:8.29E-
01
SD: 20.41
Mz: 21.11
24.91
Ski: 0.633
Kg: 1.675
Size(um) %Tile
%Tile Size(um)
10.00 2.926
20.00 5.10
30.00 7.51
40.00 10.43
50.00 14.08
60.00 18.75
70.00 25.21
80.00 36.93
90.00 64.70
95.00 99.03
Dia(um) Vol% Width
14.08 100.0 40.82
Size(um) %Chan % Pass Size(um) %Chan % Pass Size(um) %Chan % Pass Size(um) %Chan % Pass
2000 0.00 100.00 104.6 0.78 95.49 5.50 2.00 21.74 0.2890 0.00 0.001826 0.00 100.00 95.95 0.87 94.71 5.04 1.87 19.74 0.2650 0.00 0.001674 0.00 100.00 87.99 0.96 93.84 4.62 1.73 17.87 0.2430 0.00 0.001535 0.00 100.00 80.69 1.06 92.88 4.24 1.60 16.14 0.2230 0.00 0.001408 0.00 100.00 73.99 1.15 91.82 3.89 1.49 14.54 0.2040 0.00 0.001291 0.00 100.00 67.85 1.24 90.67 3.57 1.39 13.05 0.1870 0.00 0.001184 0.00 100.00 62.22 1.33 89.43 3.27 1.30 11.66 0.1720 0.00 0.001086 0.00 100.00 57.05 1.42 88.10 2.999 1.23 10.36 0.1580 0.00 0.00995.5 0.00 100.00 52.32 1.51 86.68 2.750 1.15 9.13 0.1450 0.00 0.00912.9 0.00 100.00 47.98 1.60 85.17 2.521 1.08 7.98 0.1330 0.00 0.00837.1 0.00 100.00 44.00 1.70 83.57 2.312 1.00 6.90 0.1220 0.00 0.00767.6 0.00 100.00 40.34 1.83 81.87 2.120 0.91 5.90 0.1110 0.00 0.00703.9 0.00 100.00 37.00 1.97 80.04 1.944 0.82 4.99 0.1020 0.00 0.00645.5 0.00 100.00 33.93 2.13 78.07 1.783 0.73 4.17 0.0940 0.00 0.00591.9 0.00 100.00 31.11 2.31 75.94 1.635 0.63 3.44 0.0860 0.00 0.00542.8 0.00 100.00 28.53 2.50 73.63 1.499 0.55 2.81 0.0790 0.00 0.00497.8 0.00 100.00 26.16 2.69 71.13 1.375 0.46 2.26 0.0720 0.00 0.00456.4 0.00 100.00 23.99 2.85 68.44 1.261 0.39 1.80 0.0660 0.00 0.00418.6 0.00 100.00 22.00 3.00 65.59 1.156 0.33 1.41 0.0610 0.00 0.00383.8 0.00 100.00 20.17 3.06 62.59 1.060 0.28 1.08 0.0560 0.00 0.00352.0 0.00 100.00 18.50 3.02 59.53 0.972 0.24 0.80 0.0510 0.00 0.00322.8 0.00 100.00 16.96 3.02 56.51 0.891 0.21 0.56 0.0470 0.00 0.00296.0 0.14 100.00 15.55 3.04 53.49 0.817 0.21 0.35 0.0430 0.00 0.00271.4 0.21 99.86 14.26 3.01 50.45 0.750 0.14 0.14 0.0390 0.00 0.00248.9 0.21 99.65 13.08 2.91 47.44 0.687 0.00 0.00 0.0360 0.00 0.00228.2 0.24 99.44 11.99 2.83 44.53 0.630 0.00 0.00 0.0330 0.00 0.00209.3 0.28 99.20 11.00 2.76 41.70 0.578 0.00 0.00 0.0300 0.00 0.00191.9 0.32 98.92 10.09 2.70 38.94 0.530 0.00 0.00 0.02790 0.00 0.00176.0 0.36 98.60 9.25 2.63 36.24 0.486 0.00 0.00 0.02550 0.00 0.00161.4 0.42 98.24 8.48 2.57 33.61 0.446 0.00 0.00 0.02340 0.00 0.00148.0 0.48 97.82 7.78 2.49 31.04 0.409 0.00 0.00
135.7 0.54 97.34 7.13 2.39 28.55 0.375 0.00 0.00
124.4 0.62 96.80 6.54 2.27 26.16 0.344 0.00 0.00
114.1 0.69 96.18 6.00 2.15 23.89 0.315 0.00 0.00
10.6.2
Hydro InternationalDD Test 725
MT11912, File P3529
Distribution: Volume Run Time: 30 Sec Fluid: WATER
Progression: Geom 8 Root Run#: Avg of 3 Fluid Ref Index: 1.333 Loading Factor: 0.0475
Up Edge(um): 2000 Particle: SILICA Above Residual: 0 Transmission: 0.922
Low Edge(um): 0.0215 Transparency: Transparent Below Residual: 0 RMS Residual: 0.413%
Residuals: Disabled Part. Ref. Index: 1.54 Flow: 50 %
#Channels: 132 Particle Shape: Irregular Cell ID: 1518 Usonic Power: N/A
Analysis Mode: S3000/3500 Multi Run Delay: 0 Min. Usonic Time: N/A
Filter: Enabled DB Record: 58 Recalc Status: Original Serial Number: S4629
Analysis Gain: Default(2) Database: E:\Microtrac\Hydro International\Hydro International.MDB
S3000/S350006/25/2015 09:19S4629
-Warnings: NONE
58DB Rec:
UDefName UDefData
SOP Name: HYDRO INTERNATIONAL(*)

Data Value
MV(um): 19.27
MN(um): 1.484
MA(um): 7.26
CS:8.26E-
01
SD: 14.01
Mz: 16.82
15.12
Ski: 0.463
Kg: 1.175
Size(um) %Tile
%Tile Size(um)
10.00 3.11
20.00 5.36
30.00 7.62
40.00 10.27
50.00 13.51
60.00 17.35
70.00 22.18
80.00 28.77
90.00 40.88
95.00 55.57
Dia(um) Vol% Width
13.51 100.0 28.01
Size(um) %Chan % Pass Size(um) %Chan % Pass Size(um) %Chan % Pass Size(um) %Chan % Pass
2000 0.00 100.00 104.6 0.30 99.03 5.50 2.08 20.63 0.2890 0.00 0.001826 0.00 100.00 95.95 0.35 98.73 5.04 1.89 18.55 0.2650 0.00 0.001674 0.00 100.00 87.99 0.42 98.38 4.62 1.71 16.66 0.2430 0.00 0.001535 0.00 100.00 80.69 0.49 97.96 4.24 1.55 14.95 0.2230 0.00 0.001408 0.00 100.00 73.99 0.59 97.47 3.89 1.41 13.40 0.2040 0.00 0.001291 0.00 100.00 67.85 0.71 96.88 3.57 1.30 11.99 0.1870 0.00 0.001184 0.00 100.00 62.22 0.86 96.17 3.27 1.20 10.69 0.1720 0.00 0.001086 0.00 100.00 57.05 1.05 95.31 2.999 1.12 9.49 0.1580 0.00 0.00995.5 0.00 100.00 52.32 1.26 94.26 2.750 1.04 8.37 0.1450 0.00 0.00912.9 0.00 100.00 47.98 1.50 93.00 2.521 0.97 7.33 0.1330 0.00 0.00837.1 0.00 100.00 44.00 1.78 91.50 2.312 0.90 6.36 0.1220 0.00 0.00767.6 0.00 100.00 40.34 2.06 89.72 2.120 0.82 5.46 0.1110 0.00 0.00703.9 0.00 100.00 37.00 2.36 87.66 1.944 0.74 4.64 0.1020 0.00 0.00645.5 0.00 100.00 33.93 2.66 85.30 1.783 0.67 3.90 0.0940 0.00 0.00591.9 0.00 100.00 31.11 2.93 82.64 1.635 0.58 3.23 0.0860 0.00 0.00542.8 0.00 100.00 28.53 3.17 79.71 1.499 0.51 2.65 0.0790 0.00 0.00497.8 0.00 100.00 26.16 3.38 76.54 1.375 0.43 2.14 0.0720 0.00 0.00456.4 0.00 100.00 23.99 3.49 73.16 1.261 0.36 1.71 0.0660 0.00 0.00418.6 0.00 100.00 22.00 3.51 69.67 1.156 0.31 1.35 0.0610 0.00 0.00383.8 0.00 100.00 20.17 3.53 66.16 1.060 0.27 1.04 0.0560 0.00 0.00352.0 0.00 100.00 18.50 3.56 62.63 0.972 0.23 0.77 0.0510 0.00 0.00322.8 0.00 100.00 16.96 3.53 59.07 0.891 0.20 0.54 0.0470 0.00 0.00296.0 0.00 100.00 15.55 3.43 55.54 0.817 0.20 0.34 0.0430 0.00 0.00271.4 0.00 100.00 14.26 3.32 52.11 0.750 0.14 0.14 0.0390 0.00 0.00248.9 0.00 100.00 13.08 3.22 48.79 0.687 0.00 0.00 0.0360 0.00 0.00228.2 0.00 100.00 11.99 3.13 45.57 0.630 0.00 0.00 0.0330 0.00 0.00209.3 0.00 100.00 11.00 3.05 42.44 0.578 0.00 0.00 0.0300 0.00 0.00191.9 0.00 100.00 10.09 2.97 39.39 0.530 0.00 0.00 0.02790 0.00 0.00176.0 0.03 100.00 9.25 2.91 36.42 0.486 0.00 0.00 0.02550 0.00 0.00161.4 0.08 99.97 8.48 2.83 33.51 0.446 0.00 0.00 0.02340 0.00 0.00148.0 0.16 99.89 7.78 2.73 30.68 0.409 0.00 0.00
135.7 0.21 99.73 7.13 2.60 27.95 0.375 0.00 0.00
124.4 0.23 99.52 6.54 2.45 25.35 0.344 0.00 0.00
114.1 0.26 99.29 6.00 2.27 22.90 0.315 0.00 0.00
10.6.2
Hydro InternationalDD Test 726
MT11913, File P3529
Distribution: Volume Run Time: 30 Sec Fluid: WATER
Progression: Geom 8 Root Run#: Avg of 3 Fluid Ref Index: 1.333 Loading Factor: 0.0555
Up Edge(um): 2000 Particle: SILICA Above Residual: 0 Transmission: 0.909
Low Edge(um): 0.0215 Transparency: Transparent Below Residual: 0 RMS Residual: 0.484%
Residuals: Disabled Part. Ref. Index: 1.54 Flow: 50 %
#Channels: 132 Particle Shape: Irregular Cell ID: 1518 Usonic Power: N/A
Analysis Mode: S3000/3500 Multi Run Delay: 0 Min. Usonic Time: N/A
Filter: Enabled DB Record: 66 Recalc Status: Original Serial Number: S4629
Analysis Gain: Default(2) Database: E:\Microtrac\Hydro International\Hydro International.MDB
S3000/S350006/25/2015 09:31S4629
-Warnings: NONE
66DB Rec:
UDefName UDefData
SOP Name: HYDRO INTERNATIONAL(*)

Data Value
MV(um): 29.41
MN(um): 1.451
MA(um): 7.43
CS:8.07E-
01
SD: 24.26
Mz: 24.12
28.30
Ski: 0.648
Kg: 1.563
Size(um) %Tile
%Tile Size(um)
10.00 2.941
20.00 5.23
30.00 7.84
40.00 11.15
50.00 15.28
60.00 20.60
70.00 28.37
80.00 43.17
90.00 74.18
95.00 108.6
Dia(um) Vol% Width
15.28 100.0 48.52
Size(um) %Chan % Pass Size(um) %Chan % Pass Size(um) %Chan % Pass Size(um) %Chan % Pass
2000 0.00 100.00 104.6 0.99 94.61 5.50 1.89 21.11 0.2890 0.00 0.001826 0.00 100.00 95.95 1.11 93.62 5.04 1.76 19.22 0.2650 0.00 0.001674 0.00 100.00 87.99 1.22 92.51 4.62 1.64 17.46 0.2430 0.00 0.001535 0.00 100.00 80.69 1.33 91.29 4.24 1.53 15.82 0.2230 0.00 0.001408 0.00 100.00 73.99 1.42 89.96 3.89 1.43 14.29 0.2040 0.00 0.001291 0.00 100.00 67.85 1.51 88.54 3.57 1.33 12.86 0.1870 0.00 0.001184 0.00 100.00 62.22 1.57 87.03 3.27 1.26 11.53 0.1720 0.00 0.001086 0.00 100.00 57.05 1.63 85.46 2.999 1.18 10.27 0.1580 0.00 0.00995.5 0.00 100.00 52.32 1.68 83.83 2.750 1.12 9.09 0.1450 0.00 0.00912.9 0.00 100.00 47.98 1.75 82.15 2.521 1.05 7.97 0.1330 0.00 0.00837.1 0.00 100.00 44.00 1.82 80.40 2.312 0.98 6.92 0.1220 0.00 0.00767.6 0.00 100.00 40.34 1.91 78.58 2.120 0.90 5.94 0.1110 0.00 0.00703.9 0.00 100.00 37.00 2.03 76.67 1.944 0.81 5.04 0.1020 0.00 0.00645.5 0.00 100.00 33.93 2.16 74.64 1.783 0.73 4.23 0.0940 0.00 0.00591.9 0.00 100.00 31.11 2.32 72.48 1.635 0.64 3.50 0.0860 0.00 0.00542.8 0.00 100.00 28.53 2.49 70.16 1.499 0.55 2.86 0.0790 0.00 0.00497.8 0.00 100.00 26.16 2.65 67.67 1.375 0.47 2.31 0.0720 0.00 0.00456.4 0.00 100.00 23.99 2.80 65.02 1.261 0.40 1.84 0.0660 0.00 0.00418.6 0.00 100.00 22.00 2.92 62.22 1.156 0.34 1.44 0.0610 0.00 0.00383.8 0.00 100.00 20.17 2.96 59.30 1.060 0.28 1.10 0.0560 0.00 0.00352.0 0.00 100.00 18.50 2.89 56.34 0.972 0.24 0.82 0.0510 0.00 0.00322.8 0.00 100.00 16.96 2.85 53.45 0.891 0.22 0.58 0.0470 0.00 0.00296.0 0.15 100.00 15.55 2.86 50.60 0.817 0.21 0.36 0.0430 0.00 0.00271.4 0.23 99.85 14.26 2.81 47.74 0.750 0.15 0.15 0.0390 0.00 0.00248.9 0.23 99.62 13.08 2.70 44.93 0.687 0.00 0.00 0.0360 0.00 0.00228.2 0.27 99.39 11.99 2.62 42.23 0.630 0.00 0.00 0.0330 0.00 0.00209.3 0.31 99.12 11.00 2.55 39.61 0.578 0.00 0.00 0.0300 0.00 0.00191.9 0.37 98.81 10.09 2.48 37.06 0.530 0.00 0.00 0.02790 0.00 0.00176.0 0.43 98.44 9.25 2.43 34.58 0.486 0.00 0.00 0.02550 0.00 0.00161.4 0.50 98.01 8.48 2.37 32.15 0.446 0.00 0.00 0.02340 0.00 0.00148.0 0.58 97.51 7.78 2.31 29.78 0.409 0.00 0.00
135.7 0.67 96.93 7.13 2.22 27.47 0.375 0.00 0.00
124.4 0.77 96.26 6.54 2.13 25.25 0.344 0.00 0.00
114.1 0.88 95.49 6.00 2.01 23.12 0.315 0.00 0.00
10.6.2
Hydro InternationalDD Test 727
MT11914, File P3529
Distribution: Volume Run Time: 30 Sec Fluid: WATER
Progression: Geom 8 Root Run#: Avg of 3 Fluid Ref Index: 1.333 Loading Factor: 0.0502
Up Edge(um): 2000 Particle: SILICA Above Residual: 0 Transmission: 0.920
Low Edge(um): 0.0215 Transparency: Transparent Below Residual: 0 RMS Residual: 0.435%
Residuals: Disabled Part. Ref. Index: 1.54 Flow: 50 %
#Channels: 132 Particle Shape: Irregular Cell ID: 1518 Usonic Power: N/A
Analysis Mode: S3000/3500 Multi Run Delay: 0 Min. Usonic Time: N/A
Filter: Enabled DB Record: 74 Recalc Status: Original Serial Number: S4629
Analysis Gain: Default(2) Database: E:\Microtrac\Hydro International\Hydro International.MDB
S3000/S350006/25/2015 09:42S4629
-Warnings: NONE
74DB Rec:
UDefName UDefData
SOP Name: HYDRO INTERNATIONAL(*)