Embed Size (px)
Citation preview
NJCAT TECHNOLOGY VERIFICATION
CAPSTONE MODEL C200 MICROTURBINE
CAPSTONE TURBINE CORPORATION®
January 2010
1
TABLE OF CONTENTS
1. Introduction 4
1.1 NJCAT Program 4 1.2 Verification 5 1.3 Applicant Profile 5 1.4 Key Contacts 6
2. The Capstone Model C200 Microturbine 7
2.1 Technology Description 7 2.2 New Jersey Administrative Code 9 2.3 Technical Performance Claim 9
3. Technology Evaluation 10 3.1 Introduction 10 3.2 Test Methodologies 10
4. Verification Procedures: Technology System Performance 12
4.1 Data Analysis 12 4.2 Test Results 12
5. Performance Claim Verification 16
6. Net Environmental Benefit 17
7. References 17
Appendix A – Stack Conditions 18
2
List of Tables Table 1 Test Parameters and Test Methods 11 Table 2 Capstone C200 LP Natural Gas Fired 100 Percent Load 12 Table 3 Capstone C200 LP Natural Gas Fired 75 Percent Load 13 Table 4 Capstone C200 LP Natural Gas Fired 50 Percent Load 13 Table 5 Capstone C200 LP Natural Gas Fired 25 Percent Load 14 Table 6 Capstone C200 LP Natural Gas Fired 0 Percent (Idle) Load 14 Table 7 Capstone C200 LP Natural Gas Fired NOx Emissions 16
List of Figures
Figure 1 Typical Capstone C200 MicroTurbine Engine Construction 7 Figure 2 Capstone C200 NOx Emissions vs. Operational Load 15 Figure 3 Capstone C200 CO Emissions vs. Operational Load 15
3
1. Introduction 1.1 New Jersey Corporation for Advance Technology (NJCAT) Program NJCAT is a not-for-profit corporation to promote in New Jersey the retention and growth of technology-based businesses in emerging fields such as environmental and energy technologies. NJCAT provides innovators with the regulatory, commercial, technological and financial assistance required to bring their ideas to market successfully. Specifically, NJCAT functions to:
• Advance policy strategies and regulatory mechanisms to promote technology commercialization;
• Identify, evaluate, and recommend specific technologies for which the regulatory and commercialization process should be facilitated;
• Facilitate funding and commercial relationships/alliances to bring new technologies to market and new business to the state; and
• Assist in the identification of markets and applications for commercialized technologies.
The technology verification program specifically encourages collaboration between vendors and users of technology. Through this program, teams of academic and business professionals are formed to implement a comprehensive evaluation of vendor specific performance claims. Thus, suppliers have the competitive edge of an independent third party confirmation of claims. Pursuant to N.J.S.A. 13:1D-134 et seq. (Energy and Environmental Technology Verification Program) the New Jersey Department of Environmental Protection (NJDEP) and NJCAT have established a Performance Partnership Agreement (PPA) whereby NJCAT performs the technology verification review and NJDEP certifies that the technology meets the regulatory intent and that there is a net beneficial environmental effect of the technology. In addition, NJDEP/NJCAT work in conjunction to develop expedited or more efficient timeframes for review and decision-making of permits or approvals associated with the verified/certified technology. The PPA also requires that: • The NJDEP shall enter into reciprocal environmental technology agreements concerning the
evaluation and verification protocols with the United States Environmental Protection Agency, other local required or national environmental agencies, entities or groups in other states and New Jersey for the purpose of encouraging and permitting the reciprocal acceptance of technology data and information concerning the evaluation and verification of energy and environmental technologies; and
• The NJDEP shall work closely with the State Treasurer to include in State bid specifications,
as deemed appropriate by the State Treasurer, any technology verified under the Energy and Environment Technology Verification Program.
4
1.2 Verification On November 10, 2008, Capstone Turbine Corporation, 21211 Nordhoff Street, Chatsworth, CA 91311, submitted a formal request for participation in the NJCAT Technology Verification Program. The technology proposed – The Capstone MicroTurbine (Model C200) – is a 200kW compact, turbine generator that delivers electricity onsite, or close to the point where it is needed.. The request (after pre-screening by NJCAT staff personnel in accordance with the technology assessment guidelines) was accepted into the verification program. This verification report covers the evaluation based upon the performance claim of the vendor, Capstone, that the C200 microturbine according to New Jersey Department of Environmental Protection Administrative Code 7:27, subchapters 8 and 22, qualifies as an “insignificant source” of air emissions and consequently does not require an air permit. This verification project primarily involved the evaluation of company literature and a third party laboratory test report to verify that the Capstone C200 MicroTurbine satisfies the performance claim made by Capstone Turbine Corporation.
1.3 Applicant Profile Founded in 1988, Capstone Turbine Corporation is the world’s leading producer of low-emission microturbine systems and was the first to market with commercially viable microturbine energy products. Capstone Turbine has earned industry recognition in the research, development, and field applications of advanced gas turbine-driven generator technology. The company’s flagship product is the Capstone MicroTurbine power generation system. Capstone Turbine Corporation has shipped thousands of Capstone MicroTurbine systems to customers worldwide. These systems have logged millions of documented runtime operating hours. Capstone Turbine is a member of the U.S. Environmental Protection Agency’s Combined Heat and Power Partnership which is committed to improving the efficiency of the nation’s energy infrastructure and reducing emissions of pollutants and greenhouse gases. Capstone Turbine is a UL-Certified ISO 9001:2000 and ISO 14001:2004 certified company. Key managers of Capstone Management Team are: Darren Jamison, President and Chief Executive Officer; Edward Reich, Executive Vice-President and Chief Financial Officer; Mark Gilbreth, Executive Vice-President and Chief Technology Officer; James Crouse, Executive Vice-President of Sales; and Shelby Ahmann, Senior Vice-President, Customer Service. Capstone has six national and international offices that service their customers.
5
Corporate Headquarters 21211 Nordhoff Street Chatsworth, CA 91311 818-734-5300 1-866-4-CAPSTONE
Metro Area – NYC Service Center 495 Boulevard Unit 3 Elmwood Park, NJ 07407 Tel 201-254-9186 Fax 818-734-1022 Contact: Matt Vuolo
European Office 6 Holme Road West Bridgford Nottingham NG2 5AA England, UK Tel: +44 (0) 1158 469 380 Contact: Trevor Rainbow
Mexico City Office Contact: Cuitiahuac Sandoval-(Cuit Sandoval) Tel Ph Mexico +52 55 5344 6754 Mob Ph Mexico +52 55 1499 1205 Mob Ph USA +1 818 238-7942 [email protected]
Capstone China Office (Greater China Region) Room A 25F, Peakway Tower, No. 2 Lane 600 Tianshan Rd Shanghai 200051, PRC Tel 86 21 62700922 Fax 86 21 62700923 Mob 86 13901778524 Contact: Simon Xu [email protected]
Singapore Office Tel 818-407-3617 Fax +011 65 9106 6744 Contact: Sohra Yatani [email protected]
1.4 Key Contacts
Rhea Weinberg Brekke Executive Director NJ Corporation for Advanced Technology c/o New Jersey EcoComplex 1200 Florence Columbus Road Bordentown, NJ 08505 609-499-3600 ext. 227 [email protected]
Richard S. Magee, Sc.D., P.E., BCEE Technical Director NJ Corporation for Advanced Technology 15 Vultee Drive Florham Park, NJ 07932 973-822-1425 973-879-3056 cell [email protected]
Steve Gillette VP Product Management Capstone Turbine Corp. 21211 Nordhoff Street Chatsworth, CA 91311 818-407-3647 [email protected]
Sam Brewer Director of Sales, Eastern Region Capstone Turbine Corp. 21211 Nordhoff Street Chatsworth, CA 91311 718-554-0530 [email protected]
6
2. The Capstone Model C200 MicroTurbine
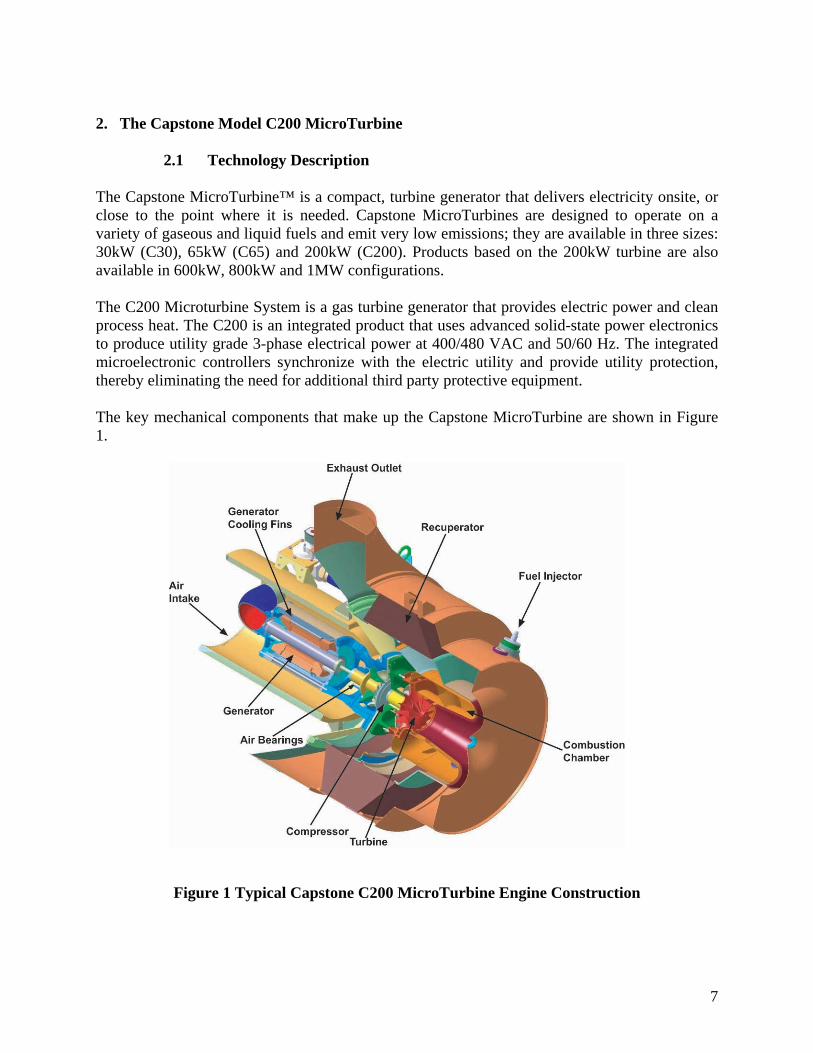
2.1 Technology Description The Capstone MicroTurbine™ is a compact, turbine generator that delivers electricity onsite, or close to the point where it is needed. Capstone MicroTurbines are designed to operate on a variety of gaseous and liquid fuels and emit very low emissions; they are available in three sizes: 30kW (C30), 65kW (C65) and 200kW (C200). Products based on the 200kW turbine are also available in 600kW, 800kW and 1MW configurations. The C200 Microturbine System is a gas turbine generator that provides electric power and clean process heat. The C200 is an integrated product that uses advanced solid-state power electronics to produce utility grade 3-phase electrical power at 400/480 VAC and 50/60 Hz. The integrated microelectronic controllers synchronize with the electric utility and provide utility protection, thereby eliminating the need for additional third party protective equipment. The key mechanical components that make up the Capstone MicroTurbine are shown in Figure 1.
Figure 1 Typical Capstone C200 MicroTurbine Engine Construction
7
The microturbine engine is a combustion turbine that includes a compressor, combustor, turbine, generator, and a recuperator. The rotating components are mounted on a single shaft supported by patented air bearings and spin at a maximum speed of 60,000 RPM. The permanent magnet generator is cooled by the airflow into the microturbine. The output of the generator is variable voltage, variable frequency AC. The generator is used as a motor during start-up and cooldown cycles. The microturbine can efficiently use a wide range of approved hydrocarbon-based gaseous fuels, depending on the model. The microturbine includes an integral fuel delivery and control system. The standard system is designed for pressurized hydrocarbon-based gaseous fuels. Other models are available for low-pressure gaseous fuels, gaseous fuels with lower heat content, gaseous fuels with corrosive components, and biogas (landfill and digester gas) fuels. Digital power electronics control and condition the microturbine electrical output. The digital power electronics change the variable frequency AC power from the generator to DC voltage, and then to constant frequency AC voltage. During start-up, the digital power electronics operate as a variable frequency drive, and motor the generator until the microturbine has reached ignition and power is available from the microturbine. The digital power electronics again operate as a drive during cooldown to remove heat stored in the recuperator and within the microturbine engine in order to protect the system components. Clean hot exhaust air can be used for process heating or cooling and can increase the overall efficiency of the system. This exhaust may be directed to an optional air to water heat exchanger. Alternately, the exhaust may be directed to customer provided devices, such as absorption chillers, which can generate cold water from the hot exhaust. The C200 MicroTurbine System requires little maintenance due to its use of air bearings. The use of air bearings, coupled with the fact that the microturbine system does not incorporate a mechanical transmission, means that no lubricants or coolants need to be periodically replaced or disposed of. Capstone MicroTurbines incorporate advanced engineering, based on more than 100 patents, and integrate an aero-based turbine engine, a magnetic generator, advanced power electronics and air bearings technology. All Capstone MicroTurbines operate:
• Continuously or On-Demand • Stand alone or Grid Connected • Individually or Multi-pack • On a variety of fuels
Key features of the Capstone MicroTurbine System include:
• Air cooled design: no cooling system maintenance or coolant disposal issues • Patented air bearings: no lubrication system maintenance or oil disposal issues • Advanced combustion control: eliminates the need for ceramics or for other costly
materials or for catalytic combustion • Oxygen rich exhaust with ultra low NOx and CO emission levels • Integral annular recuperator (heat exchanger) doubles electrical efficiency
8
• UL certified • Quiet operation (65 dB at 10 meters) • Modular design permits scalability • Multi-fuel capability • Remote Monitoring • Lightweight and compact design • High efficiency design
Capstone MicroTurbine products are commonly deployed in one or a combination of several of the following energy efficient solutions:
• CHP: Combined Heat & Power – CHP systems conserve energy and cut operational costs by creating both electricity and heat.
• CHHP: Combined Cooling, Heating & Power – The heat output can be used to both heat and air condition your facility via absorption cooling, while also producing electricity.
• Secure Power: Capstone MicroTurbines can operate connected to a utility grid or provide stand alone power to critical loads.
• Resource Recovery: Biogas Capstone MicroTurbines can cleanly burn waste gases to create renewable electrical power and heat.
• Resource Recovery: Oil and Gas Capstone MicroTurbines power onshore and offshore operations using unprocessed wellhead gas.
2.2 New Jersey Administrative Code
According to New Jersey Administrative Code (N.J.A.C.) section 7:27-8.2(c)1, a significant source of emissions is defined as “Commercial fuel burning equipment, except for a source listed in c(21) below, that has a maximum rated heat input of 1,000,000 BTU per hour or greater to the burning chamber, including emergency generators.” The exception noted in c(21) is for reciprocating engines. The Capstone C200 operating at full power and International Standard Organization (ISO) conditions consumes 2,079,000 BTU per hour, so it meets the heat input criterion as a significant source. However, N.J.A.C. section 7:27-8.2(f)1.i provides for “A microturbine with less than 500 kilowatts generating capacity that is fueled by natural gas and that has been verified according to the requirements in (f)2 below to emit less than:
(1) 0.40 pounds of NOx per megawatt hour; and (2) 0.25 pounds of CO per megawatt hour,”
to not be classified as a significant source.
2.3 Technical Performance Claim Claim – The Capstone C200 LP MicroTurbine fired with natural gas when operated at 40% or greater load has demonstrated by source emission testing that it emits less than 1) 0.40 pounds of NOx per megawatt hour, and 2) 0.25 pounds of CO per megawatt hour, and, therefore, that it is not a significant source of NOx and CO emissions in accordance with N.J.A.C. 7:27-8.2(f)1.i.
9
3. Technology Evaluation 3.1 Introduction The New Jersey Army National Guard (NJARNG) contracted AirRECON, a division of LFR Inc., to perform an emission evaluation on the outlet stack of one Capstone C-200 LP Micro Turbine. The evaluation was performed to verify claims submitted to the New Jersey Department of Environmental Protection (NJDEP) and to the New Jersey Corporation for Advanced Technology (NJCAT) in the Verification Program Limited Preliminary Application (VPLPA) dated November 11, 2008. Verification tests were performed on the identical model microturbine that NJARNG intends to install at various locations throughout New Jersey.
A Certification Stack Test Protocol which defined the procedures and methodologies to be used to verify the above emissions was reviewed and approved by NJDEP and NJCAT prior to testing. Stack tests were conducted on July 13 through 16, 2009 by AirRECON with their subcontractor GE Energy at Capstone’s Van Nuys, California facility. Capstone provided a web cam to allow observation of the test program by NJDEP and NJCAT personnel. However, only onsite observations occurred since these were deemed sufficient to ensure third party independence.
As defined in the approved protocol, testing was performed at the following five operational loadings (+ 5%) on the micro turbine:
• 100% (Base) Load (Average Power Output 164 KWe)
• 75% Load (Average Power Output 117 KWe)
• 50% Load (Average Power Output 85 KWe)
• 25% Load (Average Power Output 42 KWe)
• 0% (Idle) Load (Average Power Output <1 KWe)
3.2 Test Methodologies The parameters and methods used for this proposed emission test program are specified in Table 1. Three tests of at least one hour will be performed for all parameters at the five operational loadings. All proposed test methods conform to Title 40, Code of Federal Regulations, Part 60, Appendix A test procedures or those of the NJDEP.
10
Table 1 Test Parameters and Test Methods
PARAMETER METHOD
U.S. EPA Method 1, “Sample and Velocity Traverse for Stationary Sources” or U.S. EPA Method 1A, “Sample and Velocity Traverses for Stationary Sources with Small Stacks or Ducts.”
Flow rates
U.S. EPA Method 2, “Determination of Stack Gas Velocity and Volumetric Flow Rate (Type-S Pitot Tube)” and U.S. EPA Method 2C, “Determination of Stack Gas Velocity and Volumetric Flow Rate from Small Stacks or Ducts (Standard Pitot Tube).”
Oxygen, carbon dioxide U.S. EPA Method 3A, “Determination of Oxygen and Carbon Dioxide Concentrations in Emission from Stationary Sources.” (Instrumental Analyzer Procedure)
Moisture U.S. EPA Method 4, “Determination of Moisture Content in Stack Gases.”
Nitrogen Oxides (Nox as NO2) (Outlet Only)
U.S. EPA Method 7E, “Determination of Nitrogen Oxides Emissions from Stationary Sources.” (Instrumental Analyzer Procedure)
Carbon monoxide (CO) U.S. EPA Method 10, “Determination of Carbon Monoxide Emissions from Stationary Sources” (Instrumental Analyzer Procedure
In accordance with the approved stack test protocol, the micro turbine was tested without a heat recovery system. Useful thermal energy was calculated and added to electrical power to provide a net power output for the calculation of pounds per megawatt hour. Stack temperatures were measured every 10 minutes from a thermocouple that was installed in the exhaust duct upstream from the sample test ports. These temperature measurements were used to calculate useful thermal energy (based on a heat recovery system final temperature of 282 oF as agreed by NJDEP during protocol review) and were recorded on the field data sheets. Stack temperatures were also measured during flow traverses at the beginning and end of each test run in accordance with USEPA Methodology. These measurements were also recorded on the field data sheets, along with differential pressures and other information used to calculate volumetric flow rates. Appendix A indicates the stack conditions for the five operational loads tested.
Ambient air temperatures were recorded during the test runs to provide intake air temperatures to the micro turbine. These temperatures were used to determine the ambient temperature/pressure de-rated base load (KW) from Figure 7-2 of Capstone’s Technical Reference Manual (Page 7-8). The de-rated base load was used to determine the set point for power output (KWe) of the engine based on targeted percent load.
11
4. Verification Procedures: Technology System Performance
4.1 Data Analysis In accordance with USEPA test methodology, calibration responses recorded before and after each test run were used to bias correct the average stack gas responses. Bias corrected concentrations are used to calculate mass emission rates in pounds per hour (Lb/Hr), pounds per million British thermal unit (Lb/MMBtu) and pounds per megawatt-hour (Lb/MW-Hr). Mass emission rates are calculated using flow and F-factor based equations. The flow based calculated results are included in the emissions summary tables of this report (Section 4.2) as that is the generally accepted calculation procedure by NJDEP.
Fuel flow and power output were monitored using metering systems installed by Capstone. Data were recorded from these meters at 1 second intervals over the course of each test run. The raw data were averaged for each test period and were provided in Process Summary Sheets provided by AirRECON. Electronic copies of the raw data are available from AirRECON’s network computer drive.
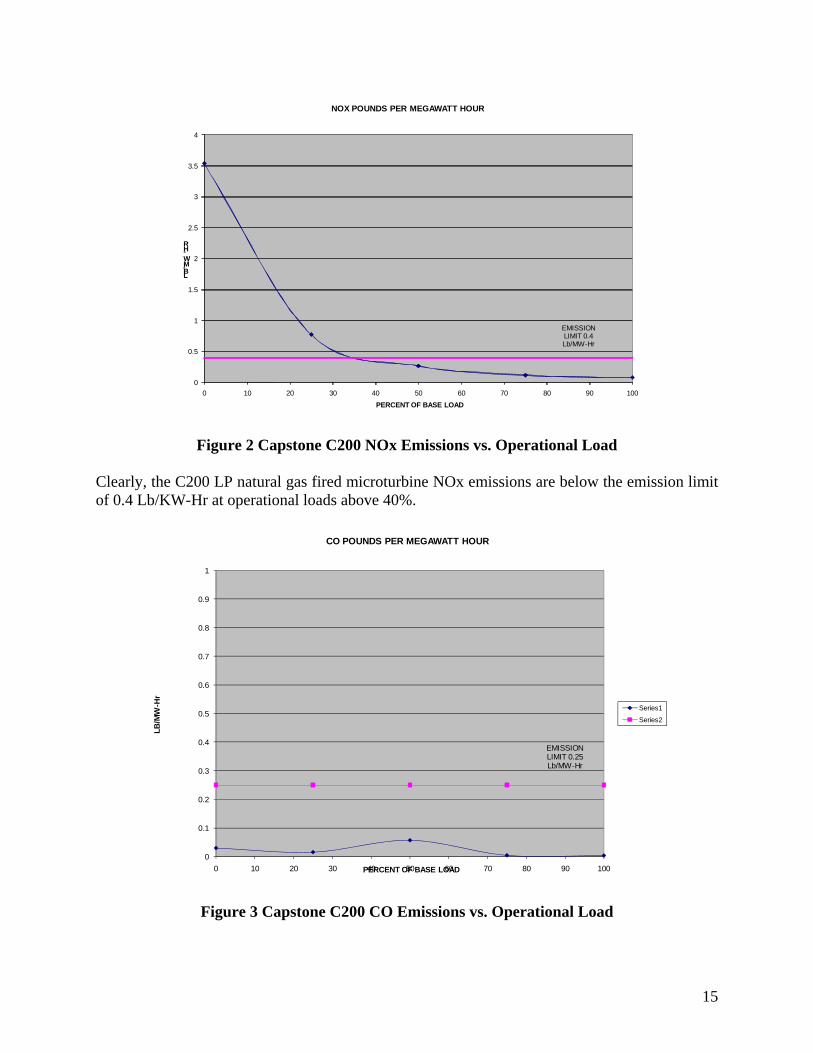
4.2 Test Results Emissions data from the five operational loads tested are shown in Tables 2, 3, 4, 5 and 6. The data are also displayed in Figures 2 and 3.
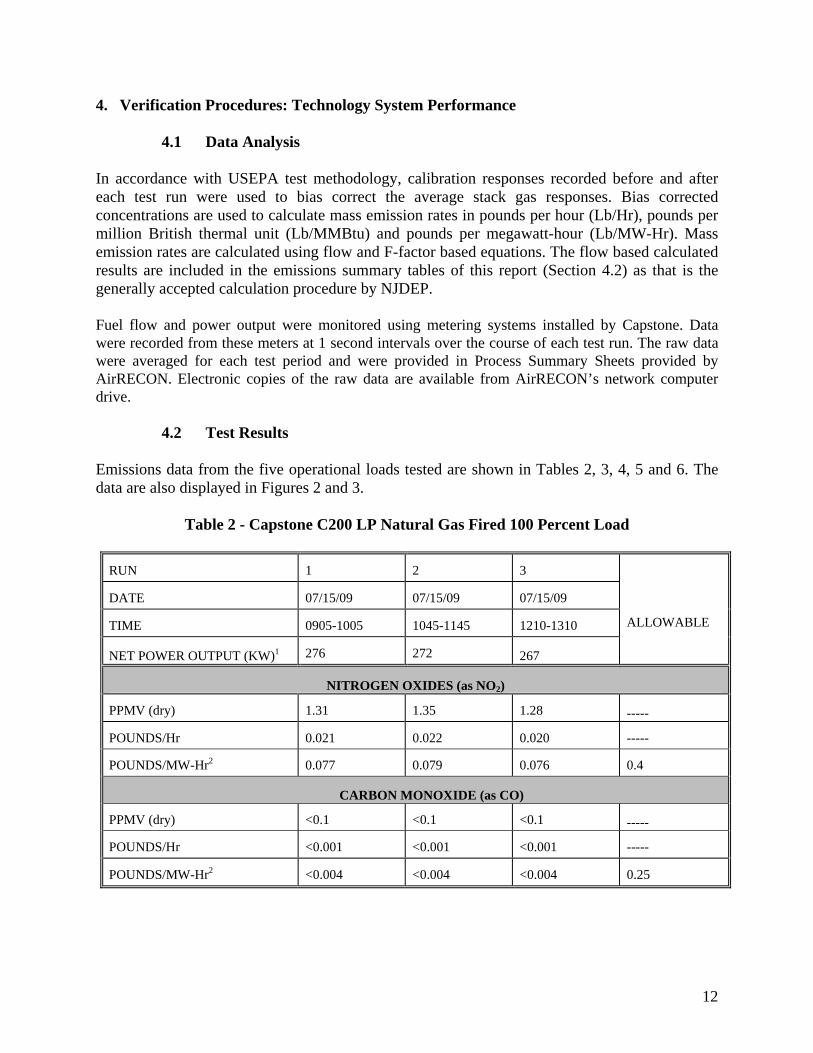
Table 2 - Capstone C200 LP Natural Gas Fired 100 Percent Load
RUN 1 2 3
DATE 07/15/09 07/15/09 07/15/09
TIME 0905-1005 1045-1145 1210-1310
NET POWER OUTPUT (KW)1 276 272 267
ALLOWABLE
NITROGEN OXIDES (as NO2)
PPMV (dry) 1.31 1.35 1.28 -----
POUNDS/Hr 0.021 0.022 0.020 -----
POUNDS/MW-Hr2 0.077 0.079 0.076 0.4
CARBON MONOXIDE (as CO)
PPMV (dry) <0.1 <0.1 <0.1 -----
POUNDS/Hr <0.001 <0.001 <0.001 -----
POUNDS/MW-Hr2 <0.004 <0.004 <0.004 0.25
12
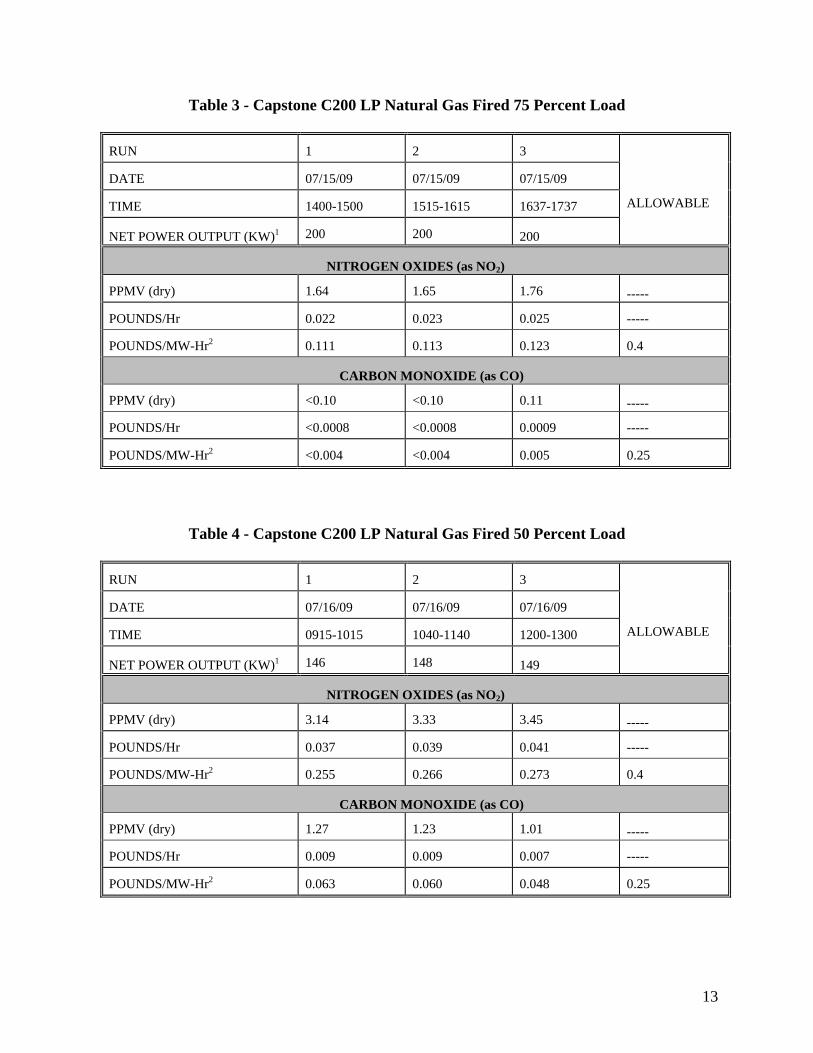
Table 3 - Capstone C200 LP Natural Gas Fired 75 Percent Load
RUN 1 2 3
DATE 07/15/09 07/15/09 07/15/09
TIME 1400-1500 1515-1615 1637-1737
NET POWER OUTPUT (KW)1 200 200 200
ALLOWABLE
NITROGEN OXIDES (as NO2)
PPMV (dry) 1.64 1.65 1.76 -----
POUNDS/Hr 0.022 0.023 0.025 -----
POUNDS/MW-Hr2 0.111 0.113 0.123 0.4
CARBON MONOXIDE (as CO)
PPMV (dry) <0.10 <0.10 0.11 -----
POUNDS/Hr <0.0008 <0.0008 0.0009 -----
POUNDS/MW-Hr2 <0.004 <0.004 0.005 0.25
Table 4 - Capstone C200 LP Natural Gas Fired 50 Percent Load
RUN 1 2 3
DATE 07/16/09 07/16/09 07/16/09
TIME 0915-1015 1040-1140 1200-1300
NET POWER OUTPUT (KW)1 146 148 149
ALLOWABLE
NITROGEN OXIDES (as NO2)
PPMV (dry) 3.14 3.33 3.45 -----
POUNDS/Hr 0.037 0.039 0.041 -----
POUNDS/MW-Hr2 0.255 0.266 0.273 0.4
CARBON MONOXIDE (as CO)
PPMV (dry) 1.27 1.23 1.01 -----
POUNDS/Hr 0.009 0.009 0.007 -----
POUNDS/MW-Hr2 0.063 0.060 0.048 0.25
13
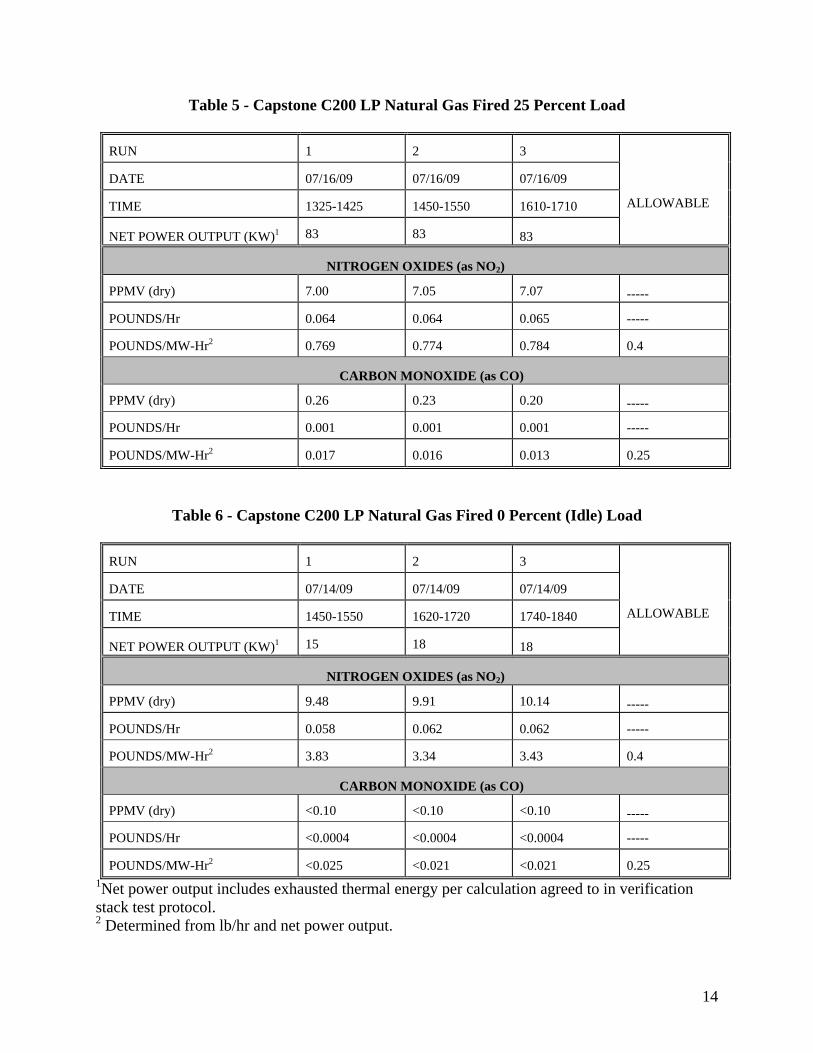
Table 5 - Capstone C200 LP Natural Gas Fired 25 Percent Load
RUN 1 2 3
DATE 07/16/09 07/16/09 07/16/09
TIME 1325-1425 1450-1550 1610-1710
NET POWER OUTPUT (KW)1 83 83 83
ALLOWABLE
NITROGEN OXIDES (as NO2)
PPMV (dry) 7.00 7.05 7.07 -----
POUNDS/Hr 0.064 0.064 0.065 -----
POUNDS/MW-Hr2 0.769 0.774 0.784 0.4
CARBON MONOXIDE (as CO)
PPMV (dry) 0.26 0.23 0.20 -----
POUNDS/Hr 0.001 0.001 0.001 -----
POUNDS/MW-Hr2 0.017 0.016 0.013 0.25
Table 6 - Capstone C200 LP Natural Gas Fired 0 Percent (Idle) Load
RUN 1 2 3
DATE 07/14/09 07/14/09 07/14/09
TIME 1450-1550 1620-1720 1740-1840
NET POWER OUTPUT (KW)1 15 18 18
ALLOWABLE
NITROGEN OXIDES (as NO2)
PPMV (dry) 9.48 9.91 10.14 -----
POUNDS/Hr 0.058 0.062 0.062 -----
POUNDS/MW-Hr2 3.83 3.34 3.43 0.4
CARBON MONOXIDE (as CO)
PPMV (dry) <0.10 <0.10 <0.10 -----
POUNDS/Hr <0.0004 <0.0004 <0.0004 -----
POUNDS/MW-Hr2 <0.025 <0.021 <0.021 0.25 1Net power output includes exhausted thermal energy per calculation agreed to in verification stack test protocol. 2 Determined from lb/hr and net power output.
14
0
0.5
1
1.5
2
2.5
3
3.5
4
0 10 20 30 40 50 60 70 80 90 1
LB/MW-HR
PERCENT OF BASE LOAD
NOX POUNDS PER MEGAWATT HOUR
EMISSION LIMIT 0.4 Lb/MW-Hr
00
Figure 2 Capstone C200 NOx Emissions vs. Operational Load Clearly, the C200 LP natural gas fired microturbine NOx emissions are below the emission limit of 0.4 Lb/KW-Hr at operational loads above 40%.
0
0.1
0.2
0.3
0.4
0.5
0.6
0.7
0.8
0.9
1
0 10 20 30 40 50 60 70 80 90 100
LB/M
W-H
r
PERCENT OF BASE LOAD
CO POUNDS PER MEGAWATT HOUR
Series1
Series2
EMISSION LIMIT 0.25 Lb/MW-Hr
Figure 3 Capstone C200 CO Emissions vs. Operational Load
15
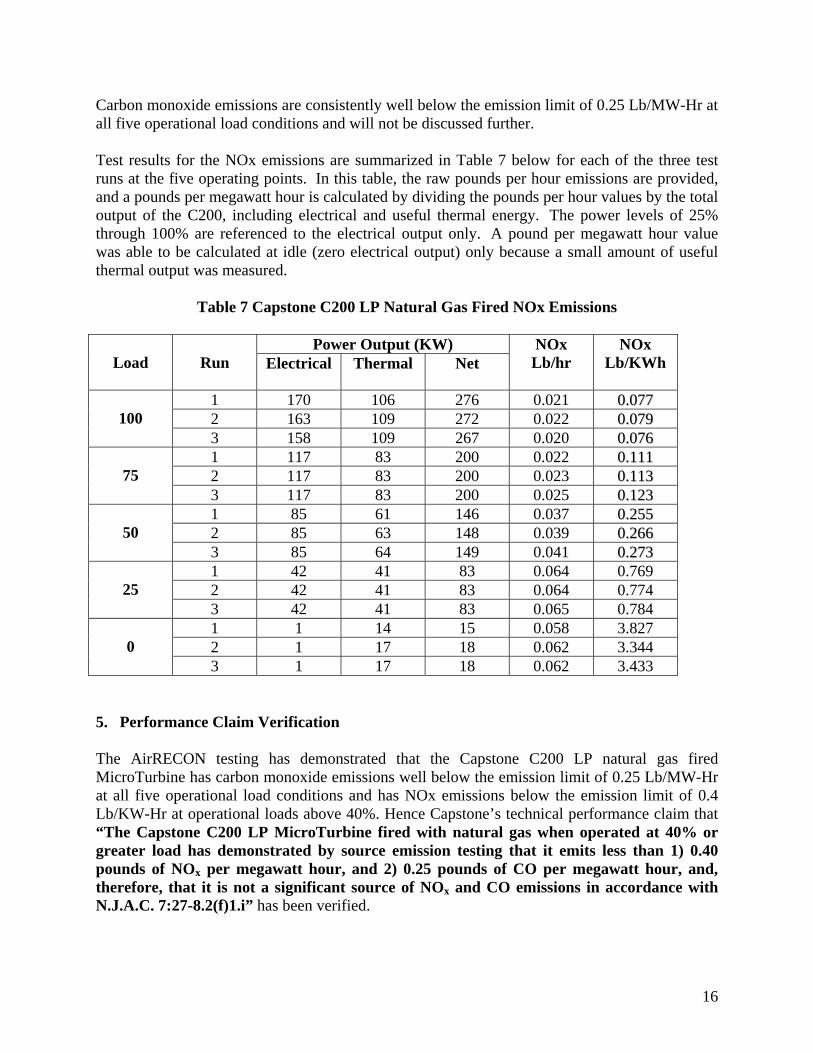
Carbon monoxide emissions are consistently well below the emission limit of 0.25 Lb/MW-Hr at all five operational load conditions and will not be discussed further. Test results for the NOx emissions are summarized in Table 7 below for each of the three test runs at the five operating points. In this table, the raw pounds per hour emissions are provided, and a pounds per megawatt hour is calculated by dividing the pounds per hour values by the total output of the C200, including electrical and useful thermal energy. The power levels of 25% through 100% are referenced to the electrical output only. A pound per megawatt hour value was able to be calculated at idle (zero electrical output) only because a small amount of useful thermal output was measured.
Table 7 Capstone C200 LP Natural Gas Fired NOx Emissions
Power Output (KW) Load
Run Electrical Thermal Net
NOx Lb/hr
NOx Lb/KWh
1 170 106 276 0.021 00..007777 2 163 109 272 0.022 00..007799
100
3 158 109 267 0.020 00..007766 1 117 83 200 0.022 00..111111 2 117 83 200 0.023 00..111133
75
3 117 83 200 0.025 00..112233 1 85 61 146 0.037 00..225555 2 85 63 148 0.039 00..226666
50 3 85 64 149 0.041 00..227733
1 42 41 83 0.064 0.769 2 42 41 83 0.064 0.774
25
3 42 41 83 0.065 0.784 1 1 14 15 0.058 3.827 2 1 17 18 0.062 3.344
0
3 1 17 18 0.062 3.433 5. Performance Claim Verification The AirRECON testing has demonstrated that the Capstone C200 LP natural gas fired MicroTurbine has carbon monoxide emissions well below the emission limit of 0.25 Lb/MW-Hr at all five operational load conditions and has NOx emissions below the emission limit of 0.4 Lb/KW-Hr at operational loads above 40%. Hence Capstone’s technical performance claim that “The Capstone C200 LP MicroTurbine fired with natural gas when operated at 40% or greater load has demonstrated by source emission testing that it emits less than 1) 0.40 pounds of NOx per megawatt hour, and 2) 0.25 pounds of CO per megawatt hour, and, therefore, that it is not a significant source of NOx and CO emissions in accordance with N.J.A.C. 7:27-8.2(f)1.i” has been verified.
16
6. Net Environmental Benefit Microturbine generation equipment can provide a source of clean and reliable electricity and heat. Since buildings in the United States contribute 40% of the greenhouse gas annually emitted, they are the single largest target for possible reduction. By generating both electricity and heat at the point of use in a building, an increase in end use fuel efficiency (generally 30-40%) is achieved. The Capstone C200 LP natural gas fired can provide electricity and heat efficiently with insignificant emissions. 7. References Capstone C200 MicroTurbine Technical Reference Manual, 410066 Rev A, Capstone Turbine Corporation, Chatsworth, CA (September 2008) Environmental Technology Verification Report, Capstone C200 LP 200 KW MicroTurbine, prepared by AirRECON, a division of LFR, Inc., Branchburg, NJ (October 8, 2009) NJCAT/NJDEP Certification Stack Test Protocol for Capstone C200 KW Natural gas Fired MicroTurbine, prepared by AirRECON, a division of LFR, Inc., Branchburg, NJ (November 11, 2008 with March 23, 2009 amendments)
17

APPENDIX A
Stack Conditions
18

100% Load
RUN 1 2 3
DATE 7/15/2009 7/15/2009 7/15/2009
TIME 0905-1005 1045-1145 1210-1310
STACK INSIDE DIAMETER (in) 12.0 12.0 12.0
STACK CROSS SECTION (sq ft) 0.79 0.79 0.79
BAROMETRIC PRESSURE 29.15 29.16 29.15
AVG. STACK TEMP (oF) 556 561 562STACK PRESSURE ("H2O-gage) -0.90 -1.00 -0.90
MOISTURE (% vol) 4.5 5.0 4.6
O2 (% vol) 17.9 18.0 18.0
CO2 (%vol) 1.8 1.8 1.8
N2 (% vol by difference) 80.3 80.2 80.2
AVG. ACTUAL VELOCITY (ft/sec) 99.1 99.0 97.8
ACTUAL FLOW RATE (acfm) 4,670 4,660 4,610
STD FLOW RATE (scfm) 2,370 2,350 2,320DRY STD FLOW RATE (dscfm) 2,260 2,240 2,220
Standard Conditions are 70 °F, 29.92" Hg
19
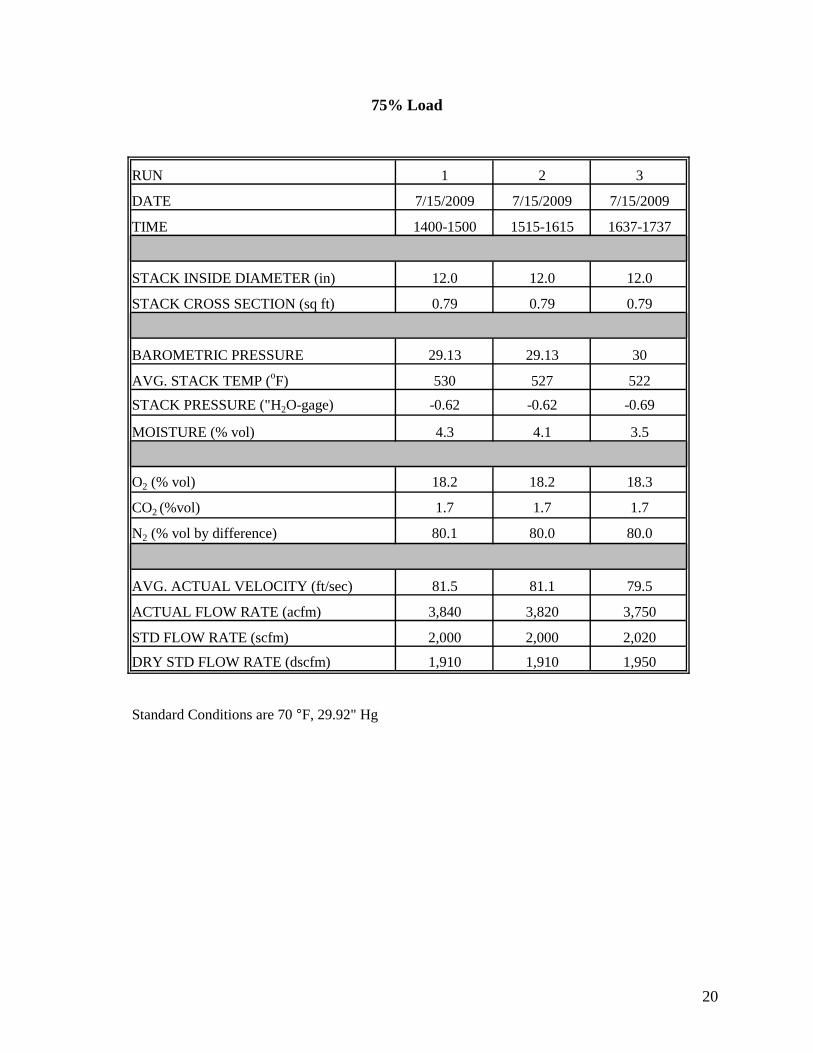
75% Load
RUN 1 2 3
DATE 7/15/2009 7/15/2009 7/15/2009
TIME 1400-1500 1515-1615 1637-1737
STACK INSIDE DIAMETER (in) 12.0 12.0 12.0
STACK CROSS SECTION (sq ft) 0.79 0.79 0.79
BAROMETRIC PRESSURE 29.13 29.13 30
AVG. STACK TEMP (oF) 530 527 522STACK PRESSURE ("H2O-gage) -0.62 -0.62 -0.69
MOISTURE (% vol) 4.3 4.1 3.5
O2 (% vol) 18.2 18.2 18.3
CO2 (%vol) 1.7 1.7 1.7
N2 (% vol by difference) 80.1 80.0 80.0
AVG. ACTUAL VELOCITY (ft/sec) 81.5 81.1 79.5
ACTUAL FLOW RATE (acfm) 3,840 3,820 3,750
STD FLOW RATE (scfm) 2,000 2,000 2,020
DRY STD FLOW RATE (dscfm) 1,910 1,910 1,950
Standard Conditions are 70 °F, 29.92" Hg
20
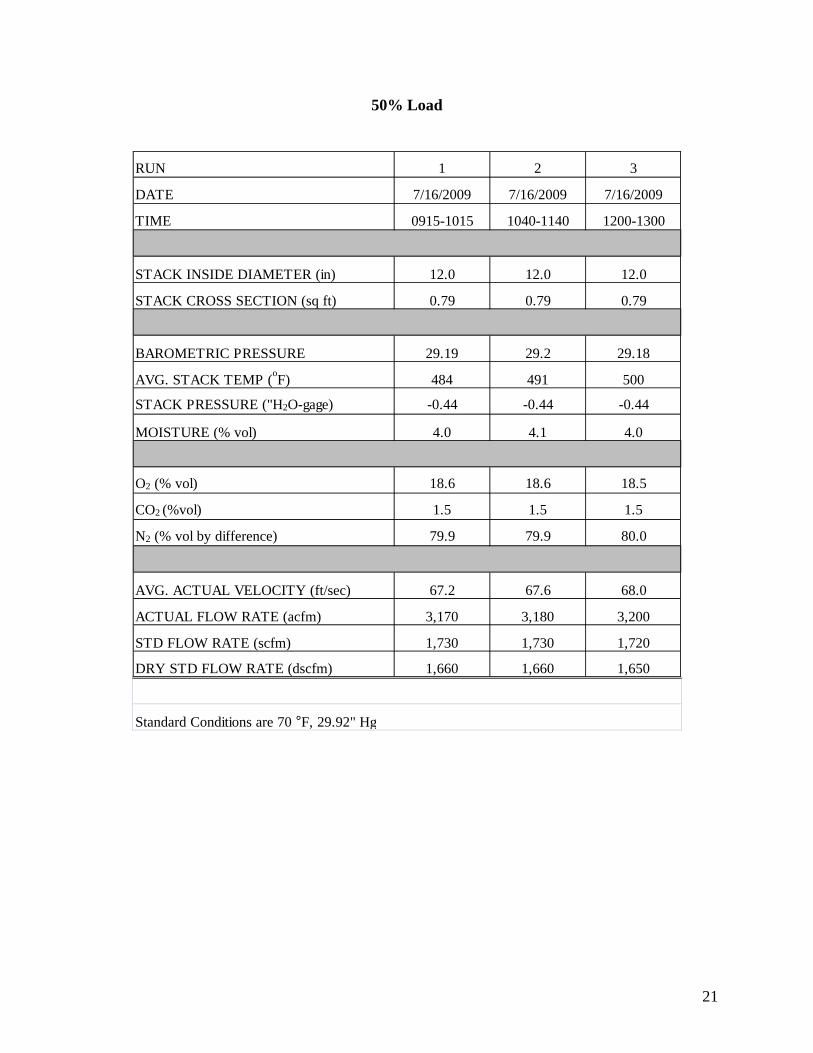
50% Load
1 2 3
7/16/2009 7/16/2009 7/16/2009
0915-1015 1040-1140 1200-1300
STACK INSIDE DIAMETER (in) 12.0 12.0 12.0
STACK CROSS SECTION (sq ft) 0.79 0.79 0.79
BAROMETRIC PRESSURE 29.19 29.2 29.18
AVG. STACK TEMP (oF) 484 491 500
STACK PRESSURE ("H2O-gage) -0.44 -0.44 -0.44
MOISTURE (% vol) 4.0 4.1 4.0
18.6 18.6 18.5
1.5 1.5 1.5
N2 (% vol by difference) 79.9 79.9 80.0
AVG. ACTUAL VELOCITY (ft/sec) 67.2 67.6 68.0
ACTUAL FLOW RATE (acfm) 3,170 3,180 3,200
STD FLOW RATE (scfm) 1,730 1,730 1,720
DRY STD FLOW RATE (dscfm) 1,660 1,660 1,650
Standard Conditions are 70 °F, 29.92" Hg
RUN
DATE
TIME
O2 (% vol)
CO2 (%vol)
21

25% Load
RUN 1 2 3
DATE 7/16/2009 7/16/2009 7/16/2009
TIME 1325-1425 1450-1550 1610-1710
STACK INSIDE DIAMETER (in) 12.0 12.0 12.0
STACK CROSS SECTION (sq ft) 0.79 0.79 0.79
BAROMETRIC PRESSURE 29.17 29.15 29.13
AVG. STACK TEMP (oF) 449 448 448STACK PRESSURE ("H2O-gage) -0.45 -0.45 -0.45
MOISTURE (% vol) 3.6 3.6 3.2
O2 (% vol) 19.0 18.9 18.9
CO2 (%vol) 1.4 1.4 1.4
N2 (% vol by difference) 79.6 79.7 79.7
AVG. ACTUAL VELOCITY (ft/sec) 49.6 49.5 49.9
ACTUAL FLOW RATE (acfm) 2,340 2,330 2,350
STD FLOW RATE (scfm) 1,330 1,320 1,330
DRY STD FLOW RATE (dscfm) 1,280 1,280 1,290
Standard Conditions are 70 °F, 29.92" Hg
22
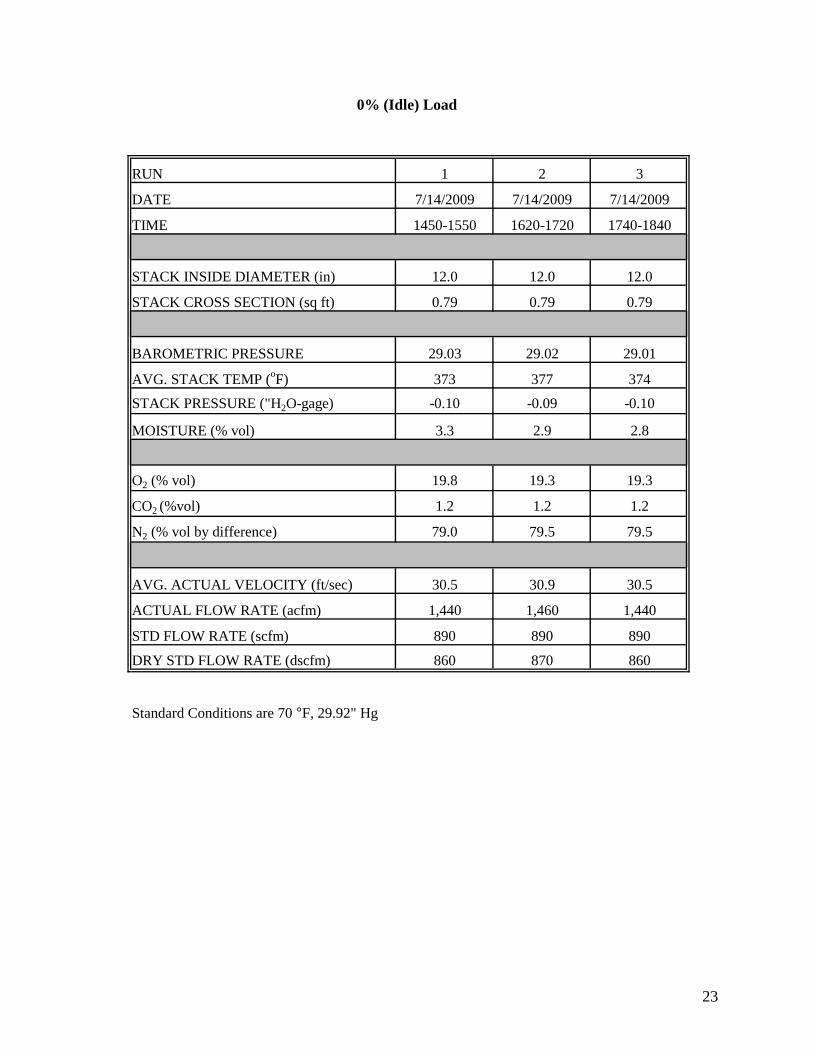
0% (Idle) Load
RUN 1 2 3
DATE 7/14/2009 7/14/2009 7/14/2009
TIME 1450-1550 1620-1720 1740-1840
STACK INSIDE DIAMETER (in) 12.0 12.0 12.0
STACK CROSS SECTION (sq ft) 0.79 0.79 0.79
BAROMETRIC PRESSURE 29.03 29.02 29.01
AVG. STACK TEMP (oF) 373 377 374STACK PRESSURE ("H2O-gage) -0.10 -0.09 -0.10
MOISTURE (% vol) 3.3 2.9 2.8
O2 (% vol) 19.8 19.3 19.3
CO2 (%vol) 1.2 1.2 1.2
N2 (% vol by difference) 79.0 79.5 79.5
AVG. ACTUAL VELOCITY (ft/sec) 30.5 30.9 30.5
ACTUAL FLOW RATE (acfm) 1,440 1,460 1,440
STD FLOW RATE (scfm) 890 890 890
DRY STD FLOW RATE (dscfm) 860 870 860
Standard Conditions are 70 °F, 29.92" Hg
23