Embed Size (px)
Citation preview
1
NJCAT TECHNOLOGY VERIFICATION
AQUA-FILTER™ MODEL AF-5.3 STORMWATER FILTRATION SYSTEM
AquaShieldTM, Inc.
November 2013

2
TABLE OF CONTENTS
1. Introduction 5 1.1 NJCAT Program 5 1.2 Interim Certification 6 1.3 Applicant Profile 6 1.4 Key Contacts 7
2. The Aqua-Filter™ Stormwater Filtration System 7
3. Technology System Evaluation: Project Plan 9
3.1 Introduction 9 3.2 Site and System Description 10 3.3 Sampling Design 10 3.4 Test Equipment and Apparatus 14 3.5 Test Methods and Procedures 14 3.6 Precipitation Measurements 15 3.7 Flow Measurements 17 3.8 Hydrographs 17 3.9 Stormwater Data Collection 18 3.10 Treatment System Maintenance 20
4. Technology System Performance 20
4.1 Test Results 20 4.2 Data Quality Assessment 25 4.3 Statistical Analysis 26 4.4 Performance Summary 27
5. Performance Verification 27
6. Net Environmental Benefit 28
7. References 28
Appendix A: Aqua-Filter™ Model AF-5.3 Specifications 30 Appendix B: Individual Storm Events 32
3
List of Tables
Table 1 Summary of Analytical Methods 15 Table 2 Summary of Storm Sampling Events 15 Table 3 Comparison of On-Site Rainfall to Off-Site Weather Station 16 Table 4 Aqua-Filter™ AF-5.3 Flow Volumes Comparison 17 Table 5 Aqua-Filter™ AF-5.3 Percentage of Storm Volumes Sampled 18 Table 6 Summary of Storm Characteristics 19 Table 7 Suspended Solids Event Sum of Loads Removal Efficiencies 20 Table 8 Summary of TSS and SSC Removal Efficiencies 21 Table 9 Influent PSD Summary 22 Table 10 Captured Sediment PSD in Swirl Chamber 25 Table 11 Storm Characteristics versus Performance 27
4
List of Figures
Figure 1 Aqua-Filter™ Mode of Operation 8
Figure 2 Aqua-Filter™ Filtration Chamber Operation 9 Figure 3 Aerial Site Plan of the Burnt Mills Shopping Center 11 Figure 4 Site Plan of the Burnt Mills Shopping Center 12 Figure 5 Sampling Locations for the Aqua-Filter™ 13
Figure 6 PSD Comparison of Field and NJDEP Laboratory Standard 23 Figure 7 Sediment Accumulation Profile in AS-5 Swirl Chamber 24 Figure 8 Swirl Chamber PSD Graph - Influent (side), Center, Effluent (side) 25

5
1. Introduction
1.1 New Jersey Corporation for Advance Technology (NJCAT) Program NJCAT is a not-for-profit corporation to promote in New Jersey the retention and growth of technology-based businesses in emerging fields such as environmental and energy technologies. NJCAT provides innovators with the regulatory, commercial, technological and financial assistance required to bring their ideas to market successfully. Specifically, NJCAT functions to:
• Advance policy strategies and regulatory mechanisms to promote technology commercialization;
• Identify, evaluate, and recommend specific technologies for which the regulatory and commercialization process should be facilitated;
• Facilitate funding and commercial relationships/alliances to bring new technologies to market and new business to the state; and
• Assist in the identification of markets and applications for commercialized technologies.
The technology verification program specifically encourages collaboration between vendors and users of technology. Through this program, teams of academic and business professionals are formed to implement a comprehensive evaluation of vendor specific performance claims. Thus, suppliers have the competitive edge of an independent third party confirmation of claims. Pursuant to N.J.S.A. 13:1D-134 et seq. (Energy and Environmental Technology Verification Program) the New Jersey Department of Environmental Protection (NJDEP) and NJCAT have established a Performance Partnership Agreement (PPA) whereby NJCAT performs the technology verification review and NJDEP certifies that the technology meets the regulatory intent and that there is a net beneficial environmental effect of the technology. In addition, NJDEP/NJCAT work in conjunction to develop expedited or more efficient timeframes for review and decision-making of permits or approvals associated with the verified/certified technology. The PPA also requires that: • The NJDEP shall enter into reciprocal environmental technology agreements concerning the
evaluation and verification protocols with the United States Environmental Protection Agency, other local required or national environmental agencies, entities or groups in other states and New Jersey for the purpose of encouraging and permitting the reciprocal acceptance of technology data and information concerning the evaluation and verification of energy and environmental technologies; and
• The NJDEP shall work closely with the State Treasurer to include in State bid specifications,
as deemed appropriate by the State Treasurer, any technology verified under the Energy and Environment Technology Verification Program.
6
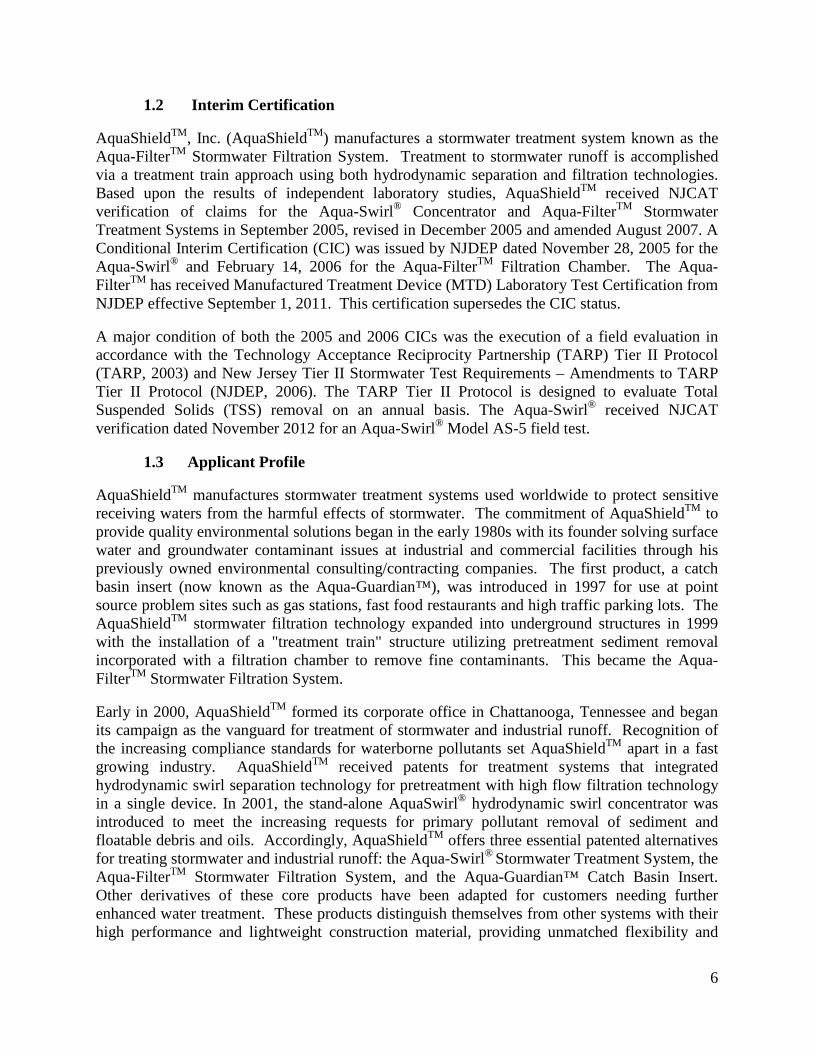
1.2 Interim Certification
AquaShieldTM, Inc. (AquaShieldTM) manufactures a stormwater treatment system known as the Aqua-FilterTM Stormwater Filtration System. Treatment to stormwater runoff is accomplished via a treatment train approach using both hydrodynamic separation and filtration technologies. Based upon the results of independent laboratory studies, AquaShieldTM received NJCAT verification of claims for the Aqua-Swirl® Concentrator and Aqua-FilterTM Stormwater Treatment Systems in September 2005, revised in December 2005 and amended August 2007. A Conditional Interim Certification (CIC) was issued by NJDEP dated November 28, 2005 for the Aqua-Swirl® and February 14, 2006 for the Aqua-FilterTM Filtration Chamber. The Aqua-FilterTM has received Manufactured Treatment Device (MTD) Laboratory Test Certification from NJDEP effective September 1, 2011. This certification supersedes the CIC status.
A major condition of both the 2005 and 2006 CICs was the execution of a field evaluation in accordance with the Technology Acceptance Reciprocity Partnership (TARP) Tier II Protocol (TARP, 2003) and New Jersey Tier II Stormwater Test Requirements – Amendments to TARP Tier II Protocol (NJDEP, 2006). The TARP Tier II Protocol is designed to evaluate Total Suspended Solids (TSS) removal on an annual basis. The Aqua-Swirl® received NJCAT verification dated November 2012 for an Aqua-Swirl® Model AS-5 field test.
1.3 Applicant Profile
AquaShieldTM manufactures stormwater treatment systems used worldwide to protect sensitive receiving waters from the harmful effects of stormwater. The commitment of AquaShieldTM to provide quality environmental solutions began in the early 1980s with its founder solving surface water and groundwater contaminant issues at industrial and commercial facilities through his previously owned environmental consulting/contracting companies. The first product, a catch basin insert (now known as the Aqua-Guardian™), was introduced in 1997 for use at point source problem sites such as gas stations, fast food restaurants and high traffic parking lots. The AquaShieldTM stormwater filtration technology expanded into underground structures in 1999 with the installation of a "treatment train" structure utilizing pretreatment sediment removal incorporated with a filtration chamber to remove fine contaminants. This became the Aqua-FilterTM Stormwater Filtration System.
Early in 2000, AquaShieldTM formed its corporate office in Chattanooga, Tennessee and began its campaign as the vanguard for treatment of stormwater and industrial runoff. Recognition of the increasing compliance standards for waterborne pollutants set AquaShieldTM apart in a fast growing industry. AquaShieldTM received patents for treatment systems that integrated hydrodynamic swirl separation technology for pretreatment with high flow filtration technology in a single device. In 2001, the stand-alone AquaSwirl® hydrodynamic swirl concentrator was introduced to meet the increasing requests for primary pollutant removal of sediment and floatable debris and oils. Accordingly, AquaShieldTM offers three essential patented alternatives for treating stormwater and industrial runoff: the Aqua-Swirl® Stormwater Treatment System, the Aqua-FilterTM Stormwater Filtration System, and the Aqua-Guardian™ Catch Basin Insert. Other derivatives of these core products have been adapted for customers needing further enhanced water treatment. These products distinguish themselves from other systems with their high performance and lightweight construction material, providing unmatched flexibility and

7
adaptation to site-specific conditions. Each product arrives at the project job site completely assembled and ready for installation.
1.4 Key Contacts Dr. Richard S. Magee, P.E., BCEE Technical Director NJ Corporation for Advanced Technology Center for Environmental Systems Stevens Institute of Technology Castle Point on Hudson Hoboken, NJ 07030 201-216-8081 973-879-3056 mobile [email protected]
Mr. J. Kelly Williamson President AquaShieldTM, Inc. 2719 Kanasita Drive Chattanooga, Tennessee 37343 423-870-8888 [email protected]
Mr. Mark B. Miller, P.G. Research Scientist AquaShieldTM, Inc. 2719 Kanasita Drive Chattanooga, Tennessee 37343 423-870-8888 [email protected]
Mr. David J. Russell, P.E., BCEE, LSRP Senior Program Director AECOM 4 Neshaminy Interplex, Suite 300 Trevose, Pennsylvania 19053 267-784-7708 [email protected]
2. The Aqua-Filter™ Stormwater Filtration System The Aqua-Filter™ is designed for sites that require advanced treatment of runoff stormwater that may discharge into sensitive receiving waters. The Aqua-Filter™ uses a hydrodynamic separator and filtration for removal of sediment, debris and free-floating oil (Figure 1). Initial pretreatment of stormwater is not necessary when using the Aqua-Filter™. In fact, each Aqua-Filter™ system is custom engineered to utilize a unique treatment train sequence where both the coarse and fine pollutants are removed. The Aqua-Swirl® concentrator is designed to target the removal of Total Suspended Solids (TSS), debris and free-floating oil. The addition of the swirl concentrator allows for larger debris to settle before filtration and increases filtration effectiveness. The decreasing flow rate in the swirl concentrator causes suspended material to fall out of suspension and settle to the bottom of the chamber. An inner arched baffle minimizes the potential for oil and debris to be discharged. The filtration chamber is designed to refine and enhance the stormwater quality prior to discharge into sensitive receiving waters. As the pre-treated water enters the filtration chamber, it is evenly distributed across the filter bed and allowed to permeate through the filter media. The filter media are contained in individual containers, which are layered in a pattern to avoid short-circuiting. The peak filtration flow rate is based on the calculated water quality treatment requirements desired for the site.
8
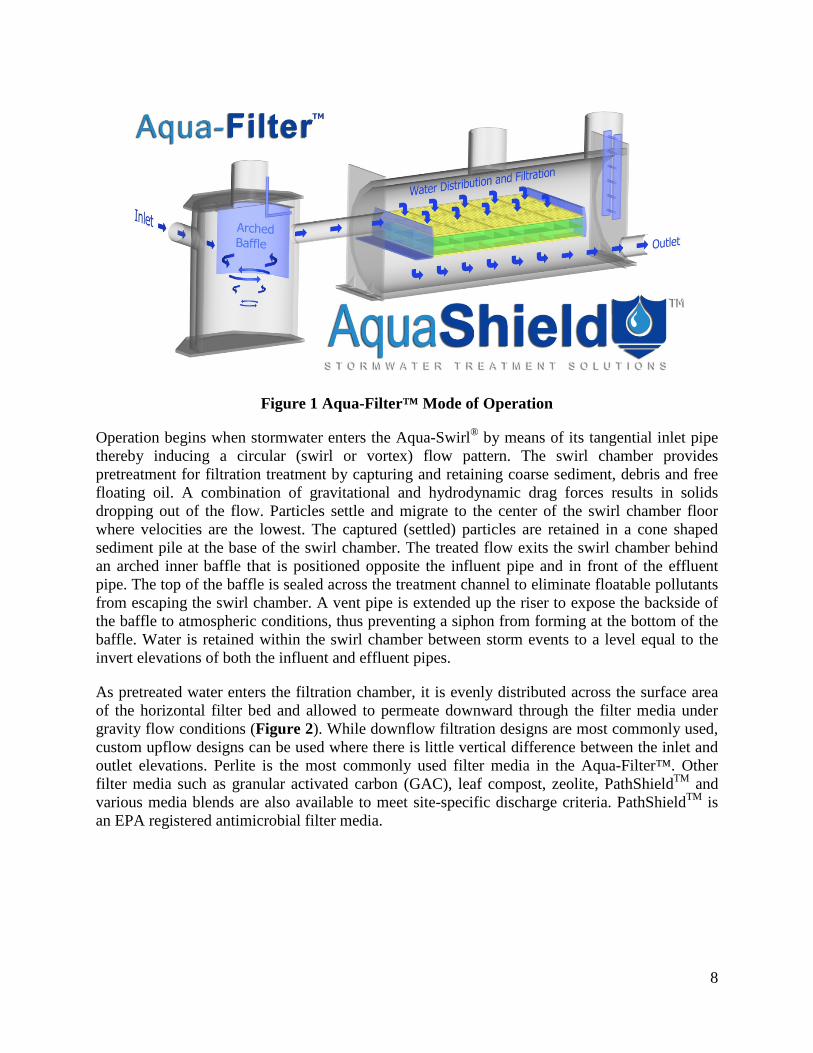
Figure 1 Aqua-Filter™ Mode of Operation
Operation begins when stormwater enters the Aqua-Swirl® by means of its tangential inlet pipe thereby inducing a circular (swirl or vortex) flow pattern. The swirl chamber provides pretreatment for filtration treatment by capturing and retaining coarse sediment, debris and free floating oil. A combination of gravitational and hydrodynamic drag forces results in solids dropping out of the flow. Particles settle and migrate to the center of the swirl chamber floor where velocities are the lowest. The captured (settled) particles are retained in a cone shaped sediment pile at the base of the swirl chamber. The treated flow exits the swirl chamber behind an arched inner baffle that is positioned opposite the influent pipe and in front of the effluent pipe. The top of the baffle is sealed across the treatment channel to eliminate floatable pollutants from escaping the swirl chamber. A vent pipe is extended up the riser to expose the backside of the baffle to atmospheric conditions, thus preventing a siphon from forming at the bottom of the baffle. Water is retained within the swirl chamber between storm events to a level equal to the invert elevations of both the influent and effluent pipes.
As pretreated water enters the filtration chamber, it is evenly distributed across the surface area of the horizontal filter bed and allowed to permeate downward through the filter media under gravity flow conditions (Figure 2). While downflow filtration designs are most commonly used, custom upflow designs can be used where there is little vertical difference between the inlet and outlet elevations. Perlite is the most commonly used filter media in the Aqua-Filter™. Other filter media such as granular activated carbon (GAC), leaf compost, zeolite, PathShieldTM and various media blends are also available to meet site-specific discharge criteria. PathShieldTM is an EPA registered antimicrobial filter media.

9
Figure 2 Aqua-FilterTM Filtration Chamber Operation
Essential elements of an Aqua-Filter™ maintenance event include the replacement and disposal of the filter media containers, as well as vacuuming of floatables, oil and sediment from the swirl and filtration chambers. Two scenarios for Aqua-Filter™ maintenance events are likely. The first and most common scenario provides for cleaning both components of the system by utilizing a vacuum truck and replacing the filter media containers. The second maintenance event scenario provides only for the cleaning of the swirl chamber and filtration chamber by use of a vacuum truck; but, no replacement of the filter media containers. The filter media containers are the only components of the system that require replacement. The replacement of perlite filter containers is generally needed if the filter media is observed to exhibit a dark brown or black color, and if a noticeable excessive accumulation of sediment, oil or other materials occurs across the filter bed. Specifications for the field tested Aqua-Filter Model AF-5.3 are included in Appendix A. 3. Technology System Evaluation: Project Plan
3.1 Introduction The TARP field test of the Aqua-Filter™ Model AF-5.3 (5-ft. swirl diameter chamber; 45 ft3 swirl chamber sediment storage capacity; 3 rows of filter containers) that is the subject of this report (AECOM 2013) was conducted by AECOM, 4 Neshaminy Interplex, Suite 300, Trevose, Pennsylvania 19053. The purpose of the Aqua-FilterTM AF-5.3 field testing program was to fulfill the initial Conditional Interim Certification (dated February 14, 2006) requirement for field testing. Field sampling activities began during 2007 to characterize several potential test sites for the purpose of identifying a site that would comply with the New Jersey TARP Tier II field testing requirements. After several years of site evaluations and preliminary testing an appropriate test site was located. A Quality Assurance Project Plan (QAPP) for the Aqua-FilterTM Field Evaluation was prepared in March 2012 and later revised in August 2012; monitoring activities commenced in March 2011 prior to finalization of the QAPP. The objective of the field testing was to demonstrate that the Aqua-Filter™ Model AF-5.3 at a filter loading rate of 16.5 gpm/ft2 would provide a TSS removal rate of >80% validating the laboratory test results in the NJCAT technology verification addendum report titled “Aqua-Swirl™ Concentrator and Aqua-Filter™ Stormwater Filtration System”.

10
3.2 Site and System Description
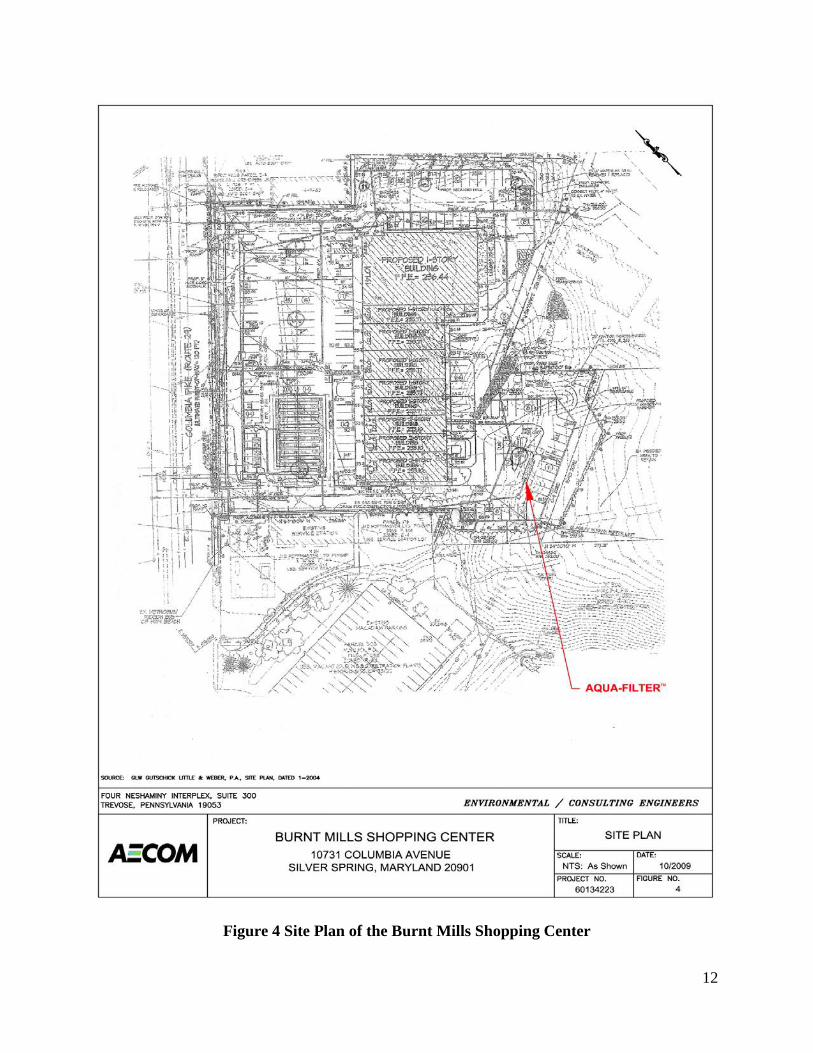
Field verification testing was conducted at the Burnt Mills Shopping Center in Silver Spring, Maryland. The test site drainage area is an asphalt covered parking lot with landscaped areas and roof runoff at an urban retail shopping center. The total drainage area is estimated at 1.19 acres. An offline Aqua-FilterTM AF-5.3 treatment unit was installed to provide sediment removal from parking lot stormwater runoff. An aerial site plan of the Burnt Mills Shopping Center is presented as Figure 3. A site plan of the Burnt Mills Shopping Center including the location of the Aqua-FilterTM is presented as Figure 4. Parking lot stormwater runoff is collected in catch basins and conveyed to the Aqua-FilterTM via underground piping. Specific requirements for field verification testing under the TARP Tier II protocol includes the definition of a qualified storm event, representative sample collection, the number of storm events required to be tested and specific conditions regarding the influent characteristics of the stormwater to be treated. Qualified storm event sampling is defined as:
• a storm event with at least 0.1 inch of rainfall; • a minimum inter-event period of six hours, where cessation of flow from the system
begins the inter-event period; • flow-weighted composite samples covering a minimum of 60% of the total storm flow,
including as much of the first 20% of the storm as possible; and • a minimum of six water quality samples per storm event.
3.3 Sampling Design
Sampling activities involved the collection of stormwater influent and effluent samples during qualified storm events. Sampling procedures were developed according to guidance given in TARP and in the "Field Sampling Procedures Manual", NJDEP, August 2005 (updated April 2011). The influent and effluent samples were collected from locations that were as close in proximity to the Aqua-FilterTM as possible to minimize potential sources of contamination that would impact the Best Management Practice (BMP) efficiency data. Influent samples were collected immediately upstream of the Aqua-FilterTM. Piping from the divergence structure conveys stormwater to the Aqua-FilterTM. Effluent samples were collected from a manhole located immediately downstream from the Aqua-FilterTM. Figure 5 presents the sampling locations for the Aqua-FilterTM.

11
Figure 3 Aerial Site Plan of the Burnt Mills Shopping Center
12
Figure 4 Site Plan of the Burnt Mills Shopping Center

13
Figure 5 Sampling Locations for the Aqua-Filter™

14
3.4 Test Equipment and Apparatus The ISCO Portable Sampler Model 6712 was used as the programmable automatic sampler for field verification testing. This sampler can be programmed to collect specific sample volumes over specified time periods and can be used in conjunction with an area velocity meter to allow flow proportional composite sampling. An ISCO 750 Area Velocity Meter was used to record flow during a storm event. The ISCO 750 uses Doppler technology to measure average velocity in the flow stream. A pressure transducer measures liquid depth to determine flow area. The ISCO 6712, when interfaced with the ISCO 750, calculates flow rate (cubic feet per second) by multiplying the area (square feet) of the flow stream by its average velocity (feet per second). A liquid level actuator was used to activate the ISCO 750 Area Velocity Meter and ISCO sampler once flow was present ensuring that the first flush of each storm event was sampled. Initially, the TARP requirement that a minimum of six samples be collected from each storm was interpreted as a minimum of six individual composite samples of the influent and effluent were required to be submitted for laboratory analysis. The six individual sample analytical results were then averaged to establish the overall influent and effluent composite analytical result. For these initial events a total of 24 1-liter aliquots were collected during each sampling event providing the volume required in order to prepare six individual composite samples for laboratory analysis. The collection of six individual samples from 24 aliquots provided additional data concerning the fluctuation of influent loading and removal efficiency over the storm period and well exceeded the TARP guidelines of a minimum of six and a goal of 10 sample aliquots collected during each storm. Following consultation with NJCAT in March 2012, the sampling procedure for subsequent sampling events was modified to result in one overall influent and effluent flow proportional composite sample being submitted to the laboratory for analysis. A minimum of six influent and effluent 1-liter flow proportional samples were collected for each storm event with the goal of at least 10 1-liter flow proportional samples being collected and combined to form one influent and effluent composite sample for laboratory analysis for each storm event. Collected samples were transferred in the field through a cone sample splitter (Dekaport Cone Sample Splitter) fitted with a 4-inch 1,000 micron (μm) sieve to remove particles greater than 1,000 µm and into laboratory prepared sample bottles for each of the analytes. The sample bottles were placed on ice and transported immediately to the laboratory for analysis to ensure analytical methodology holding times were met.
3.5 Test Methods and Procedures Table 1 presents the analytical methods used for the field testing program. Suspended sediment concentrations were determined by both the Total Suspended Solids (TSS) and Suspended Sediment Concentration (SSC) methods. Total Volatile Suspended Solids (TVSS) analysis was also performed to assess the organic content of the suspended sediment. The TSS, SSC and TVSS results are reported as mg/L by the laboratory. Particle size distribution (PSD) was determined by serial filtration techniques using sieves sized at 1,000, 500, 250, 125, 63 µm and filter paper at 1.5 µm.

15
Table 1 Summary of Analytical Methods
Parameter Matrix Method Reference Total Suspended Solids
Suspended-Sediment Concentration Total Volatile Suspended Solids
Water (Influent, Effluent)
SM 2540D ASTM D3977
EPA Method 160.4
Particle Size Distribution Water (Influent, Effluent) Serial Filtration Method
All analyses of samples were performed by a NELAC and New Jersey certified laboratory, Test America, Inc. of Burlington, Vermont.
3.6 Precipitation Measurements An on-site rain gauge was used to measure the total precipitation for each sampling event. In addition, the nearest available documented weather station (Kemp Mill/Silver Spring), located approximately 1.5 miles from the Burnt Mills Shopping Center, was used to verify qualified storm events and the total precipitation for each sampling event. The weather station’s recorded precipitation data over time was also used to determine rainfall intensity during each sampling event. Table 2 presents a summary of the sampling precipitation events and sample coverage.
Table 2 Summary of Storm Sampling Events
Sampling Event Sample Date Storm
Duration (hr:min)
Storm Size (inches)
Sampling Duration (hr:min)
1 March 6, 2011 4:50 1.42 1:59 2 March 15-16, 2011 5:06 0.42 3:00 3 April 8, 2011 3:55 0.52 1:42 4 April 28, 2011 2:19 0.23 1:33 5 May 14, 2011 3:05 0.85 1:25 6 June 16, 2011 3:20 1.03 1:10 7 August 6, 2011 4:46 0.69 1:30 8 September 28, 2011 3:05 0.61 1:02 9 October 19, 2011 7:26 0.54 1:36
10 November 29, 2011 5:95 0.30 1:22 11 December 21, 2011 5:06 0.11 2:41 12 January 16, 2012 3:59 0.21 3:05 13 May 14-15, 2012 16:01 0.79 14:47 14 July 14, 2012 2:59 0.61 1:59 15 January 13-15, 2013 64:08 1.43 63:44 16 January 30-31, 2013 9:34 1.60 9:05 17 February 26-27, 2013 20:25 0.85 19:18 18 March 6, 2013 11:30 1.00 10:38 19 March 12, 2013 7:20 0.83 7:16 20 April 12, 2013 11:59 0.62 11:03 21 May 7-8, 2013 38:31 1.17 37:34
Average 0.75 Total 15.83
16
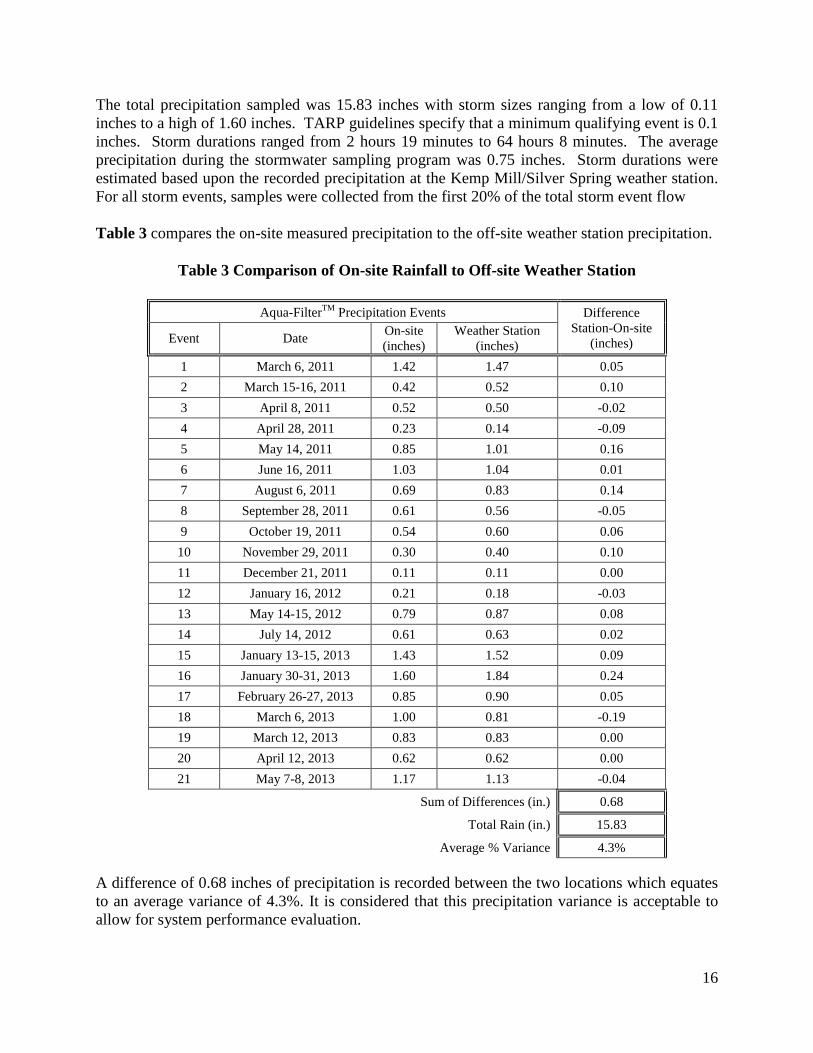
The total precipitation sampled was 15.83 inches with storm sizes ranging from a low of 0.11 inches to a high of 1.60 inches. TARP guidelines specify that a minimum qualifying event is 0.1 inches. Storm durations ranged from 2 hours 19 minutes to 64 hours 8 minutes. The average precipitation during the stormwater sampling program was 0.75 inches. Storm durations were estimated based upon the recorded precipitation at the Kemp Mill/Silver Spring weather station. For all storm events, samples were collected from the first 20% of the total storm event flow Table 3 compares the on-site measured precipitation to the off-site weather station precipitation.
Table 3 Comparison of On-site Rainfall to Off-site Weather Station
Aqua-FilterTM Precipitation Events Difference Station-On-site
(inches) Event Date On-site (inches)
Weather Station (inches)
1 March 6, 2011 1.42 1.47 0.05 2 March 15-16, 2011 0.42 0.52 0.10 3 April 8, 2011 0.52 0.50 -0.02 4 April 28, 2011 0.23 0.14 -0.09 5 May 14, 2011 0.85 1.01 0.16 6 June 16, 2011 1.03 1.04 0.01 7 August 6, 2011 0.69 0.83 0.14 8 September 28, 2011 0.61 0.56 -0.05 9 October 19, 2011 0.54 0.60 0.06 10 November 29, 2011 0.30 0.40 0.10 11 December 21, 2011 0.11 0.11 0.00 12 January 16, 2012 0.21 0.18 -0.03 13 May 14-15, 2012 0.79 0.87 0.08 14 July 14, 2012 0.61 0.63 0.02 15 January 13-15, 2013 1.43 1.52 0.09 16 January 30-31, 2013 1.60 1.84 0.24 17 February 26-27, 2013 0.85 0.90 0.05 18 March 6, 2013 1.00 0.81 -0.19 19 March 12, 2013 0.83 0.83 0.00 20 April 12, 2013 0.62 0.62 0.00 21 May 7-8, 2013 1.17 1.13 -0.04
Sum of Differences (in.) 0.68
Total Rain (in.) 15.83
Average % Variance 4.3% A difference of 0.68 inches of precipitation is recorded between the two locations which equates to an average variance of 4.3%. It is considered that this precipitation variance is acceptable to allow for system performance evaluation.

17
3.7 Flow Measurements Flows were recorded during each sampling event, downloaded and summarized to provide flow measurements for each sampling interval. These flow measurements were used to calculate hydraulic loading rates to the Aqua-Filter™ as well as to determine mass loading of suspended solids during each sampling event. Influent and effluent flow volumes were compared to determine if any adverse conditions or flow volume measurement errors existed within the Aqua-FilterTM system during the sampling period. Table 4 summarizes the flow volumes and the variances between influent and effluent flow volumes. An average variance of 9% between flow volumes was calculated for the 21 storms indicating that no overall adverse flow conditions occurred during sampling events.
Table 4 Aqua-FilterTM AF-5.3 Flow Volumes Comparison
Storm # Sample Date Influent (ft3)
Effluent (ft3)
Variance (%)
1 March 6, 2011 2,012 2,110 5 2 March 15-16, 2011 678 644 5 3 April 8, 2011 602 683 12 4 April 28, 2011 1,422 1,341 6 5 May 14, 2011 327 459 29 6 June 16, 2011 1,023 1,061 4 7 August 6, 2011 5,292 5626 6 8 September 28, 2011 1,807 2,151 16 9 October 19, 2011 2,466 2,272 8 10 November 29, 2011 609 690 12 11 December 21, 2011 593 764 22 12 January 16, 2012 1,470 1,762 17 13 May 14-15, 2012 9,743 8,343 14 14 July 14, 2012 2,760 2,553 8 15 January 13-15, 2013 23,330 23,835 2 16 January 30-31, 2013 17,476 18,086 3 17 February 26-27, 2013 10,899 11,022 1 18 March 6, 2013 4,517 4,385 3 19 March 12, 2013 1,827 2,137 17 20 April 12, 2013 5,848 5,548 5 21 May 7-8, 2013 9,885 9,804 1
Average 9%
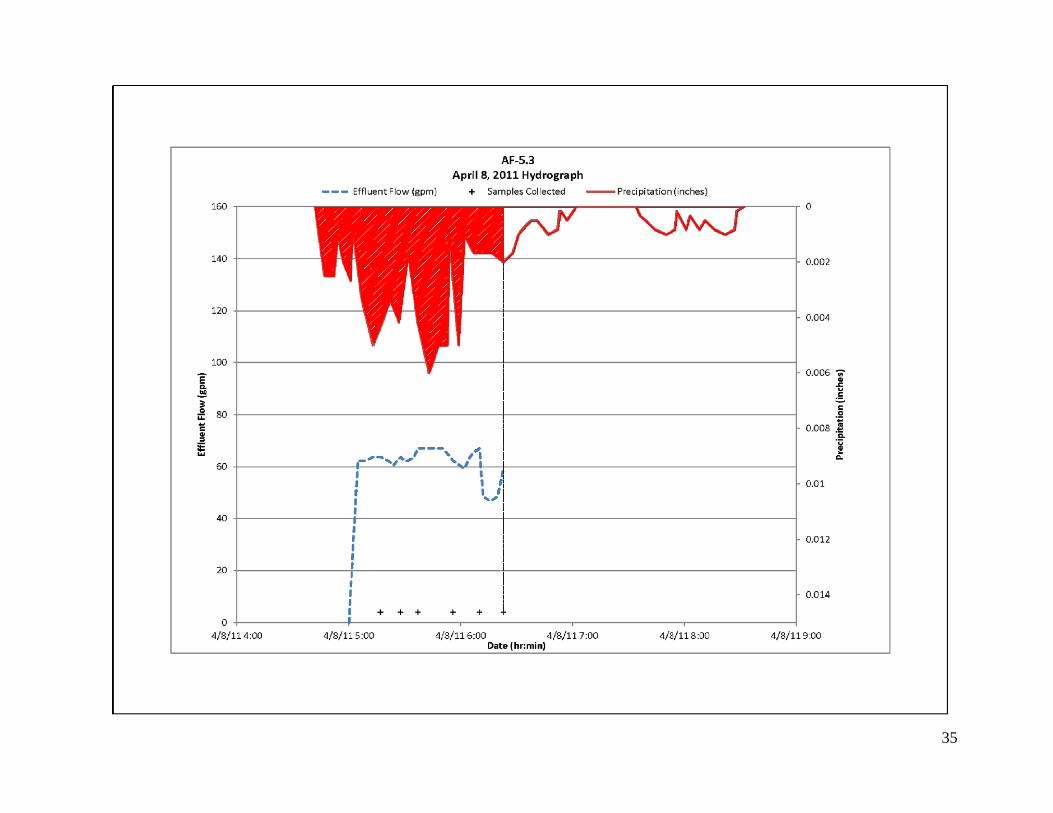
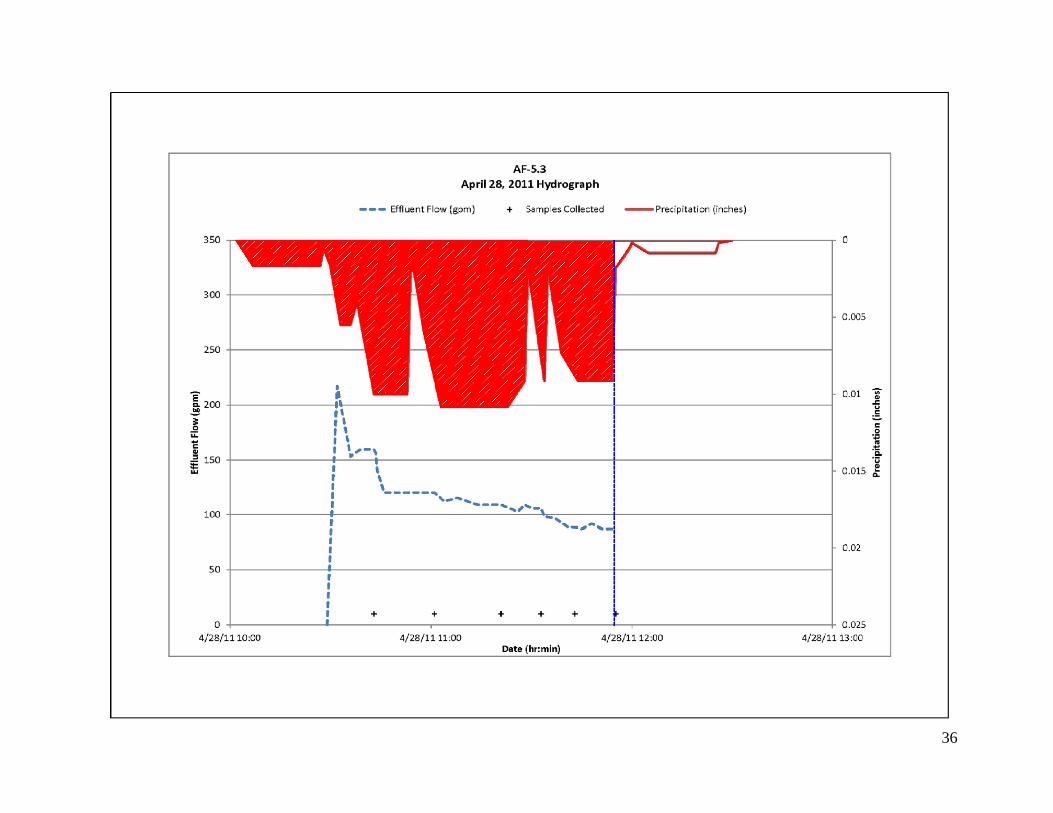
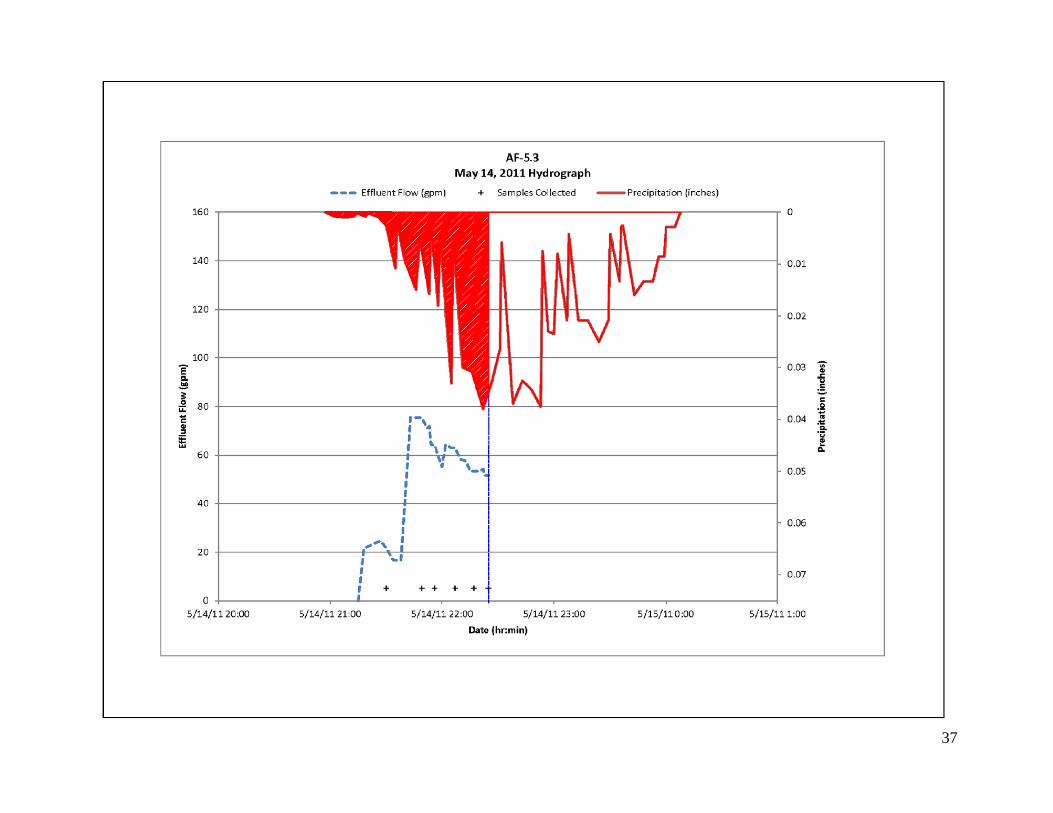
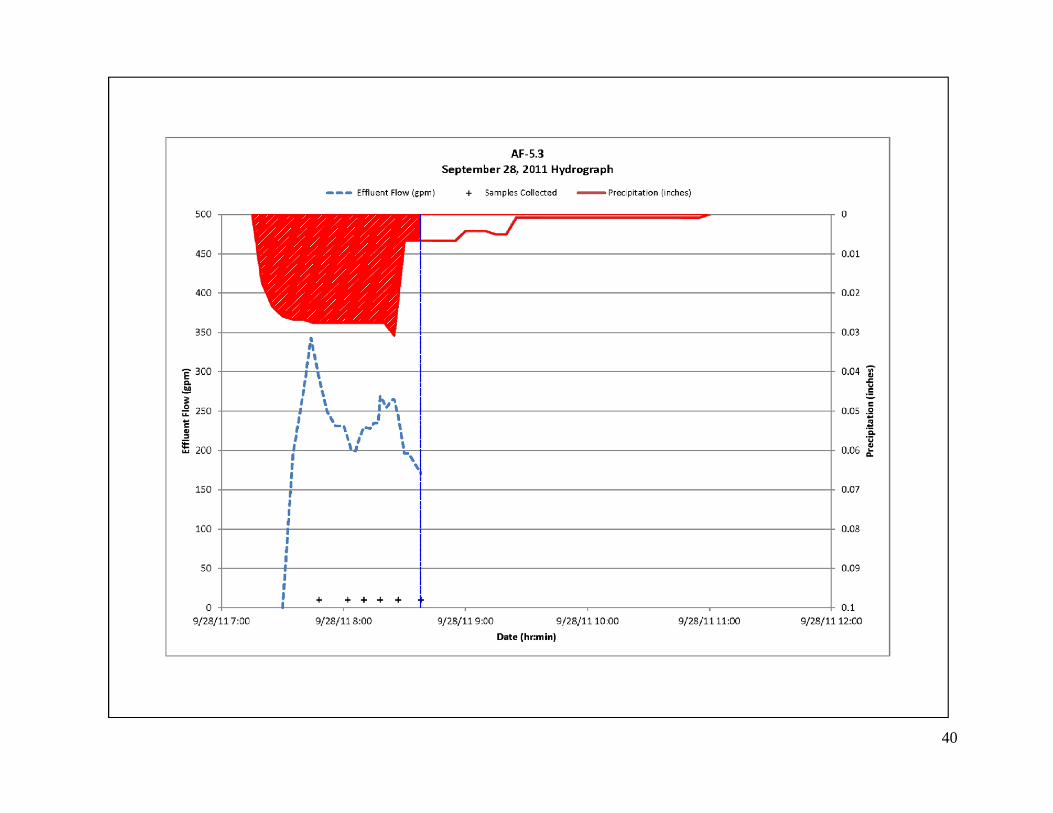
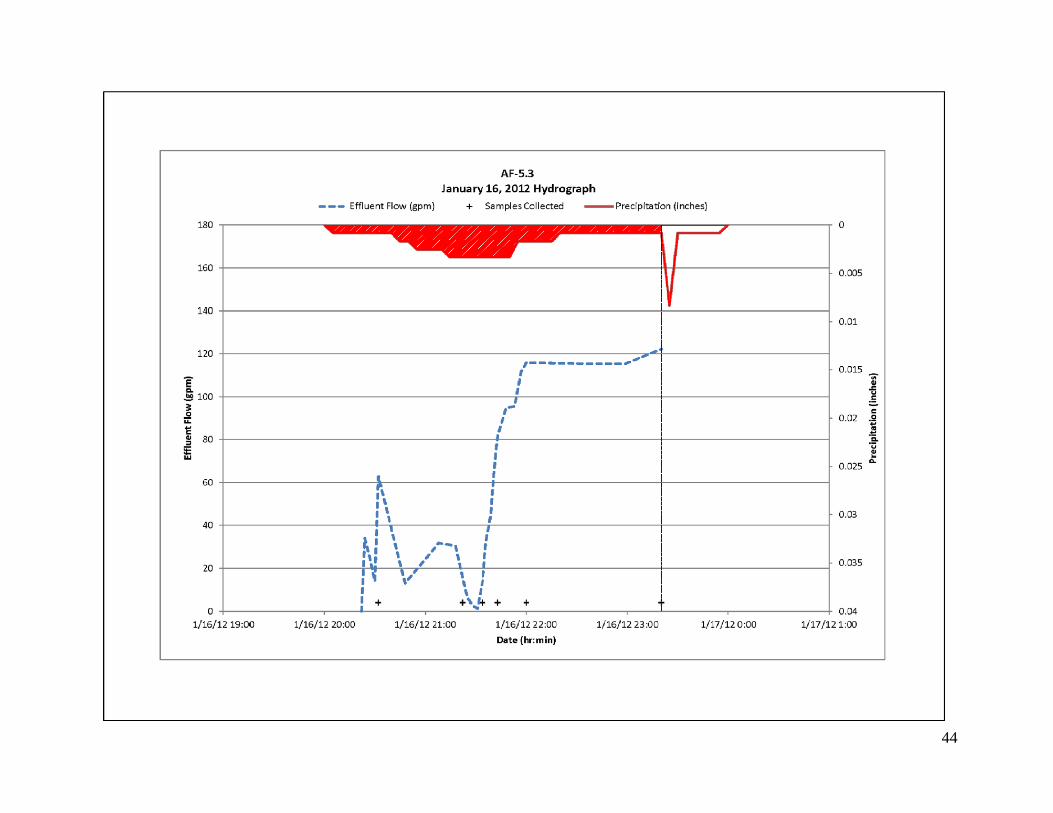
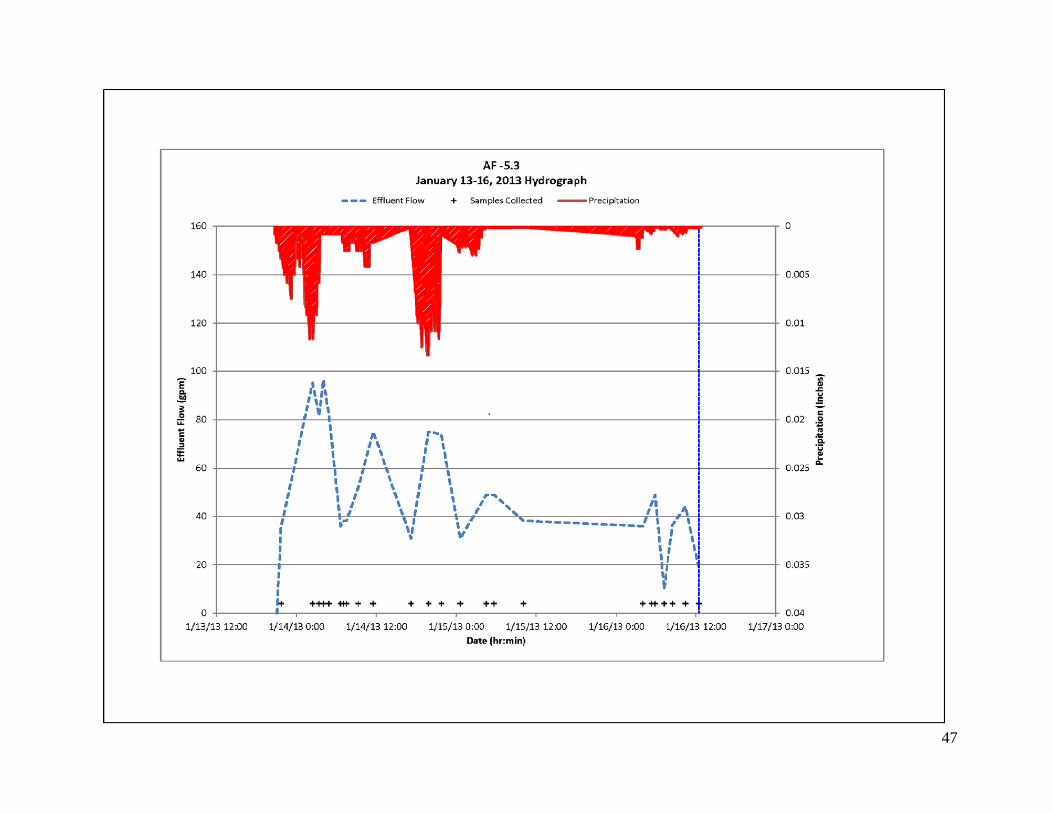
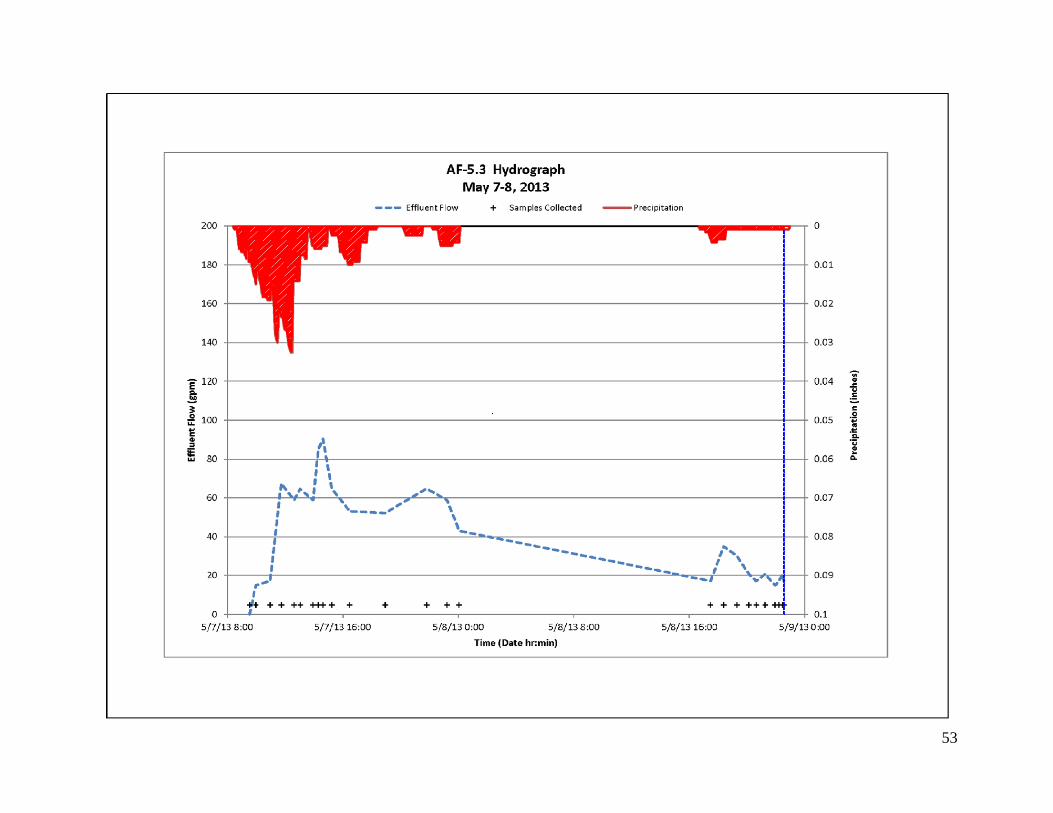
3.8 Hydrographs Hydrographs of the recorded effluent flows over time during each sampling event and the measured precipitation over time as recorded at the Kemp Mill/Silver Spring weather station

18
were developed and are presented in Appendix B. The hydrographs provide a graphic illustration of the recorded flows, rainfall intensity and when flow-weighted composite samples were collected during each of the precipitation events. The hydrographs also provide a graphic illustration of the sample coverage for each storm event. The shaded area under the precipitation curve coincides with the sampling duration time. The sampling duration area under the curve was compared to the total precipitation area under the curve to determine the percentage of flow volume coverage for each storm. The areas under the curve are unit-less based on AutoCAD drawing scales. Table 5 summarizes the areas under the curve for sampling duration and total precipitation to determine the percentage of flow volume sample coverage. An average of 80% storm volume sample coverage has been achieved for the 21 storms.
Table 5 Aqua-FilterTM AF-5.3 Percentage of Storm Volumes Sampled
Storm # Sample Date
Sampling Duration Area Under Curve
Total Precipitation Area
Under Curve
% Storm Sampled
1 March 6, 2011 256.498 519.246 49 2 March 15-16, 2011 219.864 454.746 48 3 April 8, 2011 397.660 490.015 81 4 April 28, 2011 972.627 1,005.161 97 5 May 14, 2011 241.057 695.143 35 6 June 16, 2011 335.662 379.491 88 7 August 6, 2011 285.251 337.357 85 8 September 28, 2011 385.068 449.314 86 9 October 19, 2011 258.565 658.962 39 10 November 29, 2011 564.627 826.951 68 11 December 21, 2011 756.701 1,108.014 68 12 January 16, 2012 132.938 160.498 83 13 May 14-15, 2012 260.341 282.814 92 14 July 14, 2012 318.671 456.033 70 15 January 13-15, 2013 196.254 196.350 100 16 January 30-31, 2013 535.882 536.211 100 17 February 26-27, 2013 426.129 429.876 99 18 March 6, 2013 678.076 681.989 99 19 March 12, 2013 507.362 507.447 100 20 April 12, 2013 181.681 206.687 88 21 May 7-8, 2013 140.479 140.882 100
Average 80
3.9 Stormwater Data Collection Table 6 summarizes storm characteristics for the 21 storm events including storm duration, sampling duration, storm size, peak storm intensity and peak influent loading rate. An average peak influent loading rate is calculated to be 6.1 gpm/ft2. TARP guidelines (NJDEP 2006) specify that at least two storms must exceed 75% of the design treatment capacity (16.5 gpm/ft2). The three highest peak influent loading rates are 15.6 gpm/ft2 (storm #14), 15.8 gpm/ft2 (storm

19
#7) and 17.5 gpm/ft2 (storm #20). Storms #7 and #14 exceed 75% of the design treatment capacity and storm #20 is >100% of the design treatment capacity.
Table 6 Summary of Storm Characteristics
Storm #
Sample Date
Storm Duration
(hours:mins)
Sampling Duration
(hours:mins)
Storm Size
(inches)
Peak Storm
Intensity (in/hr)
Peak Influent Loading Rate
(gpm/ft2)
1 March 6, 2011 4:50 1:59 1.42 0.46 6.0 2 March 15-16, 2011 5:06 3:00 0.42 0.35 1.0 3 April 8, 2011 3:55 1:42 0.52 0.15 1.9 4 April 28, 2011 2:19 1:33 0.23 0.23 6.8 5 May 14, 2011 3:05 1:25 0.85 0.47 3.0 6 June 16, 2011 3:20 1:10 1.03 0.91 7.2 7 August 6, 2011 4:46 1:30 0.69 1.08 15.8 8 September 28, 2011 3:05 1:02 0.61 0.37 7.4 9 October 19, 2011 7:26 1:36 0.54 0.24 6.9 10 November 29, 2011 5:95 1:22 0.30 0.23 2.2 11 December 21, 2011 5:06 2:41 0.11 0.04 1.8 12 January 16, 2012 3:59 3:05 0.21 0.04 3.6 13 May 14-15, 2012 16:01 14:47 0.79 0.36 6.0 14 July 14, 2012 2:59 1:59 0.61 0.60 11.3 15 January 13-15, 2013 64:08 63:44 1.43 0.19 3.2 16 January 30-31, 2013 9:34 9:05 1.60 0.57 15.6 17 February 26-27, 2013 20:25 19:18 0.85 0.25 3.6 18 March 6, 2013 11:30 10:38 1.00 0.17 2.6 19 March 12, 2013 7:20 7:16 0.83 0.50 2.4 20 April 12, 2013 11:59 11:03 0.62 0.32 17.5 21 May 7-8, 2013 38:31 37:34 1.17 0.36 2.6 Average 0.75 0.38 6.1
Total 15.83
3.10 Treatment System Maintenance All 36 perlite filter media containers were replaced on February 28, 2012. Routine maintenance of the Aqua-FilterTM system was conducted at the Burnt Mills Shopping Center by technicians affiliated with the County Stormwater Sewer Maintenance Program. Available records indicate that the swirl chamber was vacuumed by the County Maintenance Department during November 2012. A vacuum truck was used to empty all captured materials (floatables and settleable solids) and flush the Swirl chamber and associated catch basins and divergence and convergence structures. Continued inspections of the Aqua-FilterTM during the testing program indicate that the device has exhibited long term functionality and has been properly maintained as recommended by the manufacturer. Disposal of recovered materials from the Aqua-FilterTM was not the responsibility of AquaShieldTM or its agent(s) during the testing program. Neither AECOM nor
AquaShieldTM were informed prior to that maintenance event; hence, the condition
of captured material and sediment accumulation in the swirl chamber could not be documented.

20
The Aqua-Filter™ Inspection and Maintenance Manual (March 2013) is available for download on the AquaShield™ technical documents website page at: http://www.aquashieldinc.com/downloads.html 4. Technology System Performance
4.1 Test Results During initial testing, six influent and six effluent sample pairs were collected for laboratory analysis during each event. Following consultation with NJCAT in March 2012, the sampling procedure for subsequent sampling events was modified to result in one overall influent and effluent flow proportional composite sample being submitted to the laboratory for analysis. Sum of loads removal efficiency calculations have been performed for the 21 storm events and 15.83 inches of rainfall. Table 7 below summarizes the influent and effluent TSS and SSC mass loads and removal efficiency calculations. Both TSS and SSC removal efficiencies are calculated to be approximately 97% by the sum of loads method. Note that SSC analysis could not be performed for storm #14 due to high suspended material in the samples which prevented water from passing through the analysis method filter paper.
Table 7 Suspended Solids Event Sum of Loads Removal Efficiencies
Sampling Event Date Influent TSS
Mass (lbs) Effluent TSS
Mass (lbs) Influent SSC Mass (lbs)
Effluent SSC Mass (lbs)
1 3/6/2011 11.7 0.58 34.5 2.19 2 3/15-16/2011 1.4 0.05 2.8 0.11 3 4/8/2011 3.4 0.1 4.1 0.14 4 4/28/2011 14.4 1.15 18.5 1.17 5 5/14/2011 3.1 0.18 3.1 0.19 6 6/16/2011 2.4 0.16 3.0 0.08 7 8/6/2011 17.0 0.87 31.9 0.98 8 9/28/2011 5.4 0.892 6.0 0.677 9 10/19/2011 65.0 0.831 80.7 0.984
10 11/29/2011 1.4 0.08 2.4 0.073 11 12/21/2011 3.3 0.392 3.42 0.353 12 1/16/2012 2.8 0.573 3.4 0.239 13 5/14-15/2012 115.6 1.62 155.8 0.47 14 7/14/2012 45.3 0.54 NA NA 15 1/13-16/13 167.6 8.48 173.4 8.04 16 1/30-31/13 173.5 10.96 174.6 10.17 17 2/26-27/13 285.2 3.3 284.5 1.51 18 3/6/13 61.8 0.3 64.9 0.71 19 3/12/13 18.6 0.39 18.4 0.24 20 4/12/13 35.17 0.90 41.6 0.38 21 5/7-8/13 21.20 4.41 23.5 3.8
Total Mass 1,055.3 36.8 1,130.5 32.5 Removal Efficiency 96.5% 97.1%

21
Exclusion of any storm having higher influent loadings compared to other storms does not appreciably alter removal efficiencies since most effluent mass values are relatively low. The sum of the loads method indicates that approximately 1,100 pounds of sediment was removed from stormwater runoff for the 21 storms monitored during the testing program. Table 8 summarizes the TSS and SSC influent and effluent results; percent Total Volatile Suspended Solids (TVSS) of TSS; and removal efficiencies for each stormwater event based upon average concentration of six influent and effluent samples or direct comparison to influent and effluent composite samples. Sediment removal efficiency is calculated as follows:
Removal Efficiency (%) = (Influent Concentration – Effluent Concentration) x 100 Influent Concentration
Table 8 Summary of TSS and SSC Removal Efficiencies
Storm # Sample Date
Influent TSS
(mg/L)
Effluent TSS
(mg/L)
TSS Removal
Efficiency (%)
Influent SSC
(mg/L)
Effluent SSC
(mg/L)
SSC Removal
Efficiency (%)
% TVSS of TSS
1 3/6/2011 95.4 4.3 95.0 275.8 15.8 92.6 25.4 2 3/15-16/2011 40.3 1.2 94.6 79.7 2.0 94.4 24.4 3 4/8/2011 91.9 2.2 97.5 113.1 3.4 93.5 25.2 4 4/28/2011 132.9 13.9 77.3 168.7 14.3 79.2 71.4 5 5/14/2011 155.5 6.1 94.2 154.6 6.8 94.3 48.9 6 6/16/2011 27.8 2.8 84.2 34.3 1.4 93.3 42.6 7 8/6/2011 52.7 2.6 94.7 100.9 4.0 96.1 44.8 8 9/28/2011 52.8 7.3 80.1 69.8 4.5 89.3 29.3 9 10/19/2011 369.5 5.8 98.3 463.5 5.9 98.7 36.5 10 11/29/2011 34.1 1.8 87.7 57.7 1.6 89.2 56.7 11 12/21/2011 88.6 8.2 90.3 92.7 7.3 90.6 51.3 12 1/16/2012 33.5 4.1 77.2 33.0 3.9 84.4 29.7 13 5/14-15/2012 190.0 3.1 98.4 256.0 0.9 99.6 49.8 14 7/14/2012 263.0 3.4 98.7 NA NA NA 37.3 15 1/13-16/13 115.0 5.7 95.0 119.0 5.4 95.5 49.1 16 1/30-31/13 159.0 9.7 93.9 160.0 9.0 94.4 25.8 17 2/26-27/13 419.0 4.8 98.9 418.0 2.2 99.5 34.8 18 3/6/13 219.0 1.1 99.5 230.0 2.6 98.9 33.1 19 3/12/13 163.0 2.9 98.2 161.0 1.8 98.9 27.9 20 4/12/13 96.3 2.6 97.3 114.0 1.1 99.0 33.2 21 5/7-8/13 34.4 7.2 79.1 38.1 6.2 83.7 36.0
Average 134.9 4.8 91.9 157.0 5.0 93.3 38.7

22
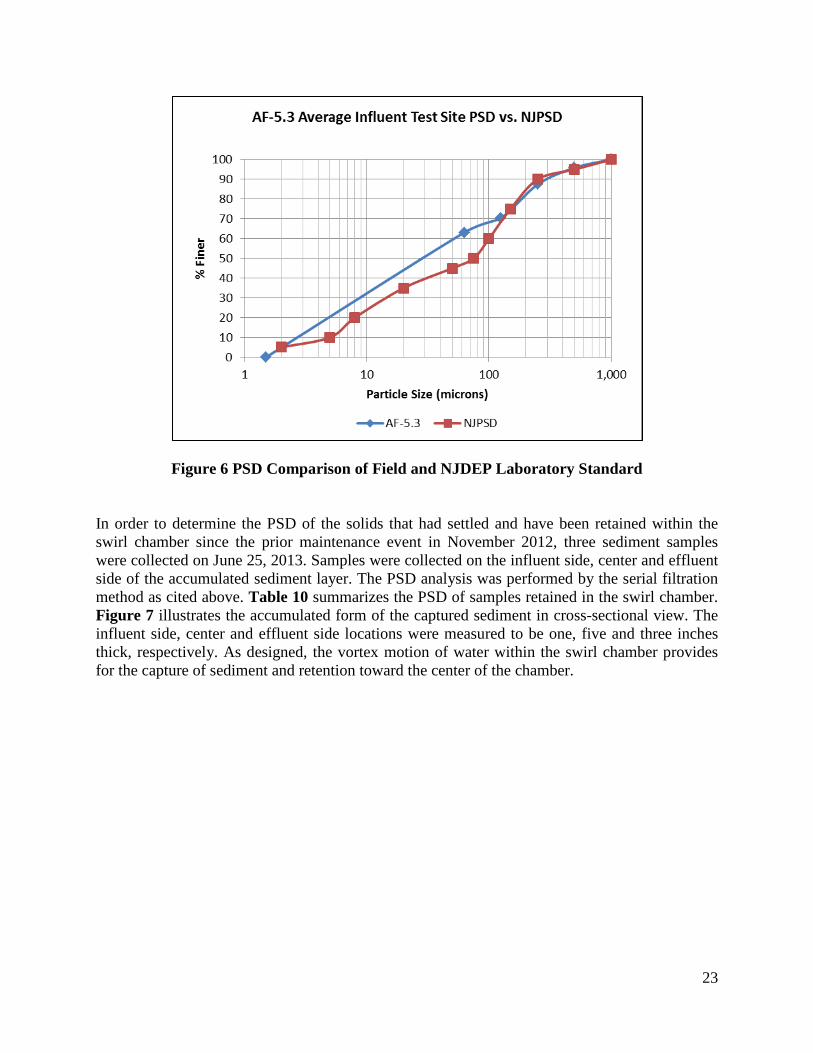
Average TSS removal efficiency is 91.9% for the 21 storm events and 15.83 inches of rainfall. The SSC average removal efficiency is 93.3% for 20 storms and 15.22 inches of rainfall. (Note that the averages shown for the first 12 storms are a result of the average of six individual sample analytical results as discussed in Section 3.4. Hence, the removal efficiencies shown are not identical to what one would calculate from the average influent and effluent concentrations). Average influent TSS and SSC concentrations were 134.9 and 157.0 mg/L, respectively, and within the TARP-specified range of 100 to 300 mg/L. Average effluent TSS and SSC concentrations were 4.8 and 5.0 mg/L, respectively. Data indicates that the sediment concentrations determined by the TSS and SSC methods compare closely. The cumulative average TVSS percentage of TSS was calculated to be 38.7%. The laboratory performed PSD analysis on samples obtained from three storm events: May 14-15, July 14, 2012 and March 6, 2013. Results of influent PSD conditions for these storms are summarized below in Table 9. The results are consistent with a fine-grained clay-loam textured sediment. Approximately 70% of the influent particulate is finer than 125 µm and 63% of the influent particulate is finer than 63 µm. The mean influent particle size is less than 100 µm and is compliant with the TARP particle size protocol. Figure 6 illustrates the AF-5.3 PSD curve based on the average influent values listed in Table 9. Figure 6 also compares the AF-5.3 PSD to that of the NJDEP laboratory test standard gradation (NJPSD) for filtration devices as specified in the recently released “NJDEP Laboratory Protocol to Assess Total Suspended Solids Removal by a Filtration Manufactured Treatment Device (January 25, 2013).
Table 9 Influent PSD Summary
% Finer than Each Sieve/Filter Summary
Storm Event 1,000 µm 500 µm 250 µm 125 µm 63 µm 1.5 µm
May 14-15, 2012 100.00 94.32 87.27 74.09 71.82 0.00 July 14, 2012 100.00 93.14 78.91 62.69 59.66 0.00 March 6, 2013 100.00 100.00 96.05 74.39 57.90 0.00
Average 100.00 95.82 87.41 70.39 63.13 0.00
23
Figure 6 PSD Comparison of Field and NJDEP Laboratory Standard
In order to determine the PSD of the solids that had settled and have been retained within the swirl chamber since the prior maintenance event in November 2012, three sediment samples were collected on June 25, 2013. Samples were collected on the influent side, center and effluent side of the accumulated sediment layer. The PSD analysis was performed by the serial filtration method as cited above. Table 10 summarizes the PSD of samples retained in the swirl chamber. Figure 7 illustrates the accumulated form of the captured sediment in cross-sectional view. The influent side, center and effluent side locations were measured to be one, five and three inches thick, respectively. As designed, the vortex motion of water within the swirl chamber provides for the capture of sediment and retention toward the center of the chamber.

24
Figure 7 Sediment Accumulation Profile in AS-5 Swirl Chamber
25
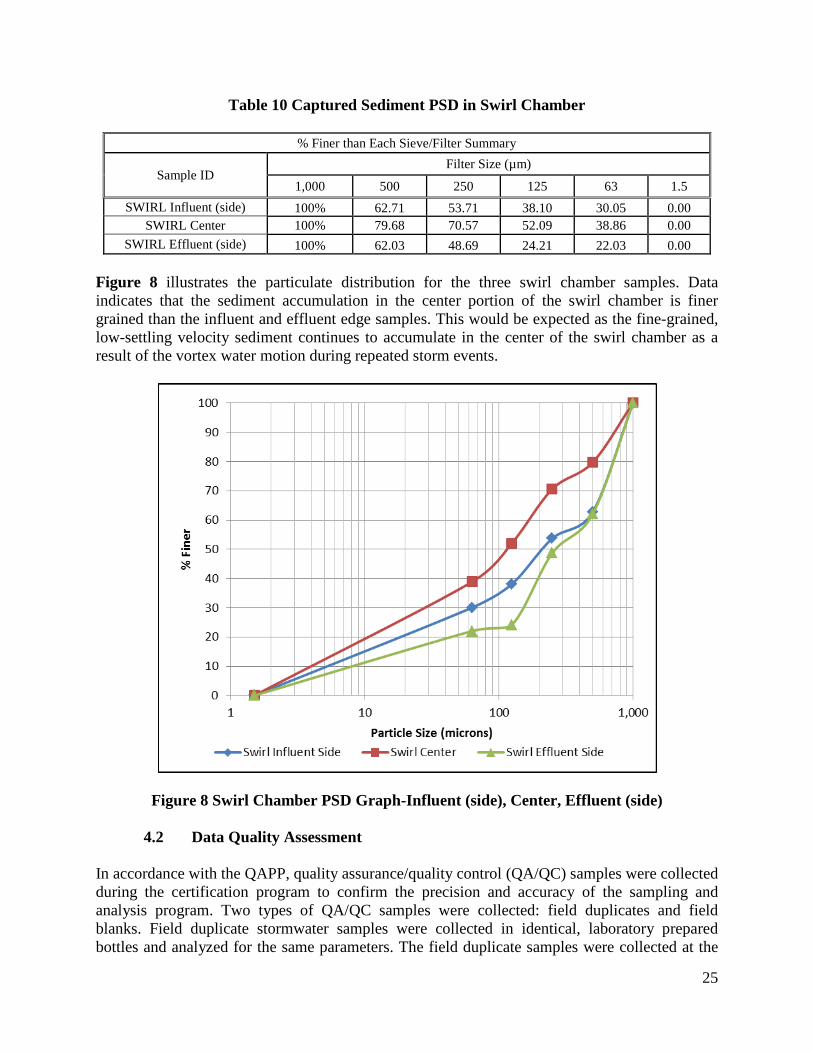
Table 10 Captured Sediment PSD in Swirl Chamber
% Finer than Each Sieve/Filter Summary
Sample ID Filter Size (µm)
1,000 500 250 125 63 1.5 SWIRL Influent (side) 100% 62.71 53.71 38.10 30.05 0.00
SWIRL Center 100% 79.68 70.57 52.09 38.86 0.00 SWIRL Effluent (side) 100% 62.03 48.69 24.21 22.03 0.00
Figure 8 illustrates the particulate distribution for the three swirl chamber samples. Data indicates that the sediment accumulation in the center portion of the swirl chamber is finer grained than the influent and effluent edge samples. This would be expected as the fine-grained, low-settling velocity sediment continues to accumulate in the center of the swirl chamber as a result of the vortex water motion during repeated storm events.
Figure 8 Swirl Chamber PSD Graph-Influent (side), Center, Effluent (side)
4.2 Data Quality Assessment In accordance with the QAPP, quality assurance/quality control (QA/QC) samples were collected during the certification program to confirm the precision and accuracy of the sampling and analysis program. Two types of QA/QC samples were collected: field duplicates and field blanks. Field duplicate stormwater samples were collected in identical, laboratory prepared bottles and analyzed for the same parameters. The field duplicate samples were collected at the

26
same location and from the same sample aliquot as the original samples. One field duplicate stormwater sample was collected for each sampling event, when sufficient sample volume was available. One field blank sample was also collected for each sampling event. The field blank was collected by pouring laboratory provided distilled/deionized water through the cone sample splitter into a decontaminated sample bottle, then into the appropriate sample containers for analysis. Field duplicate analytical results showed acceptable reproducibility of the majority of sampling events. There were isolated events with field duplicate sample results that were outliers; however, the overall relative percent difference (RPD) indicated acceptable reproducibility in sampling results. The overall average RPD was within 30%. If the identified outliers were not included, the average RPD decreased to less than 20% which is the RPD objective identified in the QAPP. The majority of field blank results were below the method detection limits with the exception of two sampling events (April 8, 2012 and May 7-8, 2013) that exhibited low TVSS, TSS and SSC concentrations just above the method detection limit. One low SSC concentration was also detected during the September 28, 2011 event. Field blank results for all other events were not detected. The field blank results confirmed that the decontamination procedures used for the sampling apparatus and the cone splitter were effective at minimizing any cross contamination during sampling and analysis. Review of the overall QA/QC procedures and analytical results have confirmed that the field sampling procedures and analytical methodologies employed produced reliable and representative analytical results.
4.3 Statistical Analysis Statistical analysis was conducted on the sampling program data to ensure that the collected data were reliable, significant and within confidence limits. Initially the removal efficiency for each analytical parameter was evaluated to determine confidence intervals and associated variance. The coefficient of variation (COV) was calculated using the calculated TSS and SSC removal efficiencies for all sampling events. The calculated COV for TSS removal efficiencies was 8.4% and for SSC removal efficiencies was 8.5%. The COVs were within acceptable limits in the TARP protocol. To evaluate the significance of differences between influent and effluent mean concentrations, the Mann-Whitney Rank U Test was used. The Mann-Whitney Rank U Test is a non-parametric statistical hypothesis test for assessing whether two independent samples of observations have equally large values. The null hypothesis concluded that there was a statistically significant difference between influent and effluent mean TSS and SSC concentrations.
27
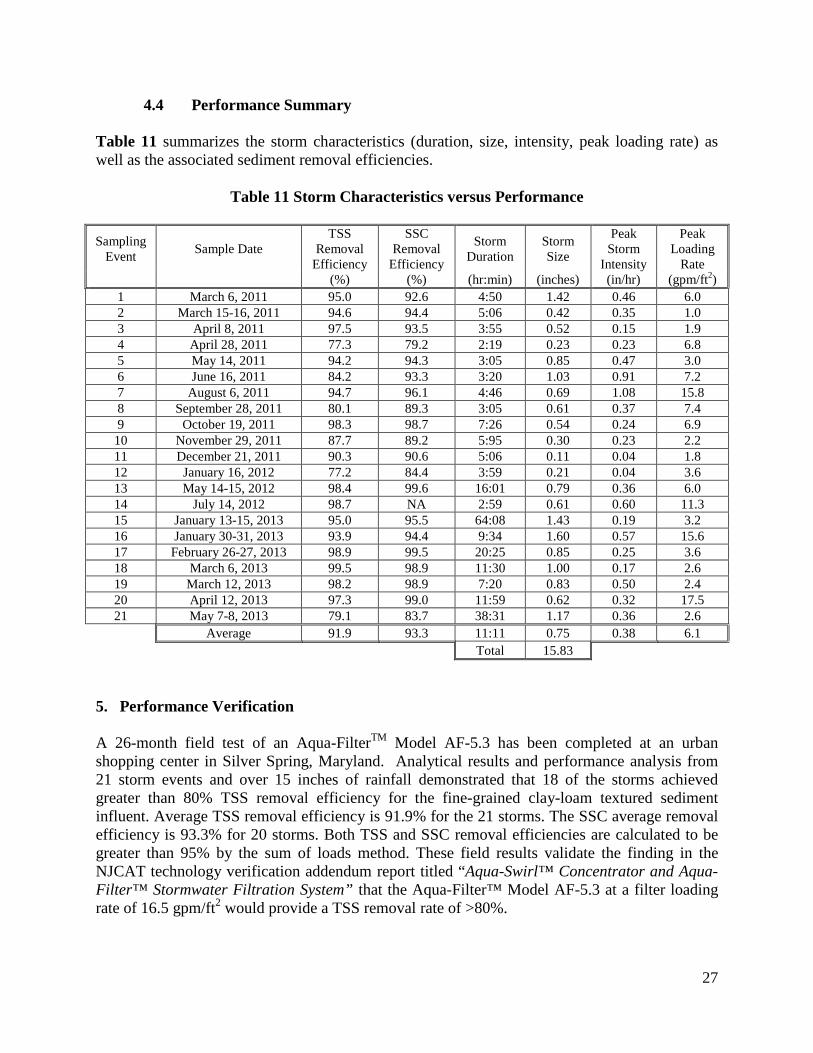
4.4 Performance Summary Table 11 summarizes the storm characteristics (duration, size, intensity, peak loading rate) as well as the associated sediment removal efficiencies.
Table 11 Storm Characteristics versus Performance
Sampling Event Sample Date
TSS Removal
Efficiency
SSC Removal
Efficiency
Storm Duration
Storm Size
Peak Storm
Intensity
Peak Loading
Rate (%) (%) (hr:min) (inches) (in/hr) (gpm/ft2)
1 March 6, 2011 95.0 92.6 4:50 1.42 0.46 6.0 2 March 15-16, 2011 94.6 94.4 5:06 0.42 0.35 1.0 3 April 8, 2011 97.5 93.5 3:55 0.52 0.15 1.9 4 April 28, 2011 77.3 79.2 2:19 0.23 0.23 6.8 5 May 14, 2011 94.2 94.3 3:05 0.85 0.47 3.0 6 June 16, 2011 84.2 93.3 3:20 1.03 0.91 7.2 7 August 6, 2011 94.7 96.1 4:46 0.69 1.08 15.8 8 September 28, 2011 80.1 89.3 3:05 0.61 0.37 7.4 9 October 19, 2011 98.3 98.7 7:26 0.54 0.24 6.9
10 November 29, 2011 87.7 89.2 5:95 0.30 0.23 2.2 11 December 21, 2011 90.3 90.6 5:06 0.11 0.04 1.8 12 January 16, 2012 77.2 84.4 3:59 0.21 0.04 3.6 13 May 14-15, 2012 98.4 99.6 16:01 0.79 0.36 6.0 14 July 14, 2012 98.7 NA 2:59 0.61 0.60 11.3 15 January 13-15, 2013 95.0 95.5 64:08 1.43 0.19 3.2 16 January 30-31, 2013 93.9 94.4 9:34 1.60 0.57 15.6 17 February 26-27, 2013 98.9 99.5 20:25 0.85 0.25 3.6 18 March 6, 2013 99.5 98.9 11:30 1.00 0.17 2.6 19 March 12, 2013 98.2 98.9 7:20 0.83 0.50 2.4 20 April 12, 2013 97.3 99.0 11:59 0.62 0.32 17.5 21 May 7-8, 2013 79.1 83.7 38:31 1.17 0.36 2.6
Average 91.9 93.3 11:11 0.75 0.38 6.1 Total 15.83
5. Performance Verification A 26-month field test of an Aqua-FilterTM Model AF-5.3 has been completed at an urban shopping center in Silver Spring, Maryland. Analytical results and performance analysis from 21 storm events and over 15 inches of rainfall demonstrated that 18 of the storms achieved greater than 80% TSS removal efficiency for the fine-grained clay-loam textured sediment influent. Average TSS removal efficiency is 91.9% for the 21 storms. The SSC average removal efficiency is 93.3% for 20 storms. Both TSS and SSC removal efficiencies are calculated to be greater than 95% by the sum of loads method. These field results validate the finding in the NJCAT technology verification addendum report titled “Aqua-Swirl™ Concentrator and Aqua-Filter™ Stormwater Filtration System” that the Aqua-Filter™ Model AF-5.3 at a filter loading rate of 16.5 gpm/ft2 would provide a TSS removal rate of >80%.
28
The TARP requirement that a minimum of six samples be collected from each storm was interpreted by AECOM during the initial testing period that a minimum of six individual composite samples of the influent and effluent were required to be submitted for laboratory analysis (See Section 3.4). To ensure that sufficient sample volumes were collected for the required analyses, storm durations had to be conservatively predicted which led to varying sampling durations, and consequently event coverage, within the rainfall period, during the first 12 events. The storm duration coverage for these storms fluctuated from 35 to 97 percent, with four (4) storms having less than 60% storm coverage; an average of 80% storm flow coverage for the 21 storms was achieved over the 26-month field testing period. TARP qualifying storms require flow-weighted composite samples be obtained covering a minimum of 60% of the total storm flow. Analysis of the TSS and SSC removal efficiencies for the four events having less than 60% storm coverage indicated slightly higher removal efficiencies than that of the 17 qualifying events, possibly due to the higher impact of the first flush. Consequently, utilizing these four storms for the AF-5.3 performance evaluation resulted in slightly higher average removal efficiencies for TSS (91.9% vs. 91.1%) and SSC (93.3% vs. 92.8%) had these storms not been included. Hence, it is concluded that including the results from all 21 storms does not impact the finding that the Aqua-Filter™ Model AF-5.3 achieved greater than 90% TSS and SSC removal efficiencies during the 26-month field test. The impact of removing these four storms when evaluating the suspended solids event sum of loads removal efficiencies (Table 7) was minimal. Removal efficiency for TSS dropped 0.1%, while removal efficiency for SSC remained unchanged. 6. Net Environmental Benefit The Aqua-FilterTM Model AF-5.3 requires no input of raw material, has no moving parts and therefore uses no water or energy other than that provided by stormwater runoff. For the 21 storm events monitored during the 26-month monitoring period the mass of materials captured and retained by the Aqua-FilterTM Model AF-5.3 would otherwise have been released to the environment. 7. References AECOM (2012). Quality Assurance Project Plan for Field Performance Verification Testing of the Aqua-Filter® Model AF-5.3 Stormwater Treatment System, Burnt Mills Shopping Center, Silver Spring, Maryland. Kennedy, John B. and Neville, Adam M. Basic Statistical Methods for Engineers and Scientists. Second Edition, Pun-Donnelly Publisher, New York. New Jersey Corporation for Advanced Technology (NJCAT). (November 2012). NJCAT Technology Verification Report, Aqua-Swirl® Model AS-5 Stormwater Treatment System. New Jersey Corporation for Advanced Technology (NJCAT). (August 2007). NJCAT Technology Verification Addendum Report, Aqua-Swirl™ Concentrator and Aqua-Filter™ Stormwater Filtration System.

29
New Jersey Department of Environmental Protection (NJDEP). (2006). New Jersey Tier II Stormwater Test Requirements-Amendment to TARP Tier II Protocol. Trenton, New Jersey. Available online: http://water.usgs.gov/osw/pubs/WRIR00-419l.pdf Technology Acceptance and Reciprocity Partnership (TARP). (2003). The Technology Acceptance Reciprocity Partnership for Protocol for Stormwater Best Management Practice Demonstrations. United States Environmental Protection Agency (USEPA). (2006). Data Quality Assessment: A Reviewer’s Guide EPA QA/G-9R.

30
APPENDIX A
AQUA-FILTER™ MODEL AF-5.3 SPECIFICATIONS

31
Gravel Backfill shall extend atleast 3.5 feet [1067 mm]outward from SwirlConcentrator and for the fullheight of the Swirl Concentrator(including riser) extendinglaterally to undisturbed soils.(See MH Detail Below)
1:50SCEDrawn By:AF-5.3 STDDocument:
07/13/2012Date: Phone (888) 344-9044 Fax (423) 826-2112 www.aquashieldinc.com
Scale:
Aqua-Filter Filtration System Model AF-5.3 Off-Line Standard DetailU.S. Patent No. 6524473 and other Patent Pending
A
146"[3708 mm]
Pipe couplingby Contractor.12" [305 mm] longStub-out byManufacturer.
A
RemovableCenter Panel
B
B
C
C
10 3/4"[273 mm] OD Max
80 3/4" [2051 mm]
Outlet
Ladder
Plan View
10 3/4" [273 mm] OD Max
Anchor Panel
* Please see accompanied Aqua-FilterSpecifications notes.
** See Site Plan for actual system orientation.
Section A-A
RemovableCenter Panel
3 Evenly SpacedDistribution Slots Ladder
Riser
Anchor Panel Feet
Anchor Panel Feet
Filter Outlet
29 3/8"[746 mm]
80 3/4" [2051 mm]
Varies24"
[610 mm]shown
Grade (Rim)32"
[813 mm] OD
Filter Media
18"[457 mm] Min.
47 3/8"[1203 mm]
42"[1067 mm]
Undisturbed Soils
Bedding
HDPE risers can be field cut to matchfinished grade by Contractor. ManholeFrame and Cover on All risers byManufacturer. (See Detail)
12"[305 mm]
Filter Media
Undisturbed Soils
Bedding
BeddingBedding
3 Evenly SpacedDistribution Slots
Filter GrateSupports
42"[1067 mm]
Section B-B
Undisturbed Soils
Bedding
BeddingBedding
42"[1067 mm]
Section C-C
RemovableCenter Panel
Filter GrateSupports
4 1/2" [114 mm]
Gravel Backfill
1/2" [13 mm]
1" [25 mm]
Manhole Frame & Cover Detail
NTSFor H-20 Traffic Loading Areas
Concrete
Paving
1" [25 mm]
Wrap Compressible ExpansionJoint Material to a minimum
1-inch [25 mm] thickness aroundtop of riser to allow transfer of
traffic loading from manholecover to concrete slab.
Backfill (90%Proctor Density)
Support and Levelmanhole frame withconcrete pad. DO NOTallow manhole frame torest upon HDPE riser.
Riser
Frame
Cover
10" [254 mm]
If traffic loading (H-20) is required or anticipated, a concretepad must be placed over the Stormwater Treatment Systemper concrete design as calculated by Engineer. For systemswhere the depth from grade to the top of the chamber isgreater than the radius of the chamber, a 5ft. x 5ft. [1.5m x1.5m] concrete pad must be placed over the StormwaterTreatment System to support and level the manhole frame.For shallower burials, a reinforced concrete pad extendingover the entire chamber is required. Sample details ofconcrete pad available upon request.
10" [254 mm]
Gravel Backfill
Concrete
Paving
3" [76 mm] Typ.
4 1/2" [114 mm]
1/2" [13 mm]
1" [25 mm]
Manhole Frame & Cover Detail
NTSFor Non-Traffic Areas Only
Soil
1" [25 mm]
Unless other traffic barriers are present,bollards shall be placed around access riser(s)in non-traffic areas to prevent inadvertentloading by maintenance vehicles.
Place small amount ofconcrete [3,000 psi [20MPa] (min)] to supportand level manhole frame.DO NOT allow manholeframe to rest upon riser.
Riser
Frame
Cover
48" [1219 mm] Min.
12" [305 mm]
Wrap Compressible ExpansionJoint Material to a minimum
1-inch [25 mm] thickness aroundtop of riser to allow transfer of
inadvertent loading frommanhole cover to concrete slab.
Backfill (90%Proctor Density)
Concrete8"
[203 mm]
Gravel Backfill
Phone (888) 344-9044 www.aquashieldinc.com
Inle
t
90°**
79" [2007 mm]
79"[2007 mm]
10 3/4" [273 mm] OD Max
Ø66 7/8" [Ø1699 mm]
32"[813 mm] OD
Varies21 3/8"
[543 mm]shown
68"[1727 mm]
104"[2642 mm]
Riser
Pipe couplingby Contractor.
12" [305 mm] longStub-out by
Manufacturer.
Octagonal Base Plate
ArchedBaffle
Vent
Swirl Inlet
Grade (Rim)
ArchedBaffle
12"[305 mm]
Filter InletSwirl Outlet

32
APPENDIX B
INDIVIDUAL STORM REPORTS

33

34
35
36
37

38

39
40

41

42

43
44

45

46
47

48

49

50

51

52
53