Embed Size (px)
Citation preview

NJ Wetlands Past, Present and Future: Using Sediment Archives to Inform and Guide Wetland Protection, Restoration
and Resilience
Horton B1, Clear J1,Khan N1,2, Shaw T1, Nikitina D3, Potapova M4,
Desianti N4, Frizzera D5, Procopio N5
1Rutgers U; 2USGS; 3West Chester U; 4Academy of Natural Sciences of Philadelphia; 5NJDEP
Mihaela D. EnacheNJDEP

NJ Wetlands Past, Present and Future
• Background
• Project objectives
• Project design and methods
• Results
• Next steps

Background
• Restoration, enhancement and maintaining the sustainability of our wetland assets have become the focus of wetland management programs.
• To be successful, these programs require knowledge of reference (background) conditions and ecosystem change over time and event; this knowledge is necessary to set reasonable and achievable restoration targets.
• The EPA approved New Jersey Wetlands Protection Plan identifies the lack of knowledge on reference conditions as a gap. This knowledge can be acquired through long-term monitoring programs.
• Unfortunately these programs are sparse, relatively recent and introduced after the wetlands were already impacted.

Background
Environmental monitoring – a matter of time scales. The time scales shown in the figure to the left are on a logarithmic scale; the figure to the right shows a more realistic representation of the relative amount of information potentially available from sedimentary deposits (Modified from Smol 2008).

Background
The four major sources of data for environmental assessments (Modified from Smol 2008).

BackgroundPresent time, wetlands
developed and impacted
Reference condition –
pristine wetlands
Early phase
development
Using sediment cores to reconstruct past environmental conditions - the surface (“top”) =present-day limnological conditions, the deepest sediment sample (“bottom”) = conditions to marked anthropogenic influences. Intermediate sediment intervals =different time periods in-between present day and the time represented by the core bottom.

Background
• The reconstruction of wetland systems based on investigations of sediment archives (cores) can provide a valuable tool to comprehend and quantify the magnitude of anthropogenic and natural impacts, thus filling the gap due to the absence of historical records.
• Our project goal is to use information from sediment cores to track the impact of human activities since the European settlement on NJ wetlands. In order to reconstruct reference conditions and the magnitude of human impacts, we are using biogeochemical proxies preserved in sediment cores, such as diatoms, pollen, organic and inorganic contaminants to assess past salinity, nutrients, sea level, and contaminant concentrations.
• This information is essential to provide restoration targets that are achievable and, importantly protect and sustain NJ wetlands.

Objectives
Use information preserved in sediment cores to:
• Assess wetland reference conditions and impact of anthropogenic activities
• Assess impact of climate and natural events on wetland characteristics
• Refine the use of microscopic algae (diatoms) as ecological indicators for wetlands
• Inform future coastal wetland restoration targets

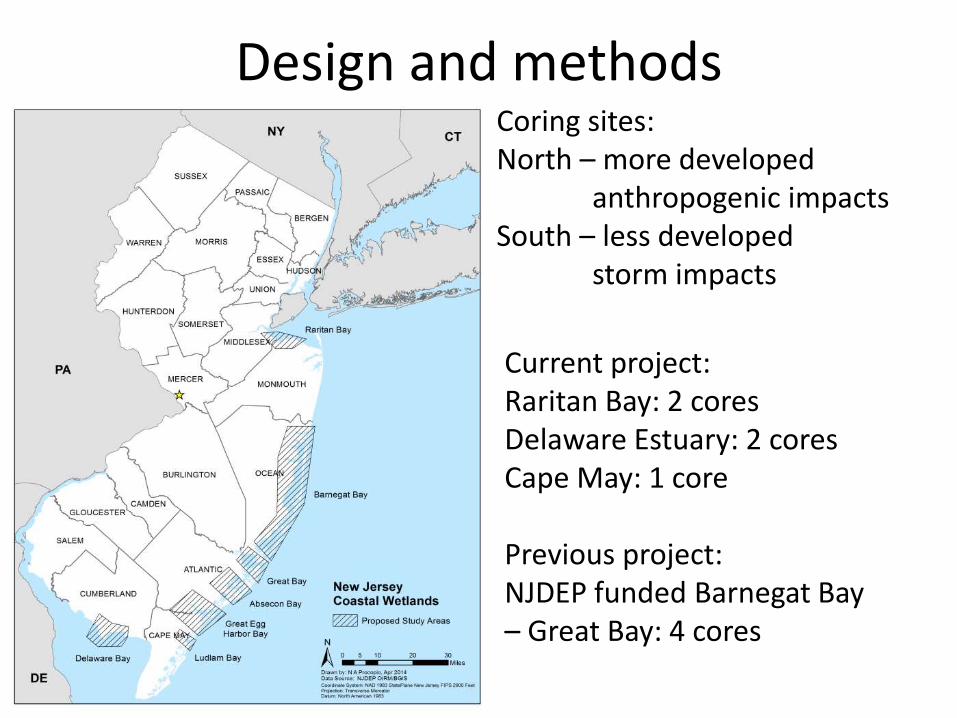
Design and methodsCoring sites:North – more developed
anthropogenic impactsSouth – less developed
storm impacts
Current project:Raritan Bay: 2 coresDelaware Estuary: 2 coresCape May: 1 core
Previous project: NJDEP funded Barnegat Bay – Great Bay: 4 cores

Design and methods
• Chronology
– Radioisotopes Cs-137, Pb-210, C-14, Pollution and pollen markers
• Sedimentary Geochemistry
– C, N, LOI
– Organic / Inorganic Components
• Diatom analysis

Results
• Transfer functions for paleoecologicalreconstructions
• Diatom species indicator of reference/high nutrient conditions
• Preliminary results from sediment core reconstructions

Results – Diatom analysis• Most abundant and diverse microscopic algae in marine
ecosystems• Silica cell walls are well-preserved in sediments• Water quality indicator
• Used in this project:• Calibration/
Transfer functions• Paleo-reconstructions
in sediment cores

CALIBRATION: 100 samples, 603
species, 29 environmental variables
Results – Diatom analysis

100 samples, 40 dominant species, 29 environmental variables
DCA1=0.24
D
CA
2=
0.2
0
Which diatom species are potential indicators of human impacts, including
eutrophication?

ResultsDiatom transfer function
Regression
Y = Û (X)Inverse regression
X = Û (Y)
Û = empirical calibration functions or regression coefficient
Regression
Modern ‘calibration dataset’Diatoms and environmental parameters
Salinity TF
Sediment N TF

Diploneis smithii
Paralia sulcata
Caloneis bacillumNavicula digitoradiata
Cyclotella striataNitzschia brevissima
“Reference” diatoms

High nitrogen indicators
Cyclotella choctawatcheeana Cyclotella atomus var. gracilis Planothidium frequentissimum
Nitzschia frustulum

I. Cheesequake core
Barnegat Bay core 1
Barnegat Bay core 2
Great Bay core 2
Barnegat Bay core 4
IV. Cape May core 8
II. Sea Breeze core
III. Fortescue core F11A & F9E
Core locations Specific goals:
• To assess the effect of
pollution/eutrophication on
wetlands
• To assess marsh recovery
after storm events
Results – Sediment Core Reconstructions

Core BB1: salinity and sediment Nitrogen reconstructions
Cranberry Inlet
Manasquan Inlet

Manasquan Inlet 1868Manasquan
Inlet 1878
Manasquan Inlet 2016
Manasquan Inlet opening project started in 1930 and the inlet was completely open in 1931 until now (2016)
Barnegat Inlet 1974
Cranberry Inlet opened by vicious storm in 1740 and remained opened for 62 years
Manasquan Inlet 1974
Herring Inlet (North of Inlet Sandy cut in 2012) was closed after the storm in 1740Core BB1
1945 map
1878 map

N tolerant
N sensitive
Neutral
Diatom zonation
Sparse foraminifera and diatoms
Foraminifera absent
Cape May Courthouse Core
Diatoms indicate sediment nitrogen increase since 1700s and especially in recent decades
Poor analog in calibration set

Cape May Courthouse CoreUpper 50 cm (~300 years)
Relative abundance (%) Total sum of squares

Inferred salinity Inferred N sediment CONISS
Cheesequake Core
Relative abundance (%) Salinity (ppt) N sed (%) Total sum of squares

Land Use – Cheesequake & Cape May
• 5 km radius around coring sites
Site/Landuse(acres)
Buffer Radius (km) AG BARREN LAND FOREST URBAN WATER WETLANDS
Cape May 3 26 86 969 2107 1421 2377
Cape May 4 112 143 2077 2862 3005 4222
Cape May 5 236 183 3166 3720 4231 7871
Cheesequake 3 366 206 1473 2990 189 1763
Cheesequake 4 508 300 2464 5870 802 2476
Cheesequake 5 567 371 3861 8873 2264 3470

Land Use ComparisonCape May / Cheesequake
0
1000
2000
3000
4000
5000
6000
7000
8000
9000
AG URB WETAG
URBWET
Cape May Cheesequake

-1 4DCA 1
-33
DC
A 2
TimeInf. Salinity
Inferred Nsed
CQ
BB1BB2
BB4 GB
CMC
BaclPard
CalnBacl
ChmAffBg
ChamKroo
ChamaSp8
CoccStau
CyclStri
CymtBelg
DentSubt
DiplLitrDiplSmit
FallPygm
FrusCreu
HalmAcutHalmApon
LutcMutc
NavcAntv
NavcCfPr
NavcCons
NavcDigt
NavcHans
NavcIsab
NavcJons
NavcMicr
NavcPerg
NavcSp52 NavcWill
NitzBrev
NitzFrus
NitzMicr
NitzScal
NitzsSp1
ParlSulc
PlanDelc
PlanFreq
RhopMusc
ThalOest
TrybDebl
800 900
1100 1300 1500
1700
1800
1900 2000
2100
Diatoms
indicating high
N and
increasing
abundance with
time
Diatoms
representing
reference
conditions

1600 – 1950 trends

Summary
• Barnegat Bay : diatom based transfer functions (Potapova et al, in review J Coastal Res)
• Sediment cores from Barnegat Bay, Cheesequake State Park (Raritan Bay) and Cape May reveal important changes through time
• Nutrient increase accelerated after 1950s consistent with development, human activities
• Cores from less impacted sites display significant deviation from reference conditions
• Top core changes suggest impacts from additional factors
• Sea Breeze (Nikitina et al., 2014) & Fortescue – Storm history reconstructed; diatom analysis ongoing

Sediment cores proved an important tool in providing information on wetland condition for New Jersey study sites
otherwise unavailable to stakeholders

Next steps• Complete Lab analyses, Land-use history, data
interpretation
• Use core multi-proxy results to:- Quantify Nutrient reference conditions- Quantify magnitude and direction of anthropogenic impacts- Assess storm erosion events and marsh recovery- Assess potential impacts of climate change
• Inform future coastal wetland restoration targets

Acknowledgements
• EPA Grant No 96284800
• NJGS for assistance with geoprobe coring
• Rutgers students for assistance in the field
• NOSAMS for radiocarbon dating
• SGS Mineral Services for geochemistry