Embed Size (px)
Citation preview
Living WatersConserving the source of life
The EconomicValues of theWorld’s WetlandsPrepared with supportfrom the Swiss Agency for theEnvironment, Forests andLandscape (SAEFL)
Gland/Amsterdam, January 2004
Kirsten SchuytWWF-InternationalGland, Switzerland
Luke BranderInstitute for Environmental StudiesVrije UniversiteitAmsterdam, The Netherlands
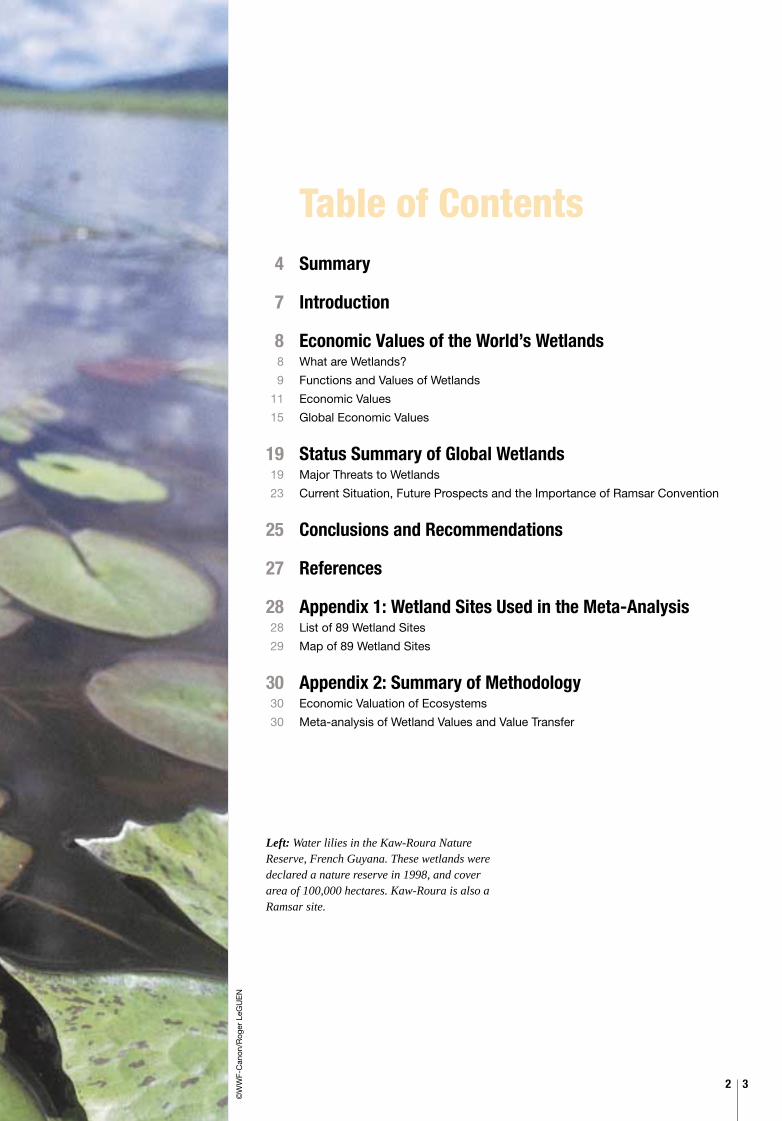
Summary
Introduction
Economic Values of the World’s WetlandsWhat are Wetlands?
Functions and Values of Wetlands
Economic Values
Global Economic Values
Status Summary of Global WetlandsMajor Threats to Wetlands
Current Situation, Future Prospects and the Importance of Ramsar Convention
Conclusions and Recommendations
References
Appendix 1: Wetland Sites Used in the Meta-AnalysisList of 89 Wetland Sites
Map of 89 Wetland Sites
Appendix 2: Summary of MethodologyEconomic Valuation of Ecosystems
Meta-analysis of Wetland Values and Value Transfer
2 3
4
7
88
9
11
15
1919
23
25
27
2828
29
3030
30
Table of Contents
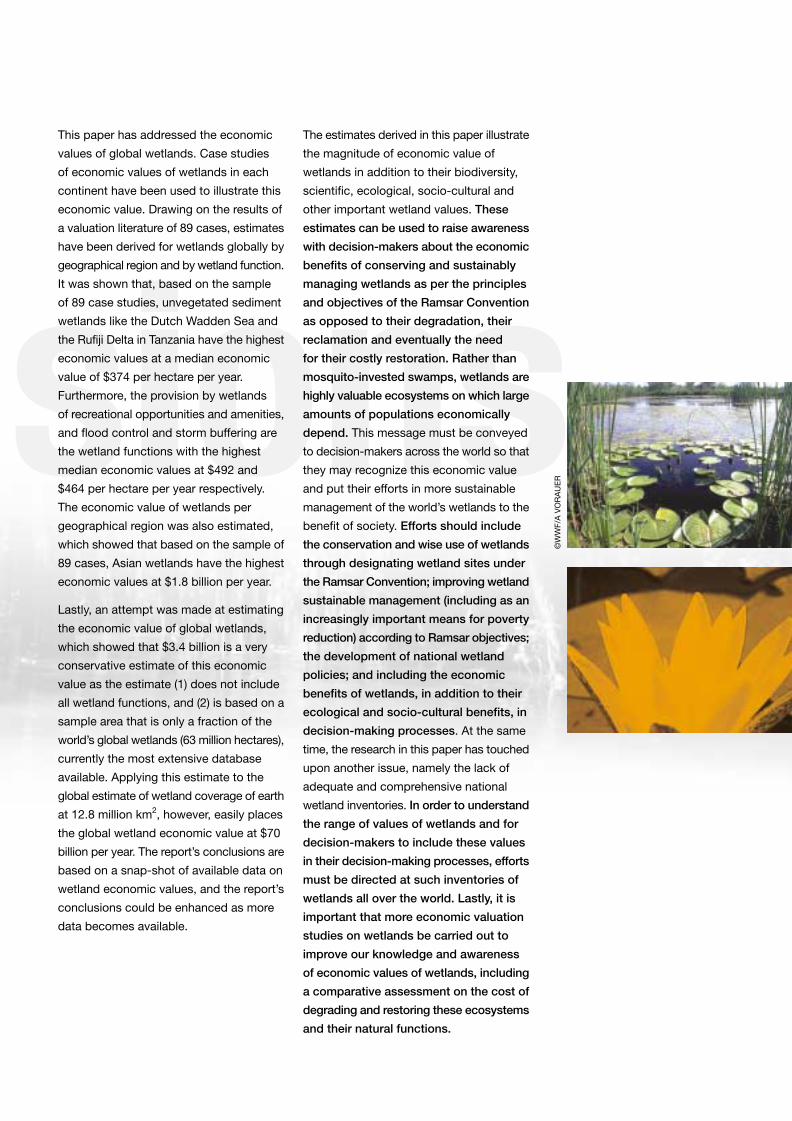
Left: Water lilies in the Kaw-Roura NatureReserve, French Guyana. These wetlands weredeclared a nature reserve in 1998, and coverarea of 100,000 hectares. Kaw-Roura is also aRamsar site.
©W
WF-
Can
on/R
oger
LeG
UE
N
SumSummaryWetlands are ecosystems that provide numerousgoods and services that have an economic value, notonly to the local population living in its periphery butalso to communities living outside the wetland area.They are important sources for food, fresh water andbuilding materials and provide valuable services suchas water treatment and erosion control. The estimatesin this paper show, for example, that unvegetatedsediment wetlands like the Dutch Wadden Sea andthe Rufiji Delta in Tanzania have the highest medianeconomic values of all wetland types at $374 perhectare per year.
maryFurthermore, the provision by wetlands of
recreational opportunities and amenities,
and flood control and storm buffering are
the wetland functions with the highest
median economic values at $492 and
$464 per hectare per year respectively.
The economic value of wetlands per
geographical region was also estimated,
which showed that Asian wetlands have
the highest economic values at $1.8 billion
per year. Lastly, an attempt was made at
estimating the economic value of global
wetlands, which showed that $3.4 billion
is a very conservative estimate of this
economic value. The two main reasons
for this conservative estimate are that (1)
many wetland functions were not valued in
the economic valuation studies collected
and used for this value; and (2) only a fraction
of the world’s global wetland area was used
(63 million hectares), the reason being that
this is currently the best available database.
If, on the other hand, we extrapolate this
estimate to the area cited by the Ramsar
Convention of a global wetland area of
12.8 million km2, the total economic value
of the world’s wetlands is in the order of
$70 billion per year. The report’s conclusions
are based on a snapshot of available data
on wetland areas and of case studies of
wetland economic values, and the report’s
conclusions could be enhanced as more
data becomes available.
The estimates derived in this paper illustrate
the magnitude of the economic value of
global wetlands in addition to their
biodiversity, scientific value, climate
regulation, potential tourism, socio-cultural
and other important wetland values. They
represent one more tool to raise awareness
with decision-makers about the economic
benefits of conserving or restoring and
sustainably managing wetlands as opposed
to their degradation and reclamation. Rather
than mosquito-invested swamps, wetlands
are highly valuable ecosystems on which
large amounts of populations depend
economically and get water for basic
functions.
Despite their economic value, wetlands
all over the world are continually modified
and reclaimed at great cost. While others
are being restored at great cost also. The
root cause of much wetland degradation is
information failure - decision-makers often
have insufficient understanding of the values
of wetlands, including the economic value,
so the protection of wetlands does not
appear to be a serious alternative. Therefore,
the message of this paper must be conveyed
to decision-makers across the world so that
they may recognize this economic value
and put their efforts in more sustainable
management of the world’s wetlands to the
benefit of society.
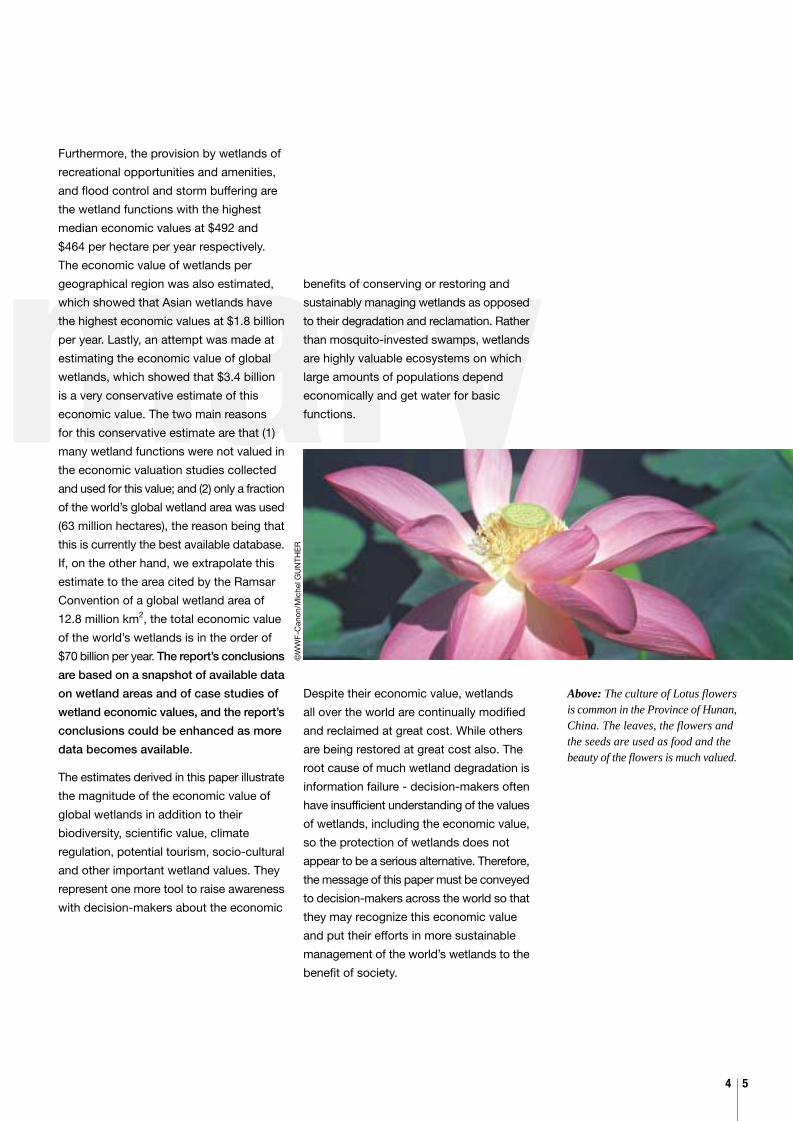
Above: The culture of Lotus flowersis common in the Province of Hunan,China. The leaves, the flowers andthe seeds are used as food and thebeauty of the flowers is much valued.
©W
WF-
Can
on/M
iche
l GU
NTH
ER
4 5
Intro-duction
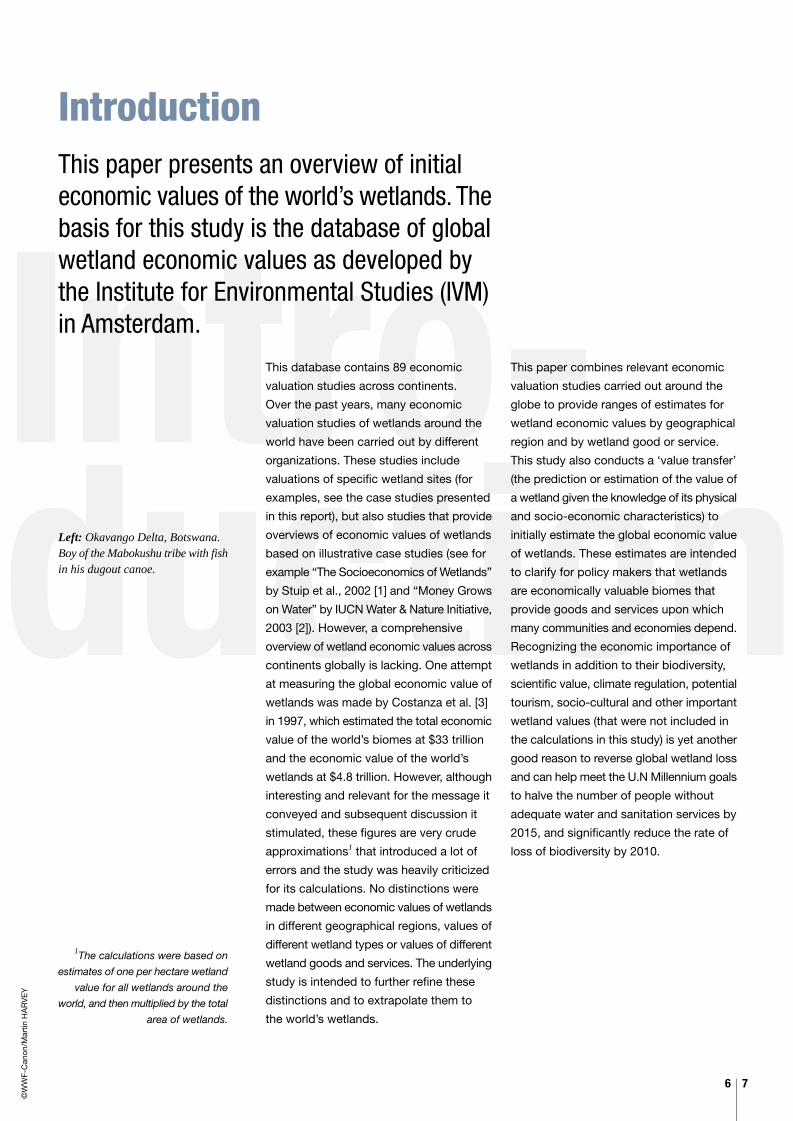
IntroductionThis paper presents an overview of initialeconomic values of the world’s wetlands. Thebasis for this study is the database of globalwetland economic values as developed bythe Institute for Environmental Studies (IVM)in Amsterdam.
This database contains 89 economic
valuation studies across continents.
Over the past years, many economic
valuation studies of wetlands around the
world have been carried out by different
organizations. These studies include
valuations of specific wetland sites (for
examples, see the case studies presented
in this report), but also studies that provide
overviews of economic values of wetlands
based on illustrative case studies (see for
example “The Socioeconomics of Wetlands”
by Stuip et al., 2002 [1] and “Money Grows
on Water” by IUCN Water & Nature Initiative,
2003 [2]). However, a comprehensive
overview of wetland economic values across
continents globally is lacking. One attempt
at measuring the global economic value of
wetlands was made by Costanza et al. [3]
in 1997, which estimated the total economic
value of the world’s biomes at $33 trillion
and the economic value of the world’s
wetlands at $4.8 trillion. However, although
interesting and relevant for the message it
conveyed and subsequent discussion it
stimulated, these figures are very crude
approximations1 that introduced a lot of
errors and the study was heavily criticized
for its calculations. No distinctions were
made between economic values of wetlands
in different geographical regions, values of
different wetland types or values of different
wetland goods and services. The underlying
study is intended to further refine these
distinctions and to extrapolate them to
the world’s wetlands.
This paper combines relevant economic
valuation studies carried out around the
globe to provide ranges of estimates for
wetland economic values by geographical
region and by wetland good or service.
This study also conducts a ‘value transfer’
(the prediction or estimation of the value of
a wetland given the knowledge of its physical
and socio-economic characteristics) to
initially estimate the global economic value
of wetlands. These estimates are intended
to clarify for policy makers that wetlands
are economically valuable biomes that
provide goods and services upon which
many communities and economies depend.
Recognizing the economic importance of
wetlands in addition to their biodiversity,
scientific value, climate regulation, potential
tourism, socio-cultural and other important
wetland values (that were not included in
the calculations in this study) is yet another
good reason to reverse global wetland loss
and can help meet the U.N Millennium goals
to halve the number of people without
adequate water and sanitation services by
2015, and significantly reduce the rate of
loss of biodiversity by 2010.
1The calculations were based on
estimates of one per hectare wetland
value for all wetlands around the
world, and then multiplied by the total
area of wetlands.
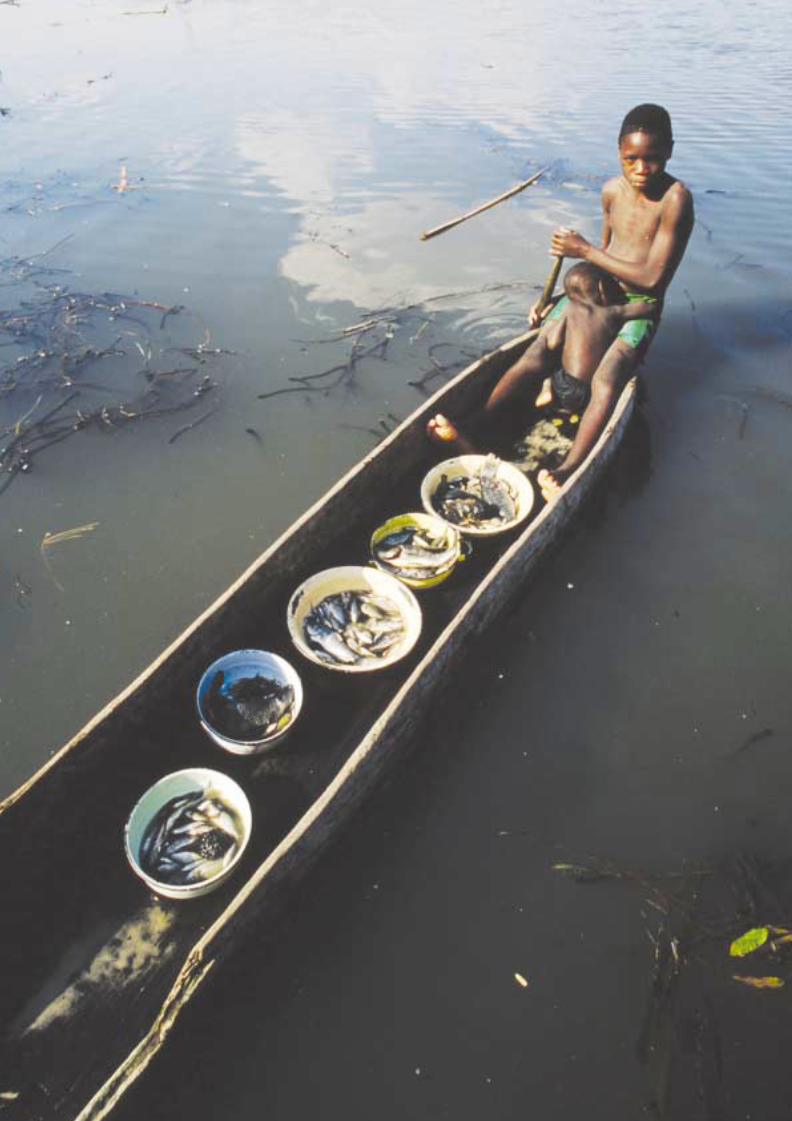
Left: Okavango Delta, Botswana.Boy of the Mabokushu tribe with fishin his dugout canoe.
©W
WF-
Can
on/M
artin
HA
RV
EY
6 7
Values
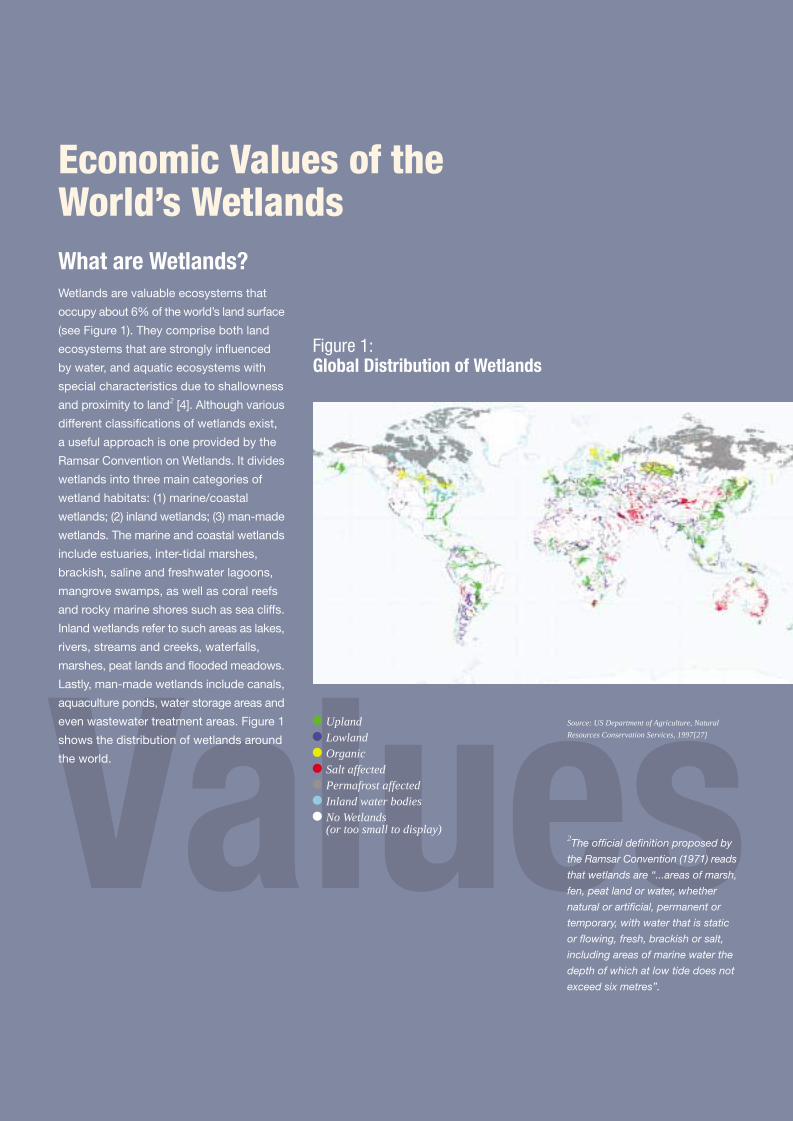
What are Wetlands?Wetlands are valuable ecosystems that
occupy about 6% of the world’s land surface
(see Figure 1). They comprise both land
ecosystems that are strongly influenced
by water, and aquatic ecosystems with
special characteristics due to shallowness
and proximity to land2 [4]. Although various
different classifications of wetlands exist,
a useful approach is one provided by the
Ramsar Convention on Wetlands. It divides
wetlands into three main categories of
wetland habitats: (1) marine/coastal
wetlands; (2) inland wetlands; (3) man-made
wetlands. The marine and coastal wetlands
include estuaries, inter-tidal marshes,
brackish, saline and freshwater lagoons,
mangrove swamps, as well as coral reefs
and rocky marine shores such as sea cliffs.
Inland wetlands refer to such areas as lakes,
rivers, streams and creeks, waterfalls,
marshes, peat lands and flooded meadows.
Lastly, man-made wetlands include canals,
aquaculture ponds, water storage areas and
even wastewater treatment areas. Figure 1
shows the distribution of wetlands around
the world.
Figure 1:Global Distribution of Wetlands
2The official definition proposed by
the Ramsar Convention (1971) reads
that wetlands are “...areas of marsh,
fen, peat land or water, whether
natural or artificial, permanent or
temporary, with water that is static
or flowing, fresh, brackish or salt,
including areas of marine water the
depth of which at low tide does not
exceed six metres”.
Source: US Department of Agriculture, Natural
Resources Conservation Services, 1997[27]
Economic Values of theWorld’s Wetlands
UplandLowlandOrganicSalt affectedPermafrost affectedInland water bodiesNo Wetlands(or too small to display)
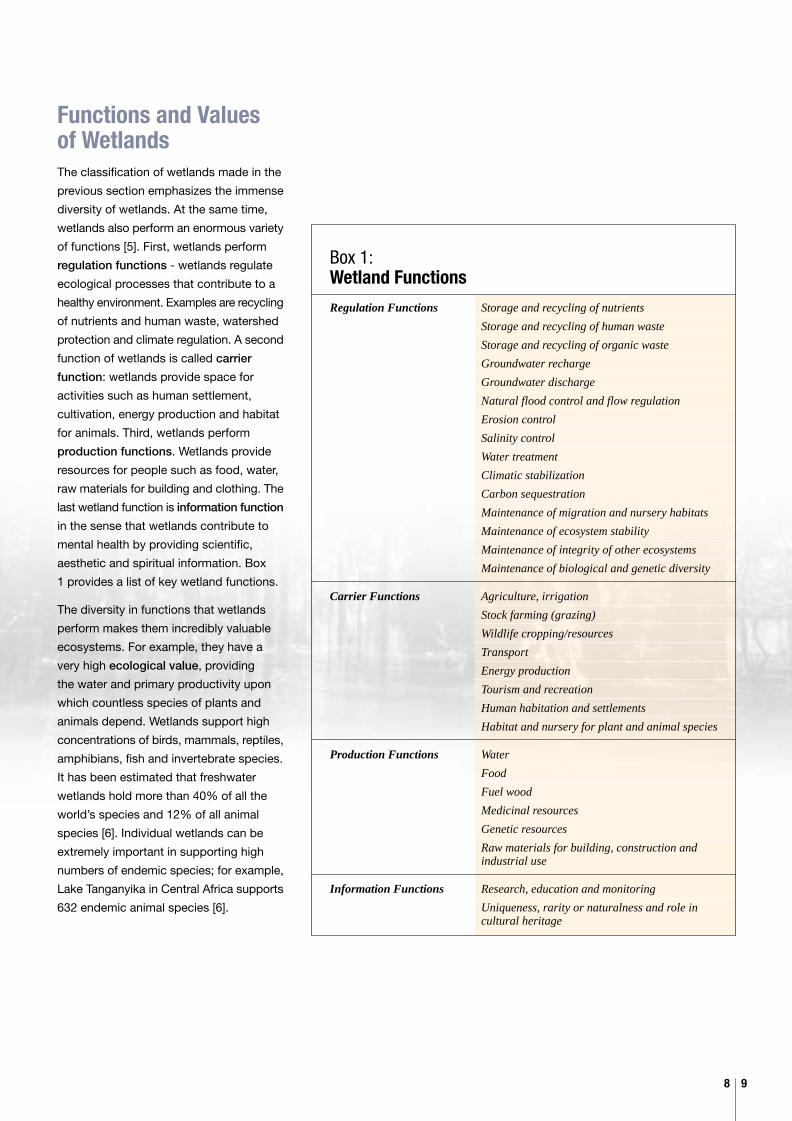
Box 1:Wetland Functions
Regulation Functions Storage and recycling of nutrients
Storage and recycling of human waste
Storage and recycling of organic waste
Groundwater recharge
Groundwater discharge
Natural flood control and flow regulation
Erosion control
Salinity control
Water treatment
Climatic stabilization
Carbon sequestration
Maintenance of migration and nursery habitats
Maintenance of ecosystem stability
Maintenance of integrity of other ecosystems
Maintenance of biological and genetic diversity
Carrier Functions Agriculture, irrigation
Stock farming (grazing)
Wildlife cropping/resources
Transport
Energy production
Tourism and recreation
Human habitation and settlements
Habitat and nursery for plant and animal species
Production Functions Water
Food
Fuel wood
Medicinal resources
Genetic resources
Raw materials for building, construction andindustrial use
Information Functions Research, education and monitoring
Uniqueness, rarity or naturalness and role incultural heritage
8 9
Functions and Valuesof WetlandsThe classification of wetlands made in the
previous section emphasizes the immense
diversity of wetlands. At the same time,
wetlands also perform an enormous variety
of functions [5]. First, wetlands perform
regulation functions - wetlands regulate
ecological processes that contribute to a
healthy environment. Examples are recycling
of nutrients and human waste, watershed
protection and climate regulation. A second
function of wetlands is called carrier
function: wetlands provide space for
activities such as human settlement,
cultivation, energy production and habitat
for animals. Third, wetlands perform
production functions. Wetlands provide
resources for people such as food, water,
raw materials for building and clothing. The
last wetland function is information function
in the sense that wetlands contribute to
mental health by providing scientific,
aesthetic and spiritual information. Box
1 provides a list of key wetland functions.
The diversity in functions that wetlands
perform makes them incredibly valuable
ecosystems. For example, they have a
very high ecological value, providing
the water and primary productivity upon
which countless species of plants and
animals depend. Wetlands support high
concentrations of birds, mammals, reptiles,
amphibians, fish and invertebrate species.
It has been estimated that freshwater
wetlands hold more than 40% of all the
world’s species and 12% of all animal
species [6]. Individual wetlands can be
extremely important in supporting high
numbers of endemic species; for example,
Lake Tanganyika in Central Africa supports
632 endemic animal species [6].

3See The Cultural Heritage of
Wetlands information pack available
from the Ramsar Bureau for more
information on socio-cultural values
of wetlands.
Lastly, wetlands also provide populations
with numerous goods and services that have
a significant economic value, not only to
the local population living in its periphery
but also to communities living outside the
wetland area. Examples of valuable wetland
goods are fish, reeds and papyrus, birds
and wild animals and fresh water. The staple
diet of 3 billion people, half the world’s
population, is rice, which grows in wetlands
in many parts of the world. In addition,
wetlands provide a nursery habitat for many
commercially important fish species that
are harvested outside the wetland. Important
wetland services include the provision of
recreational opportunities and amenities,
nutrient recycling, storm protection and
flood control. For example, New York City
found that it could avoid spending $3-8
billion on new waste water treatment plants
by investing $1.5 billion in buying land
around the reservoirs upstate as well as
instituting other protective measures to
protect the watershed that will do the job
of purifying the water supply for free [31].
This constitutes a significant amount of
money saved.
Many wetlands also have an important
socio-cultural value. Although this value
is still relatively unexplored, it is known that
wetlands have religious and historical values
for many local communities. For example,
in Australia many wetlands have a
cultural value to their Aboriginal owners,
in which they conduct ceremonies and
semi-traditional hunting and gathering.
In other parts of the world, wetlands are
used to conduct initiation rites and in Hong
Kong the Mai Poi marshes are the only place
where residents can watch traditional
methods of shrimp cultivation. Certain
studies have shown that more than 30%
of 603 Ramsar wetland sites examined had
archaeological, historical, cultural, religious,
mythical or artistic/creative significance3 [6].
Above: A worker carrying harvestedreeds which are used in paperproduction in China.
EconEconomic ValuesEconomic values are usually distinguished
as use and non-use values [7]. Economic
use values of wetlands comprise the direct
use of a wetland’s goods, such as the
consumption of fish for food, trees for
fuel wood or as a building material, and
water for drinking, cooking and washing.
Use values also include the indirect use
of a wetland’s services, such as water
retention capacity (including man-made
for irrigation or energy production) and
nutrient recycling. Lastly, option value
can be distinguished as a use value -
this is defined as the value of a wetland
to humans to preserve an environment
as a potential benefit for themselves in
the future. For example, some people would
be willing to pay for the conservation of a
tropical rainforest as a potential source of
medicine against diseases like cancer and
AIDS. The non-use value of a wetland refers
to the non-instrumental value, not associated
with use. This includes existence value -
a recognition of the value of the very
existence of wetlands. For example,
some people may have sympathy with
or concern for the welfare of certain animals
- a desire that certain species should exist.
These people would then be willing to pay
for the conservation of this species. The
appendix briefly discusses the process of
economic valuation.
The remainder of this section will illustrate
economic values of wetlands with selected
case studies in which such values have
been measured in different continents in
the world. It should be kept in mind that
in every valuation study the economic values
presented are not necessarily absolute
values, but dependent on contextual factors
of both the wetland area (population
densities, income levels, etc.) and the study
itself (such as the valuation method applied,
availability of information, the time and
budget constraints imposed on such studies
and so on). These factors may cause
economic values between wetlands to
diverge in addition to the difference in
absolute wetland economic value. It must
also be noted that economic values in certain
wetlands may be based on full utilization
of the wetland economic potential, while
economic values of other wetlands are not.
For example, tourism development in certain
wetlands may be currently under-exploited
and therefore not reflected in their economic
value. Therefore, the economic values in the
following cases (as most economic values)
should be viewed as orders of magnitude.
Furthermore, it must again be stressed that
economic value is only a fraction of total
wetland value, which also comprises
biodiversity, scientific, climate regulation,
socio-cultural and other important wetland
values, as was discussed at the beginning
of this section. While certain wetlands may
appear to have low economic values in
comparison to others (see for example
the Pantanal below in comparison to
the Charles River basin wetlands), it must
be kept in mind that such wetlands may
have enormous ecological values and
socio-cultural values (such as the
Pantanal)4. Hence, conservation and
sustainable management of wetlands
should be based on total wetland value
and not economic value alone.
4It must also be noted that wetlands
such as the Pantanal and many others
attract funding from bilateral and
multilateral donors for conservation
and community based natural
resource management projects. This
constitutes a ‘willingness-to-pay’ by
the international community for the
conservation and sustainable
management of wetlands, implying
considerable economic value. These
type of figures are, however, not
included in the estimates in the
examples in this section.
10 11
©W
WF-
Can
on/E
dw
ard
PA
RK
ER

omicEconomic Value of the LakeChilwa Wetland, Malawi [9]
The Lake Chilwa wetland has an area of
2,400 km2 and is situated in the south of
Malawi, on the border with Mozambique.
It is one of the most productive lakes in
Africa - it produces more than 20% of
all fish caught in Malawi. It is also a very
important area for breeding waterfowl and
for agricultural activities.
The two major threats facing the Lake Chilwa
wetland are a reduction in lake level due
to abstraction within the catchment and
degradation of the catchment. Over-trapping
and shooting of resident and migratory birds
is also a major problem. Potential threats
for the future include population increase,
soil erosion and siltation, destruction of
breeding grounds and sanctuaries for fish,
increased use of agro-chemicals affecting
the aquatic environment and invasion by
exotic plant species.
The economic values of the Lake Chilwa
wetland’s goods and services and its total
economic value are shown in Table 2.
Table 2:Economic Values of the Lake Chilwa Wetland,Malawi
Wetland Good Economic Value per Yearor Service (converted to 2002 US$)
Agricultural grounds 1,293,802
Fish 18,675,478
Vegetation 13,457
Open water 435,668
Grasslands 637,987
TOTAL ECONOMIC VALUE 21,056,392
Economic Value of the Pantanal,Brazil [8]
The Pantanal in Brazil is the world’s largest
freshwater wetland - a 138,000 km2 tropical
seasonal wetland in the centre of South
America. It is divided into eleven sub-regions,
and this study focuses on the largest of
these - Nhecolandia (19.5% of the region).
It is of immense biological significance and
was recently designated a United Nations
World Heritage site.
The economic values of the enormous
variety of the Pantanal’s goods and services
as well as its total economic value is
presented in Table 1.
Table 1:Economic Value of the Pantanal Wetland, Brazil
Ecosystem Service Economic Value per year(millions, 1994 US$)
Gas regulation 181.31
Climate regulation 120.50
Disturbance regulation 4,703.61
Water regulation 1,019.82
Water supply 5,322.58
Erosion control 170.70
Soil formation 60.22
Nutrient recycling 498.21
Waste treatment 1,359.64
Pollination 33.03
Biological control 30.39
Habitat/refugia 285.04
Food production 143.76
Raw materials 202.03
Genetic resources 22.15
Recreation 423.64
Cultural 1,144.49
TOTAL ECONOMIC VALUE 15,644.09
©W
WF-
Can
on/B
runo
Pam
bou
r
value
12 13
Economic Value of theMuthurajawela Wetland,Sri Lanka [10]
The Muthurajawela Marsh covers an
area of 3,068 hectares, and is located
near Colombo, the capital of Sri Lanka.
It forms a coastal wetland together with
the Negombo Lagoon. It is rich in biodiversity
and in 1996 part of the wetland was declared
a Wetland Sanctuary. The pressures facing
the Muthurajawela wetland are growing.
Major threats are urban, residential,
recreational, agricultural and industrial
developments; over-harvesting of wetland
species; and pollution from industrial and
domestic wastes. As a result, the wetland
has been seriously degraded.
The economic values and total economic
value of the Muthurajawela wetland are
illustrated in Table 3.
Table 3:Economic Value of the Muthurajawela Wetland,Sri Lanka
Economic Benefit Economic Value per year(converted to 2003 US$)
Flood attenuation 5,033,800
Industrial wastewater treatment 1,682,841
Agricultural production 314,049
Support to downstream fisheries 207,361
Firewood 82,530
Fishing 64,904
Leisure and recreation 54,743
Domestic sewage treatment 44,790
Freshwater supplies for local populations 39,191
Carbon sequestration 8,087
TOTAL ECONOMIC VALUE 7,532,297
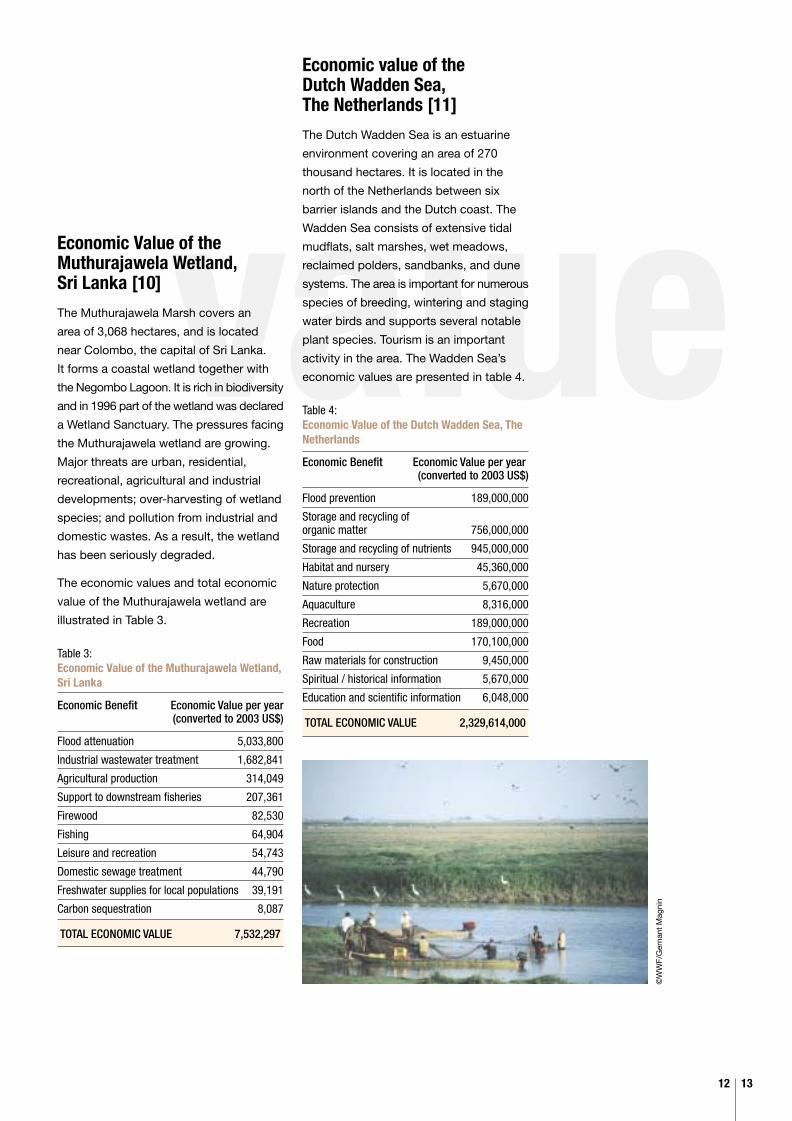
Economic value of the Dutch Wadden Sea, The Netherlands [11]
The Dutch Wadden Sea is an estuarine
environment covering an area of 270
thousand hectares. It is located in the
north of the Netherlands between six
barrier islands and the Dutch coast. The
Wadden Sea consists of extensive tidal
mudflats, salt marshes, wet meadows,
reclaimed polders, sandbanks, and dune
systems. The area is important for numerous
species of breeding, wintering and staging
water birds and supports several notable
plant species. Tourism is an important
activity in the area. The Wadden Sea’s
economic values are presented in table 4.
Table 4:Economic Value of the Dutch Wadden Sea, TheNetherlands
Economic Benefit Economic Value per year (converted to 2003 US$)
Flood prevention 189,000,000
Storage and recycling of organic matter 756,000,000
Storage and recycling of nutrients 945,000,000
Habitat and nursery 45,360,000
Nature protection 5,670,000
Aquaculture 8,316,000
Recreation 189,000,000
Food 170,100,000
Raw materials for construction 9,450,000
Spiritual / historical information 5,670,000
Education and scientific information 6,048,000
TOTAL ECONOMIC VALUE 2,329,614,000
©W
WF/
Ger
nant
Mag
nin

Economic value ofWhangamarino wetland, NorthIsland, New Zealand [12]
Whangamarino wetland is the second largest
peat bog and swamp complex on North
Island, New Zealand. It is the most important
breeding area in New Zealand for Botaurus
poiciloptilus (a species of heron) and a
habitat for wintering birds and a diverse
invertebrate fauna. The wetland covers
an area of 10,320 hectares and supports
a commercial fishery, cattle grazing,
recreational activities. Estimated use and
non-use values for Whangamarino are
presented in Table 5.
Table 5:Economic Value of Whangamarino wetland, New Zealand
Economic Benefit Economic Value per year(converted to 2003 US$)
Non-use preservation 7,247,117
Recreation 2,022,720
Commercial fishing 10,518
Flood control 601,037
TOTAL 9,881392
Economic value of the CharlesRiver Basin wetlands,Massachusetts, US [13]
The Charles River Basin wetlands in
Massachusetts consist of 3,455 hectares
of freshwater marsh and wooded swamp.
This is 75% of all the wetlands in Boston’s
major watershed. The benefits derived from
these wetlands include flood control, amenity
values, pollution reduction, water supply
and recreational opportunities. Estimates of
economic values derived from these
wetlands are presented in Table 6.
Table 6:Economic Value of Charles River Basin wetlands,Massachusetts, US
Economic Benefit Economic Value per year(converted to 2003 US$)
Flood damage prevention 39,986,788
Amenity value of living close to the wetland 216,463
Pollution reduction 24,634,150
Recreational value: Small gamehunting, waterfowl hunting 23,771,954
Recreational value: Trout fishing,Warm water fishing 6,877,696
TOTAL 95,487,051
Below: Varzea Flooded Forest, atalmost the height of the annualflooding period, is a breeding groundfor more than 200 fish speciesAmazonas, Brazil.
GlobalGlobal Economic ValuesThe previous examples have highlighted the
enormous economic values of individual
wetlands. The economic value of most
wetlands, however, are not known and
therefore not included in decisions regarding
wetland use, conservation or restoration.
This is often at the basis of many threats
facing wetlands. In response to this, there
has been a large research effort to estimate
the economic value of selected wetlands
around the world. Drawing on the results of
a statistical synthesis (or ‘meta-analysis’)
[14] of this available literature, which includes
economic valuation studies of 89 wetland
sites (see Appendix 1 for a list and map of
the 89 wetland sites), we are able to initially
examine the global economic value of
wetlands (see Appendix 2 for a brief
summary of the meta-analysis).
The estimates provided in this section
highlight the economic values of global
wetlands and further substantiate the need
for more sustainable management of these
wetlands. The values illustrate how much
wetlands can be worth economically and
represent initial estimates of costs to society
if these wetlands are lost. Although many
of the threats facing global wetlands are
rooted in poverty and high demographic
growth rates, it is often the case that
decision-makers either neglect or
underestimate the values of conserving
wetlands as opposed to the allocation of
wetland areas and water to other purposes.
The types of economic values estimated in
this section can provide powerful arguments
to these decision-makers and show how
conservation and wise use of wetlands is
in the economic interest not only of local
populations dependent on these wetlands
for their livelihoods but of society as a whole.
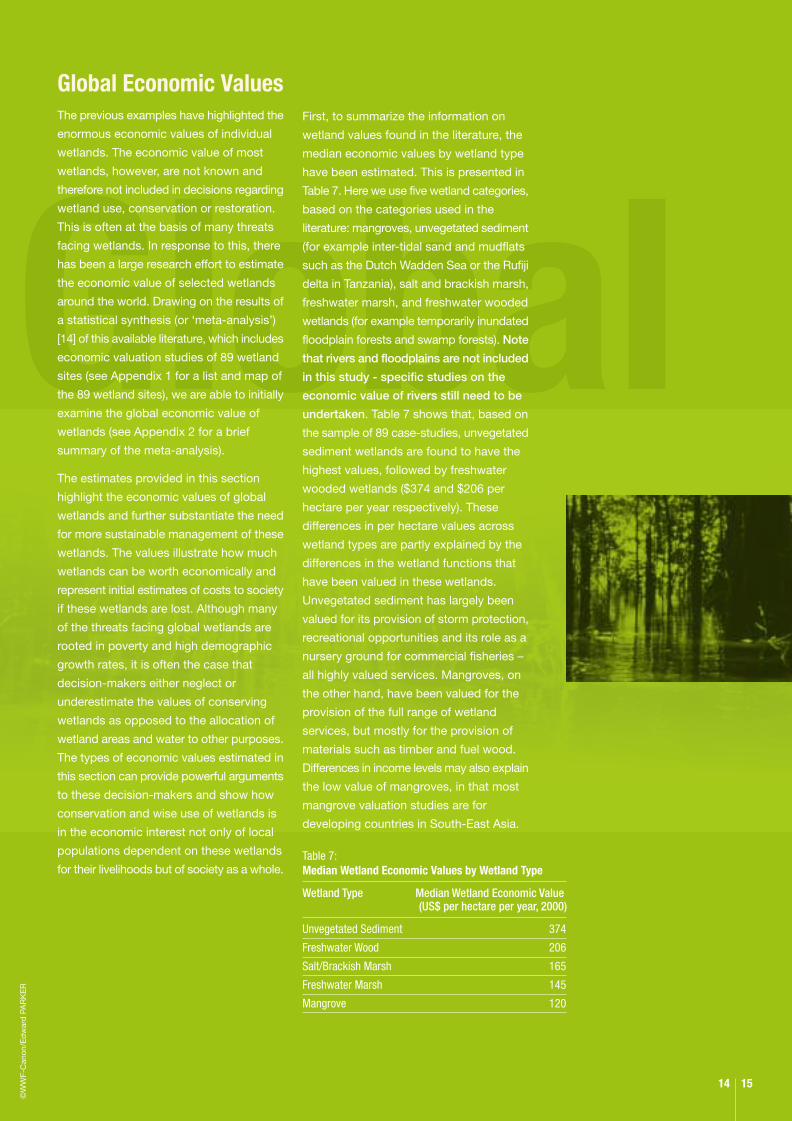
First, to summarize the information on
wetland values found in the literature, the
median economic values by wetland type
have been estimated. This is presented in
Table 7. Here we use five wetland categories,
based on the categories used in the
literature: mangroves, unvegetated sediment
(for example inter-tidal sand and mudflats
such as the Dutch Wadden Sea or the Rufiji
delta in Tanzania), salt and brackish marsh,
freshwater marsh, and freshwater wooded
wetlands (for example temporarily inundated
floodplain forests and swamp forests). Note
that rivers and floodplains are not included
in this study - specific studies on the
economic value of rivers still need to be
undertaken. Table 7 shows that, based on
the sample of 89 case-studies, unvegetated
sediment wetlands are found to have the
highest values, followed by freshwater
wooded wetlands ($374 and $206 per
hectare per year respectively). These
differences in per hectare values across
wetland types are partly explained by the
differences in the wetland functions that
have been valued in these wetlands.
Unvegetated sediment has largely been
valued for its provision of storm protection,
recreational opportunities and its role as a
nursery ground for commercial fisheries –
all highly valued services. Mangroves, on
the other hand, have been valued for the
provision of the full range of wetland
services, but mostly for the provision of
materials such as timber and fuel wood.
Differences in income levels may also explain
the low value of mangroves, in that most
mangrove valuation studies are for
developing countries in South-East Asia.
©W
WF-
Can
on/E
dw
ard
PA
RK
ER
14 15
Table 7:Median Wetland Economic Values by Wetland Type
Wetland Type Median Wetland Economic Value(US$ per hectare per year, 2000)
Unvegetated Sediment 374
Freshwater Wood 206
Salt/Brackish Marsh 165
Freshwater Marsh 145
Mangrove 120
Econom
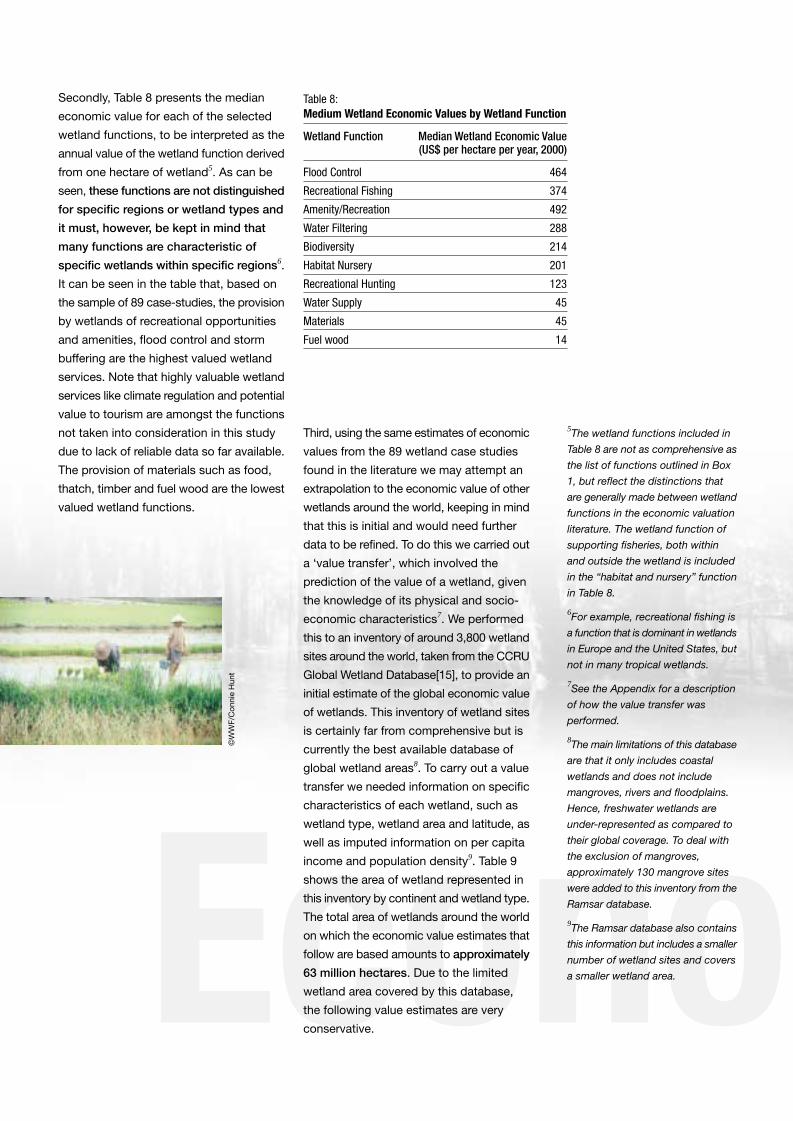
Third, using the same estimates of economic
values from the 89 wetland case studies
found in the literature we may attempt an
extrapolation to the economic value of other
wetlands around the world, keeping in mind
that this is initial and would need further
data to be refined. To do this we carried out
a ‘value transfer’, which involved the
prediction of the value of a wetland, given
the knowledge of its physical and socio-
economic characteristics7. We performed
this to an inventory of around 3,800 wetland
sites around the world, taken from the CCRU
Global Wetland Database[15], to provide an
initial estimate of the global economic value
of wetlands. This inventory of wetland sites
is certainly far from comprehensive but is
currently the best available database of
global wetland areas8. To carry out a value
transfer we needed information on specific
characteristics of each wetland, such as
wetland type, wetland area and latitude, as
well as imputed information on per capita
income and population density9. Table 9
shows the area of wetland represented in
this inventory by continent and wetland type.
The total area of wetlands around the world
on which the economic value estimates that
follow are based amounts to approximately
63 million hectares. Due to the limited
wetland area covered by this database,
the following value estimates are very
conservative.
Table 8:Medium Wetland Economic Values by Wetland Function
Wetland Function Median Wetland Economic Value(US$ per hectare per year, 2000)
Flood Control 464
Recreational Fishing 374
Amenity/Recreation 492
Water Filtering 288
Biodiversity 214
Habitat Nursery 201
Recreational Hunting 123
Water Supply 45
Materials 45
Fuel wood 14
5The wetland functions included in
Table 8 are not as comprehensive as
the list of functions outlined in Box
1, but reflect the distinctions that
are generally made between wetland
functions in the economic valuation
literature. The wetland function of
supporting fisheries, both within
and outside the wetland is included
in the “habitat and nursery” function
in Table 8.
6For example, recreational fishing is
a function that is dominant in wetlands
in Europe and the United States, but
not in many tropical wetlands.
7See the Appendix for a description
of how the value transfer was
performed.
8The main limitations of this database
are that it only includes coastal
wetlands and does not include
mangroves, rivers and floodplains.
Hence, freshwater wetlands are
under-represented as compared to
their global coverage. To deal with
the exclusion of mangroves,
approximately 130 mangrove sites
were added to this inventory from the
Ramsar database.
9The Ramsar database also contains
this information but includes a smaller
number of wetland sites and covers
a smaller wetland area.
Secondly, Table 8 presents the median
economic value for each of the selected
wetland functions, to be interpreted as the
annual value of the wetland function derived
from one hectare of wetland5. As can be
seen, these functions are not distinguished
for specific regions or wetland types and
it must, however, be kept in mind that
many functions are characteristic of
specific wetlands within specific regions6.
It can be seen in the table that, based on
the sample of 89 case-studies, the provision
by wetlands of recreational opportunities
and amenities, flood control and storm
buffering are the highest valued wetland
services. Note that highly valuable wetland
services like climate regulation and potential
value to tourism are amongst the functions
not taken into consideration in this study
due to lack of reliable data so far available.
The provision of materials such as food,
thatch, timber and fuel wood are the lowest
valued wetland functions.
©W
WF/
Con
nie
Hun
t
omic
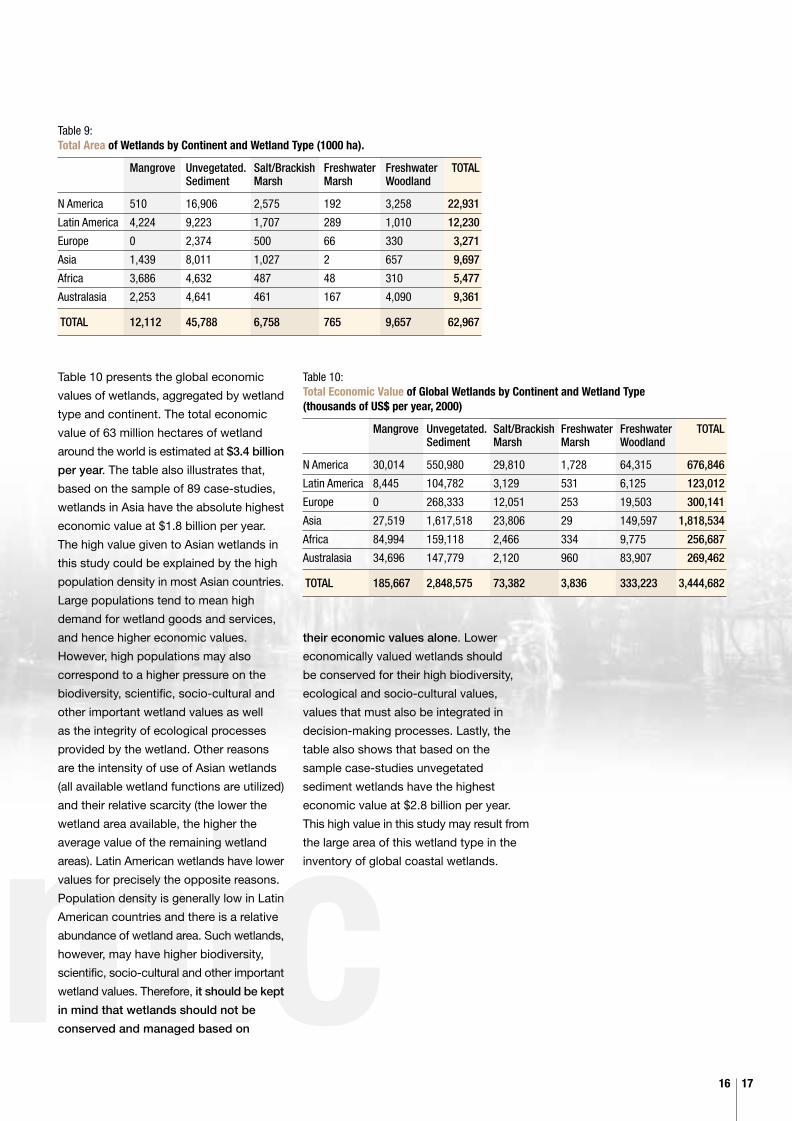
Table 10 presents the global economic
values of wetlands, aggregated by wetland
type and continent. The total economic
value of 63 million hectares of wetland
around the world is estimated at $3.4 billion
per year. The table also illustrates that,
based on the sample of 89 case-studies,
wetlands in Asia have the absolute highest
economic value at $1.8 billion per year.
The high value given to Asian wetlands in
this study could be explained by the high
population density in most Asian countries.
Large populations tend to mean high
demand for wetland goods and services,
and hence higher economic values.
However, high populations may also
correspond to a higher pressure on the
biodiversity, scientific, socio-cultural and
other important wetland values as well
as the integrity of ecological processes
provided by the wetland. Other reasons
are the intensity of use of Asian wetlands
(all available wetland functions are utilized)
and their relative scarcity (the lower the
wetland area available, the higher the
average value of the remaining wetland
areas). Latin American wetlands have lower
values for precisely the opposite reasons.
Population density is generally low in Latin
American countries and there is a relative
abundance of wetland area. Such wetlands,
however, may have higher biodiversity,
scientific, socio-cultural and other important
wetland values. Therefore, it should be kept
in mind that wetlands should not be
conserved and managed based on
their economic values alone. Lower
economically valued wetlands should
be conserved for their high biodiversity,
ecological and socio-cultural values,
values that must also be integrated in
decision-making processes. Lastly, the
table also shows that based on the
sample case-studies unvegetated
sediment wetlands have the highest
economic value at $2.8 billion per year.
This high value in this study may result from
the large area of this wetland type in the
inventory of global coastal wetlands.
Table 9:Total Area of Wetlands by Continent and Wetland Type (1000 ha).
Mangrove Unvegetated. Salt/Brackish Freshwater Freshwater TOTALSediment Marsh Marsh Woodland
N America 510 16,906 2,575 192 3,258 22,931
Latin America 4,224 9,223 1,707 289 1,010 12,230
Europe 0 2,374 500 66 330 3,271
Asia 1,439 8,011 1,027 2 657 9,697
Africa 3,686 4,632 487 48 310 5,477
Australasia 2,253 4,641 461 167 4,090 9,361
TOTAL 12,112 45,788 6,758 765 9,657 62,967
Table 10:Total Economic Value of Global Wetlands by Continent and Wetland Type(thousands of US$ per year, 2000)
Mangrove Unvegetated. Salt/Brackish Freshwater Freshwater TOTALSediment Marsh Marsh Woodland
N America 30,014 550,980 29,810 1,728 64,315 676,846
Latin America 8,445 104,782 3,129 531 6,125 123,012
Europe 0 268,333 12,051 253 19,503 300,141
Asia 27,519 1,617,518 23,806 29 149,597 1,818,534
Africa 84,994 159,118 2,466 334 9,775 256,687
Australasia 34,696 147,779 2,120 960 83,907 269,462
TOTAL 185,667 2,848,575 73,382 3,836 333,223 3,444,682
16 17
The total economic value of wetlands
illustrated in table 10 is a very conservative
estimate. There are several reasons for this.
The first reason is that many functions of
wetlands were not included simply because
they were not valued in the economic
valuation studies collected. Comparing
Table 8, for example, with Box 1 shows
that wetland functions such as water
supply (extractive use by industry),
erosion control, climatic stabilization,
carbon sequestration, maintenance of
ecosystem stability, medicinal resources
and genetic resources were not included in
this economic valuation study, while values
used were for flood control, recreational
fishing, amenity/recreation, water filtering,
biodiversity, habitat nursery, recreational
hunting, water supply (agriculture), materials,
and fuel wood.
The second reason for the very conservative
estimate of global wetlands is that the total
area of wetlands valued amounts to only 63
million hectares. It was discussed above
why this limited area was used. The actual
global total wetland area is much larger.
One study ([28]) predicts the total area
of global wetlands to be 12.8 million km2
(or 1,280 million hectares), but also found
that global wetland inventories were
incomplete and unreliable. Another study
[29] estimates the total area of the world’s
wetlands to be around 8-10 million km2
(or 800-1,000 million hectares). These
areas amount to thirteen to twenty times
the area that we were able to use for the
value transfer to derive the $3.4 billion
figure. Assuming that the wetland inventory
that we used for the value transfer is a
representative sub-set of global wetlands
we are able to scale up the $3.4 billion
estimate to provide a rough extrapolation
of the magnitude of global wetland economic
value. If we take the estimate cited by
Ramsar of global wetland area at 12.8
million km2, the total economic value
of the world’s wetlands based on the
functions examined in this report and
therefore not all functions could be around
$70 billion per year. The numbers presented
in this section should be interpreted as order
of magnitude of economic value, based on
a snapshot of available data on wetland
areas and case studies of wetland economic
values, and could be enhanced as more
data becomes available.
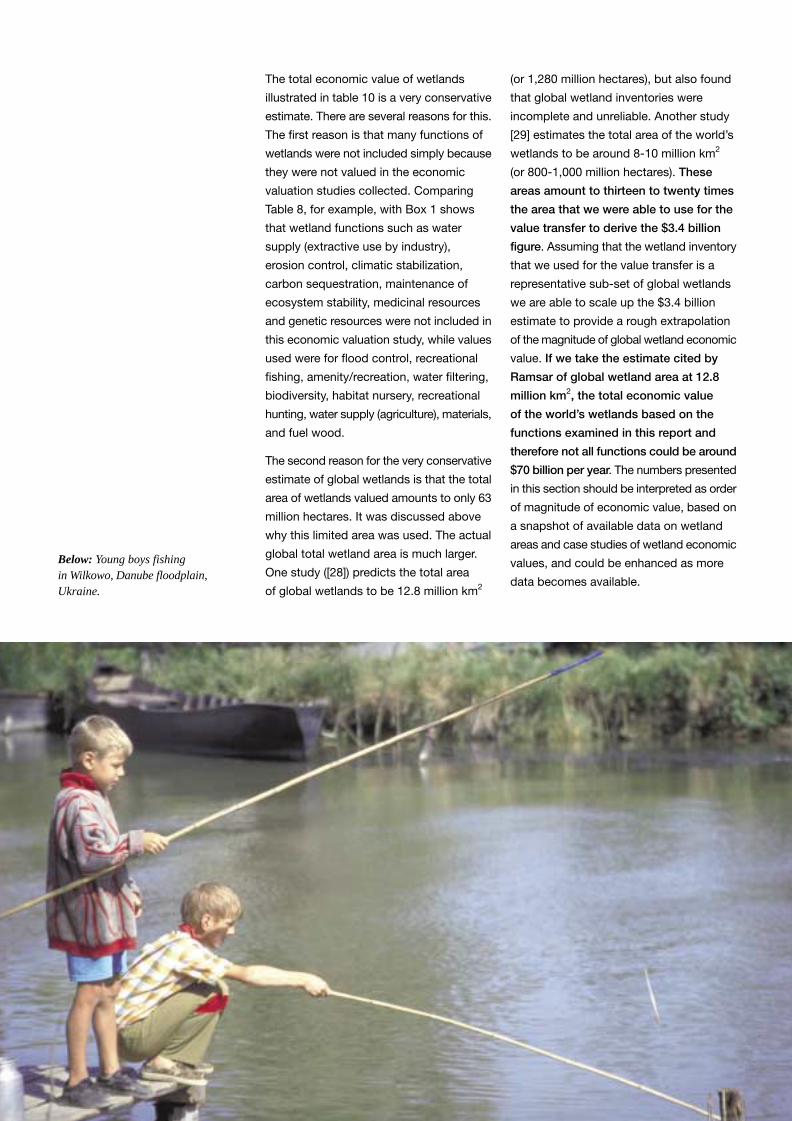
Below: Young boys fishingin Wilkowo, Danube floodplain,Ukraine.
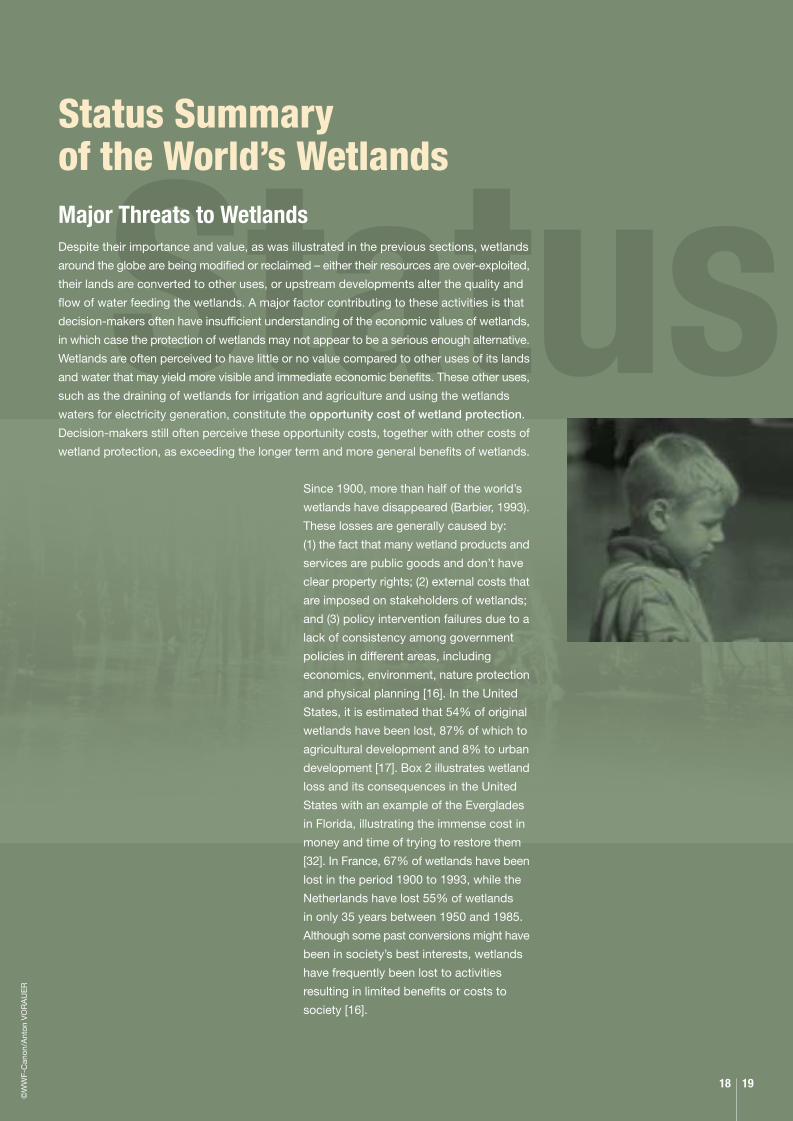
StatusMajor Threats to WetlandsDespite their importance and value, as was illustrated in the previous sections, wetlands
around the globe are being modified or reclaimed – either their resources are over-exploited,
their lands are converted to other uses, or upstream developments alter the quality and
flow of water feeding the wetlands. A major factor contributing to these activities is that
decision-makers often have insufficient understanding of the economic values of wetlands,
in which case the protection of wetlands may not appear to be a serious enough alternative.
Wetlands are often perceived to have little or no value compared to other uses of its lands
and water that may yield more visible and immediate economic benefits. These other uses,
such as the draining of wetlands for irrigation and agriculture and using the wetlands
waters for electricity generation, constitute the opportunity cost of wetland protection.
Decision-makers still often perceive these opportunity costs, together with other costs of
wetland protection, as exceeding the longer term and more general benefits of wetlands.
Status Summaryof the World’s Wetlands
©W
WF-
Can
on/A
nton
VO
RA
UE
R
Since 1900, more than half of the world’s
wetlands have disappeared (Barbier, 1993).
These losses are generally caused by:
(1) the fact that many wetland products and
services are public goods and don’t have
clear property rights; (2) external costs that
are imposed on stakeholders of wetlands;
and (3) policy intervention failures due to a
lack of consistency among government
policies in different areas, including
economics, environment, nature protection
and physical planning [16]. In the United
States, it is estimated that 54% of original
wetlands have been lost, 87% of which to
agricultural development and 8% to urban
development [17]. Box 2 illustrates wetland
loss and its consequences in the United
States with an example of the Everglades
in Florida, illustrating the immense cost in
money and time of trying to restore them
[32]. In France, 67% of wetlands have been
lost in the period 1900 to 1993, while the
Netherlands have lost 55% of wetlands
in only 35 years between 1950 and 1985.
Although some past conversions might have
been in society’s best interests, wetlands
have frequently been lost to activities
resulting in limited benefits or costs to
society [16].
18 19
Loss
At the root of these wetland conversions
is the fact that numerous stakeholders of
wetlands with different interests lay claims
on the wetlands’ functions that don’t always
coincide. Although every wetland will have
a different set of stakeholders, a total of
nine different groups of stakeholders have
previously been identified across wetlands
(see Box 3). In many cases, it is likely that
the different interests of these stakeholders
result in conflicts, so that policy-makers are
faced with complex trade-offs.
Box 2:Loss of the Everglades
The dramatic increase in human population together with its associated development
has greatly stressed the Everglades in the state of Florida in the United States. Half
the original wetlands are gone, and the remaining habitats are altered and dissected
by canals, roads, and other man-made features. Urban storm water and agricultural
practices have polluted Lake Okeechobee and disrupted the ecological balance of
nutrients in wetlands to the South. Some key losses to the Everglades ecosystem are:
• 50% reduction in area of the Everglades;
• 90-95% decrease in wading bird populations;
• 68 threatened or endangered species;
• 2,467 million m3 of water lost from the system through discharge and unnaturalseepage annually;
• increased unnatural discharges of freshwater have damaged coastal estuaries;
• the incidence of coral diseases has increased 10-fold since 1980;
• 4,047 million m2 of the system under health advisories from mercury contamination;
• phosphorus contamination of Lake Okeechobee, the Everglades,and surrounding wetlands;
• the rampant spread of invasive exotic species and the displacement of native species;
Rapid population increase, development, and urban sprawl along the state’s coastal
areas have stressed the human environment around the Everglades. Agricultural
areas face related problems stemming from growth and urban sprawl. It is expected
that by 2050, South Florida’s population will increase threefold, from 5 million to
15 million. This will result in an increased demand for roads, utilities, and services
in response to outward growth of suburbs, and overly stressed infrastructures.
Similarly, high population growth rates will result in greater unemployment, lower
income and education levels, and a high prevalence of poverty in urban cores. Key
losses to the human environment in the Everglades include:
• 16% reduction in agricultural lands;
• high numbers of sites contaminated by hazardous materials (brownfields);
• repetitive water shortages and salt water intrusion;
A restoration plan for the Everglades is underway, called the Comprehensive
Everglades Restoration Plan (CERP). The estimated costs are $7.8 billion, split
between the Federal Government and the State of Florida. Over the next 38 years,
engineers and ecologist will attempt to repair the damage caused by a century’s
worth of drainage and redirect water lost to tide back into the Everglades, requiring
a delicate balancing between demands for water supply and flood protection on one
hand and ecological restoration on the other.
Source: Working group of the South Florida Ecosystem Restoration Task Force, 1998
©W
WF-
Can
on/M
iche
l GU
NTH
ER

Box 3:Stakeholders of Wetlands
Direct extensive users directly harvest wetland goods in a sustainable way.
Direct intensive users have access to new technologies that allows to
harvest more intensively.
Direct exploiters dredge sediments in the wetland, or exploit mineral
resources, clay, peat and sand without a direct
concern for the health of the environment.
Agricultural producers drain and convert wetlands to agricultural land.
Water abstractors use wetlands as sources of drinking water,
agricultural irrigation, flow augmentation,
and so on.
Human settlements wetlands as sites for human settlement expansions.
close to wetlands
Indirect users benefit from indirect wetland services, such as storm
abatement and flood mitigation.
Nature conservation groups whose objective is to conserve nature and
and amenity groups groups who enjoy the presence of plant and
animal species.
Non-users users that may attribute an intrinsic value
to wetlands.
Turner et. al. (2000) [16]
Water management in wetlands has often
been oriented solely towards the needs of
people, such as transportation, agriculture,
flood control and settlement. Instead of an
integrated approach towards management
of freshwater ecosystem and resources,
known as the ‘ecosystem approach (see
COP 8, Doc 32) in which the ecosystem
and its different stakeholders play a key
role, wetlands have been transformed by
a wide variety of human uses. In this respect,
several engineering techniques have been
applied [4]. First of all, for the purpose of
embankment and water retention, man may
Below: Stall specialised in the sale offreshwater Crayfish. Beijing, China.
20 21
Pros
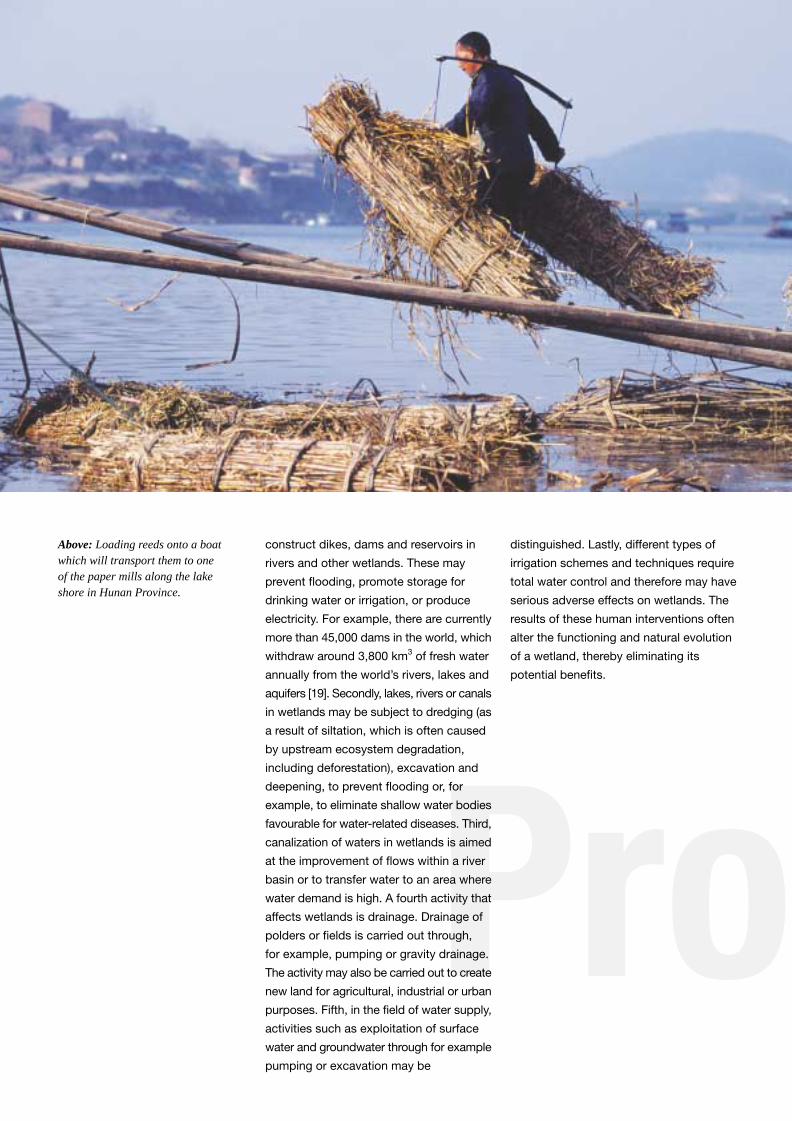
construct dikes, dams and reservoirs in
rivers and other wetlands. These may
prevent flooding, promote storage for
drinking water or irrigation, or produce
electricity. For example, there are currently
more than 45,000 dams in the world, which
withdraw around 3,800 km3 of fresh water
annually from the world’s rivers, lakes and
aquifers [19]. Secondly, lakes, rivers or canals
in wetlands may be subject to dredging (as
a result of siltation, which is often caused
by upstream ecosystem degradation,
including deforestation), excavation and
deepening, to prevent flooding or, for
example, to eliminate shallow water bodies
favourable for water-related diseases. Third,
canalization of waters in wetlands is aimed
at the improvement of flows within a river
basin or to transfer water to an area where
water demand is high. A fourth activity that
affects wetlands is drainage. Drainage of
polders or fields is carried out through,
for example, pumping or gravity drainage.
The activity may also be carried out to create
new land for agricultural, industrial or urban
purposes. Fifth, in the field of water supply,
activities such as exploitation of surface
water and groundwater through for example
pumping or excavation may be
distinguished. Lastly, different types of
irrigation schemes and techniques require
total water control and therefore may have
serious adverse effects on wetlands. The
results of these human interventions often
alter the functioning and natural evolution
of a wetland, thereby eliminating its
potential benefits.
Above: Loading reeds onto a boatwhich will transport them to oneof the paper mills along the lakeshore in Hunan Province.

ospects
©W
WF-
Can
on/E
dw
ard
PA
RK
ER
22 23
terms. However, there is an increasing trend
towards restoration of wetlands, including
decanalization of rivers, rehabilitation of
degraded floodplains, decommissioning of
dams and so on, especially in industrialized
countries. Several countries are now
investing huge sums of money in the
restoration of wetlands they had first spent
tens or even hundreds of millions of dollars
on to reclaim or canalize. In the Rhine river
basin, for example, $1.8 billion is being
invested as part of the ‘Room for the Rhine
Project’ for the period 2015-2050, a project
aimed at managing floods by bringing back
the ecological functions of the Rhine delta
(reserving retention areas and giving the
river more space for natural flooding on the
sides) [21]. Such investments of restoring
wetlands are huge long-term costs of
wetland loss and rarely produce a perfectly
re-established ecosystem with ecological
processes comparable to the original or
natural ones.
Current Situation,Future Prospects andthe Importance of theRamsar ConventionIn the previous section, it was explained
how pressures on wetlands have principally
been economic or financial. Apparent
benefits received from activities that alter
or injure the status of wetlands seemed to
have overshadowed the economic benefits
of the protection of wetlands. A major factor
contributing to these activities is that the
perspective towards the environment in
this time period was still one of unlimited
exploitation for human needs. Since then,
our knowledge and information about the
environment, about the effects of human
actions on the environment and about
ecological relationships have improved.
This has led to changing perspectives
on the relationship between people and
the environment in many countries. As a
result, it is increasingly being recognized
that humans depend on ecosystems for
their survival.
In Africa, as in many developing countries,
common factors that put further increasing
pressures on wetlands are poverty in
combination with high population growth
rates [20]. Poverty results in situations where
a wetland’s resources may be the only
source for survival for communities in
terms of food, water and shelter. Since
most wetlands’ resources are often
common-property, overpopulation results
in over-utilization of these wetland goods
and services. Such stresses are often
compounded by drought. Wetland loss
in these countries is furthermore often
increased by the disparity between those
who make decisions about the allocation of
a wetland’s land and water on the one hand,
and those that depend on the wetland’s
goods and services for their livelihoods
on the other hand. For example, decision-
makers can often derive higher profits from
the utilization of water from rivers that feed
wetlands for irrigation or hydropower, while
the costs of these conversions are borne
by large amounts of local communities.
They pay with a decrease in their livelihoods.
The root cause of much wetland
degradation, however, is information
breakdown. This relates to the complexity
and invisibility of relationships among
groundwater, surface water and wetland
vegetation [16], the failure to understand
the consequences of land use, water
management, pollution and infrastructure
on wetlands, and the fact that many wetland
functions do not have a market price and
as such are not recognized as having an
economic value by decision-makers. As a
result, benefits of wetland conversion such
as extensive crop production and power
generation are often perceived to have more
economic benefits than the conservation
and sustainable management of wetlands
themselves. Reasons are that such benefits
often appear in the short term and are readily
available in monetary terms. These benefits,
however, are also costs society must bear
in the form of the loss of important wetland
functions that often appear in the long-term
and are not readily available in monetary
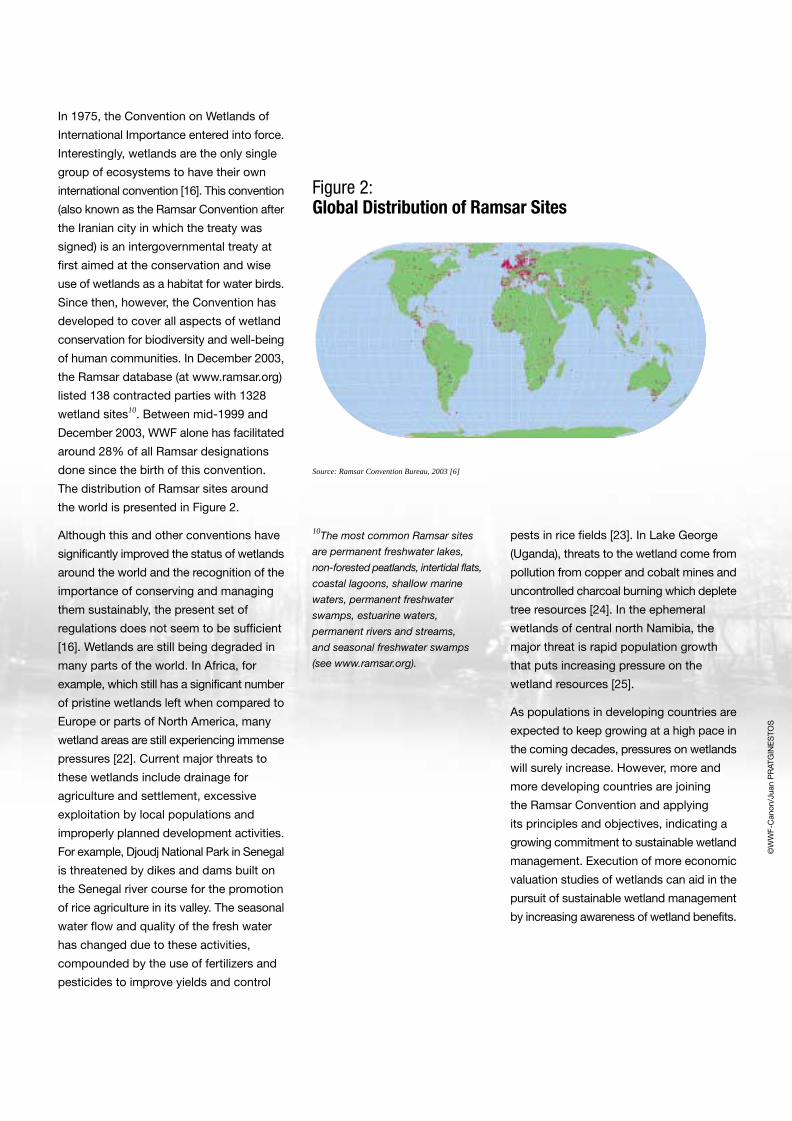
10The most common Ramsar sites
are permanent freshwater lakes,
non-forested peatlands, intertidal flats,
coastal lagoons, shallow marine
waters, permanent freshwater
swamps, estuarine waters,
permanent rivers and streams,
and seasonal freshwater swamps
(see www.ramsar.org).
Figure 2:Global Distribution of Ramsar Sites
Source: Ramsar Convention Bureau, 2003 [6]
©W
WF-
Can
on/J
uan
PR
ATG
INE
STO
S
pests in rice fields [23]. In Lake George
(Uganda), threats to the wetland come from
pollution from copper and cobalt mines and
uncontrolled charcoal burning which deplete
tree resources [24]. In the ephemeral
wetlands of central north Namibia, the
major threat is rapid population growth
that puts increasing pressure on the
wetland resources [25].
As populations in developing countries are
expected to keep growing at a high pace in
the coming decades, pressures on wetlands
will surely increase. However, more and
more developing countries are joining
the Ramsar Convention and applying
its principles and objectives, indicating a
growing commitment to sustainable wetland
management. Execution of more economic
valuation studies of wetlands can aid in the
pursuit of sustainable wetland management
by increasing awareness of wetland benefits.
In 1975, the Convention on Wetlands of
International Importance entered into force.
Interestingly, wetlands are the only single
group of ecosystems to have their own
international convention [16]. This convention
(also known as the Ramsar Convention after
the Iranian city in which the treaty was
signed) is an intergovernmental treaty at
first aimed at the conservation and wise
use of wetlands as a habitat for water birds.
Since then, however, the Convention has
developed to cover all aspects of wetland
conservation for biodiversity and well-being
of human communities. In December 2003,
the Ramsar database (at www.ramsar.org)
listed 138 contracted parties with 1328
wetland sites10. Between mid-1999 and
December 2003, WWF alone has facilitated
around 28% of all Ramsar designations
done since the birth of this convention.
The distribution of Ramsar sites around
the world is presented in Figure 2.
Although this and other conventions have
significantly improved the status of wetlands
around the world and the recognition of the
importance of conserving and managing
them sustainably, the present set of
regulations does not seem to be sufficient
[16]. Wetlands are still being degraded in
many parts of the world. In Africa, for
example, which still has a significant number
of pristine wetlands left when compared to
Europe or parts of North America, many
wetland areas are still experiencing immense
pressures [22]. Current major threats to
these wetlands include drainage for
agriculture and settlement, excessive
exploitation by local populations and
improperly planned development activities.
For example, Djoudj National Park in Senegal
is threatened by dikes and dams built on
the Senegal river course for the promotion
of rice agriculture in its valley. The seasonal
water flow and quality of the fresh water
has changed due to these activities,
compounded by the use of fertilizers and
pesticides to improve yields and control
ConclusInternational conventions have improved
the status of wetlands around the globe -
in December 2003 the International
Convention on Wetlands (Ramsar, 1971)
had 138 Contracting Parties with 1,328
designated “wetlands of international
importance” (also known as “Ramsar sites”),
28% of which were facilitated by WWF since
1999. However, the present set of global
regulations still appear to be too weak -
wetlands are still being degraded in many
parts of the world. The root cause of
much wetland degradation is information
breakdown. Decision-makers often have
insufficient understanding of the economic
values of wetlands, so the protection of
wetlands doesn’t appear to be a serious
enough alternative. Wetlands are often
perceived to have little or no economic
value compared to alternative use of its
lands and water that may yield more visible
and immediate economic benefits. There
is therefore a real need to better and more
widely estimate these economic benefits
and to further highlight the economic and
other values of wetlands to decision-makers.
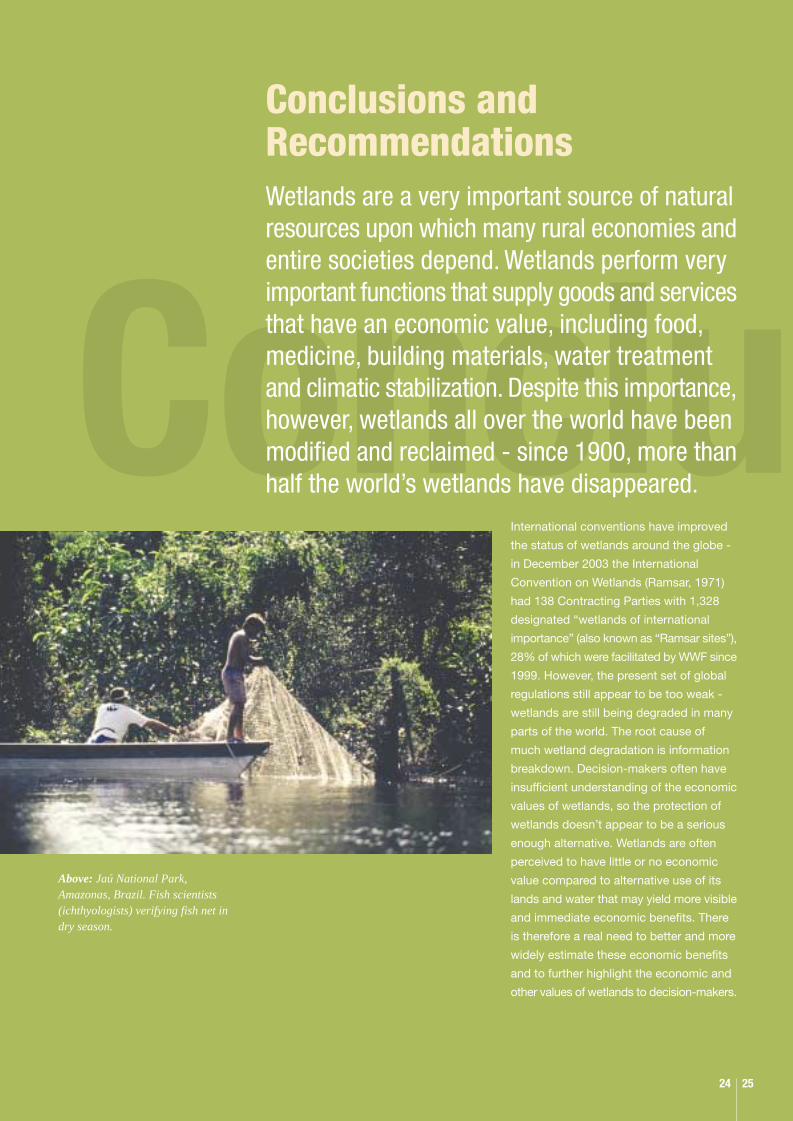
Conclusions andRecommendationsWetlands are a very important source of naturalresources upon which many rural economies andentire societies depend. Wetlands perform veryimportant functions that supply goods and servicesthat have an economic value, including food,medicine, building materials, water treatment and climatic stabilization. Despite this importance,however, wetlands all over the world have beenmodified and reclaimed - since 1900, more thanhalf the world’s wetlands have disappeared.
Above: Jaú National Park,Amazonas, Brazil. Fish scientists(ichthyologists) verifying fish net indry season.
24 25
sionsThis paper has addressed the economic
values of global wetlands. Case studies
of economic values of wetlands in each
continent have been used to illustrate this
economic value. Drawing on the results of
a valuation literature of 89 cases, estimates
have been derived for wetlands globally by
geographical region and by wetland function.
It was shown that, based on the sample
of 89 case studies, unvegetated sediment
wetlands like the Dutch Wadden Sea and
the Rufiji Delta in Tanzania have the highest
economic values at a median economic
value of $374 per hectare per year.
Furthermore, the provision by wetlands
of recreational opportunities and amenities,
and flood control and storm buffering are
the wetland functions with the highest
median economic values at $492 and
$464 per hectare per year respectively.
The economic value of wetlands per
geographical region was also estimated,
which showed that based on the sample of
89 cases, Asian wetlands have the highest
economic values at $1.8 billion per year.
Lastly, an attempt was made at estimating
the economic value of global wetlands,
which showed that $3.4 billion is a very
conservative estimate of this economic
value as the estimate (1) does not include
all wetland functions, and (2) is based on a
sample area that is only a fraction of the
world’s global wetlands (63 million hectares),
currently the most extensive database
available. Applying this estimate to the
global estimate of wetland coverage of earth
at 12.8 million km2, however, easily places
the global wetland economic value at $70
billion per year. The report’s conclusions are
based on a snap-shot of available data on
wetland economic values, and the report’s
conclusions could be enhanced as more
data becomes available.
The estimates derived in this paper illustrate
the magnitude of economic value of
wetlands in addition to their biodiversity,
scientific, ecological, socio-cultural and
other important wetland values. These
estimates can be used to raise awareness
with decision-makers about the economic
benefits of conserving and sustainably
managing wetlands as per the principles
and objectives of the Ramsar Convention
as opposed to their degradation, their
reclamation and eventually the need
for their costly restoration. Rather than
mosquito-invested swamps, wetlands are
highly valuable ecosystems on which large
amounts of populations economically
depend. This message must be conveyed
to decision-makers across the world so that
they may recognize this economic value
and put their efforts in more sustainable
management of the world’s wetlands to the
benefit of society. Efforts should include
the conservation and wise use of wetlands
through designating wetland sites under
the Ramsar Convention; improving wetland
sustainable management (including as an
increasingly important means for poverty
reduction) according to Ramsar objectives;
the development of national wetland
policies; and including the economic
benefits of wetlands, in addition to their
ecological and socio-cultural benefits, in
decision-making processes. At the same
time, the research in this paper has touched
upon another issue, namely the lack of
adequate and comprehensive national
wetland inventories. In order to understand
the range of values of wetlands and for
decision-makers to include these values
in their decision-making processes, efforts
must be directed at such inventories of
wetlands all over the world. Lastly, it is
important that more economic valuation
studies on wetlands be carried out to
improve our knowledge and awareness
of economic values of wetlands, including
a comparative assessment on the cost of
degrading and restoring these ecosystems
and their natural functions.
©W
WF/
A V
OR
AU
ER

References
[1] Stuip, M.A.M., Baker, C.J., Oosterberg,W. (2002) The Socioeconomics of Wetlands,Wetlands International, RIZA[2] IUCN Economics Programme & Waterand Nature Initiative, seewww.iucn.org/themes/wani/v1[3] Costanza, R., d’Arge, R., Groot, R. de,Farber, S., Grasso, M., Hannon, B., Limburg,K., Naeem, S., O’Neill, R.V., Paruelo, J.,Raskin, R.G., Sutton, P., Belt, M. van den(1997) The Value of the World’s EcosystemServices and Natural Capital, Nature,vol. 387, 15 May[4] Roggeri, H. (1995) Tropical FreshwaterWetlands – A Guide to Current Knowledgeand Sustainable Management, KluwerAcademic Publishers[5] Groot, R. S. de (1992) Functions of Nature:Evaluation of Nature in EnvironmentalPlanning, Management and Decision Making,Wolters-Noordhoff, Groningen, TheNetherlands[6] Ramsar, at: www.ramsar.org[7] Turner, R.K., Pearce, D., Bateman, I.(1994) Environmental Economics – an Elementary Introduction, Pearson Education Limited, England[8] Seidl, A.F., Moraes, A.S. (2000) Global Valuation of Ecosystem Services:Application to the Pantanal da Nhecolandia,Brazil, Ecological Economics 33: 1-6[9] Schuijt, K.D., Jansen, J. (1999) Economic Valuation of the Lake ChilwaWetland, Report for the Lake Chilwa Wetlandand Catchment Management Project, Danida[10]Emerton, L., Kekulandala, L.D.C.B.(2003) Assessment of the Economic Valueof Muthurajawela Wetland, OccasionalPerpers of IUCN Sri Lanka No.4[11] Groot, R. de (1992) Functions of Nature:evaluation of nature in environmentalplanning, management and decision making.Wolters-Noordhoff. Groningen[12] Kirkland, W.T. (1988) Preserving theWhangamarino wetland – an application ofthe contingent valuation method, MastersThesis, Massey University, New Zealand[13] Thibodeau, F.R, and Ostro, B.D. (1981)An economic analysis of wetland protection,Journal of Environmental Management, 12, 19-30.
[14] Brander, L., Florax, R. and Vermaat, J.(2003) The empirics of wetland valuation: acomprehensive summary and meta-analysisof the literature, Institute for EnvironmentalStudies working paper W03-30.[15] CCRU (2003) Global wetland databasedeveloped for the DINAS-COAST project[16] Turner,R.K., van den Bergh, J.C.M,Soderqvist, T., Barendregt, A., van derStraaten, J., Maltby, E., van Ierland, E.C.(2000) Ecological-Economic Analysis ofWetlands: Scientific Integration forManagement and Policy, EcologicalEconomics, 35, pp. 7-23[17] Barbier (1993) Barbier, E.B, SustainableUse of Wetlands – Valuing Tropical WetlandBenefits: Economic Methodologies andApplications, The Geographical Journal, vol. 159, no.1[18] Niger Ministry of Environment andHydraulics, 1997, in: UNEP (2000) GlobalEnvironmental Outlook, at: www.unep.org[19] World Commission on Dams (2000)Dams and development - A New frameworkfor Decision-Making[20] Matiza, T., and Chabwela, H.N. (1992)Wetlands Management: A Critical Issue forConservation in Africa, WetlandsConservation Conference for Southern Africa,IUCN, 1992[21] RIZA, “Visions for the Rhine”, Lelystad, Maart 2000[22] Kabii, T. (1996) An Overview of African Wetlands, in: Hails, A.J.,
‘Wetlands, Biodiversity and the RamsarConvention’, Ramsar Convention Bureau[23] Seydina Issa Sylla, and Balde, D. (1996)Djoudj National Bird Park, in: Hails, A.J., ‘Wetlands, Biodiversity and the Ramsar Convention’[24] Mafabi, P. (1996) Lake George in: Hails, A.J., ‘Wetlands, Biodiversity and the Ramsar Convention’[25] Kolberg, H., Griffin, M., Simmons, R.(1996) The Ephemeral Wetlands of CentralNorthern Namibia, in: Hails, A.J., ‘Wetlands,Biodiversity and the Ramsar Convention’[26] Barbier, E.B., Acreman, M., Knowler,D., Economic Valuation of Wetlands - A Guide for Policy Makers and Planners,Ramsar Convention Bureau, Gland,Switzerland, 1997
[27] FAO-UNESCO, Soil Map of the World,Soil Climate Map, USDA-NRCS, SoilSurvey Division, World Soil Resources,Washington D.C. in: US Department ofAgriculture, Natural resources andConservation Services,www.nrcs.usda.gov/technical/worldsoils/mapindex/wetlands.html[28] Ramsar COP8 - DOC. 11 (2002) ClimateChange and Wetlands: Impacts, Adaptationand Mitigation, Wetlands: water, life andculture, 8th Meeting of the Conference ofthe Contracting Parties to the Convention onWetlands, Valencia, Spain, 18-26 November[29] Lehner, B., Doell, O., Generation andValidation of a New Global Database ofLakes, Reservoirs and Wetlands, Journal ofHydrology (accepted October 2003)[30] Schuijt. K.D. (2003) Valuation of Water - the process of economic valuationof ecosystems in water management, PhDThesis, Erasmus University Rotterdam, The Netherlands[31] WWF and the World Bank (2003)Running Pure - The importance of forestprotected areas to drinking water[32] Working Group of the South FloridaEcosystem Restoration Task Force (1998)
References
26 27
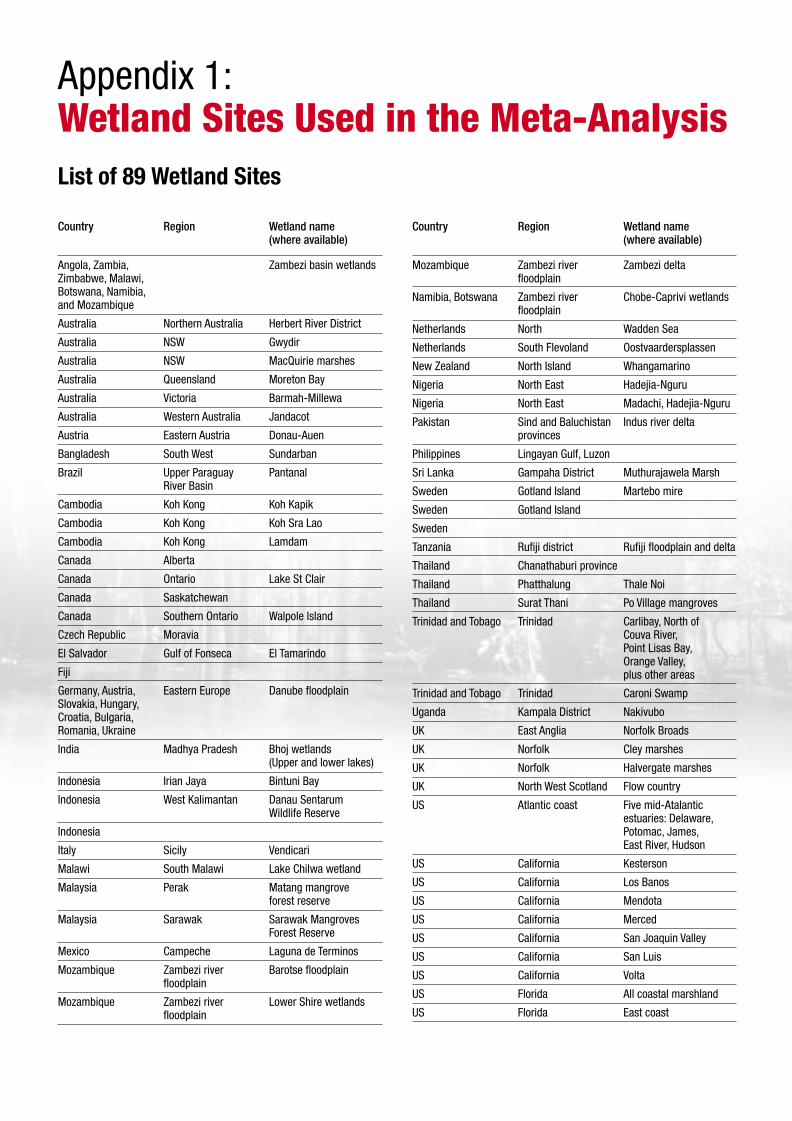
Appendix 1:Wetland Sites Used in the Meta-Analysis
Country Region Wetland name(where available)
Mozambique Zambezi river Zambezi deltafloodplain
Namibia, Botswana Zambezi river Chobe-Caprivi wetlandsfloodplain
Netherlands North Wadden Sea
Netherlands South Flevoland Oostvaardersplassen
New Zealand North Island Whangamarino
Nigeria North East Hadejia-Nguru
Nigeria North East Madachi, Hadejia-Nguru
Pakistan Sind and Baluchistan Indus river deltaprovinces
Philippines Lingayan Gulf, Luzon
Sri Lanka Gampaha District Muthurajawela Marsh
Sweden Gotland Island Martebo mire
Sweden Gotland Island
Sweden
Tanzania Rufiji district Rufiji floodplain and delta
Thailand Chanathaburi province
Thailand Phatthalung Thale Noi
Thailand Surat Thani Po Village mangroves
Trinidad and Tobago Trinidad Carlibay, North ofCouva River,Point Lisas Bay,Orange Valley,plus other areas
Trinidad and Tobago Trinidad Caroni Swamp
Uganda Kampala District Nakivubo
UK East Anglia Norfolk Broads
UK Norfolk Cley marshes
UK Norfolk Halvergate marshes
UK North West Scotland Flow country
US Atlantic coast Five mid-Atalanticestuaries: Delaware,Potomac, James,East River, Hudson
US California Kesterson
US California Los Banos
US California Mendota
US California Merced
US California San Joaquin Valley
US California San Luis
US California Volta
US Florida All coastal marshland
US Florida East coast
Country Region Wetland name(where available)
Angola, Zambia, Zambezi basin wetlandsZimbabwe, Malawi,Botswana, Namibia,and Mozambique
Australia Northern Australia Herbert River District
Australia NSW Gwydir
Australia NSW MacQuirie marshes
Australia Queensland Moreton Bay
Australia Victoria Barmah-Millewa
Australia Western Australia Jandacot
Austria Eastern Austria Donau-Auen
Bangladesh South West Sundarban
Brazil Upper Paraguay PantanalRiver Basin
Cambodia Koh Kong Koh Kapik
Cambodia Koh Kong Koh Sra Lao
Cambodia Koh Kong Lamdam
Canada Alberta
Canada Ontario Lake St Clair
Canada Saskatchewan
Canada Southern Ontario Walpole Island
Czech Republic Moravia
El Salvador Gulf of Fonseca El Tamarindo
Fiji
Germany, Austria, Eastern Europe Danube floodplainSlovakia, Hungary,Croatia, Bulgaria,Romania, Ukraine
India Madhya Pradesh Bhoj wetlands(Upper and lower lakes)
Indonesia Irian Jaya Bintuni Bay
Indonesia West Kalimantan Danau SentarumWildlife Reserve
Indonesia
Italy Sicily Vendicari
Malawi South Malawi Lake Chilwa wetland
Malaysia Perak Matang mangroveforest reserve
Malaysia Sarawak Sarawak MangrovesForest Reserve
Mexico Campeche Laguna de Terminos
Mozambique Zambezi river Barotse floodplainfloodplain
Mozambique Zambezi river Lower Shire wetlandsfloodplain
List of 89 Wetland Sites
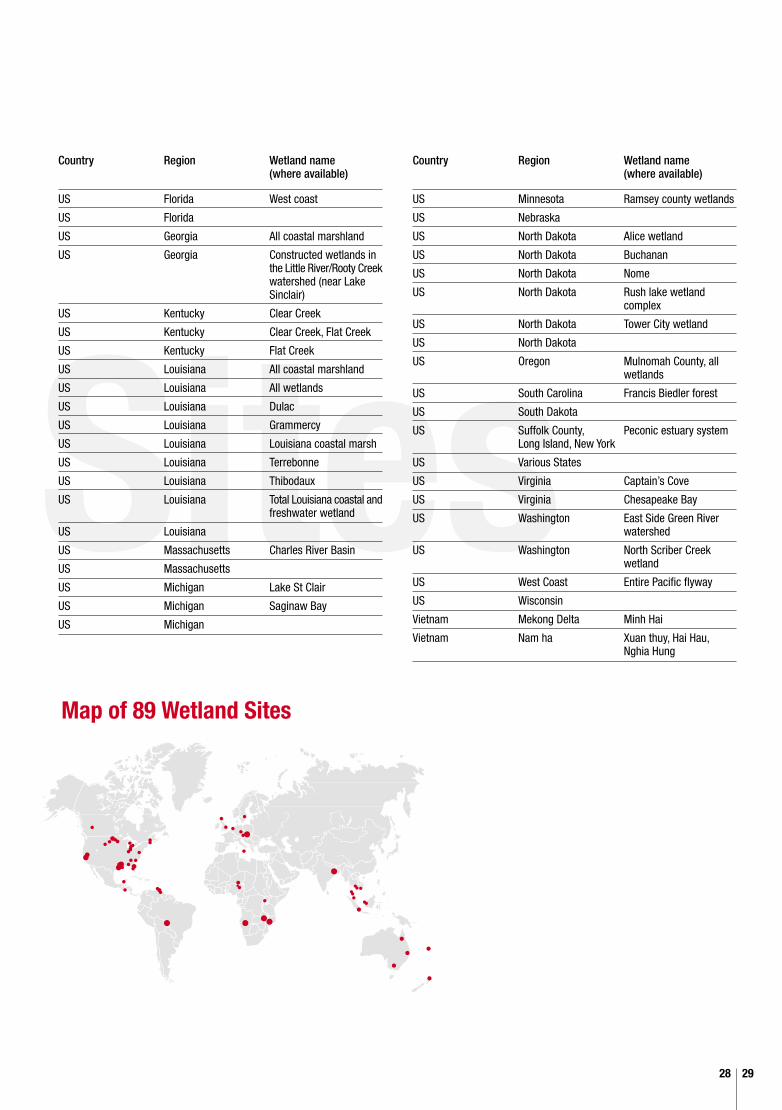
SitesMap of 89 Wetland Sites
28 29
Country Region Wetland name(where available)
US Minnesota Ramsey county wetlands
US Nebraska
US North Dakota Alice wetland
US North Dakota Buchanan
US North Dakota Nome
US North Dakota Rush lake wetlandcomplex
US North Dakota Tower City wetland
US North Dakota
US Oregon Mulnomah County, allwetlands
US South Carolina Francis Biedler forest
US South Dakota
US Suffolk County, Peconic estuary systemLong Island, New York
US Various States
US Virginia Captain’s Cove
US Virginia Chesapeake Bay
US Washington East Side Green Riverwatershed
US Washington North Scriber Creekwetland
US West Coast Entire Pacific flyway
US Wisconsin
Vietnam Mekong Delta Minh Hai
Vietnam Nam ha Xuan thuy, Hai Hau,Nghia Hung
Country Region Wetland name(where available)
US Florida West coast
US Florida
US Georgia All coastal marshland
US Georgia Constructed wetlands inthe Little River/Rooty Creekwatershed (near LakeSinclair)
US Kentucky Clear Creek
US Kentucky Clear Creek, Flat Creek
US Kentucky Flat Creek
US Louisiana All coastal marshland
US Louisiana All wetlands
US Louisiana Dulac
US Louisiana Grammercy
US Louisiana Louisiana coastal marsh
US Louisiana Terrebonne
US Louisiana Thibodaux
US Louisiana Total Louisiana coastal andfreshwater wetland
US Louisiana
US Massachusetts Charles River Basin
US Massachusetts
US Michigan Lake St Clair
US Michigan Saginaw Bay
US Michigan
SumEconomic Valuation of EcosystemsEconomic values can be quantified, a process that is called economic valuation of ecosystems. For those wetland goods and
services that are traded in the market place and whose prices are not distorted, market prices can be used as indicators for
economic values. Often, however, most goods and services do not have a market price and shadow pricing techniques can
be applied to determine their economic values. Economic theory distinguishes several shadow valuation methods. For example,
a well-known method is called Contingent Valuation, which directly obtains consumers’ willingness to pay for a change in the
level of an environmental good, based on a hypothetical market. Another example of a shadow pricing method is the Travel Cost
method. This method relies on individual valuations of environmental goods that are revealed in the travel costs made by consumers
to obtain the environmental good, such as distance costs per kilometre travelled, time costs of the individual, and the entrance
fee of the particular environmental good. See Barbier et al. [26] for a practical guide on wetland valuation.
Although application of economic valuation must be done with care12, it has an important added value. In general, one can say
economic valuation of wetlands has two benefits. First, economic valuation is important to highlight the relative importance of
different economic activities that depend on wetland functions. In this way, it can make important contributions to management
plans of wetlands. Secondly, economic valuation may be useful in countering arguments on wetland conservation. Putting a
monetary value on activities can highlight the significance of wetlands for people and thus provide strong arguments for the
conservation of wetland lands and water as opposed to reclamation or diversion. In both cases, monetary valuation is an important
complementary assessment to other, qualitative assessments on wetland functions that cannot be monetarized.
12See Schuijt (2003, pages 40-48)
for an overview of limitations and
applicability of economic valuation
studies [30].
Meta-analysis of Wetland Values and Value Transfer
Appendix 2:Summary of Methodology
in a statistical meta-analysis. From these
89 studies, we were able to extract 246
separate observations of wetland value.
The maximum number of observations
taken from one study is ten and the average
number is approximately 2.7. Care was
taken not to double count value estimates
that are reported in more than one study,
or to include estimates that were derived
through value transfer from studies also
included in our data set. It should be noted
that the geographical distribution of
observations in our sample reflects the
practice and availability of natural resource
valuation studies rather than the distribution
of wetlands. North America, for example,
is particularly well represented with just
under half our data set comprising of
observations from the US and Canada.
The number of observations for each
continent are: North American 114,
South and Latin America 13, Europe 24,
Asia 55, Africa 33, Australasia 7.
This section provides a brief description
of the meta-analysis of wetland valuation
studies used in this report and a description
of the steps taken in the value transfer
to global wetlands. This research has,
in part, been carried out within the project
DINAS-COAST (Dynamic and Interactive
Assessment of National, Regional and Global
Vulnerability of Coastal Zones to Climate
Change and Sea-Level Rise), which is
funded by the EU Directorate-General
Research under project number EVK2-CT-
2000-00084. For a more comprehensive
description of this meta-analysis and the
issues and accuracy of value transfer we
refer to Brander et al (2003) [14].
Meta-analysis is concerned with a
quantitative analysis of statistical summary
indicators reported in a series of similar
empirical studies. In total, 197 studies related
to wetland valuation were collected and of
these, 89 contained suitable and sufficient
information for the purposes of comparison

maryBelow: Peul (Wodaabe) ladyfilling waterskins at temporarypool, Central Niger
©W
WF-
Can
on/J
ohn
E. N
EW
BY
wetland sites that are of policy interest,
this estimated value function can then be
used to predict the value of those wetlands.
The inventory of global coastal wetlands
that we use in this study contained
information on wetland location, size
and type. To this we added information
on income per capita and population density
at a country level from the World Bank World
Development Indicators 2002.
It should be noted that value transfer may
result in ‘transfer errors’, particularly when
the characteristics of the site to which values
are being transferred are not well represented
in the data underlying the estimated value
function. In the meta-analysis used in this
report we have attempted to be as
comprehensive as possible in our collection
of valuation studies but clearly due to the
availability of studies our sample focuses
on certain wetland types, functions and
locations. Value transfer estimates should
therefore be treated with some caution, and
for this reason we present wetland values
at a somewhat aggregated level rather than
for individual wetlands. Finally, one should
always remember that economic value is
only one component of its total value, which
also includes biodiversity, scientific, socio-
cultural and other important wetland values.
Wetland values have been reported in
the literature in many different metrics,
currencies and refer to different years (e.g.,
WTP per household per year, capitalized
values, marginal value per acre, etc). In
order to enable comparison between these
values we have standardized them to 2000
US dollars per hectare per year. This
standardization included a purchasing power
parity (PPP) conversion in order to account
for different price levels in different countries.
For our data set the average annual wetland
value is just over 3,000 US$ per hectare.
The median value, however, is 170 US$
ha–1 yr–1, showing that the distribution of
estimated values is skewed with a long tail
of high values.
Given the existing number of wetland
valuation studies there is substantial
academic and policy interest in the potential
for, and validity of, value transfer. Value
transfer offers a means of estimating
monetary values for environmental resources
without performing relatively time consuming
and expensive primary valuation studies.
There are two general approaches to value
transfer: direct value transfer and function
value transfer. The first involves simply
transferring the value(s) estimated in one
or more primary studies to the policy site
in question. Ideally, the study site and
policy site should be similar in their
characteristics, or adjustments should
be made to the transferred value to
reflect differences in site characteristics.
The second approach involves transferring
values to a policy site based on its known
characteristics using a value transfer
function, possibly estimated through a
meta-regression. It is generally accepted
that function transfers perform better than
direct value transfers in terms of accuracy
and it is this approach that we have used
to transfer values to global wetlands.
We estimated a wetland value function by
regressing the standardized wetland values
on a number of important explanatory
variables, including wetland type, income
per capita, population density, wetland
size and continent. Given information
on the same characteristics of other
WWF’s mission is to stop the degradation of the planet’s naturalenvironment and to build a future in which humans live in harmonywith nature, by:– conserving the world’s biological diversity– ensuring that the use of renewable natural resources is sustainable– promoting the reduction of pollution and wasteful consumption.
Conserving the source of life ©19
86, W
WF
– W
orld
Wid
e Fu
nd F
or N
atur
e (F
orm
erly
Wor
ld W
ildlif
e Fu
nd)
® W
WF
– W
orld
Wid
e Fu
nd F
or N
atur
e (F
orm
erly
Wor
ld W
ildlif
e Fu
nd) R
egis
tere
d T
rad
emar
k
Contacts:c/o P.O. Box 73700AA ZeistNetherlandsTel: +31 30 693 7803Fax: +31 30 691 [email protected]/livingwaters
Avenue du Mont Blanc 271196 GlandSwitzerlandTel: +41 22 364 9027Fax: +41 22 364 [email protected]/livingwaters
Living WatersConserving the source of life