Embed Size (px)
Citation preview
NIST Special Publication 250-95
NIST Measurement Services
Photometric Calibrations
Yuqin Zong
Maria E. Nadal
Benjamin K. Tsai
C. Cameron Miller
This publication is available free of charge from:
https://doi.org/10.6028/NIST.SP.250-95
NIST Special Publication 250-95
NIST Measurement Services
Photometric Calibrations
Yuqin Zong
Maria E. Nadal
Benjamin K. Tsai
C. Cameron Miller
Sensor Science Division
Physical Measurement Division
National Institute of Standards and Technology
100 Bureau Drive
Gaithersburg, MD 20899
This publication is available free of charge from:
https://doi.org/10.6028/NIST.SP.250-95
July 2018
U.S. Department of Commerce
Wilbur L. Ross, Jr., Secretary
National Institute of Standards and Technology
Walter G. Copan, NIST Director and Under Secretary of Commerce for Standards and Technology
Certain commercial entities, equipment, or materials may be identified in this
document in order to describe an experimental procedure or concept adequately.
Such identification is not intended to imply recommendation or endorsement by the
National Institute of Standards and Technology, nor is it intended to imply that the
entities, materials, or equipment are necessarily the best available for the purpose.
National Institute of Standards and Technology Special Publication 250-95
Natl. Inst. Stand. Technol. Spec. Publ. 250-95, 147 pages (July 2018)
CODEN: NSPUE2
This publication is available free of charge from:
https://doi.org/10.6028/NIST.SP.250-95
i
This
pu
blic
atio
n is
availa
ble
free o
f charg
e fro
m: h
ttps://d
oi.o
rg/1
0.6
028
/NIS
T.S
P.2
50-9
5
Preface
The calibration and related measurement services of the National Institute of Standards and
Technology (NIST) are intended to assist the makers and users of precision measuring
instruments in achieving the highest possible levels of accuracy, quality, and productivity.
NIST offers over 300 different calibrations, special tests, and measurement assurance services.
These services allow customers to directly link their measurement systems to measurement
systems and standards maintained by NIST. These services are offered to the public and
private organizations alike. They are described in NIST Special Publication (SP) 250, NIST
Calibration Services Users Guide.
The Users Guide is supplemented by a number of Special Publications (designated as the
“SP250 Series”) that provide detailed descriptions of the important features of specific NIST
calibration services. These documents provide a description of the: (1) specifications for the
services; (2) design philosophy and theory; (3) NIST measurement system; (4) NIST
operational procedures; (5) assessment of the measurement uncertainty including an
uncertainty budget; and (6) internal quality control procedures used by NIST. These
documents will present more detail than can be given in NIST calibration reports, or than is
generally allowed in articles in scientific journals. In the past, NIST has published such
information in a variety of ways. This series will make this type of information more readily
available to the user.
This document, SP250-95 (2017), NIST Photometric Calibrations, is a revision of SP250-37
(1997). It covers the calibration of standards of luminous intensity, luminous flux, illuminance,
luminance, luminous exposure, and color temperature (test numbers 37010C–37070C and
37020S-37130S in SP250, NIST Calibration Services Users Guide). Inquiries concerning the
technical content of this document or the specifications for these services should be directed
to one of the authors or to one of the technical contacts cited in SP250.
NIST welcomes suggestions on how publications such as this might be made more useful.
Suggestions are also welcome concerning the need for new calibrations services, special tests,
and measurement assurance programs.
Gregory F. Strouse James K. Olthoff
Associate Director for Measurement Services Director
Physical Measurement Laboratory
ii
This
pu
blic
atio
n is
availa
ble
free o
f charg
e fro
m: h
ttps://d
oi.o
rg/1
0.6
028
/NIS
T.S
P.2
50-9
5
Abstract
The National Institute of Standards and Technology provides calibration services for
submitted artifacts for luminous intensity, illuminance, color temperature, total luminous
flux, luminous exposure and luminance. Additionally, the National Institute of Standards
and Technology issues calibrated standards of luminous intensity, luminance, and color
temperature. The procedures, equipment, and techniques used to perform these calibrations
are described. Detailed estimates and procedures for determining uncertainties of the
reported values are also presented along with the internal quality control procedures.
Key words
Calibration; Candela; Color temperature; Illuminance; Lumen; Luminance; Luminous
exposure; Luminous flux; Luminous intensity; Lux; Photometry; Standards; Total luminous
flux.
iii
This
pu
blic
atio
n is
availa
ble
free o
f charg
e fro
m: h
ttps://d
oi.o
rg/1
0.6
028
/NIS
T.S
P.2
50-9
5
Table of Contents
Introduction ..................................................................................................................... 1
1.1. Photometry, physical photometry, and radiometry ..................................................... 1
1.2. Photometric quantities and units ................................................................................. 3
1.2.1. Photometric quantities ........................................................................................... 3
1.2.2. Relationship between the SI units and English units ............................................ 6
1.3. NIST photometric units ............................................................................................... 7
1.3.1. Luminous intensity unit ......................................................................................... 7
1.3.2. Luminous flux unit .............................................................................................. 10
1.3.3. Luminous exposure unit ...................................................................................... 10
2. Outline of the calibration services ................................................................................ 11
3. Luminous intensity and illuminance responsivity calibrations ................................. 14
3.1. Photometry, physical photometry, and radiometry ................................................... 14
3.2. Design of the NIST standard photometers ................................................................ 16
3.3. Realization of the NIST illuminance responsivity unit ............................................. 17
3.3.1. Calibration of the NIST standard photometers .................................................... 17
3.3.2. Correction for the photometer temperature ......................................................... 17
3.3.3. Correction for illuminance responsivity geometry .............................................. 18
3.3.4. Linearity of the NIST standard photometers ....................................................... 18
3.3.5. Uncertainty budget for NIST illuminance responsivity unit ............................... 19
3.4. Realization of the NIST candela and luminous intensity unit ................................... 22
3.4.1. Photometry bench ................................................................................................ 22
3.4.2. Alignment of the NIST standard photometers .................................................... 24
3.4.3. Spectral mismatch correction factor (SMCF) ..................................................... 24
3.4.4. Uncertainty budget for NIST illuminance unit .................................................... 26
3.4.5. Uncertainty budget for NIST candela unit .......................................................... 28
3.5. Luminous intensity calibrations ................................................................................ 29
3.5.1. Lamp standards for luminous intensity ............................................................... 29
3.5.2. Long-term stability of NIST standard photometers ............................................ 32
3.5.3. Electrical power supply ....................................................................................... 33
3.5.4. Deviation from inverse square law ...................................................................... 34
3.5.5. Uncertainty budget for luminous intensity calibrations ...................................... 35
3.5.6. Calibration and quality control procedures for candela calibrations ................... 36
3.6. Illuminance responsivity calibrations ........................................................................ 38
iv
This
pu
blic
atio
n is
availa
ble
free o
f charg
e fro
m: h
ttps://d
oi.o
rg/1
0.6
028
/NIS
T.S
P.2
50-9
5
3.6.1. Types of photometers and illuminance meters .................................................... 38
3.6.2. Operation and handling of photometer heads and illuminance meters ............... 39
3.6.3. Illuminance responsivity calibration and quality control procedures ................. 39
3.6.4. Uncertainty of illuminance responsivity calibration ........................................... 40
3.7. Calibration of high-illuminance photometers ............................................................ 42
3.7.1. High-illuminance facility, calibration procedure and quality control ................. 43
3.7.2. Uncertainty budget for high-illuminance calculations ........................................ 45
4. Total luminous flux calibrations .................................................................................. 48
4.1. Principles of the absolute integrating sphere method ................................................ 48
4.2. Design of the NIST 2.5 m Integrating Sphere Facility .............................................. 49
4.3. Uncertainty of the NIST sphere photometer system responsivity ............................. 51
4.3.1. Temperature dependence ..................................................................................... 51
4.3.2. Sphere photometer system SMCF ....................................................................... 52
4.3.3. Spatial non-uniformity correction factor ............................................................. 53
4.3.4. Incident angle correction factor ........................................................................... 55
4.3.5. Illuminance on the reference plane of the aperture and photometer wheel ......... 55
4.3.6. Average illuminance correction factor ................................................................ 58
4.3.7. Uncertainty budget for the NIST sphere photometer system responsivity ......... 58
4.4. Total luminous flux and artifacts for calibration ....................................................... 58
4.4.1. Incandescent lamps – Typical budget ................................................................. 59
4.4.2. Fluorescent lamps – Typical budget .................................................................... 62
4.4.3. Reflector lamps – Typical budget ....................................................................... 66
5. Luminance calibrations ................................................................................................. 68
5.1. NIST luminance unit and uncertainty budget ............................................................ 68
5.2. Calibration of luminance meters ............................................................................... 71
5.3. Calibration of high-luminance meters ....................................................................... 73
5.4. Calibration of luminance sources .............................................................................. 75
5.5. Artifacts for calibration ............................................................................................. 77
5.6. Calibration of diffusers for luminance coefficient .................................................... 77
5.6.1. Calibration procedure for opal glass luminance coefficient ................................ 77
5.6.2. Calibration procedure for reflectance plaque luminance coefficient .................. 81
6. Color temperature calibrations .................................................................................... 83
6.1. General Description ................................................................................................... 83
6.2. NIST color temperature scale .................................................................................... 84
v
This
pu
blic
atio
n is
availa
ble
free o
f charg
e fro
m: h
ttps://d
oi.o
rg/1
0.6
028
/NIS
T.S
P.2
50-9
5
6.3. Artifacts for calibration ............................................................................................. 85
6.4. Equipment and instruments for calibration ............................................................... 86
6.5. Calibration procedures .............................................................................................. 88
6.6. Uncertainty of correlated color temperature calibration ........................................... 88
7. Flash photometer calibrations ...................................................................................... 90
7.1. General description .................................................................................................... 90
7.2. Methods for realization of the luminous exposure unit ............................................. 91
7.2.1. Electrical method ................................................................................................. 91
7.2.2. Pulsed photometry method .................................................................................. 92
7.3. Flash standard photometers ....................................................................................... 93
7.4. Calibration scheme for flash photometers ................................................................. 96
7.5. Uncertainty analysis of luminous exposure and flash photometer calibrations ........ 98
References ............................................................................................................................ 103
Appendix A: List of symbols used in document ............................................................... 107
Appendix B: Sensitivity coefficients .................................................................................. 109
Appendix C: Samples of calibration reports .................................................................... 117
vi
This
pu
blic
atio
n is
availa
ble
free o
f charg
e fro
m: h
ttps://d
oi.o
rg/1
0.6
028
/NIS
T.S
P.2
50-9
5
List of Tables
Table 1. Quantities and units used in photometry and radiometry. .......................................... 4
Table 2. English units and definitions....................................................................................... 7 Table 3. Conversion between English units and SI units.......................................................... 7 Table 4. Uncertainty budget for NIST illuminance responsivity unit. ................................... 21 Table 5. Uncertainty components as correction factors for NIST illuminance unit. .............. 27 Table 6. Uncertainty budget for NIST illuminance unit. ........................................................ 27
Table 7. Uncertainty budget for NIST candela unit. ............................................................... 28 Table 8. Uncertainty components as correction factors for luminous intensity calibration. .. 35
Table 9. Uncertainty budget for typical luminous intensity calibration. ................................ 36
Table 10. Uncertainty components as correction factors for illuminance responsivity
calibration. .............................................................................................................................. 41 Table 11. Uncertainty budget for a typical illuminance responsivity calibration. .................. 42 Table 12. Uncertainty components as correction factors for high-illuminance unit. .............. 45
Table 13. Uncertainty budget for the NIST high-illuminance unit. ........................................ 46 Table 14. Uncertainty components for high-illuminance calibration factor. .......................... 47
Table 15. Uncertainty budget for a typical high-illuminance calibration factor determination.
................................................................................................................................................. 47 Table 16. Uncertainty components for sphere photometer. .................................................... 51
Table 17. Uncertainty components for sphere external illuminance. ..................................... 56
Table 18. Uncertainty budget for a sphere external illuminance determination. .................... 57 Table 19. Uncertainty budget for a NIST sphere photometer system responsivity. ............... 58 Table 20. Uncertainty components for total flux calibration. ................................................. 60
Table 21. Uncertainty budget for total luminous flux calibration of a typical incandescent
lamp......................................................................................................................................... 61
Table 22. Uncertainty components for total flux calibration. ................................................. 64 Table 23. Uncertainty budget for total luminous flux calibration of a typical fluorescent lamp.
................................................................................................................................................. 66
Table 24. Uncertainty budget for total luminous flux calibration of a typical reflector lamp. 67 Table 25. Uncertainty components for NIST luminance unit. ................................................ 70
Table 26. Uncertainty budget for NIST luminance unit. ........................................................ 70 Table 27. Uncertainty components for luminance meter calibration. ..................................... 72 Table 28. Uncertainty budget for a typical luminance meter calibration. .............................. 72
Table 29. Uncertainty components for high luminance meter calibration. ............................. 74 Table 30. Uncertainty budget for a typical high-luminance meter calibration. ...................... 74 Table 31. Uncertainty components for luminance source calibration. ................................... 76 Table 32. Uncertainty budget for a typical luminance source calibration. ............................. 76 Table 33. Uncertainty components for NIST reference opal glasses. ..................................... 79
Table 34. Uncertainty budget for a NIST reference opal glass calibration. ........................... 79 Table 35. Uncertainty components for reflectance plaque. .................................................... 82
Table 36. Uncertainty budget for a typical reference plaque luminance coefficient calibration.
................................................................................................................................................. 83 Table 37. Uncertainty budget for the offset calibration of the transfer spectroradiometer at
2856 K. .................................................................................................................................... 89 Table 38. Typical offsets and standard uncertainties of the offsets. ....................................... 90
Table 39. Uncertainty budget for the correlated color temperature calibration at 2856 K. .... 90
vii
This
pu
blic
atio
n is
availa
ble
free o
f charg
e fro
m: h
ttps://d
oi.o
rg/1
0.6
028
/NIS
T.S
P.2
50-9
5
Table 40. Results of the flash standard photometers calibration using the two methods. ...... 95 Table 41. Uncertainty budget for luminous exposure responsivity using the electrical method.
................................................................................................................................................. 99 Table 42. Uncertainty budget for the luminous exposure unit using the electrical method. 100 Table 43. Uncertainty budget for luminous exposure responsivity using the pulsed
photometric method. ............................................................................................................. 101 Table 44. Uncertainty budget for calibration of luminous exposure responsivity using the
pulsed photometric method. .................................................................................................. 102
viii
This
pu
blic
atio
n is
availa
ble
free o
f charg
e fro
m: h
ttps://d
oi.o
rg/1
0.6
028
/NIS
T.S
P.2
50-9
5
List of Figures
Fig. 1. CIE V(λ) function. ......................................................................................................... 2
Fig. 2. Realization and maintenance of the NIST photometric units. ....................................... 8 Fig. 3. Schematic of the NIST Primary Optical Watt Radiometer (POWR). ........................... 9 Fig. 4. Geometry for the detector-based candela realization. ................................................. 14 Fig. 5. Design of the NIST standard photometer. ................................................................... 16 Fig. 6. Temperature dependence of the photometers’ illuminance responsivity. ................... 18
Fig. 7. Linearity of one transimpedance amplifier for NIST standard photometers. .............. 19 Fig. 8. Schematic of the NIST photometric bench. ................................................................. 22
Fig. 9. Alignment of the bi-post base socket using a jig. ........................................................ 23
Fig. 10. Polynomial fit for the SMCFs. .................................................................................. 26 Fig. 11. Appearance of luminous intensity standard lamps and their electrical polarity. ....... 29 Fig. 12. Aging characteristics of a typical Airway Beacon type lamp at 2856 K. .................. 30 Fig. 13. Aging characteristics of a selected FEL type lamp at 2856 K................................... 31
Fig. 14. Spatial non-uniformity of a typical FEL type lamp. .................................................. 32 Fig. 15. Drift of illuminance responsivity of NIST standard photometers. ............................ 33
Fig. 16. Results of check standard lamp over a four month period. ....................................... 37 Fig. 17. Configuration of the high illuminance calibration facility. ....................................... 43 Fig. 18. Calculated spectral power distribution of the source combined with the filters. ...... 44
Fig. 19. Spatial non-uniformity of illuminance at 30 cm from the front lens. ........................ 48
Fig. 20. Arrangement of NIST 2.5 m integrating sphere for detector-based total luminous flux
calibrations. ............................................................................................................................. 50 Fig. 21. Results of the AC/DC measurement of the NIST integrating sphere with a 1000-W
tungsten lamp operated in the sphere. ..................................................................................... 52 Fig. 22. Mapping of NIST 2.5 m integrating sphere responsivity (normalized SRDF). ........ 54
Fig. 23. Circuit diagram for the calibration of test fluorescent lamps. ................................... 62 Fig. 24. Typical normalized linear fluorescent tube light output as a function of ambient
temperature. ............................................................................................................................ 65
Fig. 25. Arrangement for NIST luminance unit realization. ................................................... 68 Fig. 26. Configuration for the realization of opal glass luminance coefficient. ..................... 77
Fig. 27. Configuration for the realization of reflectance plaque luminance coefficient. ........ 81 Fig. 28. Configuration for color temperature calibration. ....................................................... 86 Fig. 29. Color temperature correction values for the NIST diode-array spectroradiometer. .. 87
Fig. 30. Derivation of the luminous exposure unit using the electrical method. .................... 91 Fig. 31. Derivation of the luminous exposure unit using the pulsed photometry method. ..... 92 Fig. 32. The normalized luminous exposure responsivity [V/(lx·s)] of the three NIST flash
photometers that maintain the unit. ......................................................................................... 96 Fig. 33. Arrangement for the calibration of flash photometers............................................... 97
Fig. 34. The spectral power distributions of the xenon flashing-light source and filtered red
flashing-light source used in this calibration. ......................................................................... 97
1
This
pu
blic
atio
n is
availa
ble
free o
f charg
e fro
m: h
ttps://d
oi.o
rg/1
0.6
028
/NIS
T.S
P.2
50-9
5
Introduction
This document supersedes the NIST Special Publication 250-37 (1997) and NBS Special
Publication 250-15 (1987). In 1992, a new candela was realized based on an absolute
cryogenic radiometer, and the old NIST gold-point blackbody-based unit [1] was replaced by
the new detector-based unit [2]. A group of eight calibrated standard photometers based on
the cryogenic radiometer maintains the capability to realize the NIST candela, and replaces
the lamp-based standards formerly used. Further, the photometric calibration procedures have
been revised to utilize the detector-based methods [3]. Since publication of the previous
version (1997), the facilities for total luminous flux were improved significantly with the
introduction of detector-based calibration procedures [4]. A new service for calibration of
flash photometers was developed. There have been many improvements in other existing
calibration facilities and procedures.
This document describes the updated photometric calibration procedures for luminous
intensity (candela; cd), illuminance (lux; lx), total luminous flux (lumen; lm), luminance
(cd/m2), color temperature (Kelvin; K), and luminous exposure (lx·s, cd·s). Throughout this
document, uncertainty statements follow the NIST policy given by Taylor and Kuyatt [5],
which prescribes the use of an expanded uncertainty with a coverage factor k = 2 for
uncertainties of all NIST calibrations.
Descriptions for the individual standards and calibrations available from NIST covered by
this document, as of October 2017, are listed and explained in Section 2. Updated
information about calibration services and prices are published periodically in the NIST
Calibration Services Users Guide and Fee Schedule [6].
The material presented in this document describes photometric calibration facilities and
procedures as they existed at the time of publication. Further improvement of photometric
calibration facilities and procedures are underway. Additional documents will cover new
photometric calibration procedures for average LED intensity (candela; cd), LED total
luminous flux of LEDs (lumen; lm), colorimetry of LEDs, and spectrally integrated total
radiant flux of LEDs (watt; W), along with total spectral radiant flux calibration procedures
for incandescent light sources.
1.1. Photometry, physical photometry, and radiometry
The primary aim of photometry is to measure visible optical radiation, light, in such a way
that the results correlate with what the visual sensation is to a normal human observer
exposed to that radiation. Until about 1940, visual comparison techniques of measurements
were predominant in photometry, whereby an observer was required to match the brightness
of two visual fields viewed either simultaneously or sequentially. This method of
photometry is so-called visual photometry and is seldom used today.
In modern photometric practice, measurements are made with photodetectors. This is
referred to as physical photometry. In order to achieve the aim of photometry, one must take
into account the characteristics of human vision. The relative spectral responsivity of the
human vision system was first defined by the CIE (Commission Internationale de
l’Éclairage) in 1924 [7], and redefined as part of colorimetric standard observers in 1931 [8].
It is called the spectral luminous efficiency function for photopic vision, or the V() function,
2
This
pu
blic
atio
n is
availa
ble
free o
f charg
e fro
m: h
ttps://d
oi.o
rg/1
0.6
028
/NIS
T.S
P.2
50-9
5
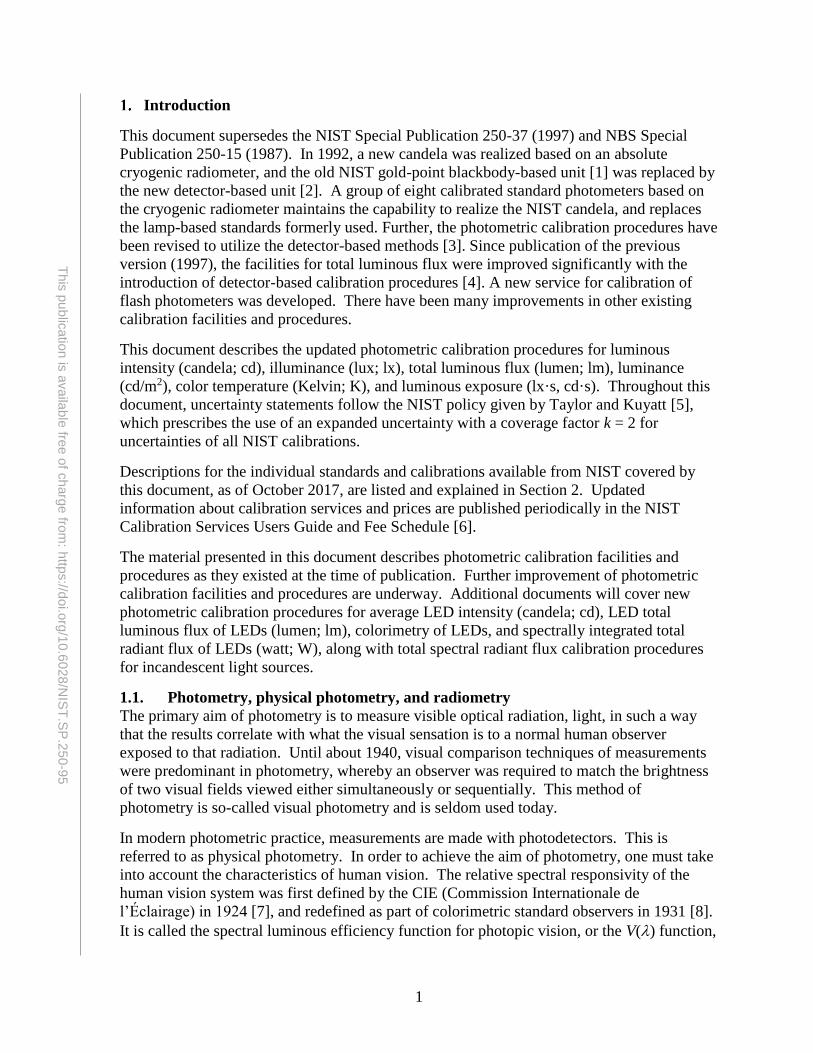
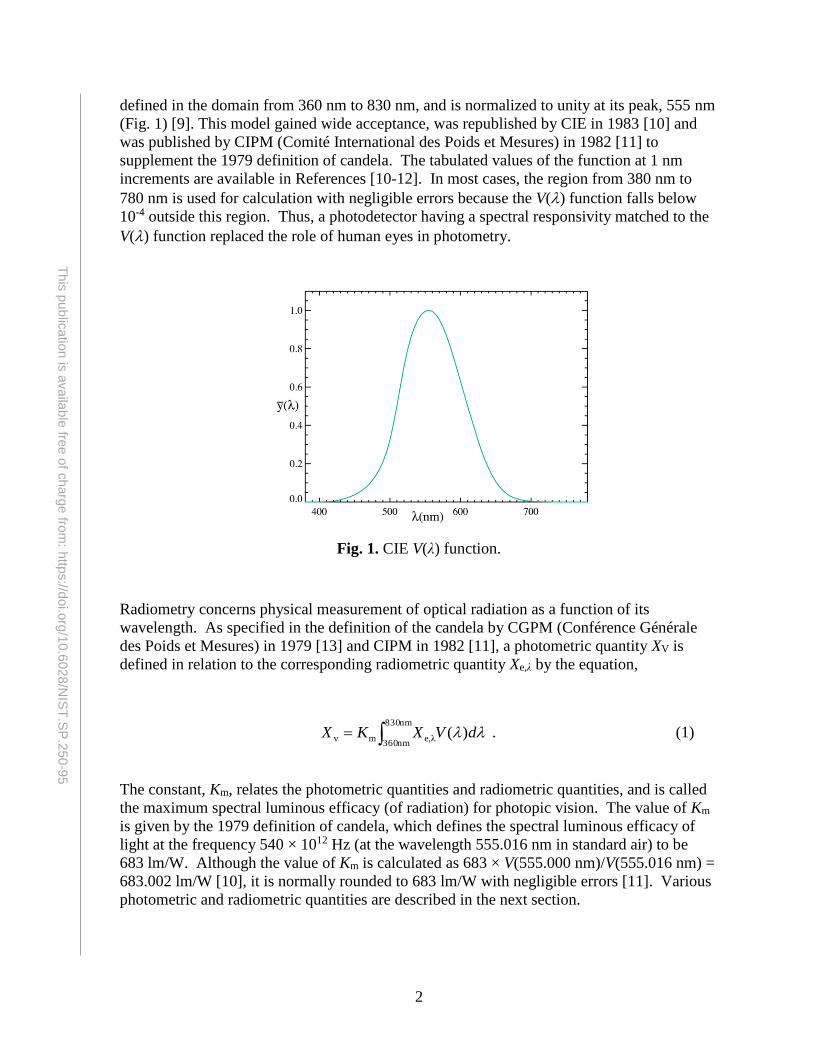
defined in the domain from 360 nm to 830 nm, and is normalized to unity at its peak, 555 nm
(Fig. 1) [9]. This model gained wide acceptance, was republished by CIE in 1983 [10] and
was published by CIPM (Comité International des Poids et Mesures) in 1982 [11] to
supplement the 1979 definition of candela. The tabulated values of the function at 1 nm
increments are available in References [10-12]. In most cases, the region from 380 nm to
780 nm is used for calculation with negligible errors because the V() function falls below
10-4 outside this region. Thus, a photodetector having a spectral responsivity matched to the
V() function replaced the role of human eyes in photometry.
Fig. 1. CIE V(λ) function.
Radiometry concerns physical measurement of optical radiation as a function of its
wavelength. As specified in the definition of the candela by CGPM (Conférence Générale
des Poids et Mesures) in 1979 [13] and CIPM in 1982 [11], a photometric quantity XV is
defined in relation to the corresponding radiometric quantity Xe,λ by the equation,
nm830
nm360λe,mv )( dVXKX . (1)
The constant, Km, relates the photometric quantities and radiometric quantities, and is called
the maximum spectral luminous efficacy (of radiation) for photopic vision. The value of Km
is given by the 1979 definition of candela, which defines the spectral luminous efficacy of
light at the frequency 540 × 1012 Hz (at the wavelength 555.016 nm in standard air) to be
683 lm/W. Although the value of Km is calculated as 683 × V(555.000 nm)/V(555.016 nm) =
683.002 lm/W [10], it is normally rounded to 683 lm/W with negligible errors [11]. Various
photometric and radiometric quantities are described in the next section.
3
This
pu
blic
atio
n is
availa
ble
free o
f charg
e fro
m: h
ttps://d
oi.o
rg/1
0.6
028
/NIS
T.S
P.2
50-9
5
It should be noted that the V() function is based on the CIE standard photometric observer
for photopic vision, which assumes additivity of sensation and a 2° field of view at relatively
high luminance levels (higher than 1 cd/m2). The human vision in this level is called
photopic vision. The spectral responsivity of human vision deviates significantly at very low
levels of luminance (less than 10-2 cd/m2). This type of vision is called scotopic vision. Its
spectral responsivity, peaking at 507 nm, is designated by the V’() function, which was
defined by CIE in 1951 [14], recognized by CIPM in 1976 [15], and republished by CIPM in
1982 [11]. Human vision in the region between photopic vision and scotopic vision is called
mesopic vision. While active research is being conducted [16, 17], there is no internationally
accepted spectral luminous efficiency function for the mesopic region yet. In current
practice, almost all photometric quantities are given in terms of photopic vision, even at low
light levels, except for special measurements for research purposes. This document,
therefore, does not deal with quantities specified in terms of scotopic or mesopic vision.
Further details of definitions outlined in this section are given in Reference 10.
To better understand the international metrology system, it is useful to know the relationship
among such organizations as CGPM (Conférence Générale des Poids et Mesures), CIPM
(Comité international des poids et mesures), CCPR (Comité Consultatif de Photométrie et
Radiométrie), BIPM (Bureau International des Poids et Mesures), and CIE (Commission
Internationale de l´Eclairage). These abbreviations are based on their French names. In
English, these organizations are: CGPM (General Conference of Weights and Measures),
CIPM (International Committee for Weights and Measures), CCPR (Consultative Committee
of Photometry and Radiometry), BIPM (International Bureau of Weights and Measures), and
CIE (International Commission on Illumination). All SI units (Système international d'unités
or International System of Units) are officially defined by the CGPM, which is the decision-
making body for the Treaty of the Meter (Convention du Mètre), signed in 1875. The
decisions of the CGPM legally govern the global metrology system among those countries
signatory to the Treaty of the Meter or agreeing to its usage. The CIPM is a committee under
the CGPM, charged with the management of the SI and related fundamental units, consisting
of many subcommittees for each technical field. The CCPR is a subcommittee under the
CIPM that discusses and recommends units in photometry and radiometry. It consists of
representatives of interested national standardizing laboratories. The CCPR also holds
international intercomparisons of photometric units and radiometric scales. The BIPM is a
metrology laboratory under the supervision of the CIPM, with staff and facilities in Paris.
The CIE, on the other hand, is originally an academic society in the field of lighting science
and was organized to promote uniformity and quality in optical measurements. Many
definitions developed by the CIE, such as the V() function, the color matching functions,
and the standard illuminants, have been adopted by the CGPM and by the ISO (International
Organization for Standardization) as international standards. The CIE has recently been
recognized officially by the ISO as a standards-creating body in the field of optical radiation.
The NIST staff actively participates in CCPR and CIE activities.
1.2. Photometric quantities and units
1.2.1. Photometric quantities
The base unit of all photometric quantities is the candela. The first realization of the candela
was performed circa 1860 using candles made from sperm whale fat, known as spermacetti.
In 1898, the candles were replaced by gas lamps that were wickless and used a mixture of
4
This
pu
blic
atio
n is
availa
ble
free o
f charg
e fro
m: h
ttps://d
oi.o
rg/1
0.6
028
/NIS
T.S
P.2
50-9
5
pentane and air. In 1909, the first internationally recognized unit was established
collaboratively between the National Bureau of Standards (currently NIST), the National
Physical Laboratory in England, and the Laboratoire Central d’Electricité in France. The
unit was based on the pentane lamp, but was maintained on carbon filament lamps. In 1948
the ‘candle’ became the candela and was defined by CGPM such that ‘the magnitude of the
candela is such that the luminance of a full radiator at the temperature of solidification of
platinum is 60 candelas per square centimeter.’ It became one of the base SI units when SI
was established in 1960. Most recently, the candela was redefined by CGPM in 1979 as
follows.
“The candela is the luminous intensity, in a given direction, of a source that
emits monochromatic radiation of frequency 540 × 1012 Hertz and that has
a radiant intensity in that direction of (1/683) Watt per steradian [11].”
Table 1 lists photometric quantities and their corresponding radiometric quantities side by
side, with units and symbols. The precise definition of each quantity is given by CCPR [12]
and CIE [18].
Table 1. Quantities and units used in photometry and radiometry.
Photometric
Quantity
Unit Relationship
to lumen
Radiometric Quantity Unit
Luminous flux lm (lumen) Radiant flux W (Watt)
Luminous intensity cd (candela) lm sr-1 Radiant intensity W sr-1
Illuminance lx (lux) lm m-2 Irradiance W m-2
Luminance cd m-2 lm sr-1 m-2 Radiance W sr-1 m-2
Luminous exitance lm m-2 Radiant exitance W m-2
Luminous exposure lx s lm m-2 s Radiant exposure W m-2 s
Luminous energy lm s Radiant energy J (Joule)
Color temperature K (Kelvin) Radiance temperature K
Although the candela is defined as an SI base unit, luminous flux (lumen) is perhaps the most
fundamental photometric quantity, as the four other photometric quantities are defined in
terms of lumen with appropriate geometric factors. Luminous flux (Φv) is the time rate of
flow of light as weighted by V(λ). It is defined as
dVK )(e.λmv , (2)
5
This
pu
blic
atio
n is
availa
ble
free o
f charg
e fro
m: h
ttps://d
oi.o
rg/1
0.6
028
/NIS
T.S
P.2
50-9
5
where Φe,λ is the spectral concentration of radiant flux in (W/nm) as a function of wavelength
λ in nm.
Luminous intensity (Iv) is the luminous flux (from a point source) emitted per unit solid angle
in a given direction. It is defined as
d
d vvI , (3)
where dΦv is the luminous flux leaving the source and propagating in an element of solid
angle dΩ containing the given direction.
Illuminance (Ev) is the density of the luminous flux incident on a given point of a surface or a
plane. It is defined as
A
Ed
d v
v
, (4)
where dv is the luminous flux incident on an element dA of the surface containing the
point.
Luminance (Lv) is the luminous flux from an element of a surface surrounding a given point,
emitted into a small solid angle containing the given direction, per unit area of the element
projected on a plane perpendicular to that given direction. It is defined as
cosΔΔ
Δlim v
0Δ,0Δv
AL
A
, (5)
where v is the luminous flux emitted (reflected or transmitted) by an elementary beam
passing through the given point and propagating in the solid angle containing the given
direction; A is the area of a section of that beam containing the given point; is the angle
between the normal to that section and the direction of the beam.
Luminance coefficient (q) is measured for opal glass and is defined as the ratio luminance to
Lv illuminance Ev, as defined by
v
v
E
Lq . (6)
6
This
pu
blic
atio
n is
availa
ble
free o
f charg
e fro
m: h
ttps://d
oi.o
rg/1
0.6
028
/NIS
T.S
P.2
50-9
5
Luminous exitance (Mv) is the density of luminous flux leaving a surface at a point. Eq. (6)
is the same as Eq. (4), with dv meaning the luminous flux leaving a surface. This quantity
is rarely used in the general practice of photometry. However, with the development and
application of organic light emitting diodes, this quantity may become more popular.
Luminous exposure (Hv) is the time integral of illuminance Ev(t) over a given duration t, as
defined by
t
dttEH )(vv . (7)
Luminous energy (Qv) is the time integral of the luminous flux (v) over a given duration
t, as defined by
t
dttQ )(vv . (8)
Color temperature (Tc) is the temperature of a Planckian radiator with radiation of the same
chromaticity as that of the light source in question. However, the chromaticity coordinates of
most lamps do not fall on the Planckian locus, and in actual lamp calibrations, either
distribution temperature or correlated color temperature is used. “Color temperature” is often
used informally for the correlated color temperature in the United States.
Distribution temperature (TD) is the temperature of a blackbody with a spectral power
distribution closest to that of the light source in question, and it is a useful concept for quasi-
Planckian sources.
Correlated color temperature (Tcp) is a concept used for sources with a spectral power
distribution significantly different from that of Planckian radiation, for example, discharge
lamps. Correlated color temperature is the temperature of the Planckian radiator whose
perceived color most closely resembles that of the light source in question.
General information (definitions, symbols, and expressions) on many other physical
quantities and units including photometric and radiometric quantities are given in
Reference 19.
1.2.2. Relationship between the SI units and English units
Under NIST policy [20], results of all NIST measurements are reported in SI units.
However, the English units shown in Table 2 are still rather widely used. For all the
photometric measurements and calculations, use of the SI units shown in Table 1 is
recommended, and use of non-SI units is discouraged [21]. The definitions of the English
units are described below for conversion purposes only.
7
This
pu
blic
atio
n is
availa
ble
free o
f charg
e fro
m: h
ttps://d
oi.o
rg/1
0.6
028
/NIS
T.S
P.2
50-9
5
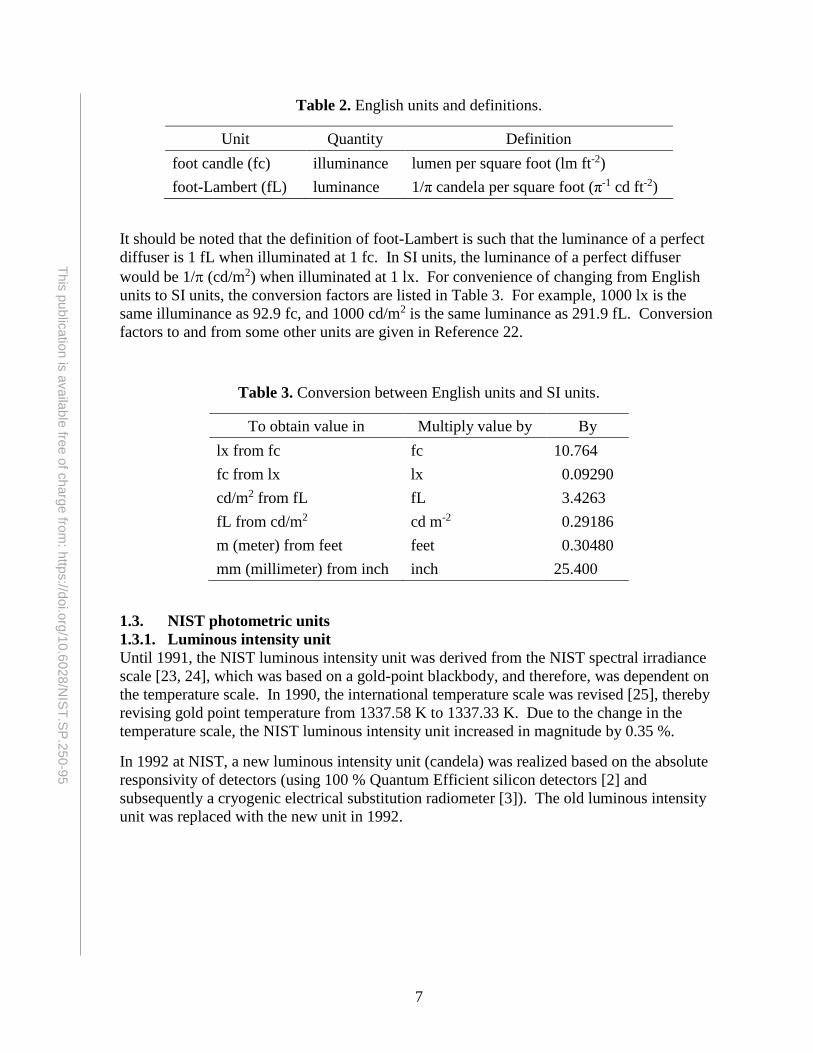
Table 2. English units and definitions.
Unit Quantity Definition
foot candle (fc) illuminance lumen per square foot (lm ft-2)
foot-Lambert (fL) luminance 1/π candela per square foot (π-1 cd ft-2)
It should be noted that the definition of foot-Lambert is such that the luminance of a perfect
diffuser is 1 fL when illuminated at 1 fc. In SI units, the luminance of a perfect diffuser
would be 1/ (cd/m2) when illuminated at 1 lx. For convenience of changing from English
units to SI units, the conversion factors are listed in Table 3. For example, 1000 lx is the
same illuminance as 92.9 fc, and 1000 cd/m2 is the same luminance as 291.9 fL. Conversion
factors to and from some other units are given in Reference 22.
Table 3. Conversion between English units and SI units.
To obtain value in Multiply value by By
lx from fc fc 10.764
fc from lx lx 0.09290
cd/m2 from fL fL 3.4263
fL from cd/m2 cd m-2 0.29186
m (meter) from feet feet 0.30480
mm (millimeter) from inch inch 25.400
1.3. NIST photometric units
1.3.1. Luminous intensity unit
Until 1991, the NIST luminous intensity unit was derived from the NIST spectral irradiance
scale [23, 24], which was based on a gold-point blackbody, and therefore, was dependent on
the temperature scale. In 1990, the international temperature scale was revised [25], thereby
revising gold point temperature from 1337.58 K to 1337.33 K. Due to the change in the
temperature scale, the NIST luminous intensity unit increased in magnitude by 0.35 %.
In 1992 at NIST, a new luminous intensity unit (candela) was realized based on the absolute
responsivity of detectors (using 100 % Quantum Efficient silicon detectors [2] and
subsequently a cryogenic electrical substitution radiometer [3]). The old luminous intensity
unit was replaced with the new unit in 1992.
8
This
pu
blic
atio
n is
availa
ble
free o
f charg
e fro
m: h
ttps://d
oi.o
rg/1
0.6
028
/NIS
T.S
P.2
50-9
5
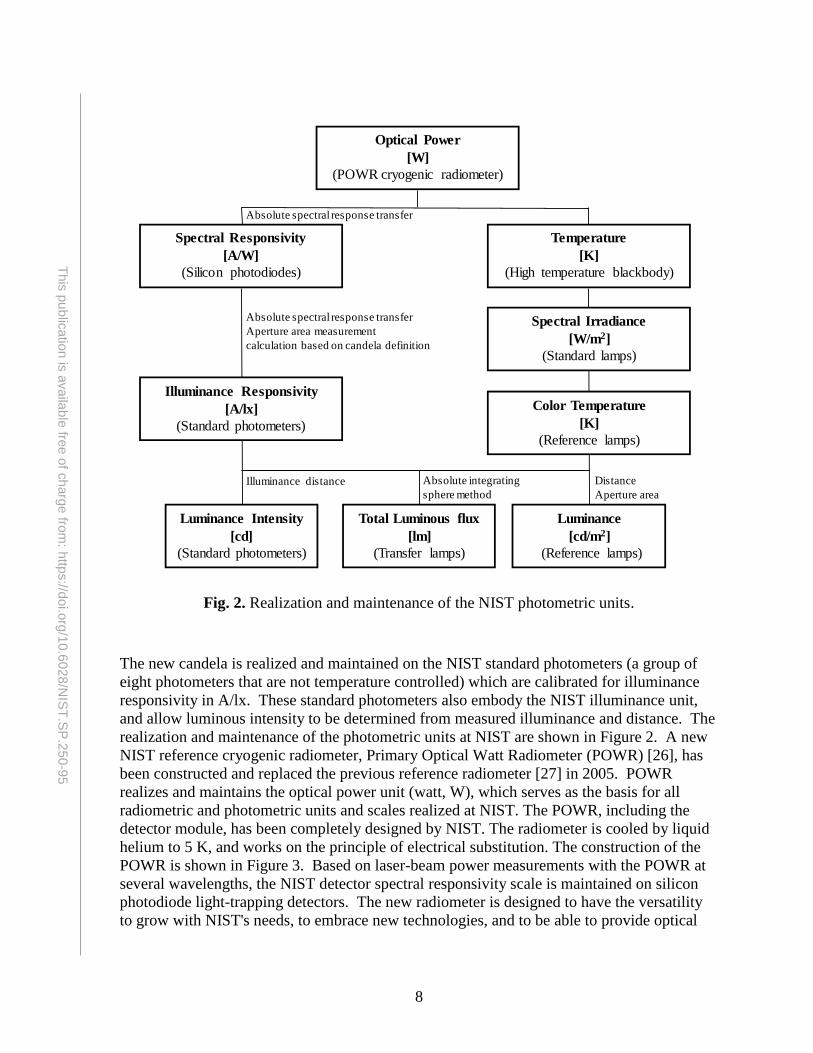
Fig. 2. Realization and maintenance of the NIST photometric units.
The new candela is realized and maintained on the NIST standard photometers (a group of
eight photometers that are not temperature controlled) which are calibrated for illuminance
responsivity in A/lx. These standard photometers also embody the NIST illuminance unit,
and allow luminous intensity to be determined from measured illuminance and distance. The
realization and maintenance of the photometric units at NIST are shown in Figure 2. A new
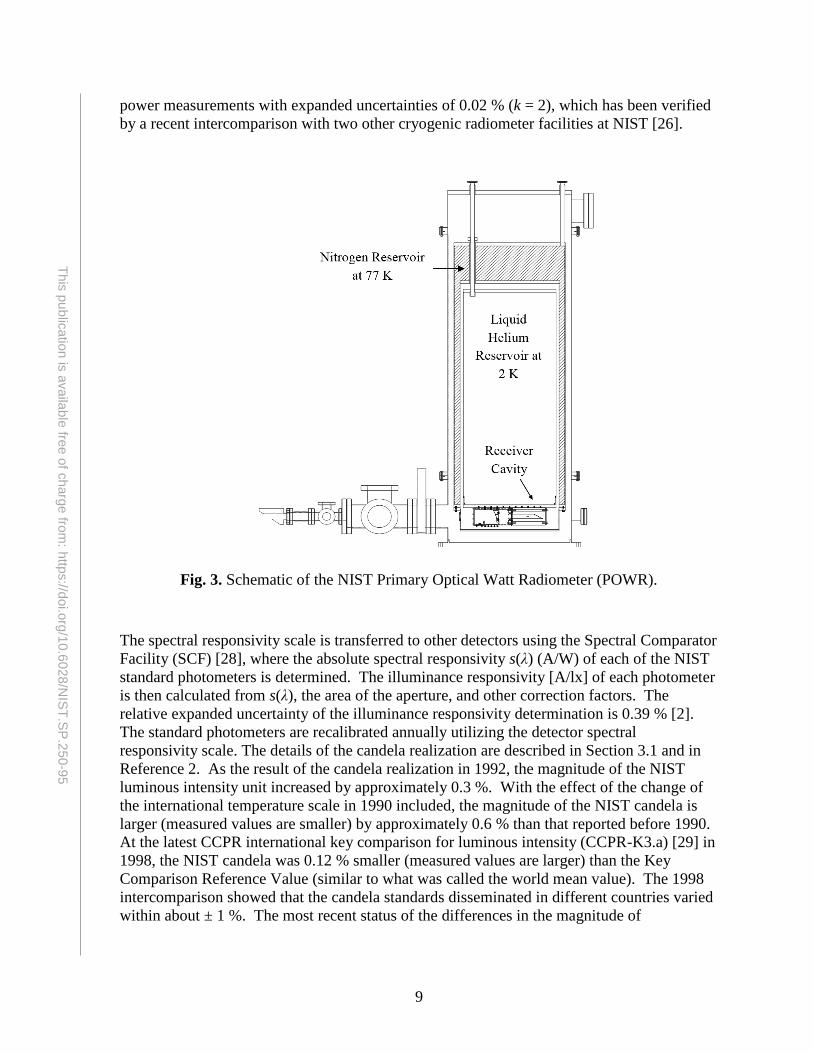
NIST reference cryogenic radiometer, Primary Optical Watt Radiometer (POWR) [26], has
been constructed and replaced the previous reference radiometer [27] in 2005. POWR
realizes and maintains the optical power unit (watt, W), which serves as the basis for all
radiometric and photometric units and scales realized at NIST. The POWR, including the
detector module, has been completely designed by NIST. The radiometer is cooled by liquid
helium to 5 K, and works on the principle of electrical substitution. The construction of the
POWR is shown in Figure 3. Based on laser-beam power measurements with the POWR at
several wavelengths, the NIST detector spectral responsivity scale is maintained on silicon
photodiode light-trapping detectors. The new radiometer is designed to have the versatility
to grow with NIST's needs, to embrace new technologies, and to be able to provide optical
Absolute spectral response transfer
Distance
Aperture area
Absolute integrating
sphere method
Illuminance distance
Absolute spectral response transfer
Aperture area measurement
calculation based on candela definition
Optical Power
[W]
(POWR cryogenic radiometer)
Temperature
[K]
(High temperature blackbody)
Spectral Responsivity
[A/W]
(Silicon photodiodes)
Spectral Irradiance
[W/m2]
(Standard lamps)
Illuminance Responsivity
[A/lx]
(Standard photometers)
Color Temperature
[K]
(Reference lamps)
Luminance Intensity
[cd]
(Standard photometers)
Luminance
[cd/m2]
(Reference lamps)
Total Luminous flux
[lm]
(Transfer lamps)
9
This
pu
blic
atio
n is
availa
ble
free o
f charg
e fro
m: h
ttps://d
oi.o
rg/1
0.6
028
/NIS
T.S
P.2
50-9
5
power measurements with expanded uncertainties of 0.02 % (k = 2), which has been verified
by a recent intercomparison with two other cryogenic radiometer facilities at NIST [26].
Fig. 3. Schematic of the NIST Primary Optical Watt Radiometer (POWR).
The spectral responsivity scale is transferred to other detectors using the Spectral Comparator
Facility (SCF) [28], where the absolute spectral responsivity s(λ) (A/W) of each of the NIST
standard photometers is determined. The illuminance responsivity [A/lx] of each photometer
is then calculated from s(λ), the area of the aperture, and other correction factors. The
relative expanded uncertainty of the illuminance responsivity determination is 0.39 % [2].
The standard photometers are recalibrated annually utilizing the detector spectral
responsivity scale. The details of the candela realization are described in Section 3.1 and in
Reference 2. As the result of the candela realization in 1992, the magnitude of the NIST
luminous intensity unit increased by approximately 0.3 %. With the effect of the change of
the international temperature scale in 1990 included, the magnitude of the NIST candela is
larger (measured values are smaller) by approximately 0.6 % than that reported before 1990.
At the latest CCPR international key comparison for luminous intensity (CCPR-K3.a) [29] in
1998, the NIST candela was 0.12 % smaller (measured values are larger) than the Key
Comparison Reference Value (similar to what was called the world mean value). The 1998
intercomparison showed that the candela standards disseminated in different countries varied
within about ± 1 %. The most recent status of the differences in the magnitude of
10
This
pu
blic
atio
n is
availa
ble
free o
f charg
e fro
m: h
ttps://d
oi.o
rg/1
0.6
028
/NIS
T.S
P.2
50-9
5
photometric units for different countries in the world is published on the BIPM website
http://www.bipm.org/.
1.3.2. Luminous flux unit
Until 1994, the NIST luminous flux unit was derived from the previous luminous intensity
unit which was based on blackbody radiation. The previous luminous flux unit was last
realized in 1985 by goniophotometric measurements [1], and was maintained on a group of
six incandescent standard lamps. The unit was periodically transferred to groups of working
standard lamps used for routine calibrations.
In 1995, a new NIST luminous flux unit was derived, based on the detector-based candela
introduced in 1992, with a new method using an integrating sphere and an external source.
The basic principle of this method (Absolute Integrating Sphere Method) is to measure the
total flux of a lamp inside the sphere compared to a known amount of flux introduced into
the sphere from a source outside the sphere.
This method was first studied theoretically using a computer simulation technique [30], then
experimentally verified [31] using a 0.5 m integrating sphere. Utilizing this method with a
2 m integrating sphere, the new NIST luminous flux unit was established in 1995 [32, 33]. A
new total luminous flux calibration facility using a 2.5 m sphere was developed at NIST
[4, 34]. Primary standard lamps are calibrated periodically against the NIST illuminance unit
in order to monitor the luminous flux unit. The 2.5 m absolute integrating sphere is used to
provide routine calibrations. The details of the luminous flux unit realization are described in
Section 4.1.
The realization of the 1995 luminous flux unit has resulted in a change (increase) of the
magnitude of NIST luminous flux unit by approximately 1.1 % compared to older
realizations. The measured lumen values reported by NIST are smaller by that percentage
than those previously reported. The new luminous flux unit has been disseminated in NIST
calibrations since January 1, 1996. At the latest CCPR international key comparison for total
luminous flux (CCPR-K4) [29] in 1998, the NIST lumen was larger (measured value was
smaller) by 0.21 % than the key comparison reference value. This intercomparison showed
that the lumen standards disseminated in different countries varied within about ± 1 %.
1.3.3. Luminous exposure unit
The photometric measurement of flashing light is essential in the evaluation of various
flashing-light sources used in many applications including photography and signaling in
transportation. Among them, a need for accurate measurements of aircraft anticollision
flashing lights is addressed by the Federal Aviation Administration [35]. The Federal
Aviation Administration has specified the requirements for the intensity of anticollision
flashing lights [36] and is enforcing the maintenance of the anticollision flashing lights on all
commercial airplanes.
In the specification of aircraft anticollision flashing lights and other vehicle signals using
flashing lights, the term effective intensity (unit: cd) is widely used. Effective intensity is the
luminous intensity of a fixed (steady) light, of the same relative spectral distribution as the
flashing light, which would have the same luminous intensity level as the flashing light under
identical conditions of observation [37]. Effective intensity Iv is calculated from Jv, the time-
11
This
pu
blic
atio
n is
availa
ble
free o
f charg
e fro
m: h
ttps://d
oi.o
rg/1
0.6
028
/NIS
T.S
P.2
50-9
5
integrated luminous intensity [cd·s], and a model based on visual perception. The variable,
Jv (= ∫ 𝐼v(𝑡)𝑇
0𝑑𝑡), is defined as the time integral of instantaneous luminous intensity Iv(t) of a
flash over the flash duration T.
Four effective intensity models are available: the Allard method [38], the Blondel-Rey
equation [39], the Form Factor method [40], and the Modified Allard method [41]. The
Blondel-Rey equation, developed in 1911, is most commonly used. The use of one single
method has not been agreed upon internationally. All four methods give the same result for a
very narrow, single pulse, as one emitted by a xenon flash tube. For such a very narrow
single pulse, the effective intensity can be approximated to be five times the time-integrated
luminous intensity. The integrated luminous intensity Jv (= Hv×d2) can also be obtained by
measuring the luminous exposure, Hv [lx·s] (see Eq. 7), and the photometer-to-source
distance, d.
In order to calibrate photometers designed for measurement of the flashing lights, NIST
established a luminous exposure scale in 1997 [42].
2. Outline of the calibration services
This section provides a list and brief description of the photometric calibration services
currently available at NIST and covered in this SP250. In addition to the photometric
calibration services in this SP250, additional documents will cover new photometric
calibration procedures for average LED intensity (candela; cd), LED total luminous flux of
LEDs (lumen; lm), colorimetry of LEDs, and spectrally integrated total radiant flux of LEDs
(watt; W), along with new procedures for the total spectral radiant flux calibrations of
incandescent light sources. For the updated information, please check the NIST photometry
calibration service website https://www.nist.gov/calibrations/photometric-measurements-
calibrations#37010C
All the calibration services listed here, including the Special Tests, are provided routinely.
Fixed services (Test Numbers ending in the letter C) are those in which NIST issues
calibrated artifacts to customers. Special Tests (Test Number ending with the letter S), on
the other hand, are those in which NIST calibrates artifacts submitted by customers. The fees
for the fixed services are listed in the NIST Calibration Services Users Guide (SP250) [6].
The fees for Special Tests depend on the type of artifacts, number of artifacts, measurement
range requested, etc. Calibrations on Special Test items or under special conditions, other
than listed, may be available after consultation as Special Photometric Tests 37100S. The
details of the artifacts and measurement procedures for calibration are described in Sections 3
through 7.
37010C - Luminous Intensity and Correlated Color Temperature Standard Lamp
NIST will issue to the customer a 1000 W modified FEL (a lamp-type designation, but not an
acronym, of the American National Standards Institute or ANSI) quartz-halogen lamp
calibrated for luminous intensity (candela) and correlated color temperature (Kelvin). This
lamp has a double coil filament and a clear bulb, and is potted on a medium bipost base. The
lamp is operated at approximately 7.3 A/85 V dc, at a correlated color temperature of
2856 K. The relative expanded uncertainty of the luminous intensity of this lamp is less than
12
This
pu
blic
atio
n is
availa
ble
free o
f charg
e fro
m: h
ttps://d
oi.o
rg/1
0.6
028
/NIS
T.S
P.2
50-9
5
0.6 % (k = 2) and the expanded uncertainty of the correlated color temperature is 8 K (k = 2)
at 2856 K.
37020S - Special Tests for Luminous Intensity and Correlated Color Temperature of Submitted
Lamps
NIST will calibrate the luminous intensity and correlated color temperature of incandescent
lamps submitted by customers. The inside frosted lamps, the airway beacon lamps, and the
1000 W FEL lamps previously issued by NIST can be submitted for recalibration. Customers
can specify either the lamp current or the correlated color temperature of the lamp (normally
2856 K) for calibration. The relative expanded uncertainty of the luminous intensity of these
lamps is typically 0.6 % (k = 2) and the expanded uncertainty of the correlated color
temperature is 8 K (k = 2) at 2856 K.
37030C - Correlated Color Temperature Standard Lamp
NIST will issue to the customer a 1000 W modified FEL quartz halogen lamp as described in
37010C calibrated for correlated color temperature. The lamp is usually calibrated for a
correlated color temperature of 2856 K. The expanded uncertainty of the correlated color
temperature of these lamps is 8 K (k = 2) at 2856 K.
37040C - Each Additional Correlated Color Temperature for 37030C
The correlated color temperature standard lamp issued for 37030C can be calibrated for
additional correlated color temperature points in a range from 2000 K to 3200 K. The
expanded uncertainty of this calibration is 5 K to 11 K (k = 2) in the range from 2000 K to
3200 K.
37050S - Special Tests for Correlated Color Temperature of Submitted Lamps
NIST will calibrate the correlated color temperature of incandescent lamps submitted by
customers. The inside frosted lamps, the airway beacon lamps, and the 1000 W FEL lamps
previously issued by NIST can be submitted for recalibration. The range of correlated color
temperature points is from 2000 K to 3200 K. The expanded uncertainty of this calibration is
5 K to 11 K (k = 2) in the range from 2000 K to 3200 K.
37060S - Special Tests for Total Luminous Flux of Submitted Incandescent and Fluorescent
Lamps
NIST will calibrate the total luminous flux (lumen) of incandescent lamps and fluorescent
lamps submitted by customers. The standard lamps previously issued by NIST can be
submitted for recalibration. Miniature lamps may also be accepted. Customers should contact
NIST before submitting lamps. The relative expanded uncertainty of this calibration is
typically 0.8 % (k = 2) for incandescent lamps and 2.0 % (k = 2) for fluorescent lamps, which
depend upon the reproducibility of the test lamps.
37070C - Opal Glass Luminance Coefficient Standards
NIST will issue a flashed opal glass plate, 51 mm x 51 mm, calibrated for luminance
coefficient (ratio of luminance/illuminance, unit: sr–1) for CIE Illuminant A (2856 K source).
The glass plate, masked with a circular aperture 25 mm in diameter, is calibrated for the
luminance coefficient within a circular area of 1 cm in diameter in the center of the aperture.
The relative expanded uncertainty of this calibration is 0.5 % (k = 2).
13
This
pu
blic
atio
n is
availa
ble
free o
f charg
e fro
m: h
ttps://d
oi.o
rg/1
0.6
028
/NIS
T.S
P.2
50-9
5
37080S - Special Tests for Submitted Luminance Sources and Transmitting Diffusers
NIST will calibrate luminance (cd/m2) of submitted sources or the luminance coefficient
(sr-1) of submitted transmitting diffusers, including opal glass previously issued by NIST.
Customers should contact NIST before sending sources or diffusers. The relative expanded
uncertainty of luminance calibration is typically less than 0.8 % (k = 2).
37090S - Special Tests for Submitted Photometers, Illuminance Meters, and Luminance Meters
NIST is capable of calibrating photometers, illuminance meters, and luminance meters
submitted by customers. Calibration is normally performed using a CIE Illuminant A source
(2856 K incandescent source).
37091S - Special Test for Submitted Illuminance Head or Illuminance Meter for Illuminance
Responsivity
NIST will calibrate illuminance photometers and illuminance meters submitted by customers
for illuminance responsivities. Calibration is performed at illuminance levels from 0.1 lx to
3000 lx. Calibrations at higher illuminance levels (up to 100 klx) are also available under
special arrangements. The relative expanded calibration uncertainty (k = 2) is typically 0.5 %,
which may increase at low illuminance levels close to 0.1 lx or high illuminance levels close
to 100 klx. As an option, NIST can also measure the spectral responsivity of a submitted
illuminance photometer and calculate the spectral mismatch correction factor for a source
with a known spectral power distribution.
37092S - Special Test for Submitted Luminance Head or Luminance Meter for Luminance
Responsivity
NIST will calibrate luminance photometers and luminance meters submitted by customers
for luminance responsivities. Calibration is performed at luminance levels from 0.1 cd/m2 to
8000 cd/m2. The relative expanded calibration uncertainty (k = 2) is typically 0.7 %, which
may increase at low luminance levels close to 0.1 cd/m2.
37100S - Special Photometric Tests
NIST can provide special tests for sources, detectors, and photometric instruments other than
those stated above under limited conditions by special arrangements with NIST. Customers
should contact NIST for consultation.
37110S - Special Tests for Submitted Flash Photometers
NIST will calibrate submitted flash photometers designed for measuring luminous exposure
[lx·s] or effective intensity [cd]. Calibration is normally performed with white light
(6500 K) from a Xenon strobe light in the range of 1 lx·s to 100 lx·s and with red light
using an Aviation Red filter covering the Xenon strobe light. The relative expanded
uncertainty of calibration is 1 % (k = 2) or larger depending on the performance of the flash
photometer under test.
37130S - Special Tests for Luminous Intensity and Luminous Flux of LEDs
NIST is capable of calibrating various light emitting diodes (LEDs) submitted by customers
including low-power, mid-power, and high-power LED packages, LED arrays or modules,
14
This
pu
blic
atio
n is
availa
ble
free o
f charg
e fro
m: h
ttps://d
oi.o
rg/1
0.6
028
/NIS
T.S
P.2
50-9
5
LED light engines, LED lamps, following measurement standards such as IES 79 and CIE S
025 for measurement of LED lamps and LED luminaires, IES 85, CIE 225:2017, and CIE
226-2017 for measurement of high-power LED packages at a specified junction temperature,
and CIE 127:2007 for measurement of low power LED packages.
37131S - Special Test for Submitted LEDs for Luminous and/or Radiant Intensity and Color
(Optional)
NIST can calibrate submitted LEDs for Averaged LED Intensity under the CIE Standard
Conditions A and B (defined in CIE 127:2007), true luminous/radiant intensity as defined in
CIE 225:2017, and color characteristics. The relative expanded uncertainty (k = 2) for an
intensity calibration varies from 0.5 % to 2 % depending on the test LED, and less than 0.001
in chromaticity for a color characteristic calibration.
37132S - Special Test for Submitted LEDs for total Luminous Flux and/or Total Radiant
Flux and Color (Optional)
NIST will calibrate submitted LEDs for total luminous flux (lm), total radiant flux (W), and
color characteristics using the detector-based 2.5 m absolute integrating sphere. The relative
expanded uncertainty (k = 2) for a total flux calibration varies from 0.5 % to 1.5 % depending
on the test LED, and less than 0.001 in chromaticity for a color characteristic calibration.
3. Luminous intensity and illuminance responsivity calibrations
3.1. Photometry, physical photometry, and radiometry
As stated in Section 1.3, the NIST candela is realized and maintained on a group of eight
NIST standard photometers. The illuminance responsivity (A/lx) of the photometers is
calibrated annually utilizing the NIST spectral responsivity scale. The principles of the
calibration of the photometers are described below.
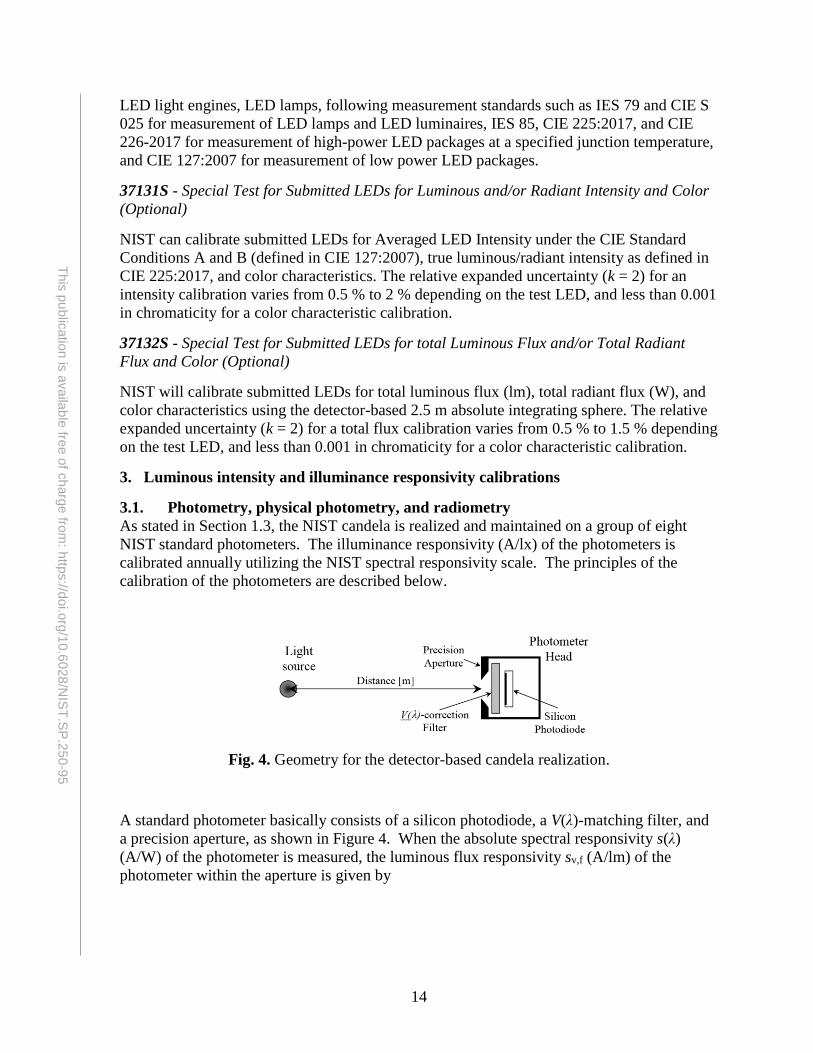
Fig. 4. Geometry for the detector-based candela realization.
A standard photometer basically consists of a silicon photodiode, a V(λ)-matching filter, and
a precision aperture, as shown in Figure 4. When the absolute spectral responsivity s(λ)
(A/W) of the photometer is measured, the luminous flux responsivity sv,f (A/lm) of the
photometer within the aperture is given by
15
This
pu
blic
atio
n is
availa
ble
free o
f charg
e fro
m: h
ttps://d
oi.o
rg/1
0.6
028
/NIS
T.S
P.2
50-9
5
d)()(
d)()(
tm
t
fv,VSK
sSs
, (9)
where St(λ) is the spectral power distribution of the lamp to measure, V(λ) is the spectral
luminous efficiency function, and Km is the maximum spectral efficacy (683 lm/W). Usually
a Planckian radiator at 2856 K (CIE Illuminant A) [43] is used to provide the light flux SA(λ),
but a different source distribution may be chosen. If the area, A (m2) of the aperture is
known and the responsivity sv,f is uniform over the aperture, the illuminance responsivity sv,i
(A/lx) of the photometer is given by
fv,iv, sAs . (10)
When a photometer calibrated for sv,i is used to measure the illuminance from a point source,
the luminous intensity Iv (cd) of the source is given by
iv,
2
v / sydI , (11)
where d is the distance (m) from the light source to the aperture surface of the photometer
and y is the output current (A) of the photometer. In practice, d must be larger than the
minimum distance where the deviation from the inverse square law of the light source is
negligibly small.
16
This
pu
blic
atio
n is
availa
ble
free o
f charg
e fro
m: h
ttps://d
oi.o
rg/1
0.6
028
/NIS
T.S
P.2
50-9
5
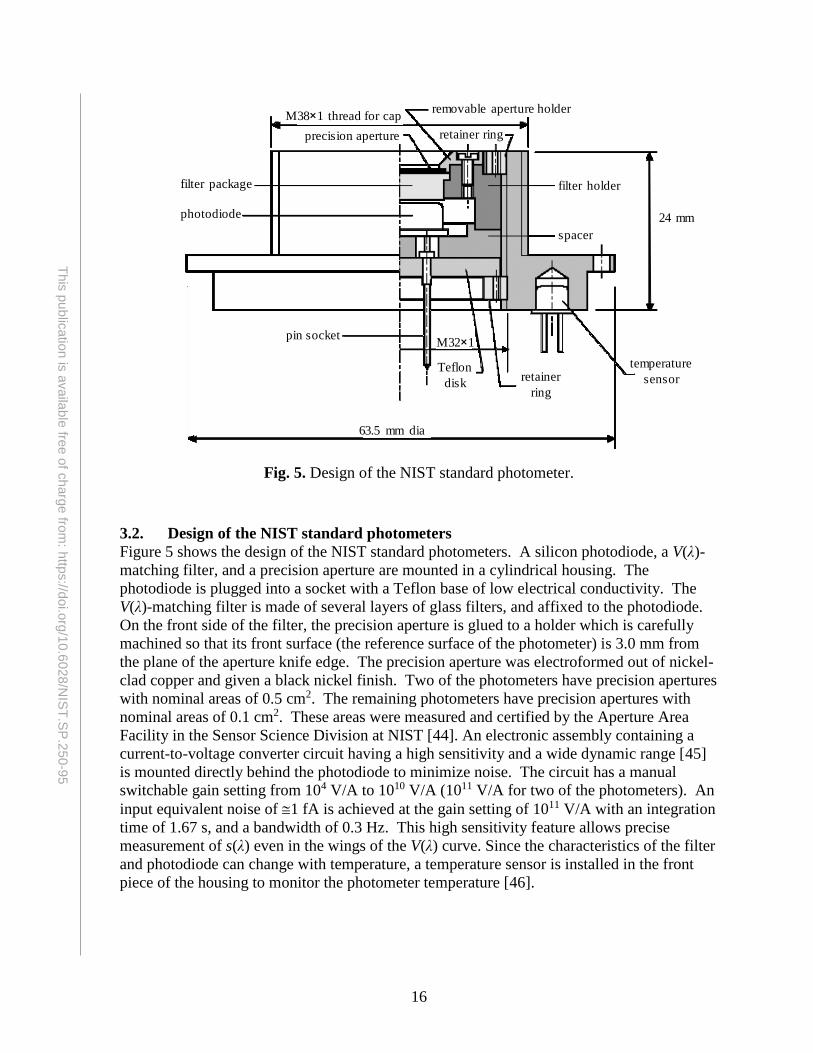
Fig. 5. Design of the NIST standard photometer.
3.2. Design of the NIST standard photometers
Figure 5 shows the design of the NIST standard photometers. A silicon photodiode, a V(λ)-
matching filter, and a precision aperture are mounted in a cylindrical housing. The
photodiode is plugged into a socket with a Teflon base of low electrical conductivity. The
V(λ)-matching filter is made of several layers of glass filters, and affixed to the photodiode.
On the front side of the filter, the precision aperture is glued to a holder which is carefully
machined so that its front surface (the reference surface of the photometer) is 3.0 mm from
the plane of the aperture knife edge. The precision aperture was electroformed out of nickel-
clad copper and given a black nickel finish. Two of the photometers have precision apertures
with nominal areas of 0.5 cm2. The remaining photometers have precision apertures with
nominal areas of 0.1 cm2. These areas were measured and certified by the Aperture Area
Facility in the Sensor Science Division at NIST [44]. An electronic assembly containing a
current-to-voltage converter circuit having a high sensitivity and a wide dynamic range [45]
is mounted directly behind the photodiode to minimize noise. The circuit has a manual
switchable gain setting from 104 V/A to 1010 V/A (1011 V/A for two of the photometers). An
input equivalent noise of 1 fA is achieved at the gain setting of 1011 V/A with an integration
time of 1.67 s, and a bandwidth of 0.3 Hz. This high sensitivity feature allows precise
measurement of s(λ) even in the wings of the V(λ) curve. Since the characteristics of the filter
and photodiode can change with temperature, a temperature sensor is installed in the front
piece of the housing to monitor the photometer temperature [46].
filter package
photodiode
pin socket
precision aperture retainer ring
retainer
ring
63.5 mm dia
temperature
sensor
M32 1
Teflon
disk
M38 1 thread for capremovable aperture holder
24 mm
filter holder
spacer
17
This
pu
blic
atio
n is
availa
ble
free o
f charg
e fro
m: h
ttps://d
oi.o
rg/1
0.6
028
/NIS
T.S
P.2
50-9
5
3.3. Realization of the NIST illuminance responsivity unit
3.3.1. Calibration of the NIST standard photometers
The spectral responsivity s(λ) [A/W] of the photometers is measured with the NIST SCF at
5 nm intervals. The photometer aperture is underfilled with a beam of 1 mm diameter from
the monochromator positioned at the center of the aperture. The SCF has a triangular
bandpass with a bandwidth of 4 nm at full width half maximum (FWHM). The error due to
the bandpass is corrected using the Stearns and Stearns method [47], but it is negligible. The
magnitude of the bandpass correction in sv,f is 0.1 %, and the residual standard uncertainty
is estimated to be 0.02 %. The responsivity of the photometer is then mapped over the entire
area of the precision aperture at several wavelengths. From the mapping data, the ratio of the
average responsivity over the aperture to the responsivity at the center of the aperture is
calculated and applied in the responsivity calculation. The illuminance responsivity of NIST
photometers, sv,i [A/lx], is calculated for Planckian radiation at 2856 K (CIE Illuminant A)
according to Eqs. (9) and (10). The f1’ values of the eight photometers range from 1.8 % to
7 %. The f1’ is a term defined by CIE [48] to indicate the degree of spectral mismatch of a
photometer to the V(λ) function.
The expanded uncertainty of the spectral power responsivity s(λ) measured by the SCF is
stated to be 0.22 % (k = 2) in the visible region [28], thus an uncertainty contribution of
0.11 %, which is the value for typical photodiodes whose spectral responsivity curve is fairly
linear in the visible region. For measurement of photometers by the SCF, additional
uncertainty components are considered due to the sharply changing spectral responsivity
curve and fairly thick V(λ)-matching filter ( 4 mm) used in the photometer. These are the
uncertainty contributions due to the wavelength scale uncertainty (0.05 %), bandpass
correction (0.02 %), and the effect of the converging beam with f/9 numerical aperture
(0.05 %).
To determine the illuminance responsivity, there are additional corrections and uncertainties
related to the characteristics of photometers themselves, as discussed in the following
sections.
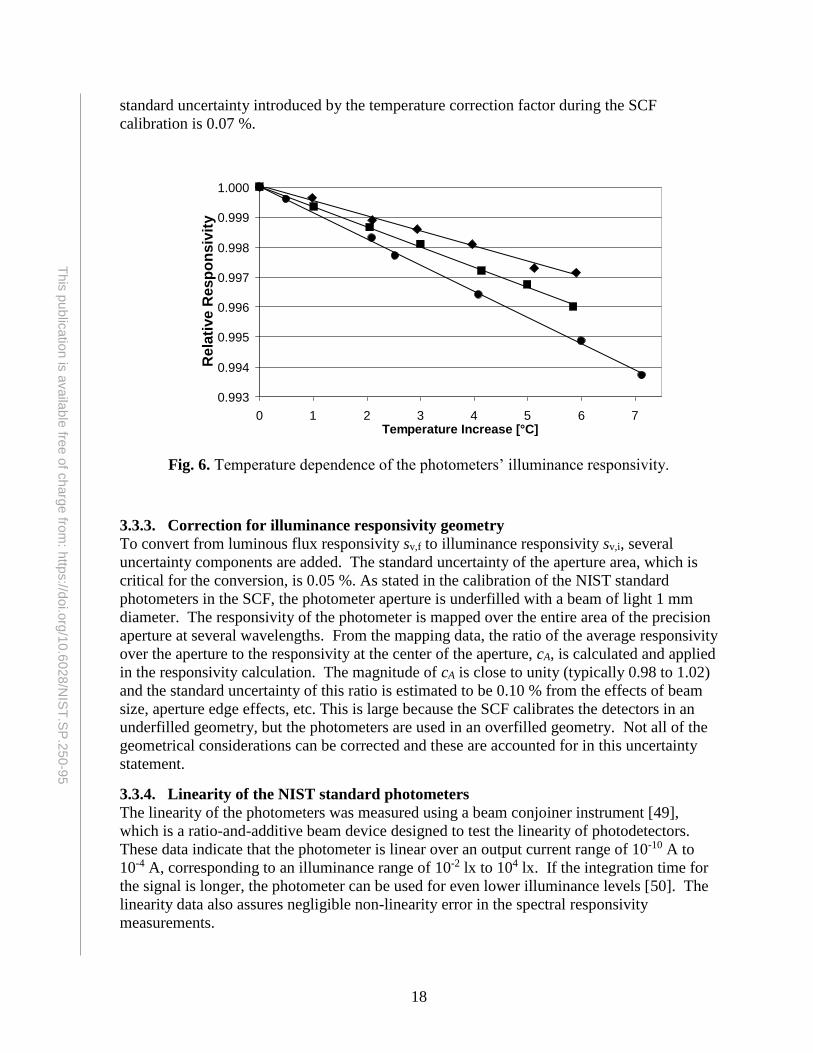
3.3.2. Correction for the photometer temperature
The NIST photometers are temperature monitored not controlled, and V()-matching filters
typically have a temperature dependence on the order of -0.1 %/°C. The temperature
coefficients of the illuminance responsivity of the photometers, measured in a temperature-
controlled chamber, are shown in Figure 6. The figure shows the data for three different
photometers in the group. The temperature coefficients, cp, for the eight photometers range
from -0.049 %/°C to -0.088 %/°C. Whenever the photometers are used, the temperature
correction factor, cT, as given by.
ppT )25(1 cTc , (12)
is calculated, which is multiplied to the photometer output signal. Using this correction, the
photometer signals are always converted to signals at 25 °C. When the photometers are
calibrated at the SCF, the determined photometric responsivity is given at 25 °C. The
18
This
pu
blic
atio
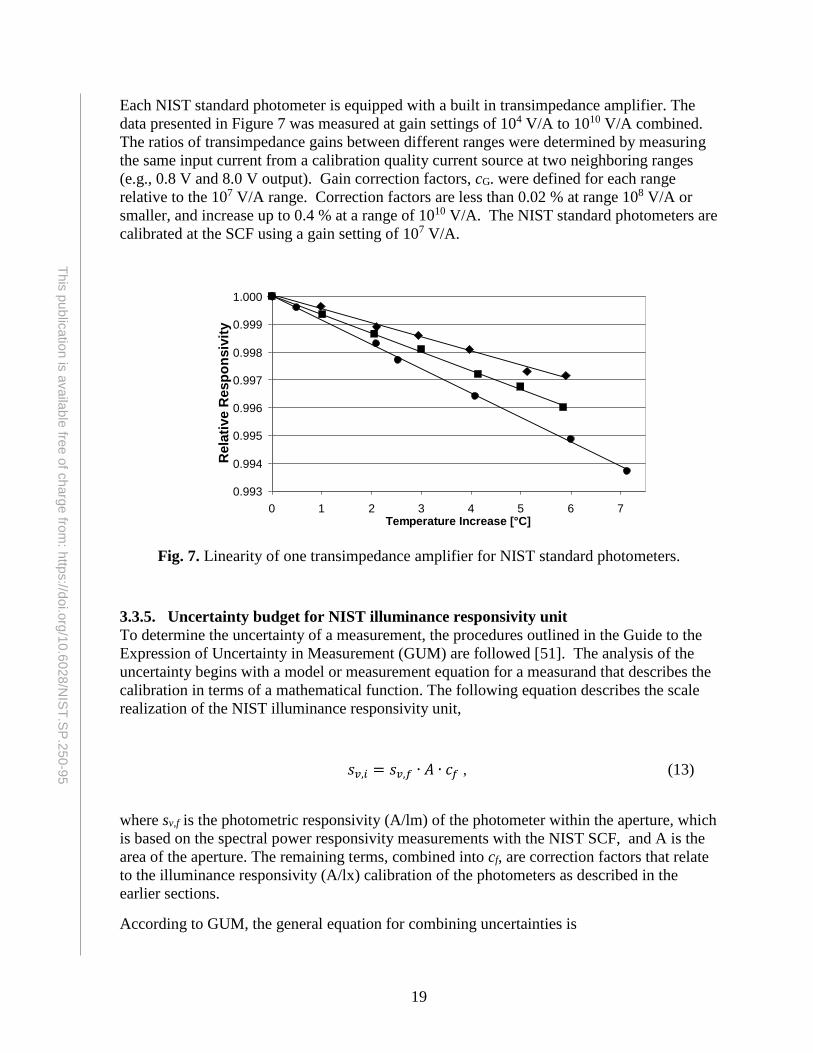
n is
availa
ble
free o
f charg
e fro
m: h
ttps://d
oi.o
rg/1
0.6
028
/NIS
T.S
P.2
50-9
5
standard uncertainty introduced by the temperature correction factor during the SCF
calibration is 0.07 %.
Fig. 6. Temperature dependence of the photometers’ illuminance responsivity.
3.3.3. Correction for illuminance responsivity geometry
To convert from luminous flux responsivity sv,f to illuminance responsivity sv,i, several
uncertainty components are added. The standard uncertainty of the aperture area, which is
critical for the conversion, is 0.05 %. As stated in the calibration of the NIST standard
photometers in the SCF, the photometer aperture is underfilled with a beam of light 1 mm
diameter. The responsivity of the photometer is mapped over the entire area of the precision
aperture at several wavelengths. From the mapping data, the ratio of the average responsivity
over the aperture to the responsivity at the center of the aperture, cA, is calculated and applied
in the responsivity calculation. The magnitude of cA is close to unity (typically 0.98 to 1.02)
and the standard uncertainty of this ratio is estimated to be 0.10 % from the effects of beam
size, aperture edge effects, etc. This is large because the SCF calibrates the detectors in an
underfilled geometry, but the photometers are used in an overfilled geometry. Not all of the
geometrical considerations can be corrected and these are accounted for in this uncertainty
statement.
3.3.4. Linearity of the NIST standard photometers
The linearity of the photometers was measured using a beam conjoiner instrument [49],
which is a ratio-and-additive beam device designed to test the linearity of photodetectors.
These data indicate that the photometer is linear over an output current range of 10-10 A to
10-4 A, corresponding to an illuminance range of 10-2 lx to 104 lx. If the integration time for
the signal is longer, the photometer can be used for even lower illuminance levels [50]. The
linearity data also assures negligible non-linearity error in the spectral responsivity
measurements.
0.993
0.994
0.995
0.996
0.997
0.998
0.999
1.000
0 1 2 3 4 5 6 7Temperature Increase [°C]
Rela
tive R
esp
on
siv
ity
19
This
pu
blic
atio
n is
availa
ble
free o
f charg
e fro
m: h
ttps://d
oi.o
rg/1
0.6
028
/NIS
T.S
P.2
50-9
5
Each NIST standard photometer is equipped with a built in transimpedance amplifier. The
data presented in Figure 7 was measured at gain settings of 104 V/A to 1010 V/A combined.
The ratios of transimpedance gains between different ranges were determined by measuring
the same input current from a calibration quality current source at two neighboring ranges
(e.g., 0.8 V and 8.0 V output). Gain correction factors, cG. were defined for each range
relative to the 107 V/A range. Correction factors are less than 0.02 % at range 108 V/A or
smaller, and increase up to 0.4 % at a range of 1010 V/A. The NIST standard photometers are
calibrated at the SCF using a gain setting of 107 V/A.
Fig. 7. Linearity of one transimpedance amplifier for NIST standard photometers.
3.3.5. Uncertainty budget for NIST illuminance responsivity unit
To determine the uncertainty of a measurement, the procedures outlined in the Guide to the
Expression of Uncertainty in Measurement (GUM) are followed [51]. The analysis of the
uncertainty begins with a model or measurement equation for a measurand that describes the
calibration in terms of a mathematical function. The following equation describes the scale
realization of the NIST illuminance responsivity unit,
𝑠𝑣,𝑖 = 𝑠𝑣,𝑓 ∙ 𝐴 ∙ 𝑐𝑓 , (13)
where sv,f is the photometric responsivity (A/lm) of the photometer within the aperture, which
is based on the spectral power responsivity measurements with the NIST SCF, and A is the
area of the aperture. The remaining terms, combined into cf, are correction factors that relate
to the illuminance responsivity (A/lx) calibration of the photometers as described in the
earlier sections.
According to GUM, the general equation for combining uncertainties is
0.993
0.994
0.995
0.996
0.997
0.998
0.999
1.000
0 1 2 3 4 5 6 7Temperature Increase [°C]
Rela
tive R
esp
on
siv
ity
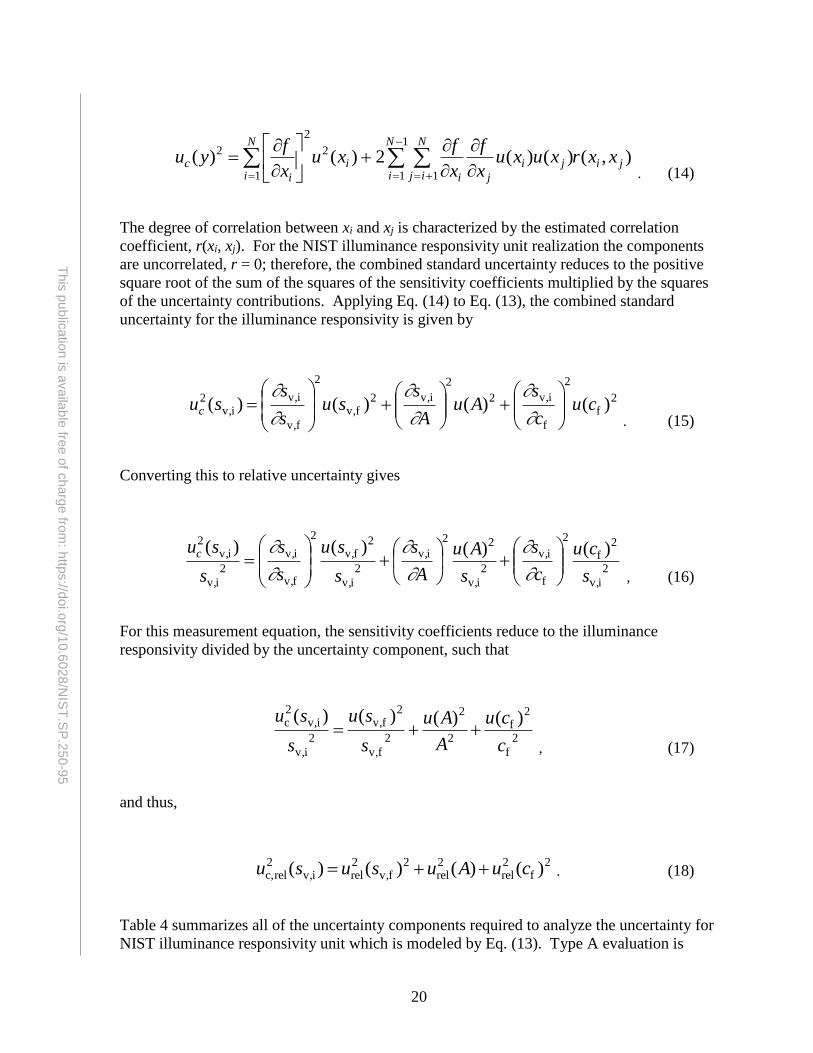
20
This
pu
blic
atio
n is
availa
ble
free o
f charg
e fro
m: h
ttps://d
oi.o
rg/1
0.6
028
/NIS
T.S
P.2
50-9
5
N
i
N
iji
N
ijji
ji
i
i
c xxrxuxux
f
x
fxu
x
fyu
1
1
1 1
2
2
2 ),()()(2)()( . (14)
The degree of correlation between xi and xj is characterized by the estimated correlation
coefficient, r(xi, xj). For the NIST illuminance responsivity unit realization the components
are uncorrelated, r = 0; therefore, the combined standard uncertainty reduces to the positive
square root of the sum of the squares of the sensitivity coefficients multiplied by the squares
of the uncertainty contributions. Applying Eq. (14) to Eq. (13), the combined standard
uncertainty for the illuminance responsivity is given by
2f
2
f
iv,2
2
iv,2fv,
2
fv,
iv,iv,
2 )()()()( cuc
sAu
A
ssu
s
ssuc
. (15)
Converting this to relative uncertainty gives
2
iv,
2f
2
f
iv,
2
iv,
22
iv,
2
iv,
2fv,
2
fv,
iv,
2
iv,
iv,2
)()()()(
s
cu
c
s
s
Au
A
s
s
su
s
s
s
suc
, (16)
For this measurement equation, the sensitivity coefficients reduce to the illuminance
responsivity divided by the uncertainty component, such that
2
f
2f
2
2
2
fv,
2fv,
2
iv,
iv,2c )()()()(
c
cu
A
Au
s
su
s
su
, (17)
and thus,
2
f2rel
2rel
2fv,
2reliv,
2relc, )()()()( cuAususu . (18)
Table 4 summarizes all of the uncertainty components required to analyze the uncertainty for
NIST illuminance responsivity unit which is modeled by Eq. (13). Type A evaluation is
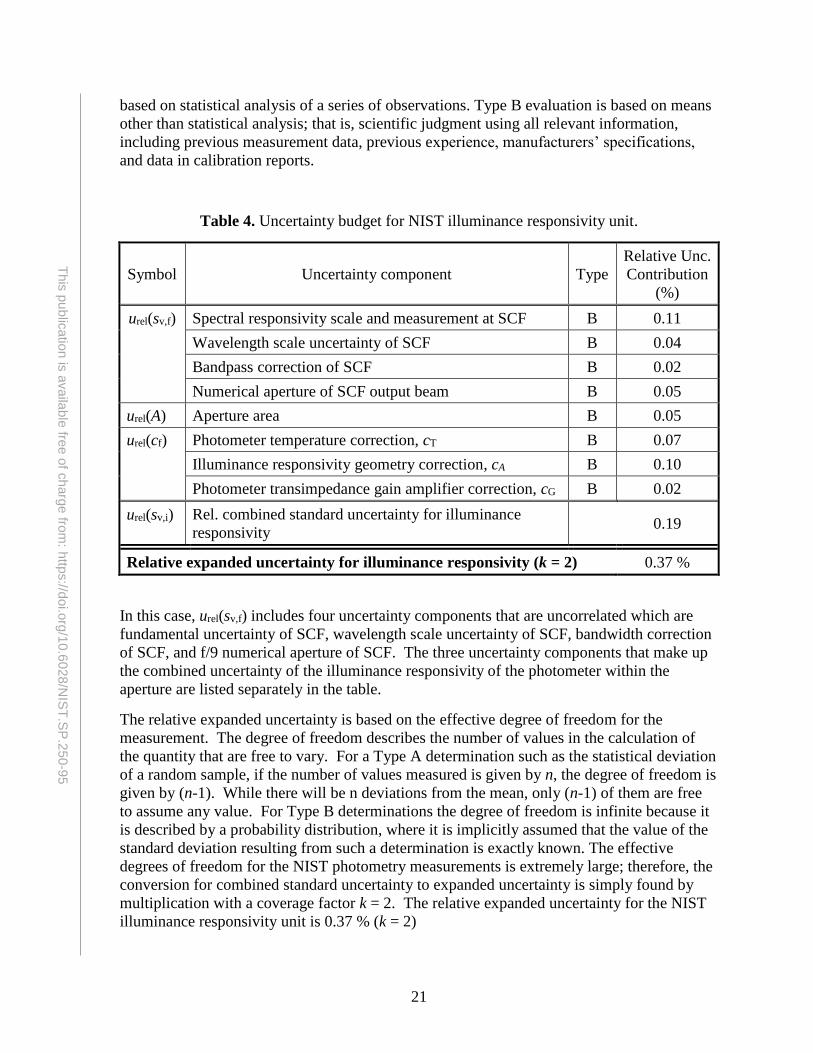
21
This
pu
blic
atio
n is
availa
ble
free o
f charg
e fro
m: h
ttps://d
oi.o
rg/1
0.6
028
/NIS
T.S
P.2
50-9
5
based on statistical analysis of a series of observations. Type B evaluation is based on means
other than statistical analysis; that is, scientific judgment using all relevant information,
including previous measurement data, previous experience, manufacturers’ specifications,
and data in calibration reports.
Table 4. Uncertainty budget for NIST illuminance responsivity unit.
Symbol Uncertainty component Type
Relative Unc.
Contribution
(%)
urel(sv,f) Spectral responsivity scale and measurement at SCF B 0.11
Wavelength scale uncertainty of SCF B 0.04
Bandpass correction of SCF B 0.02
Numerical aperture of SCF output beam B 0.05
urel(A) Aperture area B 0.05
urel(cf) Photometer temperature correction, cT B 0.07
Illuminance responsivity geometry correction, cA B 0.10
Photometer transimpedance gain amplifier correction, cG B 0.02
urel(sv,i) Rel. combined standard uncertainty for illuminance
responsivity 0.19
Relative expanded uncertainty for illuminance responsivity (k = 2) 0.37 %
In this case, urel(sv,f) includes four uncertainty components that are uncorrelated which are
fundamental uncertainty of SCF, wavelength scale uncertainty of SCF, bandwidth correction
of SCF, and f/9 numerical aperture of SCF. The three uncertainty components that make up
the combined uncertainty of the illuminance responsivity of the photometer within the
aperture are listed separately in the table.
The relative expanded uncertainty is based on the effective degree of freedom for the
measurement. The degree of freedom describes the number of values in the calculation of
the quantity that are free to vary. For a Type A determination such as the statistical deviation
of a random sample, if the number of values measured is given by n, the degree of freedom is
given by (n-1). While there will be n deviations from the mean, only (n-1) of them are free
to assume any value. For Type B determinations the degree of freedom is infinite because it
is described by a probability distribution, where it is implicitly assumed that the value of the
standard deviation resulting from such a determination is exactly known. The effective
degrees of freedom for the NIST photometry measurements is extremely large; therefore, the
conversion for combined standard uncertainty to expanded uncertainty is simply found by
multiplication with a coverage factor k = 2. The relative expanded uncertainty for the NIST
illuminance responsivity unit is 0.37 % (k = 2)
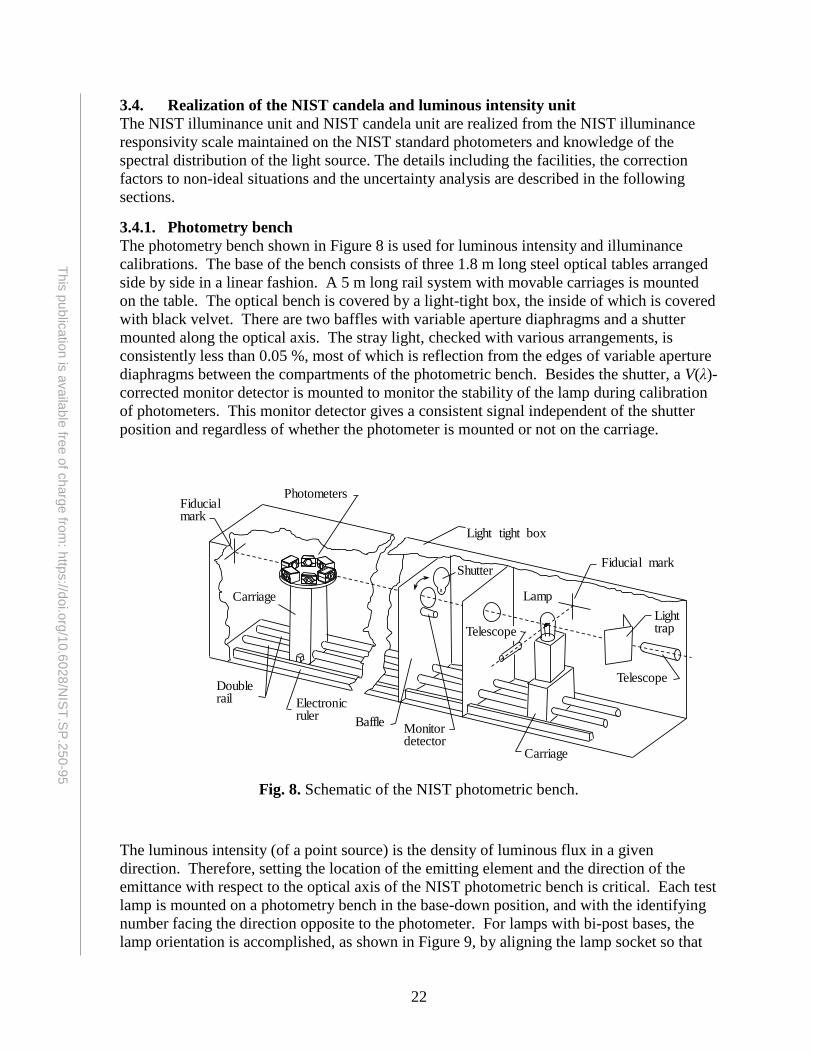
22
This
pu
blic
atio
n is
availa
ble
free o
f charg
e fro
m: h
ttps://d
oi.o
rg/1
0.6
028
/NIS
T.S
P.2
50-9
5
3.4. Realization of the NIST candela and luminous intensity unit
The NIST illuminance unit and NIST candela unit are realized from the NIST illuminance
responsivity scale maintained on the NIST standard photometers and knowledge of the
spectral distribution of the light source. The details including the facilities, the correction
factors to non-ideal situations and the uncertainty analysis are described in the following
sections.
3.4.1. Photometry bench
The photometry bench shown in Figure 8 is used for luminous intensity and illuminance
calibrations. The base of the bench consists of three 1.8 m long steel optical tables arranged
side by side in a linear fashion. A 5 m long rail system with movable carriages is mounted
on the table. The optical bench is covered by a light-tight box, the inside of which is covered
with black velvet. There are two baffles with variable aperture diaphragms and a shutter
mounted along the optical axis. The stray light, checked with various arrangements, is
consistently less than 0.05 %, most of which is reflection from the edges of variable aperture
diaphragms between the compartments of the photometric bench. Besides the shutter, a V(λ)-
corrected monitor detector is mounted to monitor the stability of the lamp during calibration
of photometers. This monitor detector gives a consistent signal independent of the shutter
position and regardless of whether the photometer is mounted or not on the carriage.
Fig. 8. Schematic of the NIST photometric bench.
The luminous intensity (of a point source) is the density of luminous flux in a given
direction. Therefore, setting the location of the emitting element and the direction of the
emittance with respect to the optical axis of the NIST photometric bench is critical. Each test
lamp is mounted on a photometry bench in the base-down position, and with the identifying
number facing the direction opposite to the photometer. For lamps with bi-post bases, the
lamp orientation is accomplished, as shown in Figure 9, by aligning the lamp socket so that
Fiducialmark
Photometers
Doublerail Electronic
ruler
Carriage
Baffle
Light tight box
ShutterFiducial mark
Lamp
Monitordetector
Carriage
Lighttrap
Telescope
Telescope
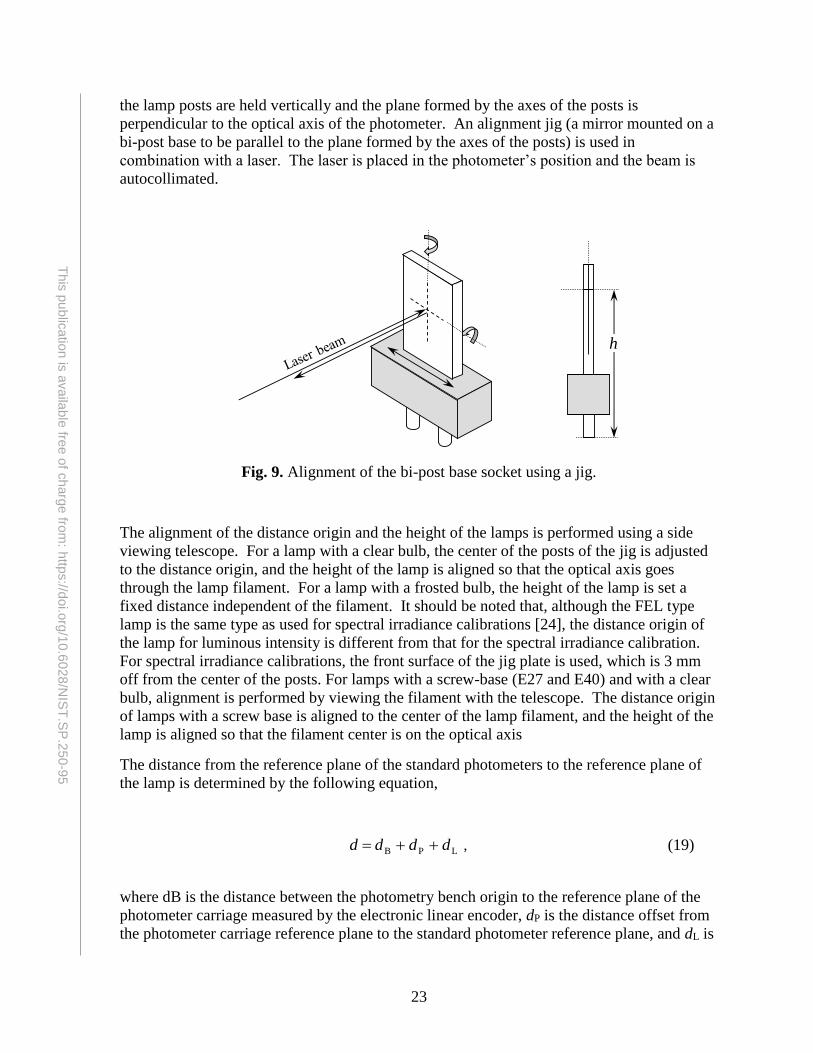
23
This
pu
blic
atio
n is
availa
ble
free o
f charg
e fro
m: h
ttps://d
oi.o
rg/1
0.6
028
/NIS
T.S
P.2
50-9
5
the lamp posts are held vertically and the plane formed by the axes of the posts is
perpendicular to the optical axis of the photometer. An alignment jig (a mirror mounted on a
bi-post base to be parallel to the plane formed by the axes of the posts) is used in
combination with a laser. The laser is placed in the photometer’s position and the beam is
autocollimated.
Fig. 9. Alignment of the bi-post base socket using a jig.
The alignment of the distance origin and the height of the lamps is performed using a side
viewing telescope. For a lamp with a clear bulb, the center of the posts of the jig is adjusted
to the distance origin, and the height of the lamp is aligned so that the optical axis goes
through the lamp filament. For a lamp with a frosted bulb, the height of the lamp is set a
fixed distance independent of the filament. It should be noted that, although the FEL type
lamp is the same type as used for spectral irradiance calibrations [24], the distance origin of
the lamp for luminous intensity is different from that for the spectral irradiance calibration.
For spectral irradiance calibrations, the front surface of the jig plate is used, which is 3 mm
off from the center of the posts. For lamps with a screw-base (E27 and E40) and with a clear
bulb, alignment is performed by viewing the filament with the telescope. The distance origin
of lamps with a screw base is aligned to the center of the lamp filament, and the height of the
lamp is aligned so that the filament center is on the optical axis
The distance from the reference plane of the standard photometers to the reference plane of
the lamp is determined by the following equation,
LPB dddd , (19)
where dB is the distance between the photometry bench origin to the reference plane of the
photometer carriage measured by the electronic linear encoder, dP is the distance offset from
the photometer carriage reference plane to the standard photometer reference plane, and dL is
h
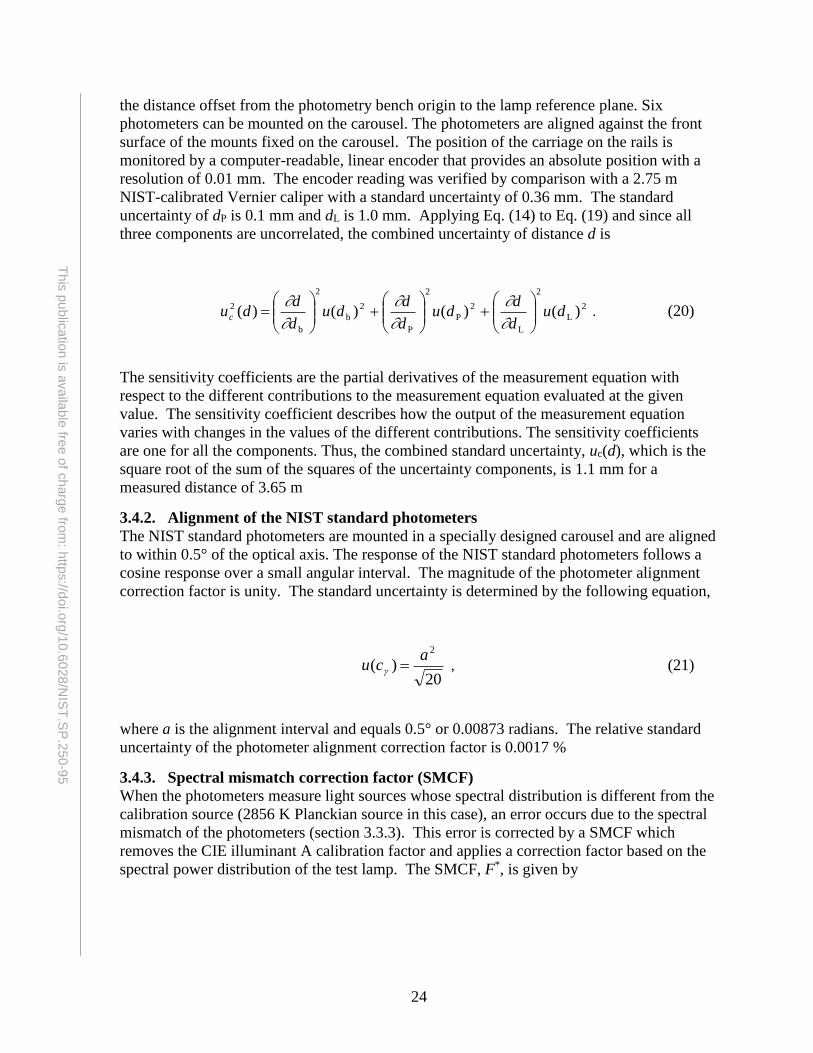
24
This
pu
blic
atio
n is
availa
ble
free o
f charg
e fro
m: h
ttps://d
oi.o
rg/1
0.6
028
/NIS
T.S
P.2
50-9
5
the distance offset from the photometry bench origin to the lamp reference plane. Six
photometers can be mounted on the carousel. The photometers are aligned against the front
surface of the mounts fixed on the carousel. The position of the carriage on the rails is
monitored by a computer-readable, linear encoder that provides an absolute position with a
resolution of 0.01 mm. The encoder reading was verified by comparison with a 2.75 m
NIST-calibrated Vernier caliper with a standard uncertainty of 0.36 mm. The standard
uncertainty of dP is 0.1 mm and dL is 1.0 mm. Applying Eq. (14) to Eq. (19) and since all
three components are uncorrelated, the combined uncertainty of distance d is
2
L
2
L
2
P
2
P
2
b
2
b
2 )()()()( dud
ddu
d
ddu
d
dduc
. (20)
The sensitivity coefficients are the partial derivatives of the measurement equation with
respect to the different contributions to the measurement equation evaluated at the given
value. The sensitivity coefficient describes how the output of the measurement equation
varies with changes in the values of the different contributions. The sensitivity coefficients
are one for all the components. Thus, the combined standard uncertainty, uc(d), which is the
square root of the sum of the squares of the uncertainty components, is 1.1 mm for a
measured distance of 3.65 m
3.4.2. Alignment of the NIST standard photometers
The NIST standard photometers are mounted in a specially designed carousel and are aligned
to within 0.5° of the optical axis. The response of the NIST standard photometers follows a
cosine response over a small angular interval. The magnitude of the photometer alignment
correction factor is unity. The standard uncertainty is determined by the following equation,
20
)(2a
cu , (21)
where a is the alignment interval and equals 0.5° or 0.00873 radians. The relative standard
uncertainty of the photometer alignment correction factor is 0.0017 %
3.4.3. Spectral mismatch correction factor (SMCF)
When the photometers measure light sources whose spectral distribution is different from the
calibration source (2856 K Planckian source in this case), an error occurs due to the spectral
mismatch of the photometers (section 3.3.3). This error is corrected by a SMCF which
removes the CIE illuminant A calibration factor and applies a correction factor based on the
spectral power distribution of the test lamp. The SMCF, F*, is given by
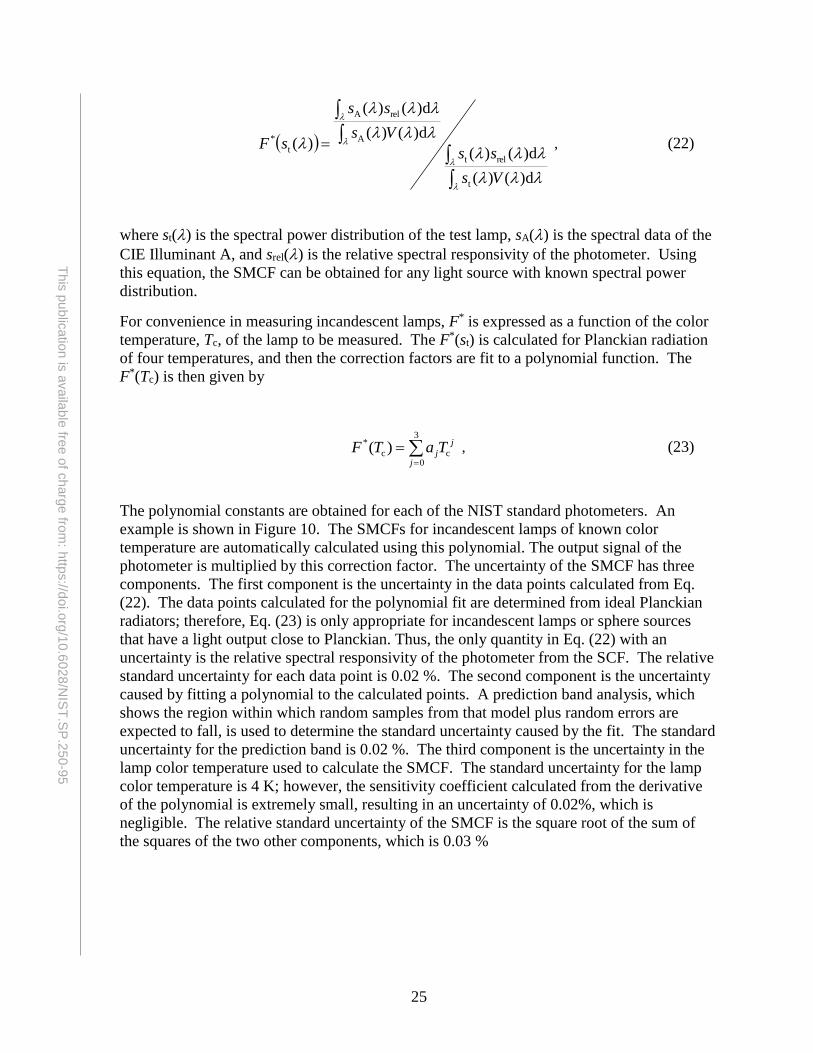
25
This
pu
blic
atio
n is
availa
ble
free o
f charg
e fro
m: h
ttps://d
oi.o
rg/1
0.6
028
/NIS
T.S
P.2
50-9
5
d)()(
d)()(
d)()(
d)()(
)(
t
relt
A
relA
t
*
Vs
ss
Vs
ss
sF , (22)
where st() is the spectral power distribution of the test lamp, sA() is the spectral data of the
CIE Illuminant A, and srel() is the relative spectral responsivity of the photometer. Using
this equation, the SMCF can be obtained for any light source with known spectral power
distribution.
For convenience in measuring incandescent lamps, F* is expressed as a function of the color
temperature, Tc, of the lamp to be measured. The F*(st) is calculated for Planckian radiation
of four temperatures, and then the correction factors are fit to a polynomial function. The
F*(Tc) is then given by
3
0cc
* )(j
j
jTaTF , (23)
The polynomial constants are obtained for each of the NIST standard photometers. An
example is shown in Figure 10. The SMCFs for incandescent lamps of known color
temperature are automatically calculated using this polynomial. The output signal of the
photometer is multiplied by this correction factor. The uncertainty of the SMCF has three
components. The first component is the uncertainty in the data points calculated from Eq.
(22). The data points calculated for the polynomial fit are determined from ideal Planckian
radiators; therefore, Eq. (23) is only appropriate for incandescent lamps or sphere sources
that have a light output close to Planckian. Thus, the only quantity in Eq. (22) with an
uncertainty is the relative spectral responsivity of the photometer from the SCF. The relative
standard uncertainty for each data point is 0.02 %. The second component is the uncertainty
caused by fitting a polynomial to the calculated points. A prediction band analysis, which
shows the region within which random samples from that model plus random errors are
expected to fall, is used to determine the standard uncertainty caused by the fit. The standard
uncertainty for the prediction band is 0.02 %. The third component is the uncertainty in the
lamp color temperature used to calculate the SMCF. The standard uncertainty for the lamp
color temperature is 4 K; however, the sensitivity coefficient calculated from the derivative
of the polynomial is extremely small, resulting in an uncertainty of 0.02%, which is
negligible. The relative standard uncertainty of the SMCF is the square root of the sum of
the squares of the two other components, which is 0.03 %
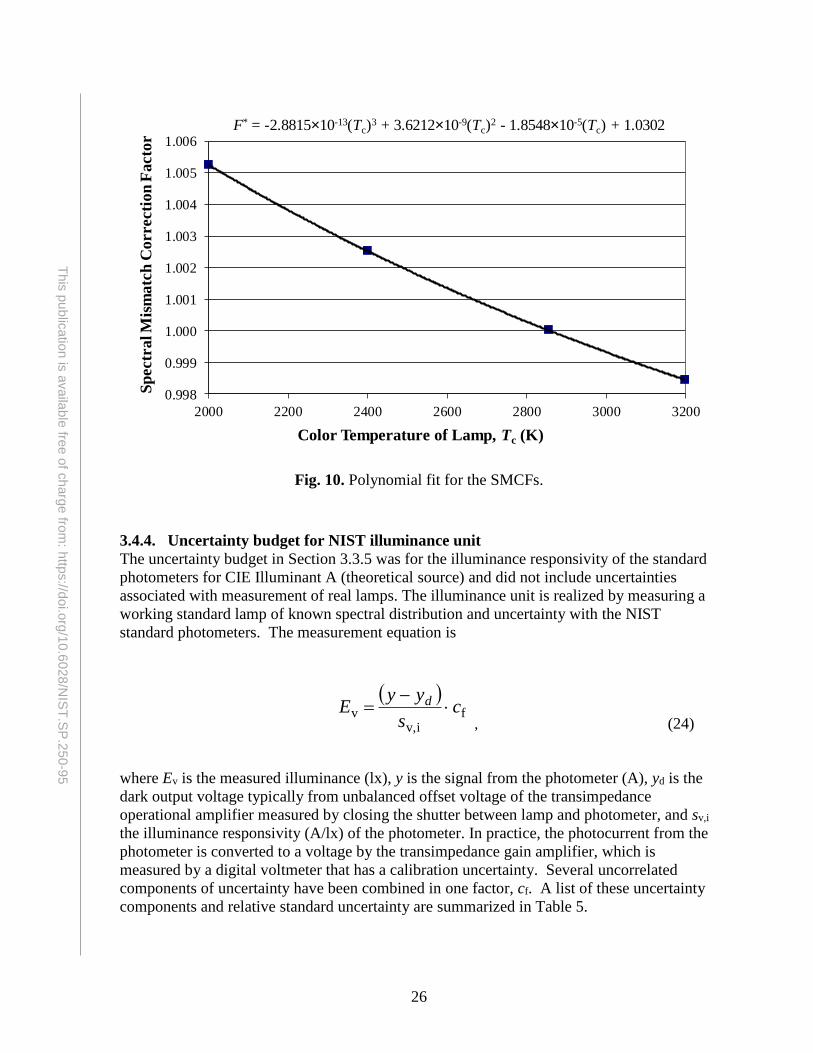
26
This
pu
blic
atio
n is
availa
ble
free o
f charg
e fro
m: h
ttps://d
oi.o
rg/1
0.6
028
/NIS
T.S
P.2
50-9
5
Fig. 10. Polynomial fit for the SMCFs.
3.4.4. Uncertainty budget for NIST illuminance unit
The uncertainty budget in Section 3.3.5 was for the illuminance responsivity of the standard
photometers for CIE Illuminant A (theoretical source) and did not include uncertainties
associated with measurement of real lamps. The illuminance unit is realized by measuring a
working standard lamp of known spectral distribution and uncertainty with the NIST
standard photometers. The measurement equation is
f
iv,v c
s
yyE d
, (24)
where Ev is the measured illuminance (lx), y is the signal from the photometer (A), yd is the
dark output voltage typically from unbalanced offset voltage of the transimpedance
operational amplifier measured by closing the shutter between lamp and photometer, and sv,i
the illuminance responsivity (A/lx) of the photometer. In practice, the photocurrent from the
photometer is converted to a voltage by the transimpedance gain amplifier, which is
measured by a digital voltmeter that has a calibration uncertainty. Several uncorrelated
components of uncertainty have been combined in one factor, cf. A list of these uncertainty
components and relative standard uncertainty are summarized in Table 5.
F* = -2.8815×10⁻¹³(Tc)3 + 3.6212×10⁻⁹(Tc)
2 - 1.8548×10⁻⁵(Tc) + 1.0302
0.998
0.999
1.000
1.001
1.002
1.003
1.004
1.005
1.006
2000 2200 2400 2600 2800 3000 3200
Sp
ectr
al M
ism
atc
h C
orrecti
on
Fa
cto
r
Color Temperature of Lamp, Tc (K)
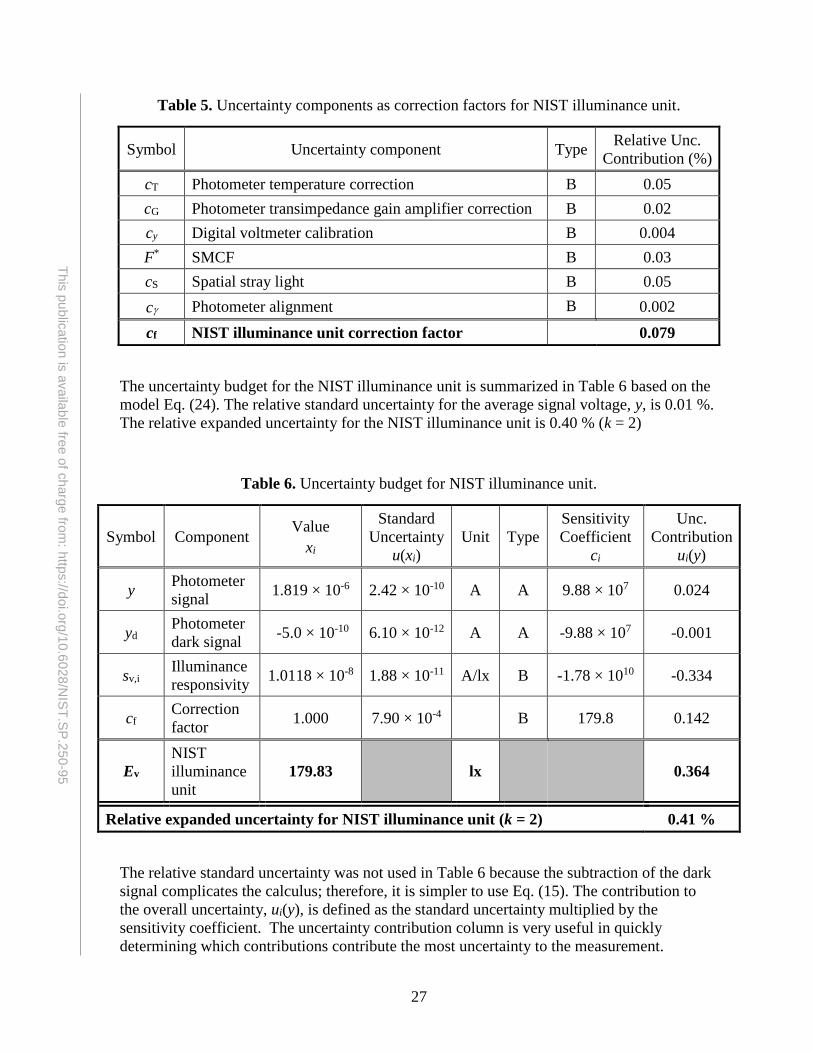
27
This
pu
blic
atio
n is
availa
ble
free o
f charg
e fro
m: h
ttps://d
oi.o
rg/1
0.6
028
/NIS
T.S
P.2
50-9
5
Table 5. Uncertainty components as correction factors for NIST illuminance unit.
Symbol Uncertainty component Type Relative Unc.
Contribution (%)
cT Photometer temperature correction B 0.05
cG Photometer transimpedance gain amplifier correction B 0.02
cy Digital voltmeter calibration B 0.004
F* SMCF B 0.03
cS Spatial stray light B 0.05
c Photometer alignment B 0.002
cf NIST illuminance unit correction factor 0.079
The uncertainty budget for the NIST illuminance unit is summarized in Table 6 based on the
model Eq. (24). The relative standard uncertainty for the average signal voltage, y, is 0.01 %.
The relative expanded uncertainty for the NIST illuminance unit is 0.40 % (k = 2)
Table 6. Uncertainty budget for NIST illuminance unit.
Symbol Component Value
xi
Standard
Uncertainty
u(xi)
Unit Type
Sensitivity
Coefficient
ci
Unc.
Contribution
ui(y)
y Photometer
signal 1.819 × 10⁻⁶ 2.42 × 10⁻¹⁰ A A 9.88 × 10⁷ 0.024
yd Photometer
dark signal -5.0 × 10⁻¹⁰ 6.10 × 10⁻¹² A A -9.88 × 10⁷ -0.001
sv,i Illuminance
responsivity 1.0118 × 10⁻⁸ 1.88 × 10⁻¹¹ A/lx B -1.78 × 10¹⁰ -0.334
cf Correction
factor 1.000 7.90 × 10⁻⁴ B 179.8 0.142
Ev
NIST
illuminance
unit
179.83 lx 0.364
Relative expanded uncertainty for NIST illuminance unit (k = 2) 0.41 %
The relative standard uncertainty was not used in Table 6 because the subtraction of the dark
signal complicates the calculus; therefore, it is simpler to use Eq. (15). The contribution to
the overall uncertainty, ui(y), is defined as the standard uncertainty multiplied by the
sensitivity coefficient. The uncertainty contribution column is very useful in quickly
determining which contributions contribute the most uncertainty to the measurement.
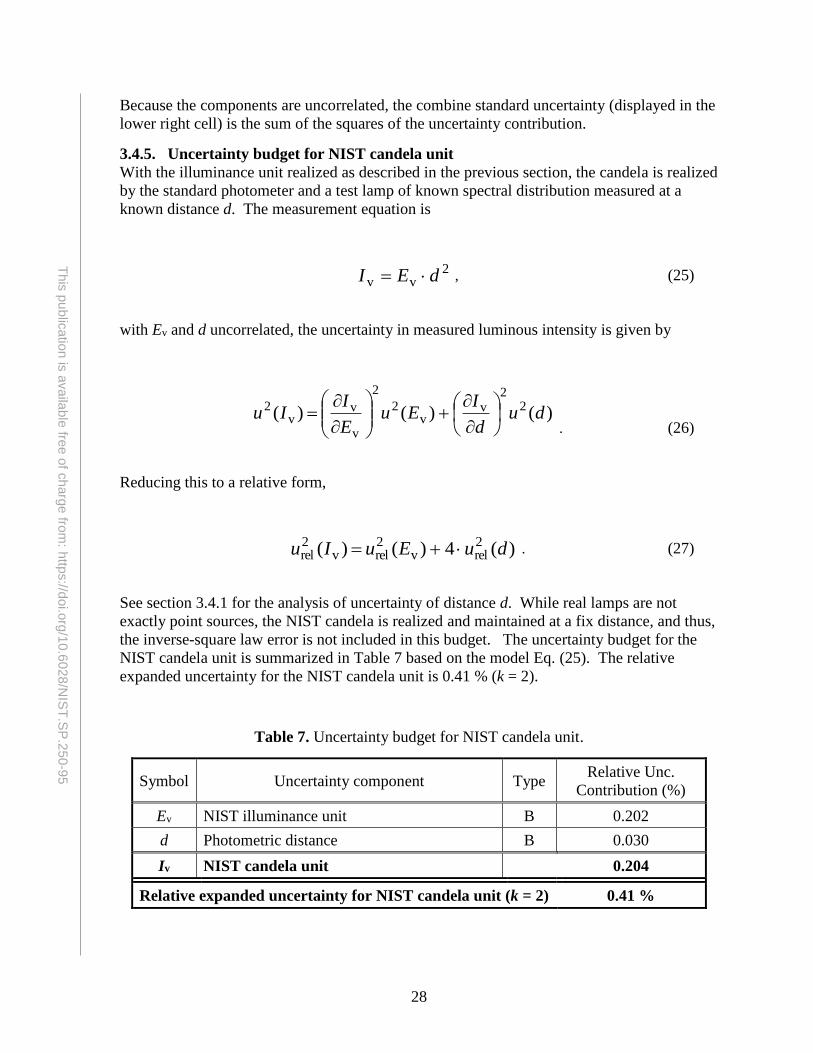
28
This
pu
blic
atio
n is
availa
ble
free o
f charg
e fro
m: h
ttps://d
oi.o
rg/1
0.6
028
/NIS
T.S
P.2
50-9
5
Because the components are uncorrelated, the combine standard uncertainty (displayed in the
lower right cell) is the sum of the squares of the uncertainty contribution.
3.4.5. Uncertainty budget for NIST candela unit
With the illuminance unit realized as described in the previous section, the candela is realized
by the standard photometer and a test lamp of known spectral distribution measured at a
known distance d. The measurement equation is
2
vv dEI , (25)
with Ev and d uncorrelated, the uncertainty in measured luminous intensity is given by
)()()( 2
2v
v2
2
v
vv
2 dud
IEu
E
IIu
. (26)
Reducing this to a relative form,
)(4)()( 2relv
2relv
2rel duEuIu . (27)
See section 3.4.1 for the analysis of uncertainty of distance d. While real lamps are not
exactly point sources, the NIST candela is realized and maintained at a fix distance, and thus,
the inverse-square law error is not included in this budget. The uncertainty budget for the
NIST candela unit is summarized in Table 7 based on the model Eq. (25). The relative
expanded uncertainty for the NIST candela unit is 0.41 % (k = 2).
Table 7. Uncertainty budget for NIST candela unit.
Symbol Uncertainty component Type Relative Unc.
Contribution (%)
Ev NIST illuminance unit B 0.202
d Photometric distance B 0.030
Iv NIST candela unit 0.204
Relative expanded uncertainty for NIST candela unit (k = 2) 0.41 %
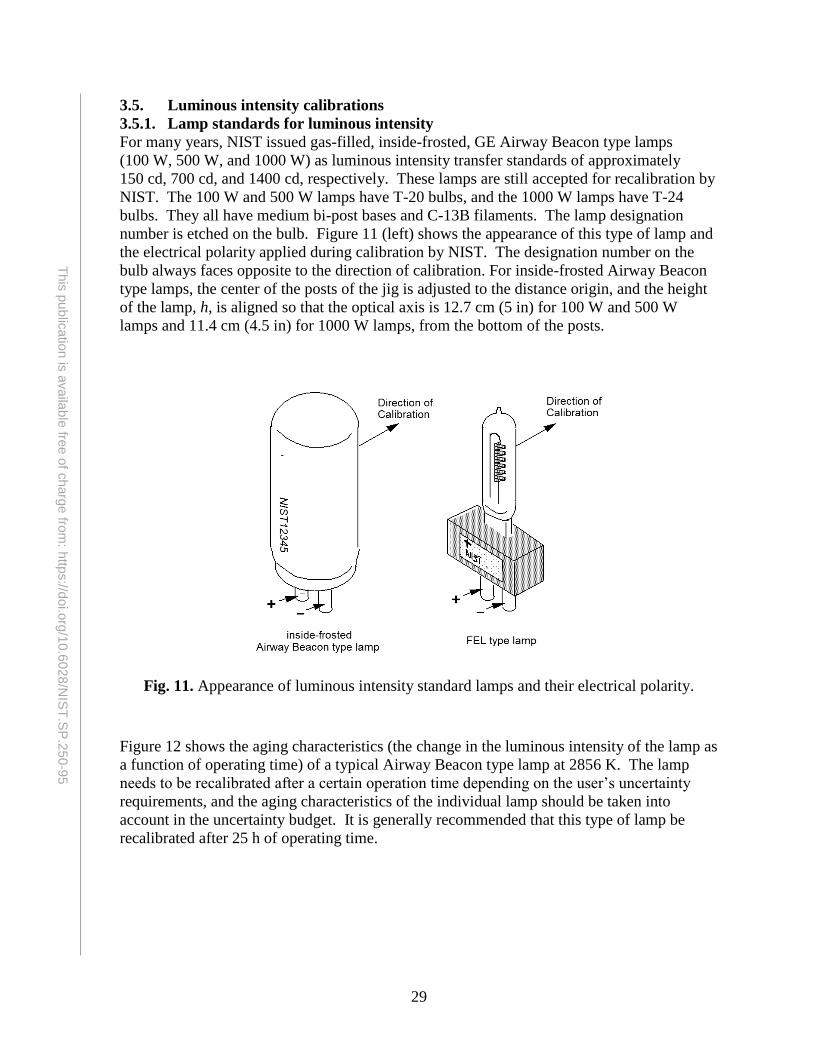
29
This
pu
blic
atio
n is
availa
ble
free o
f charg
e fro
m: h
ttps://d
oi.o
rg/1
0.6
028
/NIS
T.S
P.2
50-9
5
3.5. Luminous intensity calibrations
3.5.1. Lamp standards for luminous intensity
For many years, NIST issued gas-filled, inside-frosted, GE Airway Beacon type lamps
(100 W, 500 W, and 1000 W) as luminous intensity transfer standards of approximately
150 cd, 700 cd, and 1400 cd, respectively. These lamps are still accepted for recalibration by
NIST. The 100 W and 500 W lamps have T-20 bulbs, and the 1000 W lamps have T-24
bulbs. They all have medium bi-post bases and C-13B filaments. The lamp designation
number is etched on the bulb. Figure 11 (left) shows the appearance of this type of lamp and
the electrical polarity applied during calibration by NIST. The designation number on the
bulb always faces opposite to the direction of calibration. For inside-frosted Airway Beacon
type lamps, the center of the posts of the jig is adjusted to the distance origin, and the height
of the lamp, h, is aligned so that the optical axis is 12.7 cm (5 in) for 100 W and 500 W
lamps and 11.4 cm (4.5 in) for 1000 W lamps, from the bottom of the posts.
Fig. 11. Appearance of luminous intensity standard lamps and their electrical polarity.
Figure 12 shows the aging characteristics (the change in the luminous intensity of the lamp as
a function of operating time) of a typical Airway Beacon type lamp at 2856 K. The lamp
needs to be recalibrated after a certain operation time depending on the user’s uncertainty
requirements, and the aging characteristics of the individual lamp should be taken into
account in the uncertainty budget. It is generally recommended that this type of lamp be
recalibrated after 25 h of operating time.
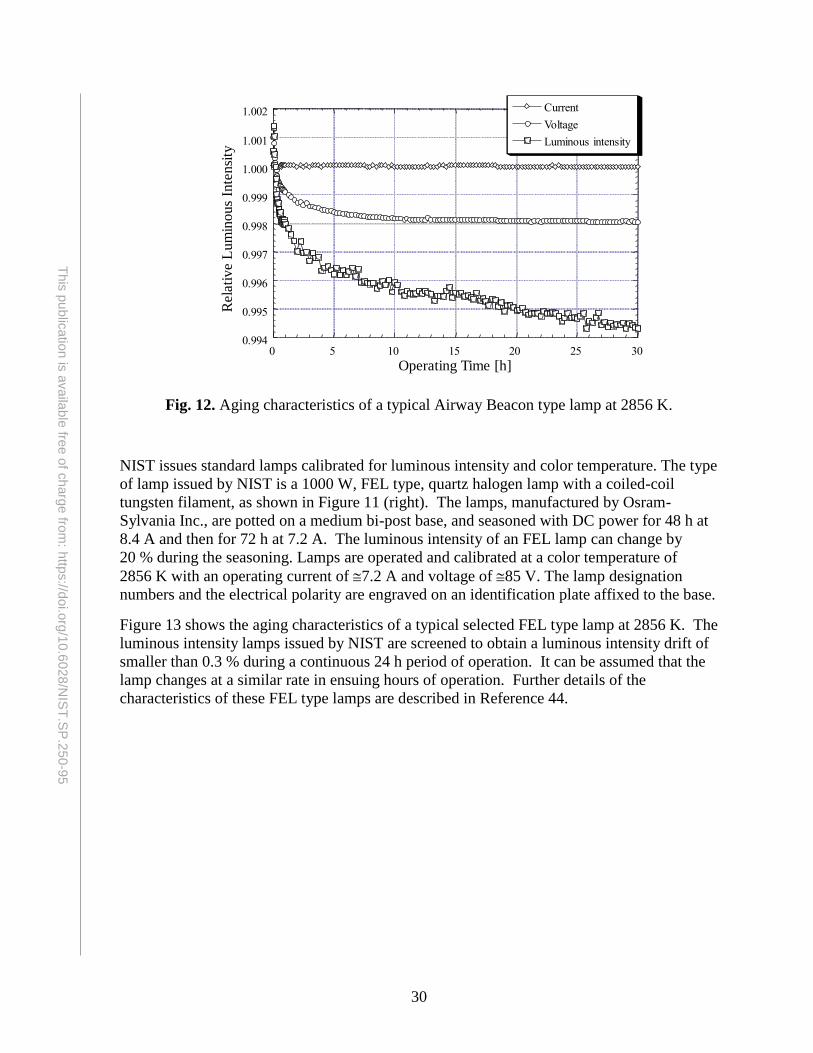
30
This
pu
blic
atio
n is
availa
ble
free o
f charg
e fro
m: h
ttps://d
oi.o
rg/1
0.6
028
/NIS
T.S
P.2
50-9
5
Fig. 12. Aging characteristics of a typical Airway Beacon type lamp at 2856 K.
NIST issues standard lamps calibrated for luminous intensity and color temperature. The type
of lamp issued by NIST is a 1000 W, FEL type, quartz halogen lamp with a coiled-coil
tungsten filament, as shown in Figure 11 (right). The lamps, manufactured by Osram-
Sylvania Inc., are potted on a medium bi-post base, and seasoned with DC power for 48 h at
8.4 A and then for 72 h at 7.2 A. The luminous intensity of an FEL lamp can change by
20 % during the seasoning. Lamps are operated and calibrated at a color temperature of
2856 K with an operating current of 7.2 A and voltage of 85 V. The lamp designation
numbers and the electrical polarity are engraved on an identification plate affixed to the base.
Figure 13 shows the aging characteristics of a typical selected FEL type lamp at 2856 K. The
luminous intensity lamps issued by NIST are screened to obtain a luminous intensity drift of
smaller than 0.3 % during a continuous 24 h period of operation. It can be assumed that the
lamp changes at a similar rate in ensuing hours of operation. Further details of the
characteristics of these FEL type lamps are described in Reference 44.
0.994
0.995
0.996
0.997
0.998
0.999
1.000
1.001
1.002
0 5 10 15 20 25 30
Operating Time [h]
Rela
tiv
e L
um
ino
us
Inte
nsi
ty
Current
Voltage
Luminous intensity
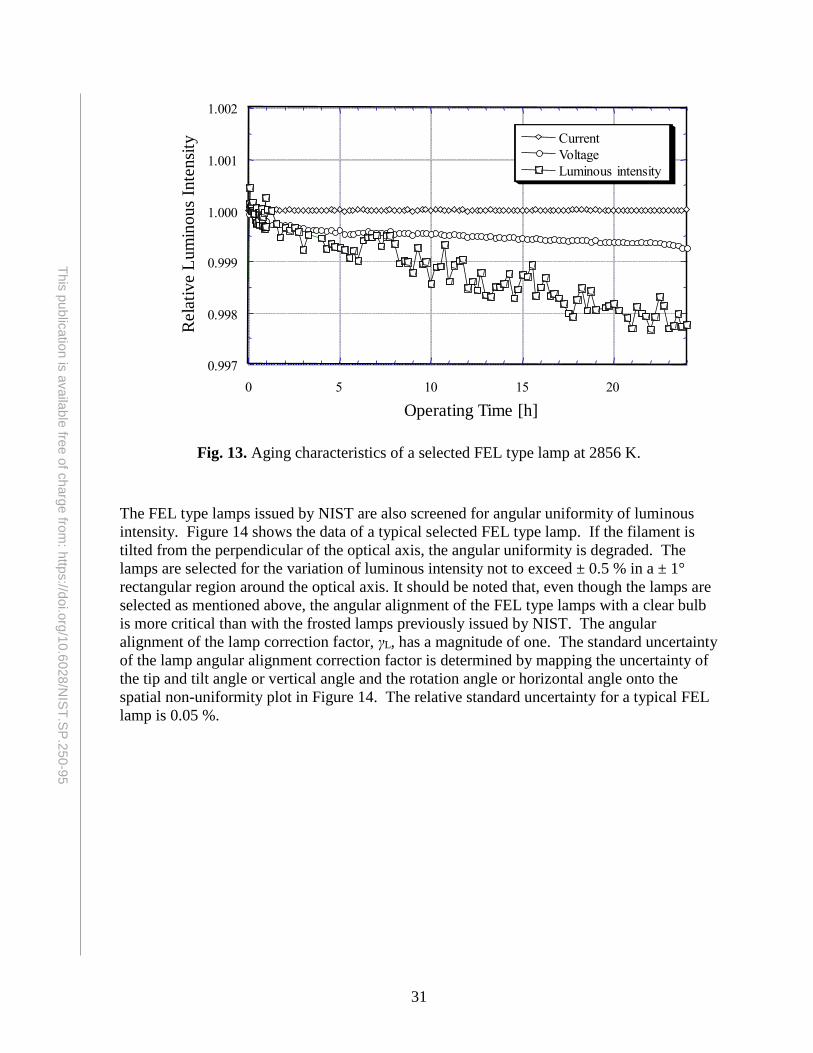
31
This
pu
blic
atio
n is
availa
ble
free o
f charg
e fro
m: h
ttps://d
oi.o
rg/1
0.6
028
/NIS
T.S
P.2
50-9
5
Fig. 13. Aging characteristics of a selected FEL type lamp at 2856 K.
The FEL type lamps issued by NIST are also screened for angular uniformity of luminous
intensity. Figure 14 shows the data of a typical selected FEL type lamp. If the filament is
tilted from the perpendicular of the optical axis, the angular uniformity is degraded. The
lamps are selected for the variation of luminous intensity not to exceed ± 0.5 % in a ± 1°
rectangular region around the optical axis. It should be noted that, even though the lamps are
selected as mentioned above, the angular alignment of the FEL type lamps with a clear bulb
is more critical than with the frosted lamps previously issued by NIST. The angular
alignment of the lamp correction factor, γL, has a magnitude of one. The standard uncertainty
of the lamp angular alignment correction factor is determined by mapping the uncertainty of
the tip and tilt angle or vertical angle and the rotation angle or horizontal angle onto the
spatial non-uniformity plot in Figure 14. The relative standard uncertainty for a typical FEL
lamp is 0.05 %.
0.997
0.998
0.999
1.000
1.001
1.002
0 5 10 15 20
Current
Voltage
Luminous intensity
Rela
tiv
e L
um
ino
us
Inte
nsi
ty
Operating Time [h]
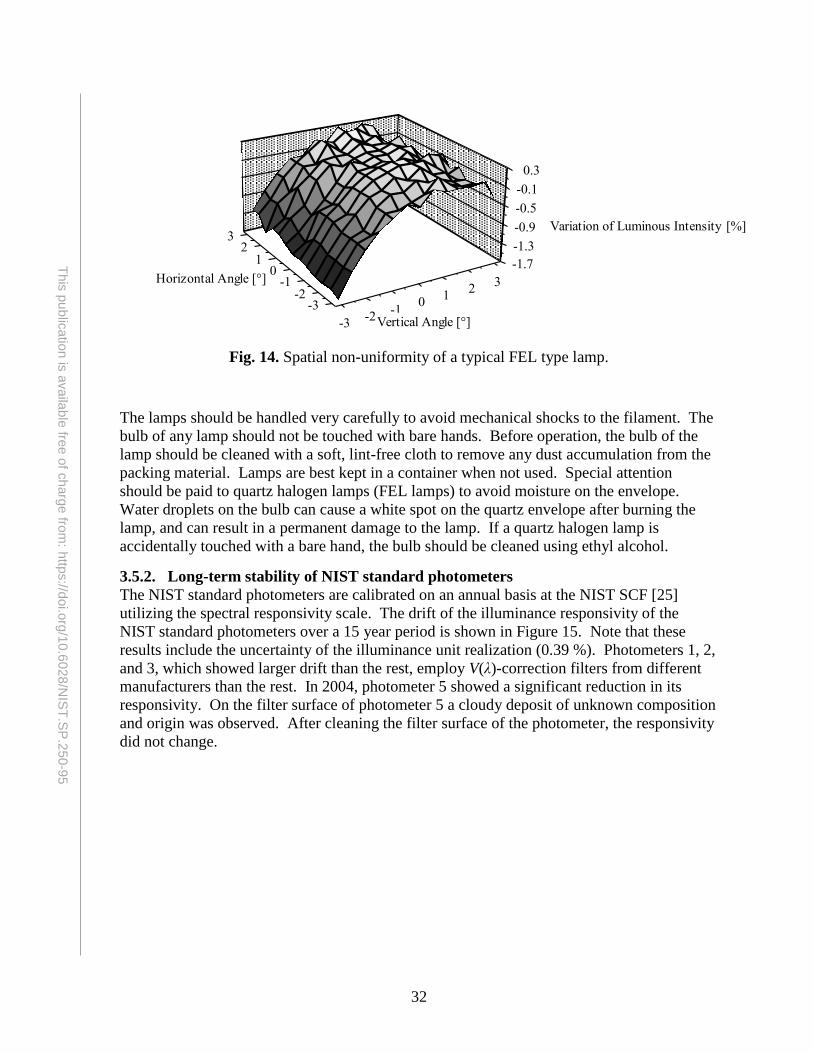
32
This
pu
blic
atio
n is
availa
ble
free o
f charg
e fro
m: h
ttps://d
oi.o
rg/1
0.6
028
/NIS
T.S
P.2
50-9
5
Fig. 14. Spatial non-uniformity of a typical FEL type lamp.
The lamps should be handled very carefully to avoid mechanical shocks to the filament. The
bulb of any lamp should not be touched with bare hands. Before operation, the bulb of the
lamp should be cleaned with a soft, lint-free cloth to remove any dust accumulation from the
packing material. Lamps are best kept in a container when not used. Special attention
should be paid to quartz halogen lamps (FEL lamps) to avoid moisture on the envelope.
Water droplets on the bulb can cause a white spot on the quartz envelope after burning the
lamp, and can result in a permanent damage to the lamp. If a quartz halogen lamp is
accidentally touched with a bare hand, the bulb should be cleaned using ethyl alcohol.
3.5.2. Long-term stability of NIST standard photometers
The NIST standard photometers are calibrated on an annual basis at the NIST SCF [25]
utilizing the spectral responsivity scale. The drift of the illuminance responsivity of the
NIST standard photometers over a 15 year period is shown in Figure 15. Note that these
results include the uncertainty of the illuminance unit realization (0.39 %). Photometers 1, 2,
and 3, which showed larger drift than the rest, employ V(λ)-correction filters from different
manufacturers than the rest. In 2004, photometer 5 showed a significant reduction in its
responsivity. On the filter surface of photometer 5 a cloudy deposit of unknown composition
and origin was observed. After cleaning the filter surface of the photometer, the responsivity
did not change.
-3-2
-10
12
3
Vertical Angle [°]
-3-2
-10
12
3
Horizontal Angle [°]-1.7
-1.3
-0.9
-0.5
-0.1
0.3
Variation of Luminous Intensity [%]
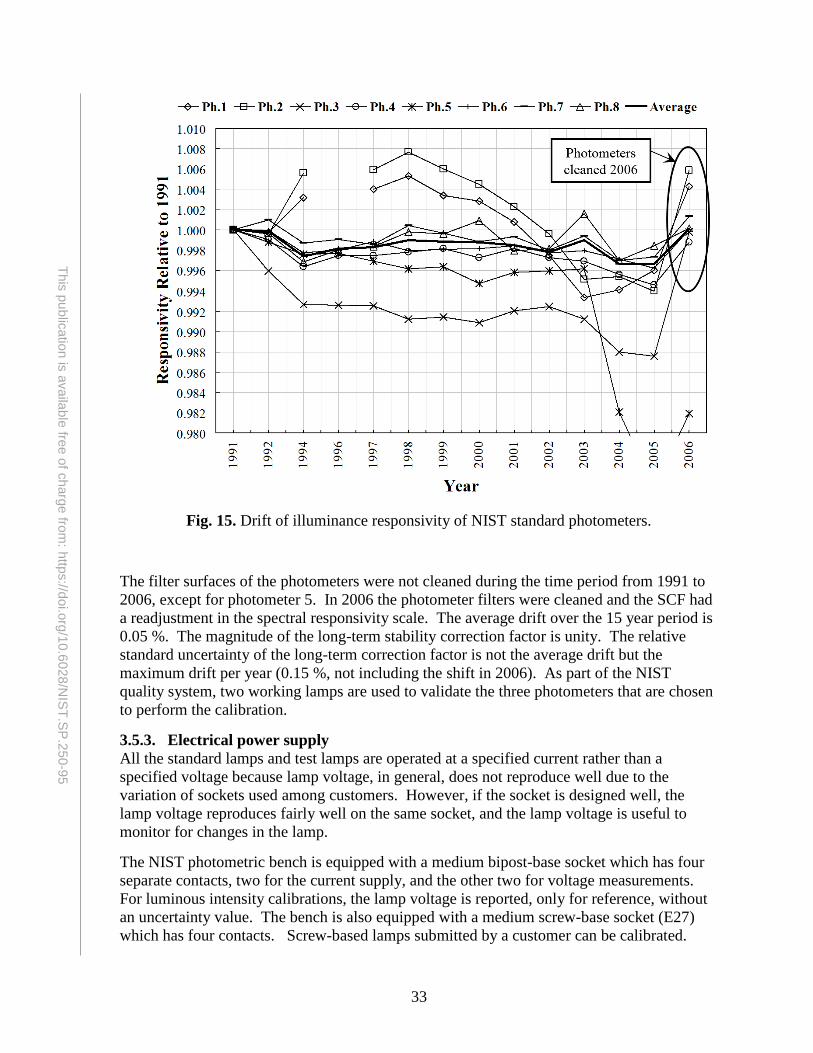
33
This
pu
blic
atio
n is
availa
ble
free o
f charg
e fro
m: h
ttps://d
oi.o
rg/1
0.6
028
/NIS
T.S
P.2
50-9
5
Fig. 15. Drift of illuminance responsivity of NIST standard photometers.
The filter surfaces of the photometers were not cleaned during the time period from 1991 to
2006, except for photometer 5. In 2006 the photometer filters were cleaned and the SCF had
a readjustment in the spectral responsivity scale. The average drift over the 15 year period is
0.05 %. The magnitude of the long-term stability correction factor is unity. The relative
standard uncertainty of the long-term correction factor is not the average drift but the
maximum drift per year (0.15 %, not including the shift in 2006). As part of the NIST
quality system, two working lamps are used to validate the three photometers that are chosen
to perform the calibration.
3.5.3. Electrical power supply
All the standard lamps and test lamps are operated at a specified current rather than a
specified voltage because lamp voltage, in general, does not reproduce well due to the
variation of sockets used among customers. However, if the socket is designed well, the
lamp voltage reproduces fairly well on the same socket, and the lamp voltage is useful to
monitor for changes in the lamp.
The NIST photometric bench is equipped with a medium bipost-base socket which has four
separate contacts, two for the current supply, and the other two for voltage measurements.
For luminous intensity calibrations, the lamp voltage is reported, only for reference, without
an uncertainty value. The bench is also equipped with a medium screw-base socket (E27)
which has four contacts. Screw-based lamps submitted by a customer can be calibrated.
34
This
pu
blic
atio
n is
availa
ble
free o
f charg
e fro
m: h
ttps://d
oi.o
rg/1
0.6
028
/NIS
T.S
P.2
50-9
5
A DC constant-current power supply is used to operate standard lamps and test lamps. The
lamp current is measured as the voltage across a reference current shunt (RS = 0.1 Ω), using a
calibrated 6-½ digit voltmeter. The digital voltmeter is on a one year calibration cycle. The
current shunt is periodically calibrated at three different current levels with a standard
uncertainty of 0.0013 %.
The lamp current is automatically controlled by a computer feedback system to keep the
current drift within ± 0.002 %. The power supply is operated in an external control mode, in
which the output current is regulated by an external reference voltage. The external voltage
is supplied by an 18 bit D-to-A converter controlled by the computer.
An incandescent lamp operated at a fixed current, J0, has a variation of the luminous intensity
which is dependent on the following equation,
J
0
0V
m
J
JII
, (28)
where I0 is the initial luminous intensity, J is the new current which is only a small deviation
from the fixed current, and mJ is the current dependent coefficient equal to 7.0 with a
standard uncertainty of 0.5.
Since the lamp current is controlled, the voltage of the lamp will fluctuate depending on the
properties of the lamp. It is the policy of the NIST photometry calibration group to include
this fluctuation in the uncertainty budget for calibrations of standard artifacts. For
incandescent or halogen lamps the luminous intensity is dependent on the voltage of the lamp
by the following equation
Vm
L
V
VII
0
0V , (29)
where I0 is the initial luminous intensity, VL is the measured voltage which is only a small
deviation from the calibrated voltage, V0, and mV is the voltage dependent coefficient equal
to 3.6 with a standard uncertainty of 0.5. To determine this correction factor the lamp is
measured three times and the voltage is recorded. The measured voltage and calibrated
voltage is set to the average voltage and the standard deviation of the three voltage
measurements is used as the standard uncertainty of the measured voltage. The V0 is stated
not to have an uncertainty.
3.5.4. Deviation from inverse square law
Due to the lamps filament structure or properties of the lamp envelop, the lamp may not
follow the inverse square law. This deviation from an ideal source is compensated for in the
uncertainty budget. The correction factor has a magnitude of 1 and the standard uncertainty is
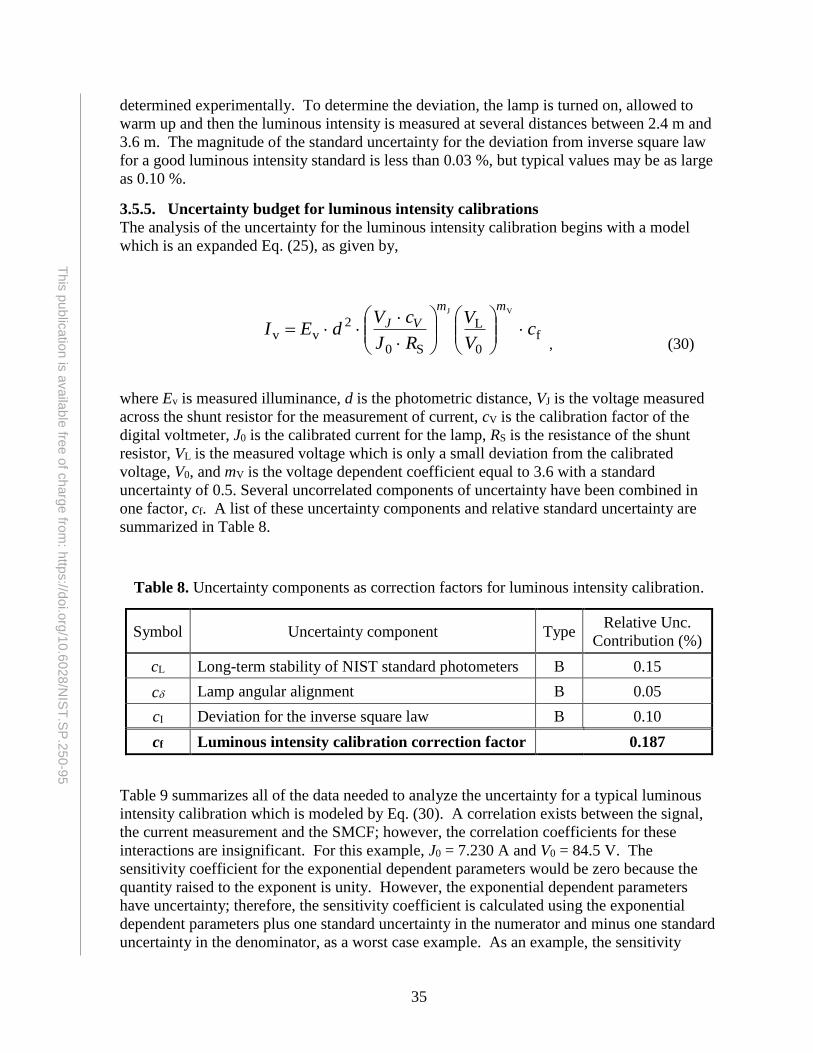
35
This
pu
blic
atio
n is
availa
ble
free o
f charg
e fro
m: h
ttps://d
oi.o
rg/1
0.6
028
/NIS
T.S
P.2
50-9
5
determined experimentally. To determine the deviation, the lamp is turned on, allowed to
warm up and then the luminous intensity is measured at several distances between 2.4 m and
3.6 m. The magnitude of the standard uncertainty for the deviation from inverse square law
for a good luminous intensity standard is less than 0.03 %, but typical values may be as large
as 0.10 %.
3.5.5. Uncertainty budget for luminous intensity calibrations
The analysis of the uncertainty for the luminous intensity calibration begins with a model
which is an expanded Eq. (25), as given by,
f
0
L
S0
2vv
VJ
cV
V
RJ
cVdEI
mm
VJ
, (30)
where Ev is measured illuminance, d is the photometric distance, VJ is the voltage measured
across the shunt resistor for the measurement of current, cV is the calibration factor of the
digital voltmeter, J0 is the calibrated current for the lamp, RS is the resistance of the shunt
resistor, VL is the measured voltage which is only a small deviation from the calibrated
voltage, V0, and mV is the voltage dependent coefficient equal to 3.6 with a standard
uncertainty of 0.5. Several uncorrelated components of uncertainty have been combined in
one factor, cf. A list of these uncertainty components and relative standard uncertainty are
summarized in Table 8.
Table 8. Uncertainty components as correction factors for luminous intensity calibration.
Symbol Uncertainty component Type Relative Unc.
Contribution (%)
cL Long-term stability of NIST standard photometers B 0.15
c Lamp angular alignment B 0.05
cI Deviation for the inverse square law B 0.10
cf Luminous intensity calibration correction factor 0.187
Table 9 summarizes all of the data needed to analyze the uncertainty for a typical luminous
intensity calibration which is modeled by Eq. (30). A correlation exists between the signal,
the current measurement and the SMCF; however, the correlation coefficients for these
interactions are insignificant. For this example, J0 = 7.230 A and V0 = 84.5 V. The
sensitivity coefficient for the exponential dependent parameters would be zero because the
quantity raised to the exponent is unity. However, the exponential dependent parameters
have uncertainty; therefore, the sensitivity coefficient is calculated using the exponential
dependent parameters plus one standard uncertainty in the numerator and minus one standard
uncertainty in the denominator, as a worst case example. As an example, the sensitivity
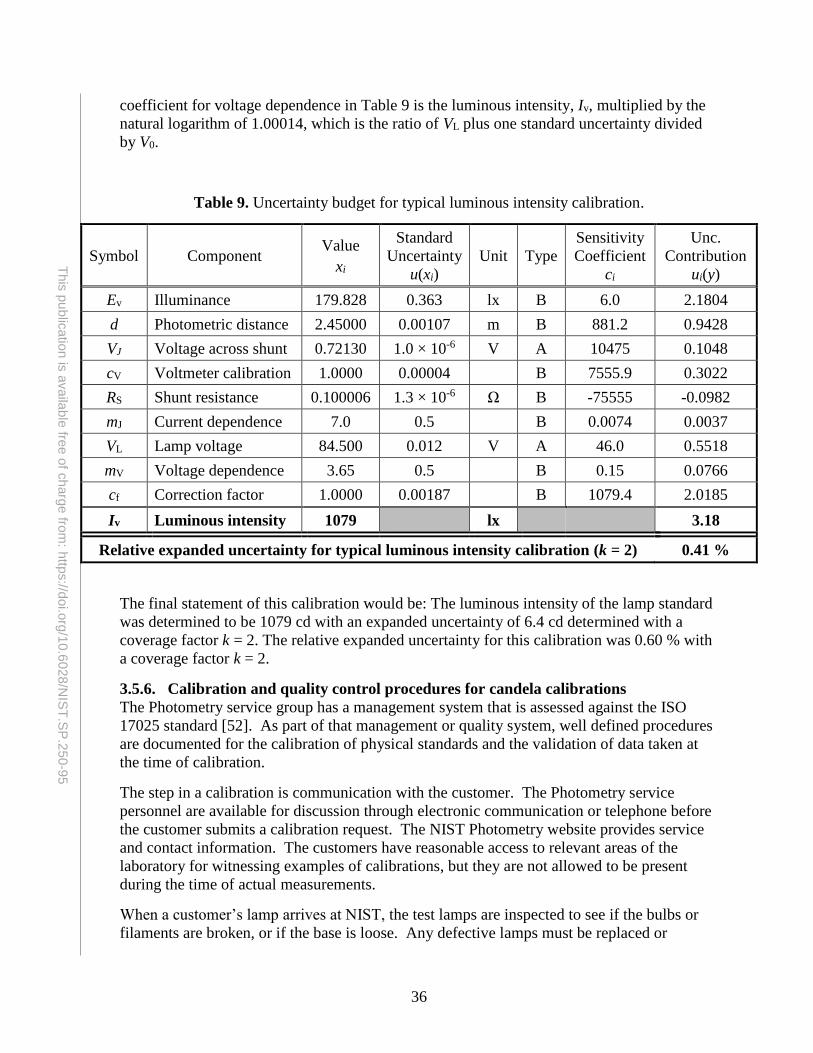
36
This
pu
blic
atio
n is
availa
ble
free o
f charg
e fro
m: h
ttps://d
oi.o
rg/1
0.6
028
/NIS
T.S
P.2
50-9
5
coefficient for voltage dependence in Table 9 is the luminous intensity, Iv, multiplied by the
natural logarithm of 1.00014, which is the ratio of VL plus one standard uncertainty divided
by V0.
Table 9. Uncertainty budget for typical luminous intensity calibration.
Symbol Component Value
xi
Standard
Uncertainty
u(xi)
Unit Type
Sensitivity
Coefficient
ci
Unc.
Contribution
ui(y)
Ev Illuminance 179.828 0.363 lx B 6.0 2.1804
d Photometric distance 2.45000 0.00107 m B 881.2 0.9428
VJ Voltage across shunt 0.72130 1.0 × 10⁻⁶ V A 10475 0.1048
cV Voltmeter calibration 1.0000 0.00004 B 7555.9 0.3022
RS Shunt resistance 0.100006 1.3 × 10⁻⁶ Ω B -75555 -0.0982
mJ Current dependence 7.0 0.5 B 0.0074 0.0037
VL Lamp voltage 84.500 0.012 V A 46.0 0.5518
mV Voltage dependence 3.65 0.5 B 0.15 0.0766
cf Correction factor 1.0000 0.00187 B 1079.4 2.0185
Iv Luminous intensity 1079 lx 3.18
Relative expanded uncertainty for typical luminous intensity calibration (k = 2) 0.41 %
The final statement of this calibration would be: The luminous intensity of the lamp standard
was determined to be 1079 cd with an expanded uncertainty of 6.4 cd determined with a
coverage factor k = 2. The relative expanded uncertainty for this calibration was 0.60 % with
a coverage factor k = 2.
3.5.6. Calibration and quality control procedures for candela calibrations
The Photometry service group has a management system that is assessed against the ISO
17025 standard [52]. As part of that management or quality system, well defined procedures
are documented for the calibration of physical standards and the validation of data taken at
the time of calibration.
The step in a calibration is communication with the customer. The Photometry service
personnel are available for discussion through electronic communication or telephone before
the customer submits a calibration request. The NIST Photometry website provides service
and contact information. The customers have reasonable access to relevant areas of the
laboratory for witnessing examples of calibrations, but they are not allowed to be present
during the time of actual measurements.
When a customer’s lamp arrives at NIST, the test lamps are inspected to see if the bulbs or
filaments are broken, or if the base is loose. Any defective lamps must be replaced or
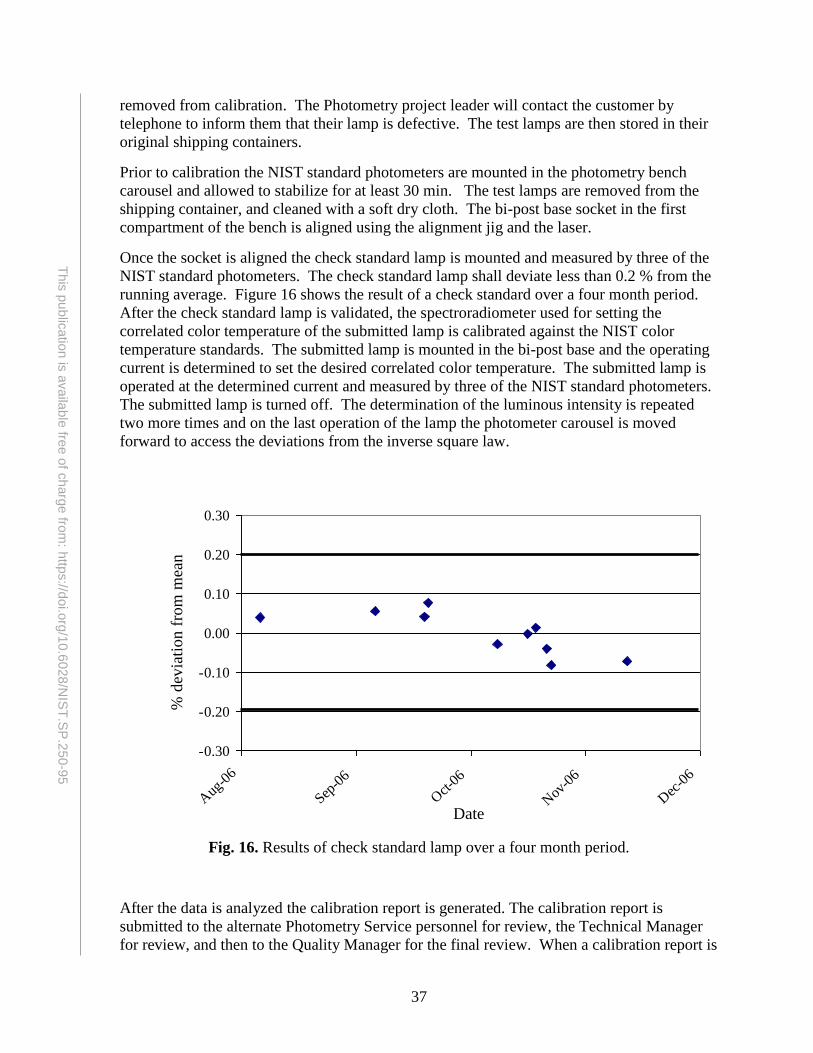
37
This
pu
blic
atio
n is
availa
ble
free o
f charg
e fro
m: h
ttps://d
oi.o
rg/1
0.6
028
/NIS
T.S
P.2
50-9
5
removed from calibration. The Photometry project leader will contact the customer by
telephone to inform them that their lamp is defective. The test lamps are then stored in their
original shipping containers.
Prior to calibration the NIST standard photometers are mounted in the photometry bench
carousel and allowed to stabilize for at least 30 min. The test lamps are removed from the
shipping container, and cleaned with a soft dry cloth. The bi-post base socket in the first
compartment of the bench is aligned using the alignment jig and the laser.
Once the socket is aligned the check standard lamp is mounted and measured by three of the
NIST standard photometers. The check standard lamp shall deviate less than 0.2 % from the
running average. Figure 16 shows the result of a check standard over a four month period.
After the check standard lamp is validated, the spectroradiometer used for setting the
correlated color temperature of the submitted lamp is calibrated against the NIST color
temperature standards. The submitted lamp is mounted in the bi-post base and the operating
current is determined to set the desired correlated color temperature. The submitted lamp is
operated at the determined current and measured by three of the NIST standard photometers.
The submitted lamp is turned off. The determination of the luminous intensity is repeated
two more times and on the last operation of the lamp the photometer carousel is moved
forward to access the deviations from the inverse square law.
Fig. 16. Results of check standard lamp over a four month period.
After the data is analyzed the calibration report is generated. The calibration report is
submitted to the alternate Photometry Service personnel for review, the Technical Manager
for review, and then to the Quality Manager for the final review. When a calibration report is
-0.30
-0.20
-0.10
0.00
0.10
0.20
0.30
Aug
-06
Sep-0
6
Oct
-06
Nov
-06
Dec
-06
Date
% d
evia
tion f
rom
mea
n
38
This
pu
blic
atio
n is
availa
ble
free o
f charg
e fro
m: h
ttps://d
oi.o
rg/1
0.6
028
/NIS
T.S
P.2
50-9
5
completed, reviewed and approved, the test lamps are packaged in the original shipping
material and taken by a Photometry Staff member to the shipping facility.
After the completion of a calibration service, the customer is welcome to contact the
Photometry service personnel to clarify or discuss calibration procedures and results. All
communication with the customer relating to the customers’ requirements or the results of
the work during the period of measurement shall be documented and included in the Test
Folder.
3.6. Illuminance responsivity calibrations
Significant improvement in the quality of commercial photometers and illuminance meters
has been made due to availability of high quality silicon photodiodes and V(λ) matching
filters. As a result, many types of commercially available photometers can be used as
photometric standards instead of traditional luminous intensity standard lamps. Standard
lamps are sensitive to mechanical shocks, change with burning time, and drift during the
stabilization period. Experience shows that well maintained photometers are less subject to
such problems, and provide a dynamic range of several orders of magnitude. NIST
experience indicates that the short-term stability of photometers is superior to lamps and
although the long-term stability has not been tested for many types of photometers, a few
particular types tested have shown satisfactory stability (0.1 % per year). It should be noted
that some photometers have shown changes greater than 1 % in a year, making their use as
standards difficult. In general, for luminous intensity and illuminance measurements, the use
of standard photometers is recommended, but the photometers should be calibrated
frequently (at least once a year) until the long-term stability data are accumulated for the
particular photometers a user laboratory may employ. Photometer heads or photometers
(photometer heads with a display unit) and illuminance meters are accepted for calibration by
NIST. The requirements and recommendations for photometers used as transfer standards
and reference standards are described below.
3.6.1. Types of photometers and illuminance meters
A standard photometer head should have either a limiting aperture (whose area is much
smaller than the photodiode area) or a flat diffuser such as an opal glass in front of the V(λ)-
correction filter so that the reference plane of the photometer is accurately and clearly
defined. Some commercial photometer heads only have a V(λ)-correction filter attached in
front of the silicon photodiode. If a photometer head does not have an aperture or a diffuser,
the photodiode surface might be used as the reference plane of the photometer head. In this
case, due to the refraction index of the V(λ)-correction filter which is usually several
millimeters in thickness, the effective reference plane can be several millimeters from the
photodiode surface. Sometimes, the front surface of the filter is simply defined as the
reference plane of such photometer heads, in which case the true reference plane can be more
than 1 cm from the filter surface. When the reference plane is not correctly defined, the
departure from the inverse square law causes the responsivity of the photometer to vary
depending on the distance to the source, and serious errors may occur when the photometer is
used at close distances to the source. This is the same problem with large-size lamps, for
which the inverse square law does not hold well at close distances. To avoid these
difficulties, standard photometers having a limiting aperture or a flat diffuser on the front are
recommended.
39
This
pu
blic
atio
n is
availa
ble
free o
f charg
e fro
m: h
ttps://d
oi.o
rg/1
0.6
028
/NIS
T.S
P.2
50-9
5
Some illuminance meter heads employ a dome-shaped or mesa-shaped diffuser in the front.
In this case, it is usually difficult to define the correct reference plane. Such illuminance
meters are not recommended to be used as standard photometers unless the meters are always
used at the same distance from the source. Also, illuminance meters with poor spectral
match and (or) with only a 3 digit display are not adequate for use as standard photometers.
Illuminance meters may have various structure of the light-receiving surface for cosine
correction. The reference plane of the illuminance meter heads should be provided by the
customer. Upon request, the reference plane of photometer heads (without an aperture or a
diffuser) and illuminance meter heads can be experimentally determined.
3.6.2. Operation and handling of photometer heads and illuminance meters
Illuminance meters are generally not designed to measure illuminance at very close distances
to a source. It should be noted that the measurement error may increase greatly if an
illuminance meter with a reference plane incorrectly defined is placed very close to a light
source (e.g., less than 0.5 m).
As previously described, the responsivity of a photometer can be a function of temperature.
If the photometer is neither a temperature-controlled type nor a temperature-monitored type,
the photometer must be used close to the calibration temperature to avoid errors. If not, the
temperature coefficient of the photometer should be measured, and correction factors should
be applied as appropriate. The photometer should be placed in the laboratory several hours
in advance of use so that the photometer’s temperature equilibrates to the ambient
temperature.
At NIST, photometers and illuminance meters are calibrated using incandescent lamps
operated at 2856 K unless otherwise requested by the customer. In this case, when the
photometers are used to measure light sources other than incandescent lamps of that color
temperature, spectral mismatch errors occur, and in order to quantify or correct for this error,
the relative spectral responsivity of the photometers or illuminance meters must be measured.
3.6.3. Illuminance responsivity calibration and quality control procedures
Photometers and photometer heads are calibrated for illuminance responsivity in A/lx, V/lx
or readings/lx. Calibration is performed on the NIST photometry bench using a 1000 W FEL
type lamp operated at 2856 K (CIE Illuminant A). The calibration is performed by direct
comparison with three of the NIST standard photometers. The responsivity is usually
measured at two distances, 2.4 m and 3.6 m from the lamp, at typical illuminance levels of
75 lx and 180 lx. Calibrations can also be made at other illuminance levels from 0.1 lx to
3000 lx for a linearity check, if requested by customers. The procedures for initiating and
completing a typical calibration are described in section 3.5.6. The specific procedures and
quality control items related to illuminance responsivity calibrations follows.
Test photometers or illuminance meters are inspected to see if the head has a limiting
aperture or a diffuser in front. If the head has neither, and consists of just a photodiode and a
V(λ) filter, the Photometry project leader will notify the customer by telephone that there will
be additional charge for determining the reference plane of the photometer head. The front
surface of photometer heads with a limiting aperture should not be cleaned or touched by
anything because the edges of the aperture can be easily damaged. If dust particles are seen
on the active area of the photometer head, air spray is used at distances greater than 20 cm.
40
This
pu
blic
atio
n is
availa
ble
free o
f charg
e fro
m: h
ttps://d
oi.o
rg/1
0.6
028
/NIS
T.S
P.2
50-9
5
Bare fingers should not touch the front surface of photometer heads with a diffuser, once
cleaned. Before and during measurements, photometer heads are not touched with bare hands
to avoid heating the photometer, as the responsivity of photometers is temperature dependent.
A glove or dry cloth is used to hold the photometer heads. If the photometer head is supplied
with a cap, it will be left on except during measurement.
Once the socket is aligned, the check standard lamp is mounted, stabilized, and measured by
three of the NIST standard photometers. The check standard lamp shall deviate less than
0.2 % from the running average. Figure 16 shows the result of a check standard over a four
month period. After the check standard lamp is validated, the illuminance at a reference
point approximately 3.5 m from the lamp is determined by three NIST standard photometers.
The photometer head under test is positioned at the same reference point and the readings are
recorded. Data are usually taken within 5 min at each illuminance level. During the
comparison, the luminous intensity stability of the lamp is monitored by the monitor detector
installed in the photometry bench. The ambient temperature during the calibration (usually
25 °C) is measured and reported.
When an illuminance meter is calibrated, the errors of the reading at each illuminance level
are reported. The meter reading is not adjusted. However, if the illuminance meter is so
manufactured that the user can adjust the readings easily, the meter can be adjusted by NIST
upon request by customers. In this case the instructions for the reading adjustment should be
provided by the customer.
Illuminance meters and illuminance heads can be calibrated for specific sources other than
2856 K source upon request by customers. In this case, the calibration is first performed
using the 2856 K source, and then the SMCFs for the specific sources are obtained by the
following procedure. The relative spectral responsivity of the illuminance meter or
illuminance head is measured by the SCF in the 350 nm to 1100 nm region at 5 nm
increments. The monochromator output of the SCF is defocused on the photometer head to
irradiate an area of several mm in diameter. The illuminance meter head is underfilled in this
case. Measurements are made with the beam incident on several different spots of the
receiving surface of the illuminance meter head, and the average is taken. This method can
only be applied for illuminance meters whose relative spectral responsivity is fairly uniform
over the receiving surface. From the relative spectral responsivity data and the spectral
power distribution data (supplied by customer) of any particular light sources to be measured
by the illuminance meter, the SMCFs for the particular sources are calculated using Eq. (22).
The relative spectral responsivity data and the correction factors are reported to the customer.
3.6.4. Uncertainty of illuminance responsivity calibration
The uncertainty analysis for an illuminance responsivity calibration for an illuminance head
that returns a signal that is measured with a digital voltmeter begins with a model expressed
as
f
f
dv
)(c
GE
yyR
v
, (31)
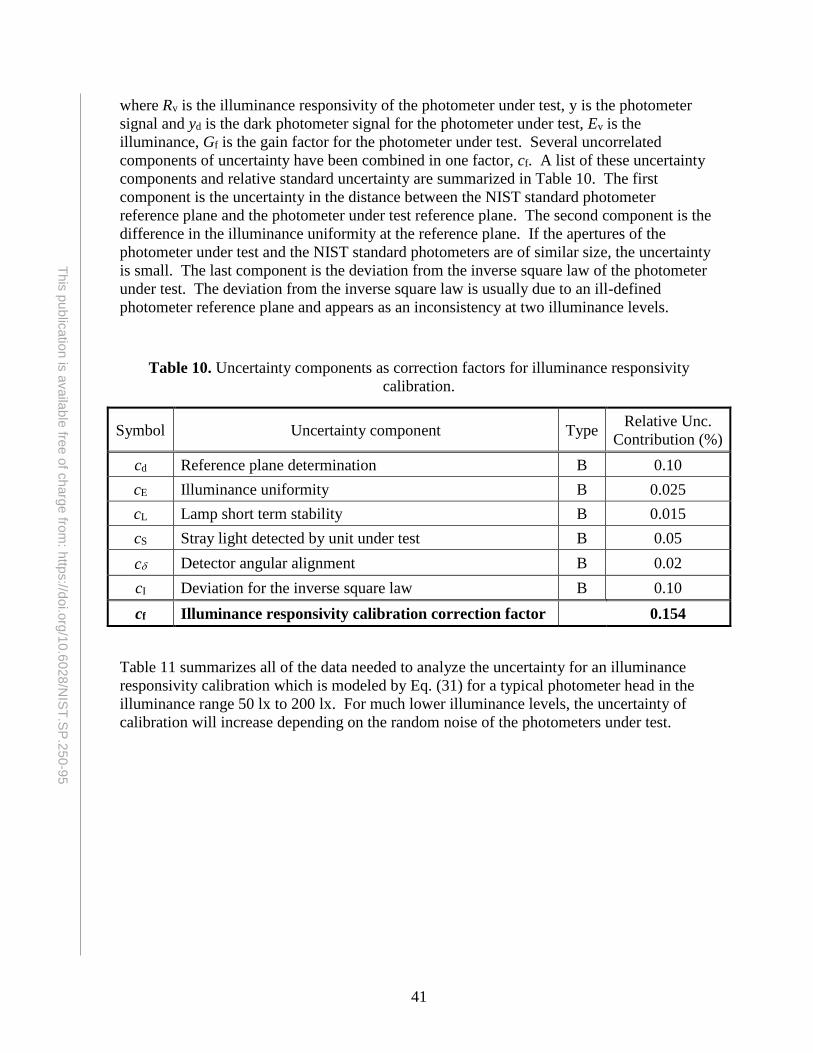
41
This
pu
blic
atio
n is
availa
ble
free o
f charg
e fro
m: h
ttps://d
oi.o
rg/1
0.6
028
/NIS
T.S
P.2
50-9
5
where Rv is the illuminance responsivity of the photometer under test, y is the photometer
signal and yd is the dark photometer signal for the photometer under test, Ev is the
illuminance, Gf is the gain factor for the photometer under test. Several uncorrelated
components of uncertainty have been combined in one factor, cf. A list of these uncertainty
components and relative standard uncertainty are summarized in Table 10. The first
component is the uncertainty in the distance between the NIST standard photometer
reference plane and the photometer under test reference plane. The second component is the
difference in the illuminance uniformity at the reference plane. If the apertures of the
photometer under test and the NIST standard photometers are of similar size, the uncertainty
is small. The last component is the deviation from the inverse square law of the photometer
under test. The deviation from the inverse square law is usually due to an ill-defined
photometer reference plane and appears as an inconsistency at two illuminance levels.
Table 10. Uncertainty components as correction factors for illuminance responsivity
calibration.
Symbol Uncertainty component Type Relative Unc.
Contribution (%)
cd Reference plane determination B 0.10
cE Illuminance uniformity B 0.025
cL Lamp short term stability B 0.015
cS Stray light detected by unit under test B 0.05
c Detector angular alignment B 0.02
cI Deviation for the inverse square law B 0.10
cf Illuminance responsivity calibration correction factor 0.154
Table 11 summarizes all of the data needed to analyze the uncertainty for an illuminance
responsivity calibration which is modeled by Eq. (31) for a typical photometer head in the
illuminance range 50 lx to 200 lx. For much lower illuminance levels, the uncertainty of
calibration will increase depending on the random noise of the photometers under test.
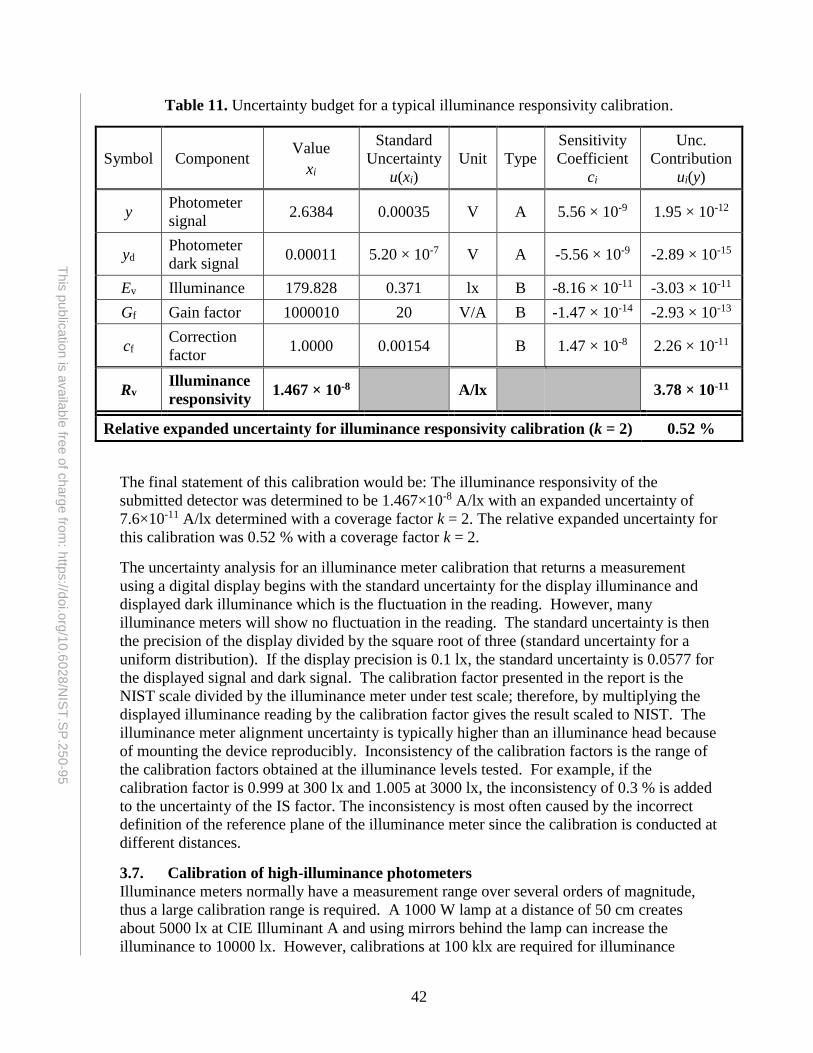
42
This
pu
blic
atio
n is
availa
ble
free o
f charg
e fro
m: h
ttps://d
oi.o
rg/1
0.6
028
/NIS
T.S
P.2
50-9
5
Table 11. Uncertainty budget for a typical illuminance responsivity calibration.
Symbol Component Value
xi
Standard
Uncertainty
u(xi)
Unit Type
Sensitivity
Coefficient
ci
Unc.
Contribution
ui(y)
y Photometer
signal 2.6384 0.00035 V A 5.56 × 10⁻⁹ 1.95 × 10⁻¹²
yd Photometer
dark signal 0.00011 5.20 × 10⁻⁷ V A -5.56 × 10⁻⁹ -2.89 × 10⁻¹⁵
Ev Illuminance 179.828 0.371 lx B -8.16 × 10⁻¹¹ -3.03 × 10⁻¹¹
Gf Gain factor 1000010 20 V/A B -1.47 × 10⁻¹⁴ -2.93 × 10⁻¹³
cf Correction
factor 1.0000 0.00154 B 1.47 × 10⁻⁸ 2.26 × 10⁻¹¹
Rv Illuminance
responsivity 1.467 × 10⁻⁸ A/lx 3.78 × 10⁻¹¹
Relative expanded uncertainty for illuminance responsivity calibration (k = 2) 0.52 %
The final statement of this calibration would be: The illuminance responsivity of the
submitted detector was determined to be 1.467×10⁻⁸ A/lx with an expanded uncertainty of
7.6×10⁻¹¹ A/lx determined with a coverage factor k = 2. The relative expanded uncertainty for
this calibration was 0.52 % with a coverage factor k = 2.
The uncertainty analysis for an illuminance meter calibration that returns a measurement
using a digital display begins with the standard uncertainty for the display illuminance and
displayed dark illuminance which is the fluctuation in the reading. However, many
illuminance meters will show no fluctuation in the reading. The standard uncertainty is then
the precision of the display divided by the square root of three (standard uncertainty for a
uniform distribution). If the display precision is 0.1 lx, the standard uncertainty is 0.0577 for
the displayed signal and dark signal. The calibration factor presented in the report is the
NIST scale divided by the illuminance meter under test scale; therefore, by multiplying the
displayed illuminance reading by the calibration factor gives the result scaled to NIST. The
illuminance meter alignment uncertainty is typically higher than an illuminance head because
of mounting the device reproducibly. Inconsistency of the calibration factors is the range of
the calibration factors obtained at the illuminance levels tested. For example, if the
calibration factor is 0.999 at 300 lx and 1.005 at 3000 lx, the inconsistency of 0.3 % is added
to the uncertainty of the IS factor. The inconsistency is most often caused by the incorrect
definition of the reference plane of the illuminance meter since the calibration is conducted at
different distances.
3.7. Calibration of high-illuminance photometers
Illuminance meters normally have a measurement range over several orders of magnitude,
thus a large calibration range is required. A 1000 W lamp at a distance of 50 cm creates
about 5000 lx at CIE Illuminant A and using mirrors behind the lamp can increase the
illuminance to 10000 lx. However, calibrations at 100 klx are required for illuminance
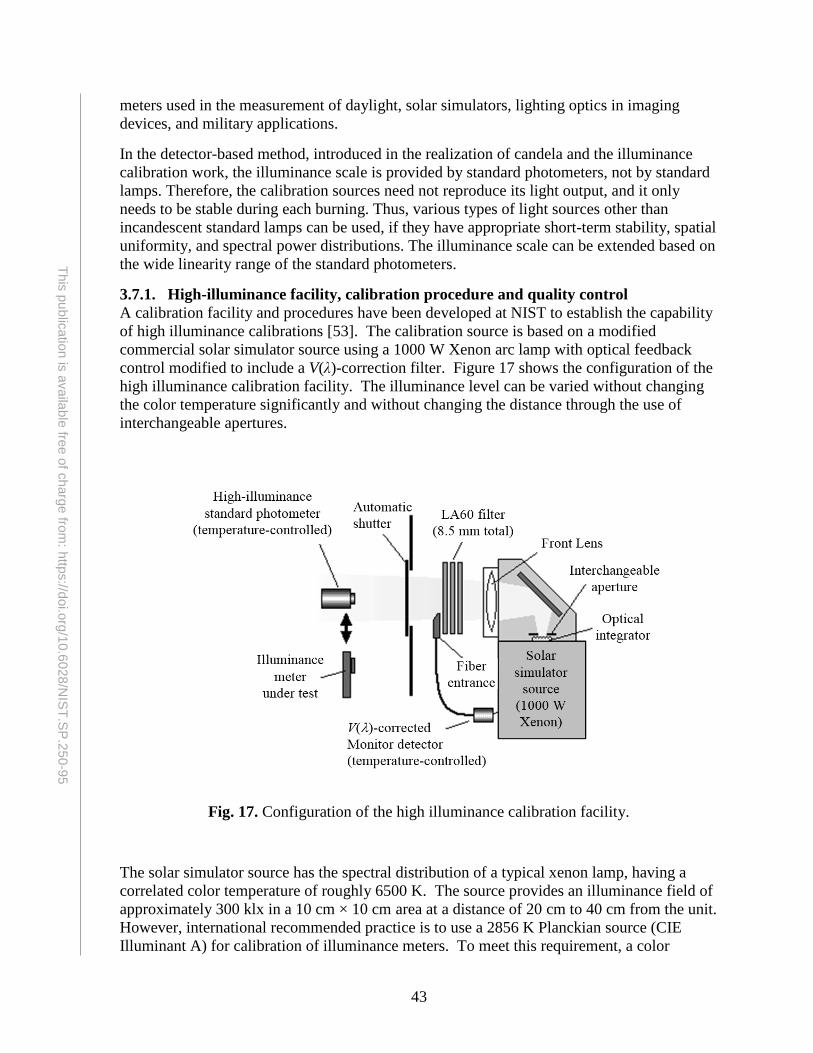
43
This
pu
blic
atio
n is
availa
ble
free o
f charg
e fro
m: h
ttps://d
oi.o
rg/1
0.6
028
/NIS
T.S
P.2
50-9
5
meters used in the measurement of daylight, solar simulators, lighting optics in imaging
devices, and military applications.
In the detector-based method, introduced in the realization of candela and the illuminance
calibration work, the illuminance scale is provided by standard photometers, not by standard
lamps. Therefore, the calibration sources need not reproduce its light output, and it only
needs to be stable during each burning. Thus, various types of light sources other than
incandescent standard lamps can be used, if they have appropriate short-term stability, spatial
uniformity, and spectral power distributions. The illuminance scale can be extended based on
the wide linearity range of the standard photometers.
3.7.1. High-illuminance facility, calibration procedure and quality control
A calibration facility and procedures have been developed at NIST to establish the capability
of high illuminance calibrations [53]. The calibration source is based on a modified
commercial solar simulator source using a 1000 W Xenon arc lamp with optical feedback
control modified to include a V(λ)-correction filter. Figure 17 shows the configuration of the
high illuminance calibration facility. The illuminance level can be varied without changing
the color temperature significantly and without changing the distance through the use of
interchangeable apertures.
Fig. 17. Configuration of the high illuminance calibration facility.
The solar simulator source has the spectral distribution of a typical xenon lamp, having a
correlated color temperature of roughly 6500 K. The source provides an illuminance field of
approximately 300 klx in a 10 cm × 10 cm area at a distance of 20 cm to 40 cm from the unit.
However, international recommended practice is to use a 2856 K Planckian source (CIE
Illuminant A) for calibration of illuminance meters. To meet this requirement, a color
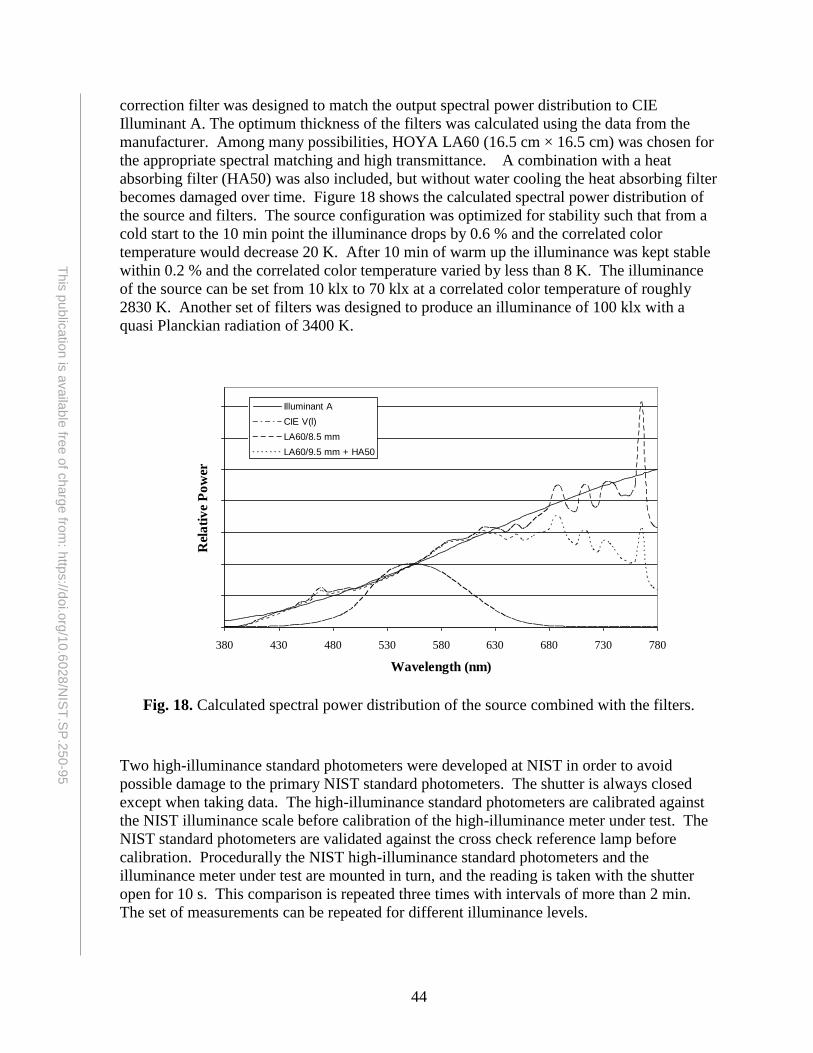
44
This
pu
blic
atio
n is
availa
ble
free o
f charg
e fro
m: h
ttps://d
oi.o
rg/1
0.6
028
/NIS
T.S
P.2
50-9
5
correction filter was designed to match the output spectral power distribution to CIE
Illuminant A. The optimum thickness of the filters was calculated using the data from the
manufacturer. Among many possibilities, HOYA LA60 (16.5 cm × 16.5 cm) was chosen for
the appropriate spectral matching and high transmittance. A combination with a heat
absorbing filter (HA50) was also included, but without water cooling the heat absorbing filter
becomes damaged over time. Figure 18 shows the calculated spectral power distribution of
the source and filters. The source configuration was optimized for stability such that from a
cold start to the 10 min point the illuminance drops by 0.6 % and the correlated color
temperature would decrease 20 K. After 10 min of warm up the illuminance was kept stable
within 0.2 % and the correlated color temperature varied by less than 8 K. The illuminance
of the source can be set from 10 klx to 70 klx at a correlated color temperature of roughly
2830 K. Another set of filters was designed to produce an illuminance of 100 klx with a
quasi Planckian radiation of 3400 K.
Fig. 18. Calculated spectral power distribution of the source combined with the filters.
Two high-illuminance standard photometers were developed at NIST in order to avoid
possible damage to the primary NIST standard photometers. The shutter is always closed
except when taking data. The high-illuminance standard photometers are calibrated against
the NIST illuminance scale before calibration of the high-illuminance meter under test. The
NIST standard photometers are validated against the cross check reference lamp before
calibration. Procedurally the NIST high-illuminance standard photometers and the
illuminance meter under test are mounted in turn, and the reading is taken with the shutter
open for 10 s. This comparison is repeated three times with intervals of more than 2 min.
The set of measurements can be repeated for different illuminance levels.
380 430 480 530 580 630 680 730 780
Wavelength (nm)
Rel
ati
ve
Po
wer
Illuminant A
CIE V(l)
LA60/8.5 mm
LA60/9.5 mm + HA50
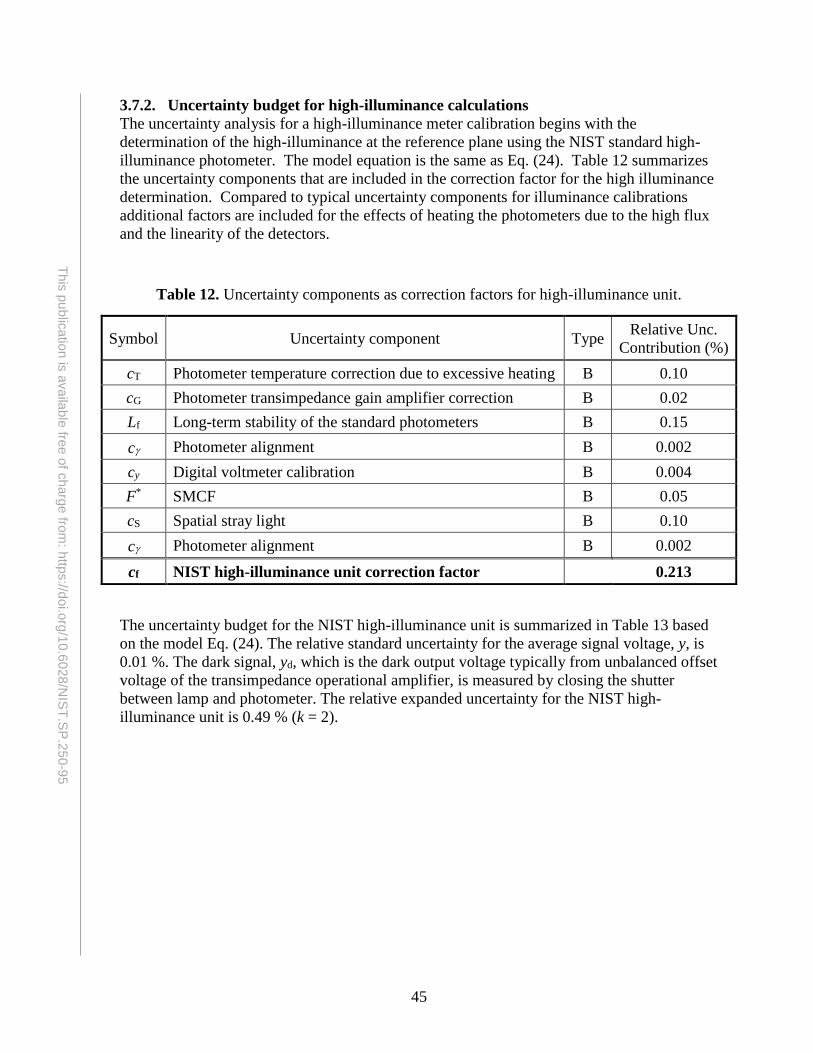
45
This
pu
blic
atio
n is
availa
ble
free o
f charg
e fro
m: h
ttps://d
oi.o
rg/1
0.6
028
/NIS
T.S
P.2
50-9
5
3.7.2. Uncertainty budget for high-illuminance calculations
The uncertainty analysis for a high-illuminance meter calibration begins with the
determination of the high-illuminance at the reference plane using the NIST standard high-
illuminance photometer. The model equation is the same as Eq. (24). Table 12 summarizes
the uncertainty components that are included in the correction factor for the high illuminance
determination. Compared to typical uncertainty components for illuminance calibrations
additional factors are included for the effects of heating the photometers due to the high flux
and the linearity of the detectors.
Table 12. Uncertainty components as correction factors for high-illuminance unit.
Symbol Uncertainty component Type Relative Unc.
Contribution (%)
cT Photometer temperature correction due to excessive heating B 0.10
cG Photometer transimpedance gain amplifier correction B 0.02
Lf Long-term stability of the standard photometers B 0.15
c Photometer alignment B 0.002
cy Digital voltmeter calibration B 0.004
F* SMCF B 0.05
cS Spatial stray light B 0.10
c Photometer alignment B 0.002
cf NIST high-illuminance unit correction factor 0.213
The uncertainty budget for the NIST high-illuminance unit is summarized in Table 13 based
on the model Eq. (24). The relative standard uncertainty for the average signal voltage, y, is
0.01 %. The dark signal, yd, which is the dark output voltage typically from unbalanced offset
voltage of the transimpedance operational amplifier, is measured by closing the shutter
between lamp and photometer. The relative expanded uncertainty for the NIST high-
illuminance unit is 0.49 % (k = 2).
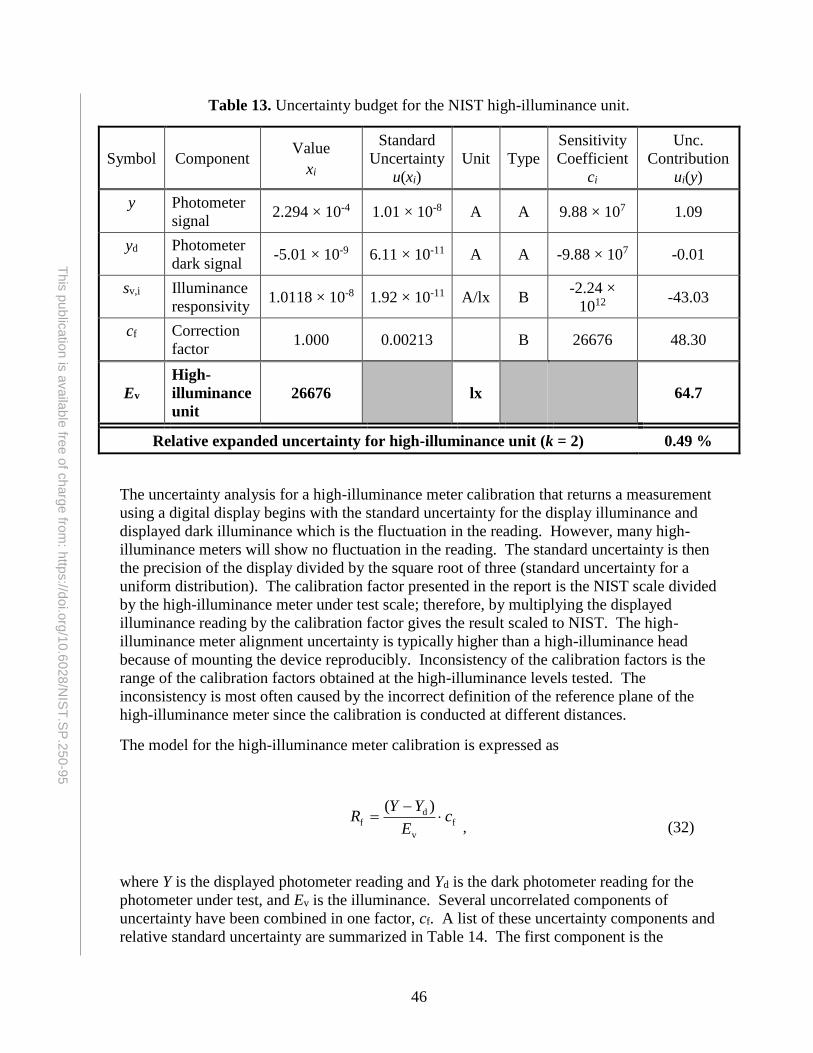
46
This
pu
blic
atio
n is
availa
ble
free o
f charg
e fro
m: h
ttps://d
oi.o
rg/1
0.6
028
/NIS
T.S
P.2
50-9
5
Table 13. Uncertainty budget for the NIST high-illuminance unit.
Symbol Component Value
xi
Standard
Uncertainty
u(xi)
Unit Type
Sensitivity
Coefficient
ci
Unc.
Contribution
ui(y)
y Photometer
signal 2.294 × 10⁻⁴ 1.01 × 10⁻⁸ A A 9.88 × 10⁷ 1.09
yd Photometer
dark signal -5.01 × 10⁻⁹ 6.11 × 10⁻¹¹ A A -9.88 × 10⁷ -0.01
sv,i Illuminance
responsivity 1.0118 × 10⁻⁸ 1.92 × 10⁻¹¹ A/lx B
-2.24 ×
1012 -43.03
cf Correction
factor 1.000 0.00213 B 26676 48.30
Ev
High-
illuminance
unit
26676 lx 64.7
Relative expanded uncertainty for high-illuminance unit (k = 2) 0.49 %
The uncertainty analysis for a high-illuminance meter calibration that returns a measurement
using a digital display begins with the standard uncertainty for the display illuminance and
displayed dark illuminance which is the fluctuation in the reading. However, many high-
illuminance meters will show no fluctuation in the reading. The standard uncertainty is then
the precision of the display divided by the square root of three (standard uncertainty for a
uniform distribution). The calibration factor presented in the report is the NIST scale divided
by the high-illuminance meter under test scale; therefore, by multiplying the displayed
illuminance reading by the calibration factor gives the result scaled to NIST. The high-
illuminance meter alignment uncertainty is typically higher than a high-illuminance head
because of mounting the device reproducibly. Inconsistency of the calibration factors is the
range of the calibration factors obtained at the high-illuminance levels tested. The
inconsistency is most often caused by the incorrect definition of the reference plane of the
high-illuminance meter since the calibration is conducted at different distances.
The model for the high-illuminance meter calibration is expressed as
f
v
df
)(c
E
YYR
, (32)
where Y is the displayed photometer reading and Yd is the dark photometer reading for the
photometer under test, and Ev is the illuminance. Several uncorrelated components of
uncertainty have been combined in one factor, cf. A list of these uncertainty components and
relative standard uncertainty are summarized in Table 14. The first component is the
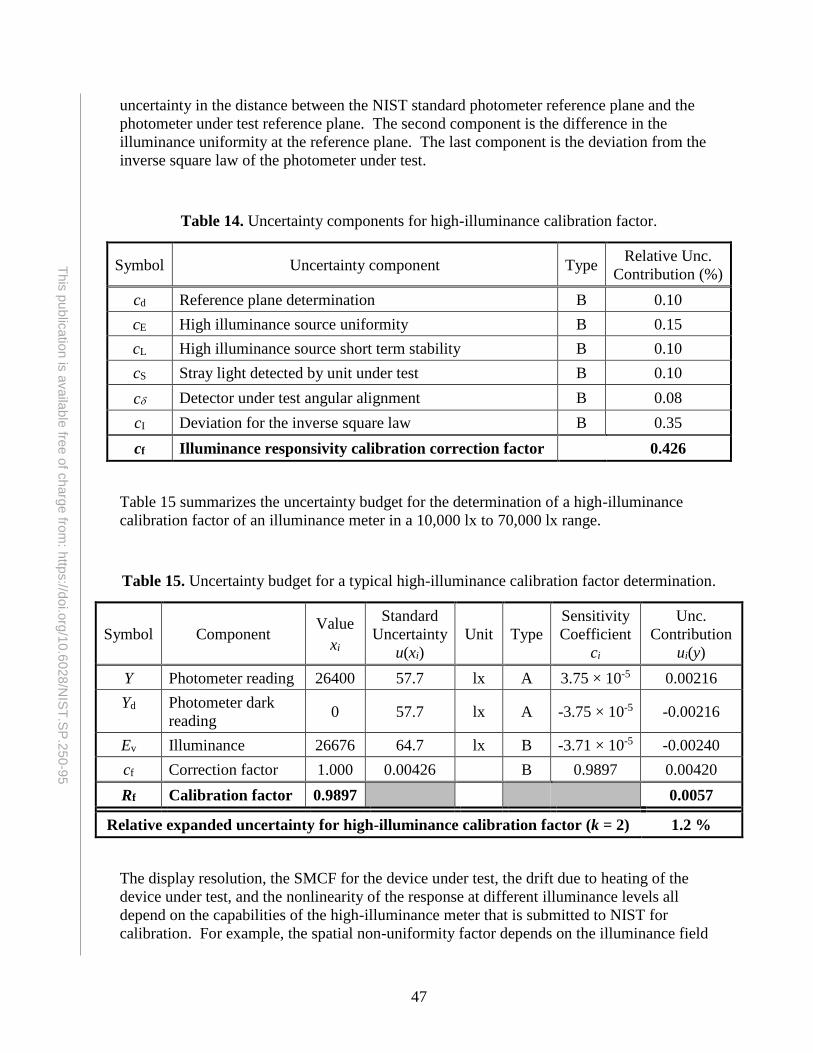
47
This
pu
blic
atio
n is
availa
ble
free o
f charg
e fro
m: h
ttps://d
oi.o
rg/1
0.6
028
/NIS
T.S
P.2
50-9
5
uncertainty in the distance between the NIST standard photometer reference plane and the
photometer under test reference plane. The second component is the difference in the
illuminance uniformity at the reference plane. The last component is the deviation from the
inverse square law of the photometer under test.
Table 14. Uncertainty components for high-illuminance calibration factor.
Symbol Uncertainty component Type Relative Unc.
Contribution (%)
cd Reference plane determination B 0.10
cE High illuminance source uniformity B 0.15
cL High illuminance source short term stability B 0.10
cS Stray light detected by unit under test B 0.10
c Detector under test angular alignment B 0.08
cI Deviation for the inverse square law B 0.35
cf Illuminance responsivity calibration correction factor 0.426
Table 15 summarizes the uncertainty budget for the determination of a high-illuminance
calibration factor of an illuminance meter in a 10,000 lx to 70,000 lx range.
Table 15. Uncertainty budget for a typical high-illuminance calibration factor determination.
Symbol Component Value
xi
Standard
Uncertainty
u(xi)
Unit Type
Sensitivity
Coefficient
ci
Unc.
Contribution
ui(y)
Y Photometer reading 26400 57.7 lx A 3.75 × 10⁻⁵ 0.00216
Yd Photometer dark
reading 0 57.7 lx A -3.75 × 10⁻⁵ -0.00216
Ev Illuminance 26676 64.7 lx B -3.71 × 10⁻⁵ -0.00240
cf Correction factor 1.000 0.00426 B 0.9897 0.00420
Rf Calibration factor 0.9897 0.0057
Relative expanded uncertainty for high-illuminance calibration factor (k = 2) 1.2 %
The display resolution, the SMCF for the device under test, the drift due to heating of the
device under test, and the nonlinearity of the response at different illuminance levels all
depend on the capabilities of the high-illuminance meter that is submitted to NIST for
calibration. For example, the spatial non-uniformity factor depends on the illuminance field
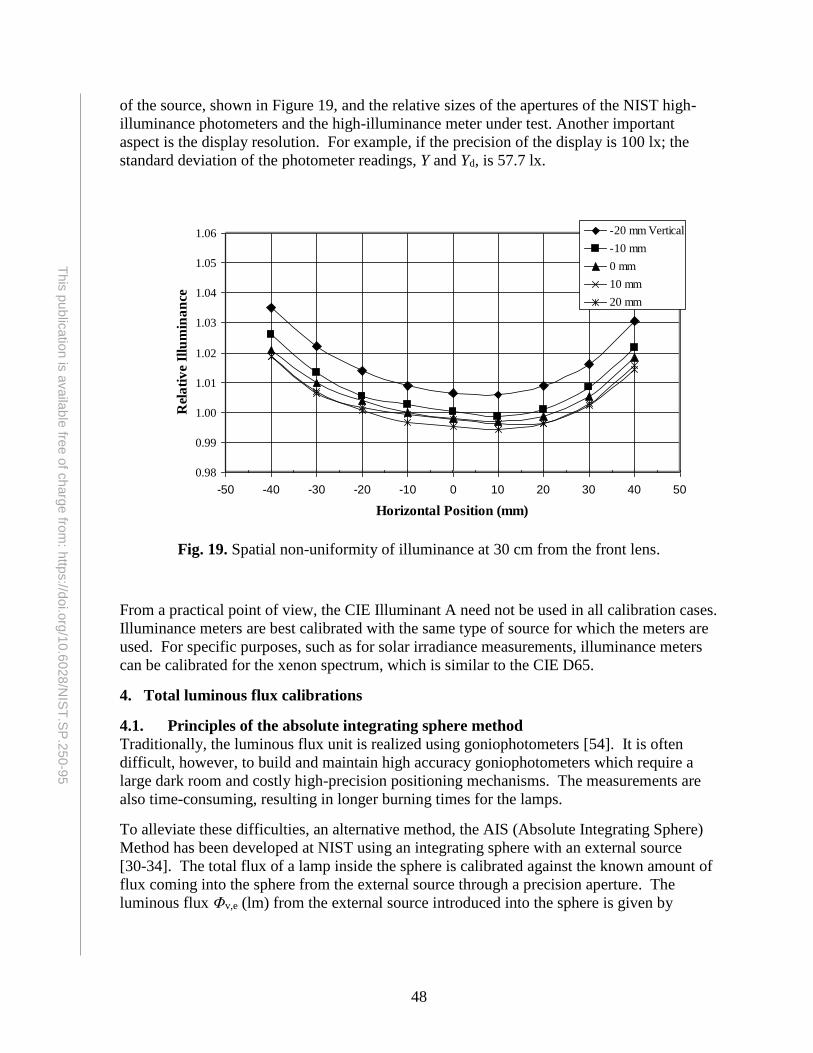
48
This
pu
blic
atio
n is
availa
ble
free o
f charg
e fro
m: h
ttps://d
oi.o
rg/1
0.6
028
/NIS
T.S
P.2
50-9
5
of the source, shown in Figure 19, and the relative sizes of the apertures of the NIST high-
illuminance photometers and the high-illuminance meter under test. Another important
aspect is the display resolution. For example, if the precision of the display is 100 lx; the
standard deviation of the photometer readings, Y and Yd, is 57.7 lx.
Fig. 19. Spatial non-uniformity of illuminance at 30 cm from the front lens.
From a practical point of view, the CIE Illuminant A need not be used in all calibration cases.
Illuminance meters are best calibrated with the same type of source for which the meters are
used. For specific purposes, such as for solar irradiance measurements, illuminance meters
can be calibrated for the xenon spectrum, which is similar to the CIE D65.
4. Total luminous flux calibrations
4.1. Principles of the absolute integrating sphere method
Traditionally, the luminous flux unit is realized using goniophotometers [54]. It is often
difficult, however, to build and maintain high accuracy goniophotometers which require a
large dark room and costly high-precision positioning mechanisms. The measurements are
also time-consuming, resulting in longer burning times for the lamps.
To alleviate these difficulties, an alternative method, the AIS (Absolute Integrating Sphere)
Method has been developed at NIST using an integrating sphere with an external source
[30-34]. The total flux of a lamp inside the sphere is calibrated against the known amount of
flux coming into the sphere from the external source through a precision aperture. The
luminous flux Φv,e (lm) from the external source introduced into the sphere is given by
0.98
0.99
1.00
1.01
1.02
1.03
1.04
1.05
1.06
-50 -40 -30 -20 -10 0 10 20 30 40 50
Horizontal Position (mm)
Rel
ati
ve
Illu
min
an
ce
-20 mm Vertical
-10 mm
0 mm
10 mm
20 mm
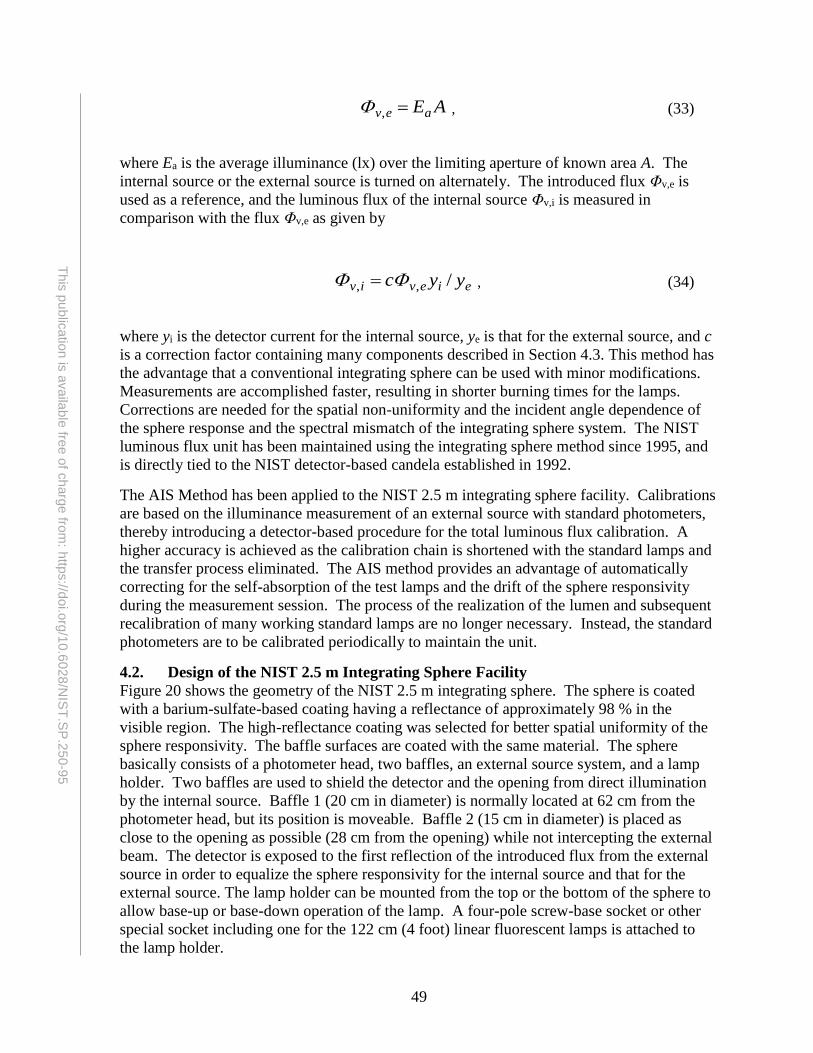
49
This
pu
blic
atio
n is
availa
ble
free o
f charg
e fro
m: h
ttps://d
oi.o
rg/1
0.6
028
/NIS
T.S
P.2
50-9
5
AEaev , , (33)
where Ea is the average illuminance (lx) over the limiting aperture of known area A. The
internal source or the external source is turned on alternately. The introduced flux Φv,e is
used as a reference, and the luminous flux of the internal source Φv,i is measured in
comparison with the flux Φv,e as given by
eieviv yyc /,, , (34)
where yi is the detector current for the internal source, ye is that for the external source, and c
is a correction factor containing many components described in Section 4.3. This method has
the advantage that a conventional integrating sphere can be used with minor modifications.
Measurements are accomplished faster, resulting in shorter burning times for the lamps.
Corrections are needed for the spatial non-uniformity and the incident angle dependence of
the sphere response and the spectral mismatch of the integrating sphere system. The NIST
luminous flux unit has been maintained using the integrating sphere method since 1995, and
is directly tied to the NIST detector-based candela established in 1992.
The AIS Method has been applied to the NIST 2.5 m integrating sphere facility. Calibrations
are based on the illuminance measurement of an external source with standard photometers,
thereby introducing a detector-based procedure for the total luminous flux calibration. A
higher accuracy is achieved as the calibration chain is shortened with the standard lamps and
the transfer process eliminated. The AIS method provides an advantage of automatically
correcting for the self-absorption of the test lamps and the drift of the sphere responsivity
during the measurement session. The process of the realization of the lumen and subsequent
recalibration of many working standard lamps are no longer necessary. Instead, the standard
photometers are to be calibrated periodically to maintain the unit.
4.2. Design of the NIST 2.5 m Integrating Sphere Facility
Figure 20 shows the geometry of the NIST 2.5 m integrating sphere. The sphere is coated
with a barium-sulfate-based coating having a reflectance of approximately 98 % in the
visible region. The high-reflectance coating was selected for better spatial uniformity of the
sphere responsivity. The baffle surfaces are coated with the same material. The sphere
basically consists of a photometer head, two baffles, an external source system, and a lamp
holder. Two baffles are used to shield the detector and the opening from direct illumination
by the internal source. Baffle 1 (20 cm in diameter) is normally located at 62 cm from the
photometer head, but its position is moveable. Baffle 2 (15 cm in diameter) is placed as
close to the opening as possible (28 cm from the opening) while not intercepting the external
beam. The detector is exposed to the first reflection of the introduced flux from the external
source in order to equalize the sphere responsivity for the internal source and that for the
external source. The lamp holder can be mounted from the top or the bottom of the sphere to
allow base-up or base-down operation of the lamp. A four-pole screw-base socket or other
special socket including one for the 122 cm (4 foot) linear fluorescent lamps is attached to
the lamp holder.
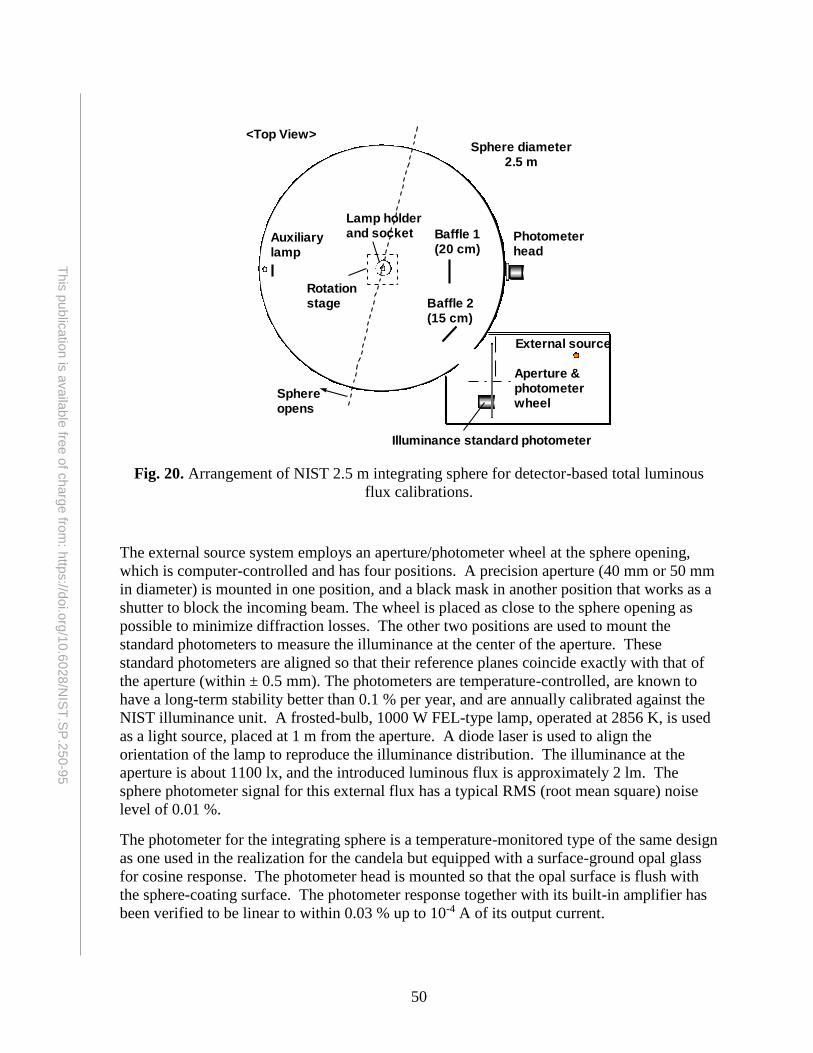
50
This
pu
blic
atio
n is
availa
ble
free o
f charg
e fro
m: h
ttps://d
oi.o
rg/1
0.6
028
/NIS
T.S
P.2
50-9
5
Fig. 20. Arrangement of NIST 2.5 m integrating sphere for detector-based total luminous
flux calibrations.
The external source system employs an aperture/photometer wheel at the sphere opening,
which is computer-controlled and has four positions. A precision aperture (40 mm or 50 mm
in diameter) is mounted in one position, and a black mask in another position that works as a
shutter to block the incoming beam. The wheel is placed as close to the sphere opening as
possible to minimize diffraction losses. The other two positions are used to mount the
standard photometers to measure the illuminance at the center of the aperture. These
standard photometers are aligned so that their reference planes coincide exactly with that of
the aperture (within ± 0.5 mm). The photometers are temperature-controlled, are known to
have a long-term stability better than 0.1 % per year, and are annually calibrated against the
NIST illuminance unit. A frosted-bulb, 1000 W FEL-type lamp, operated at 2856 K, is used
as a light source, placed at 1 m from the aperture. A diode laser is used to align the
orientation of the lamp to reproduce the illuminance distribution. The illuminance at the
aperture is about 1100 lx, and the introduced luminous flux is approximately 2 lm. The
sphere photometer signal for this external flux has a typical RMS (root mean square) noise
level of 0.01 %.
The photometer for the integrating sphere is a temperature-monitored type of the same design
as one used in the realization for the candela but equipped with a surface-ground opal glass
for cosine response. The photometer head is mounted so that the opal surface is flush with
the sphere-coating surface. The photometer response together with its built-in amplifier has
been verified to be linear to within 0.03 % up to 10-4 A of its output current.
<Top View>
Auxiliary lamp
Baffle 1 (20 cm)
Baffle 2 (15 cm)
Sphere opens
Photometer head
Aperture & photometer wheel
Rotation stage
Lamp holder and socket
External source
Illuminance standard photometer
Sphere diameter 2.5 m
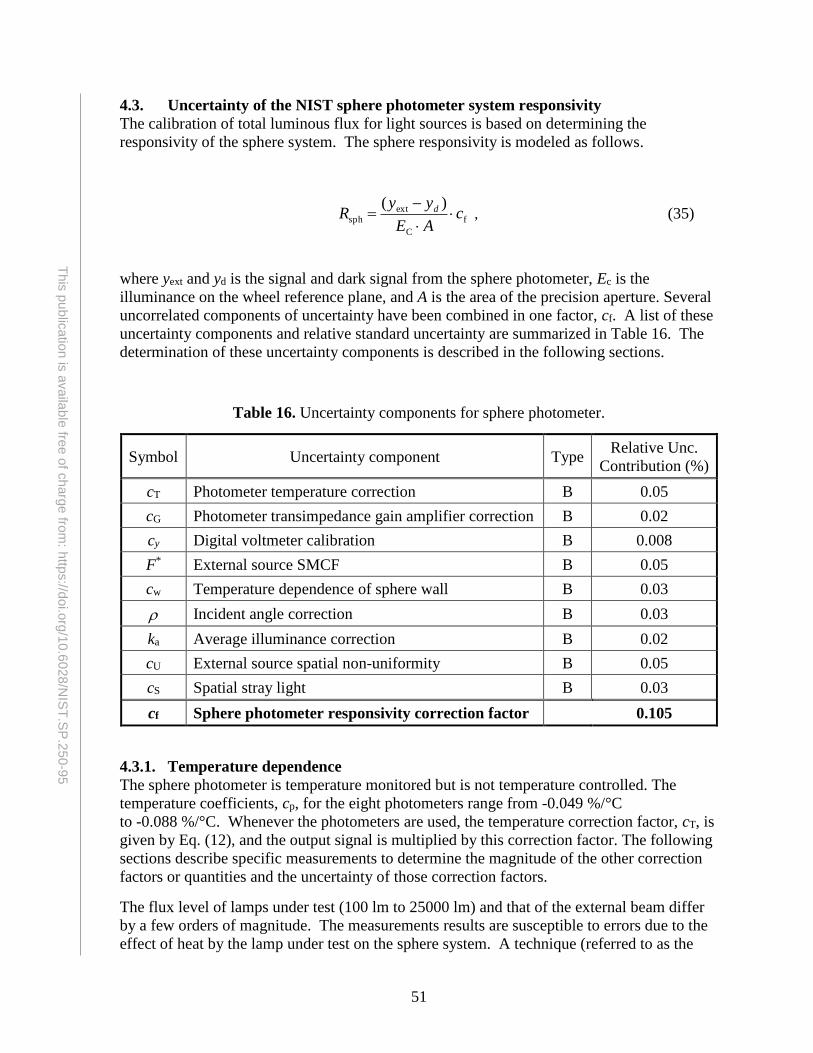
51
This
pu
blic
atio
n is
availa
ble
free o
f charg
e fro
m: h
ttps://d
oi.o
rg/1
0.6
028
/NIS
T.S
P.2
50-9
5
4.3. Uncertainty of the NIST sphere photometer system responsivity
The calibration of total luminous flux for light sources is based on determining the
responsivity of the sphere system. The sphere responsivity is modeled as follows.
f
C
extsph
)(c
AE
yyR d
, (35)
where yext and yd is the signal and dark signal from the sphere photometer, Ec is the
illuminance on the wheel reference plane, and A is the area of the precision aperture. Several
uncorrelated components of uncertainty have been combined in one factor, cf. A list of these
uncertainty components and relative standard uncertainty are summarized in Table 16. The
determination of these uncertainty components is described in the following sections.
Table 16. Uncertainty components for sphere photometer.
Symbol Uncertainty component Type Relative Unc.
Contribution (%)
cT Photometer temperature correction B 0.05
cG Photometer transimpedance gain amplifier correction B 0.02
cy Digital voltmeter calibration B 0.008
F* External source SMCF B 0.05
cw Temperature dependence of sphere wall B 0.03
Incident angle correction B 0.03
ka Average illuminance correction B 0.02
cU External source spatial non-uniformity B 0.05
cS Spatial stray light B 0.03
cf Sphere photometer responsivity correction factor 0.105
4.3.1. Temperature dependence
The sphere photometer is temperature monitored but is not temperature controlled. The
temperature coefficients, cp, for the eight photometers range from -0.049 %/°C
to -0.088 %/°C. Whenever the photometers are used, the temperature correction factor, cT, is
given by Eq. (12), and the output signal is multiplied by this correction factor. The following
sections describe specific measurements to determine the magnitude of the other correction
factors or quantities and the uncertainty of those correction factors.
The flux level of lamps under test (100 lm to 25000 lm) and that of the external beam differ
by a few orders of magnitude. The measurements results are susceptible to errors due to the
effect of heat by the lamp under test on the sphere system. A technique (referred to as the
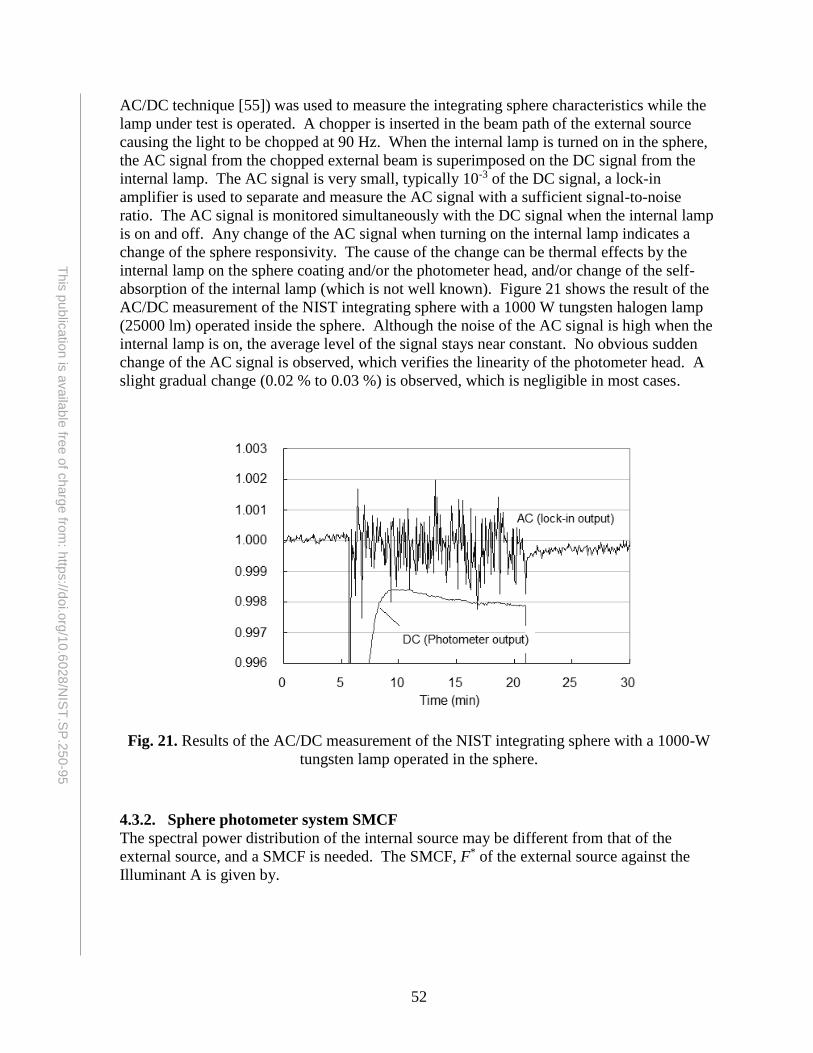
52
This
pu
blic
atio
n is
availa
ble
free o
f charg
e fro
m: h
ttps://d
oi.o
rg/1
0.6
028
/NIS
T.S
P.2
50-9
5
AC/DC technique [55]) was used to measure the integrating sphere characteristics while the
lamp under test is operated. A chopper is inserted in the beam path of the external source
causing the light to be chopped at 90 Hz. When the internal lamp is turned on in the sphere,
the AC signal from the chopped external beam is superimposed on the DC signal from the
internal lamp. The AC signal is very small, typically 10-3 of the DC signal, a lock-in
amplifier is used to separate and measure the AC signal with a sufficient signal-to-noise
ratio. The AC signal is monitored simultaneously with the DC signal when the internal lamp
is on and off. Any change of the AC signal when turning on the internal lamp indicates a
change of the sphere responsivity. The cause of the change can be thermal effects by the
internal lamp on the sphere coating and/or the photometer head, and/or change of the self-
absorption of the internal lamp (which is not well known). Figure 21 shows the result of the
AC/DC measurement of the NIST integrating sphere with a 1000 W tungsten halogen lamp
(25000 lm) operated inside the sphere. Although the noise of the AC signal is high when the
internal lamp is on, the average level of the signal stays near constant. No obvious sudden
change of the AC signal is observed, which verifies the linearity of the photometer head. A
slight gradual change (0.02 % to 0.03 %) is observed, which is negligible in most cases.
Fig. 21. Results of the AC/DC measurement of the NIST integrating sphere with a 1000-W
tungsten lamp operated in the sphere.
4.3.2. Sphere photometer system SMCF
The spectral power distribution of the internal source may be different from that of the
external source, and a SMCF is needed. The SMCF, F* of the external source against the
Illuminant A is given by.
53
This
pu
blic
atio
n is
availa
ble
free o
f charg
e fro
m: h
ttps://d
oi.o
rg/1
0.6
028
/NIS
T.S
P.2
50-9
5
d)()(
d)()(
d)()(
d)()(
)(
e
erel,e
A
erel,A
e
*
Vs
ss
Vs
ss
sF , (36)
where se(λ) is the relative spectral power distribution of the external source, sA(λ) is that of
the Illuminant A, V(λ) is the spectral luminous efficiency function, and srel,e(λ) is the relative
spectral responsivity of the sphere system. srel,e(λ) can be obtained by measuring the relative
spectral responsivity of the detector Rd(λ), and the relative spectral throughput of the
integrating sphere Ts(λ) as
sderel, TRs . (37)
The relative spectral throughput Ts(λ) of the sphere was obtained using a spectroradiometer
by taking the ratios of the spectral irradiance on the detector port of the sphere (in which a
500 W clear-bulb flux standard lamp was operated) and the spectral irradiance of the same
lamp measured on the photometry bench. The relative spectral responsivity Rs(λ) of the total
integrating sphere system was then obtained using Eq. (37). Since the SMCF is based on two
ratio measurements, the major uncertainty components are the noise of the spectrometer and
the wavelength calibration of the spectrometer.
4.3.3. Spatial non-uniformity correction factor
The spatial response distribution function (SRDF), K(θ, φ), is the spatial distribution of the
relative sphere responsivity over the sphere wall including baffle surfaces, and is measured
by scanning a narrow beam in the sphere. The integrating sphere is equipped with computer-
controlled rotation stages on the top and the bottom of the sphere, which can rotate the lamp
holder horizontally. At the lamp socket, another small rotation stage is mounted and rotates
the beam source vertically. The beam source is scanned over the 4π solid angle. The beam
source consists of a vacuum miniature lamp and a lens. A vacuum lamp is used to make the
source insensitive to its burning position. The lens was used to keep the flux level as high as
possible while minimizing the flux leaking outside the beam angle (approximately 5°). The
total luminous flux of the beam is approximately 0.1 lm, with 97 % of the flux within the
beam angle. The SRDF of the integrating sphere was measured at 5° intervals for both the
azimuth angle (φ) and elevation angle (θ), and plotted as a three-dimensional chart in
Figure 22. Prior to each vertical scan, the beam position was moved to a reference point so
that the stability of the beam source could be monitored and corrections applied for the drift
of the lamp. In Figure 22, θ = 0° at the top and θ = 180° at the bottom of the sphere, and φ
= 0° or 360° is the plane where the photometer head is located. Various structures in the
sphere are seen in the data: the effect of Baffle 1 at (θ, φ) = (90°, 0°) and (90°, 360°), the
shadow of Baffle 1 and the lamp post at φ = 180°, and the hemisphere joints (grooves at φ
= 70° and 250°). It is also observed that the responses in the upper hemisphere appear
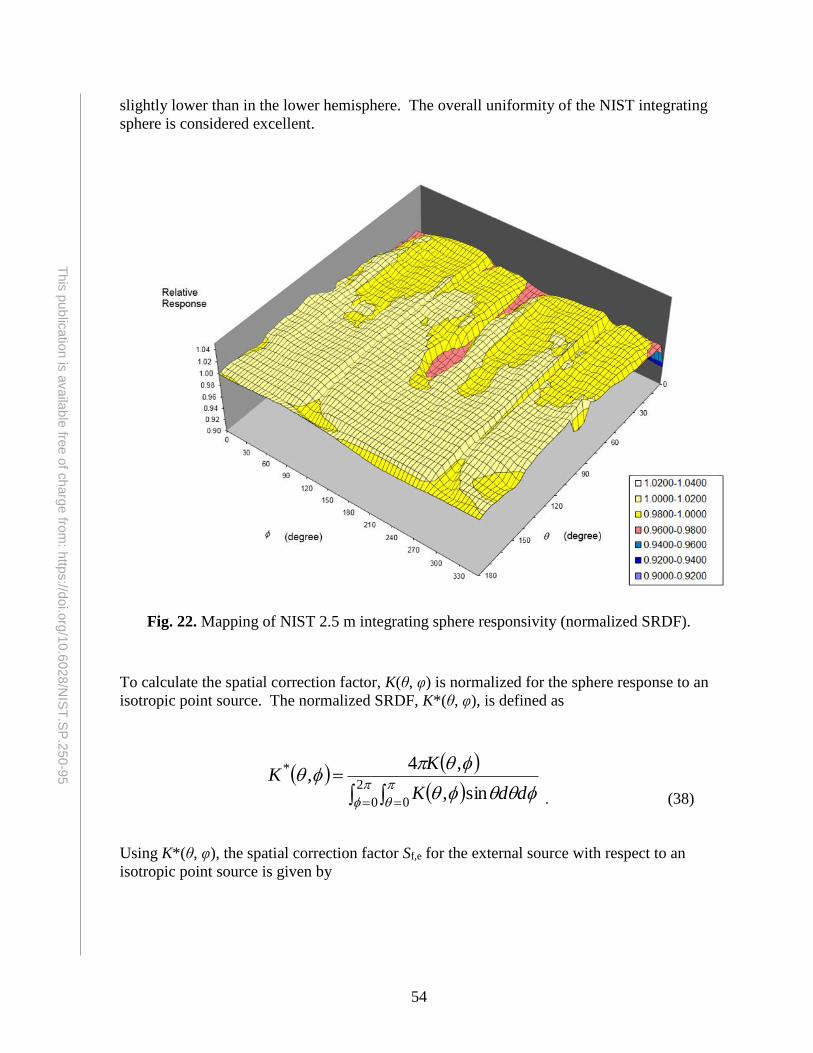
54
This
pu
blic
atio
n is
availa
ble
free o
f charg
e fro
m: h
ttps://d
oi.o
rg/1
0.6
028
/NIS
T.S
P.2
50-9
5
slightly lower than in the lower hemisphere. The overall uniformity of the NIST integrating
sphere is considered excellent.
Fig. 22. Mapping of NIST 2.5 m integrating sphere responsivity (normalized SRDF).
To calculate the spatial correction factor, K(θ, φ) is normalized for the sphere response to an
isotropic point source. The normalized SRDF, K*(θ, φ), is defined as
2
0 0
*
sin,
,4,
ddK
KK
. (38)
Using K*(θ, φ), the spatial correction factor Sf,e for the external source with respect to an
isotropic point source is given by
55
This
pu
blic
atio
n is
availa
ble
free o
f charg
e fro
m: h
ttps://d
oi.o
rg/1
0.6
028
/NIS
T.S
P.2
50-9
5
eeKS
,
1*ef,
. (39)
The area ± 5° around the hot spot (the area where the external beam hits the sphere wall) was
further mapped at 1° intervals to determine the sphere responsivity for the hot spot. The
spatial non-uniformity correction factor for the external beam was determined to be 0.9992
and is measured on an annual basis as part of the scale realization. The standard uncertainty
of this measurement is 0.05 % and the annual stability of this correction factor is 0.05 %.
4.3.4. Incident angle correction factor
The light from the lamp under test is incident normal to the sphere wall, while light from the
external source is incident at 45°. When the incident angle deviates from these values, the
diffuse reflectance of the sphere coating changes [56], which affects the sphere response.
The incident angle correction factor was measured by positioning the beam source at the
center of the sphere, illuminating the hot spot, and measuring the sphere photometer
response, y0(θe, φe). The beam source is moved to illuminate the hot spot along the axis of
external source illumination without opening the sphere, and the sphere photometer response,
y45(θe, φe), is measured. The ratio of the two measurements is the incident angle correction
factor, 0.9993 with a standard uncertainty of 0.0003.
4.3.5. Illuminance on the reference plane of the aperture and photometer wheel
The illuminance on the aperture from the external source is determined by two photometers
that are calibrated against the NIST standard photometers. The uncertainty analysis of the
illuminance measurement follows the model.
2
K2856K2856 fR
d
2
20
0
2
2
d
2
10
0
1
1c
cc
Tdd
d
R
y
Tdd
d
R
yE
, (40)
where y1 and y2 is the signal from the standard photometers, R1 and R2 is the illuminance
responsivity of the two standard photometers, d0 is the distance from the aperture to the
external source, Δd1 and Δd2 is the difference between the distance from the photometer
reference plane to the external source and d0, Td is the color temperature of the external
source, and α and β are the exponential dependence of the spectral mismatch for the
photometers. To remove the correlation between R1 and R2 the scale uncertainty has been
separated into a correction factor, cR. Several uncorrelated components of uncertainty have
been combined in one factor, cf. A list of these uncertainty components and relative standard
uncertainty are summarized in Table 17. As shown in Table 18, which summarizes the
uncertainty budget for the illuminance measurement on the reference plane of the aperture
and photometer wheel, the distance from the external source to the aperture does not need to
be determined accurately because it is a ratio in the model. The important distance aspect is
setting the reference plane of the standard photometers at the same distance as the aperture.
To approximate the sensitivity coefficient for d0, the standard uncertainty for Δd1 and Δd2
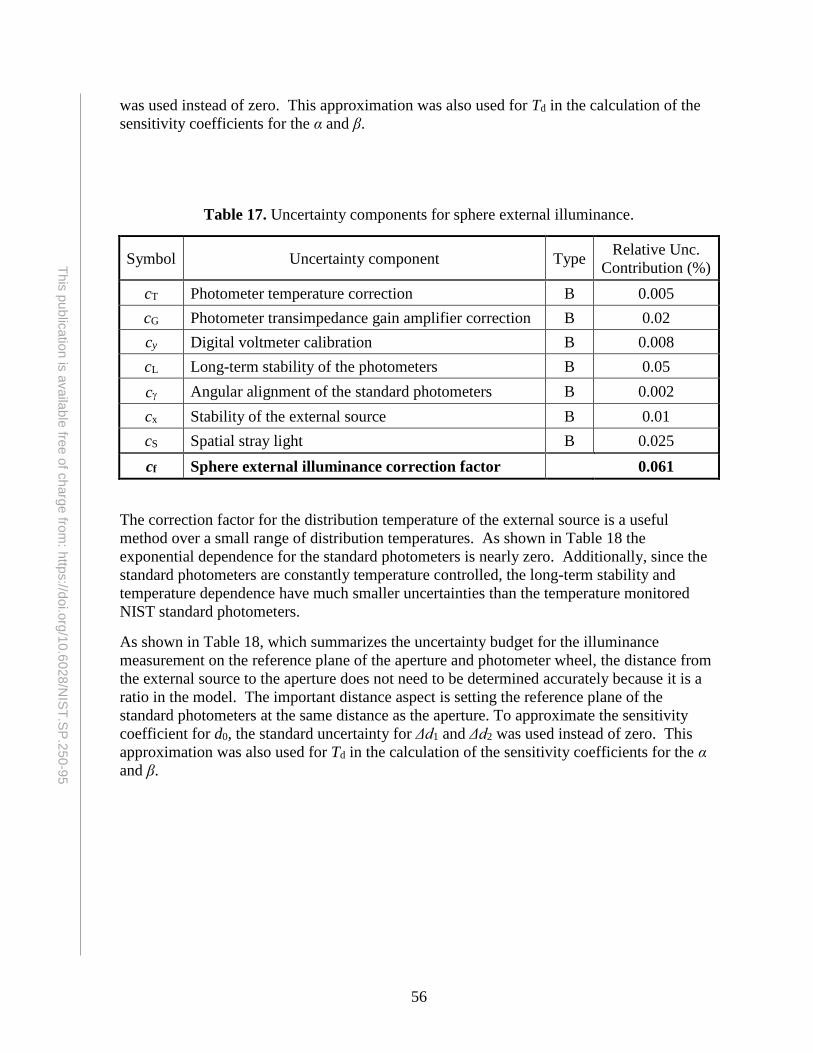
56
This
pu
blic
atio
n is
availa
ble
free o
f charg
e fro
m: h
ttps://d
oi.o
rg/1
0.6
028
/NIS
T.S
P.2
50-9
5
was used instead of zero. This approximation was also used for Td in the calculation of the
sensitivity coefficients for the α and β.
Table 17. Uncertainty components for sphere external illuminance.
Symbol Uncertainty component Type Relative Unc.
Contribution (%)
cT Photometer temperature correction B 0.005
cG Photometer transimpedance gain amplifier correction B 0.02
cy Digital voltmeter calibration B 0.008
cL Long-term stability of the photometers B 0.05
c Angular alignment of the standard photometers B 0.002
cx Stability of the external source B 0.01
cS Spatial stray light B 0.025
cf Sphere external illuminance correction factor 0.061
The correction factor for the distribution temperature of the external source is a useful
method over a small range of distribution temperatures. As shown in Table 18 the
exponential dependence for the standard photometers is nearly zero. Additionally, since the
standard photometers are constantly temperature controlled, the long-term stability and
temperature dependence have much smaller uncertainties than the temperature monitored
NIST standard photometers.
As shown in Table 18, which summarizes the uncertainty budget for the illuminance
measurement on the reference plane of the aperture and photometer wheel, the distance from
the external source to the aperture does not need to be determined accurately because it is a
ratio in the model. The important distance aspect is setting the reference plane of the
standard photometers at the same distance as the aperture. To approximate the sensitivity
coefficient for d0, the standard uncertainty for Δd1 and Δd2 was used instead of zero. This
approximation was also used for Td in the calculation of the sensitivity coefficients for the α
and β.
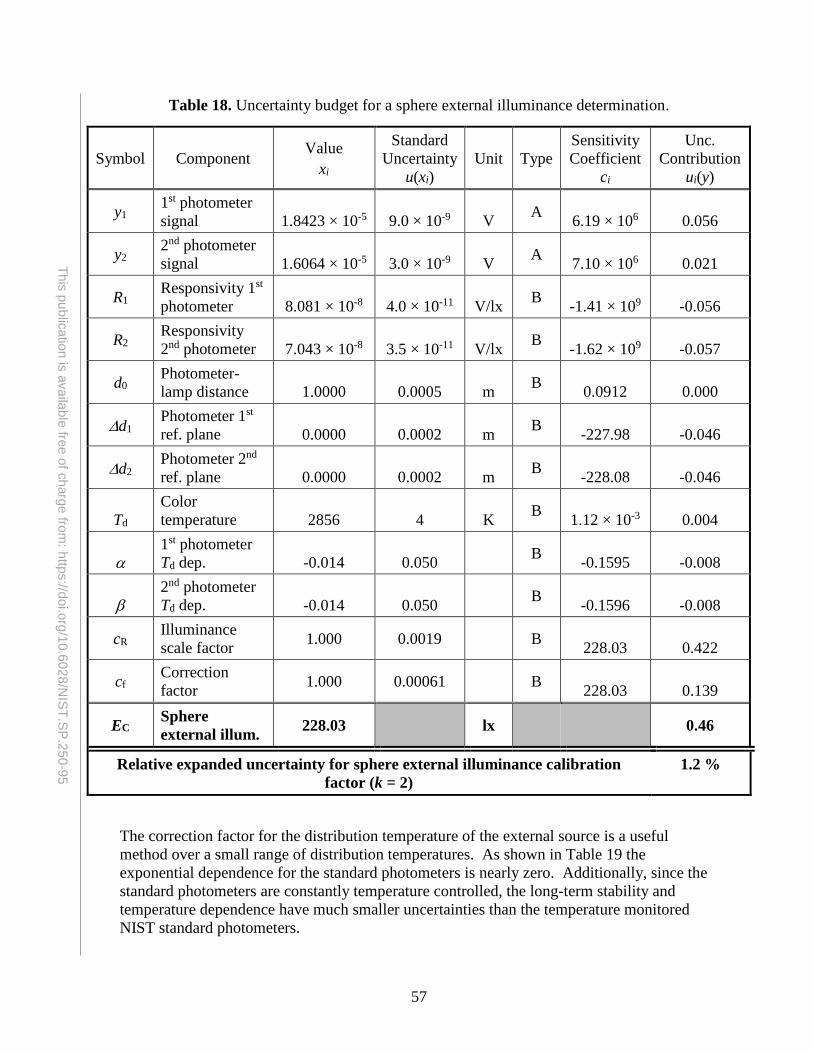
57
This
pu
blic
atio
n is
availa
ble
free o
f charg
e fro
m: h
ttps://d
oi.o
rg/1
0.6
028
/NIS
T.S
P.2
50-9
5
Table 18. Uncertainty budget for a sphere external illuminance determination.
Symbol Component Value
xi
Standard
Uncertainty
u(xi)
Unit Type
Sensitivity
Coefficient
ci
Unc.
Contribution
ui(y)
y1 1st photometer
signal 1.8423 × 10⁻⁵ 9.0 × 10⁻⁹ V A
6.19 × 10⁶ 0.056
y2 2nd photometer
signal 1.6064 × 10⁻⁵ 3.0 × 10⁻⁹ V A
7.10 × 10⁶ 0.021
R1 Responsivity 1st
photometer 8.081 × 10⁻⁸ 4.0 × 10⁻¹¹ V/lx B
-1.41 × 10⁹ -0.056
R2 Responsivity
2nd photometer 7.043 × 10⁻⁸ 3.5 × 10⁻¹¹ V/lx B
-1.62 × 10⁹ -0.057
d0 Photometer-
lamp distance 1.0000 0.0005 m B
0.0912 0.000
d1 Photometer 1st
ref. plane 0.0000 0.0002 m B
-227.98 -0.046
d2 Photometer 2nd
ref. plane 0.0000 0.0002 m B
-228.08 -0.046
Td
Color
temperature 2856 4 K B
1.12 × 10⁻³ 0.004
1st photometer
Td dep. -0.014 0.050 B
-0.1595 -0.008
2nd photometer
Td dep. -0.014 0.050 B
-0.1596 -0.008
cR Illuminance
scale factor 1.000 0.0019 B
228.03 0.422
cf Correction
factor 1.000 0.00061 B
228.03 0.139
EC Sphere
external illum. 228.03 lx 0.46
Relative expanded uncertainty for sphere external illuminance calibration
factor (k = 2)
1.2 %
The correction factor for the distribution temperature of the external source is a useful
method over a small range of distribution temperatures. As shown in Table 19 the
exponential dependence for the standard photometers is nearly zero. Additionally, since the
standard photometers are constantly temperature controlled, the long-term stability and
temperature dependence have much smaller uncertainties than the temperature monitored
NIST standard photometers.
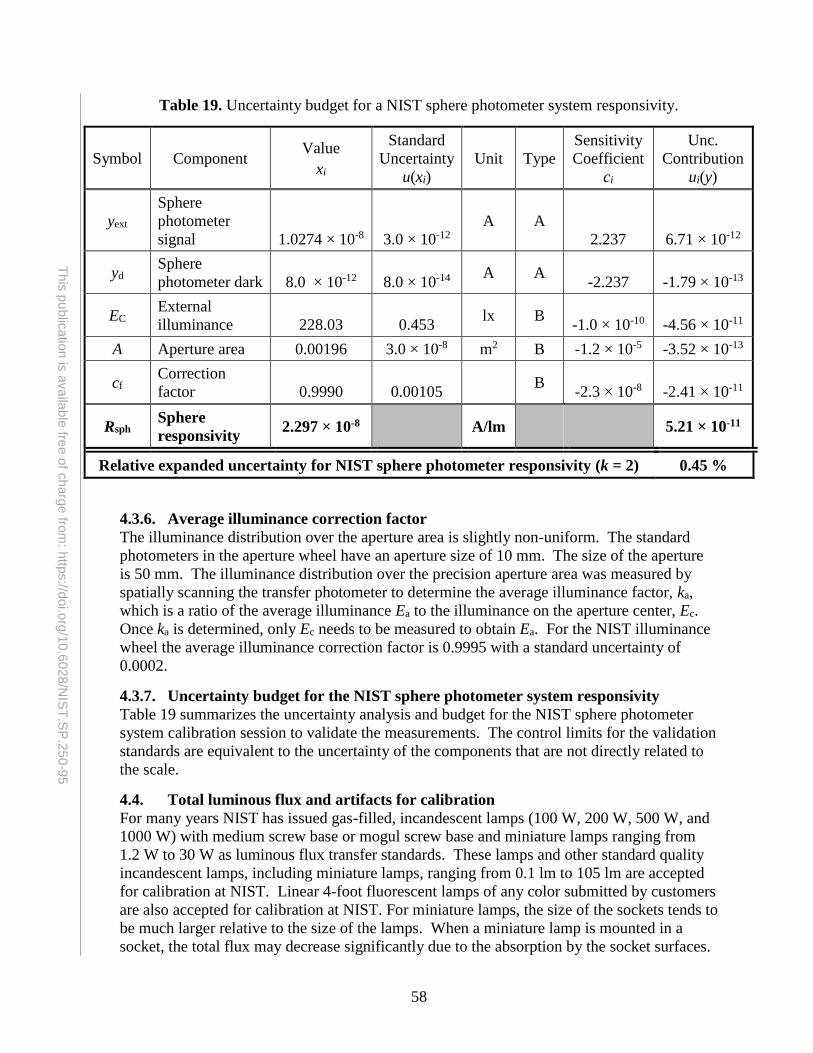
58
This
pu
blic
atio
n is
availa
ble
free o
f charg
e fro
m: h
ttps://d
oi.o
rg/1
0.6
028
/NIS
T.S
P.2
50-9
5
Table 19. Uncertainty budget for a NIST sphere photometer system responsivity.
Symbol Component Value
xi
Standard
Uncertainty
u(xi)
Unit Type
Sensitivity
Coefficient
ci
Unc.
Contribution
ui(y)
yext
Sphere
photometer
signal 1.0274 × 10⁻⁸ 3.0 × 10⁻¹²
A A
2.237 6.71 × 10⁻¹²
yd Sphere
photometer dark 8.0 × 10⁻¹² 8.0 × 10⁻¹⁴ A A
-2.237 -1.79 × 10⁻¹³
EC External
illuminance 228.03 0.453 lx B
-1.0 × 10⁻¹⁰ -4.56 × 10⁻¹¹
A Aperture area 0.00196 3.0 × 10⁻⁸ m2 B -1.2 × 10⁻⁵ -3.52 × 10⁻¹³
cf Correction
factor 0.9990 0.00105 B
-2.3 × 10⁻⁸ -2.41 × 10⁻¹¹
Rsph Sphere
responsivity 2.297 × 10⁻⁸ A/lm 5.21 × 10⁻¹¹
Relative expanded uncertainty for NIST sphere photometer responsivity (k = 2) 0.45 %
4.3.6. Average illuminance correction factor
The illuminance distribution over the aperture area is slightly non-uniform. The standard
photometers in the aperture wheel have an aperture size of 10 mm. The size of the aperture
is 50 mm. The illuminance distribution over the precision aperture area was measured by
spatially scanning the transfer photometer to determine the average illuminance factor, ka,
which is a ratio of the average illuminance Ea to the illuminance on the aperture center, Ec.
Once ka is determined, only Ec needs to be measured to obtain Ea. For the NIST illuminance
wheel the average illuminance correction factor is 0.9995 with a standard uncertainty of
0.0002.
4.3.7. Uncertainty budget for the NIST sphere photometer system responsivity
Table 19 summarizes the uncertainty analysis and budget for the NIST sphere photometer
system calibration session to validate the measurements. The control limits for the validation
standards are equivalent to the uncertainty of the components that are not directly related to
the scale.
4.4. Total luminous flux and artifacts for calibration
For many years NIST has issued gas-filled, incandescent lamps (100 W, 200 W, 500 W, and
1000 W) with medium screw base or mogul screw base and miniature lamps ranging from
1.2 W to 30 W as luminous flux transfer standards. These lamps and other standard quality
incandescent lamps, including miniature lamps, ranging from 0.1 lm to 105 lm are accepted
for calibration at NIST. Linear 4-foot fluorescent lamps of any color submitted by customers
are also accepted for calibration at NIST. For miniature lamps, the size of the sockets tends to
be much larger relative to the size of the lamps. When a miniature lamp is mounted in a
socket, the total flux may decrease significantly due to the absorption by the socket surfaces.
59
This
pu
blic
atio
n is
availa
ble
free o
f charg
e fro
m: h
ttps://d
oi.o
rg/1
0.6
028
/NIS
T.S
P.2
50-9
5
Sometimes miniature lamps are calibrated in combination with a particular socket, and in
such cases, a combination of lamp and socket is required as a calibration artifact.
At the moment, NIST does not provide luminous flux standard lamps due to unavailability of
standard quality lamps, although a search for commercially available lamps for this purpose
is underway. When lamps are submitted to NIST for calibration, the lamps must be seasoned
and tested for stability by the customer. Procedures for the seasoning of lamps are described
in LM-54 [57]. The operating current, or operating color temperature, and burning position
must be specified by the customer.
As with other standard lamps, care must be shown in the handling of luminous flux lamps.
Lamps should be handled very carefully to avoid mechanical shocks to the filament, and the
bulb of the lamps should not be touched with bare hands. Before calibration, the bulb of the
lamps should be cleaned with a soft, lint-free cloth to remove any dust from the packing
material. Lamps should be kept in a container when not used.
The model equations and operation specifics for three types of lamps NIST calibrates,
approximately isotropic incandescent lamps, linear fluorescent tubes and reflector lamps are
presented in the following sections.
4.4.1. Incandescent lamps – Typical budget
All incandescent lamps are operated at a specified current rather than a specified voltage
because the lamp voltage, in general, does not reproduce well due to the construction of the
sockets used among customers. However, lamp voltages reproduce fairly well on the same
socket, and the lamp voltage is a useful indicator of changes in the lamps.
The NIST absolute integrating sphere can be equipped with a medium screw base socket,
mogul screw base socket, medium bi-post base socket, or a special small socket (top surface
is 3 mm in diameter) for miniature lamps with leads. These are four-pole sockets, which
have four separate wires, two for the current supply and the other two for voltage
measurements. For total luminous flux calibration, the lamp voltage is reported, only for
reference purposes, without an uncertainty value.
A DC constant-current power supply is used to operate standard lamps and test lamps. The
lamp current is measured as the voltage across a reference current shunt (0.1 Ω), using a
6-1/2 digit voltmeter with a stated uncertainty better than 0.01 %. The current shunt is
periodically calibrated with an uncertainty of 0.005 %. The lamp current is automatically
controlled by a computer feedback system to keep the current drift within ± 0.002 %. The
power supply is operated in an external control mode, in which the output current is regulated
by an external reference voltage. The external voltage is supplied by two 12 bit D-to-A
converters (giving 23 bits of resolution), which is controlled by the computer.
Incandescent lamps are operated in the sphere center with the base up position unless
otherwise stated. The lamps are operated at the lamp current or at the color temperature
specified by the customer. When the color temperature is specified, the lamp current is first
determined by color temperature measurements as described in Section 6. When the lamp
current is specified, the color temperature of the lamp is measured and reported together with
the luminous flux value. The lamps are allowed to stabilize, usually for 10 min. The color
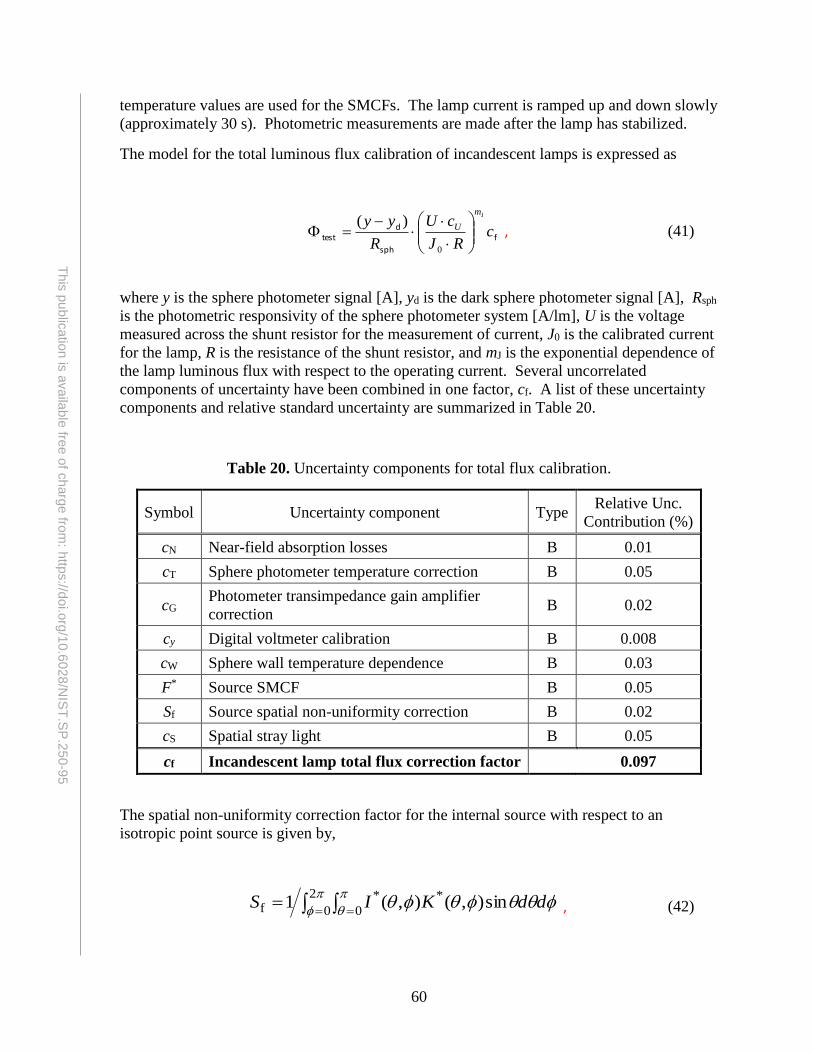
60
This
pu
blic
atio
n is
availa
ble
free o
f charg
e fro
m: h
ttps://d
oi.o
rg/1
0.6
028
/NIS
T.S
P.2
50-9
5
temperature values are used for the SMCFs. The lamp current is ramped up and down slowly
(approximately 30 s). Photometric measurements are made after the lamp has stabilized.
The model for the total luminous flux calibration of incandescent lamps is expressed as
f
sph
dtest
J
cRJ
cU
R
yym
U
0
)( , (41)
where y is the sphere photometer signal [A], yd is the dark sphere photometer signal [A], Rsph
is the photometric responsivity of the sphere photometer system [A/lm], U is the voltage
measured across the shunt resistor for the measurement of current, J0 is the calibrated current
for the lamp, R is the resistance of the shunt resistor, and mJ is the exponential dependence of
the lamp luminous flux with respect to the operating current. Several uncorrelated
components of uncertainty have been combined in one factor, cf. A list of these uncertainty
components and relative standard uncertainty are summarized in Table 20.
Table 20. Uncertainty components for total flux calibration.
Symbol Uncertainty component Type Relative Unc.
Contribution (%)
cN Near-field absorption losses B 0.01
cT Sphere photometer temperature correction B 0.05
cG Photometer transimpedance gain amplifier
correction B 0.02
cy Digital voltmeter calibration B 0.008
cW Sphere wall temperature dependence B 0.03
F* Source SMCF B 0.05
Sf Source spatial non-uniformity correction B 0.02
cS Spatial stray light B 0.05
cf Incandescent lamp total flux correction factor 0.097
The spatial non-uniformity correction factor for the internal source with respect to an
isotropic point source is given by,
2
0 0
**f sin),(),(1 ddKIS , (42)
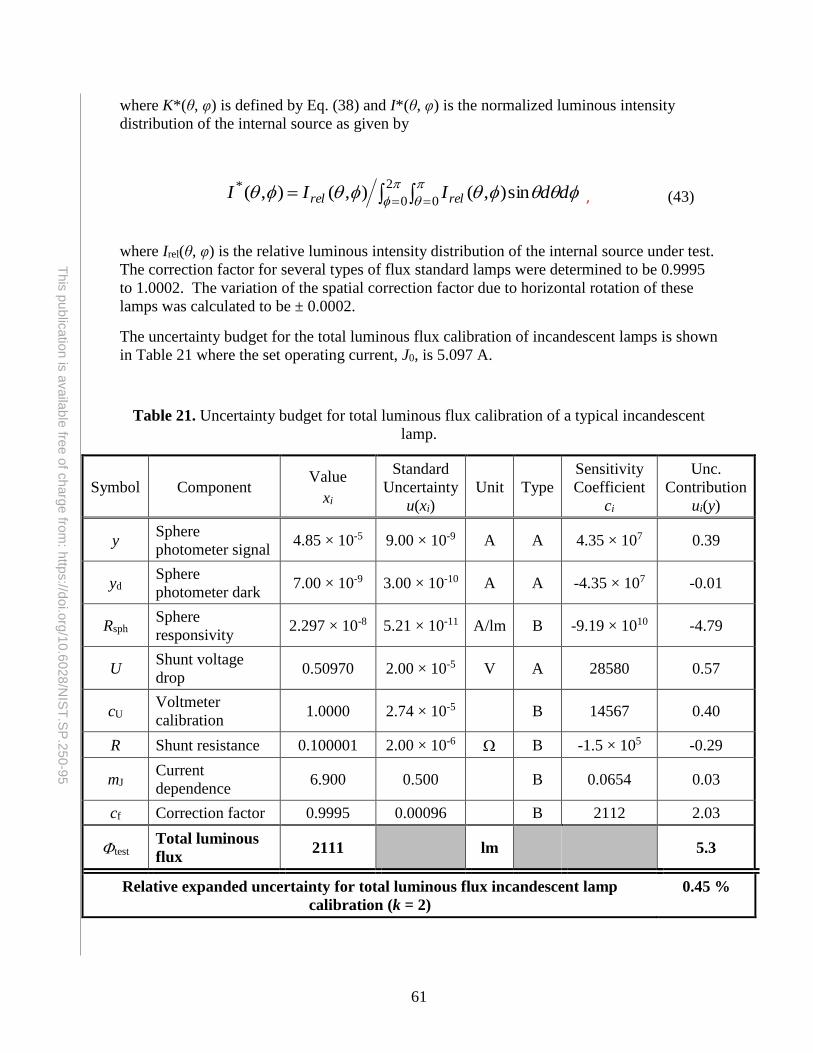
61
This
pu
blic
atio
n is
availa
ble
free o
f charg
e fro
m: h
ttps://d
oi.o
rg/1
0.6
028
/NIS
T.S
P.2
50-9
5
where K*(θ, φ) is defined by Eq. (38) and I*(θ, φ) is the normalized luminous intensity
distribution of the internal source as given by
2
0 0
* sin),(),(),( ddIII relrel , (43)
where Irel(θ, φ) is the relative luminous intensity distribution of the internal source under test.
The correction factor for several types of flux standard lamps were determined to be 0.9995
to 1.0002. The variation of the spatial correction factor due to horizontal rotation of these
lamps was calculated to be ± 0.0002.
The uncertainty budget for the total luminous flux calibration of incandescent lamps is shown
in Table 21 where the set operating current, J0, is 5.097 A.
Table 21. Uncertainty budget for total luminous flux calibration of a typical incandescent
lamp.
Symbol Component Value
xi
Standard
Uncertainty
u(xi)
Unit Type
Sensitivity
Coefficient
ci
Unc.
Contribution
ui(y)
y Sphere
photometer signal 4.85 × 10⁻⁵ 9.00 × 10⁻⁹ A A 4.35 × 10⁷ 0.39
yd Sphere
photometer dark 7.00 × 10⁻⁹ 3.00 × 10⁻¹⁰ A A -4.35 × 10⁷ -0.01
Rsph Sphere
responsivity 2.297 × 10⁻⁸ 5.21 × 10⁻¹¹ A/lm B -9.19 × 10¹⁰ -4.79
U Shunt voltage
drop 0.50970 2.00 × 10⁻⁵ V A 28580 0.57
cU Voltmeter
calibration 1.0000 2.74 × 10⁻⁵ B 14567 0.40
R Shunt resistance 0.100001 2.00 × 10⁻⁶ B -1.5 × 10⁵ -0.29
mJ Current
dependence 6.900 0.500 B 0.0654 0.03
cf Correction factor 0.9995 0.00096 B 2112 2.03
test Total luminous
flux 2111 lm 5.3
Relative expanded uncertainty for total luminous flux incandescent lamp
calibration (k = 2)
0.45 %
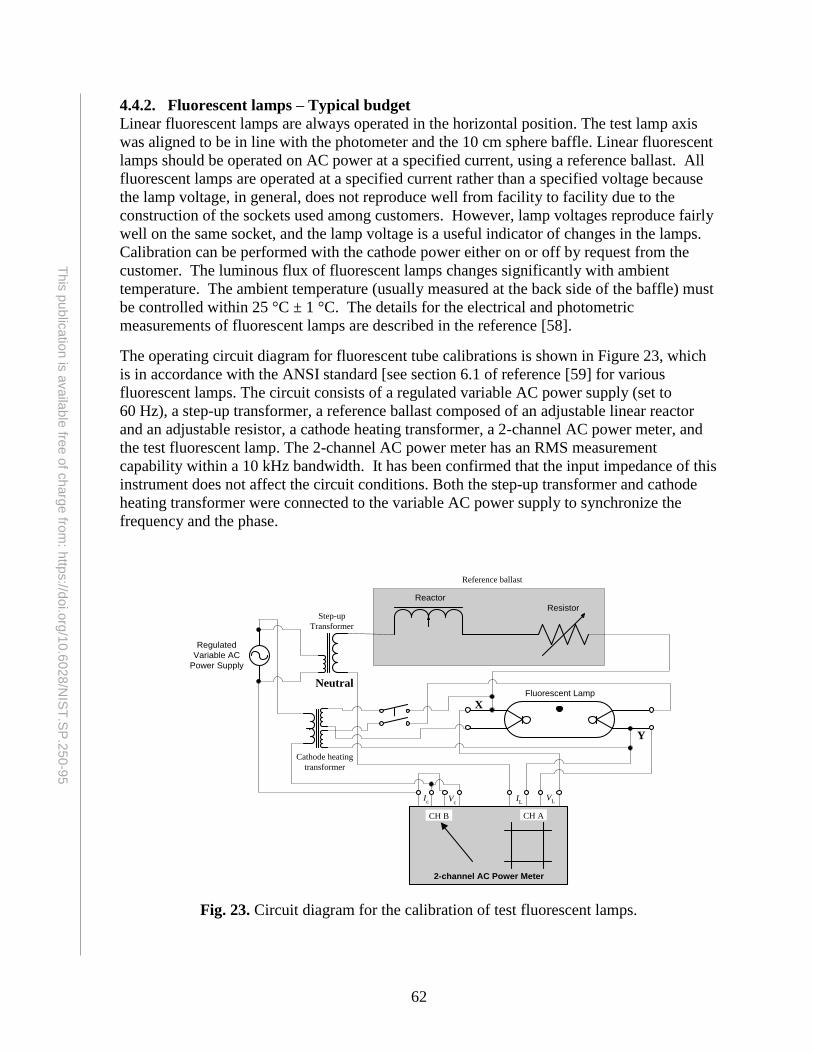
62
This
pu
blic
atio
n is
availa
ble
free o
f charg
e fro
m: h
ttps://d
oi.o
rg/1
0.6
028
/NIS
T.S
P.2
50-9
5
4.4.2. Fluorescent lamps – Typical budget
Linear fluorescent lamps are always operated in the horizontal position. The test lamp axis
was aligned to be in line with the photometer and the 10 cm sphere baffle. Linear fluorescent
lamps should be operated on AC power at a specified current, using a reference ballast. All
fluorescent lamps are operated at a specified current rather than a specified voltage because
the lamp voltage, in general, does not reproduce well from facility to facility due to the
construction of the sockets used among customers. However, lamp voltages reproduce fairly
well on the same socket, and the lamp voltage is a useful indicator of changes in the lamps.
Calibration can be performed with the cathode power either on or off by request from the
customer. The luminous flux of fluorescent lamps changes significantly with ambient
temperature. The ambient temperature (usually measured at the back side of the baffle) must
be controlled within 25 °C ± 1 °C. The details for the electrical and photometric
measurements of fluorescent lamps are described in the reference [58].
The operating circuit diagram for fluorescent tube calibrations is shown in Figure 23, which
is in accordance with the ANSI standard [see section 6.1 of reference [59] for various
fluorescent lamps. The circuit consists of a regulated variable AC power supply (set to
60 Hz), a step-up transformer, a reference ballast composed of an adjustable linear reactor
and an adjustable resistor, a cathode heating transformer, a 2-channel AC power meter, and
the test fluorescent lamp. The 2-channel AC power meter has an RMS measurement
capability within a 10 kHz bandwidth. It has been confirmed that the input impedance of this
instrument does not affect the circuit conditions. Both the step-up transformer and cathode
heating transformer were connected to the variable AC power supply to synchronize the
frequency and the phase.
Fig. 23. Circuit diagram for the calibration of test fluorescent lamps.
Fluorescent Lamp
Reactor
Resistor
Regulated
Variable AC
Power Supply
Step-up
Transformer
Neutral
2-channel AC Power Meter
Ic V
c
CH ACH B
VLI
L
X
Y
Cathode heating
transformer
Reference ballast
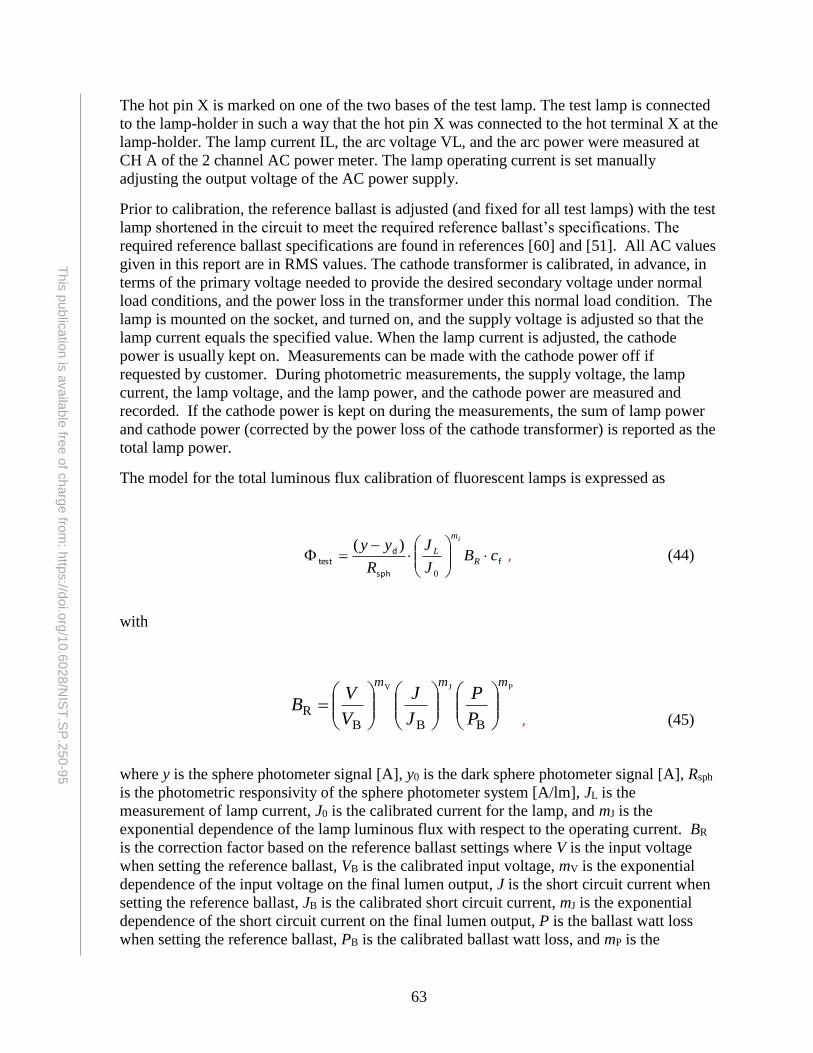
63
This
pu
blic
atio
n is
availa
ble
free o
f charg
e fro
m: h
ttps://d
oi.o
rg/1
0.6
028
/NIS
T.S
P.2
50-9
5
The hot pin X is marked on one of the two bases of the test lamp. The test lamp is connected
to the lamp-holder in such a way that the hot pin X was connected to the hot terminal X at the
lamp-holder. The lamp current IL, the arc voltage VL, and the arc power were measured at
CH A of the 2 channel AC power meter. The lamp operating current is set manually
adjusting the output voltage of the AC power supply.
Prior to calibration, the reference ballast is adjusted (and fixed for all test lamps) with the test
lamp shortened in the circuit to meet the required reference ballast’s specifications. The
required reference ballast specifications are found in references [60] and [51]. All AC values
given in this report are in RMS values. The cathode transformer is calibrated, in advance, in
terms of the primary voltage needed to provide the desired secondary voltage under normal
load conditions, and the power loss in the transformer under this normal load condition. The
lamp is mounted on the socket, and turned on, and the supply voltage is adjusted so that the
lamp current equals the specified value. When the lamp current is adjusted, the cathode
power is usually kept on. Measurements can be made with the cathode power off if
requested by customer. During photometric measurements, the supply voltage, the lamp
current, the lamp voltage, and the lamp power, and the cathode power are measured and
recorded. If the cathode power is kept on during the measurements, the sum of lamp power
and cathode power (corrected by the power loss of the cathode transformer) is reported as the
total lamp power.
The model for the total luminous flux calibration of fluorescent lamps is expressed as
f
sph
dtest
J
cBJ
J
R
yyR
m
L
0
)( , (44)
with
PJV
BBBR
mmm
P
P
J
J
V
VB
, (45)
where y is the sphere photometer signal [A], y0 is the dark sphere photometer signal [A], Rsph
is the photometric responsivity of the sphere photometer system [A/lm], JL is the
measurement of lamp current, J0 is the calibrated current for the lamp, and mJ is the
exponential dependence of the lamp luminous flux with respect to the operating current. BR
is the correction factor based on the reference ballast settings where V is the input voltage
when setting the reference ballast, VB is the calibrated input voltage, mV is the exponential
dependence of the input voltage on the final lumen output, J is the short circuit current when
setting the reference ballast, JB is the calibrated short circuit current, mJ is the exponential
dependence of the short circuit current on the final lumen output, P is the ballast watt loss
when setting the reference ballast, PB is the calibrated ballast watt loss, and mP is the
64
This
pu
blic
atio
n is
availa
ble
free o
f charg
e fro
m: h
ttps://d
oi.o
rg/1
0.6
028
/NIS
T.S
P.2
50-9
5
exponential dependence of the ballast watt loss on the final lumen output. Several
uncorrelated components of uncertainty have been combined in one factor, cf. A list of these
uncertainty components and relative standard uncertainty are summarized in Table 22.
Table 22. Uncertainty components for total flux calibration.
Symbol Uncertainty component Type Relative Unc.
Contribution (%)
cL Lamp ambient temperature correction B 0.40
cN Near-field absorption losses B 0.10
cT Sphere photometer temperature correction B 0.05
cG Photometer transimpedance gain amplifier correction B 0.02
cy Digital voltmeter calibration B 0.008
cW Sphere wall temperature dependence B 0.03
F* Source SMCF B 0.15
Sf Source spatial non-uniformity correction B 0.12
cS Spatial stray light B 0.05
cf Fluorescent lamp total flux correction factor 0.462
The performance characteristics of a fluorescent lamp including light output are strongly
influenced by the mercury vapor pressure inside the lamp. The mercury vapor pressure is
determined by the coolest part of the fluorescent lamp glass [62]. The ambient temperature
determines the temperature of the fluorescent lamp glass. Generally all fluorescent lamps
follow the same temperature curve, because the output is based on mercury vapor pressure
which is dependent on temperature. Lamps with mercury amalgams follow a different curve.
An amalgam is a mercury alloy that determines the mercury pressure by absorbing or
releasing mercury as a function of temperature. The amalgam reduces the dependence of the
ambient temperature over a wide range. Figure 24 shows a typical normalized linear
fluorescent tube light output with respect to the ambient temperature for lamps without
amalgam. The equation in Figure 24 is the light output dependence on ambient temperature.
The standard uncertainty of the sphere ambient temperature, TA, which is measured on the
photometer side of the baffle, is 1.0 °C. Since there are thermal gradients in the sphere, the
measured ambient temperature only correlates to the ambient temperature directly in contact
with the lamp glass. To account for this uncertainty in the correlation, the standard
uncertainty for the correction factor TL is the determined by multiplying the uncertainty in TA
by 3 and then multiply by the derivative of the equation evaluated at TA.
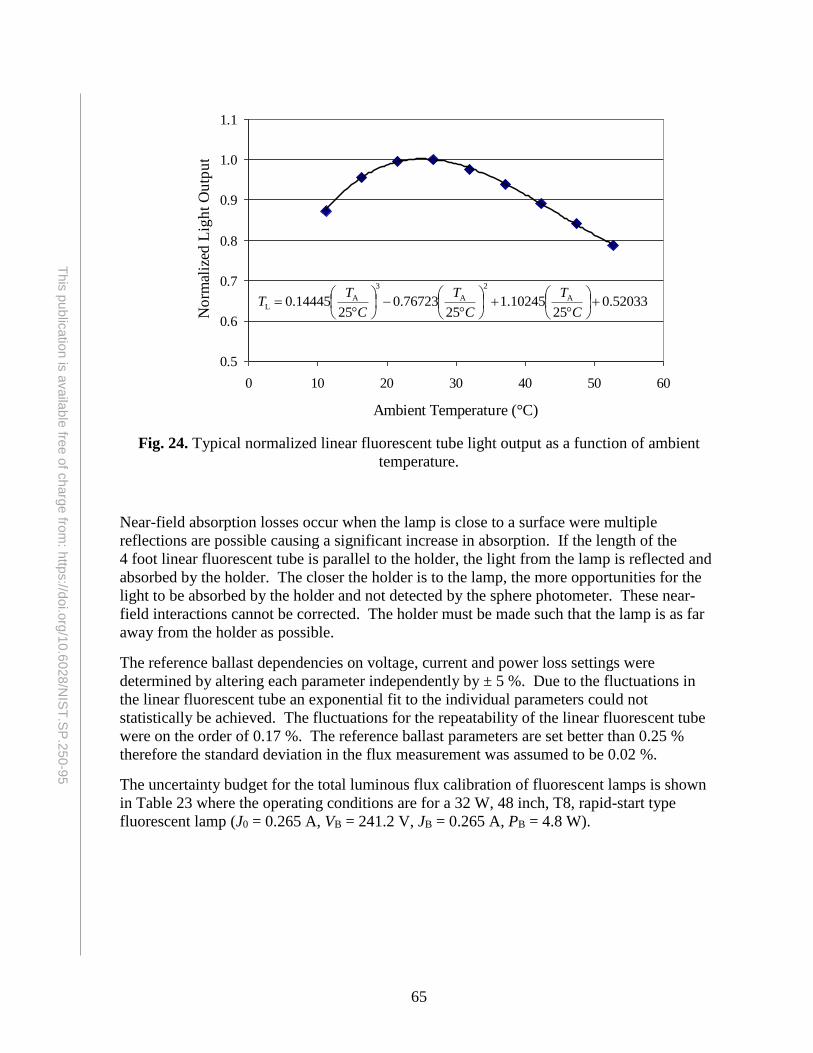
65
This
pu
blic
atio
n is
availa
ble
free o
f charg
e fro
m: h
ttps://d
oi.o
rg/1
0.6
028
/NIS
T.S
P.2
50-9
5
Fig. 24. Typical normalized linear fluorescent tube light output as a function of ambient
temperature.
Near-field absorption losses occur when the lamp is close to a surface were multiple
reflections are possible causing a significant increase in absorption. If the length of the
4 foot linear fluorescent tube is parallel to the holder, the light from the lamp is reflected and
absorbed by the holder. The closer the holder is to the lamp, the more opportunities for the
light to be absorbed by the holder and not detected by the sphere photometer. These near-
field interactions cannot be corrected. The holder must be made such that the lamp is as far
away from the holder as possible.
The reference ballast dependencies on voltage, current and power loss settings were
determined by altering each parameter independently by ± 5 %. Due to the fluctuations in
the linear fluorescent tube an exponential fit to the individual parameters could not
statistically be achieved. The fluctuations for the repeatability of the linear fluorescent tube
were on the order of 0.17 %. The reference ballast parameters are set better than 0.25 %
therefore the standard deviation in the flux measurement was assumed to be 0.02 %.
The uncertainty budget for the total luminous flux calibration of fluorescent lamps is shown
in Table 23 where the operating conditions are for a 32 W, 48 inch, T8, rapid-start type
fluorescent lamp (J0 = 0.265 A, VB = 241.2 V, JB = 0.265 A, PB = 4.8 W).
0.5
0.6
0.7
0.8
0.9
1.0
1.1
0 10 20 30 40 50 60
Ambient Temperature (°C)
No
rmal
ized
Lig
ht
Ou
tpu
t
52033.025
10245.125
76723.025
14445.0 A
2
A
3
AL
C
T
C
T
C
TT
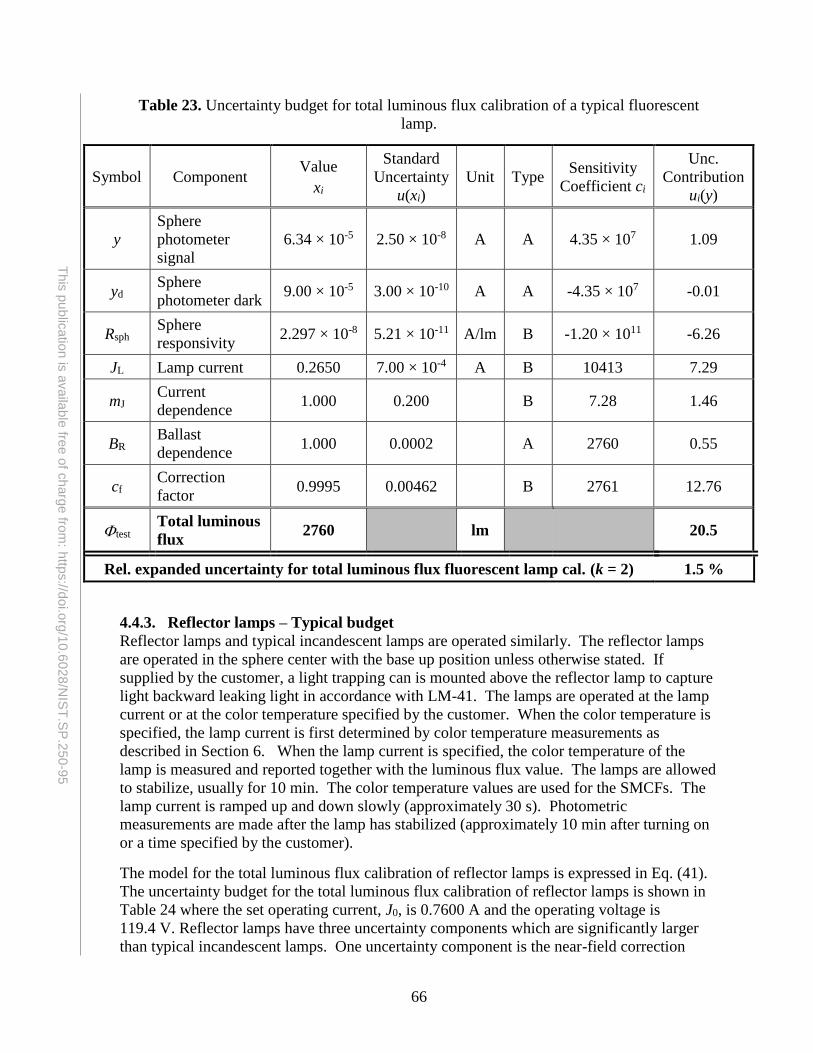
66
This
pu
blic
atio
n is
availa
ble
free o
f charg
e fro
m: h
ttps://d
oi.o
rg/1
0.6
028
/NIS
T.S
P.2
50-9
5
Table 23. Uncertainty budget for total luminous flux calibration of a typical fluorescent
lamp.
Symbol Component Value
xi
Standard
Uncertainty
u(xi)
Unit Type Sensitivity
Coefficient ci
Unc.
Contribution
ui(y)
y
Sphere
photometer
signal
6.34 × 10⁻⁵ 2.50 × 10⁻⁸ A A 4.35 × 10⁷ 1.09
yd Sphere
photometer dark 9.00 × 10⁻⁵ 3.00 × 10⁻¹⁰ A A -4.35 × 10⁷ -0.01
Rsph Sphere
responsivity 2.297 × 10⁻⁸ 5.21 × 10⁻¹¹ A/lm B -1.20 × 10¹¹ -6.26
JL Lamp current 0.2650 7.00 × 10⁻⁴ A B 10413 7.29
mJ Current
dependence 1.000 0.200 B 7.28 1.46
BR Ballast
dependence 1.000 0.0002 A 2760 0.55
cf Correction
factor 0.9995 0.00462 B 2761 12.76
test Total luminous
flux 2760 lm 20.5
Rel. expanded uncertainty for total luminous flux fluorescent lamp cal. (k = 2) 1.5 %
4.4.3. Reflector lamps – Typical budget
Reflector lamps and typical incandescent lamps are operated similarly. The reflector lamps
are operated in the sphere center with the base up position unless otherwise stated. If
supplied by the customer, a light trapping can is mounted above the reflector lamp to capture
light backward leaking light in accordance with LM-41. The lamps are operated at the lamp
current or at the color temperature specified by the customer. When the color temperature is
specified, the lamp current is first determined by color temperature measurements as
described in Section 6. When the lamp current is specified, the color temperature of the
lamp is measured and reported together with the luminous flux value. The lamps are allowed
to stabilize, usually for 10 min. The color temperature values are used for the SMCFs. The
lamp current is ramped up and down slowly (approximately 30 s). Photometric
measurements are made after the lamp has stabilized (approximately 10 min after turning on
or a time specified by the customer).
The model for the total luminous flux calibration of reflector lamps is expressed in Eq. (41).
The uncertainty budget for the total luminous flux calibration of reflector lamps is shown in
Table 24 where the set operating current, J0, is 0.7600 A and the operating voltage is
119.4 V. Reflector lamps have three uncertainty components which are significantly larger
than typical incandescent lamps. One uncertainty component is the near-field correction
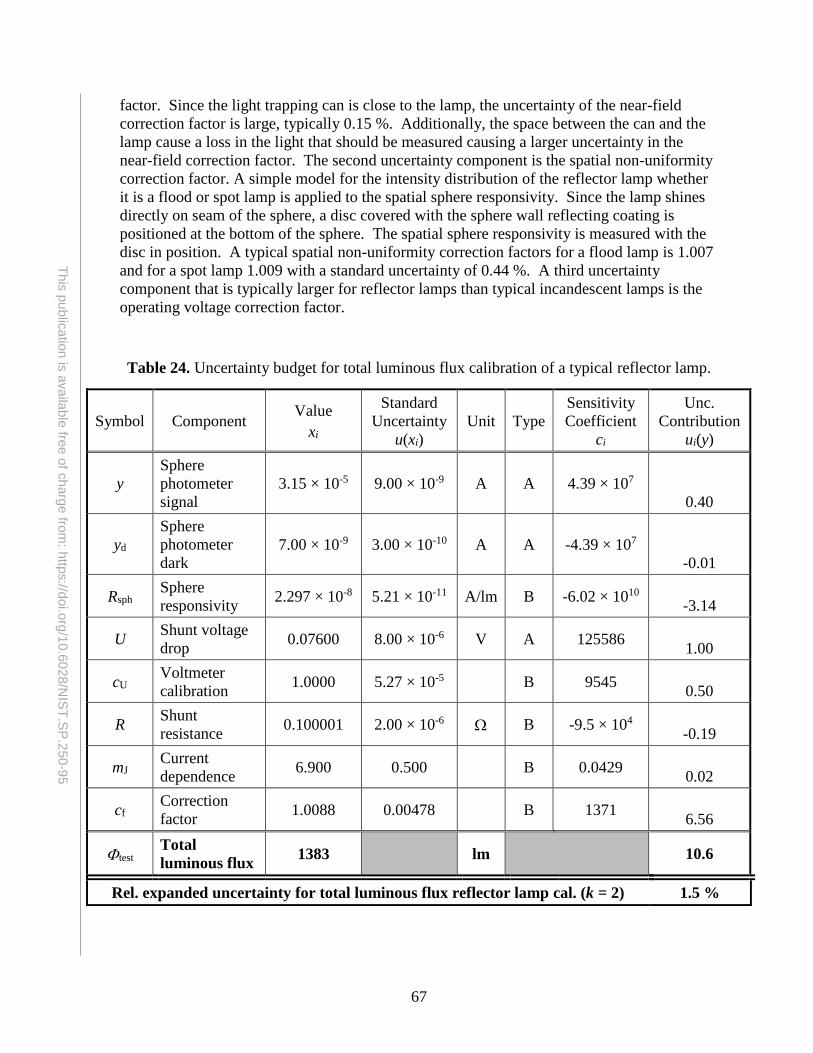
67
This
pu
blic
atio
n is
availa
ble
free o
f charg
e fro
m: h
ttps://d
oi.o
rg/1
0.6
028
/NIS
T.S
P.2
50-9
5
factor. Since the light trapping can is close to the lamp, the uncertainty of the near-field
correction factor is large, typically 0.15 %. Additionally, the space between the can and the
lamp cause a loss in the light that should be measured causing a larger uncertainty in the
near-field correction factor. The second uncertainty component is the spatial non-uniformity
correction factor. A simple model for the intensity distribution of the reflector lamp whether
it is a flood or spot lamp is applied to the spatial sphere responsivity. Since the lamp shines
directly on seam of the sphere, a disc covered with the sphere wall reflecting coating is
positioned at the bottom of the sphere. The spatial sphere responsivity is measured with the
disc in position. A typical spatial non-uniformity correction factors for a flood lamp is 1.007
and for a spot lamp 1.009 with a standard uncertainty of 0.44 %. A third uncertainty
component that is typically larger for reflector lamps than typical incandescent lamps is the
operating voltage correction factor.
Table 24. Uncertainty budget for total luminous flux calibration of a typical reflector lamp.
Symbol Component Value
xi
Standard
Uncertainty
u(xi)
Unit Type
Sensitivity
Coefficient
ci
Unc.
Contribution
ui(y)
y
Sphere
photometer
signal
3.15 × 10⁻⁵ 9.00 × 10⁻⁹ A A 4.39 × 10⁷
0.40
yd
Sphere
photometer
dark
7.00 × 10⁻⁹ 3.00 × 10⁻¹⁰ A A -4.39 × 10⁷
-0.01
Rsph Sphere
responsivity 2.297 × 10⁻⁸ 5.21 × 10⁻¹¹ A/lm B -6.02 × 10¹⁰
-3.14
U Shunt voltage
drop 0.07600 8.00 × 10⁻⁶ V A 125586
1.00
cU Voltmeter
calibration 1.0000 5.27 × 10⁻⁵ B 9545
0.50
R Shunt
resistance 0.100001 2.00 × 10⁻⁶ B -9.5 × 10⁴
-0.19
mJ Current
dependence 6.900 0.500 B 0.0429
0.02
cf Correction
factor 1.0088 0.00478 B 1371
6.56
test Total
luminous flux 1383 lm 10.6
Rel. expanded uncertainty for total luminous flux reflector lamp cal. (k = 2) 1.5 %
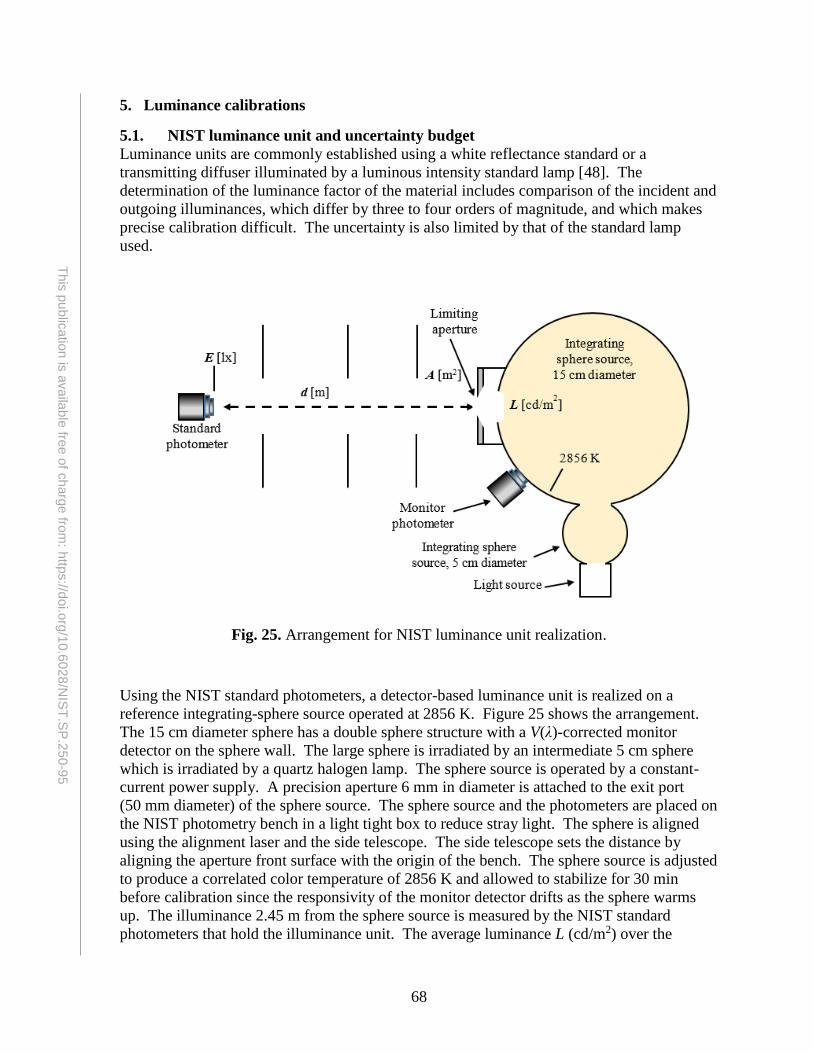
68
This
pu
blic
atio
n is
availa
ble
free o
f charg
e fro
m: h
ttps://d
oi.o
rg/1
0.6
028
/NIS
T.S
P.2
50-9
5
5. Luminance calibrations
5.1. NIST luminance unit and uncertainty budget
Luminance units are commonly established using a white reflectance standard or a
transmitting diffuser illuminated by a luminous intensity standard lamp [48]. The
determination of the luminance factor of the material includes comparison of the incident and
outgoing illuminances, which differ by three to four orders of magnitude, and which makes
precise calibration difficult. The uncertainty is also limited by that of the standard lamp
used.
Fig. 25. Arrangement for NIST luminance unit realization.
Using the NIST standard photometers, a detector-based luminance unit is realized on a
reference integrating-sphere source operated at 2856 K. Figure 25 shows the arrangement.
The 15 cm diameter sphere has a double sphere structure with a V(λ)-corrected monitor
detector on the sphere wall. The large sphere is irradiated by an intermediate 5 cm sphere
which is irradiated by a quartz halogen lamp. The sphere source is operated by a constant-
current power supply. A precision aperture 6 mm in diameter is attached to the exit port
(50 mm diameter) of the sphere source. The sphere source and the photometers are placed on
the NIST photometry bench in a light tight box to reduce stray light. The sphere is aligned
using the alignment laser and the side telescope. The side telescope sets the distance by
aligning the aperture front surface with the origin of the bench. The sphere source is adjusted
to produce a correlated color temperature of 2856 K and allowed to stabilize for 30 min
before calibration since the responsivity of the monitor detector drifts as the sphere warms
up. The illuminance 2.45 m from the sphere source is measured by the NIST standard
photometers that hold the illuminance unit. The average luminance L (cd/m2) over the
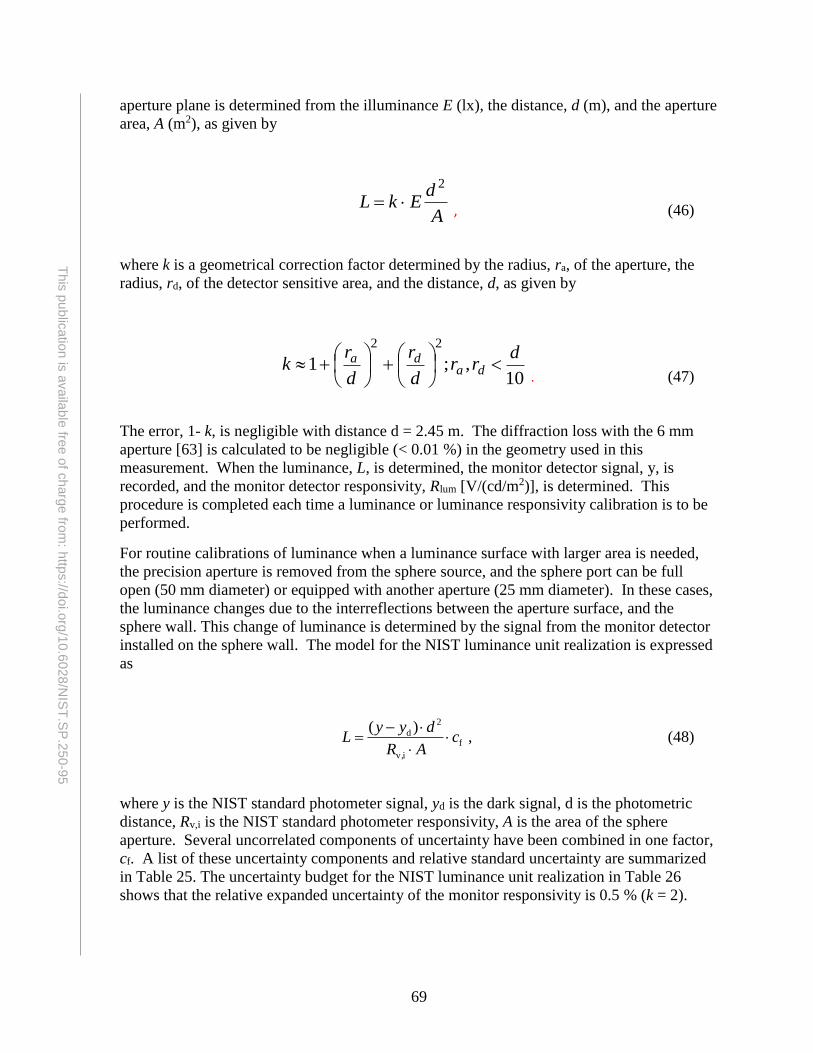
69
This
pu
blic
atio
n is
availa
ble
free o
f charg
e fro
m: h
ttps://d
oi.o
rg/1
0.6
028
/NIS
T.S
P.2
50-9
5
aperture plane is determined from the illuminance E (lx), the distance, d (m), and the aperture
area, A (m2), as given by
A
dEkL
2
, (46)
where k is a geometrical correction factor determined by the radius, ra, of the aperture, the
radius, rd, of the detector sensitive area, and the distance, d, as given by
10,;1
22d
rrd
r
d
rk da
da
. (47)
The error, 1- k, is negligible with distance d = 2.45 m. The diffraction loss with the 6 mm
aperture [63] is calculated to be negligible (< 0.01 %) in the geometry used in this
measurement. When the luminance, L, is determined, the monitor detector signal, y, is
recorded, and the monitor detector responsivity, Rlum [V/(cd/m2)], is determined. This
procedure is completed each time a luminance or luminance responsivity calibration is to be
performed.
For routine calibrations of luminance when a luminance surface with larger area is needed,
the precision aperture is removed from the sphere source, and the sphere port can be full
open (50 mm diameter) or equipped with another aperture (25 mm diameter). In these cases,
the luminance changes due to the interreflections between the aperture surface, and the
sphere wall. This change of luminance is determined by the signal from the monitor detector
installed on the sphere wall. The model for the NIST luminance unit realization is expressed
as
,)(
f
iv,
2
d cAR
dyyL
(48)
where y is the NIST standard photometer signal, yd is the dark signal, d is the photometric
distance, Rv,i is the NIST standard photometer responsivity, A is the area of the sphere
aperture. Several uncorrelated components of uncertainty have been combined in one factor,
cf. A list of these uncertainty components and relative standard uncertainty are summarized
in Table 25. The uncertainty budget for the NIST luminance unit realization in Table 26
shows that the relative expanded uncertainty of the monitor responsivity is 0.5 % (k = 2).
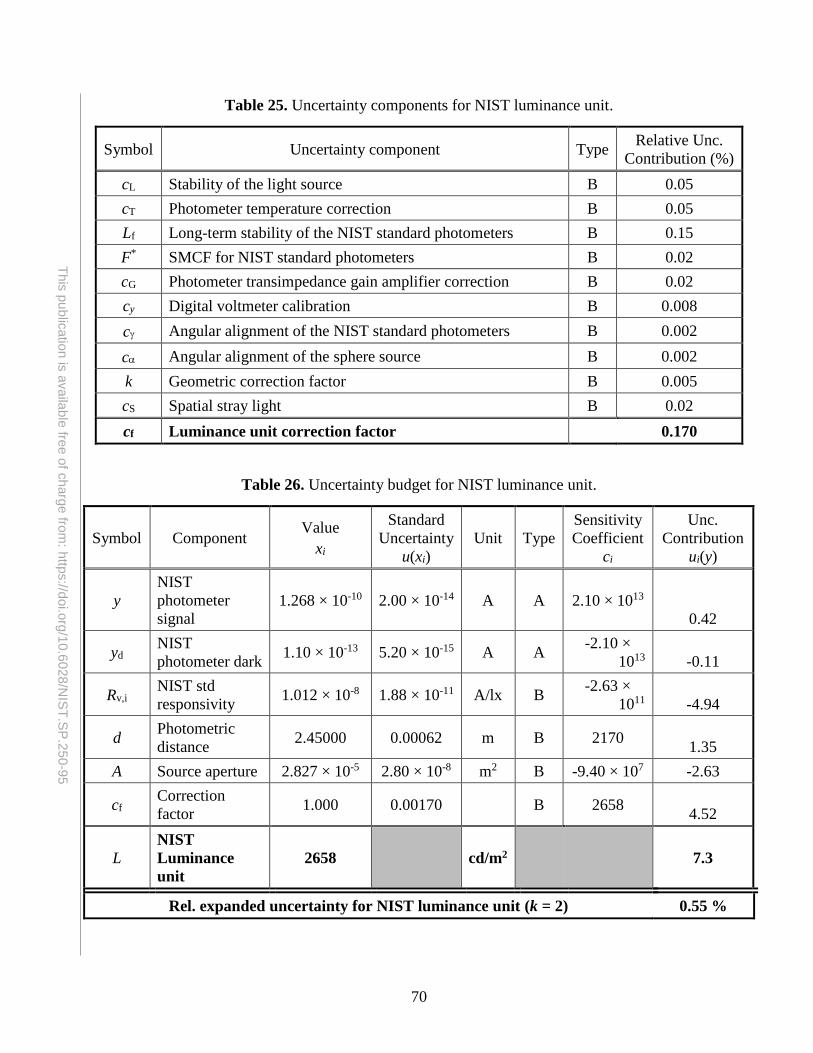
70
This
pu
blic
atio
n is
availa
ble
free o
f charg
e fro
m: h
ttps://d
oi.o
rg/1
0.6
028
/NIS
T.S
P.2
50-9
5
Table 25. Uncertainty components for NIST luminance unit.
Symbol Uncertainty component Type Relative Unc.
Contribution (%)
cL Stability of the light source B 0.05
cT Photometer temperature correction B 0.05
Lf Long-term stability of the NIST standard photometers B 0.15
F* SMCF for NIST standard photometers B 0.02
cG Photometer transimpedance gain amplifier correction B 0.02
cy Digital voltmeter calibration B 0.008
c Angular alignment of the NIST standard photometers B 0.002
c Angular alignment of the sphere source B 0.002
k Geometric correction factor B 0.005
cS Spatial stray light B 0.02
cf Luminance unit correction factor 0.170
Table 26. Uncertainty budget for NIST luminance unit.
Symbol Component Value
xi
Standard
Uncertainty
u(xi)
Unit Type
Sensitivity
Coefficient
ci
Unc.
Contribution
ui(y)
y
NIST
photometer
signal
1.268 × 10⁻¹⁰ 2.00 × 10⁻¹⁴ A A 2.10 × 10¹³
0.42
yd NIST
photometer dark 1.10 × 10⁻¹³ 5.20 × 10⁻¹⁵ A A
-2.10 ×
1013 -0.11
Rv,i NIST std
responsivity 1.012 × 10⁻⁸ 1.88 × 10⁻¹¹ A/lx B
-2.63 ×
1011 -4.94
d Photometric
distance 2.45000 0.00062 m B 2170
1.35
A Source aperture 2.827 × 10⁻⁵ 2.80 × 10⁻⁸ m2 B -9.40 × 10⁷ -2.63
cf Correction
factor 1.000 0.00170 B 2658
4.52
L
NIST
Luminance
unit
2658 cd/m2 7.3
Rel. expanded uncertainty for NIST luminance unit (k = 2) 0.55 %
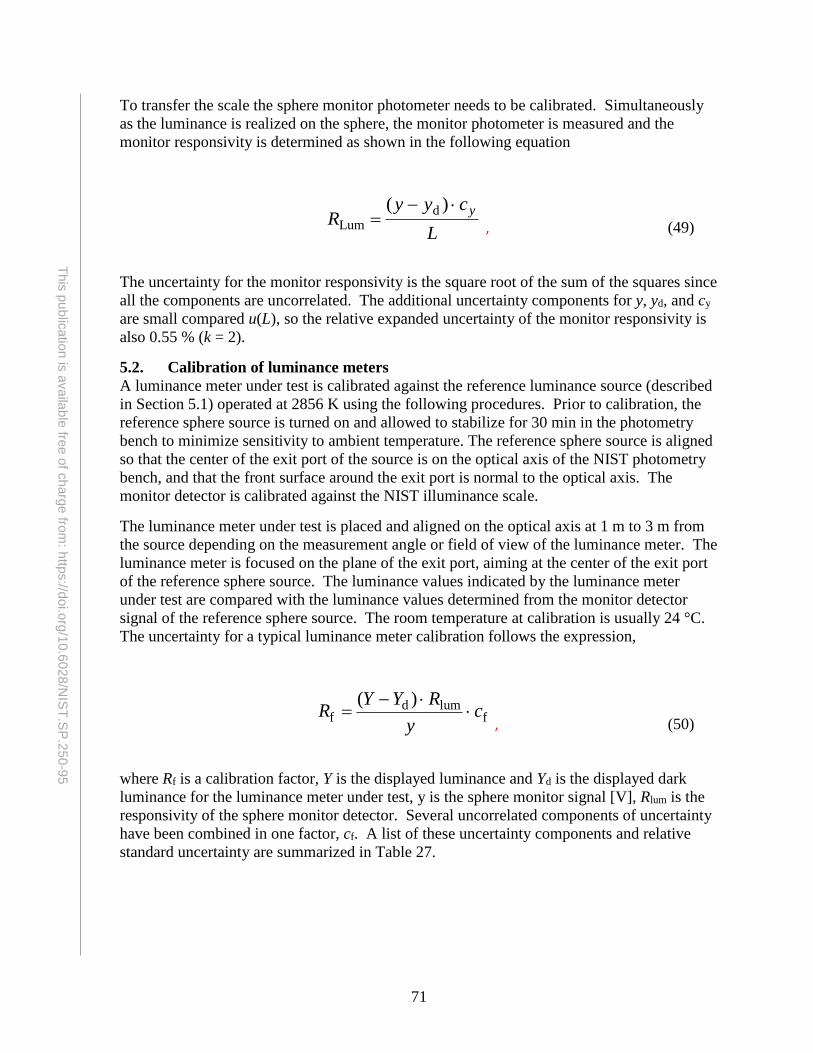
71
This
pu
blic
atio
n is
availa
ble
free o
f charg
e fro
m: h
ttps://d
oi.o
rg/1
0.6
028
/NIS
T.S
P.2
50-9
5
To transfer the scale the sphere monitor photometer needs to be calibrated. Simultaneously
as the luminance is realized on the sphere, the monitor photometer is measured and the
monitor responsivity is determined as shown in the following equation
L
cyyR
y
)( dLum , (49)
The uncertainty for the monitor responsivity is the square root of the sum of the squares since
all the components are uncorrelated. The additional uncertainty components for y, yd, and cy
are small compared u(L), so the relative expanded uncertainty of the monitor responsivity is
also 0.55 % (k = 2).
5.2. Calibration of luminance meters
A luminance meter under test is calibrated against the reference luminance source (described
in Section 5.1) operated at 2856 K using the following procedures. Prior to calibration, the
reference sphere source is turned on and allowed to stabilize for 30 min in the photometry
bench to minimize sensitivity to ambient temperature. The reference sphere source is aligned
so that the center of the exit port of the source is on the optical axis of the NIST photometry
bench, and that the front surface around the exit port is normal to the optical axis. The
monitor detector is calibrated against the NIST illuminance scale.
The luminance meter under test is placed and aligned on the optical axis at 1 m to 3 m from
the source depending on the measurement angle or field of view of the luminance meter. The
luminance meter is focused on the plane of the exit port, aiming at the center of the exit port
of the reference sphere source. The luminance values indicated by the luminance meter
under test are compared with the luminance values determined from the monitor detector
signal of the reference sphere source. The room temperature at calibration is usually 24 °C.
The uncertainty for a typical luminance meter calibration follows the expression,
f
lumdf
)(c
y
RYYR
, (50)
where Rf is a calibration factor, Y is the displayed luminance and Yd is the displayed dark
luminance for the luminance meter under test, y is the sphere monitor signal [V], Rlum is the
responsivity of the sphere monitor detector. Several uncorrelated components of uncertainty
have been combined in one factor, cf. A list of these uncertainty components and relative
standard uncertainty are summarized in Table 27.
72
This
pu
blic
atio
n is
availa
ble
free o
f charg
e fro
m: h
ttps://d
oi.o
rg/1
0.6
028
/NIS
T.S
P.2
50-9
5
Table 27. Uncertainty components for luminance meter calibration.
Symbol Uncertainty component Type Relative Unc.
Contribution (%)
cL Stability of the sphere source B 0.015
cT Sphere monitor temperature dependence B 0.05
cU Luminance uniformity of the sphere source B 0.05
cy Digital voltmeter calibration B 0.008
cS Spatial stray light B 0.05
cf Luminance meter calibration correction factor 0.088
For many luminance meters the uncertainty in the displayed luminance is the display
resolution. The uncertainty budget for the calibration of a typical luminance meter is shown
in Table 28. This budget does not include the uncertainty factor for the out-of-field
sensitivity of the test instrument. If the luminance meter’s out-of-field blocking is poor, the
responsivity of the instrument is affected by the illuminance of the area outside the
measurement angle. Therefore, the calibration value is reported with the measurement
geometry used at the calibration, and may not be valid with other geometries
Table 28. Uncertainty budget for a typical luminance meter calibration.
Symbol Component Value
xi
Standard
Uncertainty
u(xi)
Unit Type
Sensitivity
Coefficient
ci
Unc.
Contribution
ui(y)
Y
Luminance
meter
reading
2335 0.5774 cd/m2 B 0.00043 0.00025
Yd Luminance
meter dark 0 0.5774 cd/m2 B -0.00043 -0.00025
Rlum Monitor
responsivity 2.035 × 10⁻⁴ 5.61 × 10⁻⁷ V/[cd/m2] B 4902 0.00275
y Monitor
signal 0.4763 0.00011 V A -2.095 -0.00023
cf Correction
factor 1.000 0.00088 B 0.9976 0.00088
Rf Calibration
factor 0.9976 0.59 %
Rel. expanded uncertainty for luminance meter calibration (k = 2) 0.59 %
73
This
pu
blic
atio
n is
availa
ble
free o
f charg
e fro
m: h
ttps://d
oi.o
rg/1
0.6
028
/NIS
T.S
P.2
50-9
5
Luminance meters used for particular sources other than incandescent sources can be
calibrated for those specific sources (e.g., color displays) upon request by customers. In this
case, the calibration is first performed using the 2856 K source as described above. Then, the
SMCFs for the sources are obtained using the following procedures.
The relative spectral responsivity of the NIST luminance meter is measured by the SCF [25]
in the 350 nm to 1100 nm region. The monochromator output of the SCF is defocused on a
PTFE (polytetrafluoroethylene) plaque to irradiate an area of several mm in diameter. The
luminance meter under test is placed so that it will measure the luminance of the spot on the
PTFE plaque at 0/45 geometry, and that the irradiated spot underfills the measurement area
of the luminance meter. This method can only be applied for luminance meters whose
relative spectral responsivity is fairly spatially uniform within the measurement angle. From
the relative spectral responsivity data and the spectral power distribution data (supplied by
customer) of the light sources to be measured by the luminance meter, the SMCFs are
calculated. The relative spectral responsivity data and the correction factors are reported to
the customer.
5.3. Calibration of high-luminance meters
Based on the high-illuminance source described in section 3.6, a high-luminance surface can
be created by combining it with a reflecting or transmitting diffuser of a known luminance
coefficient to allow calibration of luminance meters. The calibration of reflecting and
transmitting diffusers for luminance coefficient is described in section 5.6. Two transmitting
diffusers, an acrylic diffuser and an opal glass, were tested along with one reflecting diffuser
constructed from pressed PTFE powder. The transmitting diffusers were arranged with 0°
incidence and 0° viewing geometry. The pressed PTFE plaque was arranged at a 45°
incidence and 45° viewing angle instead of the normal 0/45 due to space limitations. The
high-luminance surfaces where measured with the NIST high-illuminance photometers
equipped with luminance optics with a 1° measurement angle. The acrylic diffuser had a
maximum luminance of 55 kcd/m2, the opal diffuser had a maximum luminance of
45 kcd/m2, and the PTFE diffuser had maximum luminance of 70 kcd/m2 for a Xenon
spectral distribution. For CIE Illuminant A the range is 5000 cd/m2 to 30,000 cd/m2.
The uncertainty analysis for a high-luminance meter calibration follows the model.
f
d
Lv,df
)(
)(c
yy
RYYR
, (51)
where Rv,L is the responsivity of the NIST high-luminance standard photometer which
includes the uncertainty of the transfer of the scale, Y is the displayed luminance and Yd is the
displayed dark luminance for the luminance meter under test, y is the NIST high-luminance
photometer reading and yd is the dark reading. Several uncorrelated components of
uncertainty have been combined in one factor, cf. A list of these uncertainty components and
relative standard uncertainty are summarized in Table 29. Table 30 shows a typical
uncertainty budget for the calibration of a high-luminance meter.
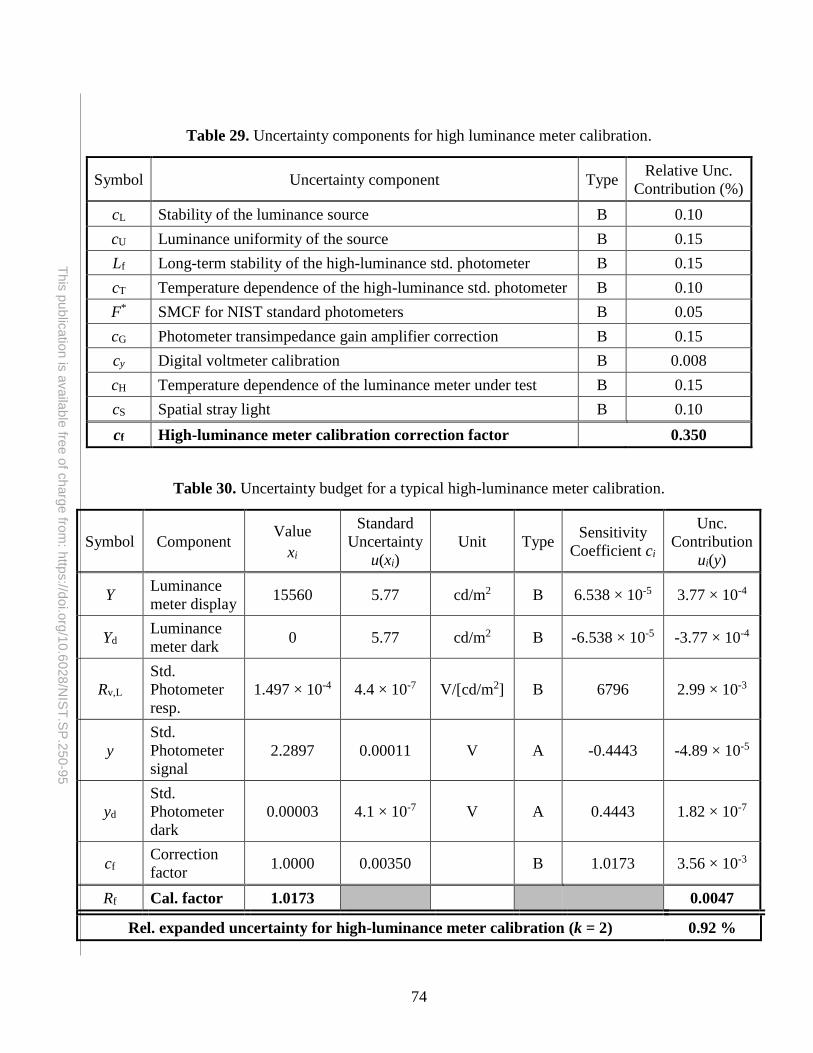
74
This
pu
blic
atio
n is
availa
ble
free o
f charg
e fro
m: h
ttps://d
oi.o
rg/1
0.6
028
/NIS
T.S
P.2
50-9
5
Table 29. Uncertainty components for high luminance meter calibration.
Symbol Uncertainty component Type Relative Unc.
Contribution (%)
cL Stability of the luminance source B 0.10
cU Luminance uniformity of the source B 0.15
Lf Long-term stability of the high-luminance std. photometer B 0.15
cT Temperature dependence of the high-luminance std. photometer B 0.10
F* SMCF for NIST standard photometers B 0.05
cG Photometer transimpedance gain amplifier correction B 0.15
cy Digital voltmeter calibration B 0.008
cH Temperature dependence of the luminance meter under test B 0.15
cS Spatial stray light B 0.10
cf High-luminance meter calibration correction factor 0.350
Table 30. Uncertainty budget for a typical high-luminance meter calibration.
Symbol Component Value
xi
Standard
Uncertainty
u(xi)
Unit Type Sensitivity
Coefficient ci
Unc.
Contribution
ui(y)
Y Luminance
meter display 15560 5.77 cd/m2 B 6.538 × 10⁻⁵ 3.77 × 10⁻⁴
Yd Luminance
meter dark 0 5.77 cd/m2 B -6.538 × 10⁻⁵ -3.77 × 10⁻⁴
Rv,L
Std.
Photometer
resp.
1.497 × 10⁻⁴ 4.4 × 10⁻⁷ V/[cd/m2] B 6796 2.99 × 10⁻³
y
Std.
Photometer
signal
2.2897 0.00011 V A -0.4443 -4.89 × 10⁻⁵
yd
Std.
Photometer
dark
0.00003 4.1 × 10⁻⁷ V A 0.4443 1.82 × 10⁻⁷
cf Correction
factor 1.0000 0.00350 B 1.0173 3.56 × 10⁻³
Rf Cal. factor 1.0173 0.0047
Rel. expanded uncertainty for high-luminance meter calibration (k = 2) 0.92 %
75
This
pu
blic
atio
n is
availa
ble
free o
f charg
e fro
m: h
ttps://d
oi.o
rg/1
0.6
028
/NIS
T.S
P.2
50-9
5
5.4. Calibration of luminance sources
Luminance sources under test are calibrated against the reference sphere source described in
5.1 using the following procedures. The reference sphere source is turned on and stabilized
for 30 min before the scale is realized. A reference luminance meter is calibrated against the
reference sphere source. The reference luminance meter has measurement angles of 6’, 20’,
1°, and 3°. The luminance meter is equipped with a 3 1/2 digit display and an analog output,
the voltage of which is measured with a digital voltmeter. The stray light error (due to the
surrounding field outside the measured area) of this luminance meter was checked according
to the CIE Pub. 69 [48] and found to be less than 0.1 %.
The sphere source under test is aligned so that the center of the exit port of the source is on
the optical axis and so that the front surface around the exit port is normal to the optical axis.
The reference luminance meter is placed on the optical axis at approximately 1.5 m from the
source for a measurement area of 9 mm in diameter, with the measurement angle of the
reference luminance meter to be 0.33 °. The luminance meter is focused on the plane of the
exit port. The test source is turned on and allowed to stabilize for the time period specified by
the customer. The room temperature during the calibration is usually 24 °C. The color
temperature of the source is also measured using the facilities and procedures described in
Section 6.
The uncertainty analysis for a luminance source calibration follows the model,
f
d
Lv,df
)(
)(c
yy
RLLR
, (52)
where Rv,L is the responsivity of the reference luminance photometer which includes the
uncertainty of the transfer of the scale, L is the displayed luminance and Ld is the displayed
dark luminance for the luminance source under test, y is the reference luminance photometer
reading and yd is the dark reading. Several uncorrelated components of uncertainty have
been combined in one factor, cf. A list of these uncertainty components and relative standard
uncertainty are summarized in Table 31. Table 32 shows a typical uncertainty budget for the
calibration of a luminance source.
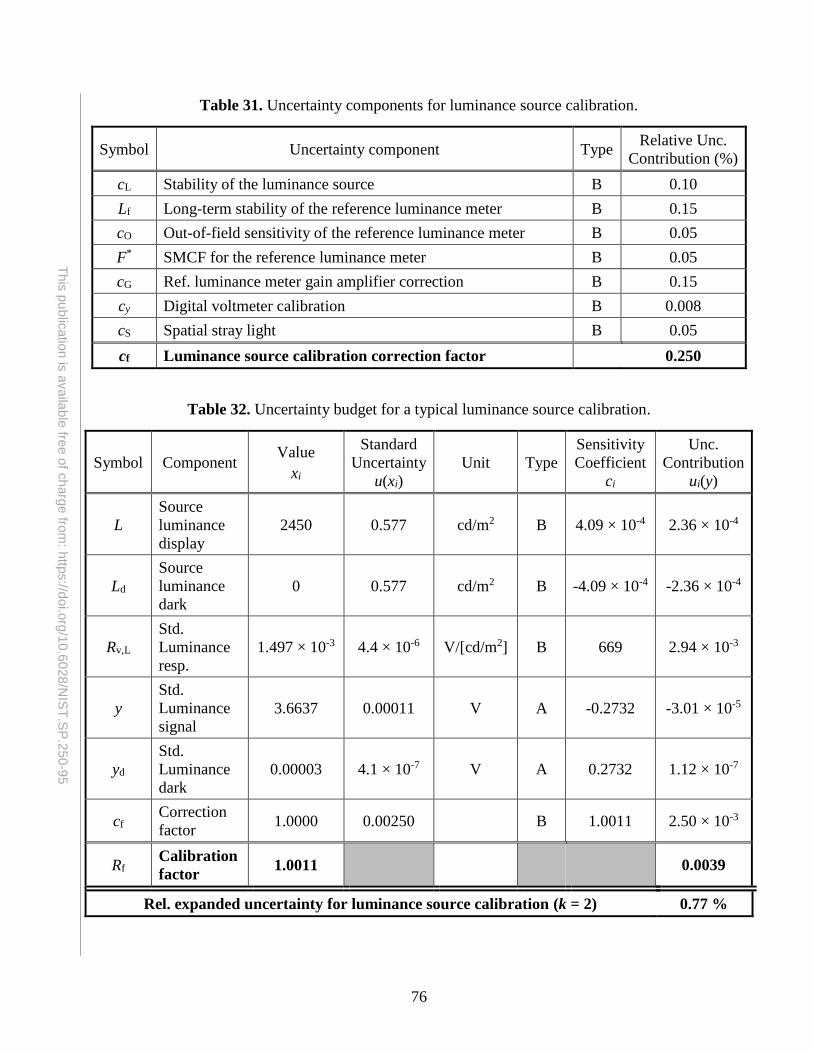
76
This
pu
blic
atio
n is
availa
ble
free o
f charg
e fro
m: h
ttps://d
oi.o
rg/1
0.6
028
/NIS
T.S
P.2
50-9
5
Table 31. Uncertainty components for luminance source calibration.
Symbol Uncertainty component Type Relative Unc.
Contribution (%)
cL Stability of the luminance source B 0.10
Lf Long-term stability of the reference luminance meter B 0.15
cO Out-of-field sensitivity of the reference luminance meter B 0.05
F* SMCF for the reference luminance meter B 0.05
cG Ref. luminance meter gain amplifier correction B 0.15
cy Digital voltmeter calibration B 0.008
cS Spatial stray light B 0.05
cf Luminance source calibration correction factor 0.250
Table 32. Uncertainty budget for a typical luminance source calibration.
Symbol Component Value
xi
Standard
Uncertainty
u(xi)
Unit Type
Sensitivity
Coefficient
ci
Unc.
Contribution
ui(y)
L
Source
luminance
display
2450 0.577 cd/m2 B 4.09 × 10⁻⁴ 2.36 × 10⁻⁴
Ld
Source
luminance
dark
0 0.577 cd/m2 B -4.09 × 10⁻⁴ -2.36 × 10⁻⁴
Rv,L
Std.
Luminance
resp.
1.497 × 10⁻³ 4.4 × 10⁻⁶ V/[cd/m2] B 669 2.94 × 10⁻³
y
Std.
Luminance
signal
3.6637 0.00011 V A -0.2732 -3.01 × 10⁻⁵
yd
Std.
Luminance
dark
0.00003 4.1 × 10⁻⁷ V A 0.2732 1.12 × 10⁻⁷
cf Correction
factor 1.0000 0.00250 B 1.0011 2.50 × 10⁻³
Rf Calibration
factor 1.0011 0.0039
Rel. expanded uncertainty for luminance source calibration (k = 2) 0.77 %
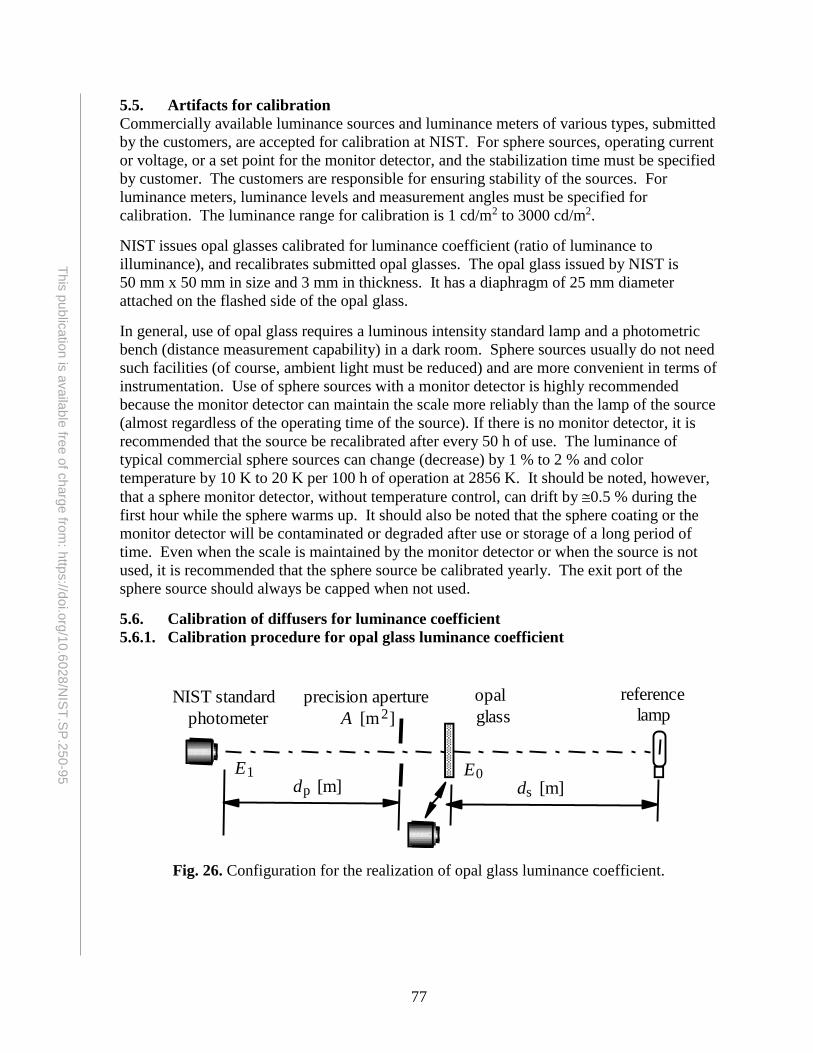
77
This
pu
blic
atio
n is
availa
ble
free o
f charg
e fro
m: h
ttps://d
oi.o
rg/1
0.6
028
/NIS
T.S
P.2
50-9
5
5.5. Artifacts for calibration
Commercially available luminance sources and luminance meters of various types, submitted
by the customers, are accepted for calibration at NIST. For sphere sources, operating current
or voltage, or a set point for the monitor detector, and the stabilization time must be specified
by customer. The customers are responsible for ensuring stability of the sources. For
luminance meters, luminance levels and measurement angles must be specified for
calibration. The luminance range for calibration is 1 cd/m2 to 3000 cd/m2.
NIST issues opal glasses calibrated for luminance coefficient (ratio of luminance to
illuminance), and recalibrates submitted opal glasses. The opal glass issued by NIST is
50 mm x 50 mm in size and 3 mm in thickness. It has a diaphragm of 25 mm diameter
attached on the flashed side of the opal glass.
In general, use of opal glass requires a luminous intensity standard lamp and a photometric
bench (distance measurement capability) in a dark room. Sphere sources usually do not need
such facilities (of course, ambient light must be reduced) and are more convenient in terms of
instrumentation. Use of sphere sources with a monitor detector is highly recommended
because the monitor detector can maintain the scale more reliably than the lamp of the source
(almost regardless of the operating time of the source). If there is no monitor detector, it is
recommended that the source be recalibrated after every 50 h of use. The luminance of
typical commercial sphere sources can change (decrease) by 1 % to 2 % and color
temperature by 10 K to 20 K per 100 h of operation at 2856 K. It should be noted, however,
that a sphere monitor detector, without temperature control, can drift by 0.5 % during the
first hour while the sphere warms up. It should also be noted that the sphere coating or the
monitor detector will be contaminated or degraded after use or storage of a long period of
time. Even when the scale is maintained by the monitor detector or when the source is not
used, it is recommended that the sphere source be calibrated yearly. The exit port of the
sphere source should always be capped when not used.
5.6. Calibration of diffusers for luminance coefficient
5.6.1. Calibration procedure for opal glass luminance coefficient
Fig. 26. Configuration for the realization of opal glass luminance coefficient.
opal
glass
reference
lamp
ds [m]
NIST standard
photometer
dp [m]
precision aperture
A [m2]
E1 E0
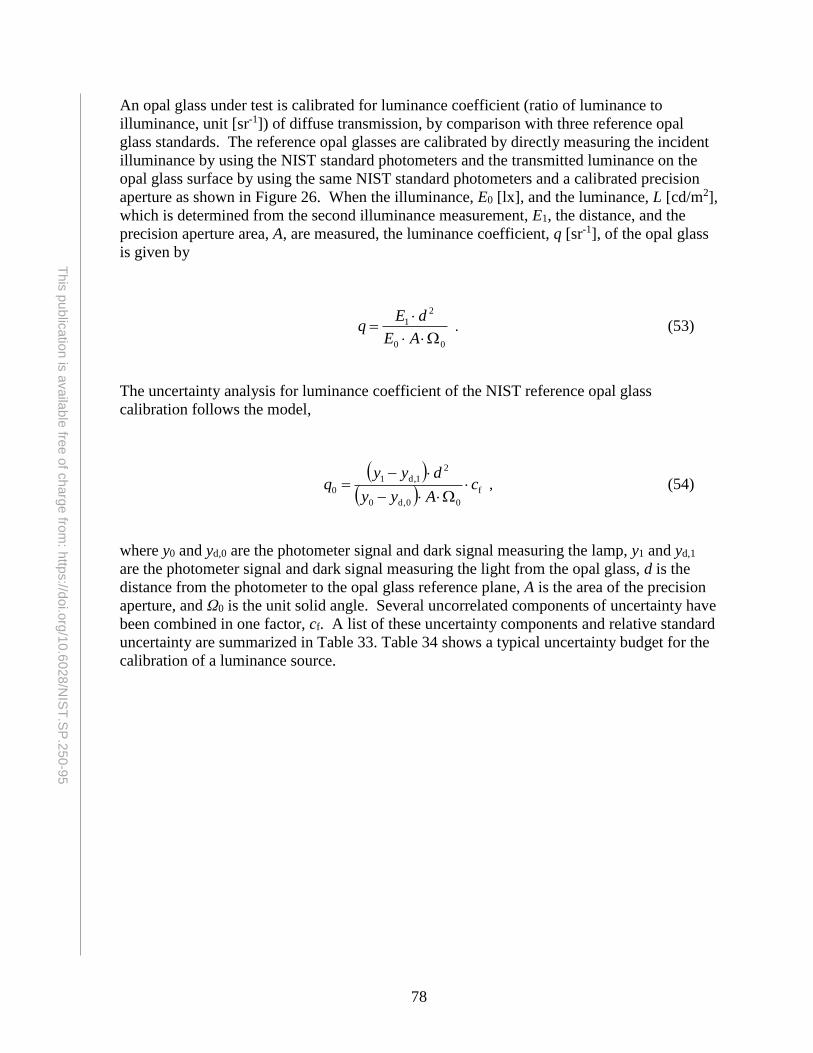
78
This
pu
blic
atio
n is
availa
ble
free o
f charg
e fro
m: h
ttps://d
oi.o
rg/1
0.6
028
/NIS
T.S
P.2
50-9
5
An opal glass under test is calibrated for luminance coefficient (ratio of luminance to
illuminance, unit [sr-1]) of diffuse transmission, by comparison with three reference opal
glass standards. The reference opal glasses are calibrated by directly measuring the incident
illuminance by using the NIST standard photometers and the transmitted luminance on the
opal glass surface by using the same NIST standard photometers and a calibrated precision
aperture as shown in Figure 26. When the illuminance, E0 [lx], and the luminance, L [cd/m2],
which is determined from the second illuminance measurement, E1, the distance, and the
precision aperture area, A, are measured, the luminance coefficient, q [sr-1], of the opal glass
is given by
00
2
1
AE
dEq . (53)
The uncertainty analysis for luminance coefficient of the NIST reference opal glass
calibration follows the model,
f
00,d0
2
1,d1
0 cAyy
dyyq
, (54)
where y0 and yd,0 are the photometer signal and dark signal measuring the lamp, y1 and yd,1
are the photometer signal and dark signal measuring the light from the opal glass, d is the
distance from the photometer to the opal glass reference plane, A is the area of the precision
aperture, and Ω0 is the unit solid angle. Several uncorrelated components of uncertainty have
been combined in one factor, cf. A list of these uncertainty components and relative standard
uncertainty are summarized in Table 33. Table 34 shows a typical uncertainty budget for the
calibration of a luminance source.
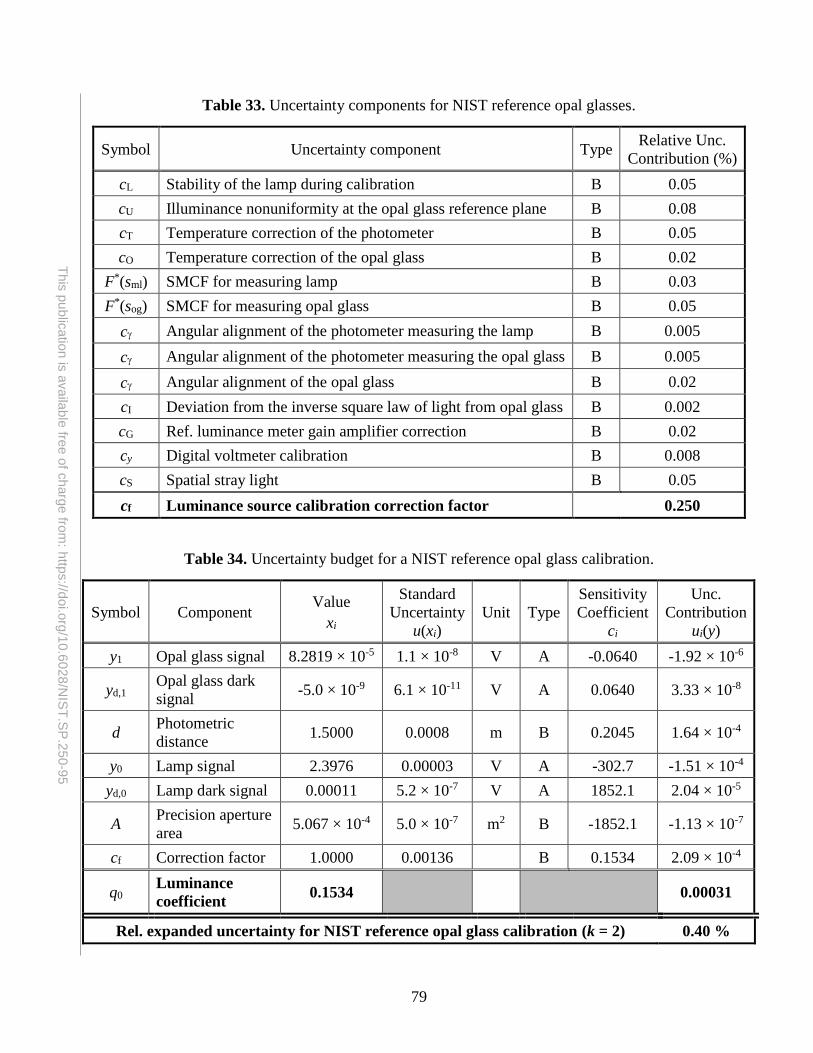
79
This
pu
blic
atio
n is
availa
ble
free o
f charg
e fro
m: h
ttps://d
oi.o
rg/1
0.6
028
/NIS
T.S
P.2
50-9
5
Table 33. Uncertainty components for NIST reference opal glasses.
Symbol Uncertainty component Type Relative Unc.
Contribution (%)
cL Stability of the lamp during calibration B 0.05
cU Illuminance nonuniformity at the opal glass reference plane B 0.08
cT Temperature correction of the photometer B 0.05
cO Temperature correction of the opal glass B 0.02
F*(sml) SMCF for measuring lamp B 0.03
F*(sog) SMCF for measuring opal glass B 0.05
c Angular alignment of the photometer measuring the lamp B 0.005
c Angular alignment of the photometer measuring the opal glass B 0.005
c Angular alignment of the opal glass B 0.02
cI Deviation from the inverse square law of light from opal glass B 0.002
cG Ref. luminance meter gain amplifier correction B 0.02
cy Digital voltmeter calibration B 0.008
cS Spatial stray light B 0.05
cf Luminance source calibration correction factor 0.250
Table 34. Uncertainty budget for a NIST reference opal glass calibration.
Symbol Component Value
xi
Standard
Uncertainty
u(xi)
Unit Type
Sensitivity
Coefficient
ci
Unc.
Contribution
ui(y)
y1 Opal glass signal 8.2819 × 10⁻⁵ 1.1 × 10⁻⁸ V A -0.0640 -1.92 × 10⁻⁶
yd,1 Opal glass dark
signal -5.0 × 10⁻⁹ 6.1 × 10⁻¹¹ V A 0.0640 3.33 × 10⁻⁸
d Photometric
distance 1.5000 0.0008 m B 0.2045 1.64 × 10⁻⁴
y0 Lamp signal 2.3976 0.00003 V A -302.7 -1.51 × 10⁻⁴
yd,0 Lamp dark signal 0.00011 5.2 × 10⁻⁷ V A 1852.1 2.04 × 10⁻⁵
A Precision aperture
area 5.067 × 10⁻⁴ 5.0 × 10⁻⁷ m2 B -1852.1 -1.13 × 10⁻⁷
cf Correction factor 1.0000 0.00136 B 0.1534 2.09 × 10⁻⁴
q0 Luminance
coefficient 0.1534 0.00031
Rel. expanded uncertainty for NIST reference opal glass calibration (k = 2) 0.40 %
80
This
pu
blic
atio
n is
availa
ble
free o
f charg
e fro
m: h
ttps://d
oi.o
rg/1
0.6
028
/NIS
T.S
P.2
50-9
5
For calibration of customers’ opal glasses, the instruments are placed on the NIST
photometry bench in a light tight box. The reference opal glasses and the opal glass under
test are placed alternately and irradiated by a 1000 W frosted quartz halogen lamp operated at
a color temperature of 2856 K (unless otherwise stated in the report) at a distance of
approximately 2 m from the opal glass. A reference luminance meter is placed 1.5 m from
the opal glass. The centers of the lamp filament, the opal glass, and the luminance meter lens
are aligned on the optical axis. The opal glasses are placed with the aperture side facing the
luminance meter. The glass surface is aligned to be perpendicular to the optical axis. The
luminance meter is aimed at the center of the circular aperture area and set to a measurement
angle of 20’. With these dimensions, the luminance of the center area of 9 mm in diameter is
measured. The luminance coefficient of the opal glass under test is calculated by comparison
to the reference opal glasses.
The color temperature of the transmitted light is shifted due to the spectral transmittance of
the opal glass and decreases typically by 100 K to 200 K. As an option, if a set of a luminous
intensity standard lamp and an opal glass are submitted for calibration, the operating current
of the lamp can be set so that the transmitted light from the opal glass produces color
temperature of 2856 K (See Section 6 for color temperature calibration), and the luminance
coefficient of the opal glass can be calibrated under that condition.
NIST issues opal glasses of 50 mm square, 3 mm thick, having an aperture of 25 mm in
diameter, as calibrated standards for luminance coefficient. A luminance standard can be
obtained by combining these standards and an incandescent lamp operated at approximately
2856 K. The opal glass should be placed so that the transparent glass side (with no aperture)
faces the lamp. The luminance standard will be on the opal side with the aperture. The
luminance, L [cd/m2], of the illuminated opal glass is
EqL , (55)
where q is the luminance coefficient [sr-1] and E is the illuminance [lx] on the reference plane
of the opal glass. The reference plane is 2 mm inside from the surface of the transparent
glass side. Illuminance can be measured by placing a standard photometer at the reference
plane of the opal glass after the opal glass is removed. Illuminance can also be determined
by using a luminous intensity standard lamp applying the inverse square law. In this case the
distance should be measured from the reference plane of the opal glass.
It is recommended that the distance, d, be greater than 1 m because a small distance error
creates a large luminance error at shorter distances. It should be noted that the luminance
coefficient, q, is calibrated for the central 9 mm diameter area of the opal glass (unless
otherwise stated in the calibration report) and in the direction normal to the opal surface.
Luminance may vary up to ± 1 % typically, outside that central area. Luminance may also
vary if viewed at different angles.
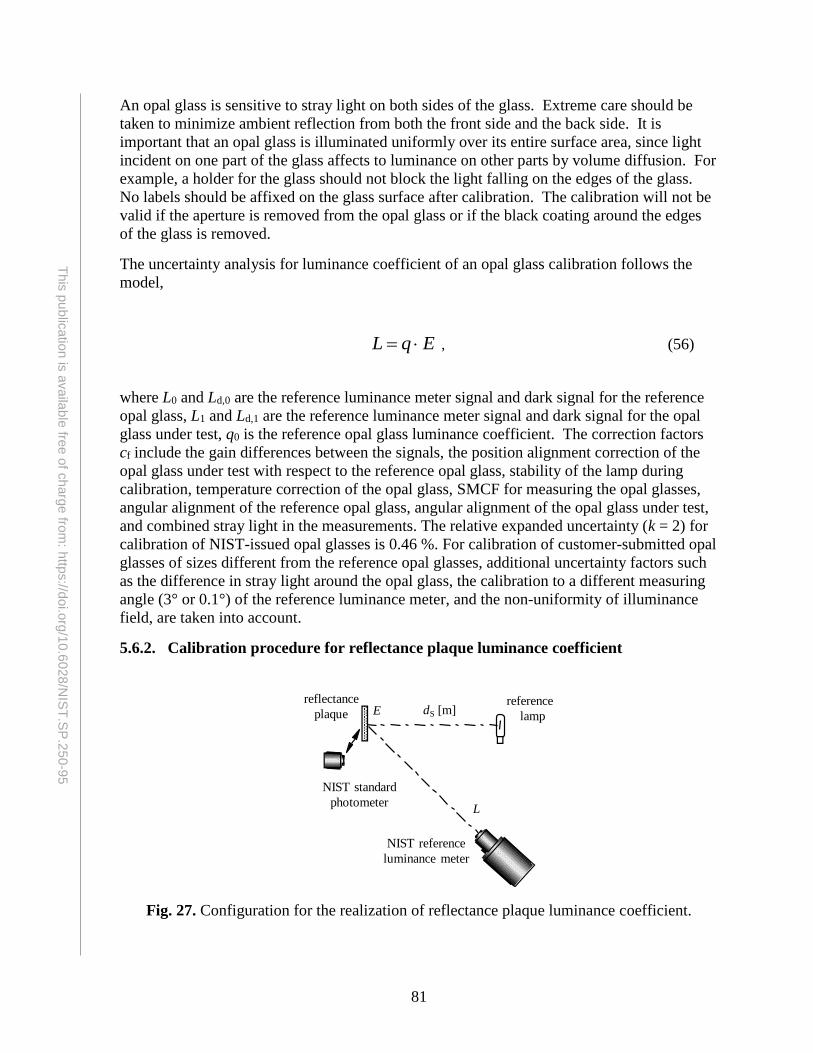
81
This
pu
blic
atio
n is
availa
ble
free o
f charg
e fro
m: h
ttps://d
oi.o
rg/1
0.6
028
/NIS
T.S
P.2
50-9
5
An opal glass is sensitive to stray light on both sides of the glass. Extreme care should be
taken to minimize ambient reflection from both the front side and the back side. It is
important that an opal glass is illuminated uniformly over its entire surface area, since light
incident on one part of the glass affects to luminance on other parts by volume diffusion. For
example, a holder for the glass should not block the light falling on the edges of the glass.
No labels should be affixed on the glass surface after calibration. The calibration will not be
valid if the aperture is removed from the opal glass or if the black coating around the edges
of the glass is removed.
The uncertainty analysis for luminance coefficient of an opal glass calibration follows the
model,
EqL , (56)
where L0 and Ld,0 are the reference luminance meter signal and dark signal for the reference
opal glass, L1 and Ld,1 are the reference luminance meter signal and dark signal for the opal
glass under test, q0 is the reference opal glass luminance coefficient. The correction factors
cf include the gain differences between the signals, the position alignment correction of the
opal glass under test with respect to the reference opal glass, stability of the lamp during
calibration, temperature correction of the opal glass, SMCF for measuring the opal glasses,
angular alignment of the reference opal glass, angular alignment of the opal glass under test,
and combined stray light in the measurements. The relative expanded uncertainty (k = 2) for
calibration of NIST-issued opal glasses is 0.46 %. For calibration of customer-submitted opal
glasses of sizes different from the reference opal glasses, additional uncertainty factors such
as the difference in stray light around the opal glass, the calibration to a different measuring
angle (3° or 0.1°) of the reference luminance meter, and the non-uniformity of illuminance
field, are taken into account.
5.6.2. Calibration procedure for reflectance plaque luminance coefficient
Fig. 27. Configuration for the realization of reflectance plaque luminance coefficient.
NIST reference
luminance meter
reflectance
plaque Ereference
lamp
L
dS [m]
NIST standard
photometer
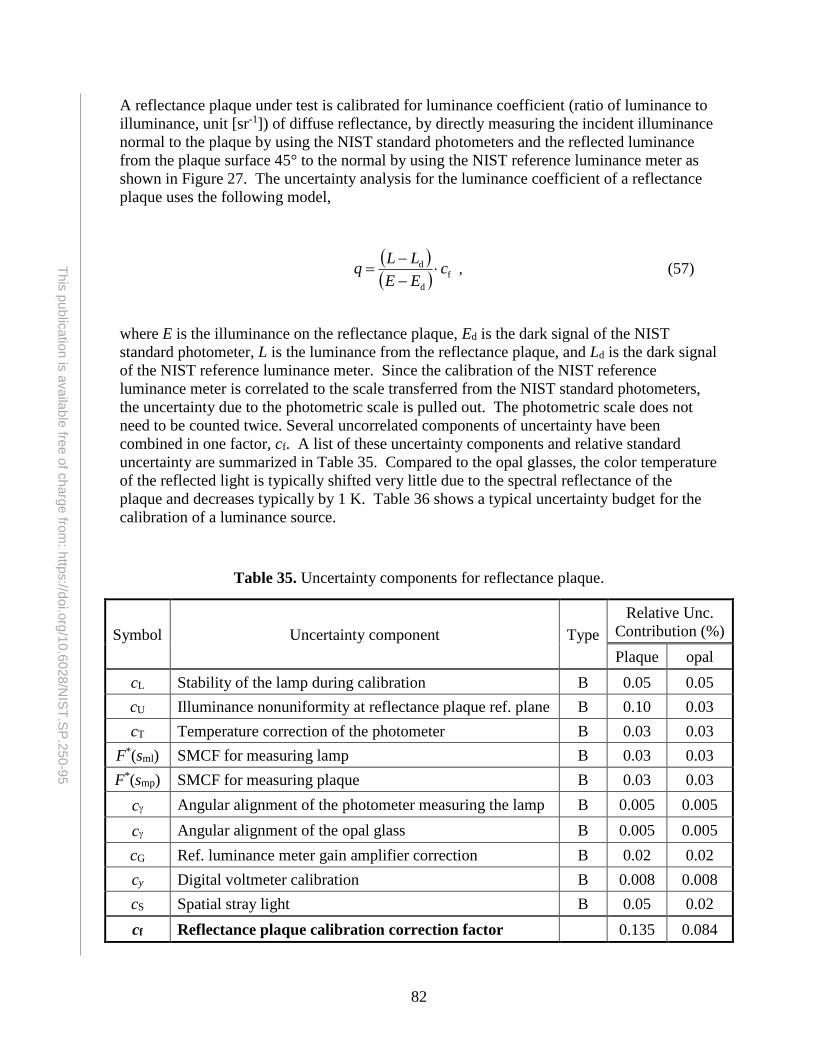
82
This
pu
blic
atio
n is
availa
ble
free o
f charg
e fro
m: h
ttps://d
oi.o
rg/1
0.6
028
/NIS
T.S
P.2
50-9
5
A reflectance plaque under test is calibrated for luminance coefficient (ratio of luminance to
illuminance, unit [sr-1]) of diffuse reflectance, by directly measuring the incident illuminance
normal to the plaque by using the NIST standard photometers and the reflected luminance
from the plaque surface 45° to the normal by using the NIST reference luminance meter as
shown in Figure 27. The uncertainty analysis for the luminance coefficient of a reflectance
plaque uses the following model,
f
d
d cEE
LLq
, (57)
where E is the illuminance on the reflectance plaque, Ed is the dark signal of the NIST
standard photometer, L is the luminance from the reflectance plaque, and Ld is the dark signal
of the NIST reference luminance meter. Since the calibration of the NIST reference
luminance meter is correlated to the scale transferred from the NIST standard photometers,
the uncertainty due to the photometric scale is pulled out. The photometric scale does not
need to be counted twice. Several uncorrelated components of uncertainty have been
combined in one factor, cf. A list of these uncertainty components and relative standard
uncertainty are summarized in Table 35. Compared to the opal glasses, the color temperature
of the reflected light is typically shifted very little due to the spectral reflectance of the
plaque and decreases typically by 1 K. Table 36 shows a typical uncertainty budget for the
calibration of a luminance source.
Table 35. Uncertainty components for reflectance plaque.
Symbol Uncertainty component Type
Relative Unc.
Contribution (%)
Plaque opal
cL Stability of the lamp during calibration B 0.05 0.05
cU Illuminance nonuniformity at reflectance plaque ref. plane B 0.10 0.03
cT Temperature correction of the photometer B 0.03 0.03
F*(sml) SMCF for measuring lamp B 0.03 0.03
F*(smp) SMCF for measuring plaque B 0.03 0.03
c Angular alignment of the photometer measuring the lamp B 0.005 0.005
c Angular alignment of the opal glass B 0.005 0.005
cG Ref. luminance meter gain amplifier correction B 0.02 0.02
cy Digital voltmeter calibration B 0.008 0.008
cS Spatial stray light B 0.05 0.02
cf Reflectance plaque calibration correction factor 0.135 0.084
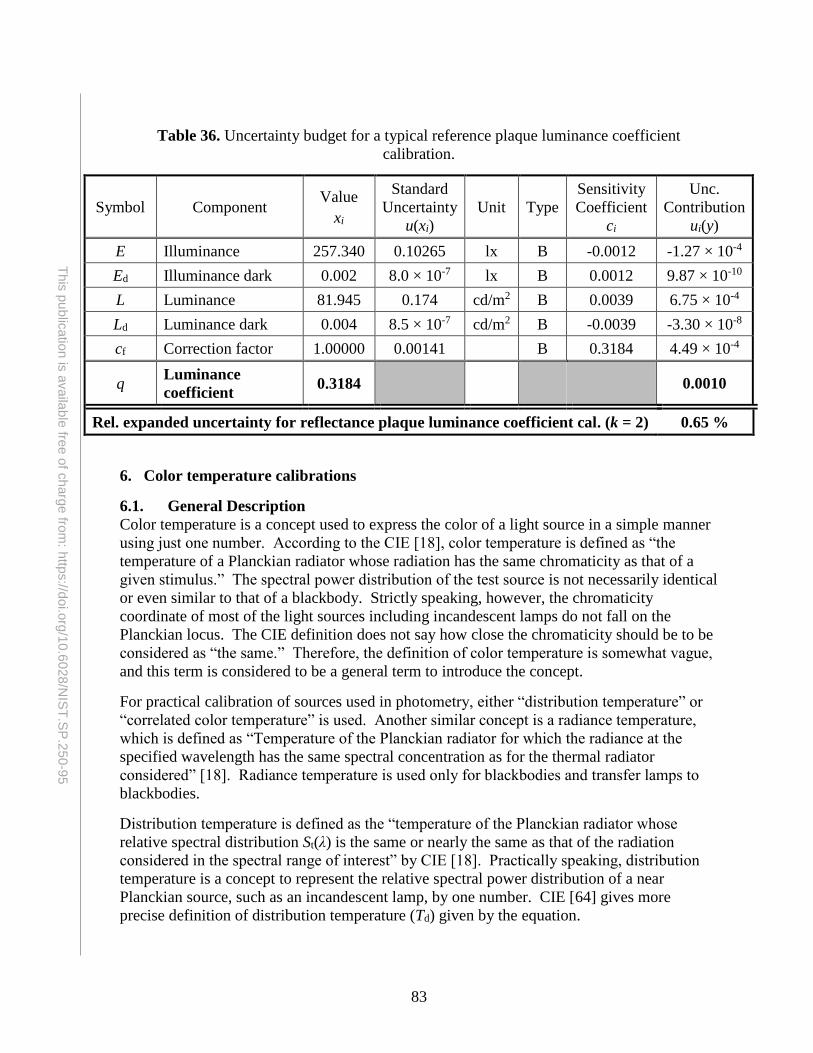
83
This
pu
blic
atio
n is
availa
ble
free o
f charg
e fro
m: h
ttps://d
oi.o
rg/1
0.6
028
/NIS
T.S
P.2
50-9
5
Table 36. Uncertainty budget for a typical reference plaque luminance coefficient
calibration.
Symbol Component Value
xi
Standard
Uncertainty
u(xi)
Unit Type
Sensitivity
Coefficient
ci
Unc.
Contribution
ui(y)
E Illuminance 257.340 0.10265 lx B -0.0012 -1.27 × 10⁻⁴
Ed Illuminance dark 0.002 8.0 × 10⁻⁷ lx B 0.0012 9.87 × 10⁻¹⁰
L Luminance 81.945 0.174 cd/m2 B 0.0039 6.75 × 10⁻⁴
Ld Luminance dark 0.004 8.5 × 10⁻⁷ cd/m2 B -0.0039 -3.30 × 10⁻⁸
cf Correction factor 1.00000 0.00141 B 0.3184 4.49 × 10⁻⁴
q Luminance
coefficient 0.3184 0.0010
Rel. expanded uncertainty for reflectance plaque luminance coefficient cal. (k = 2) 0.65 %
6. Color temperature calibrations
6.1. General Description
Color temperature is a concept used to express the color of a light source in a simple manner
using just one number. According to the CIE [18], color temperature is defined as “the
temperature of a Planckian radiator whose radiation has the same chromaticity as that of a
given stimulus.” The spectral power distribution of the test source is not necessarily identical
or even similar to that of a blackbody. Strictly speaking, however, the chromaticity
coordinate of most of the light sources including incandescent lamps do not fall on the
Planckian locus. The CIE definition does not say how close the chromaticity should be to be
considered as “the same.” Therefore, the definition of color temperature is somewhat vague,
and this term is considered to be a general term to introduce the concept.
For practical calibration of sources used in photometry, either “distribution temperature” or
“correlated color temperature” is used. Another similar concept is a radiance temperature,
which is defined as “Temperature of the Planckian radiator for which the radiance at the
specified wavelength has the same spectral concentration as for the thermal radiator
considered” [18]. Radiance temperature is used only for blackbodies and transfer lamps to
blackbodies.
Distribution temperature is defined as the “temperature of the Planckian radiator whose
relative spectral distribution St(λ) is the same or nearly the same as that of the radiation
considered in the spectral range of interest” by CIE [18]. Practically speaking, distribution
temperature is a concept to represent the relative spectral power distribution of a near
Planckian source, such as an incandescent lamp, by one number. CIE [64] gives more
precise definition of distribution temperature (Td) given by the equation.
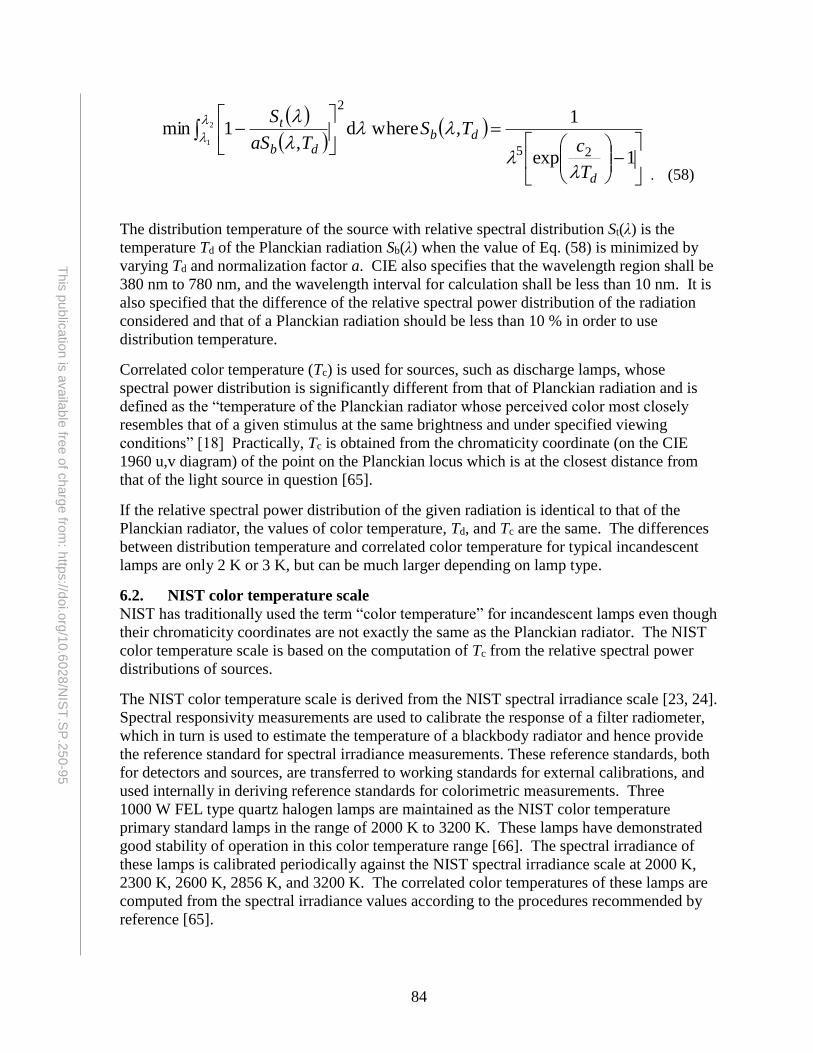
84
This
pu
blic
atio
n is
availa
ble
free o
f charg
e fro
m: h
ttps://d
oi.o
rg/1
0.6
028
/NIS
T.S
P.2
50-9
5
1exp
1, whered
,1min
25
2
2
1
d
dbdb
t
T
cTS
TaS
S
. (58)
The distribution temperature of the source with relative spectral distribution St(λ) is the
temperature Td of the Planckian radiation Sb(λ) when the value of Eq. (58) is minimized by
varying Td and normalization factor a. CIE also specifies that the wavelength region shall be
380 nm to 780 nm, and the wavelength interval for calculation shall be less than 10 nm. It is
also specified that the difference of the relative spectral power distribution of the radiation
considered and that of a Planckian radiation should be less than 10 % in order to use
distribution temperature.
Correlated color temperature (Tc) is used for sources, such as discharge lamps, whose
spectral power distribution is significantly different from that of Planckian radiation and is
defined as the “temperature of the Planckian radiator whose perceived color most closely
resembles that of a given stimulus at the same brightness and under specified viewing
conditions” [18] Practically, Tc is obtained from the chromaticity coordinate (on the CIE
1960 u,v diagram) of the point on the Planckian locus which is at the closest distance from
that of the light source in question [65].
If the relative spectral power distribution of the given radiation is identical to that of the
Planckian radiator, the values of color temperature, Td, and Tc are the same. The differences
between distribution temperature and correlated color temperature for typical incandescent
lamps are only 2 K or 3 K, but can be much larger depending on lamp type.
6.2. NIST color temperature scale
NIST has traditionally used the term “color temperature” for incandescent lamps even though
their chromaticity coordinates are not exactly the same as the Planckian radiator. The NIST
color temperature scale is based on the computation of Tc from the relative spectral power
distributions of sources.
The NIST color temperature scale is derived from the NIST spectral irradiance scale [23, 24].
Spectral responsivity measurements are used to calibrate the response of a filter radiometer,
which in turn is used to estimate the temperature of a blackbody radiator and hence provide
the reference standard for spectral irradiance measurements. These reference standards, both
for detectors and sources, are transferred to working standards for external calibrations, and
used internally in deriving reference standards for colorimetric measurements. Three
1000 W FEL type quartz halogen lamps are maintained as the NIST color temperature
primary standard lamps in the range of 2000 K to 3200 K. These lamps have demonstrated
good stability of operation in this color temperature range [66]. The spectral irradiance of
these lamps is calibrated periodically against the NIST spectral irradiance scale at 2000 K,
2300 K, 2600 K, 2856 K, and 3200 K. The correlated color temperatures of these lamps are
computed from the spectral irradiance values according to the procedures recommended by
reference [65].
85
This
pu
blic
atio
n is
availa
ble
free o
f charg
e fro
m: h
ttps://d
oi.o
rg/1
0.6
028
/NIS
T.S
P.2
50-9
5
The standard uncertainty of the correlated color temperature of these lamps has been
evaluated using the methods described in references [67-69]. The standard uncertainty
determined for the five correlated color temperature points is 1.0 K at 2000 K, 1.2 K at
2300 K,1.6 K at 2600 K,1.8 K at 2856 K, and 2.3 K at 3200 K.
6.3. Artifacts for calibration
For many years in the past, NIST issued 500 W Airway Beacon lamps as color temperature
standards. These lamps are still accepted for recalibration at NIST. These lamps have
medium bi-post bases, clear bulbs, and C-13B filaments. The lamp designation number is
etched on the bulb. The appearance and the electrical polarity of this type of lamp are shown
in Figure 11.
NIST now issues FEL type 1000 W quartz halogen lamps calibrated for color temperature.
This is the same type of lamp used for luminous intensity standards. The lamps are potted on
a medium bi-post base, and seasoned on DC power for at least 48 h at 8.4 A. The lamps are
then tested for stability 3 times for 24 h at 7.2 A. Lamps are usually calibrated at a color
temperature of 2856 K, but can be used for color temperature standards in the range of
2000 K to 3200 K. The operating current and voltage of the lamp are approximately 7.2 A
and 85 V at 2856 K. The lamp designation numbers and the electrical polarity are engraved
on an identification plate affixed on the lamp base as shown in Figure 11.
The burning position of the lamp with respect to the optical axis is critical to the transfer of
correlated color temperature. Due to shadowing of the coiled-coiled filament, the angular
distribution of the correlated color temperature fluctuates on the order of 8 K. The angular
alignment of the reference lamp contributes a standard uncertainty of 1.5 K. Additionally the
angular alignment of the lamp under test contributes a standard uncertainty of 1.5 K.
The reference lamps cannot be calibrated frequently enough to reduce the uncertainty of
lamp aging to negligible. The reference lamps are calibrated after every 24 h of operation.
The standard uncertainty due to lamp aging ranges from 0.7 K at 2000 K up to 1.8 K at
3200 K.
The uncertainty in the correlated color temperature due to the setting of the current has the
following dependence,
T
00
m
Uc
RJ
cUTT
. (59)
where T0 is the calibrated correlated color temperature, U is the measured voltage, cU is the
calibration factor for the digital voltmeter, J0 is the calibrated current, R is the calibrated
resistance of the shunt resistor, and mT is the exponential dependence which has a value of
0.7 and a standard uncertainty of 0.05. The uncertainty in the correlated color temperature
due to the fluctuation in the lamp is characterized by the fluctuation in the voltage over
several operations of the lamp. The model for the fluctuation in the lamp is
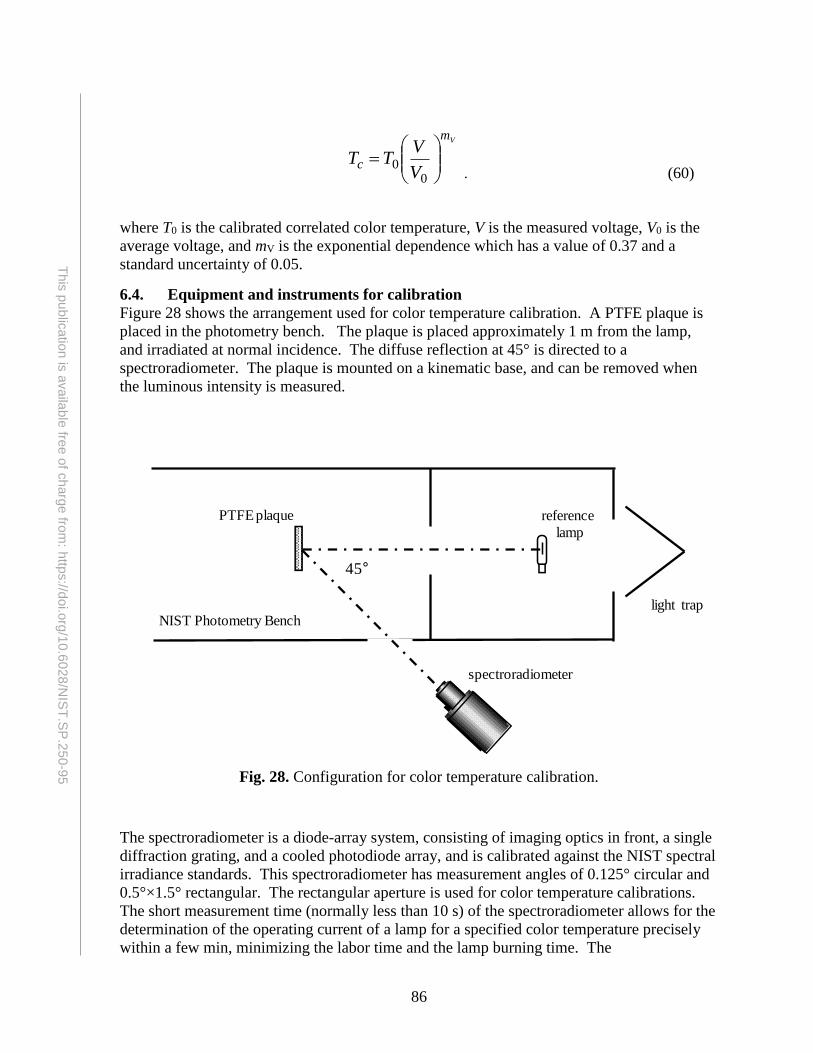
86
This
pu
blic
atio
n is
availa
ble
free o
f charg
e fro
m: h
ttps://d
oi.o
rg/1
0.6
028
/NIS
T.S
P.2
50-9
5
Vm
cV
VTT
00
. (60)
where T0 is the calibrated correlated color temperature, V is the measured voltage, V0 is the
average voltage, and mV is the exponential dependence which has a value of 0.37 and a
standard uncertainty of 0.05.
6.4. Equipment and instruments for calibration
Figure 28 shows the arrangement used for color temperature calibration. A PTFE plaque is
placed in the photometry bench. The plaque is placed approximately 1 m from the lamp,
and irradiated at normal incidence. The diffuse reflection at 45° is directed to a
spectroradiometer. The plaque is mounted on a kinematic base, and can be removed when
the luminous intensity is measured.
Fig. 28. Configuration for color temperature calibration.
The spectroradiometer is a diode-array system, consisting of imaging optics in front, a single
diffraction grating, and a cooled photodiode array, and is calibrated against the NIST spectral
irradiance standards. This spectroradiometer has measurement angles of 0.125° circular and
0.5°×1.5° rectangular. The rectangular aperture is used for color temperature calibrations.
The short measurement time (normally less than 10 s) of the spectroradiometer allows for the
determination of the operating current of a lamp for a specified color temperature precisely
within a few min, minimizing the labor time and the lamp burning time. The
spectroradiometer
PTFE plaque reference
lamp
light trapNIST Photometry Bench
45
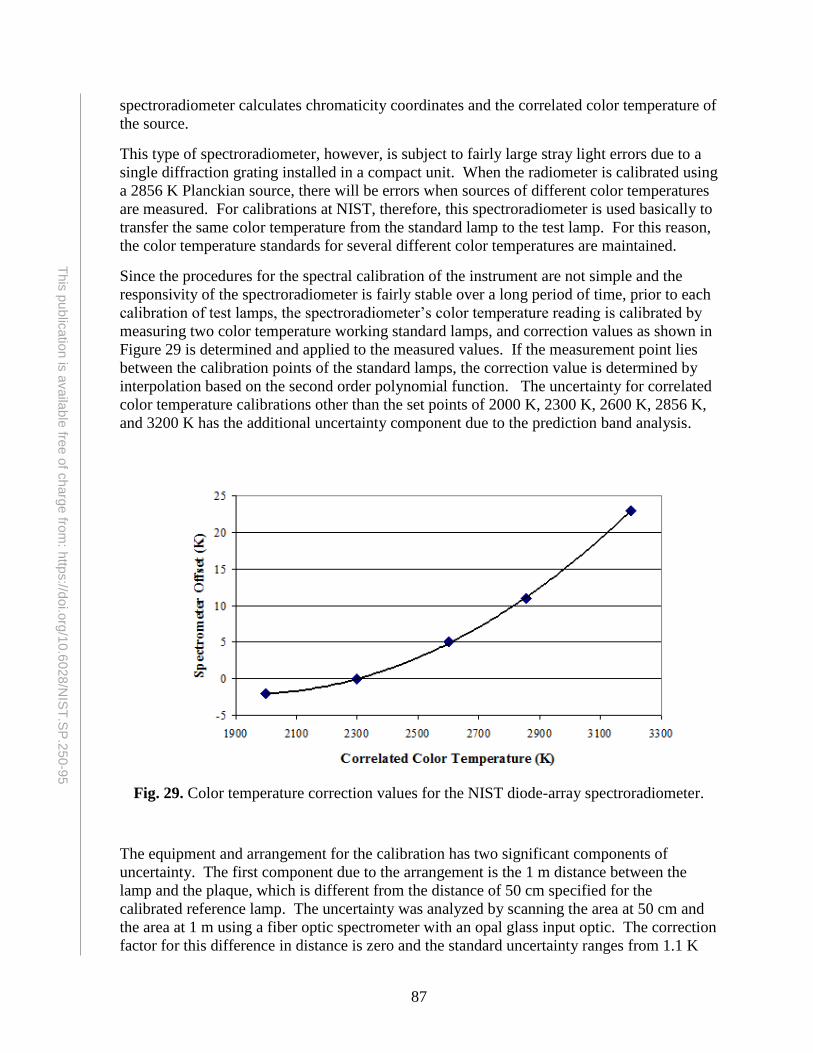
87
This
pu
blic
atio
n is
availa
ble
free o
f charg
e fro
m: h
ttps://d
oi.o
rg/1
0.6
028
/NIS
T.S
P.2
50-9
5
spectroradiometer calculates chromaticity coordinates and the correlated color temperature of
the source.
This type of spectroradiometer, however, is subject to fairly large stray light errors due to a
single diffraction grating installed in a compact unit. When the radiometer is calibrated using
a 2856 K Planckian source, there will be errors when sources of different color temperatures
are measured. For calibrations at NIST, therefore, this spectroradiometer is used basically to
transfer the same color temperature from the standard lamp to the test lamp. For this reason,
the color temperature standards for several different color temperatures are maintained.
Since the procedures for the spectral calibration of the instrument are not simple and the
responsivity of the spectroradiometer is fairly stable over a long period of time, prior to each
calibration of test lamps, the spectroradiometer’s color temperature reading is calibrated by
measuring two color temperature working standard lamps, and correction values as shown in
Figure 29 is determined and applied to the measured values. If the measurement point lies
between the calibration points of the standard lamps, the correction value is determined by
interpolation based on the second order polynomial function. The uncertainty for correlated
color temperature calibrations other than the set points of 2000 K, 2300 K, 2600 K, 2856 K,
and 3200 K has the additional uncertainty component due to the prediction band analysis.
Fig. 29. Color temperature correction values for the NIST diode-array spectroradiometer.
The equipment and arrangement for the calibration has two significant components of
uncertainty. The first component due to the arrangement is the 1 m distance between the
lamp and the plaque, which is different from the distance of 50 cm specified for the
calibrated reference lamp. The uncertainty was analyzed by scanning the area at 50 cm and
the area at 1 m using a fiber optic spectrometer with an opal glass input optic. The correction
factor for this difference in distance is zero and the standard uncertainty ranges from 1.1 K
88
This
pu
blic
atio
n is
availa
ble
free o
f charg
e fro
m: h
ttps://d
oi.o
rg/1
0.6
028
/NIS
T.S
P.2
50-9
5
for 2000 K to 2.3 K for 3200 K. The second component due to equipment is the spectral
stray-light errors that occur within the spectroradiometer. Reference [70] describes the
spectral stray-light errors and method for correcting. The correction factor for stray light is
zero with the standard uncertainty of 1.0 K.
6.5. Calibration procedures
Prior to the measurement of test lamps, the spectroradiometer’s color temperature reading is
calibrated against two color temperature working standard lamps at the color temperature
points required for the calibration. The test lamp is mounted on the photometry bench and
aligned with the same procedure as the luminous intensity measurements. The lamp is
operated in the base-down position, with the identifying number on the opposite side from
the spectroradiometer. Lamp orientation is accomplished by aligning the lamp socket so that
the lamp posts are held vertically, and the plane formed by the axes of the posts is
perpendicular to the optical axis of the spectroradiometer. An alignment jig (a mirror
mounted on a bi-post base to be parallel to the plane formed by the axes of the posts) is used
in combination with a laser and an end-viewing telescope. The distance from the lamp to the
input optics (a PTFE plaque) of the spectroradiometer is approximately 1 m.
The lamp is operated on DC power. The electrical polarity is marked on the identification
plate of the lamp. The test lamp is slowly (30 s) ramped up to the specified current, and
allowed to stabilize for at least ten minutes before calibration. When a lamp current is to be
determined for a specified color temperature, the lamp current is adjusted repeatedly until the
spectroradiometer indicates the specified color temperature. The lamp current and voltage
are recorded when the lamp reaches that color temperature. When the same lamp is
calibrated for different color temperatures, at least 3 min are allowed before any
measurements after the lamp current is changed from one color temperature to another.
Color temperature calibrations at NIST are most often done at 2856 K. Requests for
calibration at any other color temperatures from 2000 K to 3200 K are accepted.
6.6. Uncertainty of correlated color temperature calibration
The offset calibration for the transfer spectroradiometer is done at five specific correlated
color temperatures. The uncertainty analysis of the offset calibration uses the model.
Lf
00
U0T
VT
)(
DL
V
V
RJ
cUTTO
mm
c . (61)
where Lf is uncertainty due to the aging stability of the lamps, D is the uncertainty due to
distance correction factor, and φL is the uncertainty due to angular alignment of the lamp.
Table 37 summarizes uncertainty budget for calibration of the spectrometer at 2856 K where
J0 is 7.230 A.
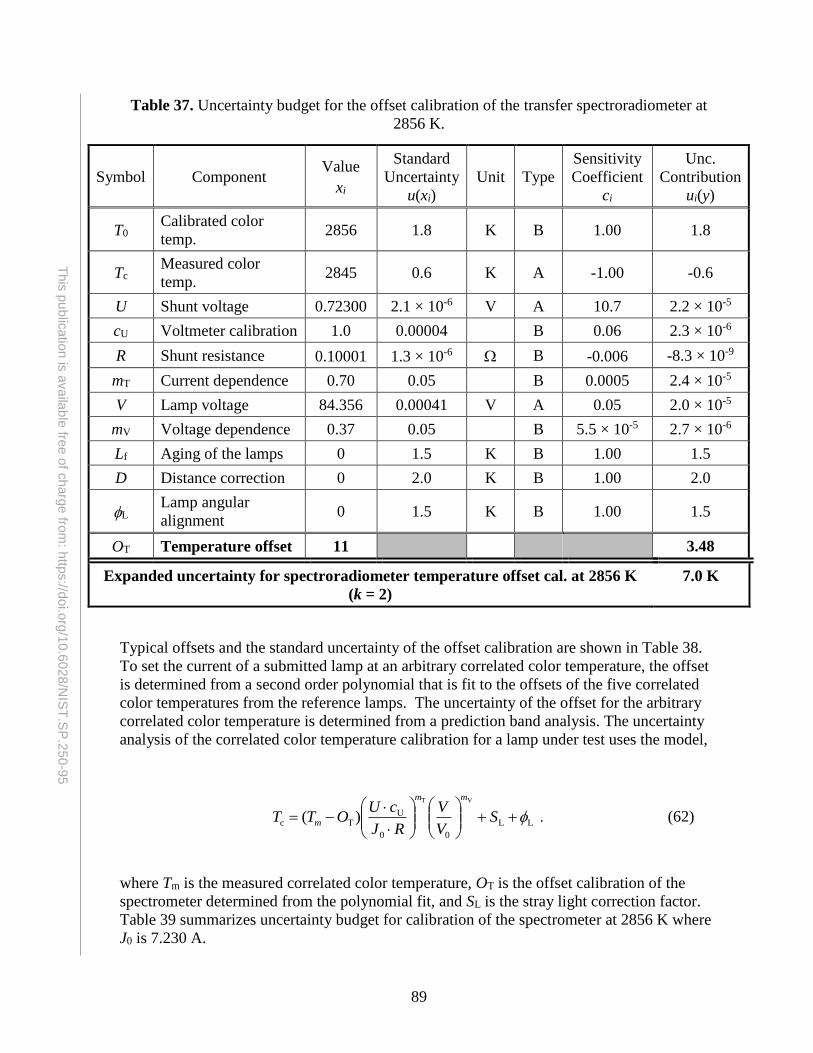
89
This
pu
blic
atio
n is
availa
ble
free o
f charg
e fro
m: h
ttps://d
oi.o
rg/1
0.6
028
/NIS
T.S
P.2
50-9
5
Table 37. Uncertainty budget for the offset calibration of the transfer spectroradiometer at
2856 K.
Symbol Component Value
xi
Standard
Uncertainty
u(xi)
Unit Type
Sensitivity
Coefficient
ci
Unc.
Contribution
ui(y)
T0 Calibrated color
temp. 2856 1.8 K B 1.00 1.8
Tc Measured color
temp. 2845 0.6 K A -1.00 -0.6
U Shunt voltage 0.72300 2.1 × 10⁻⁶ V A 10.7 2.2 × 10⁻⁵
cU Voltmeter calibration 1.0 0.00004 B 0.06 2.3 × 10⁻⁶
R Shunt resistance 0.10001 1.3 × 10⁻⁶ B -0.006 -8.3 × 10⁻⁹
mT Current dependence 0.70 0.05 B 0.0005 2.4 × 10⁻⁵
V Lamp voltage 84.356 0.00041 V A 0.05 2.0 × 10⁻⁵
mV Voltage dependence 0.37 0.05 B 5.5 × 10⁻⁵ 2.7 × 10⁻⁶
Lf Aging of the lamps 0 1.5 K B 1.00 1.5
D Distance correction 0 2.0 K B 1.00 2.0
L Lamp angular
alignment 0 1.5 K B 1.00 1.5
OT Temperature offset 11 3.48
Expanded uncertainty for spectroradiometer temperature offset cal. at 2856 K
(k = 2)
7.0 K
Typical offsets and the standard uncertainty of the offset calibration are shown in Table 38.
To set the current of a submitted lamp at an arbitrary correlated color temperature, the offset
is determined from a second order polynomial that is fit to the offsets of the five correlated
color temperatures from the reference lamps. The uncertainty of the offset for the arbitrary
correlated color temperature is determined from a prediction band analysis. The uncertainty
analysis of the correlated color temperature calibration for a lamp under test uses the model,
LL
00
UTc
VT
)(
S
V
V
RJ
cUOTT
mm
m . (62)
where Tm is the measured correlated color temperature, OT is the offset calibration of the
spectrometer determined from the polynomial fit, and SL is the stray light correction factor.
Table 39 summarizes uncertainty budget for calibration of the spectrometer at 2856 K where
J0 is 7.230 A.
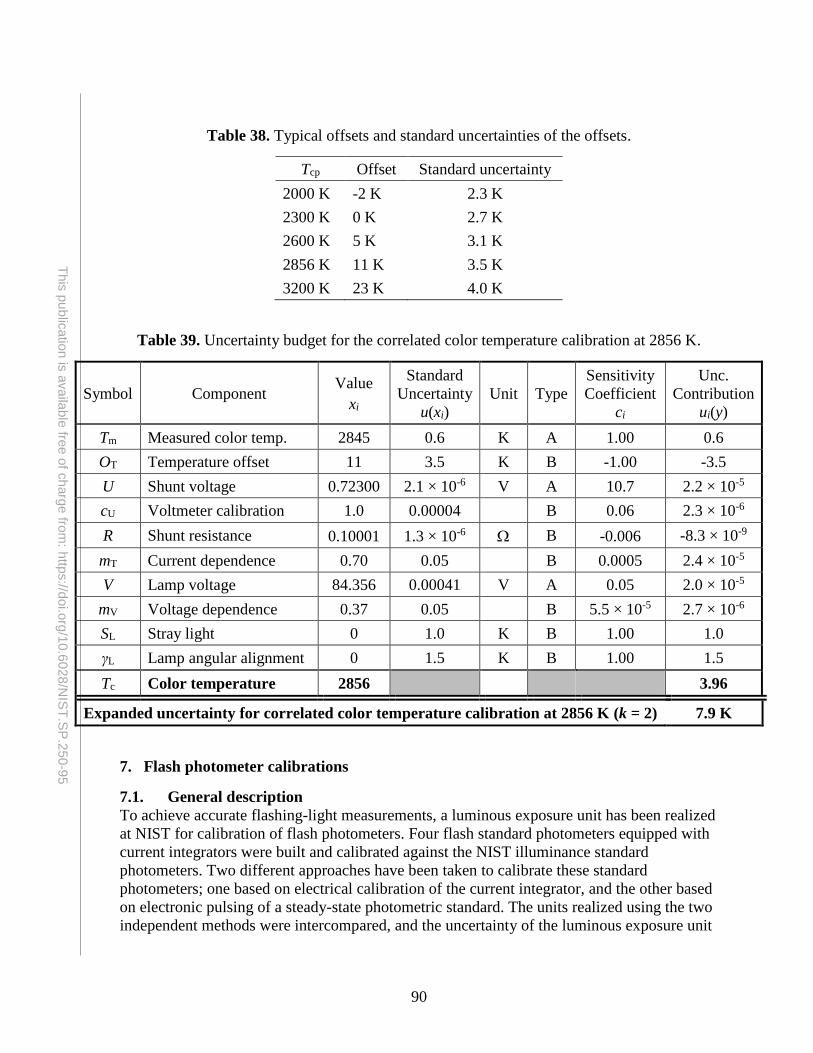
90
This
pu
blic
atio
n is
availa
ble
free o
f charg
e fro
m: h
ttps://d
oi.o
rg/1
0.6
028
/NIS
T.S
P.2
50-9
5
Table 38. Typical offsets and standard uncertainties of the offsets.
Tcp Offset Standard uncertainty
2000 K -2 K 2.3 K
2300 K 0 K 2.7 K
2600 K 5 K 3.1 K
2856 K 11 K 3.5 K
3200 K 23 K 4.0 K
Table 39. Uncertainty budget for the correlated color temperature calibration at 2856 K.
Symbol Component Value
xi
Standard
Uncertainty
u(xi)
Unit Type
Sensitivity
Coefficient
ci
Unc.
Contribution
ui(y)
Tm Measured color temp. 2845 0.6 K A 1.00 0.6
OT Temperature offset 11 3.5 K B -1.00 -3.5
U Shunt voltage 0.72300 2.1 × 10⁻⁶ V A 10.7 2.2 × 10⁻⁵
cU Voltmeter calibration 1.0 0.00004 B 0.06 2.3 × 10⁻⁶
R Shunt resistance 0.10001 1.3 × 10⁻⁶ B -0.006 -8.3 × 10⁻⁹
mT Current dependence 0.70 0.05 B 0.0005 2.4 × 10⁻⁵
V Lamp voltage 84.356 0.00041 V A 0.05 2.0 × 10⁻⁵
mV Voltage dependence 0.37 0.05 B 5.5 × 10⁻⁵ 2.7 × 10⁻⁶
SL Stray light 0 1.0 K B 1.00 1.0
γL Lamp angular alignment 0 1.5 K B 1.00 1.5
Tc Color temperature 2856 3.96
Expanded uncertainty for correlated color temperature calibration at 2856 K (k = 2) 7.9 K
7. Flash photometer calibrations
7.1. General description
To achieve accurate flashing-light measurements, a luminous exposure unit has been realized
at NIST for calibration of flash photometers. Four flash standard photometers equipped with
current integrators were built and calibrated against the NIST illuminance standard
photometers. Two different approaches have been taken to calibrate these standard
photometers; one based on electrical calibration of the current integrator, and the other based
on electronic pulsing of a steady-state photometric standard. The units realized using the two
independent methods were intercompared, and the uncertainty of the luminous exposure unit
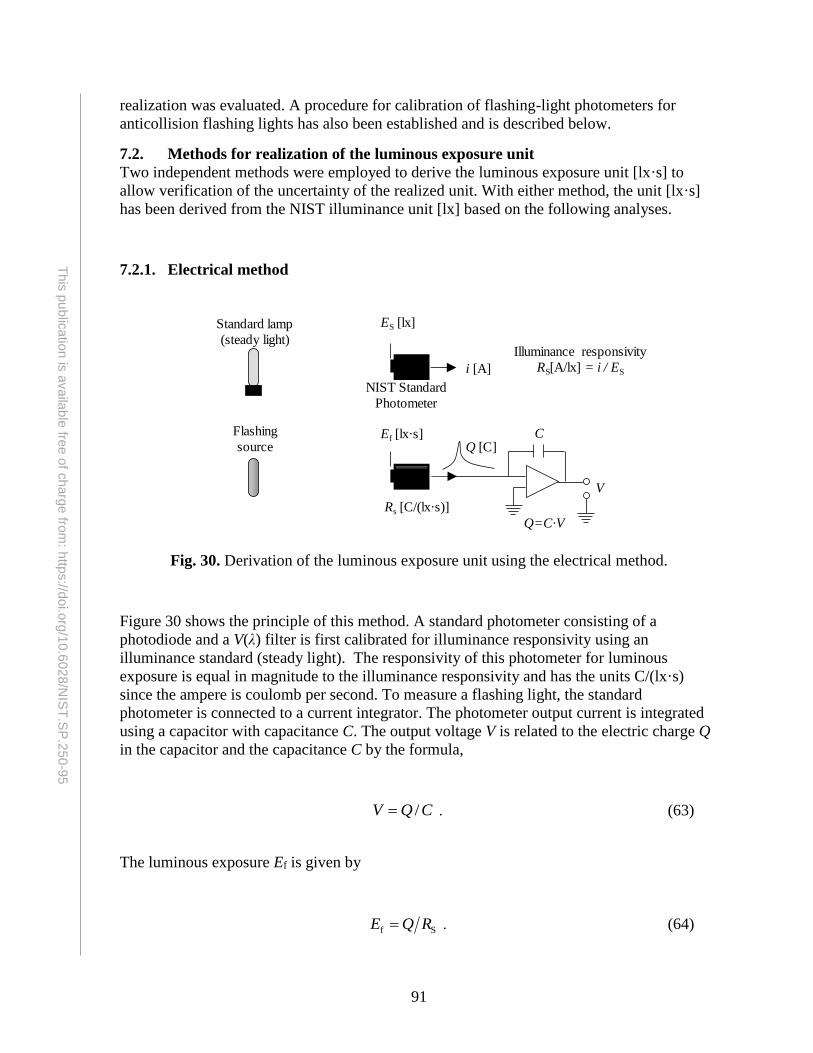
91
This
pu
blic
atio
n is
availa
ble
free o
f charg
e fro
m: h
ttps://d
oi.o
rg/1
0.6
028
/NIS
T.S
P.2
50-9
5
realization was evaluated. A procedure for calibration of flashing-light photometers for
anticollision flashing lights has also been established and is described below.
7.2. Methods for realization of the luminous exposure unit
Two independent methods were employed to derive the luminous exposure unit [lx·s] to
allow verification of the uncertainty of the realized unit. With either method, the unit [lx·s]
has been derived from the NIST illuminance unit [lx] based on the following analyses.
7.2.1. Electrical method
Fig. 30. Derivation of the luminous exposure unit using the electrical method.
Figure 30 shows the principle of this method. A standard photometer consisting of a
photodiode and a V(λ) filter is first calibrated for illuminance responsivity using an
illuminance standard (steady light). The responsivity of this photometer for luminous
exposure is equal in magnitude to the illuminance responsivity and has the units C/(lx·s)
since the ampere is coulomb per second. To measure a flashing light, the standard
photometer is connected to a current integrator. The photometer output current is integrated
using a capacitor with capacitance C. The output voltage V is related to the electric charge Q
in the capacitor and the capacitance C by the formula,
CQV / . (63)
The luminous exposure Ef is given by
Sf RQE . (64)
ES [lx]
i [A]
Ef [lx·s]
Rs [C/(lx·s)]
Standard lamp
(steady light)
Flashing
source
NIST Standard
Photometer
Illuminance responsivity
RS[A/lx] = i / ES
V
C
Q=C·V
Q [C]
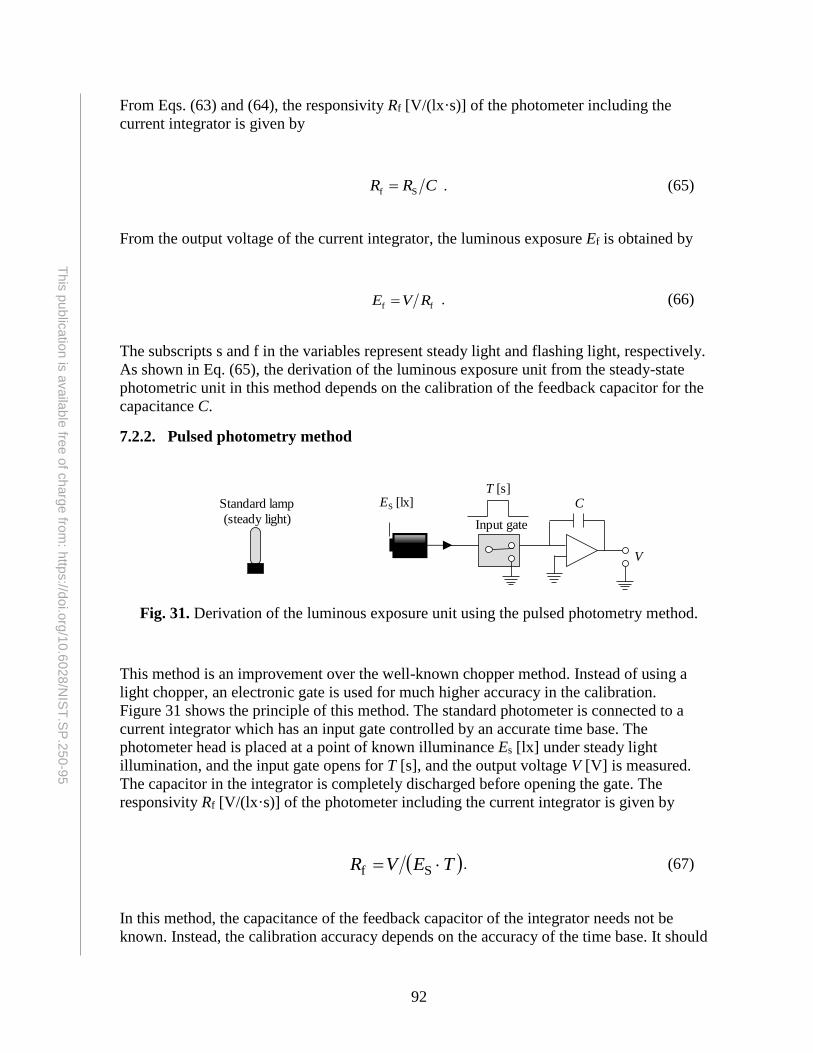
92
This
pu
blic
atio
n is
availa
ble
free o
f charg
e fro
m: h
ttps://d
oi.o
rg/1
0.6
028
/NIS
T.S
P.2
50-9
5
From Eqs. (63) and (64), the responsivity Rf [V/(lx·s)] of the photometer including the
current integrator is given by
CRR Sf . (65)
From the output voltage of the current integrator, the luminous exposure Ef is obtained by
ff RVE . (66)
The subscripts s and f in the variables represent steady light and flashing light, respectively.
As shown in Eq. (65), the derivation of the luminous exposure unit from the steady-state
photometric unit in this method depends on the calibration of the feedback capacitor for the
capacitance C.
7.2.2. Pulsed photometry method
Fig. 31. Derivation of the luminous exposure unit using the pulsed photometry method.
This method is an improvement over the well-known chopper method. Instead of using a
light chopper, an electronic gate is used for much higher accuracy in the calibration.
Figure 31 shows the principle of this method. The standard photometer is connected to a
current integrator which has an input gate controlled by an accurate time base. The
photometer head is placed at a point of known illuminance Es [lx] under steady light
illumination, and the input gate opens for T [s], and the output voltage V [V] is measured.
The capacitor in the integrator is completely discharged before opening the gate. The
responsivity Rf [V/(lx·s)] of the photometer including the current integrator is given by
TEVR Sf . (67)
In this method, the capacitance of the feedback capacitor of the integrator needs not be
known. Instead, the calibration accuracy depends on the accuracy of the time base. It should
ES [lx]Standard lamp
(steady light)
V
C
Input gate
T [s]
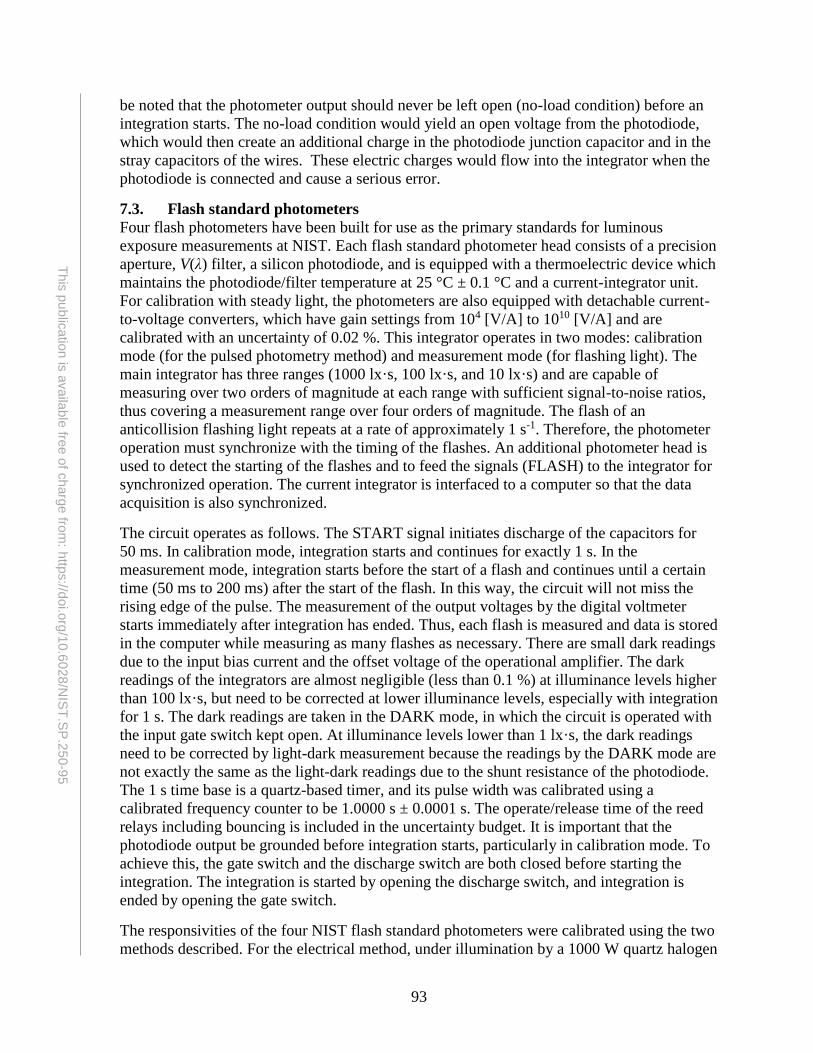
93
This
pu
blic
atio
n is
availa
ble
free o
f charg
e fro
m: h
ttps://d
oi.o
rg/1
0.6
028
/NIS
T.S
P.2
50-9
5
be noted that the photometer output should never be left open (no-load condition) before an
integration starts. The no-load condition would yield an open voltage from the photodiode,
which would then create an additional charge in the photodiode junction capacitor and in the
stray capacitors of the wires. These electric charges would flow into the integrator when the
photodiode is connected and cause a serious error.
7.3. Flash standard photometers
Four flash photometers have been built for use as the primary standards for luminous
exposure measurements at NIST. Each flash standard photometer head consists of a precision
aperture, V(λ) filter, a silicon photodiode, and is equipped with a thermoelectric device which
maintains the photodiode/filter temperature at 25 °C ± 0.1 °C and a current-integrator unit.
For calibration with steady light, the photometers are also equipped with detachable current-
to-voltage converters, which have gain settings from 104 [V/A] to 1010 [V/A] and are
calibrated with an uncertainty of 0.02 %. This integrator operates in two modes: calibration
mode (for the pulsed photometry method) and measurement mode (for flashing light). The
main integrator has three ranges (1000 lx·s, 100 lx·s, and 10 lx·s) and are capable of
measuring over two orders of magnitude at each range with sufficient signal-to-noise ratios,
thus covering a measurement range over four orders of magnitude. The flash of an
anticollision flashing light repeats at a rate of approximately 1 s-1. Therefore, the photometer
operation must synchronize with the timing of the flashes. An additional photometer head is
used to detect the starting of the flashes and to feed the signals (FLASH) to the integrator for
synchronized operation. The current integrator is interfaced to a computer so that the data
acquisition is also synchronized.
The circuit operates as follows. The START signal initiates discharge of the capacitors for
50 ms. In calibration mode, integration starts and continues for exactly 1 s. In the
measurement mode, integration starts before the start of a flash and continues until a certain
time (50 ms to 200 ms) after the start of the flash. In this way, the circuit will not miss the
rising edge of the pulse. The measurement of the output voltages by the digital voltmeter
starts immediately after integration has ended. Thus, each flash is measured and data is stored
in the computer while measuring as many flashes as necessary. There are small dark readings
due to the input bias current and the offset voltage of the operational amplifier. The dark
readings of the integrators are almost negligible (less than 0.1 %) at illuminance levels higher
than 100 lx·s, but need to be corrected at lower illuminance levels, especially with integration
for 1 s. The dark readings are taken in the DARK mode, in which the circuit is operated with
the input gate switch kept open. At illuminance levels lower than 1 lx·s, the dark readings
need to be corrected by light-dark measurement because the readings by the DARK mode are
not exactly the same as the light-dark readings due to the shunt resistance of the photodiode.
The 1 s time base is a quartz-based timer, and its pulse width was calibrated using a
calibrated frequency counter to be 1.0000 s ± 0.0001 s. The operate/release time of the reed
relays including bouncing is included in the uncertainty budget. It is important that the
photodiode output be grounded before integration starts, particularly in calibration mode. To
achieve this, the gate switch and the discharge switch are both closed before starting the
integration. The integration is started by opening the discharge switch, and integration is
ended by opening the gate switch.
The responsivities of the four NIST flash standard photometers were calibrated using the two
methods described. For the electrical method, under illumination by a 1000 W quartz halogen
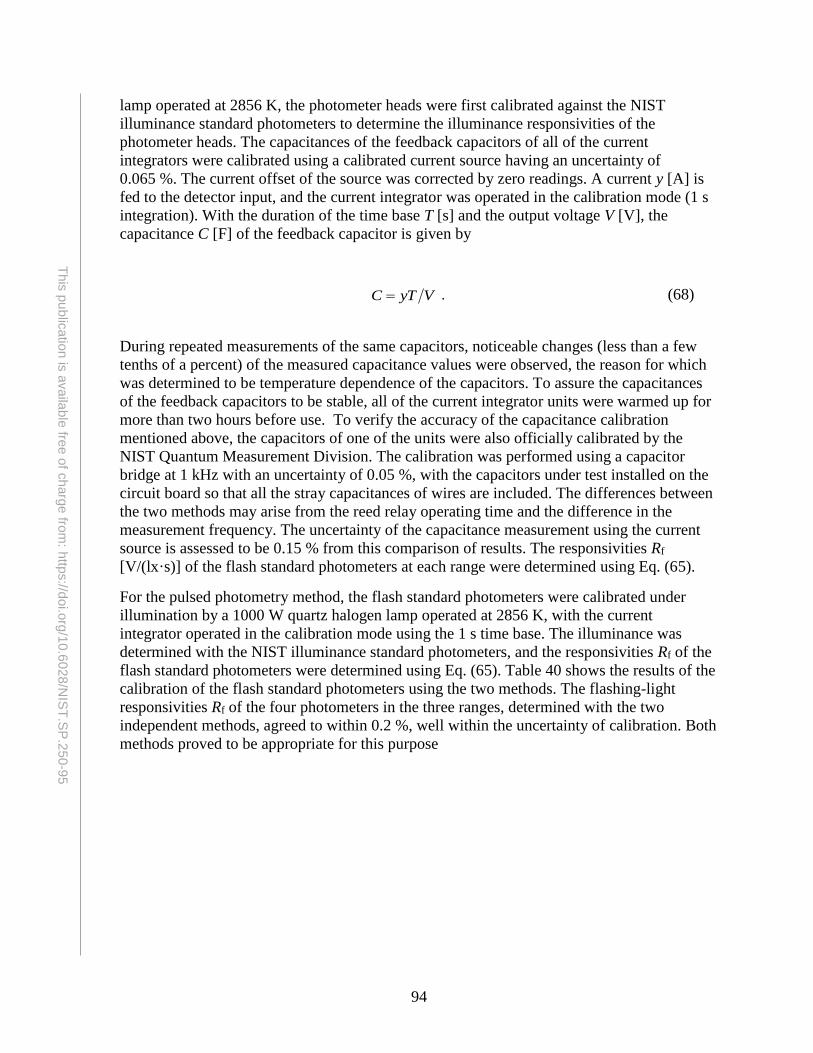
94
This
pu
blic
atio
n is
availa
ble
free o
f charg
e fro
m: h
ttps://d
oi.o
rg/1
0.6
028
/NIS
T.S
P.2
50-9
5
lamp operated at 2856 K, the photometer heads were first calibrated against the NIST
illuminance standard photometers to determine the illuminance responsivities of the
photometer heads. The capacitances of the feedback capacitors of all of the current
integrators were calibrated using a calibrated current source having an uncertainty of
0.065 %. The current offset of the source was corrected by zero readings. A current y [A] is
fed to the detector input, and the current integrator was operated in the calibration mode (1 s
integration). With the duration of the time base T [s] and the output voltage V [V], the
capacitance C [F] of the feedback capacitor is given by
VyTC . (68)
During repeated measurements of the same capacitors, noticeable changes (less than a few
tenths of a percent) of the measured capacitance values were observed, the reason for which
was determined to be temperature dependence of the capacitors. To assure the capacitances
of the feedback capacitors to be stable, all of the current integrator units were warmed up for
more than two hours before use. To verify the accuracy of the capacitance calibration
mentioned above, the capacitors of one of the units were also officially calibrated by the
NIST Quantum Measurement Division. The calibration was performed using a capacitor
bridge at 1 kHz with an uncertainty of 0.05 %, with the capacitors under test installed on the
circuit board so that all the stray capacitances of wires are included. The differences between
the two methods may arise from the reed relay operating time and the difference in the
measurement frequency. The uncertainty of the capacitance measurement using the current
source is assessed to be 0.15 % from this comparison of results. The responsivities Rf
[V/(lx·s)] of the flash standard photometers at each range were determined using Eq. (65).
For the pulsed photometry method, the flash standard photometers were calibrated under
illumination by a 1000 W quartz halogen lamp operated at 2856 K, with the current
integrator operated in the calibration mode using the 1 s time base. The illuminance was
determined with the NIST illuminance standard photometers, and the responsivities Rf of the
flash standard photometers were determined using Eq. (65). Table 40 shows the results of the
calibration of the flash standard photometers using the two methods. The flashing-light
responsivities Rf of the four photometers in the three ranges, determined with the two
independent methods, agreed to within 0.2 %, well within the uncertainty of calibration. Both
methods proved to be appropriate for this purpose
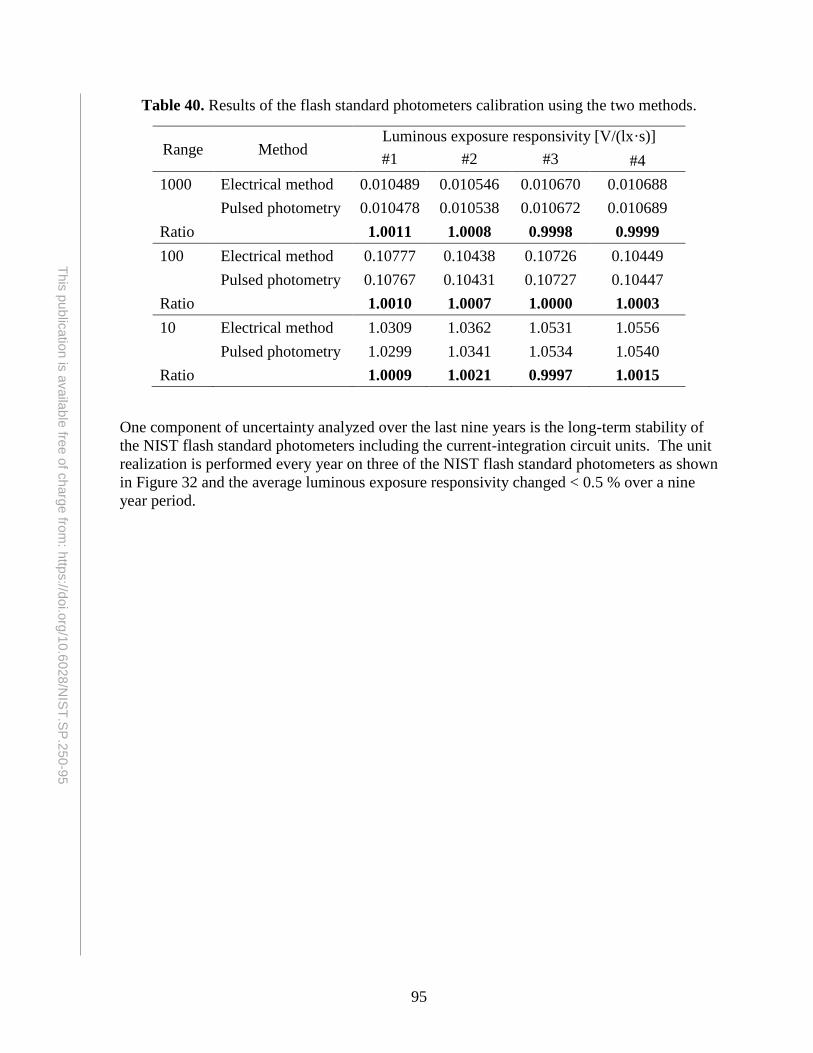
95
This
pu
blic
atio
n is
availa
ble
free o
f charg
e fro
m: h
ttps://d
oi.o
rg/1
0.6
028
/NIS
T.S
P.2
50-9
5
Table 40. Results of the flash standard photometers calibration using the two methods.
Range Method Luminous exposure responsivity [V/(lx·s)]
#1 #2 #3 #4
1000 Electrical method 0.010489 0.010546 0.010670 0.010688
Pulsed photometry 0.010478 0.010538 0.010672 0.010689
Ratio 1.0011 1.0008 0.9998 0.9999
100 Electrical method 0.10777 0.10438 0.10726 0.10449
Pulsed photometry 0.10767 0.10431 0.10727 0.10447
Ratio 1.0010 1.0007 1.0000 1.0003
10 Electrical method 1.0309 1.0362 1.0531 1.0556
Pulsed photometry 1.0299 1.0341 1.0534 1.0540
Ratio 1.0009 1.0021 0.9997 1.0015
One component of uncertainty analyzed over the last nine years is the long-term stability of
the NIST flash standard photometers including the current-integration circuit units. The unit
realization is performed every year on three of the NIST flash standard photometers as shown
in Figure 32 and the average luminous exposure responsivity changed < 0.5 % over a nine
year period.
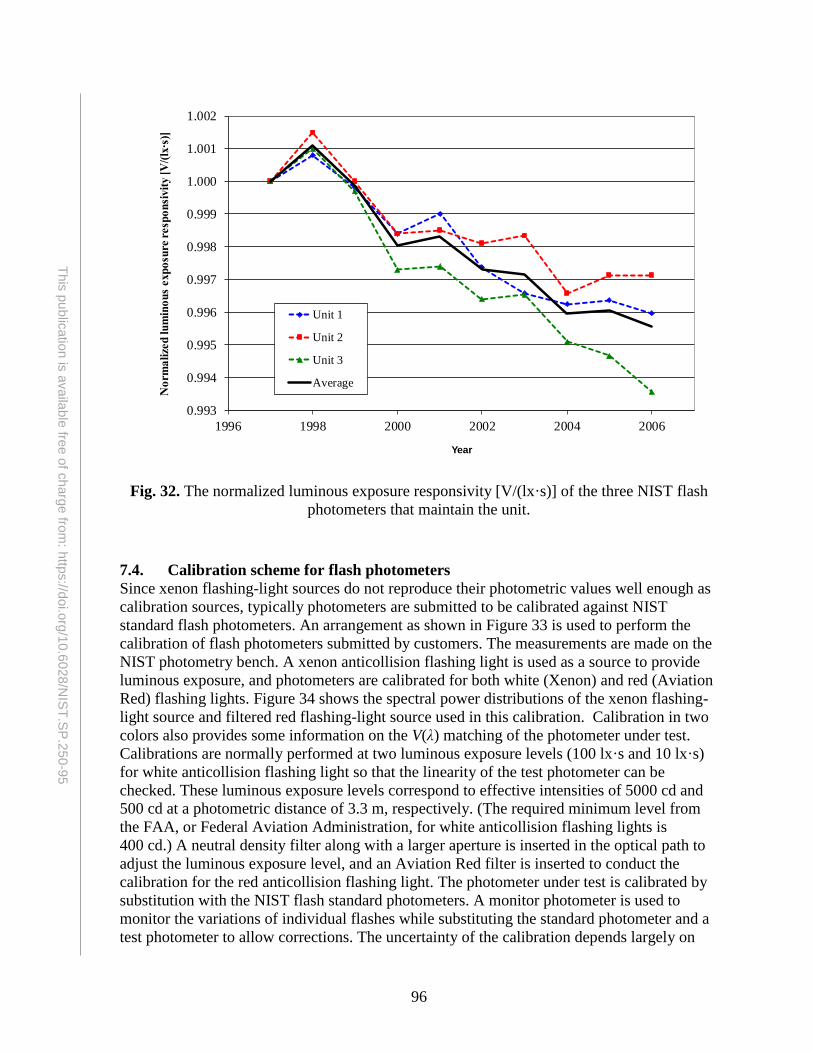
96
This
pu
blic
atio
n is
availa
ble
free o
f charg
e fro
m: h
ttps://d
oi.o
rg/1
0.6
028
/NIS
T.S
P.2
50-9
5
Fig. 32. The normalized luminous exposure responsivity [V/(lx·s)] of the three NIST flash
photometers that maintain the unit.
7.4. Calibration scheme for flash photometers
Since xenon flashing-light sources do not reproduce their photometric values well enough as
calibration sources, typically photometers are submitted to be calibrated against NIST
standard flash photometers. An arrangement as shown in Figure 33 is used to perform the
calibration of flash photometers submitted by customers. The measurements are made on the
NIST photometry bench. A xenon anticollision flashing light is used as a source to provide
luminous exposure, and photometers are calibrated for both white (Xenon) and red (Aviation
Red) flashing lights. Figure 34 shows the spectral power distributions of the xenon flashing-
light source and filtered red flashing-light source used in this calibration. Calibration in two
colors also provides some information on the V(λ) matching of the photometer under test.
Calibrations are normally performed at two luminous exposure levels (100 lx·s and 10 lx·s)
for white anticollision flashing light so that the linearity of the test photometer can be
checked. These luminous exposure levels correspond to effective intensities of 5000 cd and
500 cd at a photometric distance of 3.3 m, respectively. (The required minimum level from
the FAA, or Federal Aviation Administration, for white anticollision flashing lights is
400 cd.) A neutral density filter along with a larger aperture is inserted in the optical path to
adjust the luminous exposure level, and an Aviation Red filter is inserted to conduct the
calibration for the red anticollision flashing light. The photometer under test is calibrated by
substitution with the NIST flash standard photometers. A monitor photometer is used to
monitor the variations of individual flashes while substituting the standard photometer and a
test photometer to allow corrections. The uncertainty of the calibration depends largely on
0.993
0.994
0.995
0.996
0.997
0.998
0.999
1.000
1.001
1.002
1996 1998 2000 2002 2004 2006
No
rma
lize
d lu
min
ou
s exp
osu
re r
esp
on
sivit
y [
V/(
lx∙s
)]
Year
Unit 1
Unit 2
Unit 3
Average
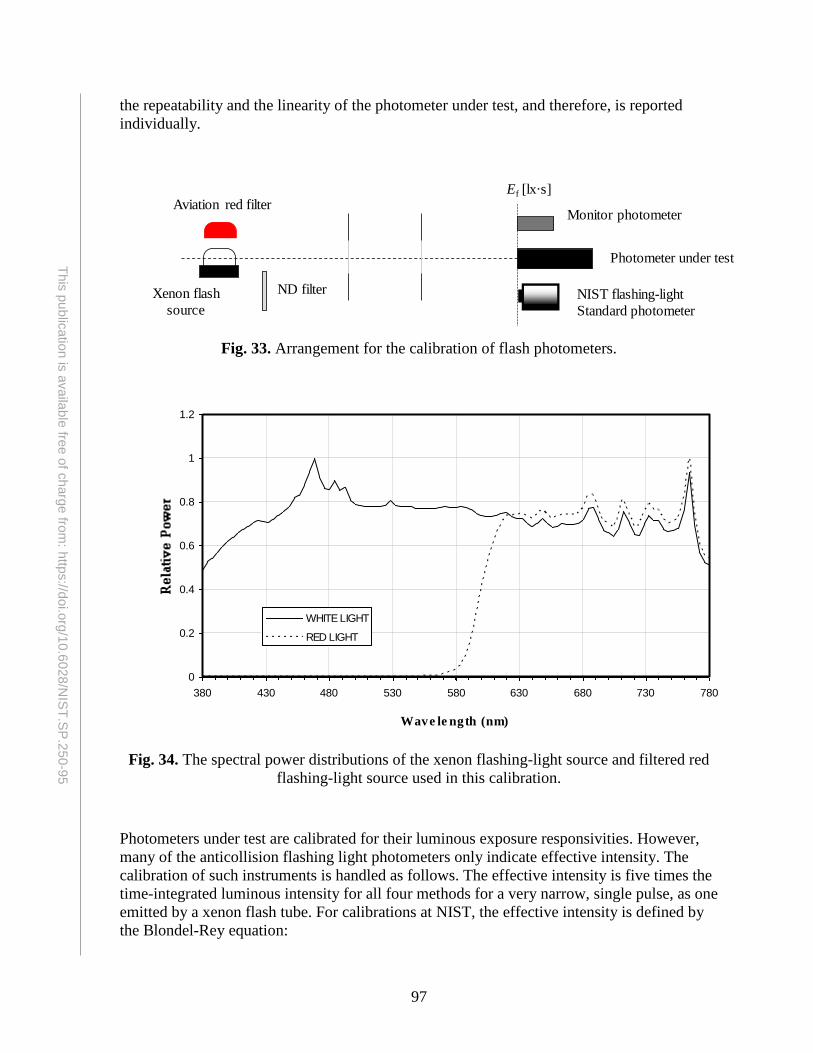
97
This
pu
blic
atio
n is
availa
ble
free o
f charg
e fro
m: h
ttps://d
oi.o
rg/1
0.6
028
/NIS
T.S
P.2
50-9
5
the repeatability and the linearity of the photometer under test, and therefore, is reported
individually.
Fig. 33. Arrangement for the calibration of flash photometers.
Fig. 34. The spectral power distributions of the xenon flashing-light source and filtered red
flashing-light source used in this calibration.
Photometers under test are calibrated for their luminous exposure responsivities. However,
many of the anticollision flashing light photometers only indicate effective intensity. The
calibration of such instruments is handled as follows. The effective intensity is five times the
time-integrated luminous intensity for all four methods for a very narrow, single pulse, as one
emitted by a xenon flash tube. For calibrations at NIST, the effective intensity is defined by
the Blondel-Rey equation:
Ef [lx·s]
Xenon flash
source
Aviation red filter
ND filter
Monitor photometer
Photometer under test
NIST flashing-light
Standard photometer
0
0.2
0.4
0.6
0.8
1
1.2
380 430 480 530 580 630 680 730 780
Wave le ngth (nm)
WHITE LIGHT
RED LIGHT

98
This
pu
blic
atio
n is
availa
ble
free o
f charg
e fro
m: h
ttps://d
oi.o
rg/1
0.6
028
/NIS
T.S
P.2
50-9
5
)2.0(
d)(
01e
1
0
tt
ttII
t
t
, (69)
where t0 is the start time and t1 is the end time of the flash. The term 0.2 s is the Blondel-Rey
constant. The effective intensity is defined as the luminous intensity of a steady-state light
source which gives equivalent detectability to that of a given pulse of light. If a flash
photometer indicates effective intensity, the photometric distance (the distance between the
photometer and the source) should be specified for the instrument. With the specified
photometric distance d, the luminous exposure Ef is calculated from the reading of the
effective intensity Ie by
2
01f )2.0( dIttE e . (70)
The duration (t1 - t0) can be neglected in the practical measurements of xenon anticollision
lights because the durations of most xenon anticollision lights are normally 1 ms or less and
because there is no clear definition of the duration of a flash. Also, many types of
commercial flash photometers are not equipped with a means to measure the duration of
flashes. Thus, photometers that only indicate effective intensity can be calibrated against
standard flash photometers for luminous exposure responsivities rather than against standard
sources of effective intensity. There is no need for measuring the real distance between the
calibration source and the photometer in the calibration setup, and the calibration source
needs not to have an excellent reproducibility since the calibration is performed using the
detector-based procedure. The reference plane of the test photometer head should be clearly
defined by the user so that it can be aligned precisely to the same position as that of the
standard flash photometer.
7.5. Uncertainty analysis of luminous exposure and flash photometer calibrations
The uncertainty analysis for the luminous exposure responsivity, Rf, of the NIST standard
flash photometer including the current integrator using the electrical method follows the
model.
Ls
f DC
RR
. (71)
where Rs is the illuminance responsivity of the NIST standard flash photometer calibrated
using a steady lamp, C is the capacitance of the feedback capacitor of the current integrator,
and DL is a correction factor for the linearity of the detector. The uncertainty budget for
luminous exposure responsivity using the electrical method is shown in Table 41.
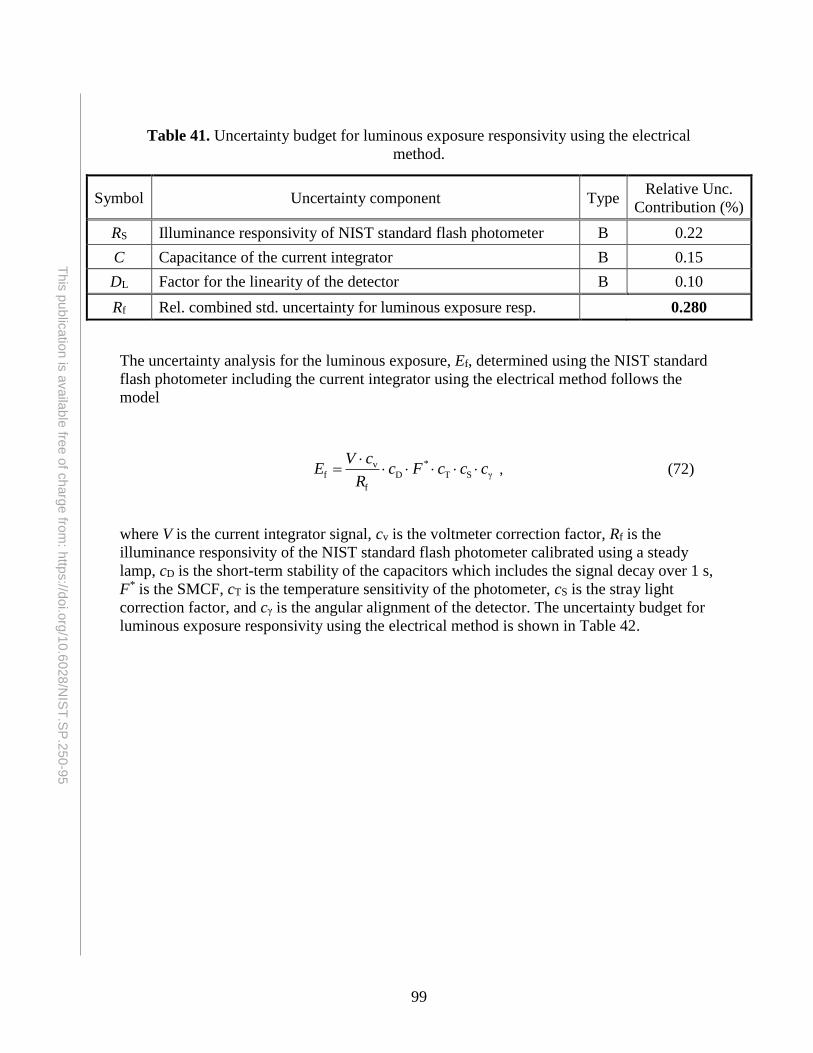
99
This
pu
blic
atio
n is
availa
ble
free o
f charg
e fro
m: h
ttps://d
oi.o
rg/1
0.6
028
/NIS
T.S
P.2
50-9
5
Table 41. Uncertainty budget for luminous exposure responsivity using the electrical
method.
Symbol Uncertainty component Type Relative Unc.
Contribution (%)
RS Illuminance responsivity of NIST standard flash photometer B 0.22
C Capacitance of the current integrator B 0.15
DL Factor for the linearity of the detector B 0.10
Rf Rel. combined std. uncertainty for luminous exposure resp. 0.280
The uncertainty analysis for the luminous exposure, Ef, determined using the NIST standard
flash photometer including the current integrator using the electrical method follows the
model
γST
*
D
f
vf cccFc
R
cVE
, (72)
where V is the current integrator signal, cv is the voltmeter correction factor, Rf is the
illuminance responsivity of the NIST standard flash photometer calibrated using a steady
lamp, cD is the short-term stability of the capacitors which includes the signal decay over 1 s,
F* is the SMCF, cT is the temperature sensitivity of the photometer, cS is the stray light
correction factor, and cγ is the angular alignment of the detector. The uncertainty budget for
luminous exposure responsivity using the electrical method is shown in Table 42.
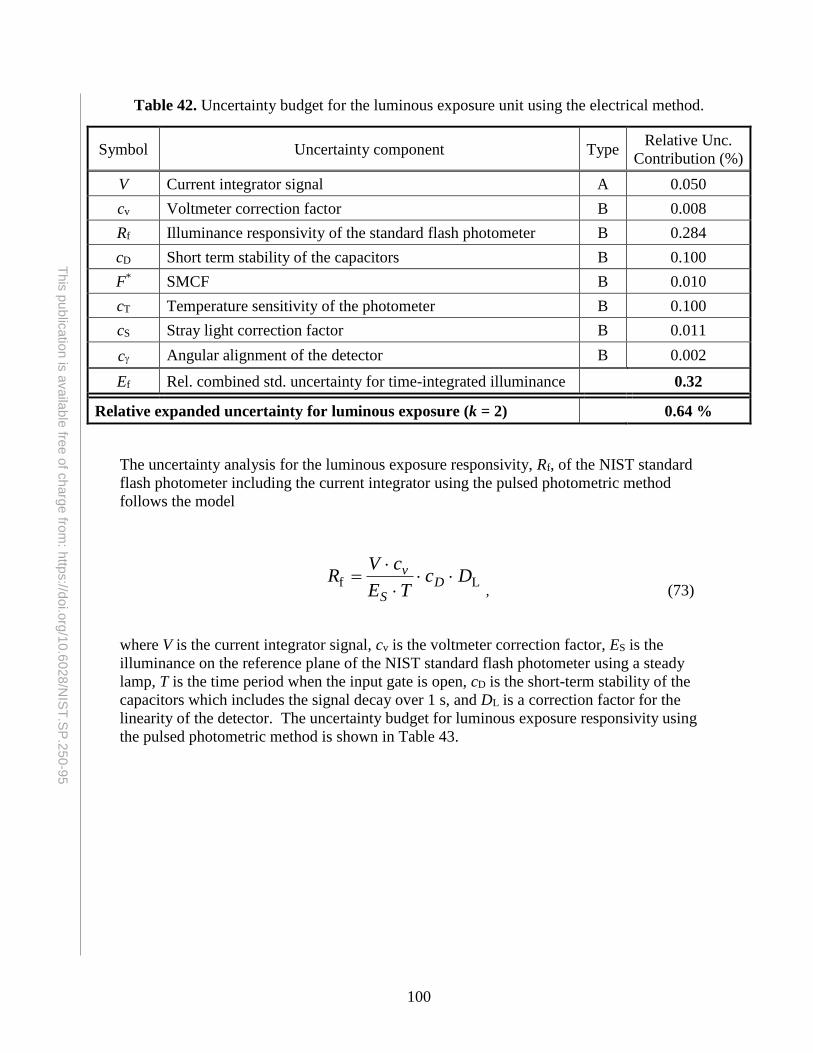
100
This
pu
blic
atio
n is
availa
ble
free o
f charg
e fro
m: h
ttps://d
oi.o
rg/1
0.6
028
/NIS
T.S
P.2
50-9
5
Table 42. Uncertainty budget for the luminous exposure unit using the electrical method.
Symbol Uncertainty component Type Relative Unc.
Contribution (%)
V Current integrator signal A 0.050
cv Voltmeter correction factor B 0.008
Rf Illuminance responsivity of the standard flash photometer B 0.284
cD Short term stability of the capacitors B 0.100
F* SMCF B 0.010
cT Temperature sensitivity of the photometer B 0.100
cS Stray light correction factor B 0.011
c Angular alignment of the detector B 0.002
Ef Rel. combined std. uncertainty for time-integrated illuminance 0.32
Relative expanded uncertainty for luminous exposure (k = 2) 0.64 %
The uncertainty analysis for the luminous exposure responsivity, Rf, of the NIST standard
flash photometer including the current integrator using the pulsed photometric method
follows the model
Lf Dc
TE
cVR D
S
v
, (73)
where V is the current integrator signal, cv is the voltmeter correction factor, ES is the
illuminance on the reference plane of the NIST standard flash photometer using a steady
lamp, T is the time period when the input gate is open, cD is the short-term stability of the
capacitors which includes the signal decay over 1 s, and DL is a correction factor for the
linearity of the detector. The uncertainty budget for luminous exposure responsivity using
the pulsed photometric method is shown in Table 43.
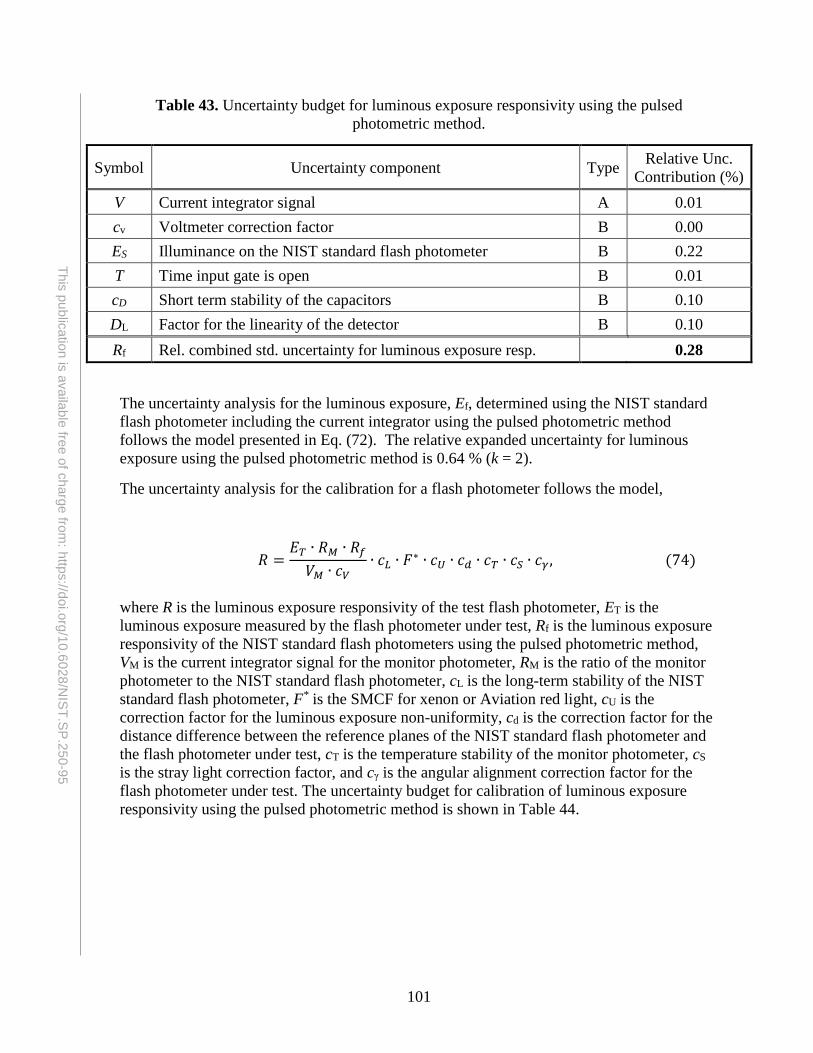
101
This
pu
blic
atio
n is
availa
ble
free o
f charg
e fro
m: h
ttps://d
oi.o
rg/1
0.6
028
/NIS
T.S
P.2
50-9
5
Table 43. Uncertainty budget for luminous exposure responsivity using the pulsed
photometric method.
Symbol Uncertainty component Type Relative Unc.
Contribution (%)
V Current integrator signal A 0.01
cv Voltmeter correction factor B 0.00
ES Illuminance on the NIST standard flash photometer B 0.22
T Time input gate is open B 0.01
cD Short term stability of the capacitors B 0.10
DL Factor for the linearity of the detector B 0.10
Rf Rel. combined std. uncertainty for luminous exposure resp. 0.28
The uncertainty analysis for the luminous exposure, Ef, determined using the NIST standard
flash photometer including the current integrator using the pulsed photometric method
follows the model presented in Eq. (72). The relative expanded uncertainty for luminous
exposure using the pulsed photometric method is 0.64 % (k = 2).
The uncertainty analysis for the calibration for a flash photometer follows the model,
𝑅 =𝐸𝑇 ∙ 𝑅𝑀 ∙ 𝑅𝑓
𝑉𝑀 ∙ 𝑐𝑉∙ 𝑐𝐿 ∙ 𝐹∗ ∙ 𝑐𝑈 ∙ 𝑐𝑑 ∙ 𝑐𝑇 ∙ 𝑐𝑆 ∙ 𝑐𝛾, (74)
where R is the luminous exposure responsivity of the test flash photometer, ET is the
luminous exposure measured by the flash photometer under test, Rf is the luminous exposure
responsivity of the NIST standard flash photometers using the pulsed photometric method,
VM is the current integrator signal for the monitor photometer, RM is the ratio of the monitor
photometer to the NIST standard flash photometer, cL is the long-term stability of the NIST
standard flash photometer, F* is the SMCF for xenon or Aviation red light, cU is the
correction factor for the luminous exposure non-uniformity, cd is the correction factor for the
distance difference between the reference planes of the NIST standard flash photometer and
the flash photometer under test, cT is the temperature stability of the monitor photometer, cS
is the stray light correction factor, and cγ is the angular alignment correction factor for the
flash photometer under test. The uncertainty budget for calibration of luminous exposure
responsivity using the pulsed photometric method is shown in Table 44.
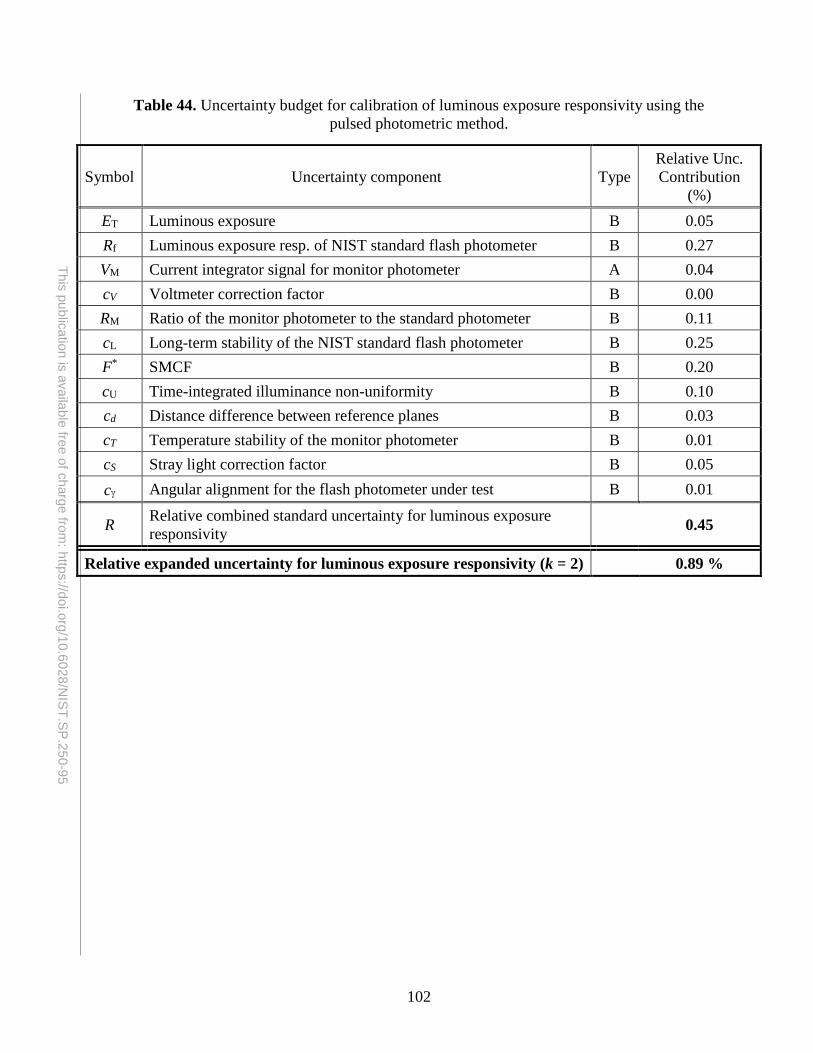
102
This
pu
blic
atio
n is
availa
ble
free o
f charg
e fro
m: h
ttps://d
oi.o
rg/1
0.6
028
/NIS
T.S
P.2
50-9
5
Table 44. Uncertainty budget for calibration of luminous exposure responsivity using the
pulsed photometric method.
Symbol Uncertainty component Type
Relative Unc.
Contribution
(%)
ET Luminous exposure B 0.05
Rf Luminous exposure resp. of NIST standard flash photometer B 0.27
VM Current integrator signal for monitor photometer A 0.04
cV Voltmeter correction factor B 0.00
RM Ratio of the monitor photometer to the standard photometer B 0.11
cL Long-term stability of the NIST standard flash photometer B 0.25
F* SMCF B 0.20
cU Time-integrated illuminance non-uniformity B 0.10
cd Distance difference between reference planes B 0.03
cT Temperature stability of the monitor photometer B 0.01
cS Stray light correction factor B 0.05
c Angular alignment for the flash photometer under test B 0.01
R Relative combined standard uncertainty for luminous exposure
responsivity 0.45
Relative expanded uncertainty for luminous exposure responsivity (k = 2) 0.89 %
103
This
pu
blic
atio
n is
availa
ble
free o
f charg
e fro
m: h
ttps://d
oi.o
rg/1
0.6
028
/NIS
T.S
P.2
50-9
5
References
[1] Booker, R.L. and McSparron, D.A., “Photometric Calibrations,” NBS Special Publication
250-15 (1987).
[2] Cromer, C.L., Eppeldauer, G., Hardis, J.E., Larason, T.C. and Parr, A.C., “National
Institute of Standards and Technology detector-based photometric scale,” Applied Optics,
32-16, 2936-2948 (1993).
[3] Ohno, Y., Cromer, C.L., Hardis, J.E., and Eppeldauer, G., “The Detector-based Candela
Scale and Related Photometric Calibration Procedures at NIST,” The Journal of the
Illuminating Engineering Society of North America, 23-1, 88-98 (1994).
[4] Ohno, Y., “Detector-Based Luminous Flux Calibration using the Absolute Integrating-
Sphere Method,” Metrologia, 35-4, 473-478 (1998).
[5] Taylor, B.N. and Kuyatt, C.E., “Guidelines for Evaluating and Expressing the
Uncertainty of NIST Measurement Results,” NIST Technical Note 1297 (1994).
[6] NIST, “Calibration Services Users Guide SP 250 Appendix Fee Schedule,” Special
Publication 250,
https://www.nist.gov/sites/default/files/documents/2017/01/13/feeschedule2017.pdf.
[7] CIE Compte Rendu, p. 67 (1924).
[8] CIE Compte Rendu, Table II, pp. 25-26 (1931).
[9] CIE, “Colorimetry – Part 1:CIE Standard Colorimetric Observers,” CIE Standard S014-
1/E:2006 (2006).
[10] CIE, “The Basis of Physical Photometry,” CIE Publication No.18.2 (1983).
[11] CIPM, Comité Consultatif de Photométrie et Radiométrie 10e Session–1982, Bureau
International Des Poids et Mesures, Pavillon de Breteuil, F-92310, Sèvres, France (1982).
The same content is published in BIPM Monographie - Principles Governing Photometry
(1983), Bureau International Des Poids et Mesures, Pavillon de Breteuil, F-92310,
Sèvres, France.
[12] CIE Disk D001 Photometric and Colorimetric Tables (1988).
[13] CGPM, “Comptes Rendus des Séances de la 16e Conférence Générale des Poids et
Mesures,” Paris, Bureau International des Poids et Mesures, F-92310 Sèvres, France, p.
10 (1979).
[14] CIE Compte Rendu, Vol. 3, Table II, pp. 37-39 (1951).
[15] CIPM Procés-Verbaux 44, 4 (1976).
[16] CIE, “Mesopic photometry: History, special problems and practical solutions,” CIE
Publication No. 81 (1989).
[17] CIE, “Vision and Lighting in Mesopic Conditions,” Proceedings of the CIE Symposium,
CIE x028:2005, León, Spain (2005).
[18] CIE, “CIE International Lighting Vocabulary,” CIE Publication No. 17.4 (1987).
[19] ISO, “Quantities and units: ISO Standards Handbook,” Third edition (1993).
[20] Taylor, B.N., Editor, “Interpretation of the SI for the United States and Metric
Conversion Policy for Federal Agencies,” NIST Special Publication 814, (1991).
[21] Taylor, B.N., “Guide for the use of the International System of Units (SI),” NIST Special
Publication 811, (1995).
[22] Illuminating Engineering Society of North America, “The IESNA Lighting Handbook
9th Edition: Appendix,” pp. 5-7 (2000).
[23] Walker, J.H., Saunders, R.D., Jackson, J.K., and McSparron, D.A., “Spectral Irradiance
Calibrations,” NBS Special Publication 250-20 (1987).
104
This
pu
blic
atio
n is
availa
ble
free o
f charg
e fro
m: h
ttps://d
oi.o
rg/1
0.6
028
/NIS
T.S
P.2
50-9
5
[24] Yoon, H.W., Gibson, C.E., and Barnes, P.Y., “The realization of the NIST Detector-
based Spectral Irradiance Scale,” Metrologia, 40, S172-S176 (2003).
[25] Mielenz, K.D., Saunders, R. D., Parr, A. C., and Hsia, J. J., “The new international
temperature scale of 1990 and its effect on radiometric, photometric, and colorimetric
measurements and standards,” CIE Proceedings 22nd Session 1-1, Melbourne 1991,
Div.2, 65-68 (1991).
[26] Houston, J.M., Rice, J.P., “NIST reference cryogenic radiometer designed for versatile
performance,” Metrologia, 43, S31-S35 (2006).
[27] Gentile, T.R., Houston, J.M., Hardis, J.E., Cromer, C.L., and Parr, A.C., “The NIST
High-Accuracy Cryogenic Radiometer,” Applied Optics 35-7, 1056-1068 (1996).
[28] Larason, T.C., Bruce, S.S., and Parr, A.C., “Spectroradiometric Detector Measurements:
Part I - Ultraviolet Detectors and Part II: Visible to Near-Infrared Detectors,” NIST
Special Publications 250-41, U.S. Government Printing Office, Washington, D.C.
(1998).
[29] Physikalisch-Technische Bundesanstalt (PTB), PTB Report, PTB-Opt-62 (1999).
[30] Ohno, Y., “Integrating Sphere Simulation - Application to Total Flux Scale Realization,”
Applied Optics, 33-13, 2637-2647 (1994).
[31] Ohno, Y., “New Method for Realizing a Total Luminous Flux Scale using an Integrating
Sphere with an External Source,” The Journal of the Illuminating Engineering Society of
North America, 24-1, 106-115 (1995).
[32] Ohno, Y., “Realization of NIST Luminous Flux Scale Using an Integrating Sphere with
an External Source,” CIE Proceedings, 23rd Session, New Delhi (1995).
[33] Ohno, Y., “Realization of NIST 1995 Luminous Flux Scale using Integrating Sphere
Method,” The Journal of the Illuminating Engineering Society of North America, 25-1,
13-22 (1996).
[34] Ohno, Y. and Zong, Y., “Detector-Based Integrating Sphere Photometry,” Proceedings,
CIE 24th Session – Warsaw’99, 155 – 160 (1999).
[35] White House Commission on Aviation Safety and Security, “Final Report to President
Clinton,” (February 1997).
[36] SAE, “Minimum Performance Standard for Anticollision Light Systems,” AS 8017A
(1986).
[37] CIE, “International Lighting Vocabulary,” CIE Publication No.17.4 (1987).
[38] Allard, M.E. “Mémoire sur l’Intensité et la Portée des Phares,” Imprimerie Nationale,
Paris 62-73 (1876).
[39] A. Blondel and J. Rey, “Sur la perception des lumiéres bréves à la limite de leur portée.”
Journal de Physique, juillet et aout, 643 (1911).
[40] H.J. Schmidt-Clausen, “The influence of the angular size, adaptation luminance, pulse
shape and light colur on the Blondel-Rey constant a.” The perception and application of
flashing lights, 95-111, Adam Hilger, London (1971).
[41] Ohno, Y. and Couzin, D. “Modified Allard Method for Effective Intensity of Flashing
Lights,” Proceedings of the CIE Expert Symposium 2002, Veszprém, Hungary (2002).
[42] Y. Ohno and Y. Zong, “Establishment of the NIST Flashing Light Photometric Unit,”
Proceedings of the SPIE: Photometric Engineering of Sources and Systems, 3140, 2-11
1997.
[43] CIE, “Colorimetry – Part 2:CIE Standard Illuminants,” CIE Standard S014-2/E:2006
(2006).
105
This
pu
blic
atio
n is
availa
ble
free o
f charg
e fro
m: h
ttps://d
oi.o
rg/1
0.6
028
/NIS
T.S
P.2
50-9
5
[44] Fowler, J.B., and Litorja, M., “Geometric Area Measurements of Circular Apertures for
Radiometry at NIST,” Metrologia, 40, no. 1, S9-S12 (2003).
[45] Eppeldauer, G. and Hardis, J.E., “Fourteen-decade photocurrent measurements with
large-area silicon photodiodes at room temperature,” Applied Optics, 30-22, 3091-3099
(1991).
[46] Eppeldauer, G., “Temperature Monitored/Controlled Silicon Photodiodes for
Standardization,” Surveillance Technologies, SPIE Proceedings 1479, 71-77 (1991).
[47] Stearns, E.I and Stearns, R.E, “An example of a method for correcting radiance data for
bandpass error,” Color Research and Application, 13, 257-259 (1988).
[48] CIE, “Methods of characterizing illuminance meters and luminance meters,” CIE
Publication No. 69 (1987).
[49] Thompson, A. and Chen, H., “Beamcon III, a Linearity Measurement Instrument for
Optical Detectors,” Journal of Research of the National Institute of Standards and
Technology, 99-6: 751-755 (1994).
[50] Eppeldauer, G. and Hardis, J.E., “Fourteen-decade photocurrent measurements with
large-area silicon photodiodes at room temperature,” Applied Optics, 30-22, 3091-3099
(1991).
[51] ISO, “Guide to the Expression of Uncertainty in Measurement” (1995).
[52] ISO, “General requirements for the competence of testing and calibration laboratories,”
ISO/IEC 17025, Geneva, Switzerland (2005).
[53] Ohno, Y., “High Illuminance Calibration Facility and Procedures,” The Journal of the
Illuminating Engineering Society of North America, 27(2) (1998).
[54] CIE, “Measurements of Luminous Flux,” CIE Publication No.84 (1987).
[55] Ohno, Y., Köhler, R., and Stock, M., “AC/DC Technique for the Absolute Integrating
Sphere Method,” Metrologia, 37, 583-586 (2000).
[56] Venable, W.H., Hsia, J.J., and Weidner, V.R., “Establishing a Scale of Directional-
Hemispherical Reflectance Factor I: The Van den Akker Method,” Journal of Research
of the National Bureau of Standards, 82-1:29-55 (1977).
[57] IES, “IES Guide to Lamp Seasoning,” IES LM-54-12, New York, New York (2012).
[58] IES, “IES Approved Method for the Electrical and Photometric Measurements of
Fluorescent Lamps,” LM-9-1999 (1999).
[59] ANSI, “Fluorescent Lamps – Guide for Electrical Measurements,” C78.375-2004
(2004).
[60] ANSI, “Double-Capped Fluorescent Lamps - Dimensional and Electrical
Characteristics,” ANSI_IEC C78.81-2005 (2005).
[61] ANSI, “Reference Ballasts for Fluorescent Lamps,” C82.3-2002 (2002).
[62] IES, Understanding and Controlling the Effects of Temperature on Fluorescent Lamp
Systems,” TM-6-1996 (1996).
[63] Blevin, W.R., “Diffraction Losses in Radiometry and Photometry,” Metrologia, 7, 39-44
(1970).
[64] CIE, “CIE Collection in Photometry and Radiometry,” CIE Publication No.114 (1994).
[65] CIE, “Colorimetry,” CIE Publication No. 15, 3rd edition, Vienna, Austria (2004).
[66] Ohno, Y. and Jackson, J. K., “Characterization of modified FEL quartz-halogen lamps
for photometric standards,” Metrologia, 32-6, 693-696 (1996).
[67] J.L. Gardner, “Uncertainty Propagation for NIST Visible Spectral Standards,” Journal of
Research of the National Institute of Standards and Technology, 109, 305-318 (2004).
106
This
pu
blic
atio
n is
availa
ble
free o
f charg
e fro
m: h
ttps://d
oi.o
rg/1
0.6
028
/NIS
T.S
P.2
50-9
5
[68] J. L. Gardner, Correlated colour temperature—uncertainty and estimation, Metrologia
37, 381-384 (2000).
[69] J. Fontecha, J. Campos, A. Corrons, and A. Pons, “An analytical method for estimating
correlated colour temperature uncertainty,” Metrologia 39, 53-536 (2002).
[70] Zong, Y., Brown, S.W., Johnson, B.C., Lykke, K.R., and Ohno, Y., “Simple spectral
stray light correction method for array spectroradiometers,” Applied Optics, 45, Issue 6,
pp. 1111-1119 (2006). https://doi.org/10.1364/AO.45.001111
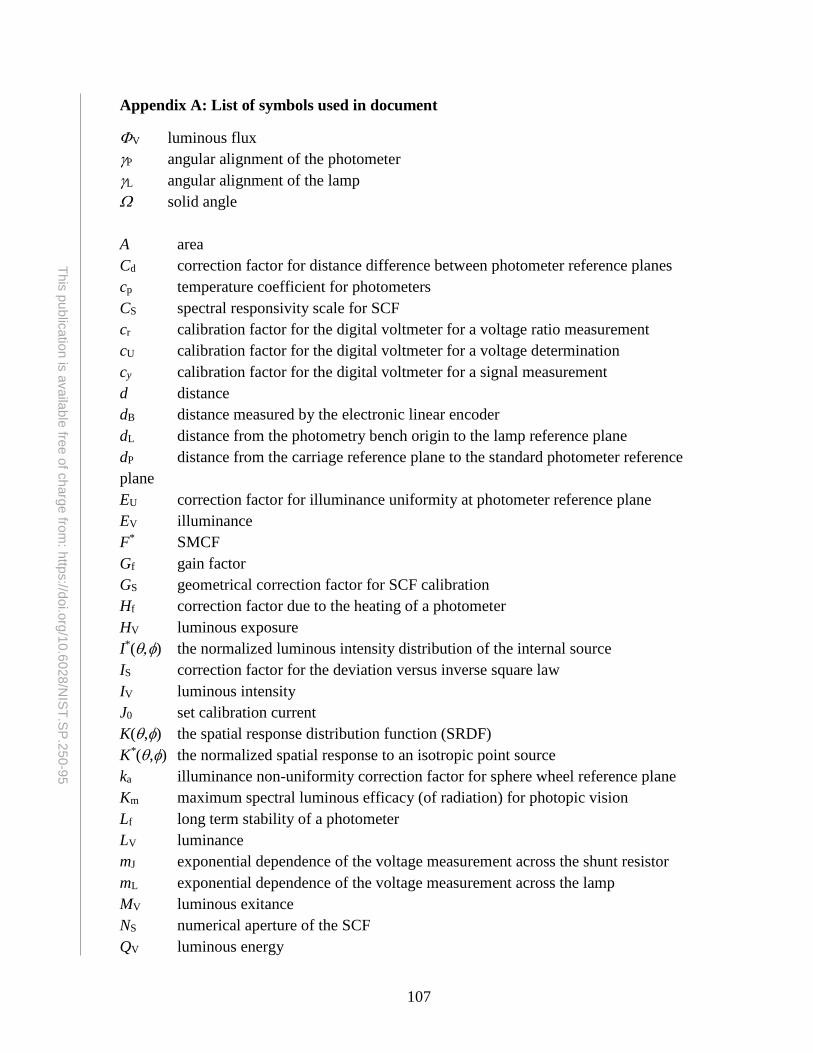
107
This
pu
blic
atio
n is
availa
ble
free o
f charg
e fro
m: h
ttps://d
oi.o
rg/1
0.6
028
/NIS
T.S
P.2
50-9
5
Appendix A: List of symbols used in document
V luminous flux
P angular alignment of the photometer
L angular alignment of the lamp
solid angle
A area
Cd correction factor for distance difference between photometer reference planes
cp temperature coefficient for photometers
CS spectral responsivity scale for SCF
cr calibration factor for the digital voltmeter for a voltage ratio measurement
cU calibration factor for the digital voltmeter for a voltage determination
cy calibration factor for the digital voltmeter for a signal measurement
d distance
dB distance measured by the electronic linear encoder
dL distance from the photometry bench origin to the lamp reference plane
dP distance from the carriage reference plane to the standard photometer reference
plane
EU correction factor for illuminance uniformity at photometer reference plane
EV illuminance
F* SMCF
Gf gain factor
GS geometrical correction factor for SCF calibration
Hf correction factor due to the heating of a photometer
HV luminous exposure
I*() the normalized luminous intensity distribution of the internal source
IS correction factor for the deviation versus inverse square law
IV luminous intensity
J0 set calibration current
K(,) the spatial response distribution function (SRDF)
K*(,) the normalized spatial response to an isotropic point source
ka illuminance non-uniformity correction factor for sphere wheel reference plane
Km maximum spectral luminous efficacy (of radiation) for photopic vision
Lf long term stability of a photometer
LV luminance
mJ exponential dependence of the voltage measurement across the shunt resistor
mL exponential dependence of the voltage measurement across the lamp
MV luminous exitance
NS numerical aperture of the SCF
QV luminous energy
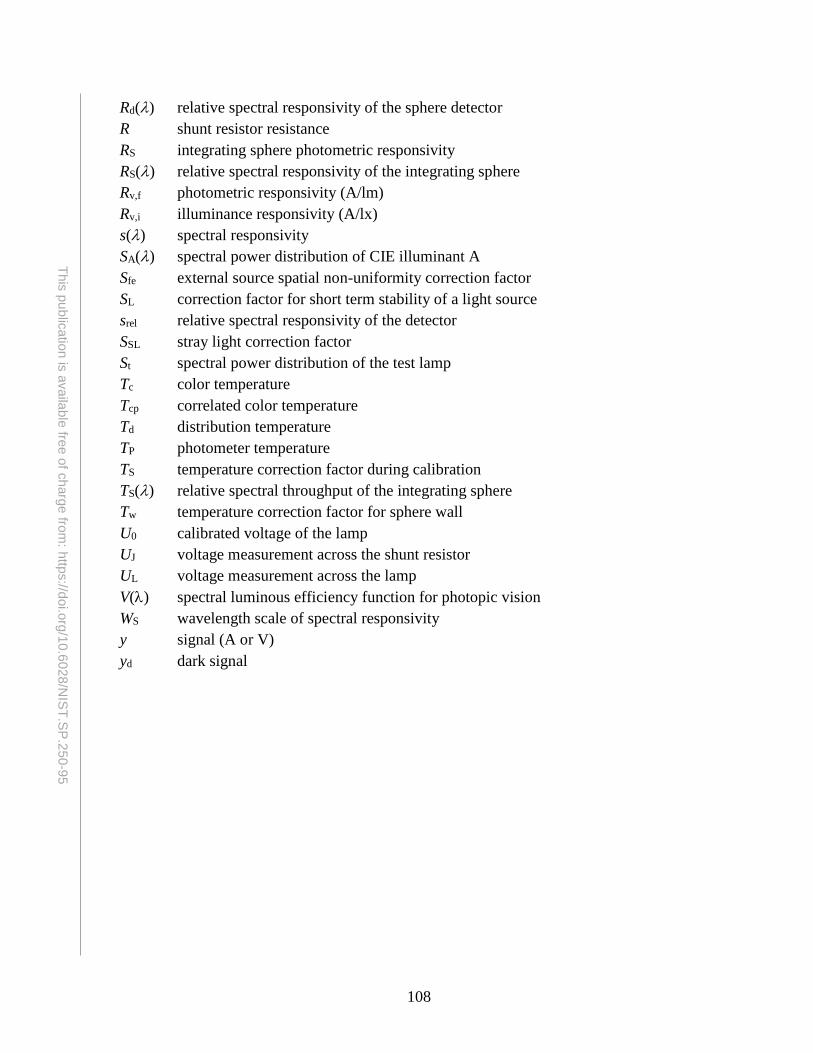
108
This
pu
blic
atio
n is
availa
ble
free o
f charg
e fro
m: h
ttps://d
oi.o
rg/1
0.6
028
/NIS
T.S
P.2
50-9
5
Rd() relative spectral responsivity of the sphere detector
R shunt resistor resistance
RS integrating sphere photometric responsivity
RS() relative spectral responsivity of the integrating sphere
Rv,f photometric responsivity (A/lm)
Rv,i illuminance responsivity (A/lx)
s() spectral responsivity
SA() spectral power distribution of CIE illuminant A
Sfe external source spatial non-uniformity correction factor
SL correction factor for short term stability of a light source
srel relative spectral responsivity of the detector
SSL stray light correction factor
St spectral power distribution of the test lamp
Tc color temperature
Tcp correlated color temperature
Td distribution temperature
TP photometer temperature
TS temperature correction factor during calibration
TS() relative spectral throughput of the integrating sphere
Tw temperature correction factor for sphere wall
U0 calibrated voltage of the lamp
UJ voltage measurement across the shunt resistor
UL voltage measurement across the lamp
V() spectral luminous efficiency function for photopic vision
WS wavelength scale of spectral responsivity
y signal (A or V)
yd dark signal
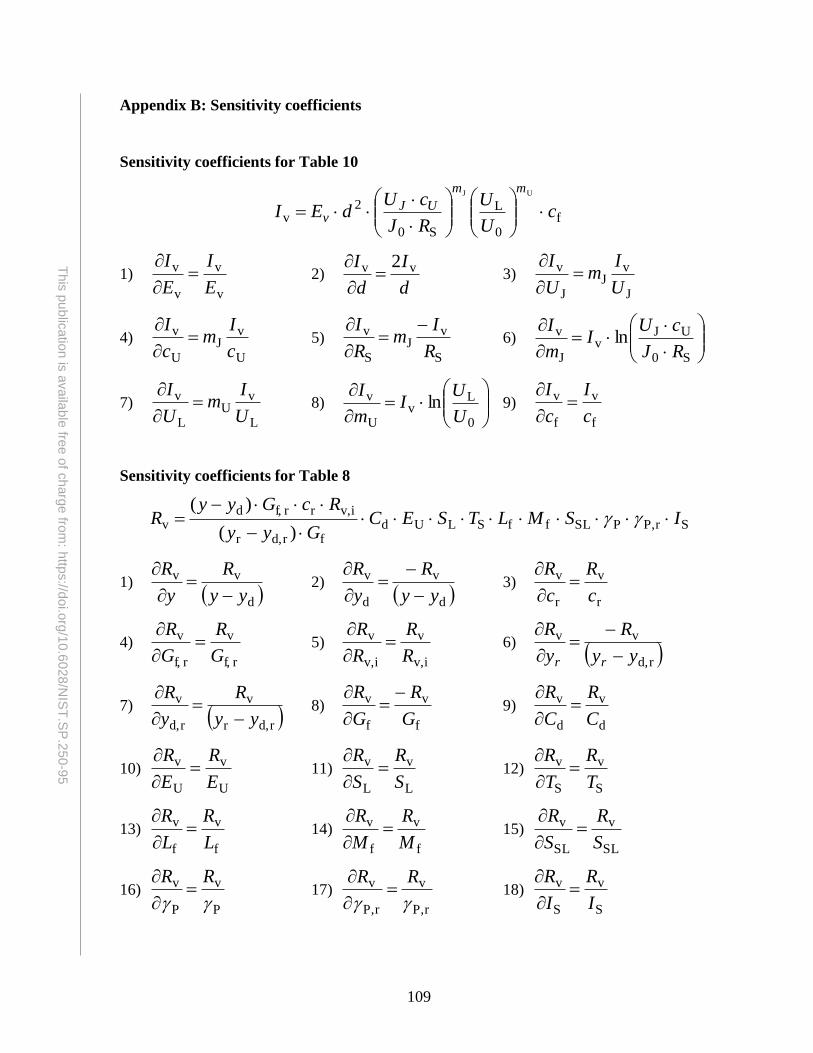
109
This
pu
blic
atio
n is
availa
ble
free o
f charg
e fro
m: h
ttps://d
oi.o
rg/1
0.6
028
/NIS
T.S
P.2
50-9
5
Appendix B: Sensitivity coefficients
Sensitivity coefficients for Table 10
f0
L
S0
2v
UJ
cU
U
RJ
cUdEI
mm
UJv
1)
v
v
v
v
E
I
E
I
2)
d
I
d
I vv 2
3)
J
vJ
J
v
U
Im
U
I
4)
U
vJ
U
v
c
Im
c
I
5)
S
vJ
S
v
R
Im
R
I
6)
S0
UJv
J
v lnRJ
cUI
m
I
7)
L
vU
L
v
U
Im
U
I
8)
0
Lv
U
v lnU
UI
m
I 9)
f
v
f
v
c
I
c
I
Sensitivity coefficients for Table 8
SrP,PSLffSLUdfrd,r
iv,rrf,dv
)(
)(ISMLTSEC
Gyy
RcGyyR
1) d
vv
yy
R
y
R
2)
d
v
d
v
yy
R
y
R
3)
r
v
r
v
c
R
c
R
4)
rf,
v
rf,
v
G
R
G
R
5)
iv,
v
iv,
v
R
R
R
R
6)
rd,
vv
yy
R
y
R
rr
7) rd,r
v
rd,
v
yy
R
y
R
8)
f
v
f
v
G
R
G
R
9)
d
v
d
v
C
R
C
R
10)
U
v
U
v
E
R
E
R
11)
L
v
L
v
S
R
S
R
12)
S
v
S
v
T
R
T
R
13)
f
v
f
v
L
R
L
R
14)
f
v
f
v
M
R
M
R
15)
SL
v
SL
v
S
R
S
R
16)
P
v
P
v
RR
17)
rP,
v
rP,
v
RR
18)
S
v
S
v
I
R
I
R
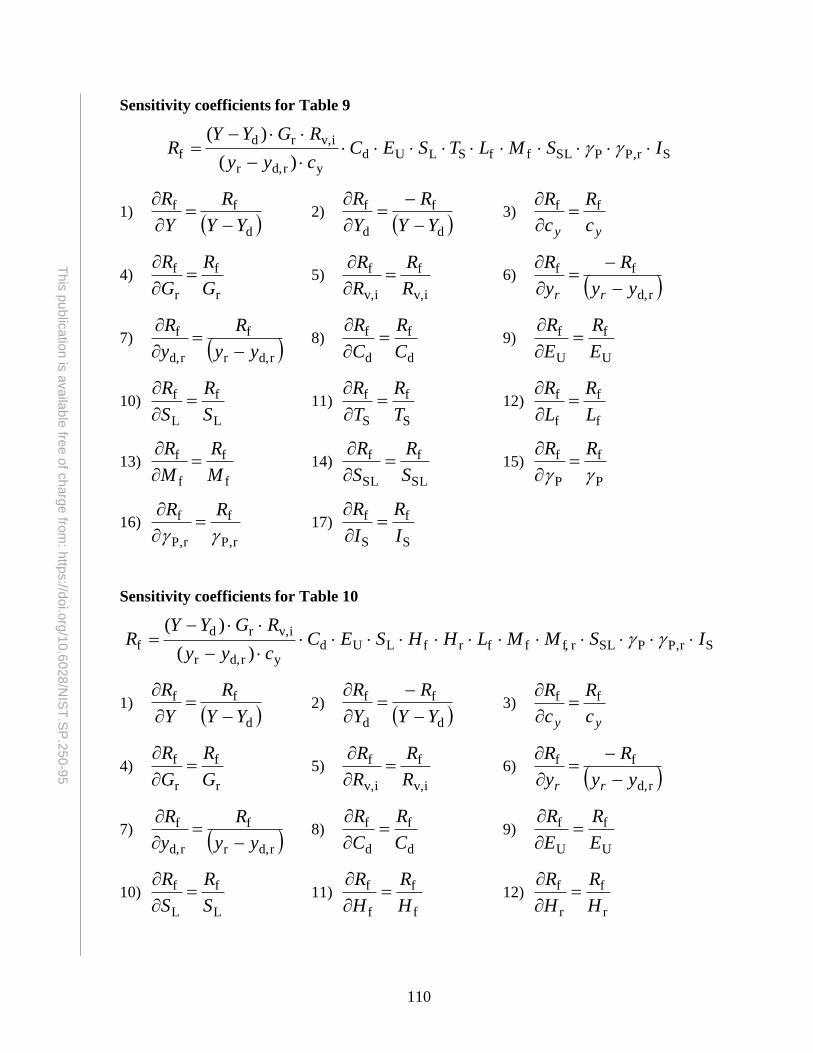
110
This
pu
blic
atio
n is
availa
ble
free o
f charg
e fro
m: h
ttps://d
oi.o
rg/1
0.6
028
/NIS
T.S
P.2
50-9
5
Sensitivity coefficients for Table 9
SrP,PSLffSLUdyrd,r
iv,rdf
)(
)(ISMLTSEC
cyy
RGYYR
1) d
ff
YY
R
Y
R
2)
d
f
d
f
YY
R
Y
R
3)
yy c
R
c
R ff
4)
r
f
r
f
G
R
G
R
5)
iv,
f
iv,
f
R
R
R
R
6)
rd,
ff
yy
R
y
R
rr
7) rd,r
f
rd,
f
yy
R
y
R
8)
d
f
d
f
C
R
C
R
9)
U
f
U
f
E
R
E
R
10)
L
f
L
f
S
R
S
R
11)
S
f
S
f
T
R
T
R
12)
f
f
f
f
L
R
L
R
13)
f
f
f
f
M
R
M
R
14)
SL
f
SL
f
S
R
S
R
15)
P
f
P
f
RR
16)
rP,
f
rP,
f
RR
17)
S
f
S
f
I
R
I
R
Sensitivity coefficients for Table 10
SrP,PSLrf,ffrfLUdyrd,r
iv,rdf
)(
)(ISMMLHHSEC
cyy
RGYYR
1) d
ff
YY
R
Y
R
2)
d
f
d
f
YY
R
Y
R
3)
yy c
R
c
R ff
4)
r
f
r
f
G
R
G
R
5)
iv,
f
iv,
f
R
R
R
R
6)
rd,
ff
yy
R
y
R
rr
7) rd,r
f
rd,
f
yy
R
y
R
8)
d
f
d
f
C
R
C
R
9)
U
f
U
f
E
R
E
R
10)
L
f
L
f
S
R
S
R
11)
f
f
f
f
H
R
H
R
12)
r
f
r
f
H
R
H
R
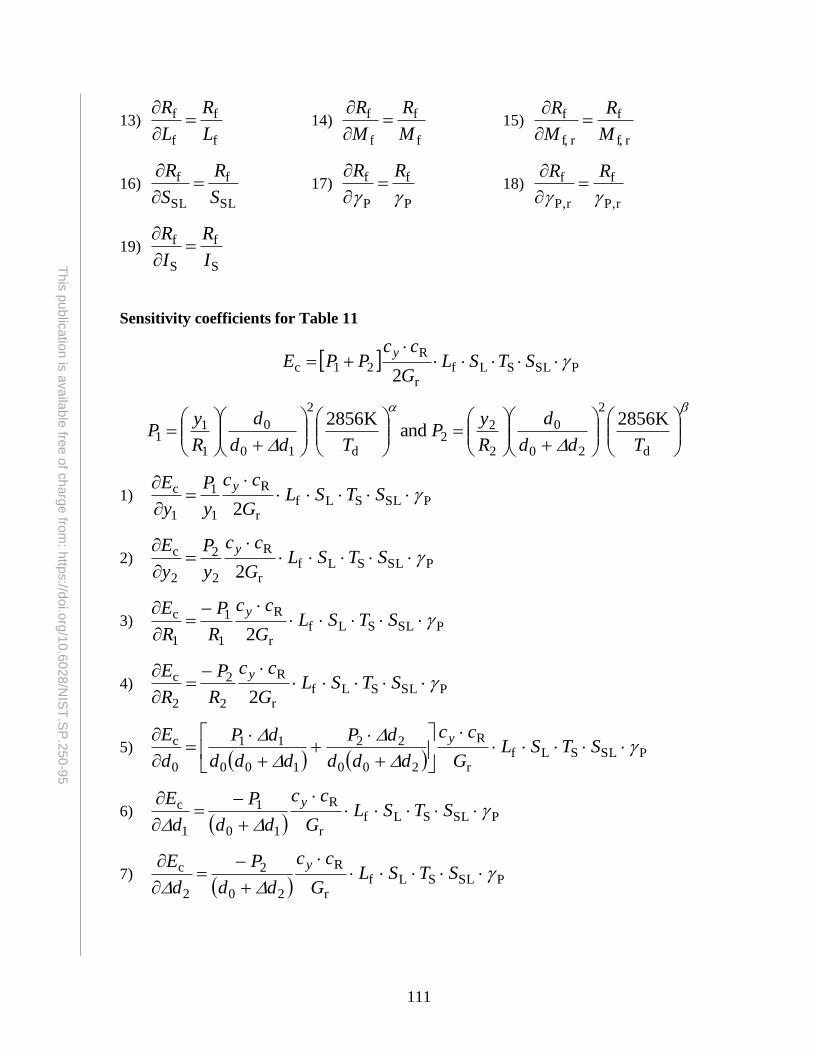
111
This
pu
blic
atio
n is
availa
ble
free o
f charg
e fro
m: h
ttps://d
oi.o
rg/1
0.6
028
/NIS
T.S
P.2
50-9
5
13)
f
f
f
f
L
R
L
R
14)
f
f
f
f
M
R
M
R
15)
rf,
f
rf,
f
M
R
M
R
16)
SL
f
SL
f
S
R
S
R
17)
P
f
P
f
RR
18)
rP,
f
rP,
f
RR
19)
S
f
S
f
I
R
I
R
Sensitivity coefficients for Table 11
PSLSLfr
R21c
2
STSL
G
ccPPE
y
d
2
20
0
2
22
d
2
10
0
1
11
K2856 and
K2856
Tdd
d
R
yP
Tdd
d
R
yP
1) PSLSLfr
R
1
1
1
c
2
STSL
G
cc
y
P
y
E y
2) PSLSLfr
R
2
2
2
c
2
STSL
G
cc
y
P
y
E y
3) PSLSLfr
R
1
1
1
c
2
STSL
G
cc
R
P
R
E y
4) PSLSLfr
R
2
2
2
c
2
STSL
G
cc
R
P
R
E y
5) PSLSLf
r
R
200
22
100
11
0
c
STSL
G
cc
ddd
dP
ddd
dP
d
E y
6) PSLSLf
r
R
10
1
1
c
STSL
G
cc
dd
P
d
E y
7) PSLSLf
r
R
20
2
2
c
STSL
G
cc
dd
P
d
E y
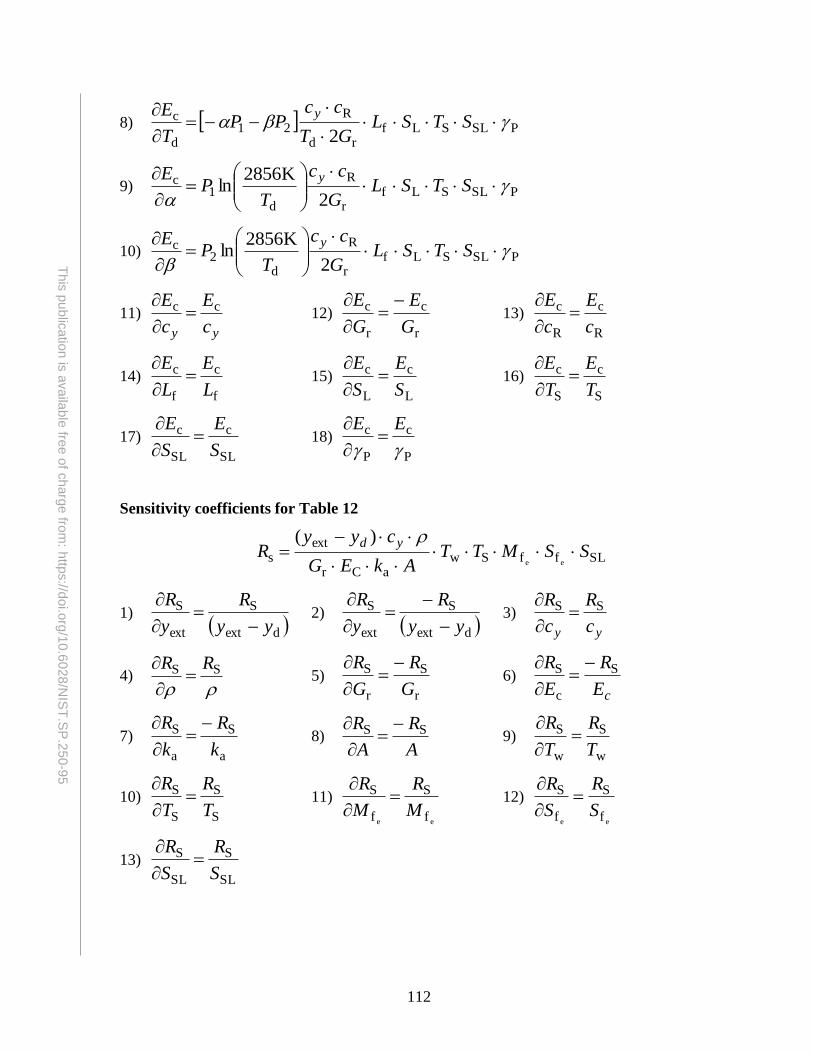
112
This
pu
blic
atio
n is
availa
ble
free o
f charg
e fro
m: h
ttps://d
oi.o
rg/1
0.6
028
/NIS
T.S
P.2
50-9
5
8) PSLSLfrd
R21
d
c
2
STSL
GT
ccPP
T
E y
9) PSLSLfr
R
d1
c
2
K2856ln
STSL
G
cc
TP
E y
10) PSLSLfr
R
d2
c
2
K2856ln
STSL
G
cc
TP
E y
11)
yy c
E
c
E cc
12)
r
c
r
c
G
E
G
E
13)
R
c
R
c
c
E
c
E
14)
f
c
f
c
L
E
L
E
15)
L
c
L
c
S
E
S
E
16)
S
c
S
c
T
E
T
E
17)
SL
c
SL
c
S
E
S
E
18)
P
c
P
c
EE
Sensitivity coefficients for Table 12
SLffSwaCr
exts ee
)(SSMTT
AkEG
cyyR
yd
1) dext
S
ext
S
yy
R
y
R
2)
dext
S
ext
S
yy
R
y
R
3)
yy c
R
c
R SS
4) SS RR
5)
r
S
r
S
G
R
G
R
6)
cE
R
E
R S
c
S
7)
a
S
a
S
k
R
k
R
8)
A
R
A
R SS
9)
w
S
w
S
T
R
T
R
10)
S
S
S
S
T
R
T
R
11)
ee f
S
f
S
M
R
M
R
12)
ee f
S
f
S
S
R
S
R
13)
SL
S
SL
S
S
R
S
R
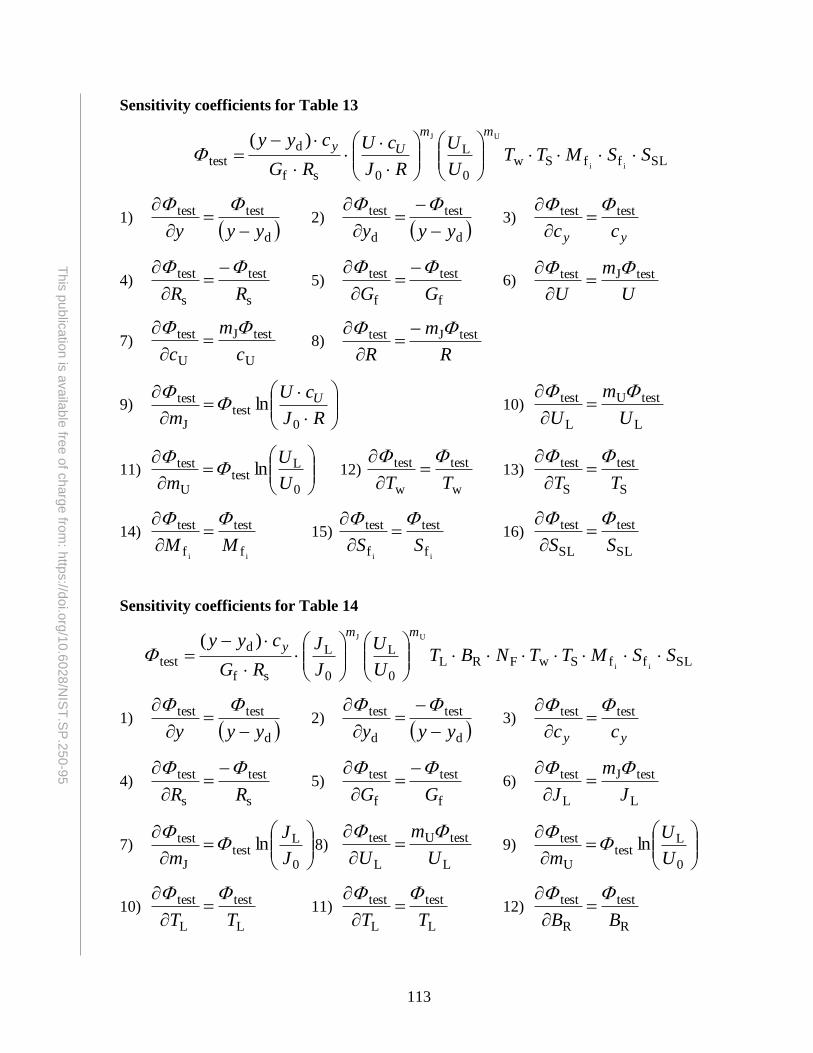
113
This
pu
blic
atio
n is
availa
ble
free o
f charg
e fro
m: h
ttps://d
oi.o
rg/1
0.6
028
/NIS
T.S
P.2
50-9
5
Sensitivity coefficients for Table 13
SLffSw0
L
0sf
dtest ii
UJ)(SSMTT
U
U
RJ
cU
RG
cyymm
Uy
1) d
testtest
yyy
2)
d
test
d
test
yyy
3)
yy cc
testtest
4)
s
test
s
test
RR
5)
f
test
f
test
GG
6)
U
m
U
testJtest
7)
U
testJ
U
test
c
m
c
8)
R
m
R
testJtest
9)
RJ
cU
m
U
0test
J
test ln
10)
L
testU
L
test
U
m
U
11)
0
Ltest
U
test lnU
U
m
12)
w
test
w
test
TT
13)
S
test
S
test
TT
14)
ii f
test
f
test
MM
15)
ii f
test
f
test
SS
16)
SL
test
SL
test
SS
Sensitivity coefficients for Table 14
SLffSwFRL0
L
0
L
sf
dtest ii
UJ)(SSMTTNBT
U
U
J
J
RG
cyymm
y
1) d
testtest
yyy
2)
d
test
d
test
yyy
3)
yy cc
testtest
4)
s
test
s
test
RR
5)
f
test
f
test
GG
6)
L
testJ
L
test
J
m
J
7)
0
Ltest
J
test lnJ
J
m
8)
L
testU
L
test
U
m
U
9)
0
Ltest
U
test lnU
U
m
10)
L
test
L
test
TT
11)
L
test
L
test
TT
12)
R
test
R
test
BB
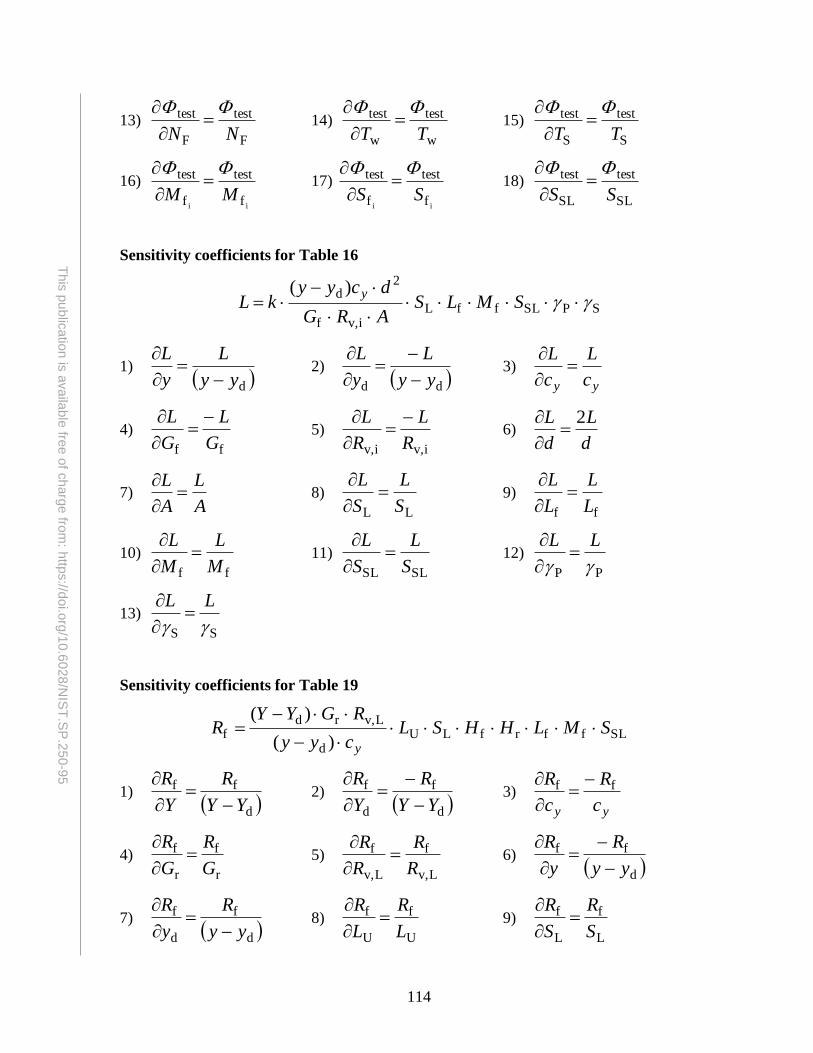
114
This
pu
blic
atio
n is
availa
ble
free o
f charg
e fro
m: h
ttps://d
oi.o
rg/1
0.6
028
/NIS
T.S
P.2
50-9
5
13)
F
test
F
test
NN
14)
w
test
w
test
TT
15)
S
test
S
test
TT
16)
ii f
test
f
test
MM
17)
ii f
test
f
test
SS
18)
SL
test
SL
test
SS
Sensitivity coefficients for Table 16
SPSLffLiv,f
2d )(
SMLS
ARG
dcyykL
y
1) dyy
L
y
L
2)
dd yy
L
y
L
3)
yy c
L
c
L
4)
ff G
L
G
L
5)
iv,iv, R
L
R
L
6)
d
L
d
L 2
7) A
L
A
L
8)
LL S
L
S
L
9)
ff L
L
L
L
10)
ff M
L
M
L
11)
SLSL S
L
S
L
12)
PP
LL
13)
SS
LL
Sensitivity coefficients for Table 19
SLffrfLUd
Lv,rdf
)(
)(SMLHHSL
cyy
RGYYR
y
1) d
ff
YY
R
Y
R
2)
d
f
d
f
YY
R
Y
R
3)
yy c
R
c
R ff
4)
r
f
r
f
G
R
G
R
5)
Lv,
f
Lv,
f
R
R
R
R
6)
d
ff
yy
R
y
R
7) d
f
d
f
yy
R
y
R
8)
U
f
U
f
L
R
L
R
9)
L
f
L
f
S
R
S
R
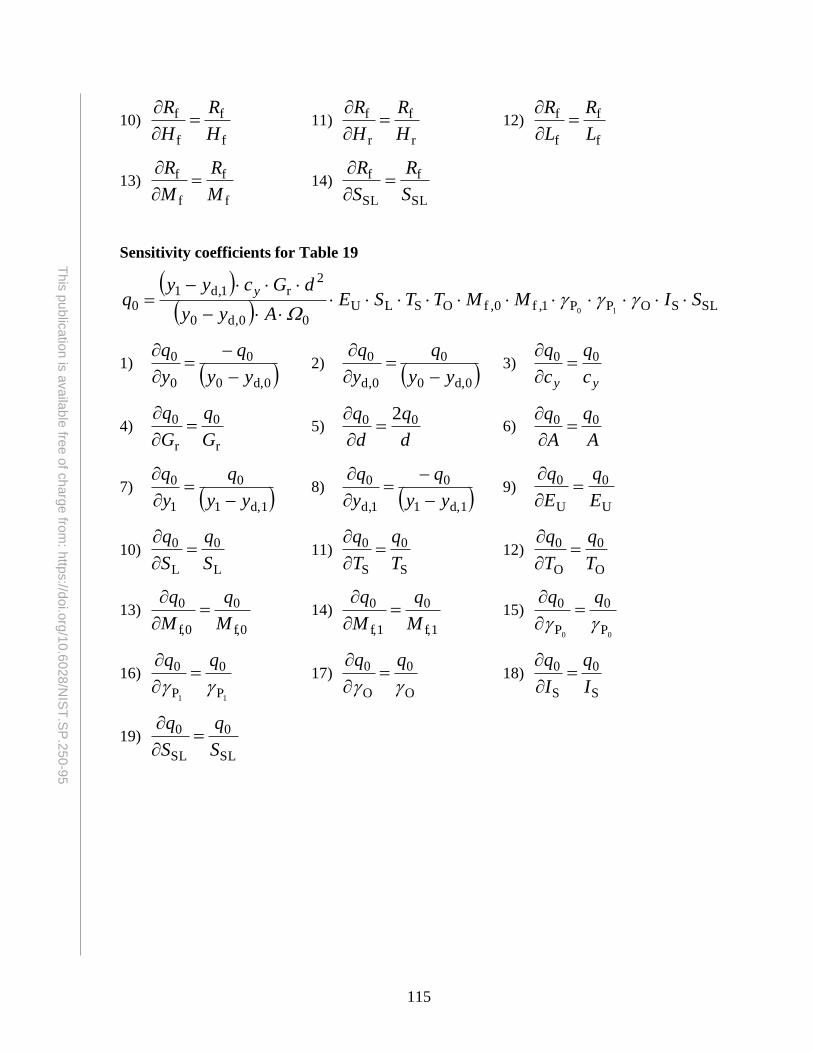
115
This
pu
blic
atio
n is
availa
ble
free o
f charg
e fro
m: h
ttps://d
oi.o
rg/1
0.6
028
/NIS
T.S
P.2
50-9
5
10)
f
f
f
f
H
R
H
R
11)
r
f
r
f
H
R
H
R
12)
f
f
f
f
L
R
L
R
13)
f
f
f
f
M
R
M
R
14)
SL
f
SL
f
S
R
S
R
Sensitivity coefficients for Table 19
SLSOPP1,f0,fOSLU
00,d0
2r1,d1
0 10SIMMTTSE
Ayy
dGcyyq
y
1) d,00
0
0
0
yy
q
y
q
2)
d,00
0
0,d
0
yy
q
y
q
3)
yy c
q
c
q 00
4)
r
0
r
0
G
q
G
q
5)
d
q
d
q 00 2
6)
A
q
A
q 00
7) d,11
0
1
0
yy
q
y
q
8)
d,11
0
1,d
0
yy
q
y
q
9)
U
0
U
0
E
q
E
q
10)
L
0
L
0
S
q
S
q
11)
S
0
S
0
T
q
T
q
12)
O
0
O
0
T
q
T
q
13)
f,0
0
f,0
0
M
q
M
q
14)
f,1
0
f,1
0
M
q
M
q
15)
00 P
0
P
0
16)
11 P
0
P
0
17)
O
0
O
0
18)
S
0
S
0
I
q
I
q
19)
SL
0
SL
0
S
q
S
q
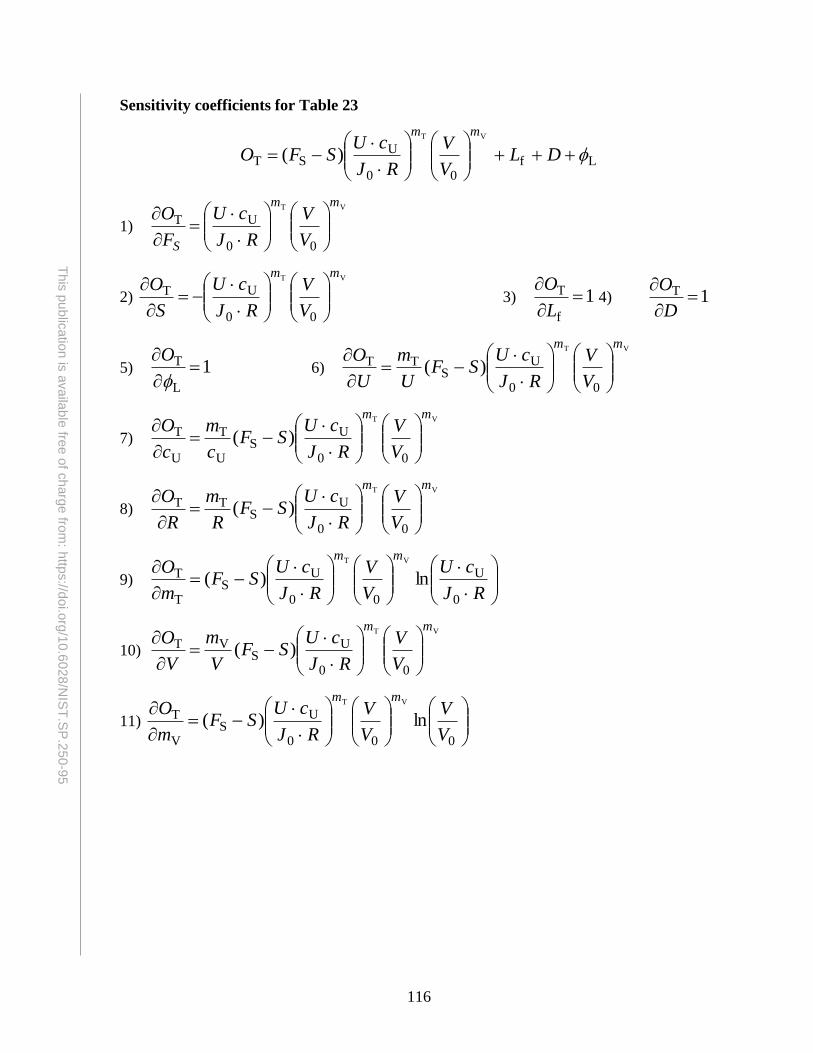
116
This
pu
blic
atio
n is
availa
ble
free o
f charg
e fro
m: h
ttps://d
oi.o
rg/1
0.6
028
/NIS
T.S
P.2
50-9
5
Sensitivity coefficients for Table 23
Lf00
UST
VT
)(
DL
V
V
RJ
cUSFO
mm
1)
VT
00
UT
mm
S V
V
RJ
cU
F
O
2)
VT
00
UT
mm
V
V
RJ
cU
S
O
3) 1
f
T
L
O 4) 1T
D
O
5) 1L
T
O 6)
VT
00
US
TT )(
mm
V
V
RJ
cUSF
U
m
U
O
7)
VT
00
US
U
T
U
T )(
mm
V
V
RJ
cUSF
c
m
c
O
8)
VT
00
US
TT )(
mm
V
V
RJ
cUSF
R
m
R
O
9)
RJ
cU
V
V
RJ
cUSF
m
Omm
0
U
00
US
T
T ln)(
VT
10)
VT
00
US
VT )(
mm
V
V
RJ
cUSF
V
m
V
O
11)
000
US
V
T ln)(
VT
V
V
V
V
RJ
cUSF
m
Omm
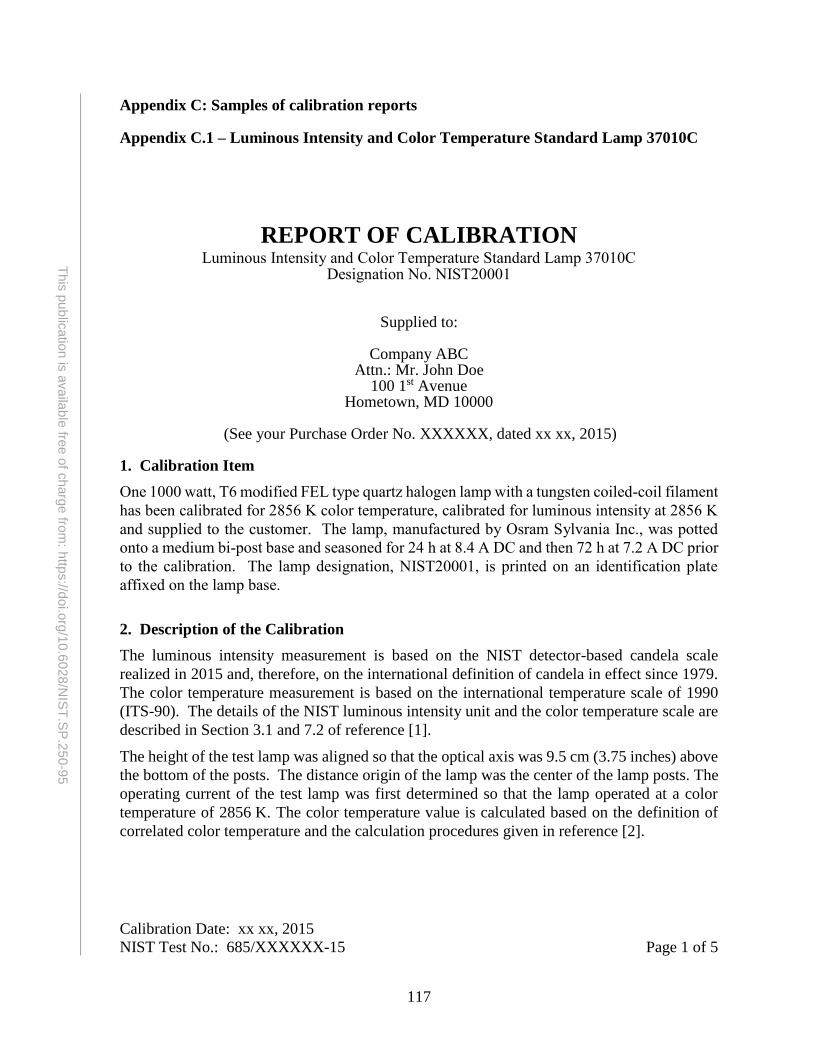
117
This
pu
blic
atio
n is
availa
ble
free o
f charg
e fro
m: h
ttps://d
oi.o
rg/1
0.6
028
/NIS
T.S
P.2
50-9
5
Appendix C: Samples of calibration reports
Appendix C.1 – Luminous Intensity and Color Temperature Standard Lamp 37010C
REPORT OF CALIBRATION
Luminous Intensity and Color Temperature Standard Lamp 37010C Designation No. NIST20001
Supplied to:
Company ABC Attn.: Mr. John Doe
100 1st Avenue Hometown, MD 10000
(See your Purchase Order No. XXXXXX, dated xx xx, 2015)
1. Calibration Item
One 1000 watt, T6 modified FEL type quartz halogen lamp with a tungsten coiled-coil filament
has been calibrated for 2856 K color temperature, calibrated for luminous intensity at 2856 K
and supplied to the customer. The lamp, manufactured by Osram Sylvania Inc., was potted
onto a medium bi-post base and seasoned for 24 h at 8.4 A DC and then 72 h at 7.2 A DC prior
to the calibration. The lamp designation, NIST20001, is printed on an identification plate
affixed on the lamp base.
2. Description of the Calibration
The luminous intensity measurement is based on the NIST detector-based candela scale
realized in 2015 and, therefore, on the international definition of candela in effect since 1979.
The color temperature measurement is based on the international temperature scale of 1990
(ITS-90). The details of the NIST luminous intensity unit and the color temperature scale are
described in Section 3.1 and 7.2 of reference [1].
The height of the test lamp was aligned so that the optical axis was 9.5 cm (3.75 inches) above
the bottom of the posts. The distance origin of the lamp was the center of the lamp posts. The
operating current of the test lamp was first determined so that the lamp operated at a color
temperature of 2856 K. The color temperature value is calculated based on the definition of
correlated color temperature and the calculation procedures given in reference [2].
Calibration Date: xx xx, 2015
NIST Test No.: 685/XXXXXX-15 Page 1 of 5
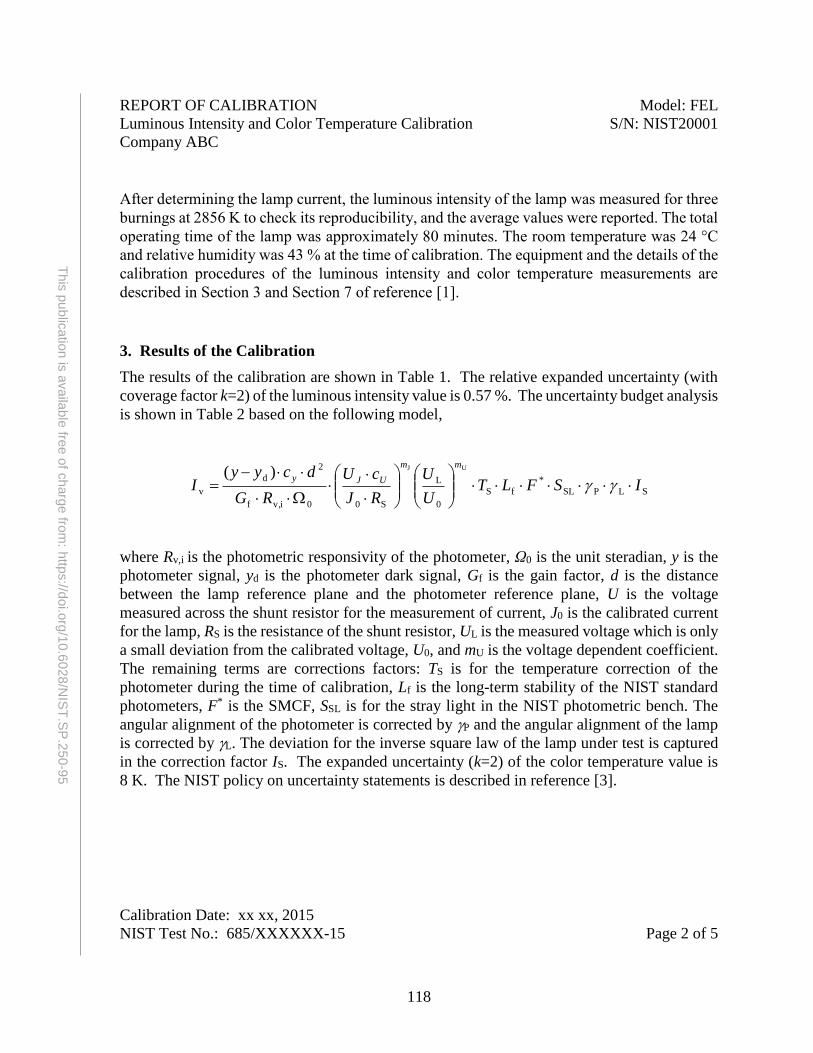
118
This
pu
blic
atio
n is
availa
ble
free o
f charg
e fro
m: h
ttps://d
oi.o
rg/1
0.6
028
/NIS
T.S
P.2
50-9
5
REPORT OF CALIBRATION Model: FEL
Luminous Intensity and Color Temperature Calibration S/N: NIST20001
Company ABC
After determining the lamp current, the luminous intensity of the lamp was measured for three
burnings at 2856 K to check its reproducibility, and the average values were reported. The total
operating time of the lamp was approximately 80 minutes. The room temperature was 24 °C
and relative humidity was 43 % at the time of calibration. The equipment and the details of the
calibration procedures of the luminous intensity and color temperature measurements are
described in Section 3 and Section 7 of reference [1].
3. Results of the Calibration
The results of the calibration are shown in Table 1. The relative expanded uncertainty (with
coverage factor k=2) of the luminous intensity value is 0.57 %. The uncertainty budget analysis
is shown in Table 2 based on the following model,
SLPSL
*
fS
0
L
S00iv,f
2
d
v
UJ)(ISFLT
U
U
RJ
cU
RG
dcyyI
mm
UJy
where Rv,i is the photometric responsivity of the photometer, Ω0 is the unit steradian, y is the
photometer signal, yd is the photometer dark signal, Gf is the gain factor, d is the distance
between the lamp reference plane and the photometer reference plane, U is the voltage
measured across the shunt resistor for the measurement of current, J0 is the calibrated current
for the lamp, RS is the resistance of the shunt resistor, UL is the measured voltage which is only
a small deviation from the calibrated voltage, U0, and mU is the voltage dependent coefficient.
The remaining terms are corrections factors: TS is for the temperature correction of the
photometer during the time of calibration, Lf is the long-term stability of the NIST standard
photometers, F* is the SMCF, SSL is for the stray light in the NIST photometric bench. The
angular alignment of the photometer is corrected by P and the angular alignment of the lamp
is corrected by L. The deviation for the inverse square law of the lamp under test is captured
in the correction factor IS. The expanded uncertainty (k=2) of the color temperature value is
8 K. The NIST policy on uncertainty statements is described in reference [3].
Calibration Date: xx xx, 2015
NIST Test No.: 685/XXXXXX-15 Page 2 of 5
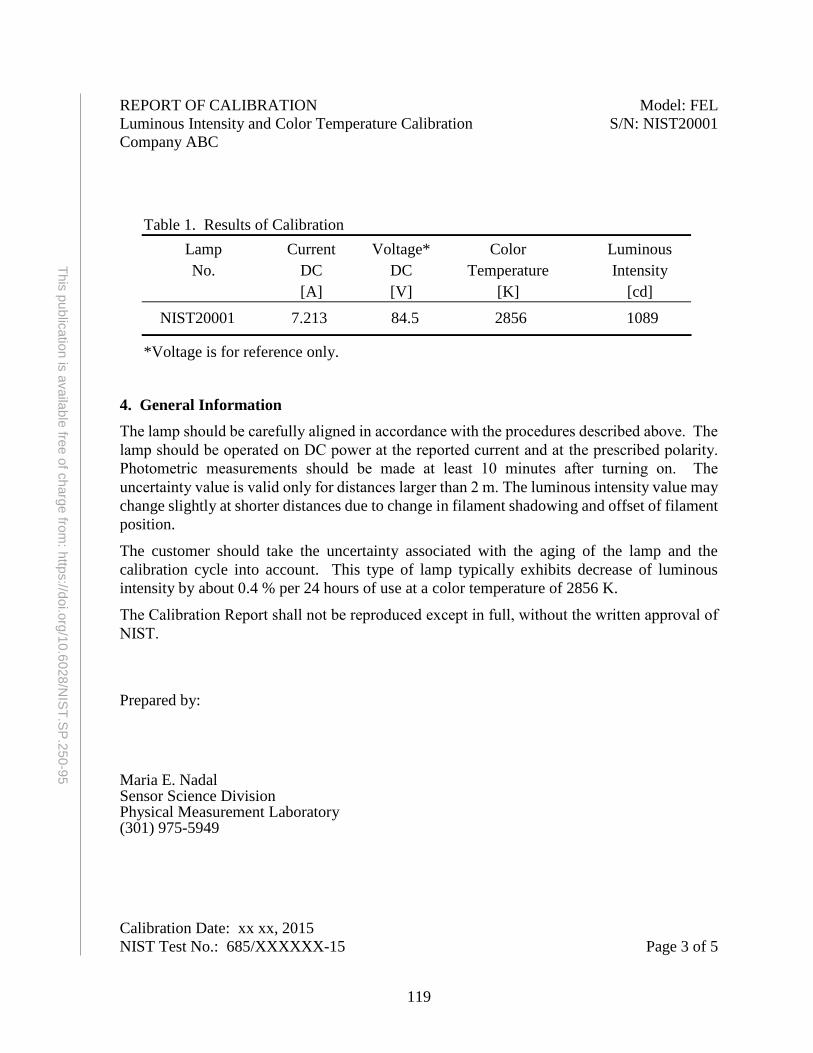
119
This
pu
blic
atio
n is
availa
ble
free o
f charg
e fro
m: h
ttps://d
oi.o
rg/1
0.6
028
/NIS
T.S
P.2
50-9
5
REPORT OF CALIBRATION Model: FEL
Luminous Intensity and Color Temperature Calibration S/N: NIST20001
Company ABC
Table 1. Results of Calibration
Lamp Current Voltage* Color Luminous
No. DC DC Temperature Intensity
[A] [V] [K] [cd]
NIST20001 7.213 84.5 2856 1089
*Voltage is for reference only.
4. General Information
The lamp should be carefully aligned in accordance with the procedures described above. The
lamp should be operated on DC power at the reported current and at the prescribed polarity.
Photometric measurements should be made at least 10 minutes after turning on. The
uncertainty value is valid only for distances larger than 2 m. The luminous intensity value may
change slightly at shorter distances due to change in filament shadowing and offset of filament
position.
The customer should take the uncertainty associated with the aging of the lamp and the
calibration cycle into account. This type of lamp typically exhibits decrease of luminous
intensity by about 0.4 % per 24 hours of use at a color temperature of 2856 K.
The Calibration Report shall not be reproduced except in full, without the written approval of
NIST.
Prepared by: Maria E. Nadal Sensor Science Division Physical Measurement Laboratory (301) 975-5949
Calibration Date: xx xx, 2015
NIST Test No.: 685/XXXXXX-15 Page 3 of 5
120
This
pu
blic
atio
n is
availa
ble
free o
f charg
e fro
m: h
ttps://d
oi.o
rg/1
0.6
028
/NIS
T.S
P.2
50-9
5
REPORT OF CALIBRATION Model: FEL
Luminous Intensity and Color Temperature Calibration S/N: NIST20001
Company ABC
Approved by: C. Cameron Miller For the Director, National Institute of Standards and Technology (301) 975-4713 References:
[1] Y. Ohno, NIST Special Publication 250-37 “Photometric Calibration” (1997). [2] CIE Publication No.15:2006, Colorimetry – Third Edition (2006). [3] B. N. Taylor and C. E. Kuyatt, "Guidelines for Evaluating and Expressing the
Uncertainty of NIST Measurement Results," NIST Technical Note 1297 (1994).
Calibration Date: xx xx, 2015
NIST Test No.: 685/XXXXXX-15 Page 4 of 5
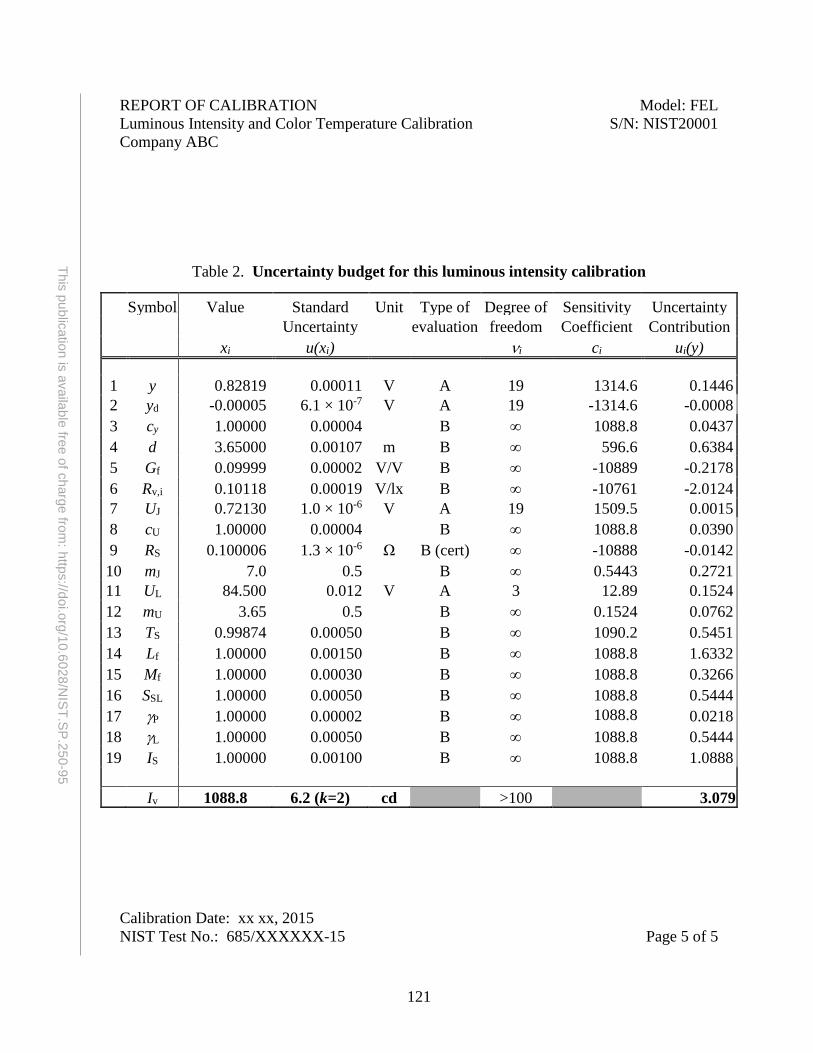
121
This
pu
blic
atio
n is
availa
ble
free o
f charg
e fro
m: h
ttps://d
oi.o
rg/1
0.6
028
/NIS
T.S
P.2
50-9
5
REPORT OF CALIBRATION Model: FEL
Luminous Intensity and Color Temperature Calibration S/N: NIST20001
Company ABC
Table 2. Uncertainty budget for this luminous intensity calibration
Symbol Value Standard Unit Type of Degree of Sensitivity Uncertainty
Uncertainty evaluation freedom Coefficient Contribution
xi u(xi) i ci ui(y)
1 y 0.82819 0.00011 V A 19 1314.6 0.1446
2 yd -0.00005 6.1 × 10⁻⁷ V A 19 -1314.6 -0.0008
3 cy 1.00000 0.00004 B 1088.8 0.0437
4 d 3.65000 0.00107 m B 596.6 0.6384
5 Gf 0.09999 0.00002 V/V B -10889 -0.2178
6 Rv,i 0.10118 0.00019 V/lx B -10761 -2.0124
7 UJ 0.72130 1.0 × 10⁻⁶ V A 19 1509.5 0.0015
8 cU 1.00000 0.00004 B 1088.8 0.0390
9 RS 0.100006 1.3 × 10⁻⁶ Ω B (cert) -10888 -0.0142
10 mJ 7.0 0.5 B 0.5443 0.2721
11 UL 84.500 0.012 V A 3 12.89 0.1524
12 mU 3.65 0.5 B 0.1524 0.0762
13 TS 0.99874 0.00050 B 1090.2 0.5451
14 Lf 1.00000 0.00150 B 1088.8 1.6332
15 Mf 1.00000 0.00030 B 1088.8 0.3266
16 SSL 1.00000 0.00050 B 1088.8 0.5444
17 P 1.00000 0.00002 B 1088.8 0.0218
18 L 1.00000 0.00050 B 1088.8 0.5444
19 IS 1.00000 0.00100 B 1088.8 1.0888
Iv 1088.8 6.2 (k=2) cd >100 3.079
Calibration Date: xx xx, 2015
NIST Test No.: 685/XXXXXX-15 Page 5 of 5
122
This
pu
blic
atio
n is
availa
ble
free o
f charg
e fro
m: h
ttps://d
oi.o
rg/1
0.6
028
/NIS
T.S
P.2
50-9
5
Appendix C.2 – Total Luminous Flux of a Submitted Lamp 37060S
REPORT OF CALIBRATION Special Test for Total Luminous Flux of Submitted Lamps 37060S
for
One 32W/T8 linear fluorescent lamp Model FO32/741
with S/N: NIST22001
Submitted by:
Company ABC Attn.: Mr. John Doe
100 1st Avenue Hometown, MD 10000
(See your Purchase Order No. XXXXX, dated xx xx, 2015)
1. Calibration Item
One 32W/T8, rapid-start type linear fluorescent lamp Model FO32/741 with designation
number, NIST22001, was calibrated for total luminous flux. The lamp designation is
engraved on the lamp near one of the two lamp bases.
2. Description of the Calibration
2.1 NIST luminous flux unit and measurement facility
This total luminous flux measurement is based on the NIST luminous flux scale realized in
2015 which has been derived from the NIST detector-based candela scale and therefore, based
on the international definition of candela in effect since 1979. [1]
The test lamp was calibrated in the NIST 2.5 m integrating sphere by using the detector-based
absolute integrating method [2]. The test lamp was mounted horizontally at the center of the
integrating sphere, and its axis was aligned to be in line with the photometer and the 10 cm
sphere baffle. The details for the electrical and photometric measurements of fluorescent lamps
are described in the reference 3.
Calibration Date: xx xx, 2015
NIST Test No.: 685/XXXXXX-15 Page 1 of 7
123
This
pu
blic
atio
n is
availa
ble
free o
f charg
e fro
m: h
ttps://d
oi.o
rg/1
0.6
028
/NIS
T.S
P.2
50-9
5
REPORT OF CALIBRATION Manufacturer: XXXXX
Total Luminous Flux of Submitted Lamps Model: F032/741
Company ABC Designations: NIST22001
Prior to the luminous flux calibration, the spectral power distribution of each lamp was
measured in the 2.5 m integrating sphere using an array spectroradiometer to determine the
SMCF of the 2.5 m sphere system for the luminous flux calibration. The test lamp was
stabilized for 15 minutes before the calibration took place with the lamp’s ambient temperature
(defined in reference 3) maintained to be approximately 25 °C. The lamp current, the arc
voltage, the arc power, and the photometer output signal were recorded together with the data
on the environmental conditions. Corrections were applied for the dark reading, the self-
absorption effect (automatically corrected), and the spectral mismatch to calculate the total
luminous flux of the test lamp, as described in section 5.4 of reference 1 and section 4 of
reference 2. The total luminous flux measurements were made for three lightings of each test
lamp. The mean value of the three lightings is reported. The variation of the total luminous
flux values of the three lightings is included in the uncertainty budget of the calibration.
The room temperature was 24 °C and relative humidity was 18 % at the time of calibration.
2.2. Operation of the test lamp
The operating circuit diagram for this calibration is shown in Figure 1, which is in accordance
with the ANSI standard [see section 6.1 of reference 4] for a 32 W, 48-inch, T8, rapid-start
type fluorescent lamp. The circuit consists of a regulated variable ac power supply (set to 60
Hz), a step-up transformer, a reference ballast composed of an adjustable linear reactor and an
adjustable resistor, a cathode heating transformer, a 2-channel ac power meter, and the test
fluorescent lamp. The 2-channel ac power meter has an RMS measurement capability within
a 10 kHz bandwidth. It has been confirmed that the input impedance of this instrument does
not affect the circuit conditions. Both the step-up transformer and cathode heating transformer
were connected to the variable ac power supply to synchronize the frequency and the phase.
The hot pin X is marked on one of the two bases of the test lamp which is adjacent to the
engraved lamp designation. The test lamp was connected to the lamp-holder in such a way that
the hot pin X was connected to the hot terminal X at the lamp-holder. For this calibration, the
cathode heating power was switched off. The lamp current IL, the arc voltage VL, the arc power
were measured at CH A of the 2-channel ac power meter. The lamp operating current was
specified by the customer, and was set by manually adjusting the output voltage of the ac power
supply.
Prior to the calibration, the reference ballast was adjusted (and fixed for all test lamps) with
the test lamp shortened in the circuit to meet the required reference ballast’s specifications
(910 impedance [see p. 33 of reference 5] and 0.075 power factor [6]):
Calibration Date: xx xx, 2015
NIST Test No.: 685/XXXXXX-15 Page 2 of 7
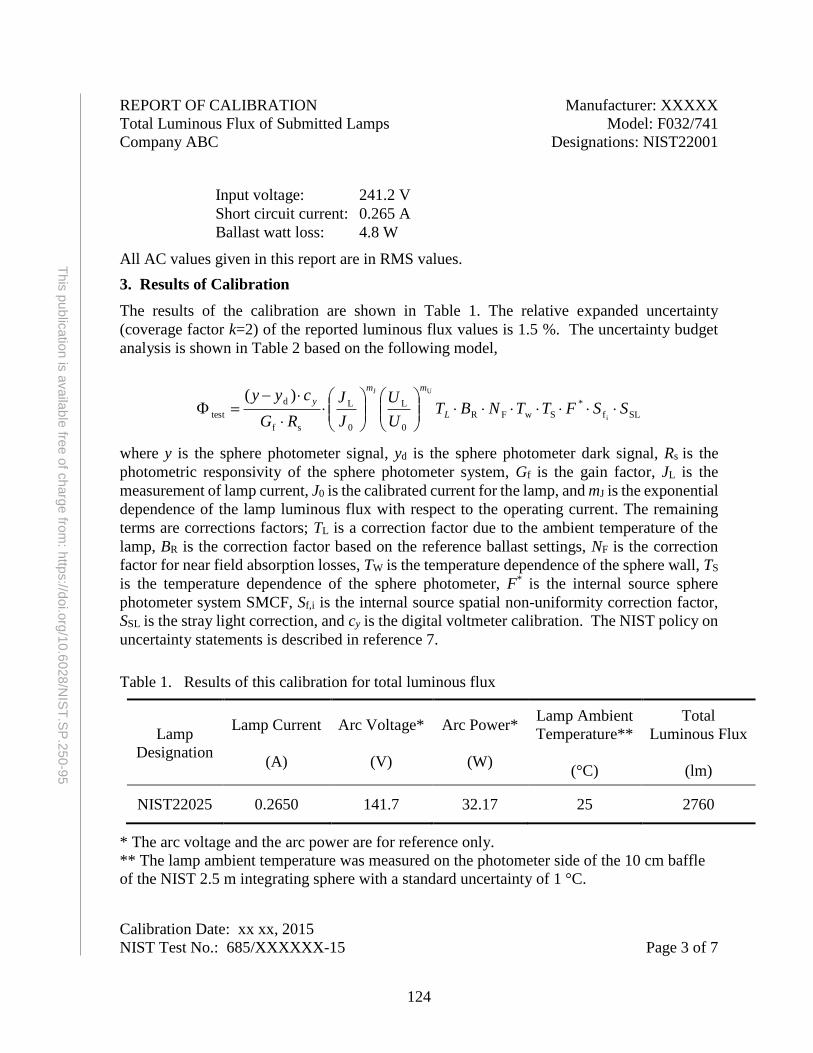
124
This
pu
blic
atio
n is
availa
ble
free o
f charg
e fro
m: h
ttps://d
oi.o
rg/1
0.6
028
/NIS
T.S
P.2
50-9
5
REPORT OF CALIBRATION Manufacturer: XXXXX
Total Luminous Flux of Submitted Lamps Model: F032/741
Company ABC Designations: NIST22001
Input voltage: 241.2 V
Short circuit current: 0.265 A
Ballast watt loss: 4.8 W
All AC values given in this report are in RMS values.
3. Results of Calibration
The results of the calibration are shown in Table 1. The relative expanded uncertainty
(coverage factor k=2) of the reported luminous flux values is 1.5 %. The uncertainty budget
analysis is shown in Table 2 based on the following model,
SLf
*
SwFR
0
L
0
L
sf
d
test i
UJ)(SSFTTNBT
U
U
J
J
RG
cyyL
mm
y
where y is the sphere photometer signal, yd is the sphere photometer dark signal, Rs is the
photometric responsivity of the sphere photometer system, Gf is the gain factor, JL is the
measurement of lamp current, J0 is the calibrated current for the lamp, and mJ is the exponential
dependence of the lamp luminous flux with respect to the operating current. The remaining
terms are corrections factors; TL is a correction factor due to the ambient temperature of the
lamp, BR is the correction factor based on the reference ballast settings, NF is the correction
factor for near field absorption losses, TW is the temperature dependence of the sphere wall, TS
is the temperature dependence of the sphere photometer, F* is the internal source sphere
photometer system SMCF, Sf,i is the internal source spatial non-uniformity correction factor,
SSL is the stray light correction, and cy is the digital voltmeter calibration. The NIST policy on
uncertainty statements is described in reference 7.
Table 1. Results of this calibration for total luminous flux
Lamp
Designation
Lamp Current
(A)
Arc Voltage*
(V)
Arc Power*
(W)
Lamp Ambient
Temperature**
(°C)
Total
Luminous Flux
(lm)
NIST22025 0.2650 141.7 32.17 25 2760
* The arc voltage and the arc power are for reference only.
** The lamp ambient temperature was measured on the photometer side of the 10 cm baffle
of the NIST 2.5 m integrating sphere with a standard uncertainty of 1 °C. Calibration Date: xx xx, 2015
NIST Test No.: 685/XXXXXX-15 Page 3 of 7
125
This
pu
blic
atio
n is
availa
ble
free o
f charg
e fro
m: h
ttps://d
oi.o
rg/1
0.6
028
/NIS
T.S
P.2
50-9
5
REPORT OF CALIBRATION Manufacturer: XXXXX
Total Luminous Flux of Submitted Lamps Model: F032/741
Company ABC Designations: NIST22001
4. General Information
Photometric measurements should be made at 15 minutes after turning on the fluorescent
lamp.
The uncertainty due to the aging of the test lamp should be taken into account by the
customer depending on the calibration cycle and the uncertainty required. The uncertainty
related to the size of the integrating sphere (related to the difference in lamp’s thermal
conditions) should also be taken into account by the customer.
The Calibration Report shall not be reproduced except in full, without the written approval of
NIST.
Prepared by: Yuqin Zong Sensor Science Division Physical Measurement Laboratory (301) 975-2332 Approved by: C. Cameron Miller For the Director, National Institute of Standards and Technology (301) 975-4713 Calibration Date: xx xx, 2015
NIST Test No.: 685/XXXXXX-15 Page 4 of 7
126
This
pu
blic
atio
n is
availa
ble
free o
f charg
e fro
m: h
ttps://d
oi.o
rg/1
0.6
028
/NIS
T.S
P.2
50-9
5
REPORT OF CALIBRATION Manufacturer: XXXXX
Total Luminous Flux of Submitted Lamps Model: F032/741
Company ABC Designations: NIST22001
References:
[1] Y. Ohno, NIST Special Publication 250-37 Photometric Calibrations (1997).
[2] Y. Ohno and Y. Zong: Detector-Based Integrating Sphere Photometry, CIE Proceedings,
24 Session – Warsaw, pp. 155–160 (1999).
[3] IES LM-9-1999, IES Approved Method for the Electrical and Photometric
Measurements of Fluorescent Lamps.
[4] ANSI C78.375-2004, Fluorescent Lamps – Guide for Electrical Measurements.
[5] ANSI_IEC C78.81-2005, Double-Capped Fluorescent Lamps - Dimensional and
Electrical Characteristics.
[6] ANSI C82.3-2002, Reference Ballasts for Fluorescent Lamps.
[7] B. N. Taylor and C. E. Kuyatt, “Guidelines for Evaluating and Expressing the Uncertainty
of NIST Measurement Results,” NIST Technical Note 1297 (1994). Calibration Date: xx xx, 2015
NIST Test No.: 685/XXXXXX-15 Page 5 of 7
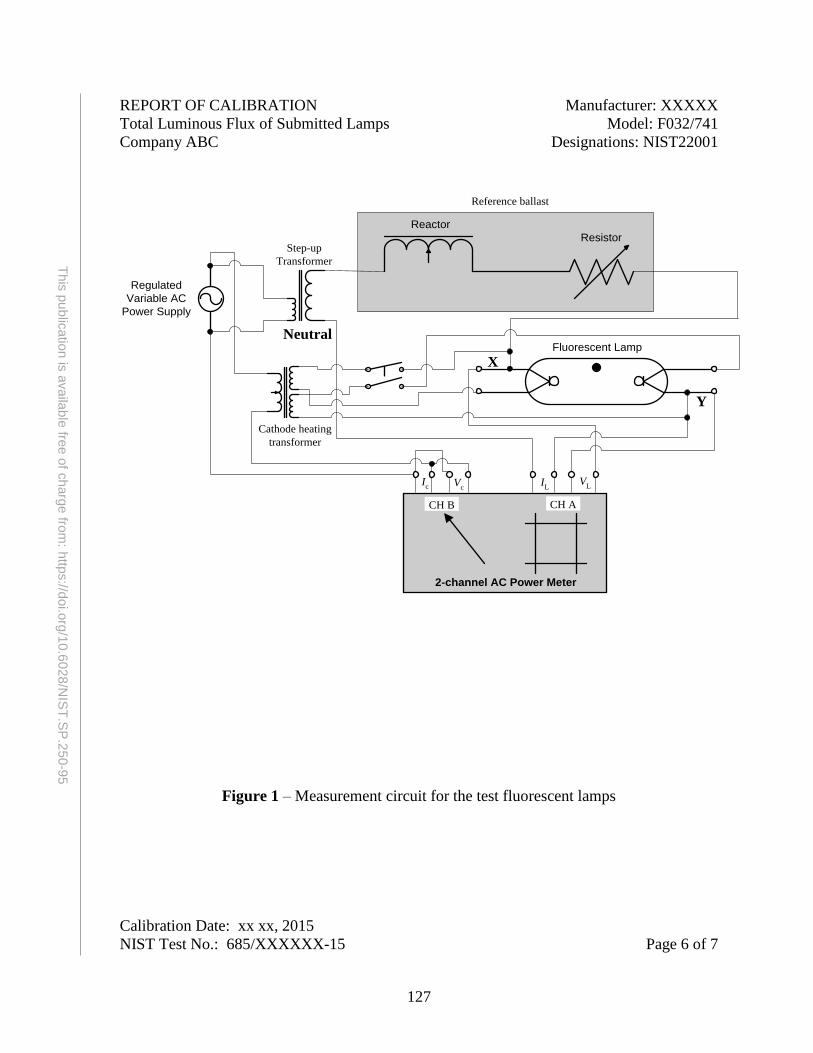
127
This
pu
blic
atio
n is
availa
ble
free o
f charg
e fro
m: h
ttps://d
oi.o
rg/1
0.6
028
/NIS
T.S
P.2
50-9
5
REPORT OF CALIBRATION Manufacturer: XXXXX
Total Luminous Flux of Submitted Lamps Model: F032/741
Company ABC Designations: NIST22001
Figure 1 – Measurement circuit for the test fluorescent lamps
Calibration Date: xx xx, 2015
NIST Test No.: 685/XXXXXX-15 Page 6 of 7
Fluorescent Lamp
Reactor
Resistor
Regulated
Variable AC
Power Supply
Step-up
Transformer
Neutral
2-channel AC Power Meter
Ic V
c
CH ACH B
VLI
L
X
Y
Cathode heating
transformer
Reference ballast
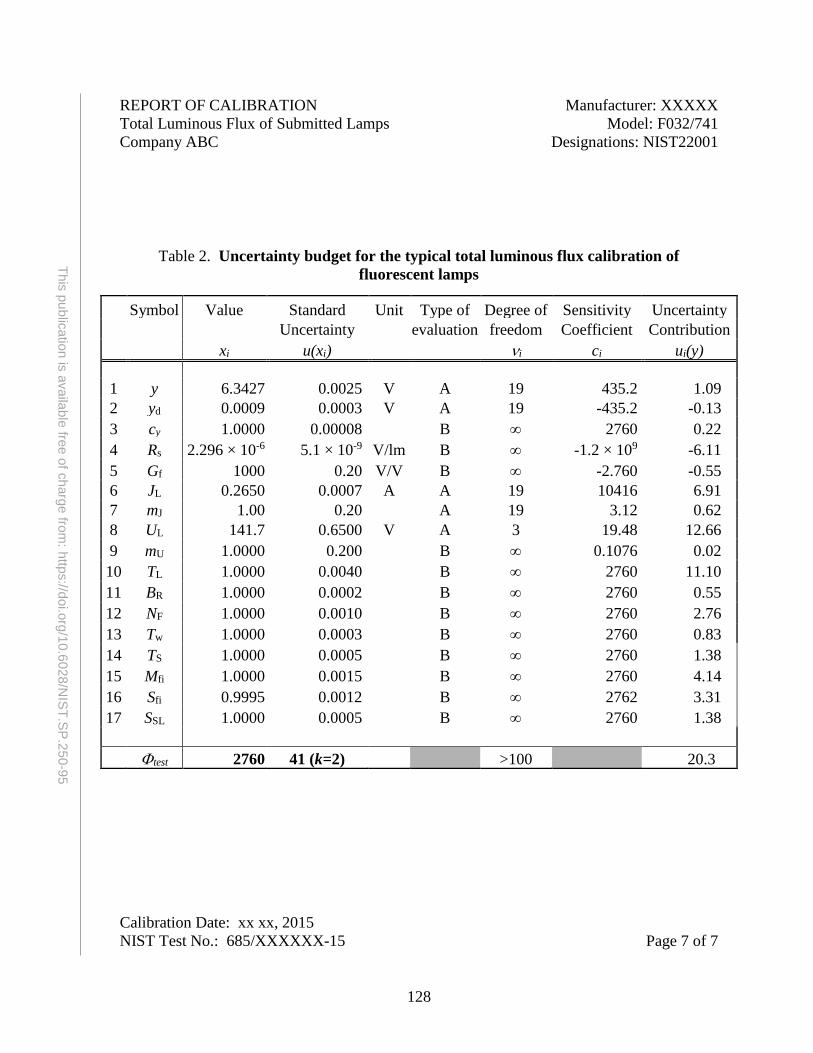
128
This
pu
blic
atio
n is
availa
ble
free o
f charg
e fro
m: h
ttps://d
oi.o
rg/1
0.6
028
/NIS
T.S
P.2
50-9
5
REPORT OF CALIBRATION Manufacturer: XXXXX
Total Luminous Flux of Submitted Lamps Model: F032/741
Company ABC Designations: NIST22001
Table 2. Uncertainty budget for the typical total luminous flux calibration of
fluorescent lamps
Symbol Value Standard Unit Type of Degree of Sensitivity Uncertainty
Uncertainty evaluation freedom Coefficient Contribution
xi u(xi) i ci ui(y)
1 y 6.3427 0.0025 V A 19 435.2 1.09
2 yd 0.0009 0.0003 V A 19 -435.2 -0.13
3 cy 1.0000 0.00008 B 2760 0.22
4 Rs 2.296 × 10⁻⁶ 5.1 × 10⁻⁹ V/lm B -1.2 × 10⁹ -6.11
5 Gf 1000 0.20 V/V B -2.760 -0.55
6 JL 0.2650 0.0007 A A 19 10416 6.91
7 mJ 1.00 0.20 A 19 3.12 0.62
8 UL 141.7 0.6500 V A 3 19.48 12.66
9 mU 1.0000 0.200 B 0.1076 0.02
10 TL 1.0000 0.0040 B 2760 11.10
11 BR 1.0000 0.0002 B 2760 0.55
12 NF 1.0000 0.0010 B 2760 2.76
13 Tw 1.0000 0.0003 B 2760 0.83
14 TS 1.0000 0.0005 B 2760 1.38
15 Mfi 1.0000 0.0015 B 2760 4.14
16 Sfi 0.9995 0.0012 B 2762 3.31
17 SSL 1.0000 0.0005 B 2760 1.38
test 2760 41 (k=2) >100 20.3
Calibration Date: xx xx, 2015
NIST Test No.: 685/XXXXXX-15 Page 7 of 7
129
This
pu
blic
atio
n is
availa
ble
free o
f charg
e fro
m: h
ttps://d
oi.o
rg/1
0.6
028
/NIS
T.S
P.2
50-9
5
Appendix C.3 – Calibration of a Luminance Source 37080S
REPORT OF CALIBRATION
Special Test for Calibration of Submitted Luminance Source 37080S
for
An integrating sphere source (Company, Inc.)
composed of a sphere source (Model XXXX, S/N 00000001)
and a controller (Model XXXX, S/N 00000001)
submitted by
Company ABC
Attn.: Mr. John Doe
100 1st Avenue
Hometown, MD 10000
(See your Purchase Order No. XXXXXX, dated xx xx, 2015)
1. Calibration Item
An integrating sphere source (Company, Inc.) composed of a sphere source (Model XXXX,
S/N 00000001) and a controller (Model XXXX, S/N 00000001) has been calibrated for
correlated color temperature and luminance.
2. Description of the Calibration
This luminance measurement is based on the NIST luminance scale that has been derived from
the NIST detector-based candela scale [1] and therefore based on the international definition
of candela in effect since 1979.
The test item was calibrated for luminance (cd/m2), using a NIST reference luminance meter
that is calibrated against the NIST luminance scale realized on a reference sphere source
operated at 2856 K [1]. The test source was aligned, so that the center of the exit port of the
source was on the optical axis, and the front surface around the exit port was normal to the
optical axis. The reference luminance meter was placed on the optical axis, and the luminance
of the source was measured with a measurement angle of 1° at a distance of 1.0 m. The average
luminance area measured was 18 mm in diameter at the center of the exit port.
Calibration Date: xx xx, 2015
NIST Test No.: 685/XXXXXX-15 Page 1 of 4
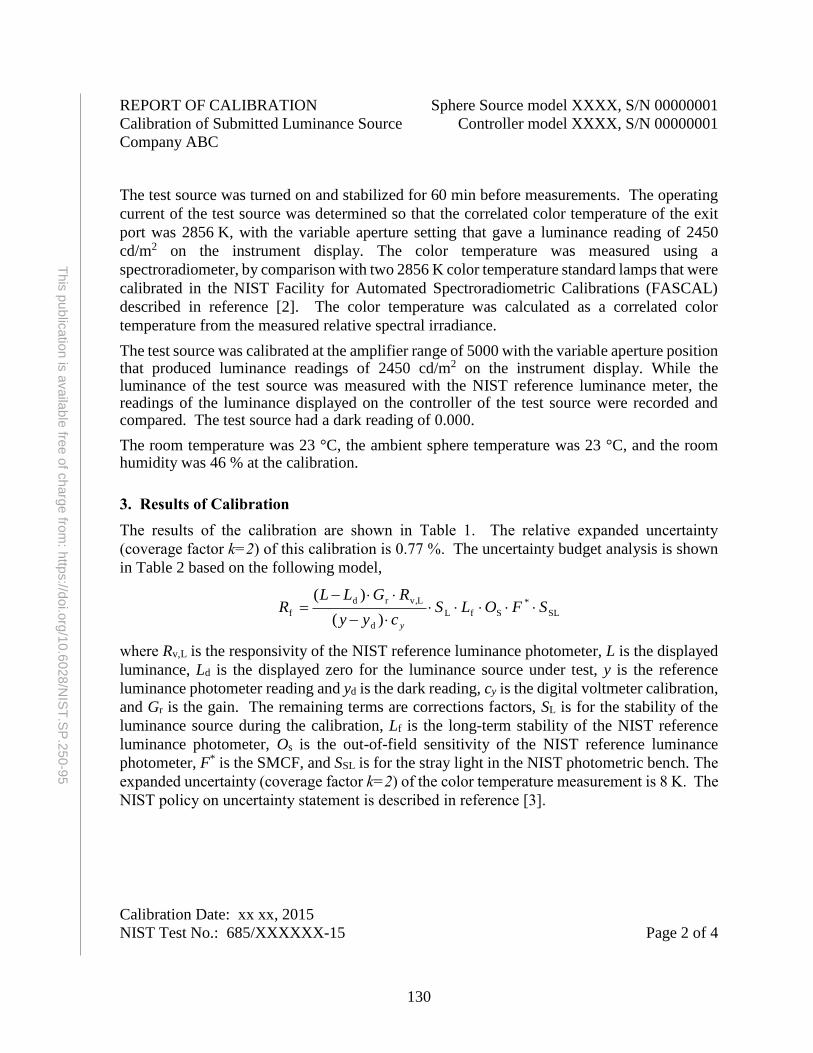
130
This
pu
blic
atio
n is
availa
ble
free o
f charg
e fro
m: h
ttps://d
oi.o
rg/1
0.6
028
/NIS
T.S
P.2
50-9
5
REPORT OF CALIBRATION Sphere Source model XXXX, S/N 00000001
Calibration of Submitted Luminance Source Controller model XXXX, S/N 00000001
Company ABC
The test source was turned on and stabilized for 60 min before measurements. The operating
current of the test source was determined so that the correlated color temperature of the exit
port was 2856 K, with the variable aperture setting that gave a luminance reading of 2450
cd/m2 on the instrument display. The color temperature was measured using a
spectroradiometer, by comparison with two 2856 K color temperature standard lamps that were
calibrated in the NIST Facility for Automated Spectroradiometric Calibrations (FASCAL)
described in reference [2]. The color temperature was calculated as a correlated color
temperature from the measured relative spectral irradiance.
The test source was calibrated at the amplifier range of 5000 with the variable aperture position that produced luminance readings of 2450 cd/m2 on the instrument display. While the luminance of the test source was measured with the NIST reference luminance meter, the readings of the luminance displayed on the controller of the test source were recorded and compared. The test source had a dark reading of 0.000.
The room temperature was 23 °C, the ambient sphere temperature was 23 °C, and the room humidity was 46 % at the calibration.
3. Results of Calibration
The results of the calibration are shown in Table 1. The relative expanded uncertainty
(coverage factor k=2) of this calibration is 0.77 %. The uncertainty budget analysis is shown
in Table 2 based on the following model,
SL
*
SfL
d
Lv,rd
f)(
)(SFOLS
cyy
RGLLR
y
where Rv,L is the responsivity of the NIST reference luminance photometer, L is the displayed
luminance, Ld is the displayed zero for the luminance source under test, y is the reference
luminance photometer reading and yd is the dark reading, cy is the digital voltmeter calibration,
and Gr is the gain. The remaining terms are corrections factors, SL is for the stability of the
luminance source during the calibration, Lf is the long-term stability of the NIST reference
luminance photometer, Os is the out-of-field sensitivity of the NIST reference luminance
photometer, F* is the SMCF, and SSL is for the stray light in the NIST photometric bench. The
expanded uncertainty (coverage factor k=2) of the color temperature measurement is 8 K. The
NIST policy on uncertainty statement is described in reference [3]. Calibration Date: xx xx, 2015
NIST Test No.: 685/XXXXXX-15 Page 2 of 4
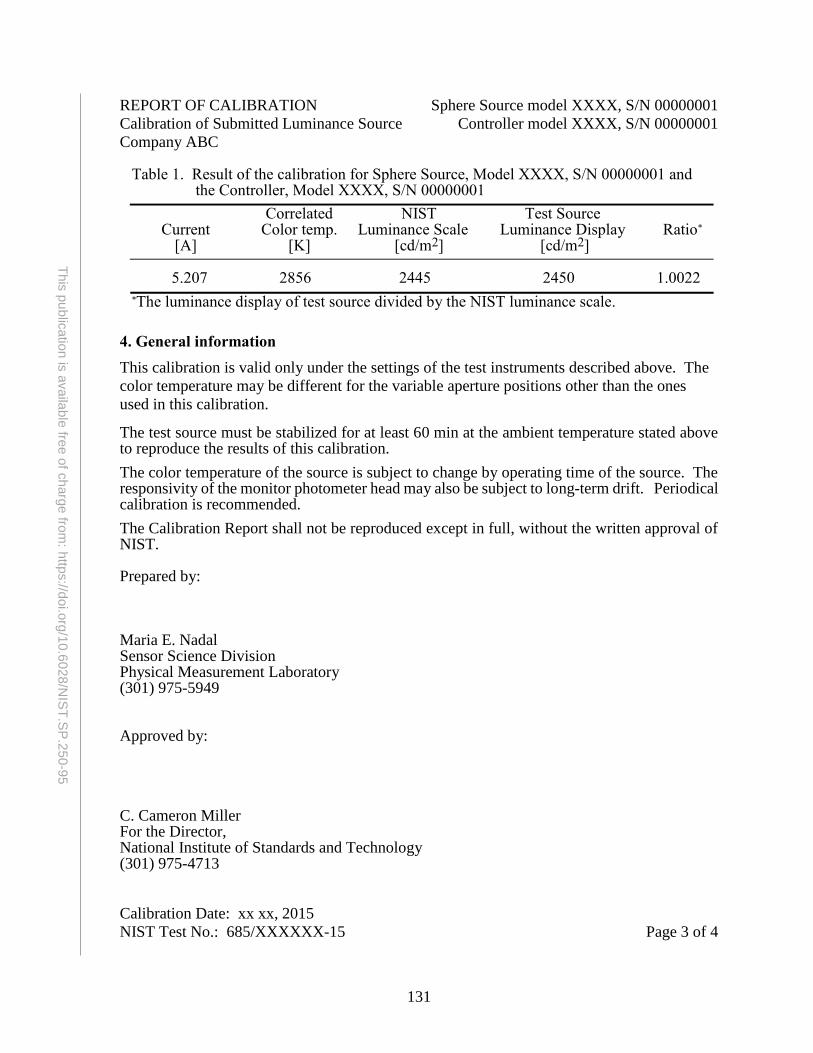
131
This
pu
blic
atio
n is
availa
ble
free o
f charg
e fro
m: h
ttps://d
oi.o
rg/1
0.6
028
/NIS
T.S
P.2
50-9
5
REPORT OF CALIBRATION Sphere Source model XXXX, S/N 00000001
Calibration of Submitted Luminance Source Controller model XXXX, S/N 00000001
Company ABC
Table 1. Result of the calibration for Sphere Source, Model XXXX, S/N 00000001 and the Controller, Model XXXX, S/N 00000001
Correlated NIST Test Source Current Color temp. Luminance Scale Luminance Display Ratio* [A] [K] [cd/m2] [cd/m2]
5.207 2856 2445 2450 1.0022
*The luminance display of test source divided by the NIST luminance scale.
4. General information
This calibration is valid only under the settings of the test instruments described above. The
color temperature may be different for the variable aperture positions other than the ones
used in this calibration.
The test source must be stabilized for at least 60 min at the ambient temperature stated above to reproduce the results of this calibration.
The color temperature of the source is subject to change by operating time of the source. The responsivity of the monitor photometer head may also be subject to long-term drift. Periodical calibration is recommended.
The Calibration Report shall not be reproduced except in full, without the written approval of NIST. Prepared by: Maria E. Nadal Sensor Science Division Physical Measurement Laboratory (301) 975-5949 Approved by: C. Cameron Miller For the Director, National Institute of Standards and Technology (301) 975-4713 Calibration Date: xx xx, 2015
NIST Test No.: 685/XXXXXX-15 Page 3 of 4
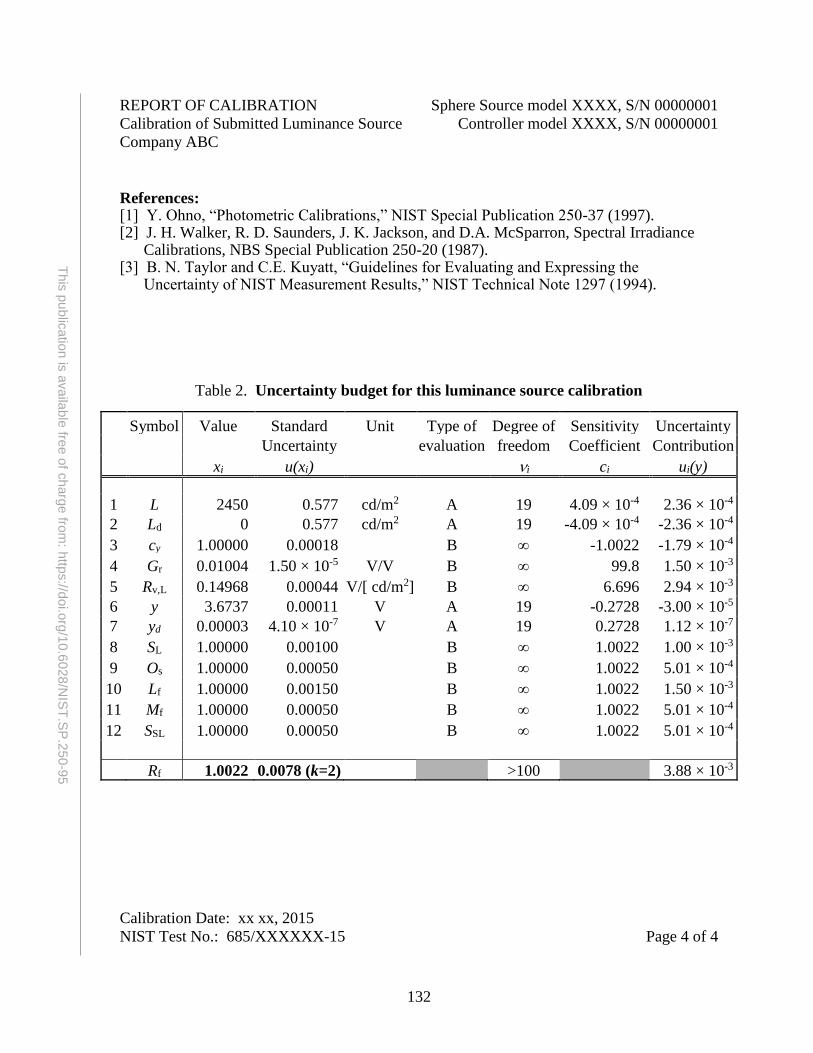
132
This
pu
blic
atio
n is
availa
ble
free o
f charg
e fro
m: h
ttps://d
oi.o
rg/1
0.6
028
/NIS
T.S
P.2
50-9
5
REPORT OF CALIBRATION Sphere Source model XXXX, S/N 00000001
Calibration of Submitted Luminance Source Controller model XXXX, S/N 00000001
Company ABC
References: [1] Y. Ohno, “Photometric Calibrations,” NIST Special Publication 250-37 (1997). [2] J. H. Walker, R. D. Saunders, J. K. Jackson, and D.A. McSparron, Spectral Irradiance
Calibrations, NBS Special Publication 250-20 (1987). [3] B. N. Taylor and C.E. Kuyatt, “Guidelines for Evaluating and Expressing the
Uncertainty of NIST Measurement Results,” NIST Technical Note 1297 (1994).
Table 2. Uncertainty budget for this luminance source calibration
Symbol Value Standard Unit Type of Degree of Sensitivity Uncertainty
Uncertainty evaluation freedom Coefficient Contribution
xi u(xi) i ci ui(y)
1 L 2450 0.577 cd/m2 A 19 4.09 × 10⁻⁴ 2.36 × 10⁻⁴
2 Ld 0 0.577 cd/m2 A 19 -4.09 × 10⁻⁴ -2.36 × 10⁻⁴
3 cy 1.00000 0.00018 B -1.0022 -1.79 × 10⁻⁴
4 Gr 0.01004 1.50 × 10⁻⁵ V/V B 99.8 1.50 × 10⁻³
5 Rv,L 0.14968 0.00044 V/[ cd/m2] B 6.696 2.94 × 10⁻³
6 y 3.6737 0.00011 V A 19 -0.2728 -3.00 × 10⁻⁵
7 yd 0.00003 4.10 × 10⁻⁷ V A 19 0.2728 1.12 × 10⁻⁷
8 SL 1.00000 0.00100 B 1.0022 1.00 × 10⁻³
9 Os 1.00000 0.00050 B 1.0022 5.01 × 10⁻⁴
10 Lf 1.00000 0.00150 B 1.0022 1.50 × 10⁻³
11 Mf 1.00000 0.00050 B 1.0022 5.01 × 10⁻⁴
12 SSL 1.00000 0.00050 B 1.0022 5.01 × 10⁻⁴
Rf 1.0022 0.0078 (k=2) >100 3.88 × 10⁻³ Calibration Date: xx xx, 2015
NIST Test No.: 685/XXXXXX-15 Page 4 of 4
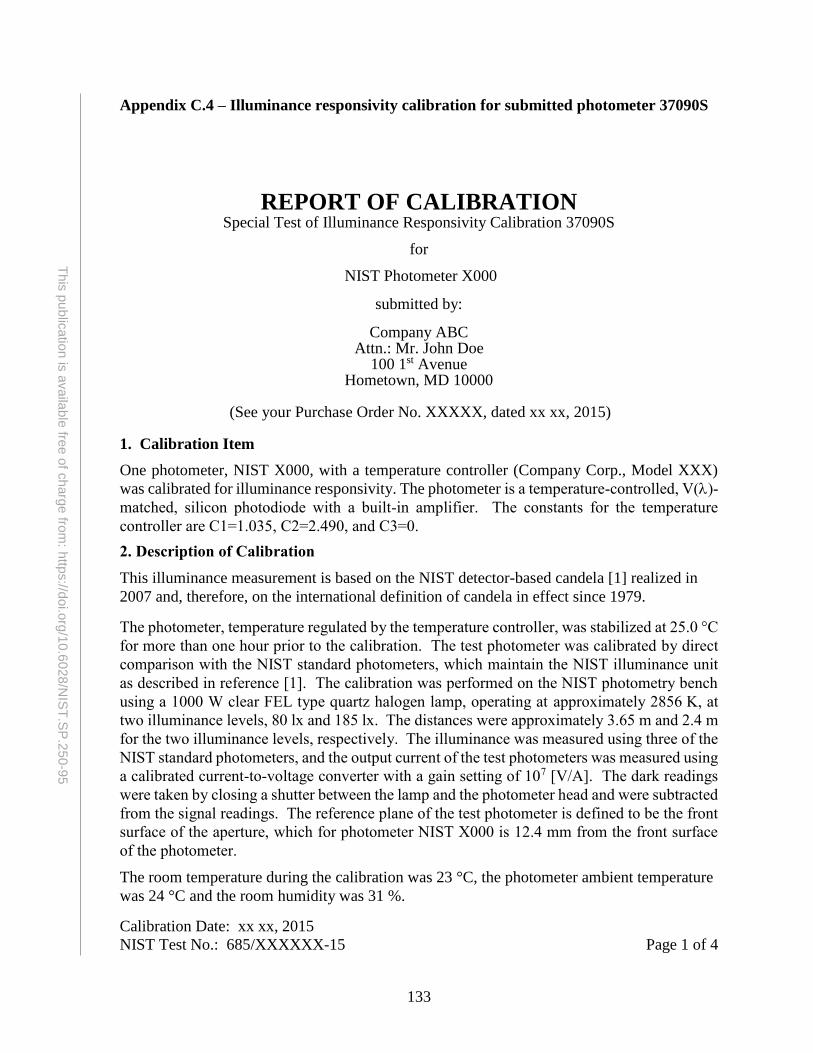
133
This
pu
blic
atio
n is
availa
ble
free o
f charg
e fro
m: h
ttps://d
oi.o
rg/1
0.6
028
/NIS
T.S
P.2
50-9
5
Appendix C.4 – Illuminance responsivity calibration for submitted photometer 37090S
REPORT OF CALIBRATION Special Test of Illuminance Responsivity Calibration 37090S
for
NIST Photometer X000
submitted by:
Company ABC Attn.: Mr. John Doe
100 1st Avenue Hometown, MD 10000
(See your Purchase Order No. XXXXX, dated xx xx, 2015)
1. Calibration Item
One photometer, NIST X000, with a temperature controller (Company Corp., Model XXX)
was calibrated for illuminance responsivity. The photometer is a temperature-controlled, V(-
matched, silicon photodiode with a built-in amplifier. The constants for the temperature
controller are C1=1.035, C2=2.490, and C3=0.
2. Description of Calibration
This illuminance measurement is based on the NIST detector-based candela [1] realized in
2007 and, therefore, on the international definition of candela in effect since 1979.
The photometer, temperature regulated by the temperature controller, was stabilized at 25.0 °C
for more than one hour prior to the calibration. The test photometer was calibrated by direct
comparison with the NIST standard photometers, which maintain the NIST illuminance unit
as described in reference [1]. The calibration was performed on the NIST photometry bench
using a 1000 W clear FEL type quartz halogen lamp, operating at approximately 2856 K, at
two illuminance levels, 80 lx and 185 lx. The distances were approximately 3.65 m and 2.4 m
for the two illuminance levels, respectively. The illuminance was measured using three of the
NIST standard photometers, and the output current of the test photometers was measured using
a calibrated current-to-voltage converter with a gain setting of 107 [V/A]. The dark readings
were taken by closing a shutter between the lamp and the photometer head and were subtracted
from the signal readings. The reference plane of the test photometer is defined to be the front
surface of the aperture, which for photometer NIST X000 is 12.4 mm from the front surface
of the photometer.
The room temperature during the calibration was 23 °C, the photometer ambient temperature
was 24 °C and the room humidity was 31 %.
Calibration Date: xx xx, 2015
NIST Test No.: 685/XXXXXX-15 Page 1 of 4
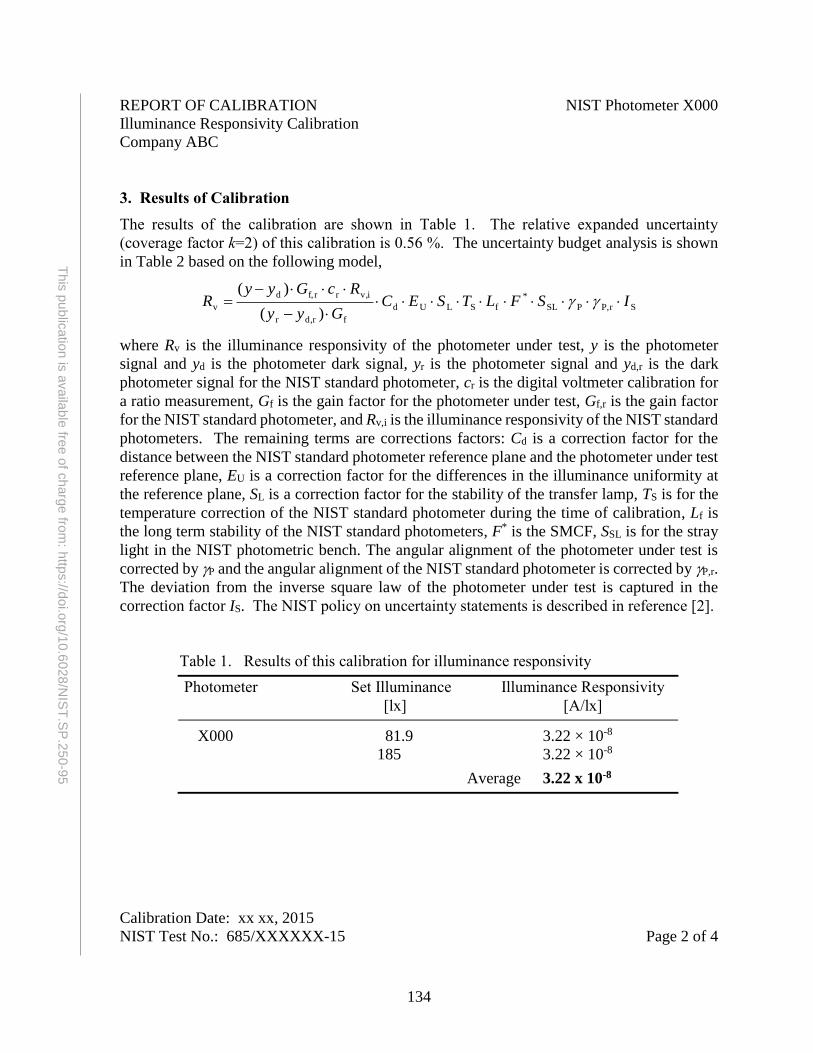
134
This
pu
blic
atio
n is
availa
ble
free o
f charg
e fro
m: h
ttps://d
oi.o
rg/1
0.6
028
/NIS
T.S
P.2
50-9
5
REPORT OF CALIBRATION NIST Photometer X000
Illuminance Responsivity Calibration
Company ABC
3. Results of Calibration
The results of the calibration are shown in Table 1. The relative expanded uncertainty
(coverage factor k=2) of this calibration is 0.56 %. The uncertainty budget analysis is shown
in Table 2 based on the following model,
SrP,PSL
*
fSLUd
frd,r
iv,rrf,d
v)(
)(ISFLTSEC
Gyy
RcGyyR
where Rv is the illuminance responsivity of the photometer under test, y is the photometer
signal and yd is the photometer dark signal, yr is the photometer signal and yd,r is the dark
photometer signal for the NIST standard photometer, cr is the digital voltmeter calibration for
a ratio measurement, Gf is the gain factor for the photometer under test, Gf,r is the gain factor
for the NIST standard photometer, and Rv,i is the illuminance responsivity of the NIST standard
photometers. The remaining terms are corrections factors: Cd is a correction factor for the
distance between the NIST standard photometer reference plane and the photometer under test
reference plane, EU is a correction factor for the differences in the illuminance uniformity at
the reference plane, SL is a correction factor for the stability of the transfer lamp, TS is for the
temperature correction of the NIST standard photometer during the time of calibration, Lf is
the long term stability of the NIST standard photometers, F* is the SMCF, SSL is for the stray
light in the NIST photometric bench. The angular alignment of the photometer under test is
corrected by P and the angular alignment of the NIST standard photometer is corrected by P,r.
The deviation from the inverse square law of the photometer under test is captured in the
correction factor IS. The NIST policy on uncertainty statements is described in reference [2].
Table 1. Results of this calibration for illuminance responsivity
Photometer Set Illuminance Illuminance Responsivity
[lx] [A/lx]
X000 81.9 3.22 × 10⁻⁸
185 3.22 × 10⁻⁸
Average 3.22 x 10⁻⁸
Calibration Date: xx xx, 2015
NIST Test No.: 685/XXXXXX-15 Page 2 of 4
135
This
pu
blic
atio
n is
availa
ble
free o
f charg
e fro
m: h
ttps://d
oi.o
rg/1
0.6
028
/NIS
T.S
P.2
50-9
5
REPORT OF CALIBRATION NIST Photometer X000
Illuminance Responsivity Calibration Company ABC
4. General Information
This calibration is valid only for the measurement of incandescent or Planckian sources with
color temperatures of approximately 2856 K. The responsivity of the photometers may change
at a temperature different from that reported above.
The photometers may be subject to long-term drift. Periodic calibration is recommended.
This Calibration Report shall not be reproduced except in full, without the written approval
of NIST. Prepared by: Maria E. Nadal Sensor Science Division Physical Measurement Laboratory (301) 975-5949 Approved by: C. Cameron Miller For the Director, National Institute of Standards and Technology (301) 975-4713 References:
[1] Y. Ohno, NIST Special Publication 250-37 “Photometric Calibration” (1997). [2] B. N. Taylor and C. E. Kuyatt, "Guidelines for Evaluating and Expressing the
Uncertainty of NIST Measurement Results," NIST Technical Note 1297 (1994).
Calibration Date: xx xx, 2015
NIST Test No.: 685/XXXXXX-15 Page 3 of 4
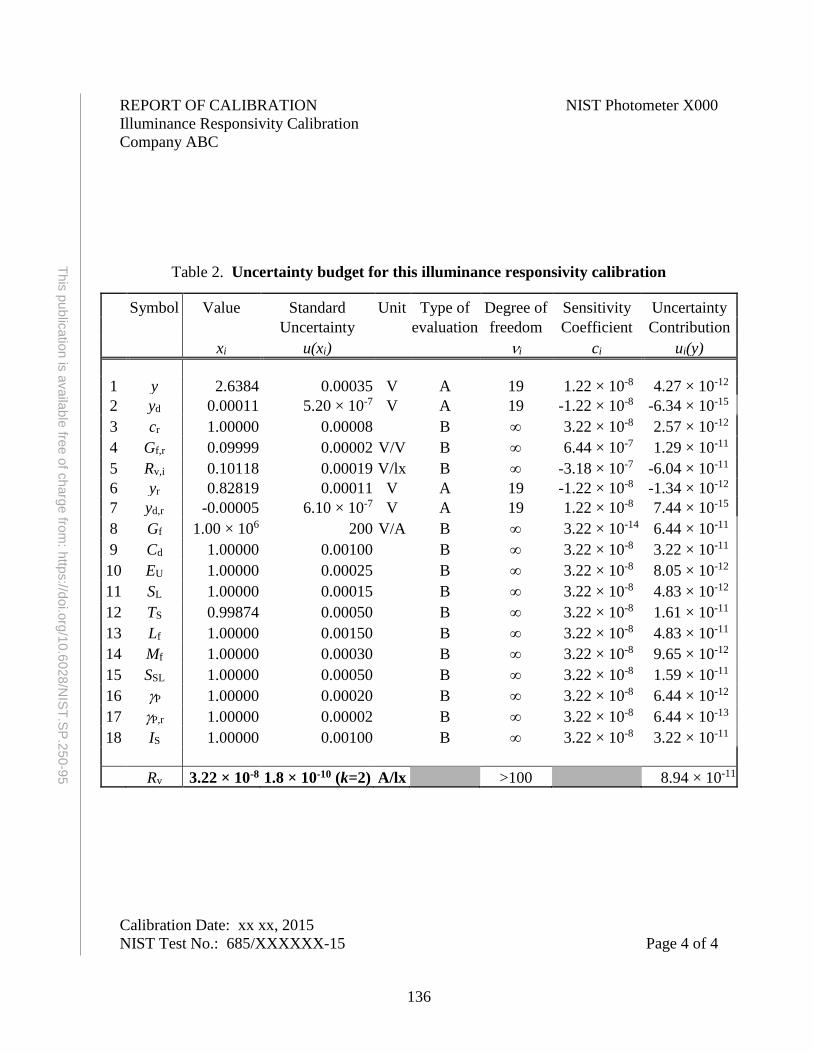
136
This
pu
blic
atio
n is
availa
ble
free o
f charg
e fro
m: h
ttps://d
oi.o
rg/1
0.6
028
/NIS
T.S
P.2
50-9
5
REPORT OF CALIBRATION NIST Photometer X000
Illuminance Responsivity Calibration
Company ABC
Table 2. Uncertainty budget for this illuminance responsivity calibration
Symbol Value Standard Unit Type of Degree of Sensitivity Uncertainty
Uncertainty evaluation freedom Coefficient Contribution
xi u(xi) i ci ui(y)
1 y 2.6384 0.00035 V A 19 1.22 × 10⁻⁸ 4.27 × 10⁻¹²
2 yd 0.00011 5.20 × 10⁻⁷ V A 19 -1.22 × 10⁻⁸ -6.34 × 10⁻¹⁵
3 cr 1.00000 0.00008 B 3.22 × 10⁻⁸ 2.57 × 10⁻¹²
4 Gf,r 0.09999 0.00002 V/V B 6.44 × 10⁻⁷ 1.29 × 10⁻¹¹
5 Rv,i 0.10118 0.00019 V/lx B -3.18 × 10⁻⁷ -6.04 × 10⁻¹¹
6 yr 0.82819 0.00011 V A 19 -1.22 × 10⁻⁸ -1.34 × 10⁻¹²
7 yd,r -0.00005 6.10 × 10⁻⁷ V A 19 1.22 × 10⁻⁸ 7.44 × 10⁻¹⁵
8 Gf 1.00 × 10⁶ 200 V/A B 3.22 × 10⁻¹⁴ 6.44 × 10⁻¹¹
9 Cd 1.00000 0.00100 B 3.22 × 10⁻⁸ 3.22 × 10⁻¹¹
10 EU 1.00000 0.00025 B 3.22 × 10⁻⁸ 8.05 × 10⁻¹²
11 SL 1.00000 0.00015 B 3.22 × 10⁻⁸ 4.83 × 10⁻¹²
12 TS 0.99874 0.00050 B 3.22 × 10⁻⁸ 1.61 × 10⁻¹¹
13 Lf 1.00000 0.00150 B 3.22 × 10⁻⁸ 4.83 × 10⁻¹¹
14 Mf 1.00000 0.00030 B 3.22 × 10⁻⁸ 9.65 × 10⁻¹²
15 SSL 1.00000 0.00050 B 3.22 × 10⁻⁸ 1.59 × 10⁻¹¹
16 P 1.00000 0.00020 B 3.22 × 10⁻⁸ 6.44 × 10⁻¹²
17 P,r 1.00000 0.00002 B 3.22 × 10⁻⁸ 6.44 × 10⁻¹³
18 IS 1.00000 0.00100 B 3.22 × 10⁻⁸ 3.22 × 10⁻¹¹
Rv 3.22 × 10⁻⁸ 1.8 × 10⁻¹⁰ (k=2) A/lx >100 8.94 × 10⁻¹¹
Calibration Date: xx xx, 2015
NIST Test No.: 685/XXXXXX-15 Page 4 of 4