Embed Size (px)
Citation preview
High Power Laser Calibrations at NIST
NIST Measurement Services:
NIST Special Publication 250-77
Xiaoyu Li Joshua Hadler Christopher Cromer John Lehman Marla Dowell


NIST Special Publication 250-77
NIST MEASUREMENT SERVICES: High Power Laser Calibrations at NIST Xiaoyu Li Joshua Hadler Christopher Cromer John Lehman Marla Dowell Optoelectronics Division Electronics and Electrical Engineering Laboratory National Institute of Standards and Technology Boulder, CO 80305
September 2008
U.S. Department of Commerce Carlos M. Gutierrez, Secretary National Institute of Standards and Technology Patrick D. Gallagher, Deputy Director
Certain commercial entities, equipment, or materials may be identified in this document in order to describe an experimental procedure or concept adequately. Such identification is not intended to imply
recommendation or endorsement by the National Institute of Standards and Technology, nor is it intended to imply that the entities, materials, or equipment are necessarily the best available for the purpose.
National Institute of Standards and Technology Special Publication 250-77 Natl. Inst. Stand. Technol. Spec. Publ. 250-77, 22 pages (September 2008)
CODEN: NSPUE2
U.S. GOVERNMENT PRINTING OFFICE WASHINGTON: 2000
For sale by the Superintendent of Documents, U.S. Government Printing Office, Washington, DC 20402-9325
1 Introduction ................................................................................................................ 1 2 Calibration Service Summary ..................................................................................... 1 3 Theory of Measurement .............................................................................................. 2
3.1 System Basics and Measurement Principle ........................................................ 2 3.1.1 NIST Primary Standard for High Power Laser Measurements .................. 3 3.1.2 Measurement System .................................................................................. 4
3.2 Measurement Equations ...................................................................................... 4 3.3 Data Analysis ...................................................................................................... 5
3.3.1 Power Meters .............................................................................................. 5 3.3.2 Energy Meter .............................................................................................. 6 3.3.3 Calorimeter ................................................................................................. 7
4 Measurement System .................................................................................................. 8 4.1 Measurement Standards ...................................................................................... 8 4.2 Laser Sources ...................................................................................................... 8 4.3 Optical Setup ....................................................................................................... 8
4.3.1 Attenuator ................................................................................................... 8 4.3.2 Shutters ....................................................................................................... 8 4.3.3 Mirrors and Focusing .................................................................................. 8 4.3.4 Chopper Wheels .......................................................................................... 9
4.4 Data Acquisition ................................................................................................. 9 5 Standard Operating Procedures ................................................................................. 10
5.1 System Startup .................................................................................................. 10 5.2 Optical Alignment ............................................................................................. 10
5.2.1 Beam Extent .............................................................................................. 10 5.2.2 Beam Alignment ....................................................................................... 10
5.3 Data Acquisition ............................................................................................... 11 5.3.1 Software Setup .......................................................................................... 11 5.3.2 Software Operation. .................................................................................. 12
5.4 Data Analysis .................................................................................................... 12 6 Uncertainty Evaluation ............................................................................................. 13
6.1 Measurement Standard Uncertainties ............................................................... 14 6.1.1 Absorptivity (Type B) ............................................................................... 14 6.1.2 Electronics (Type B) ................................................................................. 14 6.1.3 Heater Leads (Type B) .............................................................................. 14 6.1.4 Inequivalence (Type B) ............................................................................. 14 6.1.5 Electrical Calibration (Type A) ................................................................ 14
iii
iv
6.2 Measurement System Uncertainties .................................................................. 15 6.2.1 Optical Shutter (Type A) .......................................................................... 15 6.2.2 Laser/System Instability (Type B) ............................................................ 16 6.2.3 Aperture Effects ........................................................................................ 16 6.2.4 Chopper Wheel Ratio (Type A) ................................................................ 16 6.2.5 Test Meter Measurement (Type A) ........................................................... 16
7 Quality Control. ........................................................................................................ 16 8 Summary ................................................................................................................... 17 9 References ..................................................................................................................18
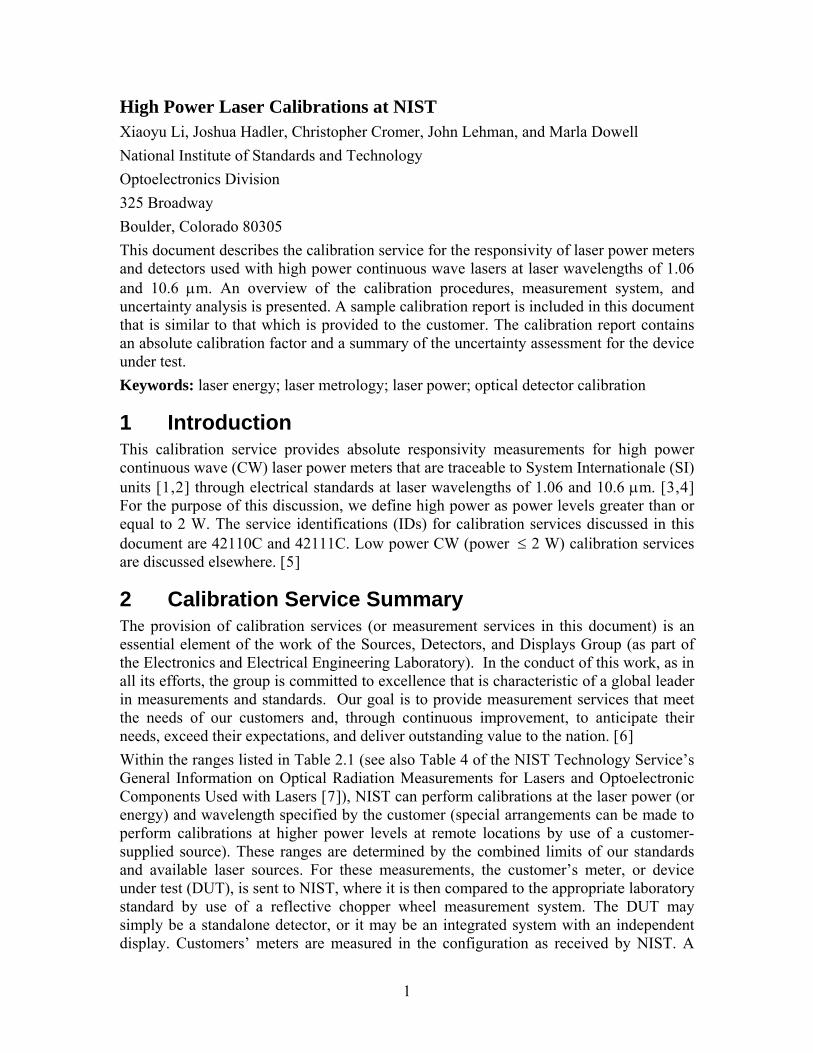
High Power Laser Calibrations at NIST Xiaoyu Li, Joshua Hadler, Christopher Cromer, John Lehman, and Marla Dowell National Institute of Standards and Technology Optoelectronics Division 325 Broadway Boulder, Colorado 80305 This document describes the calibration service for the responsivity of laser power meters and detectors used with high power continuous wave lasers at laser wavelengths of 1.06 and 10.6 μm. An overview of the calibration procedures, measurement system, and uncertainty analysis is presented. A sample calibration report is included in this document that is similar to that which is provided to the customer. The calibration report contains an absolute calibration factor and a summary of the uncertainty assessment for the device under test. Keywords: laser energy; laser metrology; laser power; optical detector calibration
1 Introduction This calibration service provides absolute responsivity measurements for high power continuous wave (CW) laser power meters that are traceable to System Internationale (SI) units [1,2] through electrical standards at laser wavelengths of 1.06 and 10.6 μm. [3,4] For the purpose of this discussion, we define high power as power levels greater than or equal to 2 W. The service identifications (IDs) for calibration services discussed in this document are 42110C and 42111C. Low power CW (power ≤ 2 W) calibration services are discussed elsewhere. [5]
2 Calibration Service Summary The provision of calibration services (or measurement services in this document) is an essential element of the work of the Sources, Detectors, and Displays Group (as part of the Electronics and Electrical Engineering Laboratory). In the conduct of this work, as in all its efforts, the group is committed to excellence that is characteristic of a global leader in measurements and standards. Our goal is to provide measurement services that meet the needs of our customers and, through continuous improvement, to anticipate their needs, exceed their expectations, and deliver outstanding value to the nation. [6] Within the ranges listed in Table 2.1 (see also Table 4 of the NIST Technology Service’s General Information on Optical Radiation Measurements for Lasers and Optoelectronic Components Used with Lasers [7]), NIST can perform calibrations at the laser power (or energy) and wavelength specified by the customer (special arrangements can be made to perform calibrations at higher power levels at remote locations by use of a customer-supplied source). These ranges are determined by the combined limits of our standards and available laser sources. For these measurements, the customer’s meter, or device under test (DUT), is sent to NIST, where it is then compared to the appropriate laboratory standard by use of a reflective chopper wheel measurement system. The DUT may simply be a standalone detector, or it may be an integrated system with an independent display. Customers’ meters are measured in the configuration as received by NIST. A
1
system consisting of a detector and display combination is calibrated as a unit. That is, components of the system are not calibrated independently. Normally, the absolute responsivity is characterized but no physical adjustments are made to the customer’s meter. At the completion of the calibration measurements, the DUT and a calibration report are sent to the customer. The calibration report summarizes the results of the measurements and provides a list of the associated measurement uncertainties. The laboratory standards used as references for these measurements were designed and built at NIST. All of the critical parameters (electrical calibration coefficient, absorptivity, etc.) for the laboratory standards have been evaluated at the laser wavelengths and power levels for which they are used.
Wavelength (μm)
Power Range Typical Relative Expanded Uncertainty (k=2) (%)
1.06 2 W to 1 kW 1
10.6 2 W to 2 kW 1
Table 2.1: Laser power and energy measurement capabilities.
More information can be found in the NIST Optoelectronics Division Quality Manual (QM-II) for descriptions of NIST, the NIST Optoelectronics Division, and their quality systems.[8]
3 Theory of Measurement
Chopper Wheel
NIST Standard
Laser
Shutter 1 Lens
DUT
Shutter 2
Data Acquisition
Monitor Detector
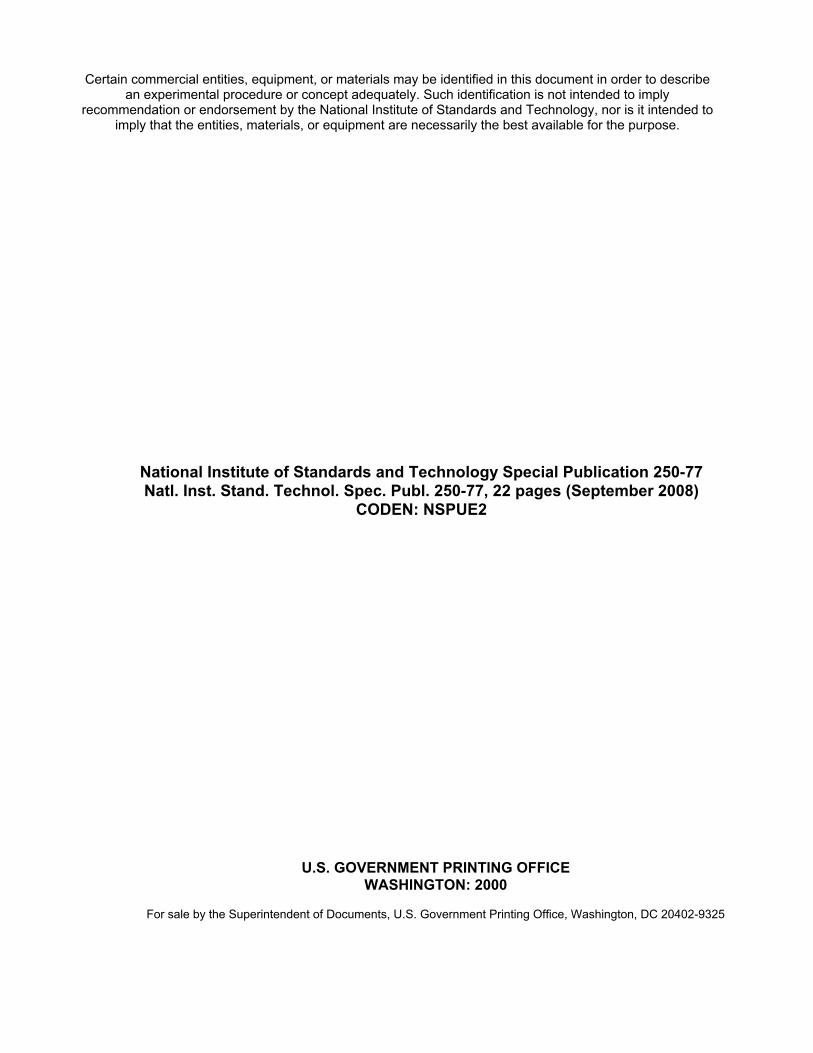
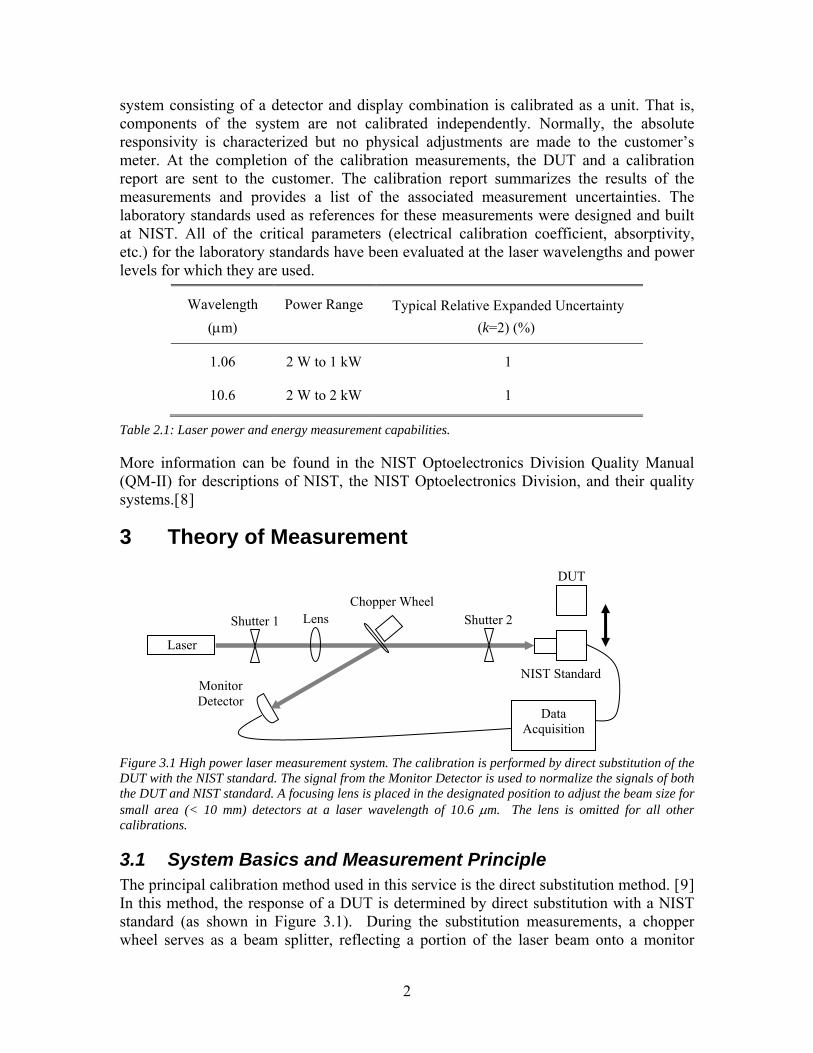
Figure 3.1 High power laser measurement system. The calibration is performed by direct substitution of the DUT with the NIST standard. The signal from the Monitor Detector is used to normalize the signals of both the DUT and NIST standard. A focusing lens is placed in the designated position to adjust the beam size for small area (< 10 mm) detectors at a laser wavelength of 10.6 μm. The lens is omitted for all other calibrations.
3.1 System Basics and Measurement Principle The principal calibration method used in this service is the direct substitution method. [9] In this method, the response of a DUT is determined by direct substitution with a NIST standard (as shown in Figure 3.1). During the substitution measurements, a chopper wheel serves as a beam splitter, reflecting a portion of the laser beam onto a monitor
2
detector and transmitting a portion of the beam onto either the DUT or NIST standard. The signal from the monitor detector is used to normalize the responses of both the DUT and NIST standard. Since a rotating chopper wheel is involved, this system is only suitable for measuring detector systems having a relatively slow (millisecond or slower) temporal response, such as thermal detectors, and using CW lasers or pulsed lasers with high pulse repetition frequencies (5 kHz or greater).
3.1.1 NIST Primary Standard for High Power Laser Measurements
Scale:10 cm
Absorbing Cavity
Calorimeter Case
Temp Controlled Jacket
Electrical HeaterTemperature Sensor
Reflector
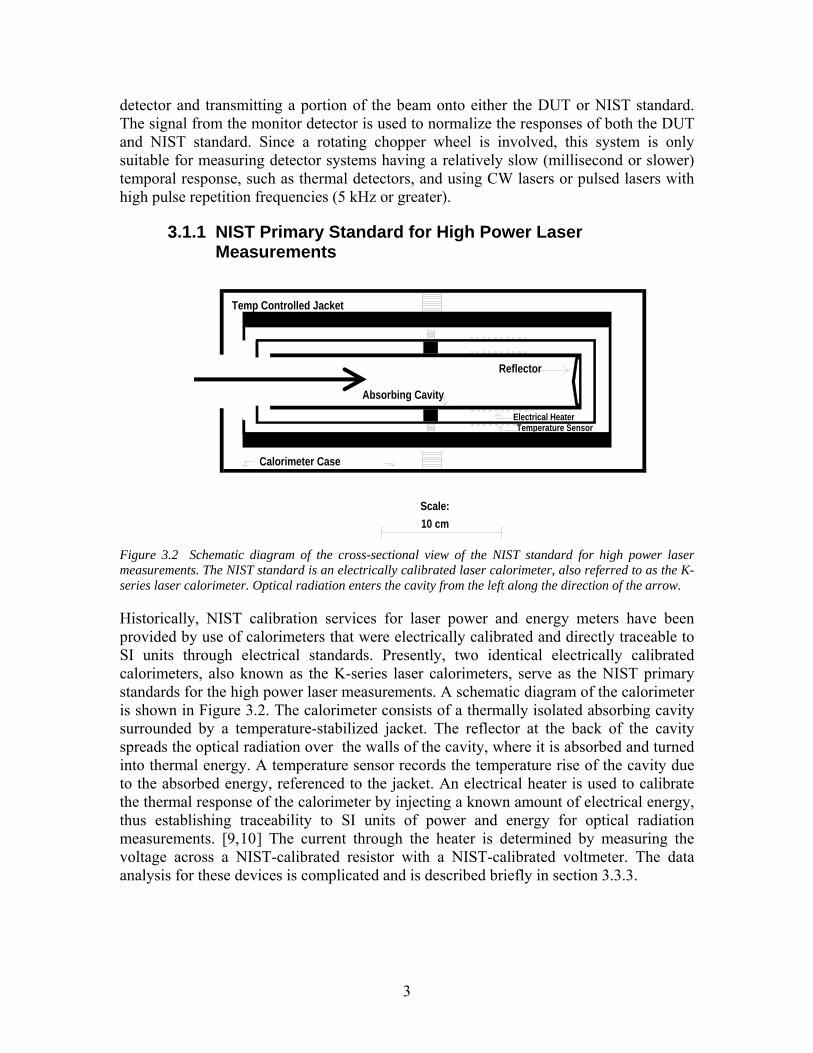
Figure 3.2 Schematic diagram of the cross-sectional view of the NIST standard for high power laser measurements. The NIST standard is an electrically calibrated laser calorimeter, also referred to as the K-series laser calorimeter. Optical radiation enters the cavity from the left along the direction of the arrow.
Historically, NIST calibration services for laser power and energy meters have been provided by use of calorimeters that were electrically calibrated and directly traceable to SI units through electrical standards. Presently, two identical electrically calibrated calorimeters, also known as the K-series laser calorimeters, serve as the NIST primary standards for the high power laser measurements. A schematic diagram of the calorimeter is shown in Figure 3.2. The calorimeter consists of a thermally isolated absorbing cavity surrounded by a temperature-stabilized jacket. The reflector at the back of the cavity spreads the optical radiation over the walls of the cavity, where it is absorbed and turned into thermal energy. A temperature sensor records the temperature rise of the cavity due to the absorbed energy, referenced to the jacket. An electrical heater is used to calibrate the thermal response of the calorimeter by injecting a known amount of electrical energy, thus establishing traceability to SI units of power and energy for optical radiation measurements. [9,10] The current through the heater is determined by measuring the voltage across a NIST-calibrated resistor with a NIST-calibrated voltmeter. The data analysis for these devices is complicated and is described briefly in section 3.3.3.
3
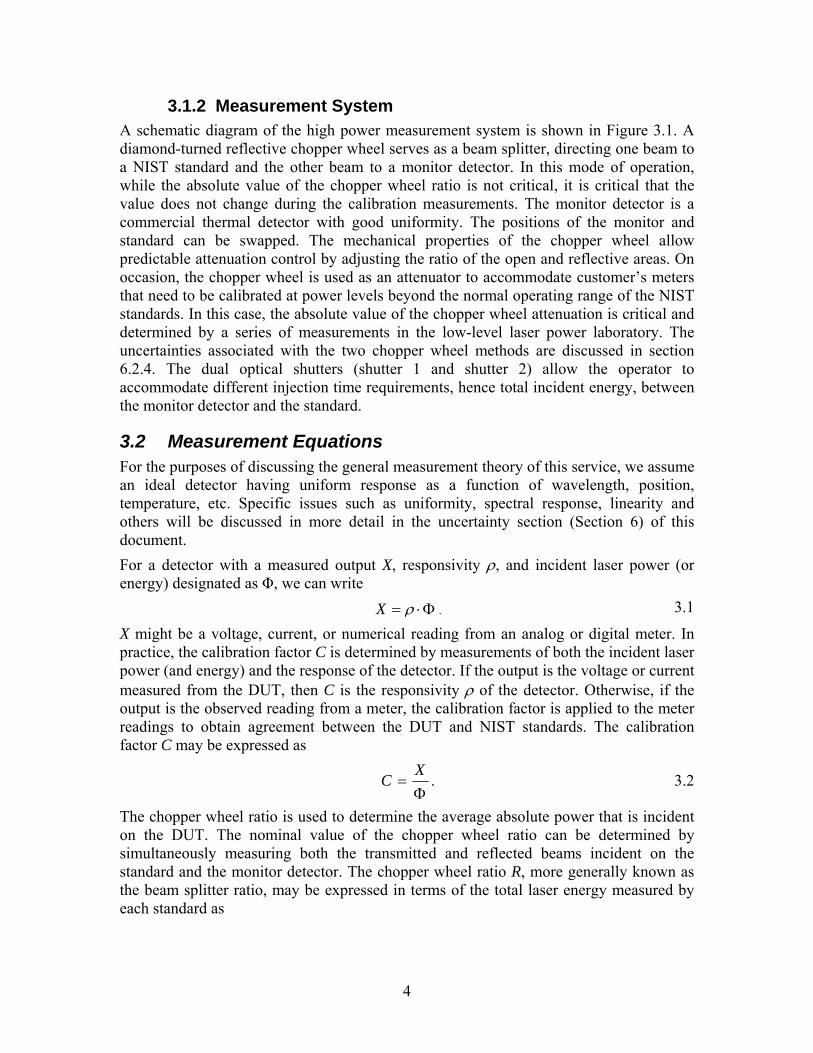
3.1.2 Measurement System A schematic diagram of the high power measurement system is shown in Figure 3.1. A diamond-turned reflective chopper wheel serves as a beam splitter, directing one beam to a NIST standard and the other beam to a monitor detector. In this mode of operation, while the absolute value of the chopper wheel ratio is not critical, it is critical that the value does not change during the calibration measurements. The monitor detector is a commercial thermal detector with good uniformity. The positions of the monitor and standard can be swapped. The mechanical properties of the chopper wheel allow predictable attenuation control by adjusting the ratio of the open and reflective areas. On occasion, the chopper wheel is used as an attenuator to accommodate customer’s meters that need to be calibrated at power levels beyond the normal operating range of the NIST standards. In this case, the absolute value of the chopper wheel attenuation is critical and determined by a series of measurements in the low-level laser power laboratory. The uncertainties associated with the two chopper wheel methods are discussed in section 6.2.4. The dual optical shutters (shutter 1 and shutter 2) allow the operator to accommodate different injection time requirements, hence total incident energy, between the monitor detector and the standard.
3.2 Measurement Equations For the purposes of discussing the general measurement theory of this service, we assume an ideal detector having uniform response as a function of wavelength, position, temperature, etc. Specific issues such as uniformity, spectral response, linearity and others will be discussed in more detail in the uncertainty section (Section 6) of this document. For a detector with a measured output X, responsivity ρ, and incident laser power (or energy) designated as Φ, we can write = ⋅ρ ΦX . 3.1
X might be a voltage, current, or numerical reading from an analog or digital meter. In practice, the calibration factor C is determined by measurements of both the incident laser power (and energy) and the response of the detector. If the output is the voltage or current measured from the DUT, then C is the responsivity ρ of the detector. Otherwise, if the output is the observed reading from a meter, the calibration factor is applied to the meter readings to obtain agreement between the DUT and NIST standards. The calibration factor C may be expressed as
Φ
=X
C . 3.2
The chopper wheel ratio is used to determine the average absolute power that is incident on the DUT. The nominal value of the chopper wheel ratio can be determined by simultaneously measuring both the transmitted and reflected beams incident on the standard and the monitor detector. The chopper wheel ratio R, more generally known as the beam splitter ratio, may be expressed in terms of the total laser energy measured by each standard as
4
SM
SR−Φ
Φ= , 3.3
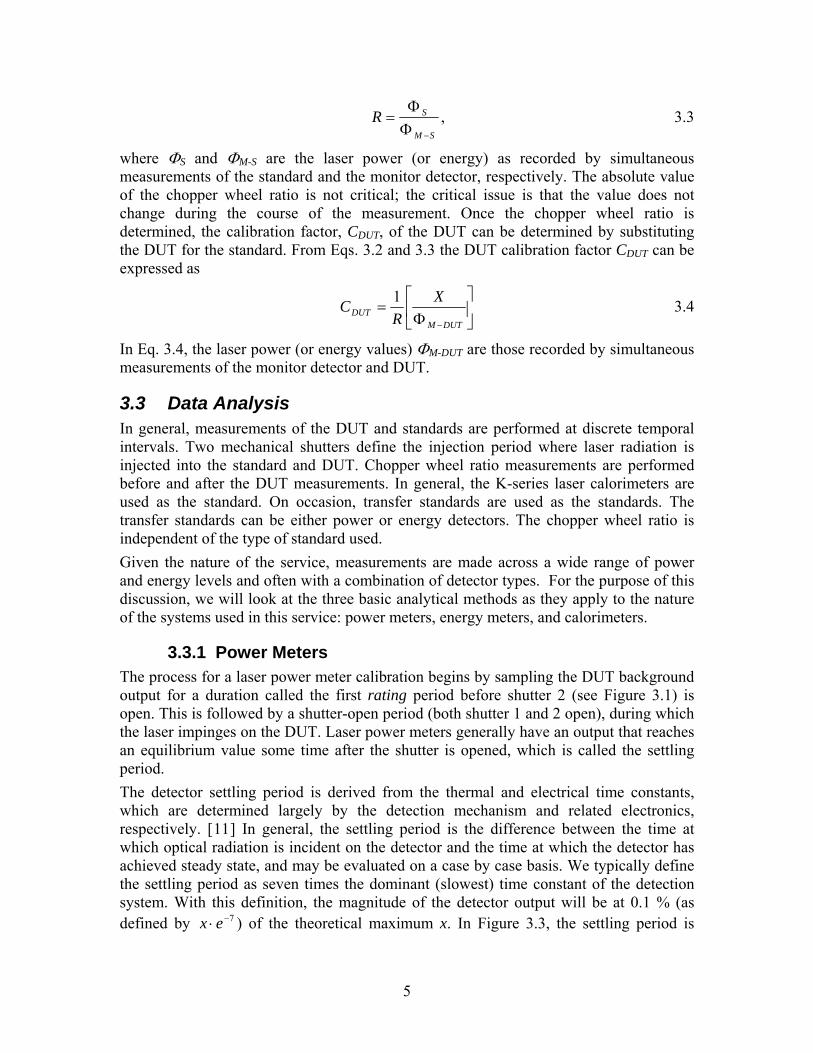
where ΦS and ΦM-S are the laser power (or energy) as recorded by simultaneous measurements of the standard and the monitor detector, respectively. The absolute value of the chopper wheel ratio is not critical; the critical issue is that the value does not change during the course of the measurement. Once the chopper wheel ratio is determined, the calibration factor, CDUT, of the DUT can be determined by substituting the DUT for the standard. From Eqs. 3.2 and 3.3 the DUT calibration factor CDUT can be expressed as
⎥⎦
⎤⎢⎣
⎡Φ
=−DUTM
DUTX
RC 1 3.4
In Eq. 3.4, the laser power (or energy values) ΦM-DUT are those recorded by simultaneous measurements of the monitor detector and DUT.
3.3 Data Analysis In general, measurements of the DUT and standards are performed at discrete temporal intervals. Two mechanical shutters define the injection period where laser radiation is injected into the standard and DUT. Chopper wheel ratio measurements are performed before and after the DUT measurements. In general, the K-series laser calorimeters are used as the standard. On occasion, transfer standards are used as the standards. The transfer standards can be either power or energy detectors. The chopper wheel ratio is independent of the type of standard used. Given the nature of the service, measurements are made across a wide range of power and energy levels and often with a combination of detector types. For the purpose of this discussion, we will look at the three basic analytical methods as they apply to the nature of the systems used in this service: power meters, energy meters, and calorimeters.
3.3.1 Power Meters The process for a laser power meter calibration begins by sampling the DUT background output for a duration called the first rating period before shutter 2 (see Figure 3.1) is open. This is followed by a shutter-open period (both shutter 1 and 2 open), during which the laser impinges on the DUT. Laser power meters generally have an output that reaches an equilibrium value some time after the shutter is opened, which is called the settling period. The detector settling period is derived from the thermal and electrical time constants, which are determined largely by the detection mechanism and related electronics, respectively. [11] In general, the settling period is the difference between the time at which optical radiation is incident on the detector and the time at which the detector has achieved steady state, and may be evaluated on a case by case basis. We typically define the settling period as seven times the dominant (slowest) time constant of the detection system. With this definition, the magnitude of the detector output will be at 0.1 % (as defined by ) of the theoretical maximum x. In 7−⋅ ex Figure 3.3, the settling period is
5

shown graphically as the duration between the shutter open condition and the starting point of the measurement period. After the settling period, N readings of the DUT output are acquired and then averaged. The shutter is closed for another period equal to the settling period. A second set of samples of the background output is acquired from the DUT, which is called the second rating period. The signal from the DUT can then be calculated by subtracting the average background from both rating periods from the average DUT output during the measurement period. If the DUT has an analog or digital display, then visual readings may be recorded at equal time intervals by the operator during this process, otherwise standard automated data acquisition practices are followed, e.g., GPIB or serial port read out. The monitor detector monitors the incident laser power during the measurement. The DUT signal is normalized to the monitor detector signal. The calibration factor is determined by dividing the normalized DUT signal by the beam splitter ratio R.
Figure 3.3 Example of power meter output as a function of time t.
3.3.2 Energy Meter The sequence of events for measurement of energy meters is fundamentally the same as that of power meter measurements, although the data analysis is slightly different. There are many types of energy meters that might require calibration. Some may have an output that is similar to that in Figure 3.3, but the analysis may be performed differently depending on the specifics of the DUT. The baseline is still determined from the rating periods before and after the injection period. The average baseline is subtracted first from the entire waveform. The waveform is then numerically integrated from the data acquired during the period defined by the start of the shutter open to the end of the settling period after the shutter is closed. Other types of energy meters may require a measurement of the peak output from the DUT as the output to use in the calibration. If the DUT has an analog or digital meter, then visual readings may be recorded by the operator during this process. For energy meter calibrations, the maximum energy threshold of the standard used will determine the total energy incident on the DUT during the measurement.
Injection period
Shutteropen
Shutter closed
Settling period
Settling period
Rating period
Det
ecto
r ou
tput
Rating period
Measurement period
t
6
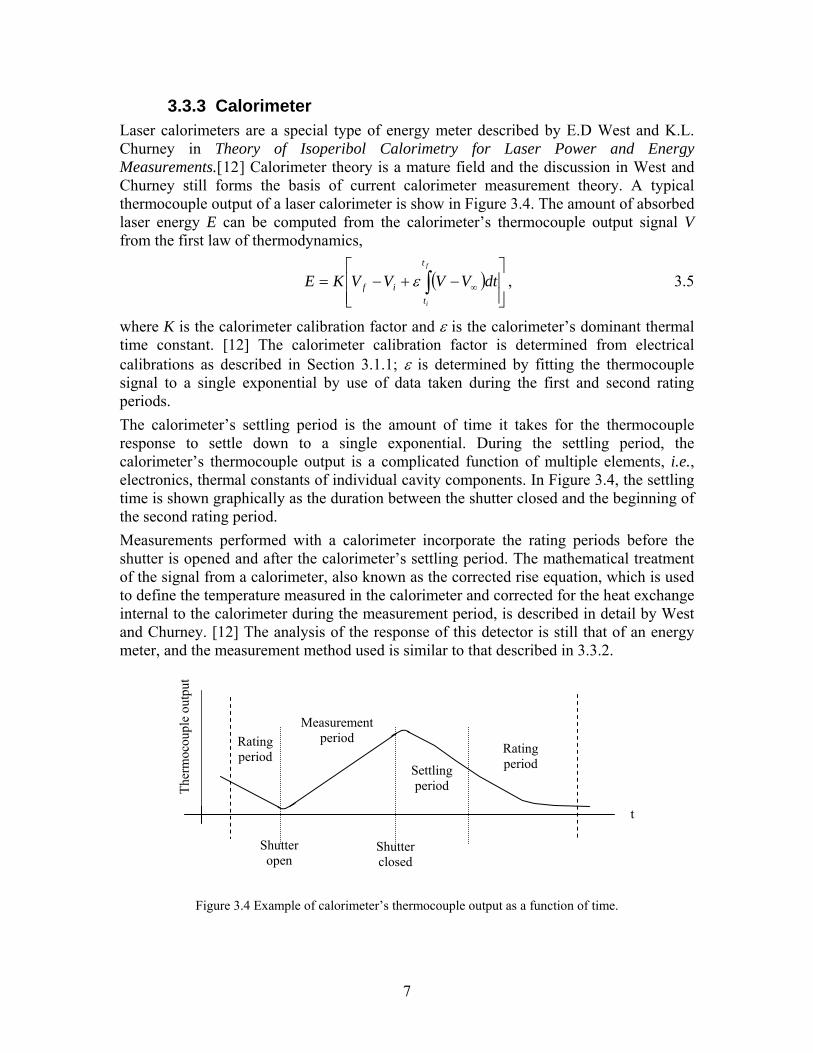
3.3.3 Calorimeter Laser calorimeters are a special type of energy meter described by E.D West and K.L. Churney in Theory of Isoperibol Calorimetry for Laser Power and Energy Measurements.[12] Calorimeter theory is a mature field and the discussion in West and Churney still forms the basis of current calorimeter measurement theory. A typical thermocouple output of a laser calorimeter is show in Figure 3.4. The amount of absorbed laser energy E can be computed from the calorimeter’s thermocouple output signal V from the first law of thermodynamics,
, 3.5 ( ) ⎥⎤
⎢⎡
−+−= ∫ ∞
ft
if dtVVVVKE ε⎥⎦⎢⎣ it
where K is the calorimeter calibration factor and ε is the calorimeter’s dominant thermal time constant. [12] The calorimeter calibration factor is determined from electrical calibrations as described in Section 3.1.1; ε is determined by fitting the thermocouple signal to a single exponential by use of data taken during the first and second rating periods. The calorimeter’s settling period is the amount of time it takes for the thermocouple response to settle down to a single exponential. During the settling period, the calorimeter’s thermocouple output is a complicated function of multiple elements, i.e., electronics, thermal constants of individual cavity components. In Figure 3.4, the settling time is shown graphically as the duration between the shutter closed and the beginning of the second rating period. Measurements performed with a calorimeter incorporate the rating periods before the shutter is opened and after the calorimeter’s settling period. The mathematical treatment of the signal from a calorimeter, also known as the corrected rise equation, which is used to define the temperature measured in the calorimeter and corrected for the heat exchange internal to the calorimeter during the measurement period, is described in detail by West and Churney. [12] The analysis of the response of this detector is still that of an energy meter, and the measurement method used is similar to that described in 3.3.2.
Ther
moc
oupl
e ou
tput
Figure 3.4 Example of calorimeter’s thermocouple output as a function of time.
t
Shutter open
Shutter closed
Rating period
Settling period
Rating period
Measurement period
7

4 Measurement System
4.1 Measurement Standards Energy and power measurements can be acquired by a variety of types of detectors. Such detectors might include, but are not limited to, thermopiles (surface and volume absorbers), and calorimeters. More than one type of detector or standard may be employed as a transfer standard for any given measurement. NIST standards currently in use for this service are the K-Series laser calorimeters (see section 3.1.1). Appropriate commercial detectors are used as transfer standards as necessary. (See the K-series Calibration Service quality manual (K-series QMIII) for information regarding the maintenance and operation of transfer standards.) [6]
4.2 Laser Sources The 42110C and 42111C calibration services rely on a suite of commercial laser sources, at fixed wavelengths of 1.06 μm (power levels from 2 W to 1 kW) and 10.6 μm (power levels from 2 W to 2 kW).
4.3 Optical Setup The basic optical setup is represented in Figure 3.1.
4.3.1 Attenuator An attenuation system is used for control of the laser power delivered to the measurement system that will not impart steering effects or otherwise change the overall beam profile. The method of attenuation may change, depending on the laser source and the power levels desired. These methods may employ neutral density filters, low transmittance mirrors, or optical choppers. [13]
4.3.2 Shutters It is necessary to control and quantify the injection time during a measurement. Computer-controlled mechanical shutters are used. The data acquisition system controls these shutters remotely and records the duration of the shutter openings. Two shutters (shutter 1 and shutter 2, see Figure 3.1) allow the operator to define different measurement periods for the DUT and NIST standard.
4.3.3 Mirrors and Focusing The high power calibration service employs a suite of lasers operating at 1.06 and 10.6 μm and a flexible optical layout to accommodate these wavelengths. Multiple mirror sets are maintained, allowing for optimum transmission at a particular wavelength. Additionally, lenses are used to allow the operator to adjust the beam size to accommodate small area (< 10 mm diameter) detectors at 10.6 μm. The lens is aligned so the beam is centered and normal to the surface of the lens. Normal incidence may be determined by observing the retro-reflection from the lens, and centering the retro-reflection on the upstream mirror.
8
4.3.4 Chopper Wheels A selection of chopper wheels is used to accommodate different power levels. The chopper wheel ratio is measured for each calibration set up before and after the DUT measurement. The materials selected for use as chopper wheels are chosen from known materials with thermally stable properties. Typically, the chopper wheel is used as a beam splitter. In this case, the absolute value of the chopper wheel ratio is not critical. It is critical that the chopper wheel ratio R does not change during the course of the DUT measurements. To ensure that the ratio does not change, the value for the chopper wheel ratio is determined by performing measurements both before and after the DUT measurements. On occasion, a chopper wheel is used as an attenuator to accommodate different power levels for use with the DUT and NIST standard. In this instance, the absolute value of the chopper wheel ratio is critical and the chopper wheel ratio is calibrated in the low-level laser power laboratory at three different radii along the open sector. The uncertainties associated with these two modes of operation are described in section 6.2.4.
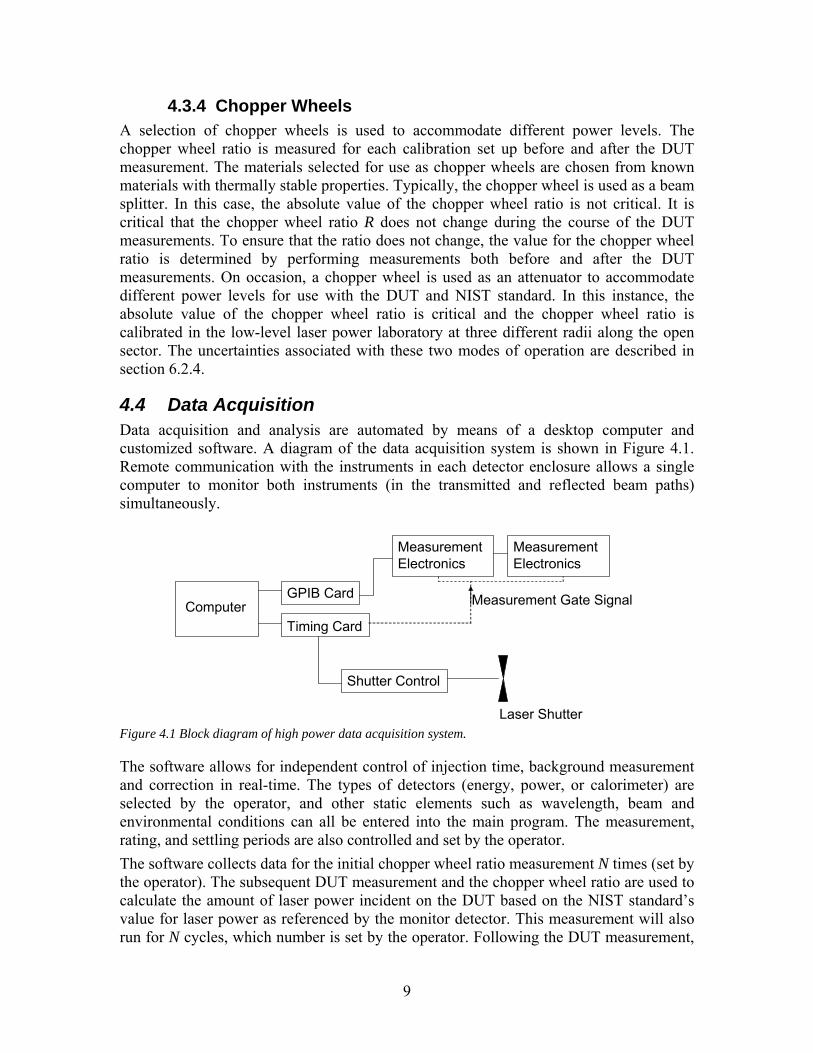
4.4 Data Acquisition Data acquisition and analysis are automated by means of a desktop computer and customized software. A diagram of the data acquisition system is shown in Figure 4.1. Remote communication with the instruments in each detector enclosure allows a single computer to monitor both instruments (in the transmitted and reflected beam paths) simultaneously.
ComputerGPIB Card
MeasurementElectronics
Laser Shutter
Shutter Control
MeasurementElectronics
Timing Card
Measurement Gate Signal
Figure 4.1 Block diagram of high power data acquisition system.
The software allows for independent control of injection time, background measurement and correction in real-time. The types of detectors (energy, power, or calorimeter) are selected by the operator, and other static elements such as wavelength, beam and environmental conditions can all be entered into the main program. The measurement, rating, and settling periods are also controlled and set by the operator. The software collects data for the initial chopper wheel ratio measurement N times (set by the operator). The subsequent DUT measurement and the chopper wheel ratio are used to calculate the amount of laser power incident on the DUT based on the NIST standard’s value for laser power as referenced by the monitor detector. This measurement will also run for N cycles, which number is set by the operator. Following the DUT measurement,
9

a second set of chopper wheel measurements is taken to assure that there has been no significant drift in the chopper wheel ratio. If both measurements are consistent, the final value for the chopper wheel ratio is the average of the all chopper wheel ratio measurements.
5 Standard Operating Procedures
5.1 System Startup All electronics and other support systems are powered up at least one hour prior to the start of the measurement. All test equipment is allowed to equilibrate with room temperature. The laser is selected for the desired wavelength and power, and is energized at least one hour before alignment to allow for stabilization of the laser pointing.
5.2 Optical Alignment Adjustable apertures are set to block stray light (scatter and halo), but not to occlude the beam incident on the DUT and/or standard(s). The beam is centered on the DUT, the monitor detector, and the NIST standard to within 1 mm. A higher degree of alignment accuracy is unnecessary as the diameter of the beam extent is generally 75 % or less than the active area of the DUT and the typical diameter of a DUT is 25 mm or greater.
5.2.1 Beam Extent The diameter of the extent of the beam must be smaller than the diameters prescribed by the active areas of the DUT and NIST standards. The extent of the beam is defined by the diameter where 99.9% of the beam power is contained. The extent of the beam is determined by placing a centered adjustable aperture in front of a power detector (placed at the same relative position as the DUT), with the aperture set to occlude 0.1% of the incident beam. The diameter of the aperture at this point establishes the extent of the beam. This diameter should generally be less than 75 % of the diameter prescribed by the active area of the DUT.
5.2.2 Beam Alignment The alignment process follows these basic steps:
• Select the proper optics for the measurement. This includes, but may not be limited to: mirrors, chopper wheel, lenses, filters and/or attenuators.
• Ensure beam is centered on the shutter. • Direct the beam toward the chopper wheel (see Fig. 3.1).
A focusing lens is used for calibrations of small area detectors at 10.6 μm when a laser beam size of 10 mm or less is desired. The focusing lens is placed in the necessary position to establish proper beam size, and aligned so the beam is centered and normal to the surface of the lens. Normal incidence may be determined by observing the retro-reflection from the lens, and centering the retro-reflection on the upstream mirror.
• Steer the beam to the center of the alignment target in each measurement enclosure.
10
Since the beam area is smaller than the active area of the DUT and NIST standards, the alignment itself is not critical as long as the laser beam is centered on, and perpendicular to, the DUT, the standards, and the monitor detector. Spatial non-uniformities in the DUT are not characterized. It is the customer’s responsibility to evaluate the effect of spatial non-uniformities on their measurements. When a DUT exhibits gross deficiencies in performance, the measurements are suspended and the customer is contacted for further instructions.
5.3 Data Acquisition The data acquisition of this measurement service employs computer-controlled remote measurement equipment. The software that controls the measurement also analyzes the collected data. Data collection is performed in three separate steps:
• Chopper wheel ratio measurements are performed. Multiple samples are acquired. The number of samples may vary depending on injection time and detectors used.
• DUT measurements are taken. Again, the number of samples may vary depending on detectors and injection times.
• A second set of chopper wheel measurements are taken. This is to ensure that the chopper wheel ratio has not changed during the test meter measurement.
Data are analyzed after each measurement.
5.3.1 Software Setup Before measurements begin, the data acquisition software needs to have all of the necessary information entered. The first information to be entered is the general information about the overall measurement:
• Measurement wavelength: this allows the system to compensate for any wavelength dependencies that may be inherent to a given standard. For calorimeters, this can be the optical reflectance of the calorimeter at a given wavelength of the standard being used.
• Laboratory temperature and humidity. • Calibration Service specific information: NIST ID number(s) of the DUT and
NIST folder number. • Any other general information, including, but not limited to, DUT name,
customer, power level measured, and unique optics used (focusing lenses, for example).
• The settling period is usually seven times the time constant of the DUT. The settling time or time constant is generally provided by the manufacturer’s specifications. Where the settling period is less than that of the standard being used, the settling period of the standard takes precedence.
• Time interval for each data point recorded. Next, information specific to the chopper wheel measurements is entered:
11

• Monitor detector/Standard used: both detectors (transmitted and reflected) are identified and selected in the software interface.
• Type of detector: Power, Energy, or Calorimeter. • Electronics settings that are enabled for remote control: Gain ranges for remote
voltage and/or current meters are set. In addition, specific channel allocation on multiplexed meters are entered.
• Time constant of detectors used. • Standard/Monitor gain. • Background, or rating period, time. • Injection times for both monitor and standard, which would be shutter 1 and
shutter 2. • Number of measurements.
Similarly, this information is set for the DUT measurement. Detector-specific information for the monitor detector should not be changed from that defined during the chopper wheel measurement. Rating period, injection, settling and time intervals are to be set according to the needs of the DUT calibration and may differ from the chopper wheel measurements.
5.3.2 Software Operation. During software operation, the chopper wheel measurements are started and the number of measurements (N), and the cooling time between each measurement is set. Cooling time is set when utilizing any type of thermal detector in the measurement process. The purpose is to allow the detector output to settle as the detector, either DUT or standard, cools down. This value is variable and depends on the amount of energy injected and the desired starting value, where applicable. When the chopper wheel ratio measurements are completed, the test meter measurements are launched. The number of measurements (N) and cooling time are also entered during this operation. Additionally, the option for “visual” recording is available if the DUT output is not compatible with the data acquisition system. Often, laser power meters will not have a remote measurement output (such as remote computer read back or analog output) and measurements will rely on visually recording the meter reading from the display of the test meter itself. The software allows for entering this information for each measurement in the set of measurements for the test meter.
5.4 Data Analysis Most of the pertinent analysis is performed in real-time during the measurement by the software.
• Power and/or energy levels of both transmitted and reflected beams during the chopper wheel measurements are calculated. Selection of the detector and detector type determines what algorithms the software will use in analysis.
• From these power/energy measurements, the chopper wheel ratio is determined, and standard deviation is calculated. Selection of gain and range in the software
12
settings scales the measurement to the instrument’s gain, and yields the true power measured.
• Power and/or energy levels of both transmitted and reflected beams during the DUT measurements are calculated.
• From these power/energy levels, the calibration factor for the DUT is determined, and standard deviation is calculated.
Following the measurement, the uncertainty contributions are determined depending on the detector(s) employed in the measurement; the total uncertainty is calculated.
6 Uncertainty Evaluation The uncertainty estimates for the NIST laser power and energy measurements are assessed following guidelines given in NIST Technical Note 1297, “Guidelines for Evaluating and Expressing the Uncertainty of NIST Measurement Results” by Barry N. Taylor and Chris E. Kuyatt. [14] To establish the uncertainty limits, the error sources are separated into Type B errors, whose magnitudes are determined by subjective judgment or other nonstatistical method, and Type A errors, whose magnitudes are obtained statistically from a series of measurements. All Type B error components are assumed independent and to have rectangular or uniform distributions (that is, each has an equal probability of being within the region, ± δi, and zero probability of being outside that region). If the distribution is rectangular, the standard deviation, σs, for each Type B error component is equal to δi/3½ and the total standard uncertainty is approximated by (Σσs
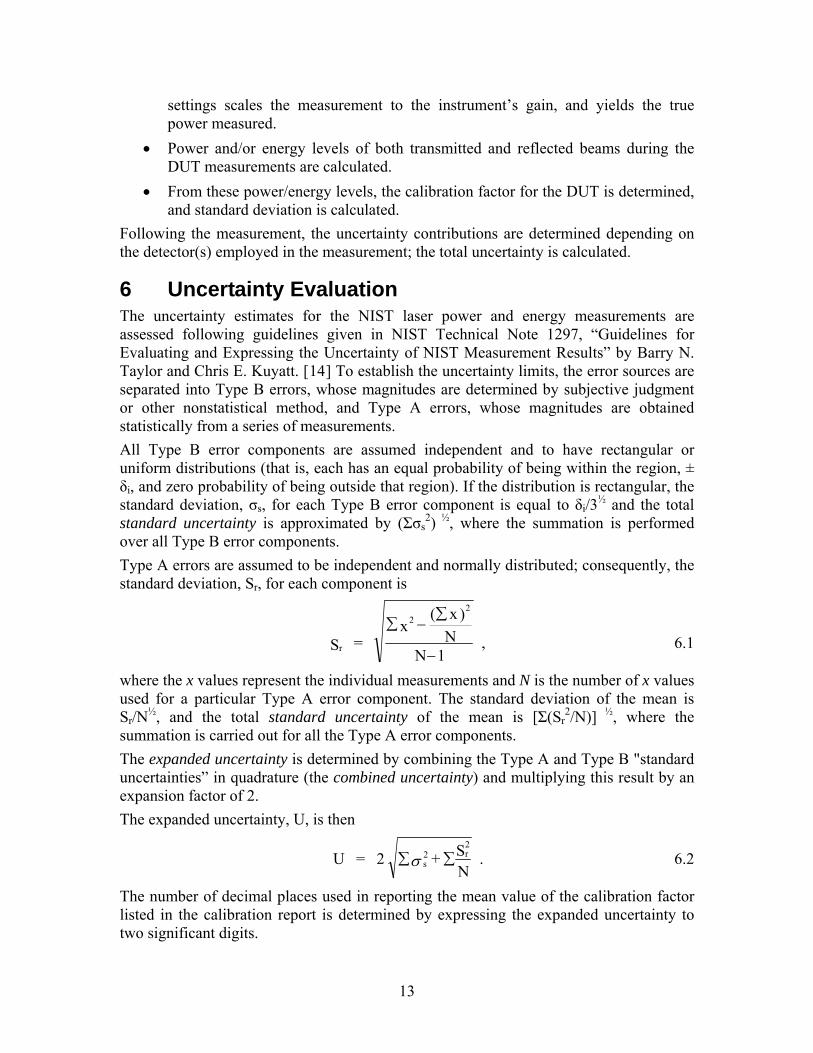
2) ½, where the summation is performed over all Type B error components. Type A errors are assumed to be independent and normally distributed; consequently, the standard deviation, Sr, for each component is
1NN
)x(x
= S
22
r −
∑−∑
, 6.1
where the x values represent the individual measurements and N is the number of x values used for a particular Type A error component. The standard deviation of the mean is Sr/N½, and the total standard uncertainty of the mean is [Σ(Sr
2/N)] ½, where the summation is carried out for all the Type A error components. The expanded uncertainty is determined by combining the Type A and Type B "standard uncertainties” in quadrature (the combined uncertainty) and multiplying this result by an expansion factor of 2. The expanded uncertainty, U, is then
NS+ 2 = U
2r2
s ∑∑σ . 6.2
The number of decimal places used in reporting the mean value of the calibration factor listed in the calibration report is determined by expressing the expanded uncertainty to two significant digits.
13

6.1 Measurement Standard Uncertainties The uncertainties specific to any given reference standard are documented in the K-series QMIII specific to the 42110C and 42111C calibration services. [6] However, it is proper to discuss the nature of these types of uncertainties, and their contribution to the overall uncertainty evaluation for each standard. Not all of the following uncertainty contributions will apply to any given standard, and in some cases, only a few will be applicable.
6.1.1 Absorptivity (Type B) The absorptivity of thermal-based detectors tends to have a uniform spectral responsivity, but the uncertainty in the actual absorptivity value is still essential to account for in the error summary for each detector. The uncertainty associated with the absorbtivity of the standard calorimeters used in this service is discussed elsewhere by T. Scott. [15]
6.1.2 Electronics (Type B) Where individual standards utilize discrete electronics that are integral to that detector, the accuracies of these electronics will also contribute to the uncertainty of the measurement. The contributions will vary from detector to detector, depending on the electronics, and are accounted for in the individual uncertainties for each detector used.
6.1.3 Heater Leads (Type B) The uncertainty associated with the heater leads is due to the electrical heating that may occur due to the finite resistance associated with the leads. The resistance of the leads is measured by use of a standard ohm meter.
6.1.4 Inequivalence (Type B) In the case of electrically calibrated standards, the difference in temperature response between optically-delivered power and electrically delivered power (during electrical calibration of the standard) is described as the inequivalence of the detector. The methods used to determine this value for the isoperibol calorimeter are described by E.G. Johnson. [16] This uncertainty is currently implemented only for measurements by use of electrically calibrated calorimeters. The uncertainty for the inequivalence of the standard calorimeters used in this service is covered by T. Scott. [15]
6.1.5 Electrical Calibration (Type A) The uncertainty associated with the electrical calibration is determined from a series of measurements to characterize the K-series laser calorimeters with a known quantity of electrical energy. A known quantity of electrical energy is injected into the calorimeter by an electrical heater attached to the calorimeter’s receiver. The amount of electrical energy is determined from measurements of the voltage across the heater resistance, the average heater current, and the injection time. The heater resistor and a standard resistor are connected in series. The nominal resistance of the standard resistor is 1 Ω with an expanded uncertainty of 0.0018 %. The average heater current is determined from measurements of the voltage drop across a standard resistor and the standard resistor’s known resistance. The uncertainty associated with the voltage measurements is
14

designated as “Electronics” in Table 6.1. The heater current is chosen such that the average power dissipated by the electrical heater is approximately equivalent to the average optical power incident on the calorimeter during operation. The sources of uncertainty are listed in Table 6.1.
Source of Uncertainty Standard Calorimeter System
Type B Type A
σs (%) Sr (%) N
Inequivalence 0.14
Electronics 0.06
Absorptivity 0.34
Heater Leads 0.20
Electrical Calibration 0.18 170
Table 6.1 Example uncertainty budget associated with the electrical calibration of the K-series laser calorimeter.
6.2 Measurement System Uncertainties The uncertainties for this measurement system are included in each calibration report. The sources of uncertainty are summarized in Table 6.2 and discussed in detail in the following subsections.
Source of Uncertainty Measurement System
Type B Type A
σs (%) Sr (%) N
Laser/System Instability 0.29
Optical Shutter 0.01 6
Test Meter Measurement 0.15 10
Beam splitter Ratio 0.05 6
Table 6.2 Example summary of measurement uncertainties associated with DUT measurements. The Chopper wheel ratio is given a more general designation of “Beam splitter Ratio” in the Measurement Uncertainty budget.
6.2.1 Optical Shutter (Type A) The evaluation of energy meters and calorimeters requires integration over the entire injection time. Precise control of the injection time is accomplished by use of a computer-controlled optical shutter. The injection time is measured at the time of test with a typical uncertainty of 0.01 %.
15
6.2.2 Laser/System Instability (Type B) The variation of laser power during a given measurement can impact the accuracy of the measurement. Most lasers will tend to exhibit some form of power instability over the relatively shorter durations (100 to 300 sec.) of an individual measurement. The uncertainty contribution of laser power stability to the measurement is quantified by the difference in the average power over the full injection period and the average power measured after the settling time. Because different laser sources will have different drift characteristics, modeling of laser power drift was done to determine an upper bound of 0.50 % contribution, resulting in a standard measurement uncertainty of 0.29 %.
6.2.3 Aperture Effects The aperture effect is a function of the beam size and the properties of the detectors being compared, such as the detector area, aperture area, field of view, and spatial uniformity. More generally, it is described as an uncertainty contribution due to differing fields of view between detectors used in the measurement. If the detectors being compared have active areas of different size, in principle the detectors being compared do not see the same amount of optical power. The methods used to characterize this effect are described in NIST Special Publication SP250-62. [17] However, the contribution to the overall uncertainty budget is negligible for this measurement service.
6.2.4 Chopper Wheel Ratio (Type A) When the chopper wheel is used as a beam splitter, its uncertainty directly affects the overall uncertainty. The uncertainty is determined from the standard deviation of the chopper wheel ratio measurements by use of the monitor detector and NIST standard (see section 3). These measurements are performed both before and after the DUT measurements. When the chopper wheel is used as an attenuator, the absolute value for its attenuation is determined by a series of attenuation measurements at three different radii along the open sector of the chopper wheel. This attenuation calibration is performed in the low-level laser power laboratory. The typical standard deviation for the chopper wheel ratio in both of these modes of operation is 0.05 % or less.
6.2.5 Test Meter Measurement (Type A) The accuracy of the direct substitution measurement is quantified by the standard deviation of the transfer-standard calibration factors (see Eq. 3.4).
7 Quality Control. The Optoelectronic Division measurement services make use of quality assurance practices to ensure the validity of measurement results and their uncertainties. Such practices include
• Repeated measurements/calibrations compared over many time intervals • Comparison of previous results obtained by use of multiple reference standards if
available. • Routine, periodic internal comparisons of NIST standards that are used in
calibrating the DUT.
16
In the Optoelectronics Division, all calibration, MAP, and remote measurement services maintain check standards and control charts for periodic test of the measurement service. The procedure for selecting, storing, maintaining, and measuring check standards, control charts, and other practices are described in the K-series QM-III. [6] When available, historic data from previous measurements of a detector shall be placed into the test folder by the Measurement Services Coordinator after the preparation of the calibration report. The Calibration Leader and the Group Leader shall review these data before signing the calibration reports. If a significant variance from previous results is observed, the Group Leader may require another measurement of the check standard and calibration item as a test of measurement system conformance.
8 Summary The calibration service provides responsivity measurements of laser power and energy meters by direct substitution with the K-series laser calorimeters at laser wavelengths of 1.06 and 10.6 μm and laser power levels of 2 W and above. These responsivity measurements are traceable to SI units through electrical substitution measurements of the calorimeters. In this document we have summarized the basic measurement equation, the measurement procedure, and described the quantities that contribute to the relative standard uncertainty.
17
18
9 References
[1] Barry N. Taylor, The International System of Units (SI), NIST Special Publication 330, 2001 Edition.
[2] Barry N. Taylor, Guide for the Use of the International System of Units (SI), NIST Special Publication 811, 1995 Edition.
[3] D. E. West and L. B. Schmidt, A System for Calibrating Laser Power Meter for the Range 5-1000 W, NBS Technical Note 685 (1977).
[4] X. Li, T. R. Scott, C. L. Cromer, D. Keenan, F. Brandt, and K. Möstl, Power measurement standards for high-power lasers: comparison between the NIST and the PTB, Metrologia 37, 445-447 (2000).
[5] Joshua Hadler, Chris Cromer, and John Lehman, NIST Measurement Services: CW Laser Power and Energy Calibrations at NIST. Accepted by MCOM (2005); in press.
[6] X. Li, K-series (42110C/42111C) Calibration Services Quality Manual III (2007). [7] Laser Power and Energy Meter (or Detectors Used with Lasers) Calibrations
(42110C-42111C) http://ts.nist.gov/MeasurementServices/Calibrations/laseroptoelectronic.cfm#42110 [Accessed June 12, 2007].
[8] NIST Optoelectronics Division, http://www.boulder.nist.gov/div815 [Accessed June 12, 2007].
[9] E. D. West and L. B. Schmidt, A System for Calibration Laser Power Meters for the Range 5-1000W, NBS Tech Note 685 (1977).
[10] E. D. West, W.E. Case, A.L. Rasmussen, L.B. Schmidt; A Reference Calorimeter for Laser Energy Measurements. Journal of Research of the National Bureau of Standards – A. Physics and Chemistry 76A No. 1, January-February 1972.
[11] See for example, E.L. Dereniak, D.G. Crowe, Optical Radiation Detectors, (John Wiley & Sons, New York, 1984), p. 136.
[12] E.D West and K.L. Churney in Theory of Isoperibol Calorimetry for Laser Power and Energy Measurements (Journal of Applied Physics – Vol. 41 No. 6, May 1970).
[13] X. Li, T. Scott, S. Yang, C. Cromer, and M. Dowell, Nonlinearity Measurements of High-Power Laser Detectors at NIST. J. Res. Natl. Inst. Stand. Technol. 109, 429-434 (2004).
[14] Barry N. Taylor and Chris E. Kuyatt; Guidelines for Evaluating and Expressing the Uncertainty of NIST Measurement Results. NIST Technical Note 1297: p.8 1994 Edition.
[15] Thomas R. Scott, NBS Laser power and energy measurements. SPIE Proceedings Vol 888 Laser Beam Radiometry (1988).

19
[16] Eric G. Johnson Jr., Evaluating the inequivalence and a computational
simplification for the NBS laser energy standards. Applied Optics, Vol 16, page 2315, August 1977.
[17] David Livigni, High Accuracy Laser Power and Energy Meter Calibration Service. NIST Special Publication 250-62, Aug 2004.
NIST Technical Publications
Periodical
Journal of Research of the National Institute of Standards and Technology–Reports NIST research and development in metrology and related fields of physical science, engineering, applied mathematics, statistics, biotechnology, and information technology. Papers cover a broad range of subjects, with major emphasis on measurement methodology and the basic technology underlying standardization. Also included from time to time are survey articles on topics closely related to the Institute's technical and scientific programs. Issued six times a year. Nonperiodicals Monographs–Major contributions to the technical literature on various subjects related to the Institute's scientific and technical activities. Handbooks–Recommended codes of engineering and industrial practice (including safety codes) developed in cooperation with interested industries, professional organizations, and regulatory bodies. Special Publications–Include proceedings of conferences sponsored by NIST, NIST annual reports, and other special publications appropriate to this grouping such as wall charts, pocket cards, and bibliographies. National Standard Reference Data Series–Provides quantitative data on the physical and chemical properties of materials, compiled from the world's literature and critically evaluated. Developed under a worldwide program coordinated by NIST under the authority of the National Standard Data Act (Public Law 90-396). NOTE: The Journal of Physical and Chemical Reference Data (JPCRD) is published bimonthly for NIST by the American Institute of Physics (AlP). Subscription orders and renewals are available from AIP, P.O. Box 503284, St. Louis, MO 63150-3284. Building Science Series–Disseminates technical information developed at the Institute on building materials, components, systems, and whole structures. The series presents research results, test methods, and performance criteria related to the structural and environmental functions and the durability and safety characteristics of building elements and systems. Technical Notes–Studies or reports which are complete in themselves but restrictive in their treatment of a subject. Analogous to monographs but not so comprehensive in scope or definitive in treatment of the subject area. Often serve as a vehicle for final reports of work performed at NIST under the sponsorship of other government agencies. Voluntary Product Standards–Developed under procedures published by the Department of Commerce in Part 10, Title 15, of the Code of Federal Regulations. The standards establish nationally recognized requirements for products, and provide all concerned interests with a basis for common understanding of the characteristics of the products. NIST administers this program in support of the efforts of private-sector standardizing organizations. Order the following NIST publications–FIPS and NISTIRs–from the National Technical Information Service, Springfield, VA 22161. Federal Information Processing Standards Publications (FIPS PUB)–Publications in this series collectively constitute the Federal Information Processing Standards Register. The Register serves as the official source of information in the Federal Government regarding standards issued by NIST pursuant to the Federal Property and Administrative Services Act of 1949 as amended, Public Law 89-306 (79 Stat. 1127), and as implemented by Executive Order 11717 (38 FR 12315, dated May 11,1973) and Part 6 of Title 15 CFR (Code of Federal Regulations). NIST Interagency or Internal Reports (NISTIR)–The series includes interim or final reports on work performed by NIST for outside sponsors (both government and nongovernment). In general, initial distribution is handled by the sponsor; public distribution is handled by sales through the National Technical Information Service, Springfield, VA 22161, in hard copy, electronic media, or microfiche form. NISTIR's may also report results of NIST projects of transitory or limited interest, including those that will be published subsequently in more comprehensive form.

U.S. Department of Commerce National Institute of Standards and Technology 325 Broadway Boulder, CO 80305-3337 Official Business Penalty for Private Use $300


![The Gauge Block Handbook - NIST · appendix on drift eliminating designs is an adaptation for dimensional calibrations of the work of Joseph Cameron [5] on weighing designs. They](https://img.pdfslide.us/doc/110x75/5f08090e7e708231d4200170/the-gauge-block-handbook-nist-appendix-on-drift-eliminating-designs-is-an-adaptation.jpg)