Embed Size (px)
Citation preview
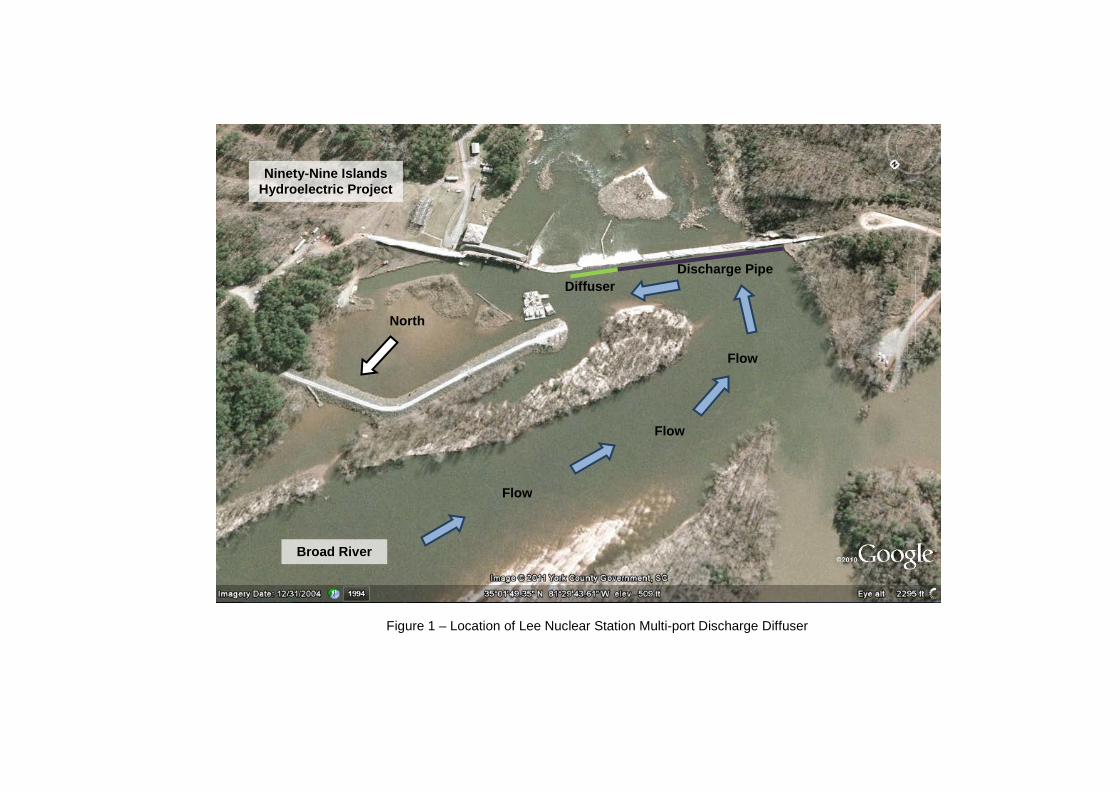
Figure Figure 1 – Location of Lee Nuclear Station Multi-port Discharge Diffuser
Broad River
North
Ninety-Nine Islands Hydroelectric Project
Discharge Pipe Diffuser
Flow
Flow
Flow
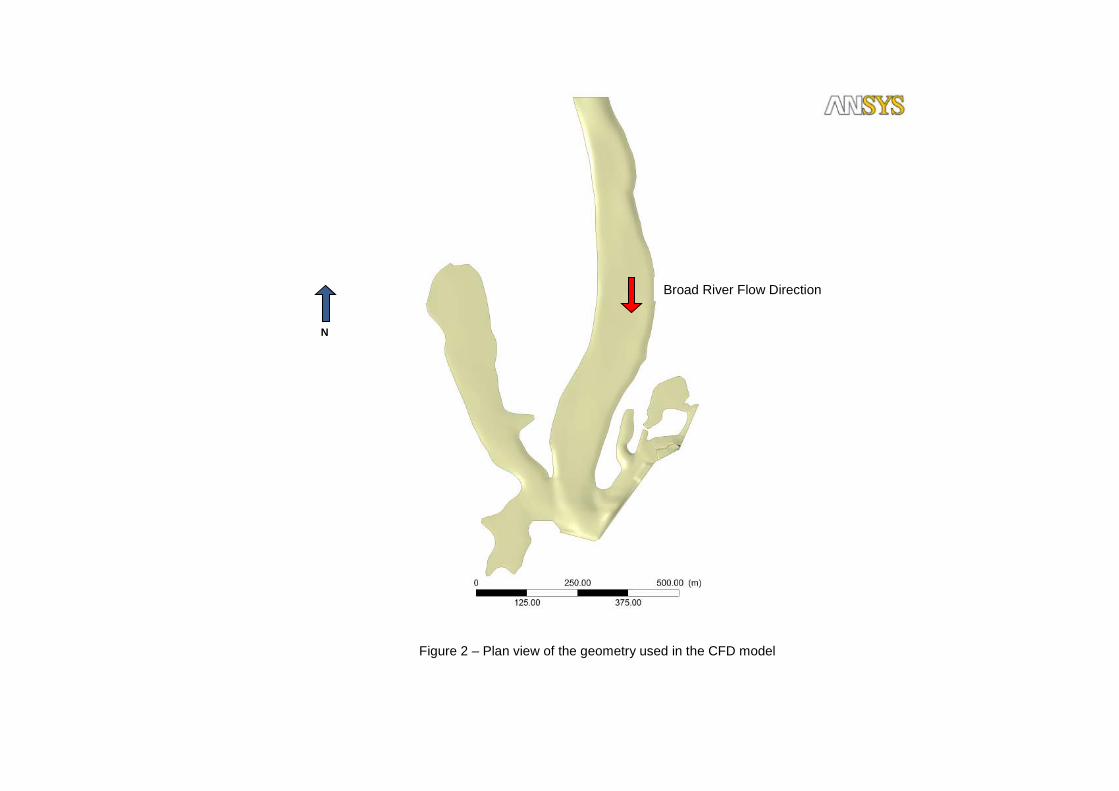
Figure Figure 2 – Plan view of the geometry used in the CFD model
N
Broad River Flow Direction
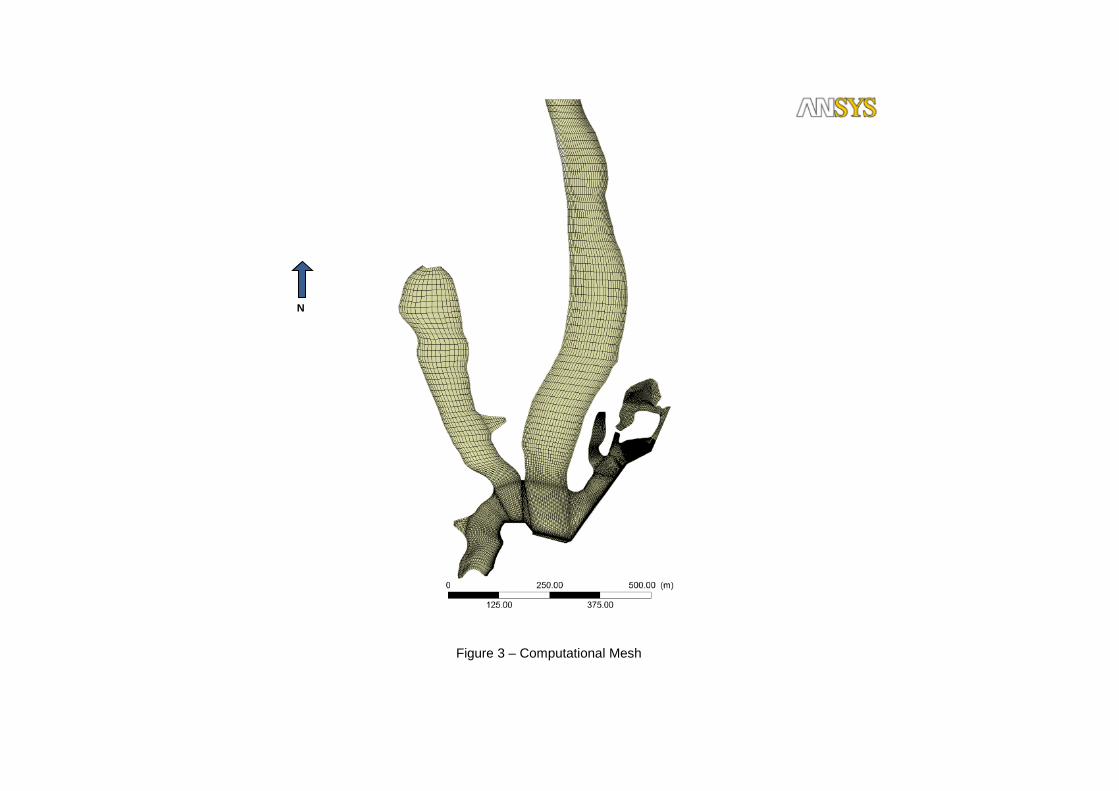
Figure 3 – Computational Mesh
N
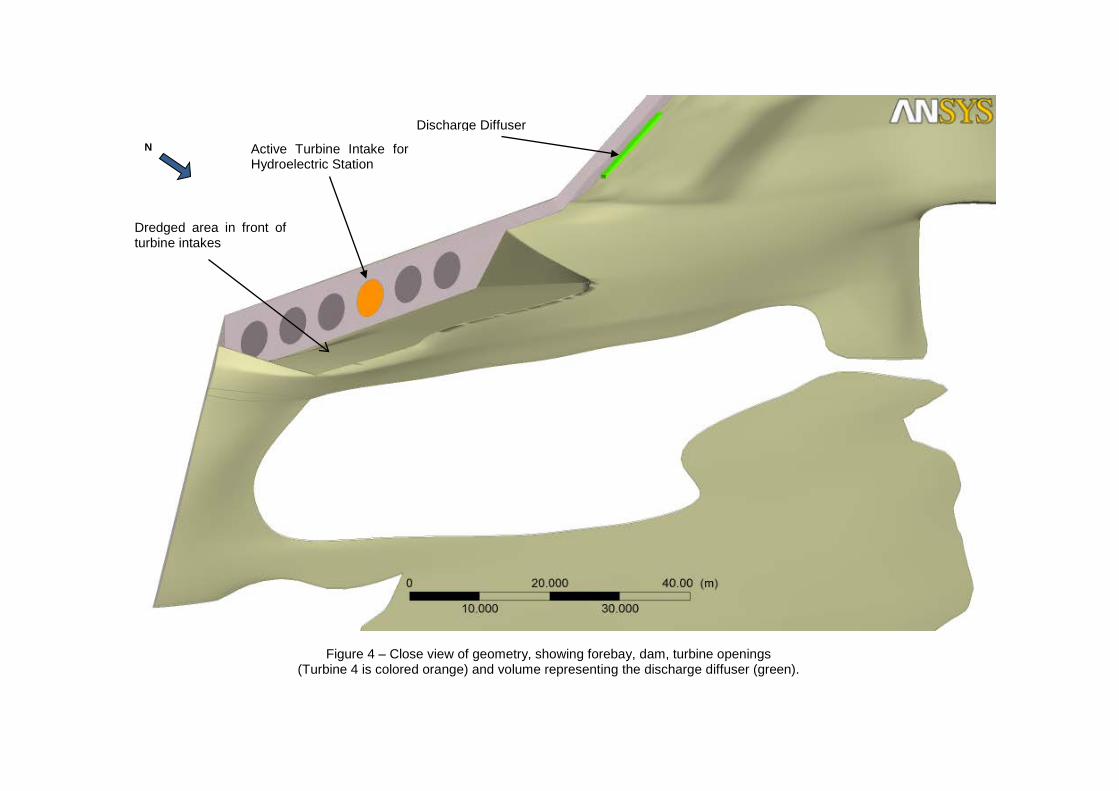
Figure 4 – Close view of geometry, showing forebay, dam, turbine openings (Turbine 4 is colored orange) and volume representing the discharge diffuser (green).
Discharge Diffuser
Active Turbine Intake for Hydroelectric Station
N
Dredged area in front of turbine intakes
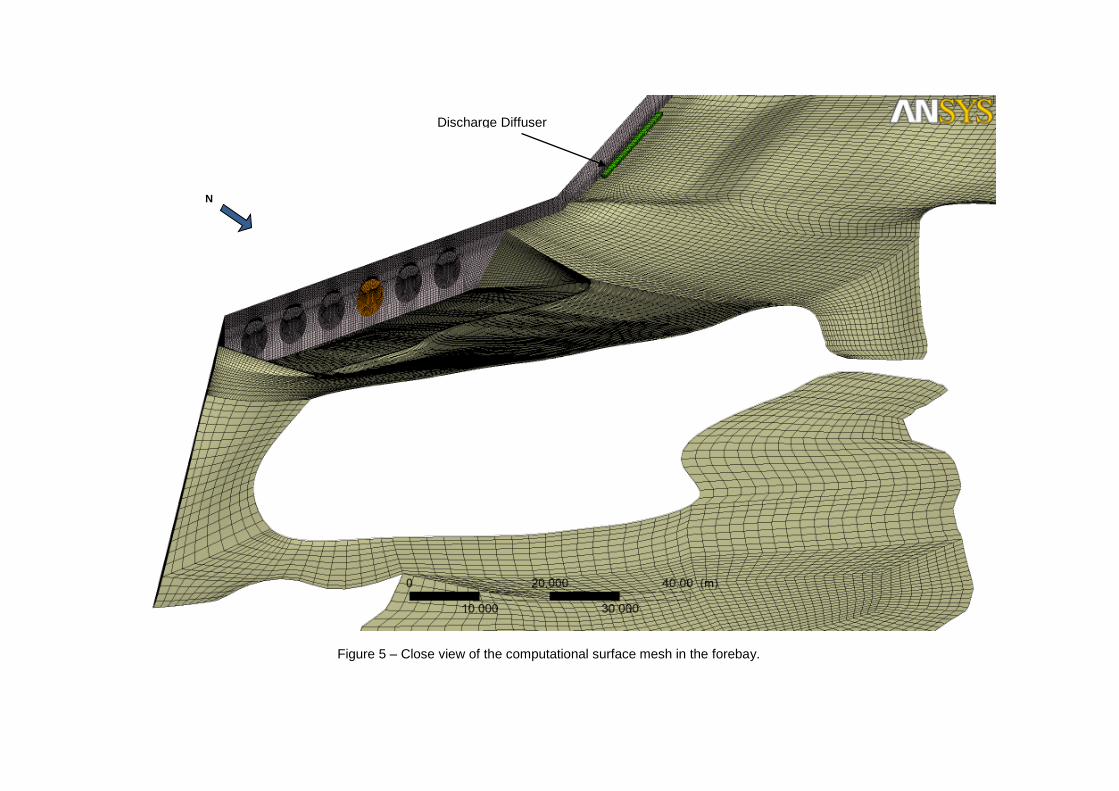
Figure 5 – Close view of the computational surface mesh in the forebay.
Discharge Diffuser
N
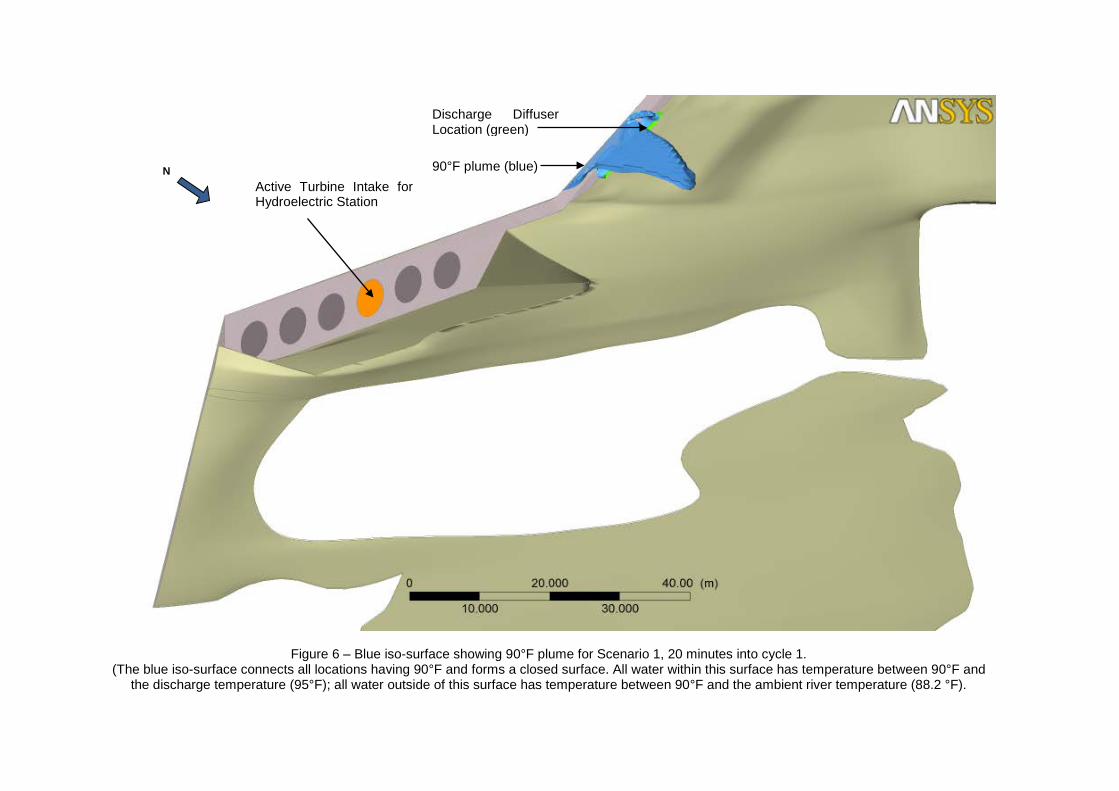
Figure 6 – Blue iso-surface showing 90°F plume for Scenario 1, 20 minutes into cycle 1. (The blue iso-surface connects all locations having 90°F and forms a closed surface. All water within this surface has temperature between 90°F and
the discharge temperature (95°F); all water outside of this surface has temperature between 90°F and the ambient river temperature (88.2 °F).
Active Turbine Intake for Hydroelectric Station
Discharge Diffuser Location (green)
90°F plume (blue) N
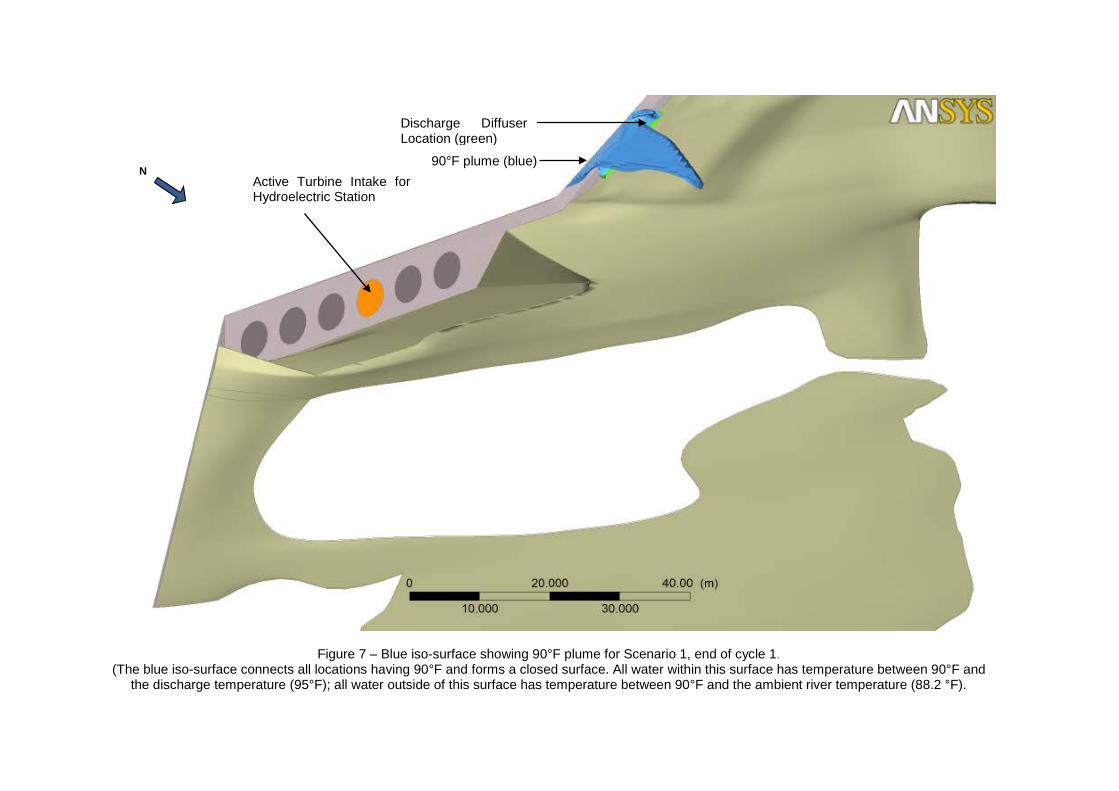
Figure 7 – Blue iso-surface showing 90°F plume for Scenario 1, end of cycle 1. (The blue iso-surface connects all locations having 90°F and forms a closed surface. All water within this surface has temperature between 90°F and
the discharge temperature (95°F); all water outside of this surface has temperature between 90°F and the ambient river temperature (88.2 °F).
N Active Turbine Intake for Hydroelectric Station
90°F plume (blue)
Discharge Diffuser Location (green)
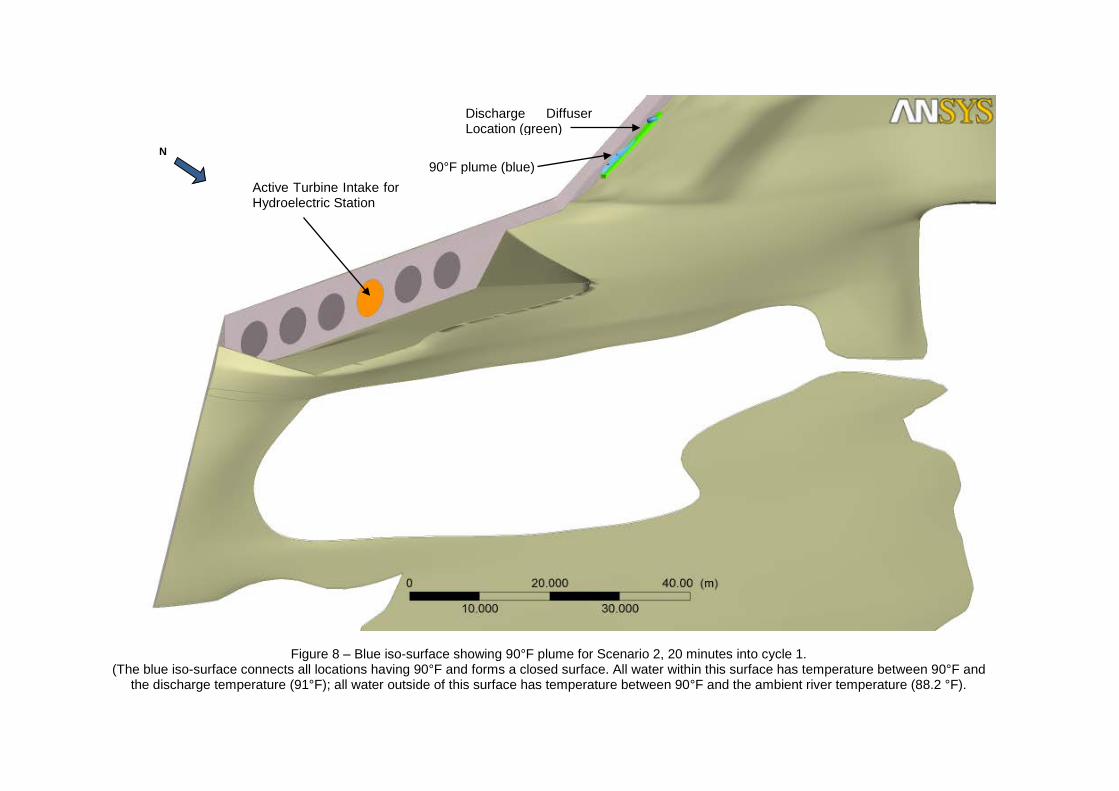
Figure 8 – Blue iso-surface showing 90°F plume for Scenario 2, 20 minutes into cycle 1. (The blue iso-surface connects all locations having 90°F and forms a closed surface. All water within this surface has temperature between 90°F and
the discharge temperature (91°F); all water outside of this surface has temperature between 90°F and the ambient river temperature (88.2 °F).
Active Turbine Intake for Hydroelectric Station
Discharge Diffuser Location (green)
90°F plume (blue) N
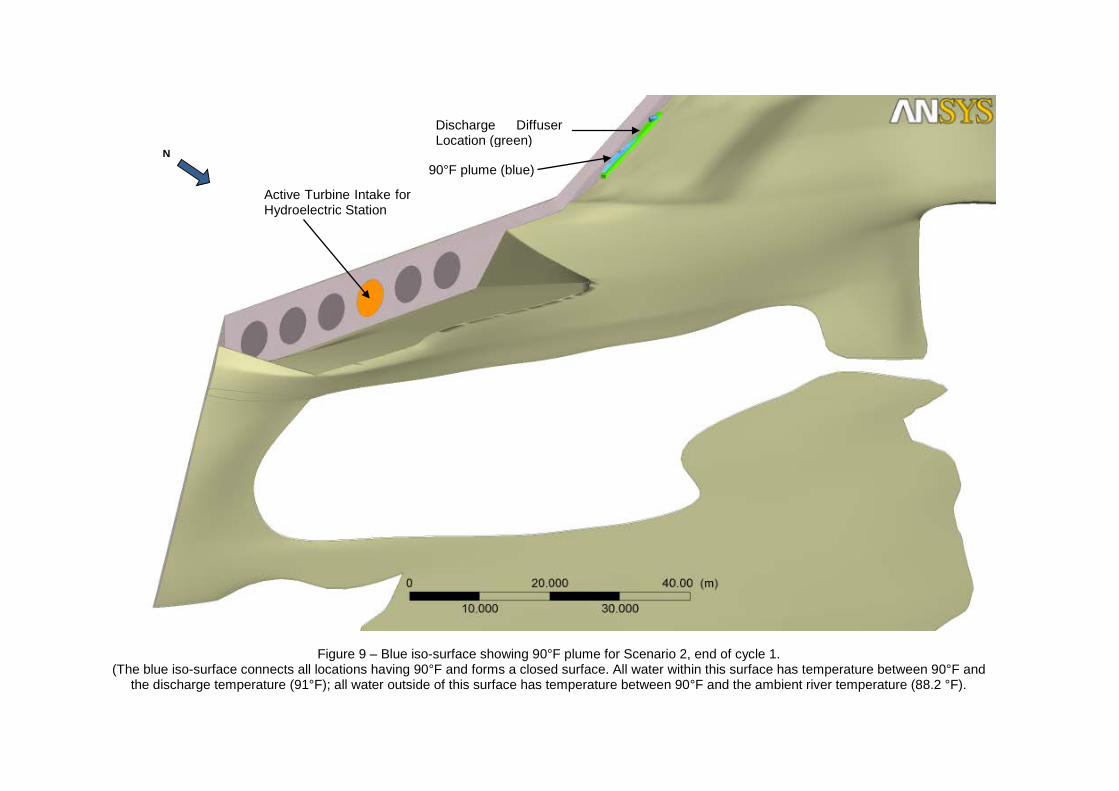
Figure 9 – Blue iso-surface showing 90°F plume for Scenario 2, end of cycle 1. (The blue iso-surface connects all locations having 90°F and forms a closed surface. All water within this surface has temperature between 90°F and
the discharge temperature (91°F); all water outside of this surface has temperature between 90°F and the ambient river temperature (88.2 °F).
N 90°F plume (blue)
Discharge Diffuser Location (green)
Active Turbine Intake for Hydroelectric Station
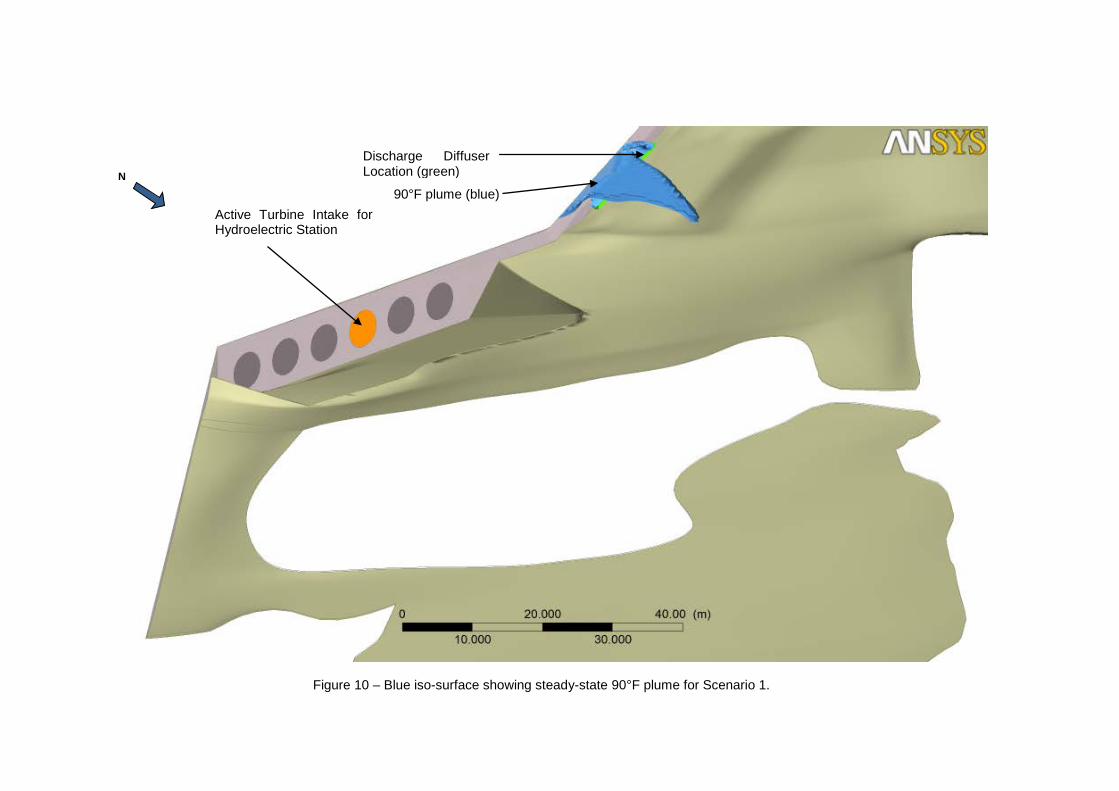
Figure 10 – Blue iso-surface showing steady-state 90°F plume for Scenario 1.
N
Active Turbine Intake for Hydroelectric Station
90°F plume (blue)
Discharge Diffuser Location (green)
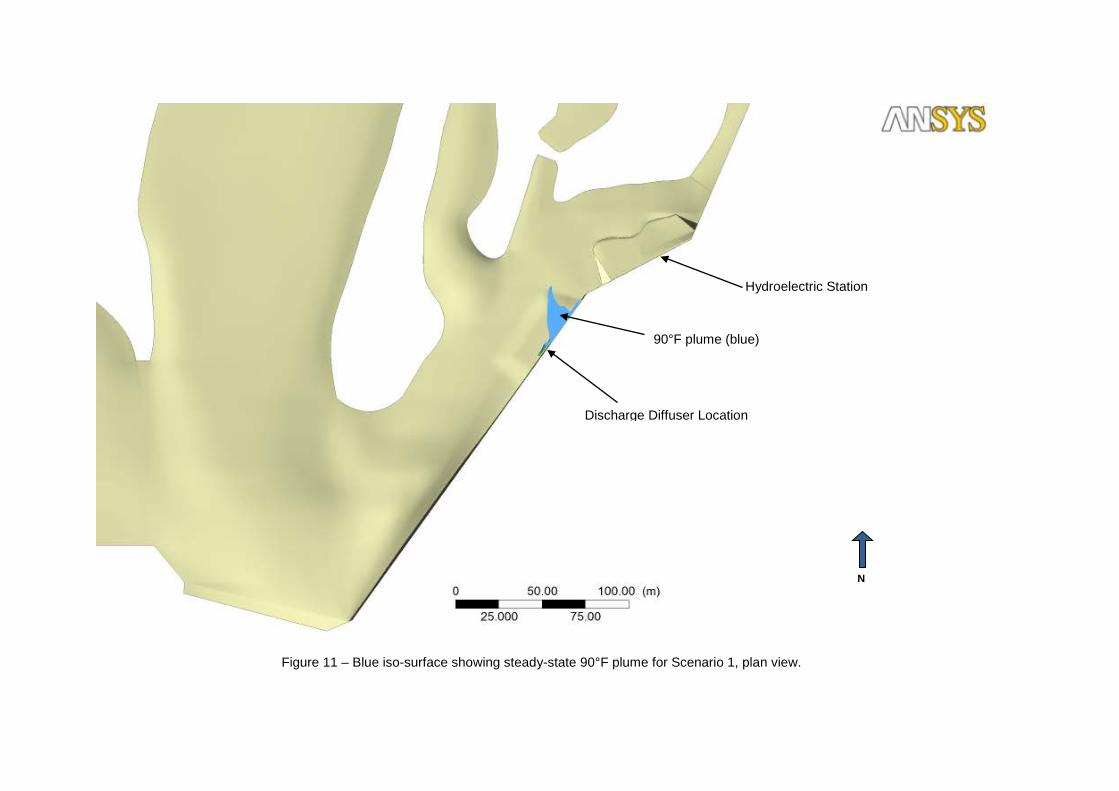
Figure 11 – Blue iso-surface showing steady-state 90°F plume for Scenario 1, plan view.
Discharge Diffuser Location
Hydroelectric Station
N
90°F plume (blue)
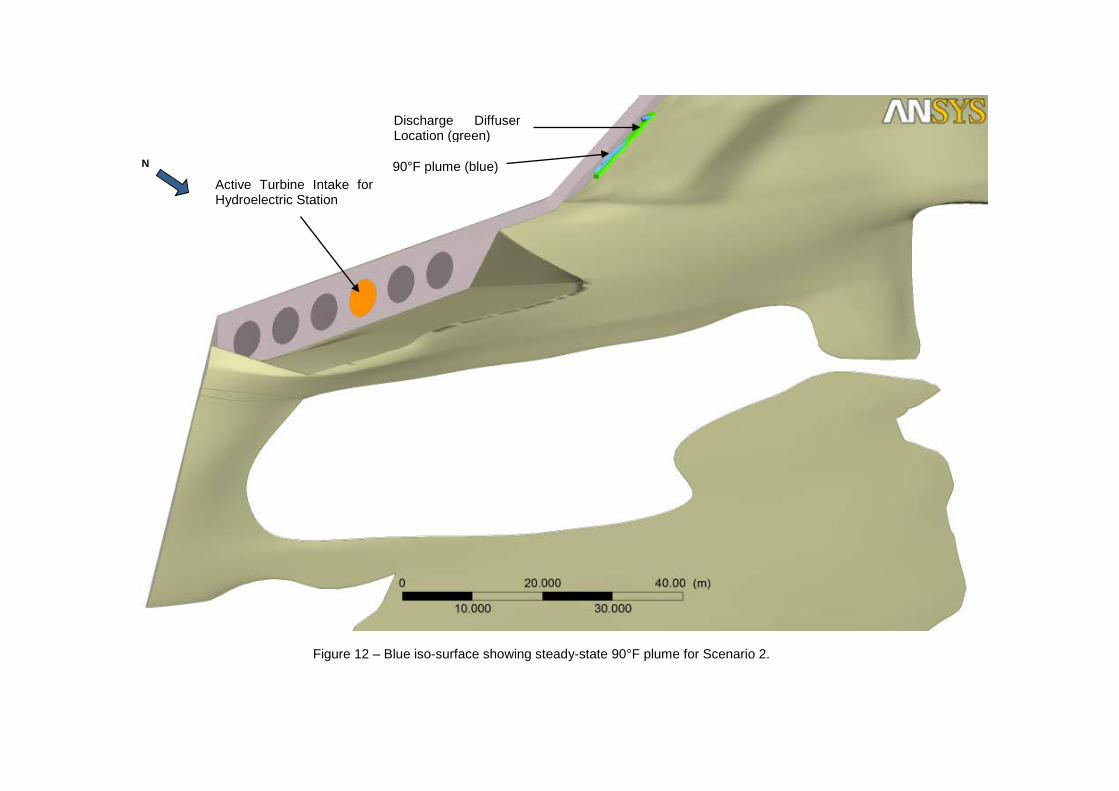
Figure 12 – Blue iso-surface showing steady-state 90°F plume for Scenario 2.
Active Turbine Intake for Hydroelectric Station
N 90°F plume (blue)
Discharge Diffuser Location (green)
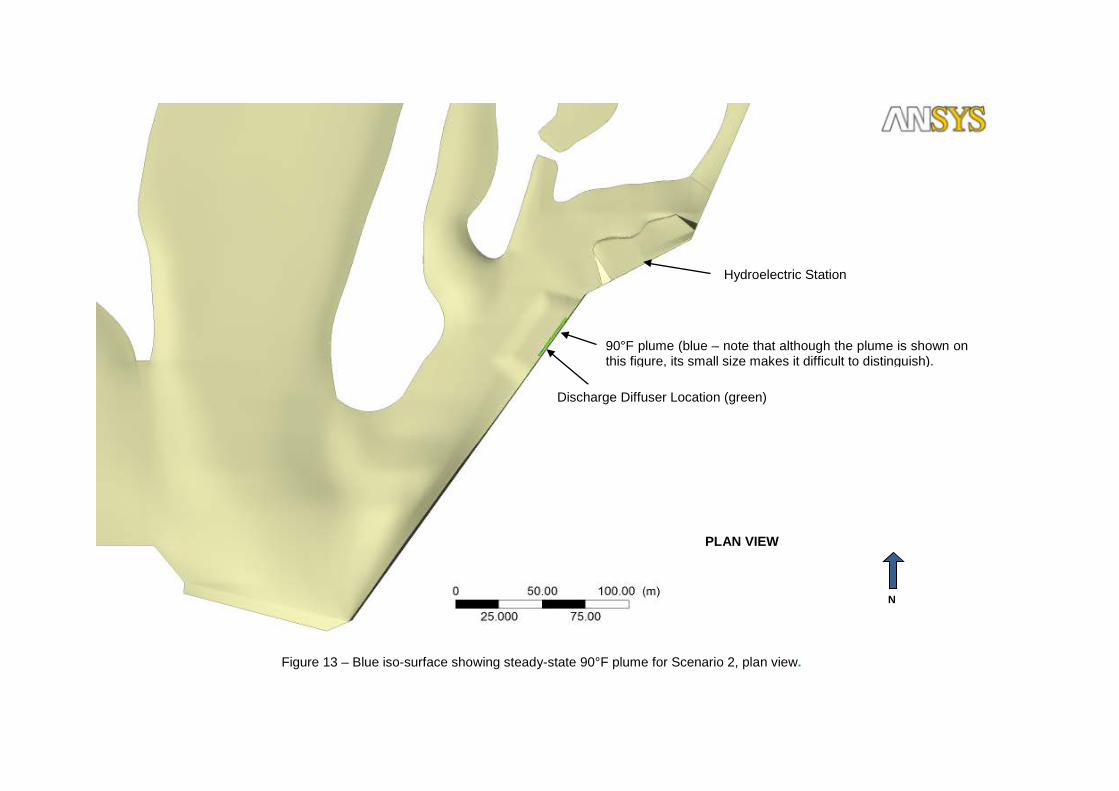
Figure 13 – Blue iso-surface showing steady-state 90°F plume for Scenario 2, plan view.
N
PLAN VIEW
Hydroelectric Station
Discharge Diffuser Location (green)
90°F plume (blue – note that although the plume is shown on this figure, its small size makes it difficult to distinguish).
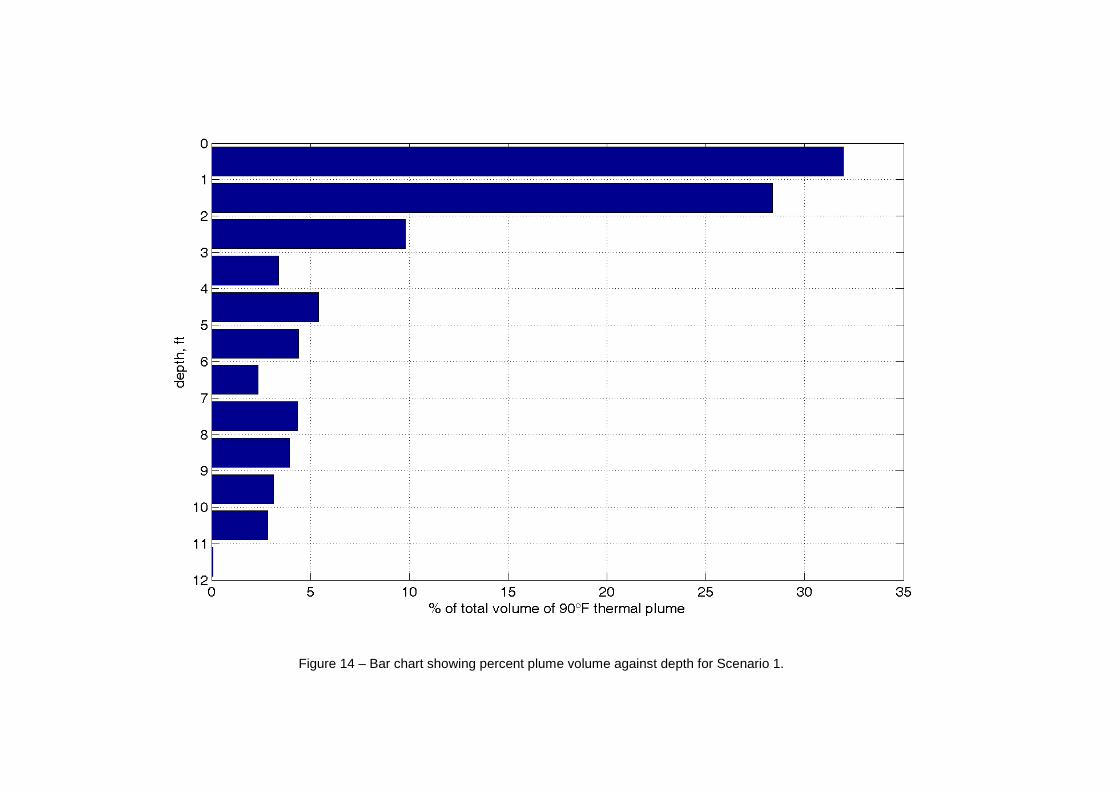
Figure 14 – Bar chart showing percent plume volume against depth for Scenario 1.

Figure 15 – Blue area showing cross-section of steady-state 90°F plume for Scenario 1.
Active Turbine Intake for Hydroelectric Station
N
90°F plume (blue)
Discharge Diffuser Location (green)
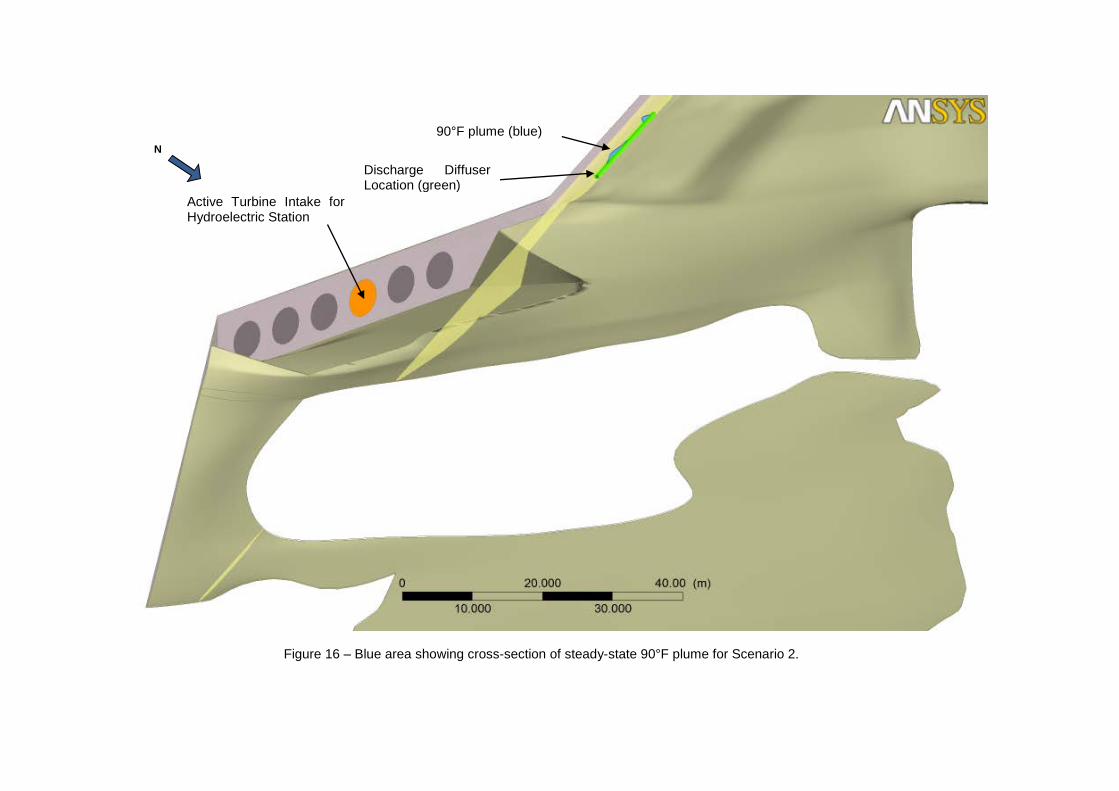
Figure 16 – Blue area showing cross-section of steady-state 90°F plume for Scenario 2.
N
Active Turbine Intake for Hydroelectric Station
90°F plume (blue)
Discharge Diffuser Location (green)
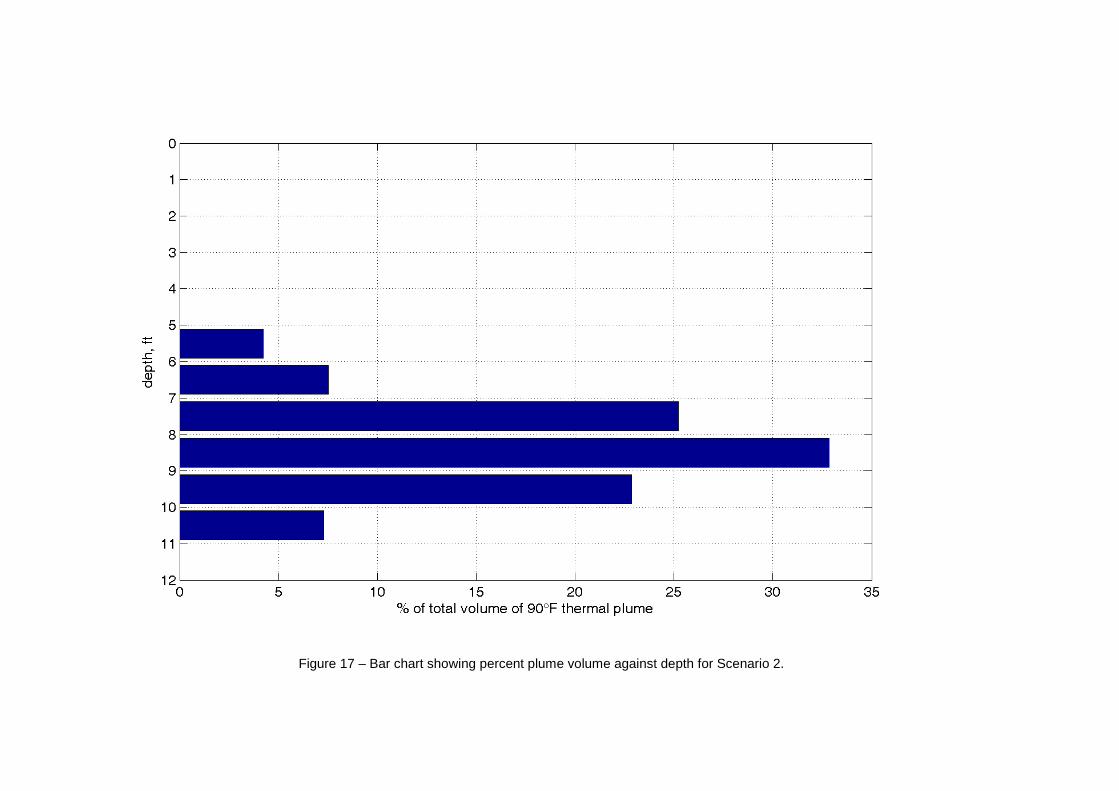
Figure 17 – Bar chart showing percent plume volume against depth for Scenario 2.
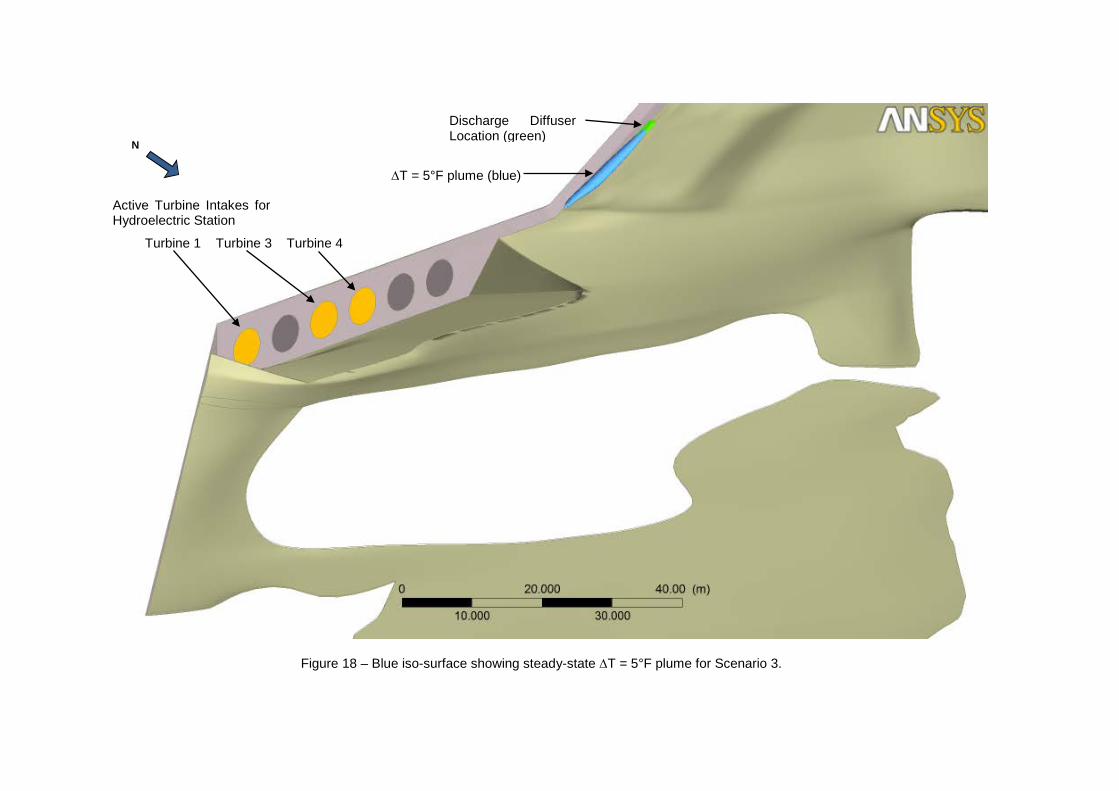
Figure 18 – Blue iso-surface showing steady-state ∆T = 5°F plume for Scenario 3.
N
Discharge Diffuser Location (green)
Active Turbine Intakes for Hydroelectric Station
∆T = 5°F plume (blue)
Turbine 1 Turbine 3 Turbine 4
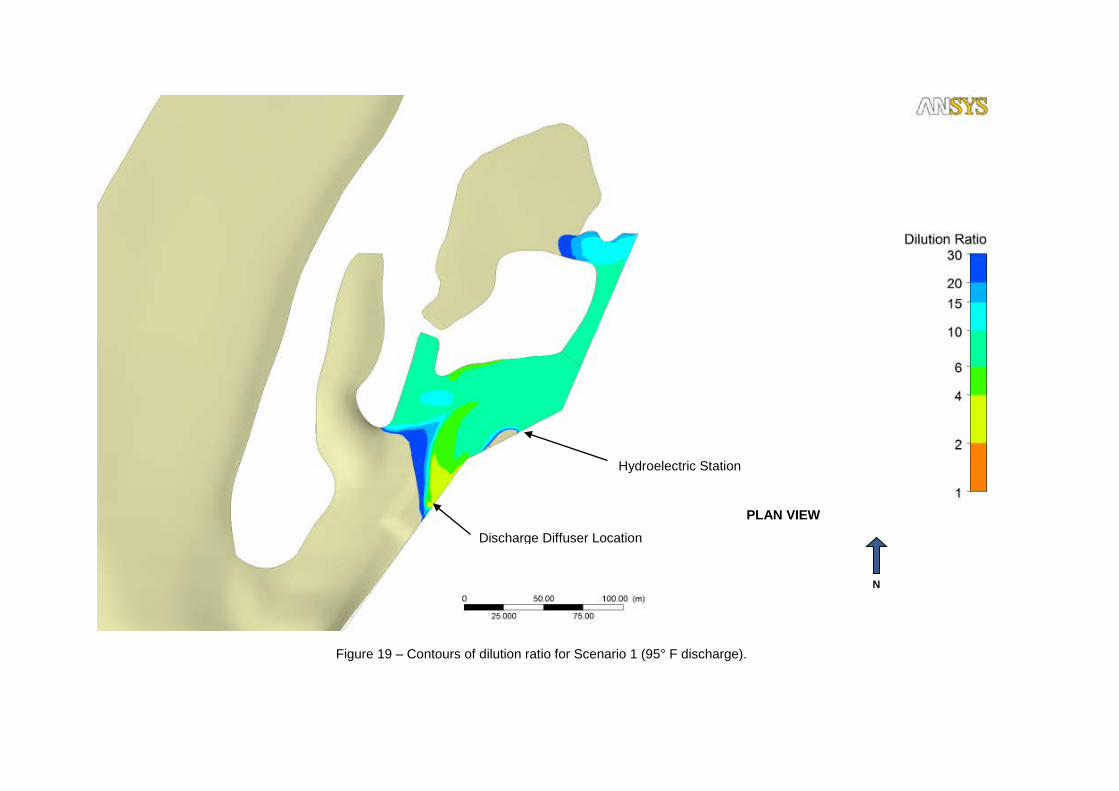
Figure 19 – Contours of dilution ratio for Scenario 1 (95° F discharge).
N
Discharge Diffuser Location
PLAN VIEW
Hydroelectric Station

Figure 20 – Contours of dilution ratio for Scenario 2 (91° F discharge).
N
PLAN VIEW Discharge Diffuser Location
Hydroelectric Station
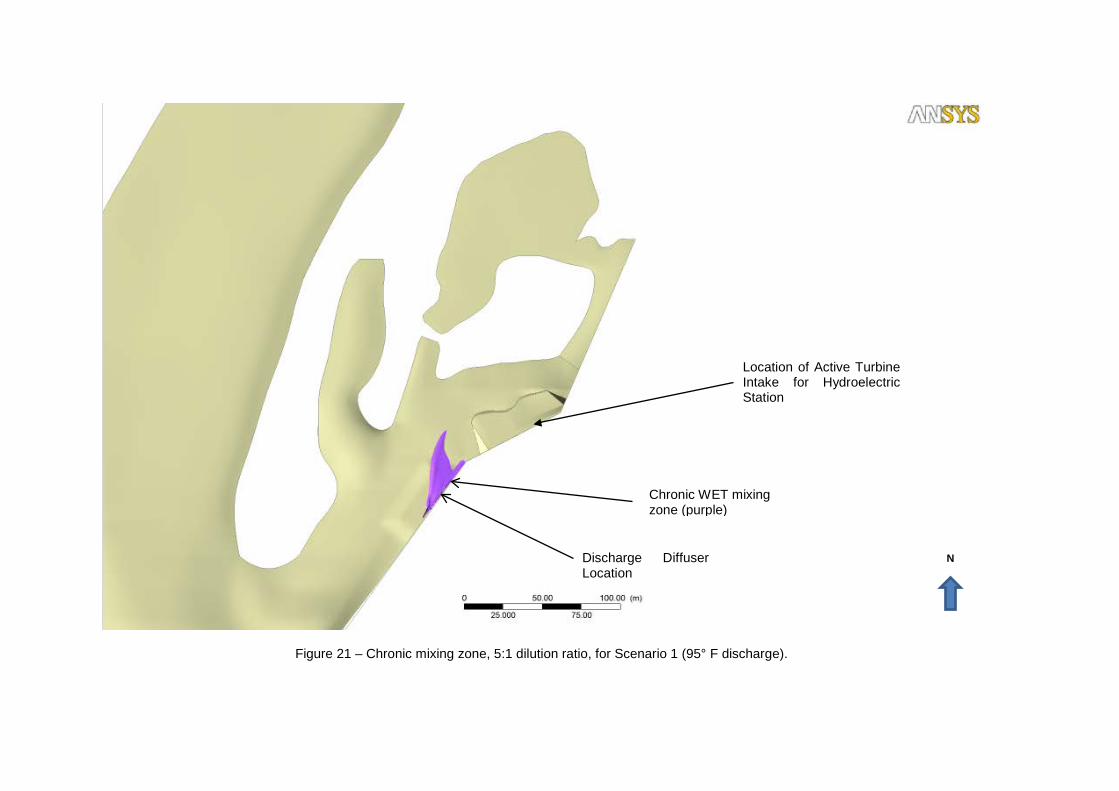
Figure 21 – Chronic mixing zone, 5:1 dilution ratio, for Scenario 1 (95° F discharge).
N Discharge Diffuser Location
Chronic WET mixing zone (purple)
Location of Active Turbine Intake for Hydroelectric Station
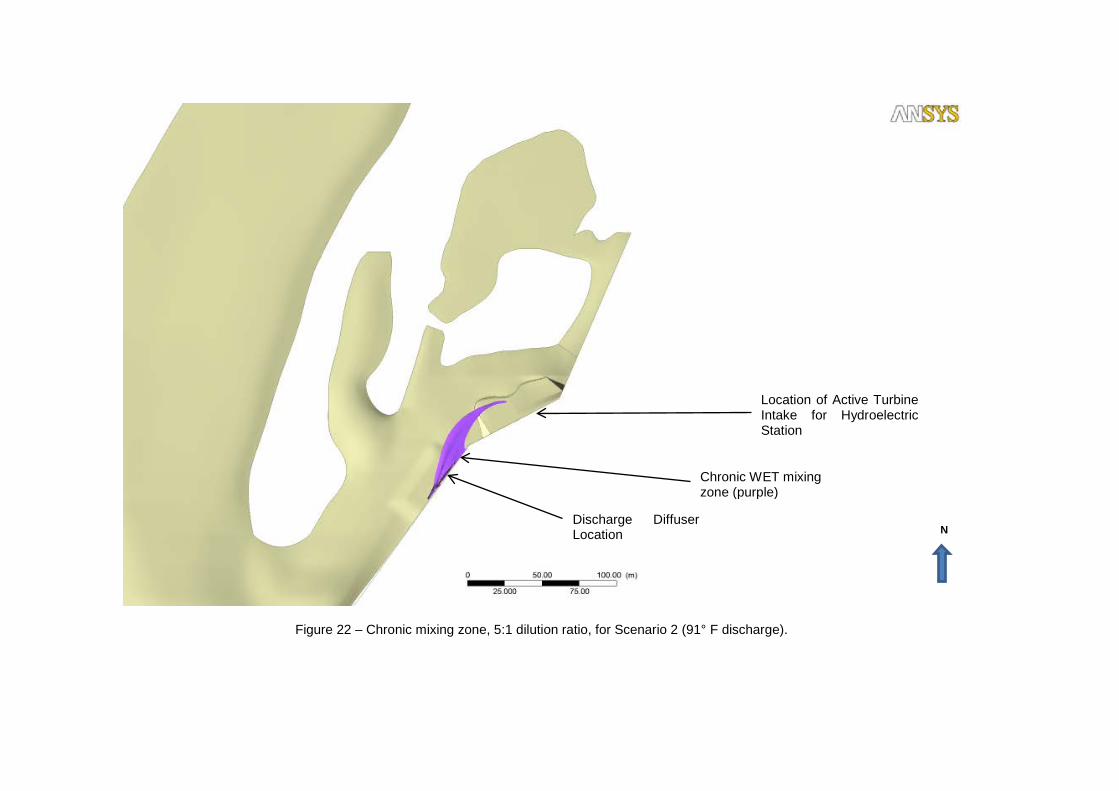
Figure 22 – Chronic mixing zone, 5:1 dilution ratio, for Scenario 2 (91° F discharge).
N
Location of Active Turbine Intake for Hydroelectric Station
Discharge Diffuser Location
Chronic WET mixing zone (purple)
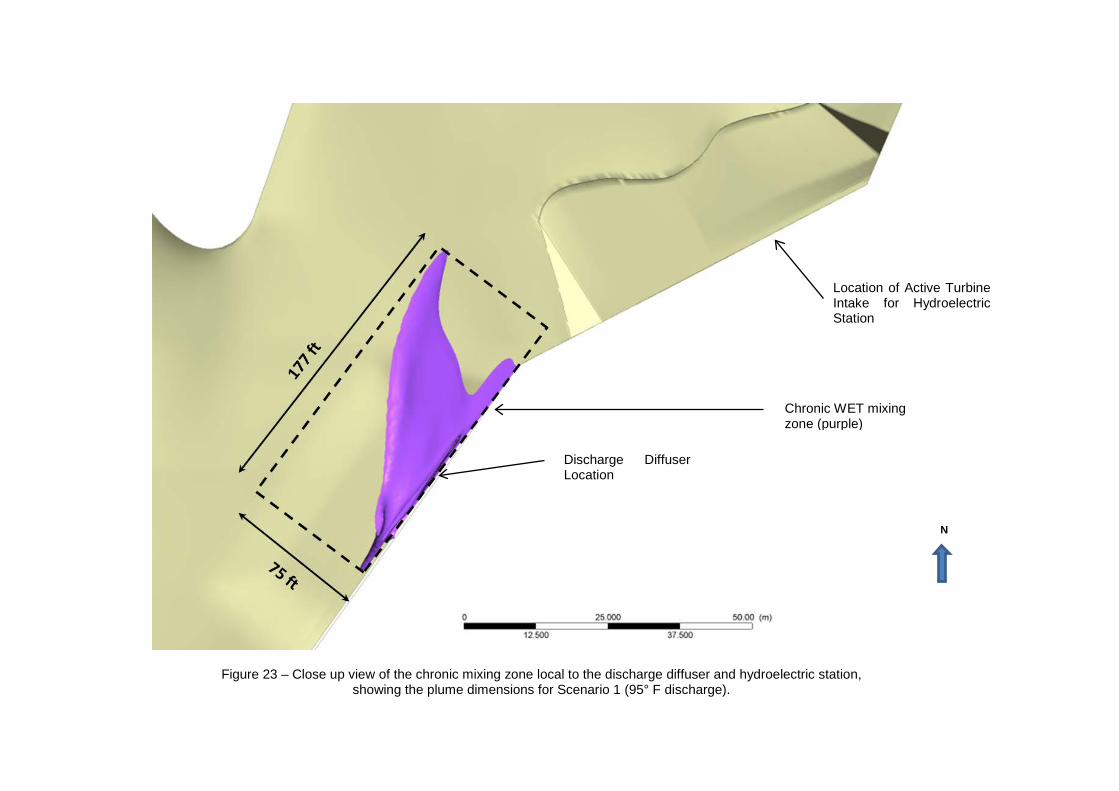
Figure 23 – Close up view of the chronic mixing zone local to the discharge diffuser and hydroelectric station, showing the plume dimensions for Scenario 1 (95° F discharge).
N
Location of Active Turbine Intake for Hydroelectric Station
Discharge Diffuser Location
Chronic WET mixing zone (purple)
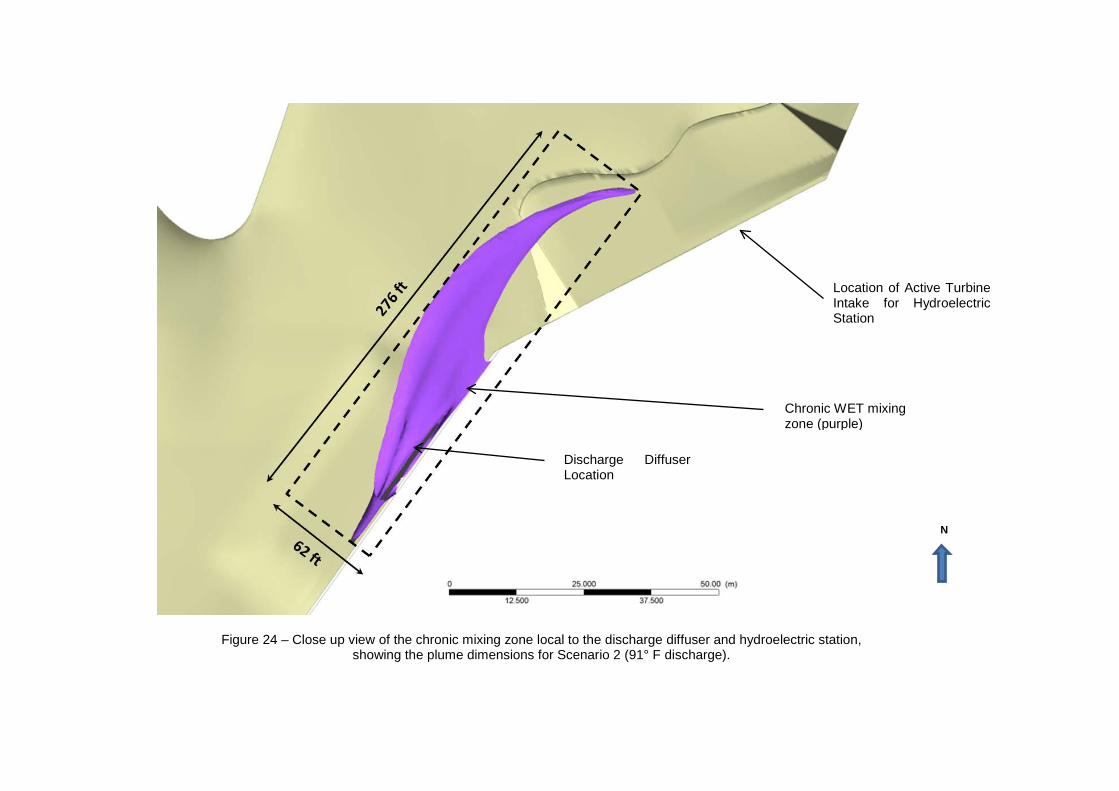
Figure 24 – Close up view of the chronic mixing zone local to the discharge diffuser and hydroelectric station, showing the plume dimensions for Scenario 2 (91° F discharge).
N
Location of Active Turbine Intake for Hydroelectric Station
Discharge Diffuser Location
Chronic WET mixing zone (purple)


![[image] - Animorphs Forumanimorphsforum.com/uploads/files/arpitnathany/K A Applegate... · It was ninety-nine-point-nine-percent successful. It had stopped his heart, his kidneys,](https://img.pdfslide.us/doc/110x75/5aed6c247f8b9a3b2e908fc0/image-animorphs-a-applegateit-was-ninety-nine-point-nine-percent-successful.jpg)


![The Ninety Nine Diseases of Pressure Equipment[1]](https://img.pdfslide.us/doc/110x75/55cf994a550346d0339c9bce/the-ninety-nine-diseases-of-pressure-equipment1.jpg)