Embed Size (px)
Citation preview
Night/Day Changes in Pineal Expression of >600 GenesCENTRAL ROLE OF ADRENERGIC/cAMP SIGNALING*□S
Received for publication, November 3, 2008, and in revised form, December 12, 2008 Published, JBC Papers in Press, December 22, 2008, DOI 10.1074/jbc.M808394200
Michael J. Bailey‡1, Steven L. Coon‡, David A. Carter§2, Ann Humphries§2, Jong-so Kim‡3, Qiong Shi‡4,Pascaline Gaildrat‡5, Fabrice Morin‡6, Surajit Ganguly‡7, John B. Hogenesch¶8, Joan L. Weller‡, Martin F. Rath�9,Morten Møller�9, Ruben Baler**10, David Sugden‡‡11, Zoila G. Rangel§§, Peter J. Munson§§, and David C. Klein‡12
From the ‡Section on Neuroendocrinology, Program on Developmental Endocrinology and Genetics, NICHD, National Institutes ofHealth, Bethesda, Maryland 20892, §School of Biosciences, Cardiff University, Cardiff CF10 3AX, United Kingdom, ¶GenomicsInstitute, Novartis Research Foundation, San Diego, California 92121, �Department of Neuroscience and Pharmacology, Faculty ofHealth Sciences, University of Copenhagen, Blegdamsvei 3, DK-2200 Copenhagen, Denmark, **Unit on Temporal Gene Expression,Laboratory of Cellular and Molecular Regulation, National Institute of Mental Health, Bethesda, Maryland 20892, ‡‡Division ofReproduction and Endocrinology, School of Biomedical and Health Sciences, King’s College London, London SE1 1UL, UnitedKingdom, and §§Mathematical and Statistical Computing Laboratory, Center for Information Technology, National Institutes ofHealth, Bethesda, Maryland 20892
The pineal gland plays an essential role in vertebrate chrono-biology by converting time into a hormonal signal, melatonin,which is always elevated at night. Here we have analyzed therodent pineal transcriptome using Affymetrix GeneChip� tech-nology to obtain amore complete description of pineal cell biol-ogy. The effort revealed that 604 genes (1,268 probe sets) withEntrez Gene identifiers are differentially expressed greater than2-fold between midnight and mid-day (false discovery rate<0.20). Expression is greater at night in �70%. These findings
were supported by the results of radiochemical in situ hybrid-ization histology and quantitative real time-PCR studies. Wealso found that the regulatorymechanism controlling the night/day changes in the expression of most genes involves norepi-nephrine-cyclic AMP signaling. Comparison of the pineal geneexpression profile with that in other tissues identified 334genes (496 probe sets) that are expressed greater than 8-foldhigher in the pineal gland relative to other tissues. Of thesegenes, 17% are expressed at similar levels in the retina, con-sistent with a common evolutionary origin of these tissues.Functional categorization of the highly expressed and/ornight/day differentially expressed genes identified clustersthat are markers of specialized functions, including theimmune/inflammation response, melatonin synthesis, pho-todetection, thyroid hormone signaling, and diverse aspectsof cellular signaling and cell biology. These studies produce aparadigm shift in our understanding of the 24-h dynamics ofthe pineal gland from one focused on melatonin synthesis toone including many cellular processes.
A defining feature of the pineal gland is a 24-h rhythm inmelatonin synthesis.Melatonin provides vertebrates with a cir-culating signal of time and is essential for optimal integration ofphysiological functions with environmental lighting on a dailyand seasonal basis (1–4).The melatonin rhythm in mammals is driven by a circadian
clock located in the suprachiasmatic nucleus (SCN),13 which ishard-wired to the pineal gland by a polysynaptic pathway thatcourses through central and peripheral neuronal structures.The pineal gland is innervated by projections from the superiorcervical ganglia (SCG) in the form of a dense network of cate-cholamine-containing sympathetic fibers. Activation of theSCN3 pineal pathway occurs at night and results in the release
* This work was supported, in whole or in part, by the National Institutes ofHealth (NICHD, Intramural Research Program to M. J. B., S. L. C., J. K., Q. S.,P. G., F. M., S. G., J. L. W., and D. C. K.; Center for Information Technology toZ. G. R. and P. J. M.). The costs of publication of this article were defrayed inpart by the payment of page charges. This article must therefore be herebymarked “advertisement” in accordance with 18 U.S.C. Section 1734 solely toindicate this fact.
□S The on-line version of this article (available at http://www.jbc.org) containssupplemental Procedures, Tables S1–S8, and Figs. S1 and S2.
1 Present address: Dept. of Poultry Science, Texas A & M University, CollegeStation, TX 77843.
2 Supported by The Wellcome Trust.3 Present address: Laboratory of Molecular Neurophysiology, Dept. of Life
Science, POSTECH, San 31 Hyoja-dong, Pohang, South Korea, 790-784.4 Present address: OriGene Technologies Inc., 6 Taft Ct., Suite 100, Rockville,
MD 20850.5 Present address: INSERM U614, Laboratory of Molecular Genetics, Faculty of
Medicine and University Hospital, Rouen, France.6 Present address: INSERM U413, Laboratory of Cellular and Molecular Neu-
roendocrinology, European Institute for Peptide Research, University ofRouen, Mont-Saint-Aignan, France.
7 Present address: Institute of Molecular Medicine, New Delhi 110020, India.8 Supported by NIMH P50 Conte Center Grant MH074924, NINDS Grant R01
NS054794, and Pennsylvania Commonwealth Health Research Formulafunds. Present address: Dept. of Pharmacology and Institute for Transla-tional Medicine and Therapeutics, University of Pennsylvania School ofMedicine, 421 Curie Blvd., Philadelphia, PA 19104.
9 Supported by The Lundbeck Foundation, Danish Medical Research CouncilGrants 271-07-0412 and 271-06-0754, The Novo Nordisk Foundation, TheCarlsberg Foundation, Fonden til Lægevidenskabens Fremme, and SimonFougner Hartmanns Familiefond.
10 Present address: Science Policy Branch, National Institute on Drug Abuse,Bethesda, MD 20892.
11 Supported by Research Equipment Initiative Grant BB/D52503X/1 from theBiotechnology and Biological Sciences Research Council.
12 To whom correspondence should be addressed: 49 Convent Dr., Bldg. 49,Rm. 6A82, Bethesda, MD 20892-4510. Tel.: 301-496-6915; Fax: 301-480-3526; E-mail: [email protected].
13 The abbreviations used are: SCN, suprachiasmatic nucleus; Bt2cAMP, dibu-tyryl cAMP; CREB, cAMP-response element-binding protein; pCREB, phos-phor-CREB; CRE, cAMP response element; cGMP, cyclic guanosine mono-phosphate; FDR, false discovery rate; qRT-PCR, quantitative real time-PCR;PWM, position weight matrices; SCG, superior cervical ganglia; NE, norepi-nephrine; ZT, Zeitgeber time; LD, light-dark; T3, thyroid hormone.
THE JOURNAL OF BIOLOGICAL CHEMISTRY VOL. 284, NO. 12, pp. 7606 –7622, March 20, 2009Printed in the U.S.A.
7606 JOURNAL OF BIOLOGICAL CHEMISTRY VOLUME 284 • NUMBER 12 • MARCH 20, 2009
by guest on July 6, 2018http://w
ww
.jbc.org/D
ownloaded from

of norepinephrine (NE) from the sympathetic fibers into thepineal perivascular space (5). NE activates the pinealocytethrough adrenergic receptors (5, 6). The best studied mecha-nism involves coincident “AND” gate activation of �1b- and�1-adrenergic receptors, whichmaximally stimulates adenylatecyclase, thereby elevating cAMP (7–13). Activation of �1b-ad-renergic receptors alone elevates intracellular calcium andphospholipid signaling (1, 14–16).cAMP is believed to mediate the effects of NE on melatonin
production to a large part by activating cAMP-dependent pro-tein kinase. In rodents, this induces expression of Aanat, thepenultimate enzyme in melatonin synthesis (17). Inductionoccurs through phosphorylation of cAMP-response element-binding protein (CREB) bound to cAMP-response elements(CREs) in theAanat gene. A similar NE/cAMPmechanism alsocontrols expression ofAdra1b, Atp7b,Crem,14Dio2, Fosl2, Id1,Dusp1, Mat2a, Nr4a1, Slc15a1, Pde4b2, Ptch1, and Rorb (18–27). In addition, a NE/cAMP mechanism decreases expressionof Hs3st2 (28). Although it is likely that some of the effects ofcAMP involve CREs, it is also likely that cAMP influences pin-eal gene expression through epigenetic mechanisms thatalter chromatin structure, e.g. histone phosphorylation (29,30), thereby having the potential of altering the expression ofmany genes and broadly promoting transcription by factorsother than CREB. Whereas there is abundant evidence thatthe SCN/SCG/NE/cAMP system controls rhythmic geneexpression in the pineal gland, it is also possible that otherregulatory mechanisms exist, involving release of othertransmitters, and additional second messengers (e.g. cGMP,Ca2�, and phospholipids).The increased abundance of some of these night/day differ-
entially expressed genes and of other genes in the pineal gland isdetermined in part by members of the OTX2/CRX family ofhomeodomain proteins, which play a similar role in the retina(31–34). These factors bind to photoreceptor conserved ele-ments and closely related sequences. In addition, Pax6 andOtx2 are essential for development of both tissues (35–37). Thisdevelopmental similarity is consistent with the common evolu-tionary origin of the pineal gland and retina from a primitivephotodetector (38). Examples of OTX2/CRX-controlled genesexpressed in both tissues include Aanat, Asmt, Sag, and Grk1(20, 39–46). The first two encode proteins dedicated to mela-tonin synthesis; the latter two encode proteins associated withphototransduction in the retina. It is not clear whether the pro-teins encoded by these phototransduction genes play parallelroles in NE/cAMP signal transduction in the pinealocyte or ifthey are functionally vestigial in the context of the pinealocyte.Although OTX2 and CRX are of central importance in thesetissues, it appears that other transcription factors and regula-tory cascades are involved. For example, the importance ofE-boxes in determining tissue-specific expression of Aanat isevident from several studies (42, 47), and NeuroD1 may alsoplay a role in determining pineal gland-specific expression pat-terns (48).
Whereas in both the pineal gland and retina, photoreceptorconserved elements control developmental expression of thesame gene, different mechanisms can operate in each tissue tocontrol rhythmicity. For example, in the case of Aanat, CREsmediate cAMP control of 24-h rhythms in the pineal gland (49,50). In the retina, however, E-box elements mediate circadianclock control of the 24-h rhythm in Aanat expression (51).In addition to the accepted SCN/SCG/NE/cAMP pathway,
reports in the literature have claimed that a circadian clockregulates daily changes in the expression of some genes in themammalian pineal gland (52), as in the submammalian pinealgland (53, 54). The physiological impact of this remainsunknown.Here we have expanded our understanding of the transcrip-
tional regulation and physiology of the pineal gland by employ-ing Affymetrix GeneChip� technology, including a microarraythat interrogates more than 13,663 genes that have beenassigned Entrez Gene identifiers.15 Previous studies of thisnature in the rat have identified 39 night/day differentiallyexpressed genes (26); a more recent study identified 35 suchgenes with Entrez Gene identifiers (59 probe sets) (55). Ourstudy had three specific goals. The first goal was to produce acomprehensive listing of genes that are differentially expressedon a night/day basis. The second goal was to identify the highlyenriched genes that define pineal function, independent ofwhether they are tonically or night/day differentially expressed;this was done by comparing gene expression in the pinealgland tomedian expression among other tissues. The third goalwas to determine the scope of the NE/cAMP regulatory cas-cade; this approach utilized an in vitro organ culture system. Inaddition to establishing the importance of this cascade, theorgan culture studies identified sets of genes that were sponta-neously up- or down-regulated more than 10-fold during cul-ture in defined medium, providing evidence of the existence ofunknown regulatory mechanisms. An unexpected discoverywas that the pineal transcriptome includes a large number ofimmune/inflammation response-associated genes.The findings of this study are of value to investigators inter-
ested in the pineal gland, chronobiology, neuroendocrinology,and immunology and to those who study specific genes that arenight/day differentially and/or highly expressed in the pinealgland.
EXPERIMENTAL PROCEDURES
Animals
Threemicroarray experiments were done (experiments A, B,and C). For microarray experiments A and B (Cardiff Univer-sity), Sprague-Dawley rats (2–3 months old) were maintainedin standard laboratory conditions in a 14:10 light-dark (LD)cycle (lights on, 05:00 h). Animals were killed at mid-day (ZT7)
14 One transcript isoform of Crem, termed Icer, is known to be highly rhythmicin the rat pineal gland. Therefore, throughout the text, when Crem is men-tioned in the context of the pineal gland, the term refers to the Icer isoform.
15 Where numbers of genes in various categories are given, this refers toprobe sets that have been annotated with Entrez Gene identifiers byAffymetrix as of November 5, 2007, and updated manually as of June 15,2008. The gene symbols that are used have been taken from Entrez Gene;associated Gene titles and Entrez Gene identifiers are given in supplemen-tal Tables S3, S4, and S5. Gene symbols beginning with LOC, RGD, or MGCare not included in the tables in the text; they are included in the supple-mental tables.
Interrogating the Pineal Transcriptome
MARCH 20, 2009 • VOLUME 284 • NUMBER 12 JOURNAL OF BIOLOGICAL CHEMISTRY 7607
by guest on July 6, 2018http://w
ww
.jbc.org/D
ownloaded from

or midnight (ZT19) by cervical dislocation, and pineal glandswere rapidly dissected, placed in tubes on solid CO2, and storedat �80 °C. For microarray experiment C (NICHD, NationalInstitutes of Health), for the time series analysis of gene expres-sion by qRT-PCR (Fig. 4), and for organ culture experiments,Sprague-Dawley rats (2–3months old, female) were housed for2 weeks in LD 14:10 lighting cycles, killed by CO2 asphyxiation,and decapitated; pineal glandswere rapidly dissected and eitherplaced in tubes on solid CO2 and stored at �80 °C or wereprepared for organ culture. Other tissues were also removed,and 10-mg samples were frozen and stored in a similarmanner.For the qRT-PCR experiment (Fig. 4), tissues were collected atZT1, -7, -13.5, -15, -16, -17.5, -19, and -22, placed in tubes onsolid CO2, and stored at �80 °C. Glands for organ cultureexperiments were obtained at ZT4–6 and placed in culturewithin 60 min. For radiochemical in situ hybridization histol-ogy studies (University of Copenhagen), Sprague-Dawley andWistar rats (Charles River, Germany) were housed for 2 weeksin a controlled lighting environment (LD 12:12). Animals werekilled by decapitation at ZT6 and ZT18; their brains wereremoved, immediately placed in solid CO2, and stored at�80 °C until sectioned.Animal use and care protocols were approved by local ethical
review, and they were in accordance with National Institutes ofHealth guidelines, United Kingdom Home Office Regulations,and Health Sciences Animal Policy European Union Directive86/609/EEC (approved by the Danish Council for AnimalExperiments).For organ culture, rat pineal glands were cultured in BGJb
medium as described previously (56) and detailed in the sup-plemental material. Glands were incubated (1 gland/well) withfresh media containing NE (1 �M), dibutyryl cAMP (Bt2cAMP;0.5 or 1 mM), or forskolin (10 �M) (Sigma). Following a 6-htreatment, glands were placed in microtubes on solid CO2.To confirm that the glandswere activated by the drugs,mela-
tonin production in the culturemediawasmeasured by tandemmass spectroscopy as described (57), with an internal d4-mela-tonin standard. The amount of melatonin produced (nano-moles/gland/6 h; means � S.E.) for the control, NE-treated,Bt2cAMP-treated, and forskolin-treated groups was (numberof samples) 1.4� 0.1 (9); 20.3� 1.1 (9); 9.9� 0.9 (9); and 15.0�1.2 (9), respectively.
Microarray
For the analysis of pineal glands in experiments A and B,two sets of six pooled samples of four rat pineal glands eachwere prepared (three night and three day). In experiment C,four pools, each containing three glands, were prepared foreach time point; as part of this experiment, single retinas and10-mg samples of the cerebellum, neocortex, hypothalamus,liver, and heart were also obtained. Glands were alsoobtained from organ culture experiments in which eachtreatment group was comprised of three pools, each contain-ing four glands. Total RNA was isolated, labeled and used tointerrogate Affymetrix GeneChips� as detailed in the sup-plemental material.
Microarray Data Sets
The microarray data presented here are derived from theexperiments described below (A, B, and C) in conjunction witha published tissue profiling effort (Genomics Institute of theNovartis Research Foundation (GNF), Entrez Gene ExpressionOmnibus (GEO), dataset GDS589 (58)).Microarray experiment A (Cardiff University) used the
Affymetrix RG_U34A microarray (8,799 probe sets, 4,996genes). Results from microarray experiment A were comparedwith data from the GNF data base, which had been generatedusing the samemicroarray. Expression data for the following 23Sprague-Dawley tissues and isolated cells were used (number ofsamples per tissue is in parentheses): neocortex (39), cerebel-lum (17), striatum (13), hippocampus (3), hypothalamus (2),pituitary (2), amygdala (10), nucleus accumbens (6), locus cer-uleus (2), dorsal raphe (2), ventral tegmental area (2), pinealgland (2), dorsal root ganglion (2), cornea (2), heart (2), intes-tine (4), kidney (2), spleen (2), thymus (2), bone marrow (2),muscle (2), Sertoli cells (10), and endothelial cells (2).Microarray experiment B (Cardiff University) used the
RAE230A microarray (15,923 probe sets, 10,174 genes).Microarray experiment C (NICHD, National Institutes ofHealth) used the Rat230_2 microarray (31,099 probe sets,13,663 genes); this experiment included pineal glands and othertissues (retina, neocortex, cerebellum, hypothalamus, heart,and liver) obtained at mid-day and midnight, and glandsobtained from organ culture.
Analysis of Microarray Results
Night/Day Differences in Gene Expression—AffymetrixMAS5 Signal and Present Call values were stored in the NIH-LIMS, a data base for storage and retrieval of microarray data.The microarray data are available at the Entrez Gene Expres-sion Omnibus, National Center for Biotechnology Information(59), and are accessible through GEO series accession numberGSE12344 (ncbi.nlm.nih.gov), and at sne.nichd.nih.gov. Datawere statistically analyzed using the MSCL Analyst Toolbox(P. J. Munson, J. J. Barb, abs.cit.nih.gov) and the JMP statisticalsoftware package (SAS, Inc., Cary, NC). Affymetrix signal val-ues were incremented by a value of 0.1� microarray medianvalue, then normalized to 1.1� microarray median values, andfinally decimal log-transformed. This transformation is termed“Lmed” and has the desirable effect of reducing the influence ofvery small expression values. One-way, two-level analysis ofvariance testing differences between night and day were per-formed on the transformed data, and significance (p values, orfalse discovery rate (FDR) (60)) was reported (see supplementalTable S3). Night-day log fold changes were computed as thedifference between the night and day Lmed values; in experi-ment C, NE/control and Bt2cAMP/control log fold change val-ues were calculated similarly. Expression ratios are reported aslinear values; values less than one are reported using the 1/Xconvention in which X � the night/day ratio, i.e. a night/dayratio of 0.01 is displayed as 1/100. Table 1 details the expressionratios (night/day, NE/control, Bt2cAMP/control) of all geneswith a Entrez Gene identifier and with a night/day ratio greaterthan 4 or less than 1⁄4. The supplemental Table S3 presents the
Interrogating the Pineal Transcriptome
7608 JOURNAL OF BIOLOGICAL CHEMISTRY VOLUME 284 • NUMBER 12 • MARCH 20, 2009
by guest on July 6, 2018http://w
ww
.jbc.org/D
ownloaded from

expression ratios of all probe sets with a night/day ratio greaterthan 2 or less than 1⁄2.Expression of Genes in the Pineal Gland Relative to Other
Tissues—Gene expression in one tissue relative to expression inother tissues was defined as the relative tissue expression (rEx)value, whichwas calculated as the ratio ofmaximumexpression(the highest of day or night) to the median expression of thatgene in other tissues. In experiment A, median values werecalculated from 23 Sprague-Dawley tissues in the GNF database (see above) plus the day and night pineal gland values gen-erated in experiment A. In experiment C, the median valueswere calculated from the average expression levels in each ofseven tissues (see above). These averages were based on singlemid-day and midnight values, except in the case of the pinealgland for which four mid-day and four midnight values wereused. The larger of two rEx values obtained using the two exper-iments is presented in Table 3, which contains genes with rExvalues greater than 8. The supplemental Table S4 includes rExvalues from both experiments for probe sets with rEx valuesgreater than 2.Comparison of Results across Different Microarray Platforms—
Results from the three platforms were compared using the fol-lowingmapping algorithm. The RG_U34A probe sets were firstmapped to the Rat230_2 microarray using the Affymetrixortholog map (available online). Exact matches for probe setson the RAE230A microarray are found on the Rat230_2microarray. In cases where a probe set maps to several probesets on another microarray, each mapped probe set pair is con-sidered as an independent pair, resulting inmultiple pairs, eachsharing a common probe set. Probe sets from the differentmicroarrays were annotated using Affymetrix annotation files(available online) dated November 5, 2007. Each probe set wasmapped to an Entrez Gene identifier. In cases of discrepantgene identification for the probe set pair, the annotations fromthe most recent microarray type were used. In cases whereprobe sets identify two or more genes, the gene symbol of thefirst gene on the annotation file is listed, unless otherwise indi-cated. Summaries over multiple probe sets mapping to thesame gene were calculated by taking the maximum observedratios for night/day. The rEx values were calculated in a similarmanner.
Radiochemical in Situ Hybridization Histology
Sagittal sections of frozen rat brains were analyzed by in situhybridization histology as described previously (34, 61) anddetailed in the supplementalmaterial. Sectionswere hybridizedwith 35S-labeled 38-mer oligonucleotide probes (supplementalTable S1). The sections were exposed to x-ray film or dippedinto an LM-1� emulsion (Amersham Biosciences). The in situhybridization images presented in Fig. 2 are available at highresolution on line at sne.nichd.nih.gov.
qRT-PCR
For data in Fig. 4 and Table 6, pools of glands were used foreach time point or treatment group. cDNA was synthesizedfrom DNase-treated total RNA, and qRT-PCR results werequantitated and normalized (62) as detailed in the supplemen-
tal material. The primers used are described in supplementalTable S2.
Functional Analysis
The programs used to identify clusters of genes associatedwith discrete functions were DAVID BioinformaticsResources 2007 (david.abcc.ncifcrf.gov/), ModuleMiner (63)and Affymetrix NetAffx. The results of these analyses andcommon knowledge were used to generate Table 7.
Detection of cis-Regulatory Elements
Computational detection of enriched cis-regulatory ele-ments (position weight matrices (PWMs)) within microarray-derived gene sets was conducted using ModuleMiner (63).
RESULTS
Microarray Analysis
A Large Number of Genes Exhibit Night/Day Differences inExpression in the Pineal Gland—The results of analysis ofnight/day differences in gene expression using the RG_U34A,the RAE230A, and Rat230_2 microarrays are presented inTable 1 and supplemental Table S3. To examine the degree ofagreement of data obtained by these microarrays, we com-pared results from the RG_U34A and Rat230_2 microarray;the latter and the RAE230A microarray contain the sameprobe sets, representing 10,156 Entrez Gene identifiers, anddid not require comparative analysis. Comparison of theexpression levels of the 4,459 genes (6,392 probe sets) pres-ent on both the RG_U34A and Rat230_2 microarraysrevealed the results were in excellent agreement (r � 0.44)(supplemental Fig. S1).Expression of 604 genes (1,268 probe sets) exhibits a signifi-
cantly greater than 2-fold change on a night/day basis (FDR�0.20; Table 1 and supplemental Table S3). Approximately2,000 additional genes exhibit a smaller but significant night/day change in expression (FDR� 0.20). These findings increaseby more than 50-fold the known number of genes differentiallyexpressed in the pineal gland. Among the 604 genes with agreater than 2-fold difference in expression, 72% increase inexpression at night and 28%decrease. A scatter plot of the nightversus day expression (supplemental Fig. S2A) provides an indi-cation of the range of night/day differences; this plot used thelargest night/day difference observedwith anymicroarray type.The amplitude of these changes varied from a downward20-fold to an upward�100-fold change. A set of 142 genes (209probe sets) changes greater than 4-fold (Table 1 and supple-mental Table S3). Among the genes listed in Table 1 are thosepreviously reported to be night/day differentially expressed (seeIntroduction). Although the results obtained with the differentmicroarrays are in excellent overall agreement, there are differ-ences in the absolute magnitude of the night/day changes,which may reflect different probe set design, biological varia-tion, technical differences, or a combination.NE/cAMP Signaling Plays a Dominant Role in the Control of
Night/Day Changes in Gene Expression—As noted in the Intro-duction, 13 genes were previously known to be differentiallyexpressed on a night/day basis in the pineal gland and to be
Interrogating the Pineal Transcriptome
MARCH 20, 2009 • VOLUME 284 • NUMBER 12 JOURNAL OF BIOLOGICAL CHEMISTRY 7609
by guest on July 6, 2018http://w
ww
.jbc.org/D
ownloaded from

controlled byNE/cAMP signaling (1, 4). To determine whetheradditional genes exhibiting night/day differences in expressionare also controlled byNE/cAMP signaling, we used awell estab-lished organ culture method in which glands are incubated for48 h, during which time nerve endings disintegrate. After 48 hglands are treatedwithNE.A 6-h treatment periodwas selectedto approximate the time period between lights off andmidnightsampling in the in vivo experiments; a dose of 1 �M NE wasselected because it is known to selectively activate�-adrenergicand �-adrenergic receptors in this system (6, 10, 12, 13, 56).Gene expression was studied using the Rat230_2 microarray(experiment C).Approximately 98%of the probe sets that exhibited increased
expression at night also exhibited increased expression follow-ing NE treatment, and 85% of the probe sets that exhibiteddecreased expression at night also exhibited decreased expres-sion following NE treatment (supplemental Fig. S2B, Table 1,and supplemental Table S3). This finding supports the conclu-sion that night/day differences in gene expression in the pineal
gland are due to a large degree to the release of NE from nerveterminals in the pineal gland (4).NE activates adenylate cyclase and elevates intracellular
cAMP levels in the pineal gland. Here it was found that mosteffects of NE were mimicked by treatment with 0.5 mMBt2cAMP (supplemental Fig. S2C, Table 1, and supplementalTable S3). 95% of the probe sets that exhibited decreased expres-sion following NE treatment also exhibited decreased expressionfollowing Bt2cAMP treatment. The finding that Bt2cAMP treat-ment broadly mimics the effects of NE on gene expression pro-vides evidence that cAMP is the primary secondmessengermedi-ating NE control of gene expression in this tissue.Although it is apparent that NE or Bt2cAMP treatments
change gene expression in a pattern similar to the changes seenon anight/day basis, there are striking exceptions, i.e. genes thatexhibit marked night/day changes in expression that exhibit10-fold lower response to NE treatment. These include Ccl9,Cd8a, Cyp1a1, Drd4, Mfrp, Per2, Prlr, Slco1a5, and severalgenes that do not have gene symbols (Table 1).
TABLE 1Differential expression of genes in the pineal glandExpression ratios listed under night/day (N/D) are the highest values obtained in experiments A, B or C (see “Experimental Procedures”). Expression ratios listed underNE/C (NE/control) and DBcAMP/C (Bt2cAMP/control) are from experiment C. Decreases in expression are indicated by the 1/X convention, indicating that expressionwas lower by a factor of X. Section A includes genes that exhibited a �8 or �1/8 fold night/day difference in expression; section B includes genes with a 4–8-fold or 1/4 to1/8 night/day difference in expression. The supplemental Table S3 (sne.nichd.nih.gov) is an expanded version of this table, and includes genes with a 2–4-fold or 1/2 to 1/4-fold night/day difference in expression, gene titles, probe set numbers, and Entrez Gene identifiers.
* Predicted gene is indicated.
Interrogating the Pineal Transcriptome
7610 JOURNAL OF BIOLOGICAL CHEMISTRY VOLUME 284 • NUMBER 12 • MARCH 20, 2009
by guest on July 6, 2018http://w
ww
.jbc.org/D
ownloaded from

Organ Culture Has Marked Effects on Expression of a MinorComponent of Genes—To determine whether changes in geneexpression are induced by organ culture itself, we compared theday values from the in vivo study to control values from theorgan culture study (experiment C). The normalized expres-sion levels of more than 95% of the genes were unchanged afterorgan culture. However, marked changes occurred in 5% of thegenes, andmost notablewere the greater than 10-fold decreasesin gene expression that occurred in 51 genes (102 probe sets;Table 2), including 11 genes (24 probe sets) that decreasegreater than 30-fold, and the greater than 10-fold increase inexpression of 13 genes (20 probes sets; Table 2). Some of thegenes that exhibit a greater than 30-fold decrease in expres-sion are hemoglobin genes, suggesting that in some casesexpression of a gene is low because blood cells that expressthese genes are present in the pineal gland when removed forin vivo experiments but are lost from the pineal gland duringculture.Among the nine non-hemoglobin genes that exhibited the
largest decrease (�30-fold) in expression during culture in con-trol glands, six were also highly rhythmic, suggesting day levelsseen in vivo may reflect physiological regulation by NE and/oranother factor. The decrease in expression during culture may
reflect the absence of a factor that is necessary for NE stimula-tion of these genes.Highly Expressed Genes That Characterize the Pineal Gland—
Highly expressed geneswere identified by determining the ratioof expression in the pineal gland relative to the median expres-sion among other tissues (see “Experimental Procedures”),yielding rEx values. Thiswas done using data obtained in exper-iment A (RG_U34A microarray) and in experiment C(Rat230_2 microarray); the median expression values werebased on 23 (58) and 7 tissues, respectively. In both cases, braintissues comprise approximately half of the tissues sampled. Thecalculated tissue medians are given in supplemental Table S4.This effort identified 996 genes (1,654 probe sets) with rEx
values of 4 to�300.Onehundred fifty six genes (255 probe sets)had rEx values greater than 16 (Table 3; supplemental TableS4).The rEx values for the pineal gland were compared with
those of six other tissues in an effort to identify other tissuesstrongly expressing the same genes. Only in the case of theretina was there a striking similarity in the genes with high rExvalues, consistent with evidence that both tissues evolved froma common ancestral photodetector (64). Approximately 17% ofthe highly expressed genes (rEx� 8) in the pineal gland are alsoexpressed in the retina at similar levels (Fig. 1; Table 4, andsupplemental Table S5). Among these highly expressed genesare those that encode signal transduction proteins (e.g. Sag, Pdc,and Grk1) and genes encoding developmental and regulatorytranscription factors (e.g. Otx2, Crx, Pax6, and Neurod1).Genes with high rEx values in the pineal gland but not the
retina include genes encoding enzymes required for melatoninsynthesis (e.g. Tph1, Gch1, Ddc, Aanat, Asmt, and Mat2a).Among those with high rEx values in the retina but not thepineal gland are Rho and Opn1mw, which encode photosensi-tiveG-protein-coupled receptors. A surprising observationwasthat expression of Opn1sw, which encodes another G-protein-coupled light receptor, is 4-fold greater in the pineal gland; thisis surprising because the mammalian pineal gland is not gener-ally regarded as being directly photosensitive.
TABLE 2Genes expressed 10-fold higher or lower following organ cultureGenes were identified from data generated in experiment C. Unidentified genes arenot included in the table. For further details see “Experimental Procedures.”Gene expression following
organ culture Gene symbol
Higher (�30-fold) Mmp3, Spp1Higher (10–30-fold) Akr1b8, Ccl2, Ccl20, Fcgr3, Fxyd2, Fzd1, Gpnmb,
Hmox1, Igfbp3, S100a4, Wnt2Lower (10–30-fold) Alas2, Arr3, Asmt, Atp1a2, Atp2b3, Car14,a
Ccl9, Cd74, Cd8a, Cdkn1c, Cirbp, ClicLIC6,Cln6,a Cml5, Cyp1a1, Enpp2, Folr1, Gjb6,Gpc3, Grk1, Grm1, Guca1a,a Il17re, Kcne2,Mdk, Mfap5,a Mpp4, Nphs1, Nrxn3, Ogn,aPtgds, Reep6, RT1-Da, Sag, Slc24a1, Slco1c1,Spink4, Vtn, Vwf, Wasl
Lower (�30-fold) Cox8h, Defb24, Drd4, Hba-a1, Hbb, Igfbp2,Mfrp,a Opn1sw, Prlr, Sostdc1, St8sia5
a Predicted gene is indicated.
TABLE 3Genes highly expressed in the pineal gland relative to other tissuesGeneswere identified fromdata generated in experiments A andC.Gene titles, EntrezGene identifiers, and individual rEx values obtained in each experiment are presentedin supplemental Table S4 (sne.nichd.nih.gov); supplemental Table S4 also contains genes with rEx values 4–8. For details regarding calculation of rEx values see“Experimental Procedures.”
Pineal rEx Gene symbol�16 A2m, Aanat, Abca1, Abhd14b, Adra1b, Adrb1, Aipl1, Alox15, Arhgap24, Arr3, Asl, Asmt, Atp7b, Ca3, Cabp1, Cacna1f, Camk1g, Ccl9, Cd1d1,
Cd24, Cdh22, Chga, Chrna3, Chrnb4, Cnga1, Cngb1, Cntrob,a Col8a1,a Cplx3, Cpt1b, Crem, Crocc,a Crtac1, Crx, Ctsc, Cyp1b1, Dclk3,a Ddc,Defb24, Drd4, Dusp1, Efemp1, Egflam, Esm1, Eya2, Fcer1a, Fdx1, Fkbp4, Fkbp5, Frmpd1,a Fst, Fzd4, Gch, Gdf15, Gem,a Gnat2,a Gnb3, Grk1,Guca1a,a Hs3st2, Hspa1a, Hspa1b, Hspb1, Igfbp6, Impg1, Impg2, Irak2, Irs1, Isl2, Ka15, Kcne2, Kcnh6, Kcnj14, Krt1–19, Lamp3, Lgals1,Lgals3, Lhx4,a Lix1,a Lpl, Lrrc21, M6prbp1, Map4k1,a Mat2a, Mcam, Me2,a Miox, Mitf, Morn1, Mpp3, Mpp4, Mtac2d1, Mx2, Ncaph,Neurod1, Nphp4, Nphs1, Nptx1, Opn1sw, Osap, Otx2, Padi4, Pax4, Pax6, Pcbd1, Pcdh21, Pdc, Pde4b, Pla2g5, Plscr1, Rbp3, Rds, Ribc2,Rom1, Rorb,a Rxrg, Sag, Scn7a, Serping1, Slc12a5, Slc15a1, Slc17a6, Slc24a1, Slc30a1, Slc39a4,a Slc6a6, Snap25, Snf1lk, Sorl1, Spink4,Stk22s1, Sv2b, Tm7sf2, Tph1, Ttr, Tulp1,a Unc119, Vof16
8–16 Accn4, Acsl1, Acvr1, Adam2, Ak3l1, Als2cr4,a Ampd2, Anp32e, Anpep, Atp1b2, Atp6v1c2, Baiap2l1, Bmp6, Bzrp, Cacna1h, Ccdc125, Ccl2,Ccl6, Ccnd2, Cd63, Cd74, Cd8a, Cebpb, Cfd, Cflar, Chst2,a Cip98, Col15a1, Col1a1, Cr16, Crcp, Cyp1a1, Dcn, Depdc7, Dhrs8, Dnajc12,Dnm2, Dnm3, Dpt,a Dsc2, Dscr1, Epb4.1, Errfi1, Etnk1,a Exoc5, F5, Farp2,a Fosl2, Foxd1, Frmd4b, G0s2, Gabrr1, Gale, Galnt4, Galntl1, Gla,Gls, Gmds, Gnas, Grm1, Hcn1, Hk2, Hsd3b7, Hspb6, Id1, Ifitm3, Igfbp2, Igsf1, Igsf4a, Il13ra2, Il17re, Irf7, Itgb2, Kctd14,a Kctd3, Kit, Klhl4,Lad1,a Lama2,a Lamb1,a Lmbr1l, Lmod1,a Lnx1,a Lox, Loxl1, Lrrc8e, Lum, Lxn, Mad2l2, Mak, Mak10, Man2a1, Mapk6, Msrb2, Msx1,Mt1a, Muc4, Mylk,a Myo5b, Nacad, Nr4a1, Nradd, Nrap,a Nup107, Oasl1, Orai1, Pcbp3, Pde10a, Pde6b,a Pdp2, Pgam2, Pgm1, Pid1, Pik3r3,Pla2g1b, Pla2r1,a Plcd1, Plcd4, Postn,a Pqlc1, Prkar2b, Prkca, Prtg, Psph, Ptgis, Ptms, Ptprn, PVR, Qscn6, Rab3c, Rarres1, Rasgrf2, Rax, Rere,Resp18, Rnase1, Rreb1,a RT1-Aw2, Rtbnd,a Sall1,a Sema3a, Slc12a2, Slc19a2, Slc1a5, Slc25a10, Slc47a1, Slc4a2, Slc7a6,a Slco4a1, Sod3,Spint2, Svop, Tagln2, Tcn2, Tex14,a Timp1, Tmepai,a Tnfrsf9, Ugdh, Wnt10a,a Zmat2, Zrsr1
a Predicted gene is indicated.
Interrogating the Pineal Transcriptome
MARCH 20, 2009 • VOLUME 284 • NUMBER 12 JOURNAL OF BIOLOGICAL CHEMISTRY 7611
by guest on July 6, 2018http://w
ww
.jbc.org/D
ownloaded from

Radiochemical in Situ Hybridization Histological AnalysisConfirms Gene Profiling Results
Radiochemical in situ hybridization analysis of sagittal brainsections (Fig. 2) was used to confirm night/day differences ingene expression and to obtain a detailed anatomical analysis ofareas of expression of the genes with a high rEx value from the
microarray analysis. Quantitation of the radiochemical labelingin the pineal gland revealed the results of histological studieswere in excellent agreement with the microarray results, asregards both the degree of night/day differences in expressionand rEx values (Table 5).The rEx values provided by microarray analysis were also
confirmed by the results of in situ hybridization; genes withhigh rEx values were found by in situ hybridization to beexpressed highly or exclusively in the pineal gland relative toother brain regions on the section (Fig. 2). In some cases, how-ever, genes with high pineal rEx values are also strongly andselectively expressed in other brain regions. For example, Aclyis highly expressed in the habenular nucleus and in the mesen-cephalic raphe complex; Dusp1 is highly expressed in the cor-tex, cerebellum, and thalamus; Gnb3 is expressed at moderatelevels in many brain regions;Nptx1 is expressed in the cerebel-lum and dentate gyrus; andTtr is very strongly expressed in thechoroid plexus (Fig. 2). In addition, the results of in situ hybrid-ization provide examples of nocturnally elevated extra pinealexpression of specific genes, including Per2 in the cerebellumand cortex and Fosl2 in the cortex, and this was consistentlyobserved upon repeated examination of brain sections from allanimals. Although these findings require further in-depthinvestigation, this is beyond the scope of this study.In sections that contained the pineal stalk or deep pineal
gland, both structures were labeled with the same density andpattern as the superficial pineal gland. An example of this isfound in the Crx panel (see Fig. 2). However, because the deeppineal gland was absent frommost sections because of its smallsize and to differences in the plane of section, this was not seenon a regular basis.It is highly likely that most of these genes are expressed in the
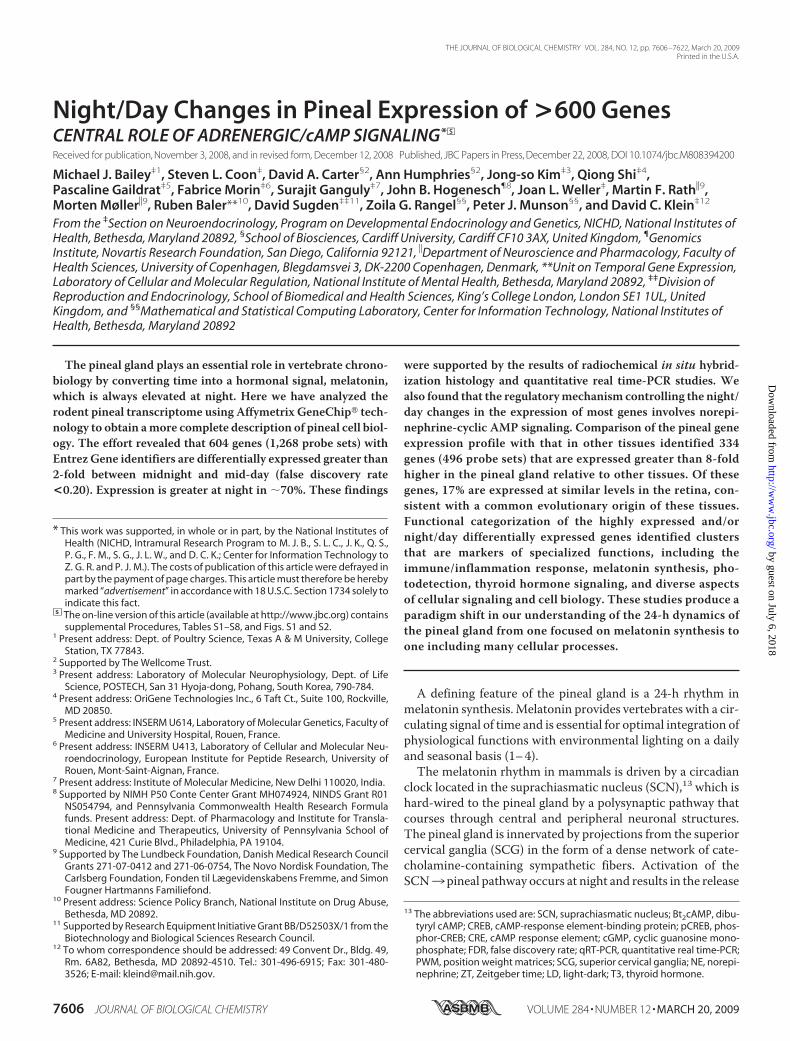
dominant cell type in the pineal gland, the pinealocyte (5), asoccurs with Aanat (Fig. 3, A and B). However, it is also clear thatsomeof theexpressedgeneswithhighrExvaluesmaybeexpressedin non-pinealocytes, as demonstrated by the endothelial cellmarkerEsm1,which has a high rEx value (supplemental Table S4)
FIGURE 1. Pineal rEx versus retina rEx. This figure demonstrates that a sub-set of genes is predominantly expressed in the pineal gland or retina or both.Data are based on results obtained in experiment C. The probe sets for theentire microarray are represented by 5% density contours (95% of probe setsare within the outermost contour line). Only symbols representing probe setswith rEx values greater than 8 for either the pineal gland or retina (�1% of31,099 probe sets on the Rat230_2 microarray) are shown; the remainingprobe sets are not highly expressed in either tissue relative to other tissues.The plotted probe sets fall into three sectors as follows: Pineal, in which 218genes (256 probe sets) are highly expressed primarily in the pineal gland;Pineal, Retina, in which 55 genes (63 probe sets) are highly expressed at similarlevels in both the pineal gland and retina; and Retina, in which 93 genes (109probe sets) are highly expressed primarily in the retina. The genes repre-sented by these probe sets are listed in Table 4; supplemental Table S5 con-tains a detailed description of these genes and other unannotated probe sets.An interactive version of this figure that identifies each symbol is available atsne.nichd.nih.gov.
TABLE 4Genes highly expressed in the pineal gland and/or the retinaGenes were identified from data generated in experiment C and represent the symbols shown in the corresponding sectors in Fig. 1. The supplemental Table S5(sne.nichd.nih.gov) contains the gene titles, EntrezGene identifiers, and the rEx values for individual genes. The supplemental Table S5 also includes EntrezGene identifiersfor unidentified sequences (i.e. expressed sequence tags) not included here. For details regarding the calculation of rEx values see “Experimental Procedures.”
Group Gene symbolPineal A2m, Aanat, Abca1, Abhd14b, Accn4, Acvr1, Adam2, Adra1b, Adrb1, Alox15, Als2cr4,a Ampd2, Anp32e, Arhgap24, Asl, Asmt, Atp6v1c2,
Atp7b, Baiap2l1, Bzrp, Ca3, Cabp1, Cacna1h, Camk1g, Ccdc125, Ccl2, Ccl6, Ccl9, Ccnd2, Cd1d1, Cd24, Cd63, Cd8a, Cfd, Cflar, Chga,Chrna3, Chrnb4, Chst2,a Cip98, Cntrob,a Col15a1, Col8a1,a Crcp, Crem, Crtac1, Ctsc, Cyp1a1, Dclk3,a Dcn, Ddc, Defb24, Depdc7, Dhrs8,Dnajc12, Dpt,a Dsc2, Dscr1, Esm1, Etnk1,a Eya2, F5, Farp2,a Fcer1a, Fdx1, Fkbp5, Fosl2, Frmd4b, Fzd4, G0s2, Gale, Galnt4, Galntl1, Gch,Gdf15, Gem,a Gla, Gls, Gmds, Gnas, Hs3st2, Hsd3b7, Hspb1, Ifitm3, Igfbp6, Igsf1, Il13ra2, Il17re, Irak2, Irf7, Irs1, Isl2, Itgb2, Ka15, Kcne2,Kctd14,a Kctd3, Kit, Klhl4, Krt1–19, Lad1,a Lama2,a Lamb1,a Lgals1, Lgals3, Lhx4,a Lix1,a Lmbr1l, Lmod1,a Lnx1,a Lpl, Lrrc8e, Lum, Lxn,M6prbp1, Mad2l2, Mak10, Map4k1,a Mat2a, Mcam, Me2,a Miox, Mitf, Morn1, Mpp3, Msrb2, Mt1a, Mtac2d1, Muc4, Mx2, Mylk,a Myo5b,Nacad, Ncaph, Nphp4, Nphs1, Nptx1, Nradd, Nrap,a Nup107, Oasl1, Padi4, Pcbd1, Pde10a, Pde4b, Pgam2, Pgm1, Pid1, Pik3r3, Pla2g1b,Pla2g5, Plcd4, Plscr1, Postn,a Pqlc1, Prkar2b, Prtg, Psph, Ptgis, Ptprn, PVR, Qscn6, Rarres1, Rasgrf2, Rere, Resp18, Ribc2, Rnase1, Rorb,aRreb1,a Rxrg, Sall1,a Scn7a, Sema3a, Serping1, Slc15a1, Slc17a6, Slc19a2, Slc1a5, Slc25a10, Slc39a4,a Slc47a1, Slc7a6,a Snf1lk, Sod3, Sorl1,Spink4, Tagln2, Tex14,a Tm7sf2, Tnfrsf9, Ugdh, Vof16, Wnt10a,a Zmat2, Zrsr1
Pineal, retina Aipl1, Arr3, Cacna1f, Cnga1, Cngb1, Cplx3, Crocc,a Crx, Drd4, Egflam, Frmpd1,a Gabrr1, Gnat2,a Gnb3, Grk1, Guca1a,a Hspa1b, Impg1,Impg2, Kcnh6, Kcnj14, Lamp3, Lrrc21, Mak, Mpp4, Neurod1, Opn1sw, Osap, Otx2, Pax4, Pcbp3, Pcdh21, Pdc, Pde6b,a Pla2r1,a Rax, Rbp3,Rds, Rom1, Rtbnd,a Sag, Slc24a1, Slc6a6, Slco4a1, Stk22s1, Tulp1,a Unc119
Retina Abca4,a Agpat3,a Arf4l,a C1ql2, Calb2, Capn3, Cart, Cav, Cbln2, Cds1, Chrna6, Cirbp, Col11a1, Col2a1, Col5a3, Col9a1, Cryaa, Cryba1,Cryba2, Cryba4, Crybb1, Crybb2, Crybb3, Cryga, Crygb, Crygd, Cryge, Dapl1, Dkk3, Elovl4,a Fscn2,a Glra2, Gnat1,a Gnb1, Gpsm2, Gsg1,Hk2, Hmx1,a Igsf9,a Isl1, Kcnb1, Mab21l1, Mdm1, Msh5, Ng23, Opn1mw, Opn4, Pax6, Pcdh8, Pcp2, Pde6a,a Pde6h, Ppap2c, Prom1, Rcvrn,Rdh11, Rdh12,a Reep6, Rfrp, Rgr,a Rho, Rhpn1,a Rp1h, Six6,a Smarcd1,a Sncg, St6galnac2, Stx3, Susd3,a Synpr, Tbc1d12,a Tbx2,a Tcfap2a,aTcfap2b,a Tmem136, Txnl6,a Vip, Vipr2, Wdr89
a Predicted gene is indicated.
Interrogating the Pineal Transcriptome
7612 JOURNAL OF BIOLOGICAL CHEMISTRY VOLUME 284 • NUMBER 12 • MARCH 20, 2009
by guest on July 6, 2018http://w
ww
.jbc.org/D
ownloaded from

and is expressed in a pattern consistent with localization in cellsconfined to theperivascular spaces of the gland,where endothelialcells occur (Fig. 3,C andD).
qRT-PCR Analysis Confirms Results of Gene Profiling
qRT-PCRwas used to confirm and extend in vitro and in vivoresults obtained from microarrays. This effort includedgenes known to exhibit large night/day differences in thepineal gland, which serve as references (e.g. Aanat, Fosl2,Crem, and Dio2), in addition to genes that did not exhibit anight/day difference; 44 genes were examined. qRT-PCRconfirmed rhythmic expression that had initially been indi-cated by microarray analysis (Fig. 4), providing evidence thatthe two-point night/day sampling strategy is a productiveand reliable approach, as a first step toward the identifica-tion of night/day rhythmically expressed genes. In mostcases, the amplitude of the rhythm was greater using qRT-PCR. The use of multiple time points in the qRT-PCR studyprovided a more complete profiling of the pattern of tran-script abundance. Comparison of these patterns reveals dif-
ferences in the timing of the peak in transcript abundance,consistent with previous reports (65, 66).In some cases there was a comparatively large variation at tran-
sition times between low and high expression (e.g. Fosl2 and Cit-ed4), which may reflect individual variation (Fig. 4). In the case ofTtr andMfrp, such variation does not appear to be associatedwitha distinct 24-h pattern of expression; the similar pattern of varia-tion might reflect a common biological link (i.e. regulation) notshared by the other genes examined.qRT-PCR was also used to confirm the microarray results
from organ culture studies. The results confirm the microar-ray results, providing additional support for the conclusionthat night/day differentially expressed genes are controlledby a NE/cAMPmechanism (Table 6). The effects of forskolinwere also examined; forskolin increases adenylate cyclaseactivity (67, 68), resulting in an increase in cAMP. It wasfound to mimic the effects of Bt2cAMP and NE, providingfurther support for the conclusion that cAMP mediates theeffects of NE.
FIGURE 2. Radiochemical in situ hybridization images. Each panel contains autoradiographs prepared from sections of rat brains through the pinealgland. The sections on the left are from animals killed during the day and those on the right are from animals killed during the night. The sections wereincubated with antisense probes identified in the bottom left-hand corner of the Day image. Probes are detailed in supplemental Table S1. The results ofquantitation of the signal strength of the pineal labeling appear in Table 5. For further details see “Experimental Procedures.” Hab, habenula; ic, inferiorcolliculus; mhn, medial habenular nucleus; Raphe, dorsal raphe nucleus; sc, superior colliculus. These figures are available in high resolution atsne.nichd.nih.gov.
Interrogating the Pineal Transcriptome
MARCH 20, 2009 • VOLUME 284 • NUMBER 12 JOURNAL OF BIOLOGICAL CHEMISTRY 7613
by guest on July 6, 2018http://w
ww
.jbc.org/D
ownloaded from
Detection of cis-Regulatory ElementsComputational detection of enriched cis-regulatory ele-
ments (PWMs) obtained via submission of gene groups toModuleMiner (63) showed that multiple, diverse PWMs wereenriched in the submitted groups (see supplemental Tables S7and S8). Individual gene groups were found to be associatedwith distinct collections of high scoring PWMs. Notableenrichments of PWM families in particular gene groupsincludedCREB (rhythmic� 8,�1/8), SP1 (rhythmic� 8),Oct1(retina), and Hox (Crx) (pineal and retina, pineal). None ofthese were enriched in the control group, which included geneswith low rEx values (�1.5) and night/day expression differ-ences between 1⁄2 and 2; this group was, however, enriched inthe Pax4 PWM.Also notable was the relative absence of PWMsof regulatory transcription factor (TF) sites compared withbasal transcriptional sites in the pineal group.
DISCUSSION
The results of these studies provide the most comprehen-sive profile of the pineal transcriptome available, contribut-ing to a more meaningful understanding of tissue functionand providing new evidence of metabolic pathways andfunctional capacities of the pineal gland that have been over-looked or unrecognized. These advances include a greater
than 10-fold increase in the num-ber of genes known to be night/daydifferentially expressed in the pin-eal gland; in addition, this studyhas revealed that night/day differ-ential expression is regulated byNE/cAMP signaling. Moreover,this effort has identified for thefirst time a large set of highlyexpressed genes that may or maynot be differentially expressed on anight/day basis. The lists of night/day differentially expressed genesand highly expressed genes pro-vide a valuable new data base forfuture studies of the pineal gland.
Gene Expression Considered inLight of the Cellular Composition ofthe Pineal Gland
Discussion of the results ofmicroarray studies is appropriatelypreceded by consideration of theorganization and composition ofthe tissue. Pinealocytes are thedominant cell in the rodent pinealgland (�95%) and are recognized tofunction as a melatonin factory (5).Interstitial cells are located betweenpinealocytes and generally resemblebrain fibrillary astrocytes. In addi-tion, the mammalian pineal glandcontains a dense vasculature com-posed of endothelial cells and peri-
FIGURE 3. Staining of pinealocytes and endothelial cells in the pineal gland. A, image presentingAanat-labeling of pinealocytes. Dark field photomicrograph of radiochemical in situ hybridization of a partof the superficial pineal gland of the rat with an antisense probe binding to mRNA encoding AANAT. Thesection was dipped in a photographic emulsion and developed after exposure; the grains are seen usingdark field visualization as white dots in the emulsion. Dense labeling is seen above the pineal parenchymawith no labeling of the perivascular space (per vasc). B, same section shown in A in transmitted light.Arrows indicate the perivascular space, which is not labeled in A. Cresyl violet counterstaining is used. C,labeling of the perivascular spaces; endothelial labeling image. Dark field photomicrograph of radio-chemical in situ hybridization of the superficial pineal with an antisense probe binding to mRNA encodingEsm1. Note the labeling of the perivascular spaces (arrows). D, high power photomicrograph taken intransmitted light of part of the superficial pineal showing Esm1 labeling of the perivascular cells and onlyfew grains above the pinealocytes. Cresyl violet counterstaining. Bars, A, B and D � 20 �m. C � 50 �m. Theprobes used are described in supplemental Table S1.
TABLE 5Quantitative analysis of the in situ hybridization signal in the pinealglandThe antisense probes used appear in supplemental Table S1. Quantitation was doneas described under “Experimental Procedures”; results are given as the mean � S.E.
Genesymbol
Microarray In situ hybridizationNight/daya rExb Day Night Night/day
dpm/mg tissue dpm/mg tissueAanat 92.9 196.0 13.4 � 1.1 3059.2 � 183.5 227.8cAcly 1.3 6.9 386.8 � 63.0 722.0 � 148.5 1.9cAlox15 1.7 324.0 924.5 � 64.2 927.0 � 79.7 1.0Asmt 1.3 198.0 1737.5 � 107.8 2156.4 � 170.8 1.2cAtp7b 12.1 17.9 4.8 � 0.9 424.8 � 55.3 87.6cCrem 37.0 167.7 40.2 � 1.6 1277.4 � 240.9 31.8cCrx 2.2 151.1 1277.2 � 79.0 1411.0 � 333.7 1.1Dusp1 48.8 85.8 9.0 � 0.8 26.5 � 7.4 3.0cEsm1 1.9 198.7 134.5 � 16.7 196.7 � 20.5 1.5cFosl2 4.2 8.1 15.8 � 1.1 79.9 � 26.8 5.1cGch1 1.3 236.4 980.8 � 67.1 965.9 � 82.7 1.0Gnb3 1.0 101.8 3262.5 � 309.1 3989.8 � 228.1 1.2cMt1a 12.6 12.2 90.8 � 14.4 1031.3 � 247.1 11.4cNptx1 3.5 48.9 86.5 � 5.2 543.1 � 24.7 6.3cPdc 1/2.7 359.4 566.7 � 53.4 170.9 � 18.7 1/3.3cPer2 13.4 5.1 19.5 � 2.5 37.2 � 1.8 1.9cRorb 3.4 32.9 34.7 � 4.7 170.8 � 32.8 4.9cTph1 1.2 259.4 3092.3 � 16.7 3049.5 � 36.0 1.0Ttr 1.5 65.1 1476.9 � 138.7 2362.0 � 291.8 1.6c
a Data were taken from microarray data in Table 1.b Data were taken from microarray data in Table 3 and supplemental Table S4.c p � 0.01 indicates a significant difference between night and day in situhybridization signal.
Interrogating the Pineal Transcriptome
7614 JOURNAL OF BIOLOGICAL CHEMISTRY VOLUME 284 • NUMBER 12 • MARCH 20, 2009
by guest on July 6, 2018http://w
ww
.jbc.org/D
ownloaded from

cytes of the capillaries in fairly large perivascular spaces (Fig. 3),with a ground substance consisting of acid mucopolysacchar-ides. Some arterioles are also present, which adds the smooth
muscle cell to the list of minor cel-lular components of the pinealgland. In addition, minor popula-tions of phagocytes are located inthe pineal perivascular spaces and inthe parenchyma of the gland (69).Finally, T-cells and other membersof the immune family of cells can betransiently present in the gland orlocated in a cluster just outside thegland (5).This cellular complexity makes it
clear that some of the highly ornight/day differentially expressedgenes may be located in cells otherthan the pinealocyte. This possibil-ity is made clear by the example ofEsm1, an endothelial cell markerthat is known to be highly expressedin the pineal gland (70, 71). Com-parison of the patterns of expressionof Esm1 and of pinealocyte markersas revealed by in situ hybridizationhistologymakes it clear that Esm1 isnot expressed in pinealocytes and islikely to mark endothelial cells. Pre-vious studieswith another gene, Id1,have provided a reason of a differentnature that also argues for theimportance of consideration of thecellular localization of transcripts.These studies found that expressionof Id1 follows a daily rhythm (26)and is expressed at levels that are�8-fold higher than in other tissues.Id1 is expressed in the pineal glandat very high levels in a small popula-tion of glial-like cells and at lowerlevels in pinealocytes (72). Simil-arly, in evaluating the conditionalchanges in gene expression (night/day, NE, Bt2cAMP), it is clear thatgenes may be differentially ex-pressed in non-pinealocyte sites andthat evidence from histologicalstudies or gene profiling of purifiedcell preparations or both is requiredto establish the site of expression ofa gene of interest to provide the cel-lular context in which a gene isexpressed.
Large Number of Genes ThatExhibit Daily Changes in Expressionin the Pineal Gland
An unexpected finding from this effort was the large numberof genes that exhibit night/day differences in expression; morethan 600 genes are differentially expressed on a night/day basis
FIGURE 4. qRT-PCR analysis of transcripts that are night/day differentially expressed or have high rExvalues or both. The lighting cycle is represented at the bottom of each column. Transcripts are identified bygene symbol. Each value is the mean � S.E. of three determinations. Values were normalized to Actb, Gapdh,Hrpt1, and Rnr1. A single asterisk identifies statistically significant rhythmic patterns of gene expression (p �0.01) based on log transformed raw values analyzed by one-way analysis of variance in JMP. For technicaldetails, see “Experimental Procedures” and the supplemental material.
Interrogating the Pineal Transcriptome
MARCH 20, 2009 • VOLUME 284 • NUMBER 12 JOURNAL OF BIOLOGICAL CHEMISTRY 7615
by guest on July 6, 2018http://w
ww
.jbc.org/D
ownloaded from

more than 2-fold, with �70% increasing at night. The fargreater number of night/day differentially expressed genes seenin this study as compared with the less than 40 genes seen inprevious studies (26, 55) may reflect several factors, includingthe larger number of probe sets interrogated by the RAE230Amicroarray (15,923 probe sets, 10,174 genes) and the Rat230_2microarray (31,099 probe sets, 13,663 genes), as compared withthe two platforms used in the previous studies, including theAffymetrix RG_U34A microarray (8,799 probe sets, 4,996genes) and the Atlas Rat 1.2 cDNA expression array (1,176genes). Other factors that may have contributed to the differ-ences are the larger number of replicates in this study, which isbased on a total of 10 pools of night and of day glands; previousstudies used less. In addition, technical differences and differ-ences in statistical analyses may have contributed to the num-ber of genes detected.
A striking feature of the global change in gene expression isthat many genes are differentially expressed on a night/daybasis with a greater than 10-fold amplitude. This characteristicis consistent with the dedicated role that the pineal gland has intime-keeping.It is likely that the number of night/day differentially
expressed genes will grow in the future for several reasons. Oneis that the two-point sampling (mid-day versusmidnight) usedhere may not have revealed daily rhythms in expression thatpeak closer to dawn or dusk, which might be revealed by morefrequent sampling. For example, recent studies have revealedsuch a rhythm in expression ofPax4 (73). In addition, the night/day differentially expressed genes identified in Table 1 onlyinclude those that have been assigned Entrez Gene identifiersand exceed a 2-fold night/day threshold. Approximately 500 ofthese have not been assigned Entrez Gene identifiers, andalthough these may represent noncoding RNAs of unrecog-nized genes, some may represent unidentified genes. Accord-ingly, the complete annotation of the rat genome will furtherexpand the number of genes that are expressed differentially ona 24-h basis in the pineal gland, as will more frequent timesampling. Furthermore, the precise nature of the transcriptsencoded by genes cannot be reliably predicted from the resultsof microarray studies, because the microarray probes are basedon 3 sequence; this may not detect differential splicing and/orthe actions of alternative promoters, which can markedly alterthe expressed transcript, as seen with Crem, Slc15a1, Atp7b,and Pde4b (21, 23, 24, 74).It is important to note that changes in mRNA may be large
and unequivocal, but one cannot reliably predict that suchchanges will be translated into changes in protein. Such a rela-tionship is seen in the pineal gland in the case of Mat2a,Slc15a1, Pde4b, and Fcer1a (22, 23, 75, 76); in these cases, thetranscripts and encoded proteins appear to have similar stabil-ity. However, the daily changes in gene expression in othercases may be only slowly translated into changes in proteinsover a period of days or weeks, not hours, thereby providing anintegrated measure of prior levels of activity, i.e. changes in theduration of the periods of expression of some genesmay lead tovery gradual changes in the level of the encoded protein as hasbeen shown to be the case in the pineal gland with the Cremsplice variant Icer (24, 77) and the adrenergic receptor Adra1b(19). Likewise, post-translational regulation can cause veryrapid changes in protein, without the encoding mRNA chang-ing as seen with Aanat (78, 79).
Adrenergic/cAMP Signaling Plays a Dominant Role inControlling the Global Changes in Pineal Gene Expression
As indicated in the Introduction, previous studies of night/day differentially expressed genes have provided convincingevidence that NE controls cAMP accumulation, which in turncontrols gene expression. These studies have established clearlythat NE is released at night in the dark and that when release isblocked, night/day differences in gene expression are blocked.Moreover, it has been shown repeatedly that the night/day dif-ferences in gene expression can be mimicked in organ or cellculture by treatmentwithNE,which elevates cyclicAMP in thistissue. Furthermore, it has been established that in all cases, the
TABLE 6Effects of NE, Bt2cAMP, or forskolin on transcript abundance incultured pineal glandsGlands were cultured for 48 h prior to the initiation of the indicated treatment.Treatment duration was 6 h. Transcript abundance wasmeasured by qRT-PCR andnormalized as described under “Experimental Procedures.” Each value is based onresults obtained from three pools of three glands and given as a treatment/controlratio. Amore extensive version of this table, including absolute values of themean�S.E., is available in supplemental Table S6.
Gene symbol NE/control Bt2cAMP/control Forskolin/controlAanat 143.7a 284.8a 96.2aAbca1 2.43a 4.21a 2.26aAcly 1/1.27 1.34 1.52Actbb 1/1.20 1/1.17 1/1.22Alox15 1.14 1.62 1.59Asmt 1.11 1.31 1.80Ccl9 1/3.27 1/3.50 1/10.49Cd8a 1/1.30 2.45 3.78Cebpb 2.10 4.78a 2.40Cited4 50.1a 84.1a 49.1aCrem 31.6a 32.5a 27.6aDdc 1/1.29 1.01 1/1.07Dio2 3.92a 10.8a 11.0aDrd4 14.0a 41.9a 20.1aDusp1 13.7a 18.7a 5.86aEgr1 1.31 1/1.03 1/1.61Esm1 1/1.09 3.32a 2.42aFcer1a 3.92a 10.8a 11.0aFosl2 3.09a 4.74a 2.91aGalnt14 1/3.79a 1/2.16a 1/3.01aGapdhb 1.00 1.32 1.00Gch1 1.25 1.18 1/1.01Hhip 16.9a 36.5a 59.0aId1 2.36 2.98a 1.97Id3 1.05 1.17 1/1.26Il18 1.36 1.56a 1.46Kpna2 1/1.46 1.20 1.23Lta 1.36 2.06 1.82Map3k5 1.20 2.45a 2.17Mat2a 9.12a 11.0a 6.78aMfrp 1/9.71 1.46 1/6.67Neurod1 1.11 1.13 1.27Npy1r 1/3.81a 1/2.69a 1/2.01Nr4a2 1.76 5.07a 2.42Opn1sw 1.39 1.48 1/1.03Per2 1.10 1.35 1.49Rnr1b 1.23 1/1.08 1.69Slc6a17 4.40a 11.3a 10.8aSlc15a1 479.3a 472.2a 174.7aSnf1lk 10.7a 11.8a 7.48aSt8sia5 1.64 2.27a 1.78Tnf 1/1.03 1/4.68a 1/1.48Tph1 1/1.05 1.07 1/1.21Ttr 1/1.29 1.16 1/1.33Ush2a 1/2.50a 1/1.53a 1/2.38a
a p � 0.01.b Data indicates genes used for normalization.
Interrogating the Pineal Transcriptome
7616 JOURNAL OF BIOLOGICAL CHEMISTRY VOLUME 284 • NUMBER 12 • MARCH 20, 2009
by guest on July 6, 2018http://w
ww
.jbc.org/D
ownloaded from

effects of NE on gene expression are mimicked by elevation ofcAMPor by cAMPprotagonists. The results of this studymark-edly expand the list of adrenergically regulated genes and indoing so demonstrate that a single regulatory signal can have aprofound effect on the transcriptome of one tissue.A previous study did not find a correlation between night/
day differentially expressed genes and those induced by NEtreatment (26, 55, 80). It is likely that this difference is becauseof the short NE treatment period (1 h) used in the previousstudy (80). The current set of experiments used a 6-h treatmentperiod, which more closely reflects the period animals were inthe dark in the in vivo studies.As discussed above, the number of genes controlled by this
signaling cascade is likely to increase because of annotationissues and also because only a single 6-h treatment period wasstudied, whichmight not detect changes that occur rapidly andtransiently or those that are slow to develop. In addition,another reason that gene expressionmight not increase in somecases is the artificial conditions of organ culture, including useof a defined minimal medium. The absence of hormones andother factors critical for expression of some genes might pre-cludea response toNEorBt2cAMP.Accordingly, it ispossible thatfuture investigations will find that NE induction of some genesmay require one or more coregulating factors that are absentfrom the current organ culture medium. As a result, the num-ber of genes regulated by NE would increase.The effects of cAMP, as addressed in the Introduction, are
likely to be mediated by cAMP-dependent protein kinase andreflect either a specific pCREB/CRE interaction or more gen-eral epigeneticmechanisms, including regulation by histoneH3phosphorylation and acetylation. Epigenetic modulation ofchromatin organization could influence access of transcriptionfactors to regulatory elements in genes. In this case, cAMP canbe seen as a transcriptional regulator acting through epigeneticmechanisms that do not involve pCREB/CRE interactions.The finding that cAMP suppresses expression of some genes
may be explained by the induction of inhibitory transcriptionfactors, as recently discussed (81), and also along epigeneticlines, because cAMP may act to block access to a regulatoryelement by altering chromatin structure.The finding that most of the genes that are differentially
expressed on a night/day basis are also regulated by NE pro-vides evidence for concluding that these genes are expressedon a circadian basis, i.e. a daily rhythm will be seen in con-stant darkness and does not require light/dark transitions.This conclusion is supported by the fact that the release ofNE into the pineal extracellular space is controlled by theSCN. As discussed in the Introduction, the SCN/SCG/NE/cAMP regulatory system has been found to regulate a smallnumber of genes in the pineal gland based on classical bio-chemical and physiological evidence. The results of thisstudy provide reason to conclude that all genes found in thisstudy to be controlled by NE and Bt2cAMP are physiologi-cally controlled by the endogenous circadian oscillator in theSCN and that their rhythms can be correctly described ascircadian in nature.
Genes That Are Spontaneously Up- or Down-regulated inOrgan Culture
The relative level of expression ofmost genes compared withtotal gene expression does not change remarkably after pinealglands are placed in culture.However, we discovered a subset ofgenes that exhibited greater than 10-fold positive and negativechanges during culture. Decreased gene expression may reflectthe absence from organ culture of a regulatory factor or hor-mone normally present in the circulation or of a transmitter(e.g. dopamine or neuroactive peptides) that is normallyreleased from the sympathetic nerve endings. Gene expressionmay also change in response to the culture environment (95%O2 and defined medium) or because physiologically relevantlocal controlmechanisms do not function in vitro. For example,these changes could reflect the absence of interactions betweenpinealocytes and the vasculature.It is of special interest to note that there was a marked
decrease in the expression of one of the more important genesin the melatonin synthesis pathway, Asmt, which encodes thelast enzyme in melatonin synthesis. This has not been reportedpreviously. Studies with rodents have revealed that expressionof this enzyme can be regulated by adrenergic mechanisms (82,83). Other studies of this gene in Y79 cells, a human retinoblas-toma-derived line, indicate that expression of the gene is con-trolled by 9-cis-retinoic acid (84). However, we have not beenable to prevent the decrease in Asmt expression in the culturedrat pineal gland by treatment with 9-cis-retinoic acid, NE, orBt2cAMP.16 Accordingly, the factors controlling expression ofthis gene remain unknown.Studies with retinoblastoma cells have also found that 9-cis-
retinoic acid regulates expression of Crx and a set of genesexpressed in cones (85), pointing to the need for further studieson 9-cis-retinoic acid and the role it plays in pineal biology.Similarly, expression of the opsin geneOpn1sw falls more than50-fold in culture; its expression is controlled by T3 signaling(86). Accordingly, it is possible that treatment of pineal glandswith T3 and retinoic acid, which are known to act in concertthrough heterodimeric receptor complexes, may prevent someof the spontaneous large changes in gene expression that occurduring culture and that media used for pineal organ culturesshould be supplemented accordingly.As mentioned under “Results,” it is also likely that the disap-
pearance of some genes reflects the loss of blood cells normallypresent in the vasculature, as is probably the case for Hba-a1and Hbb, which are expressed in the red blood cells.
Functional Implications
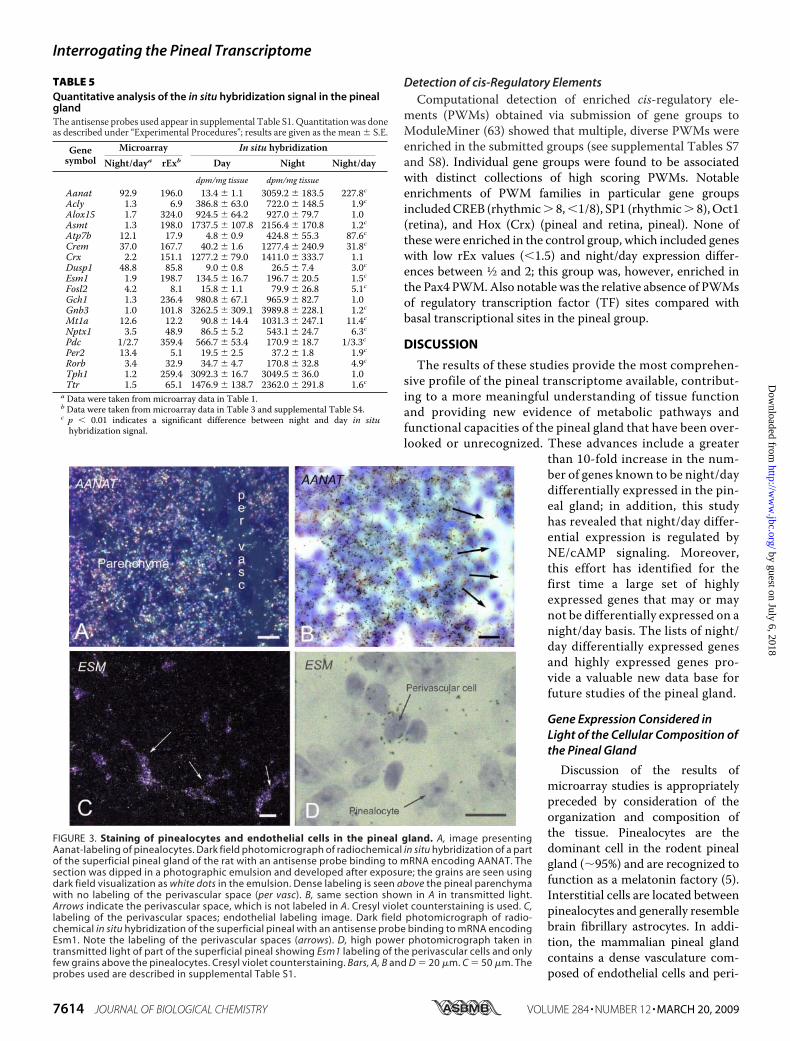
Functional clustering (see under “Experimental Procedures”)of the genes selected for inclusion in Table 7 (rhythmicallyexpressed, highly pineal enriched, or both) places these genesinto two broad functional categories. These are as follows: first,groups of genes that participate in specialized functions; andsecond, genes that have a nonspecialized,more common role incell biology.
16 D. C. Klein, J. L. Weller, and F. G. Amaral, unpublished studies.
Interrogating the Pineal Transcriptome
MARCH 20, 2009 • VOLUME 284 • NUMBER 12 JOURNAL OF BIOLOGICAL CHEMISTRY 7617
by guest on July 6, 2018http://w
ww
.jbc.org/D
ownloaded from
Specialized Functional Gene Groups
Two of these gene groups are predictable from previousknowledge (melatonin production and phototransduction),whereas two other groups (immune response and T3/retinoicacid signaling) are less predictable.Melatonin Production—Most predictable are those genes
that code for proteins involved in melatonin production,including both enzymes that function directly in the melatoninsynthesis pathway and cofactors required for these enzymes. Itis also very likely that many of the genes encoding proteinsdedicated to protein phosphorylation and to cAMP and cal-cium signaling are involved in the control of melatonin synthe-sis, in part through regulation of Aanat expression and proc-essing of AANAT protein.Phototransduction—Gene expression similarities between
the pinealocyte and the retina have been documented before,but they were limited to less than 20 genes. This study greatlyextends the number of genes known to be highly expressedprimarily in pineal/retina to over 55 genes (63 probe sets). A
common expression pattern reflects well documented evolu-tionary relationships between the pineal gland and retina (54,87, 88); but by revealing the real extent of pineal gland/retinacoexpression, we have freshly questioned the functional rele-vance of phototransduction-related genes in the mammalianpineal gland (see below). Highly expressed pineal gland/retinagenes also include transcription factors (Otx2, Crx, Neurod1,and Pax6) that likely drive the common transcriptional outputsin these tissues. The work done here also led to the finding thatboth tissues express high levels of Pax4, an ortholog of Pax6(89). Importantly, adult expression of these transcription factorgenes implies roles in maintenance of cellular phenotype, inaddition to roles during development.It is of interest to note that the expression of one opsin gene
in the pineal gland is higher than that in the retina; Opn1sw isexpressed 4-fold higher in the pineal gland as compared withthe retina. In contrast,Opn1mw andRho are expressed at 18- or�400-fold higher in the retina, respectively. This and the find-ing that the pineal gland expressesmany genes involved in pho-
TABLE 7Functional grouping of genes that are night/day differentially expressed (N/D >2 or <1/2) or at high levels (rEx >4) in the pineal glandAll genes appear in Tables 1 and 3 and, supplemental Tables S3 and S4.
Functional group Gene symbolSpecialized processesImmune response/inflammation Abhd2,a And, Ahcy, Alms1,a ArHgef9, Bbs7, Bcar1, Btg2, C3, Ccl2, Ccl6, Ccl7, Ccl9, Ccrl2,a Cd1d1, Cd47, Cd74, Cd8a, Crcp,
Ctsc, Ctss, Defb24, Dscr1, Fcer1a, Fras1,a Gdf15, Gem,a Hivep1, Hivep2, Icsbp1, Ifi35, IfiTm1,a Ifnar1,a Igsf4a, Igsf9,a Igha,II13ra2, II17re, Il18, Il1rl1l, Ilk, Impdh2, Inhbb, Irak2, Irf7, Ler3, Litaf, Lrrc8, Lta4h, Mal2, Mdk, Mina, Mmd2, Mox2, Mx2,Oit1,a Optn, Pcna, Plscr1, Pvr, Pvrl2, RT1-A1, RT1-A2, RT1-A3, RT1-Aw2, RT1-Bb, RT1-Da, Sct2, Sema3a, Serping1, Slfn3,Stch, Stip1, Tfp12, Tpm4, Ush2a, Vof16
Melatonin synthesis Aanat, Acly, Asmt, Ddc, Gch1, Gchfr, Mat2a, Pcbd1, Tph1Photodetection Genes linked to photodetection in the pineal gland are considered to be highly expressed in both the pineal gland and retina;
they are listed in Table 4 and supplemental Table S5T3/RA signaling Dio2, Hr, Rbp3, Rdh12,a Rorb,a Rxrg, Thrb, Ttr
Nonspecialized processesAdhesion Cdh22, Celsr32, Cml5, Cntn4, Dsc2, Eva,a Gja12,a Glycam1, Grn, Hnt, Mcam, Mfap4, Mpp4, Muc4, Nell2, Parvb, Pcdh21,
Prph2, Pvr, Scarb2, Sdc4, Spon1, Ssx21pCell cycle/cell death Acom1, Acvr1, Aprin, Bag1,a Giklk, Casp7, Ccnd2, Cdc25a, Cdc5l, Cdk5, Cdkn1b, Cdkn1c, Cflar, Ches1,a Commd5, Csnk2a2,
Ddit3, Dnm1, Dnm2, Elmo3, Faim, Gos2, Gadd45a, Gadd45b, Igf1r, Igfbpl1,a Jag1, Junb, Mad2l2, Mak10, Ntf3, Pafah1b1,Pard3, Pdia3, Plagl1, Ptgs2, Qscn6, Rarres1, Rgc32, Fhob, Slc31a1, Strn3, Tacc3, Vegfc
Cytoskeleton Ap1g1, Baiapw, Bbs4,a Catna1, Clasp2, Clta, Col14a1,a Col3a1, Col4a3, Col8a1,a Cope,a Cpg2, Dnch1, Dncl2b,a Dncl2b,aEmilin1,a Emls, Fgd2,a lnb,a Flnc,a Fmod, Fni, Fscn2,a Hdac11,a Ka15, Kif1b, Kif22, Kif2c, Krt1–18, Krt1–19, Krt25, Lad1,aLama2,a Lamb1–1,a Lap1b, Lcp1, Lix1, Lmod1, Lumk, Mapt, Marcks, Mfap5,a Mgp, Mrgl19, Mtap2, Mylip,a Nrap,a Pgea1,Rpl3, Sas, Selpl,a Sdo3, Spna2, Tctex1, Thbs4, Tmem16a,a Tmem22, Tpm4, Tuba4, Tubb5, Unc119, Vil2, Vim
DNAmodification Adprt, Blm,a Bnc2,a Cntn1, Commd1,aCtps,a Herc3,a Hmgb2, Kpna2, Mcm4, Pcna, Prc1,a Prim1, Ptms, Rere, Thap4, Tlk1,aTop1, Tspyl4, Zdhhc22, Zfp143, Zfp162, Zfp238, Zfp36l1, Zhx1, Znf444, Zswim5,a
Endothelium Esm1, Vegfb, Vegfc, VwfGrowth Efemt1, Egf, Egfr, Egfr1, Fgf1, Fgfr1, Gadd45g, Gdf15, Gfer, Grb2, Igf1r, Igfbp2, Igfbp6, Pdgfrl, Pgf, Tgfb1, Tgfbi, Vegfb, VegfcSignaling Calcium: Atp2b3, Cabp1, Cacna1f, Cacna1g, Calm1, Camk1g, Camk2b, Cip98, Dcamkl1, Dcamkl3
Cyclic nucleotide: Adcy8, Akap11, Cnga1, Cngb1, Creb3, Guca1a , Gucy1a3, Hcn1, Pde4b, Pde4d, Pde6b, Pde8b, Pde10a,Prkar2b, Prkca
G-protein: Arf3, Arr3, Arl2bp, Arl6ip5, Gem, Gna12, Gnaq, Gnas, Gnat2, Gnaz, Gnb1, Gnb3, Gng11, Grk1, Pdc1, Rgs2, Rgs4,Rgs7, Rgs9, Rgs17, Sag1, Tyro3
Membrane receptors/ligands: Acvr1, Adra1b, Adrb1, Agtrap, Bmp6, Chrna3, Chrnb1, Chrnb4, Crcp, Drd1a, Drd4, Ece1, Ednrb,Egf, Egfr, Fgf, Fgfr1, Fst, Fzd4, Grip2, Grm1, Grm2, Hcrtr1, Htr2c, Igf1r ,Igfbp2, Igfbp3, Igfbp5, Igfbp6, Lepr, Nog, Opn1sw, Prlr,Sort1,Vipr2
Lipid/ Phospholipid/cholesterol: Abca1,Alox15, Cyp27a1, Ephx1, Inpp5e, Itpr1, Lta4h, Ltb4dh, Pa2g1b, Pik3r3, Pla2g5, Plcb1,Plcd4, Ptgds, Ptgis
MAP kinase: Dusp1, Errfi1, Map3k5, Map3k6, Map4k1, Mapk14, Mapk6Protein phosphorylation, serine/threonine: Calm1, Camk1g, Camk2b, Cdk5, Cdkn1b, Crkas, Dcamkl1, Enh, Fez1, Gsk3b, Nell2,Pak2, Prkar2b, Prkca, Prkcdbp, Prkce, Prkcl1, Rock2, Sik2, Snrk, Stk2, Stk39
Protein phosphorylation, tyrosine: Crkas, Efna5, Jak1, Kit, Ntrk2, Ntrk3, Ptp2E, Ptp4a1, Ptpn16, Ptprj, Ptprr, Ptp-Td14, Tyro3RNA modification Ankrd24,a Bfsp1, Bop1, Bzw2, Eif2ak4,a Eif2c2, Eif3s9, Eif4g2, Ell2, Hdac5, Polr2d,a Qtrt1, Rnase1, Rnase2,a Rpat1, Sfpq, XpotaSmall molecule biology Metal homeostasis: Atp7b, Chordc1, Mt1a, Mt2, Slc30a1 Slc39a4
Ion homeostasis: Atp1a1, Atp1b1, Atp1b2, Atp2a2, Atp2b1, Cacna1h, Cacnb2, Clcn3, Cnga1, Cngb1, Hcn1, Kcnab2, Kcne2,Kcnh6, Kcnj14, Kctd3, Scn7a, Slc12a2, Slc12a5, Slc17a6, Slc24a1
Solute transport: Slc2a1, Slc2a4, Slc3a1, Slc4a2, Slc4a4, Slc6a6, Slc7a1, Slc7a7, Slc12a2, Slc12a5, Slc14a1, Slc15a1, Slc16a1,Slc16a6, Slc21a1, Slc21a7, Slc22a1, Slc25a10, Slc29a1, Slc30a1, Slc34a1
Transcription factors Arntl, Bhlhb3, Cebpb, Crem, Cbx5, Cry2, Crx, Datf1, Eya2, Fosl2, Foxd1, Hdac5, Homer1, Homer2, Hr, Isl2, Jun, Junb, Mitf,Msx1, Neurod1, Nr1d2, Nr1h4, Nr2f6, Nr4a1, Nr4a3, Otx2, Pax4, Pax6, Per2, Ptch1, Rax, Rorb, Rxrg, Thrb
Vesicle biology Cadps, Chga, Chgb, Clta, Cltb, Dnm1, Dnm2, Dnm3, Lphn2, Ptprn, Scg2, Scg3, Snap23, Snap25, Sny2, Stx3, Sv2b, Syt4a Predicted gene is indicated.
Interrogating the Pineal Transcriptome
7618 JOURNAL OF BIOLOGICAL CHEMISTRY VOLUME 284 • NUMBER 12 • MARCH 20, 2009
by guest on July 6, 2018http://w
ww
.jbc.org/D
ownloaded from

totransduction provide genetic evidence that this tissue mightdetect light; however, there is no evidence that the adult pinealgland has this capacity. Photodetection by neonatal pinealgland has been reported (90–92); however, the underlyingmechanism involved has not been elucidated, and it is not clearwhether this involves the phototransduction system that oper-ates in the retina or anothermechanism. PinealOpn1swmay befunctionally vestigial in the adult pinealocyte as regards detec-tion of light. However, it is also possible that it plays a passiverole in signal transduction that does not involve detection oflight; for example, it might influence signal transduction bybinding to receptors and other proteins involved in adrenergicsignaling.Immune/Inflammation Response—Our identification of a
large cluster of immune/inflammation-associated genesexpressed in the rat pineal gland reflects similar findings in anavian species (88) and is therefore of interest. A potential,immune-related, functional specialization for the pineal glandis indicated by the presence of perivascular phagocytes that actas antigen-presenting cells (69), and also by the strong expres-sion of Fcera1 (a receptor dedicated to IgE signaling), and arelated gene in the pineal gland (76). Further study of thesegenes may lead to a better understanding of the role of thepineal gland in the immune response.T3/Retinoic Acid Signaling—Our finding of high levels of
transcripts associated with T3/retinoic acid signaling sug-gests a potential functional specialization related to this sig-naling pathway. Previously there has been a report of effectsof T3 on melatonin synthesis and a substantial body of evi-dence indicating that Dio2 is night/day differentiallyexpressed in this tissue (93–95). Together with reports ofeffects of T3 on retinal function (86, 96–99), the accumu-lated evidence argues for future studies that involve specificfunctional interventions of this signaling pathway in boththe pineal gland and retina.
Nonspecialized Functional Gene Groups
Cellular Signaling—A functional cluster of “cellular signal-ing” genes derived from the genes of Table 7 is consistent, atleast in part, with the evidence of adrenergic control of pinealfunction, which involves a broad range of signal transduction-related proteins. As indicated above, many of these are likelyinvolved in regulating melatonin production. The high rEx ofDrd4 and known rhythmic pattern of expression (26) point to arelated role for dopamine in pineal function because dopamineis colocalized in pineal nerve processes as a precursor of NE; assuch, it is likely to be released with NE. The role of dopamine inthe pineal gland remains to be fully established. It is of interestthat Drd4 expression was not elevated by NE or Bt2cAMP inorgan culture. This raises the question of how expression of thisgene is regulated in vivo.This study has also highlighted groups of genes that have not
received significant attention. These include genes related toprostaglandin synthesis and the lipoxygenase 15 pathway,which leads to production of hepoxilins and related compounds(100–106). The regulation and function of these pathways andtheir cellular sources and targets requires further investigation.Other less well studied genes in a pineal context included the
receptors for prolactin, acetylcholine, GABA, glutamate, andinterleukin, suggesting roles in pineal gland signaling.Acetylcholine receptor expression is consistent with anatomi-cal evidence (5) that reveals the presence of nonsympathetic,probably parasympathetic, nerve fibers in the pineal gland ofthe rat and with biochemical studies that have shown the pres-ence of both muscarinic (107) and nicotinic (108) cholinergicreceptors. Furthermore, it has been shown that a cholinergicinput to the rat pineal gland causes the release of glutamate,which has been reported to act via glutamate receptors on thepinealocyte membrane to inhibit melatonin synthesis (109,110).Genes Dedicated to Small Molecule Biology—Included
among this cluster of genes is the taurine transporter Slc6a6,perhaps explaining the high concentration of taurine in the pin-eal gland (111); this gene is also highly expressed in the retina,another tissuewith a high concentration of taurine (112).Genesthat regulatemetal homeostasis are also clustered here. Zn2� isessential for the synthesis ofmelatonin, because it is required byGch to generate biopterin (113, 114), the cofactor for Tph1, thefirst enzyme in melatonin synthesis. Another essential role ofmetals of special relevance to pineal physiology is Sn�, which isessential for T3 signaling because it is required by Dio2 (115).Cell:Cell and Cell:Extracellular Matrix Contacts—Genes
encoding proteins involved in cell:cell and cell:extracellularmatrix contacts represent another group of genes that have notbeen well studied in the context of the pineal gland. Thisincludes several members of the cadherin family, which formhomophilic Ca2�-dependent associations. Knowledge of thesite of expression of these genes may be of practical utility inidentifying, purifying and immobilizing populations of cellsrecovered from the pineal gland.Circadian Clock Genes—Generally absent from the list of
strongly rhythmic or highly expressed (Table 7) genes are cir-cadian clock genes, exceptions being Per2 and Rorb. Expressionlevels of Arntl, Clock, Per1, Per2, Per3, Cry1, Cry2, and Arnt areless than 4-fold themedian tissue level of expression. Reports inthe literature have established that these genes are expressed inthe pineal gland, some following a 24-h pattern (116–119).Their absence from the lists of highly expressed or highly rhyth-mic genes may reflect a relatively unimportant role that thecircadian clock system plays in the mammalian pinealocyte ingenerating daily rhythms. The strong rhythm of Per2 mayreflect a related role in biological time-keeping, in that it mightinfluence the dynamics (intensity, duration) of the responses ofgenes with E-boxes, which includes Aanat (120, 121).
cis-Regulatory Elements
A question raised by our finding of large groups of pinealgland-specific and night/day differentially expressed genes iswhether these groups of genes share common transcriptionalregulatory DNA sequences. This question was addressed usingModuleMiner (63) using multiple groups of genes as inputs. Ingeneral, the results of this effort did not provide an indicationthat pineal specificity or night/day differences can be explainedby the presence of a few dominant regulatory elements. Thismay relate to inherent limitations of this analysis, which includethe analysis of only 10 kb 5 to the transcription start site and
Interrogating the Pineal Transcriptome
MARCH 20, 2009 • VOLUME 284 • NUMBER 12 JOURNAL OF BIOLOGICAL CHEMISTRY 7619
by guest on July 6, 2018http://w
ww
.jbc.org/D
ownloaded from

filtering that eliminates genes that do not exhibit human-mouse conservation of regulatory elements. Conversely, it ispossible that rhythmic or relatively high expression of genes inthe pineal gland reflects multiple parallel/hierarchicalregulatory cascades of such complexity that they would beimpenetrable to this mode of analysis. However, some of theresults of this analysis (see supplemental Table S7) are worthyof further consideration.Enrichment of a CREB family PWM in the group of highly
rhythmic genes (rhythmic �8, �1/8) is consistent with known,cAMP-driven, mechanisms of gene regulation in the pinealgland, as discussed in the Introduction. The NE/cAMP cascadeis evident from the results of the experiments presented here, inwhich gene expression was broadly enhanced by treatmentwith Bt2cAMP, a stable cAMP analog; with forskolin, an activa-tor of adenylate cyclase; orwithNE,which elevates cAMP in thepineal gland. Conversely, the absence of a similar enrichment inless highly rhythmic genes suggests the presence of alternativemechanisms. The enrichment of SP1 PWMs in moderatelyrhythmic and highly rhythmic groups is interesting in this con-text and may warrant further investigation because a previousstudy has indicated a role for SP1 in pineal gene rhythmicity(122).Surprisingly, we did not observe widespread enrichment of
Hox family PWMs across the tissue-specific (pineal and retina)groups of genes; this is surprising because the Crx and Otxtranscription factors are known to regulate pineal gland- andretina-specific gene expression, as discussed in the Introduc-tion (31, 32, 123). Our results show the Crx PWM to beenriched only in the combined submission of pineal only andpineal/retina groups. This finding may indicate a more limited(pineal gland- and retina-related) role for Hox family-relatedmechanisms than is currently believed.With respect to the ret-ina, our analysis has revealed strong enrichment of anotherPWM family (Oct1) that is recognized as one PWM family/transcription factor that is associatedwith the visual perceptionGO term (GO:0007601; Matbase, Genomatix). With respect tothe pineal gland, an intriguing finding of the ModuleMineranalysis was the relative absence of conserved regulatory tran-scription factor sites in the “pineal only” group. This is an inter-esting result inwhichModuleMiner detects only a few enrichedsequences, and these are primarily either core promoter ele-ments such as initiator and cap or CEBP, all of which are amongthe most common sites found in eukaryotic promoters (124).This finding taken together with the Pineal only and Pineal/retina result is suggestive of common cis-regulatory rules forpineal/retinal tissues but the absence of a pineal only mech-anism, indicating either a novel cis or trans (e.g. microRNA)level of control not detected by this analysis or that the pinealgland-specific cascade is controlled by multiple unrelatedmechanisms.Another surprising finding of theModuleMiner analysis was
the enrichment of Pax4 sites within the control group of pinealgenes, genes expressed in this tissue that are neither rhythmicnor highly expressed relative to other tissues. Given the highrelative expression of Pax4 in the rat pineal gland (73), this maypoint to a negative mode of regulation in which the “control”gene group is suppressed via a Pax4-related mechanism. In this
respect, previous studies have provided evidence of repressiveactions of Pax4 (125).
Final Statement
The results of these studies provide investigators with a richand comprehensive genetic profiling of the rodent pineal glandand should provide a sound foundation for future investiga-tions of this tissue focused on the factors controlling develop-mental and rhythmic gene expression. The evidence providedhere also provides a basis for future research on the role ofT3/retinoic acid signaling in the pineal gland and on the role ofthis tissue in the immune/inflammation response. The findingthat most genes that exhibit daily changes in expression areregulated by NE/cAMP signaling raises intriguing questionsregarding the mechanisms involved, especially the role of epi-genetic events. Analysis of the factors regulating these largechanges in gene expression and expression of genes at relativelyhigh levels in the pineal glandmay be of interest to investigatorsstudying these genes in other tissues, especially the retina. Theindication from the results of analysis of cis-regulatory ele-ments that transcript abundance in the pineal gland involvesPWMs, which have not previously appeared in the pineal liter-ature, opens new doors to the analysis of the molecular controlof gene expression in this tissue.
Acknowledgments—The support of John Walker and Andrew Su(Novartis Research Foundation) in facilitating the use of data in theNovartis Research Foundation Data Base is greatly appreciated, as isthe expert histological assistance of Ursula Rentzmann (University ofCopenhagen).
Note Added in Proof—The Sertoli cell data used for calculatingmedian expression levels in experiment A were obtained fromRef. 126.
REFERENCES1. Maronde, E., and Stehle, J. H. (2007) Trends Endocrinol. Metab. 18,
142–1492. Arendt, J. (1994)Melatonin and the Mammalian Pineal Gland, 1st Ed.,
pp. 1–331, Chapman & Hall, New York3. Lincoln, G. A. (2006) Chronobiol. Int. 23, 301–3064. Klein, D. C. (1985) CIBA Found. Symp. 117, 38–565. Moller, M., and Baeres, F. M. (2002) Cell Tissue Res. 309, 139–1506. Klein, D. C., Sugden, D., and Weller, J. L. (1983) Proc. Natl. Acad. Sci.
U. S. A. 80, 599–6037. Sugden, L. A., Sugden, D., and Klein, D. C. (1987) J. Biol. Chem. 262,
741–7458. Auerbach, D. A., Klein, D. C., Woodard, C., and Aurbach, G. D. (1981)
Endocrinology 108, 559–5679. Chik, C. L., Ho,A. K., andKlein,D.C. (1988)Endocrinology122, 702–70810. Sugden, D., and Klein, D. C. (1984) Endocrinology 114, 435–44011. Sugden, A. L., Sugden, D., and Klein, D. C. (1986) J. Biol. Chem. 261,
11608–1161212. Sugden, D., Anwar, N., and Klein, D. C. (1996) Br. J. Pharmacol. 118,
1246–125213. Vanecek, J., Sugden, D., Weller, J., and Klein, D. C. (1985) Endocrinology
116, 2167–217314. Ho, A. K., and Klein, D. C. (1987) J. Biol. Chem. 262, 11764–1177015. Ho, A. K., and Klein, D. C. (1987) J. Neurochem. 48, 1033–103816. Ho, A. K., Chik, C. L., and Klein, D. C. (1988) J. Pineal Res. 5, 553–56417. Klein, D. C. (2007) J. Biol. Chem. 282, 4233–423718. Baler, R., Coon, S. L., and Klein, D. C. (1996) Biochem. Biophys. Res.
Interrogating the Pineal Transcriptome
7620 JOURNAL OF BIOLOGICAL CHEMISTRY VOLUME 284 • NUMBER 12 • MARCH 20, 2009
by guest on July 6, 2018http://w
ww
.jbc.org/D
ownloaded from

Commun. 220, 975–97819. Coon, S. L., McCune, S. K., Sugden, D., and Klein, D. C. (1997) Mol.
Pharmacol. 51, 551–55720. Li, X., Chen, S.,Wang, Q., Zack, D. J., Snyder, S. H., and Borjigin, J. (1998)
Proc. Natl. Acad. Sci. U. S. A. 95, 1876–188121. Borjigin, J., Payne, A. S., Deng, J., Li, X., Wang, M. M., Ovodenko, B.,
Gitlin, J. D., and Snyder, S. H. (1999) J. Neurosci. 19, 1018–102622. Kim, J. S., Bailey,M. J., Ho, A. K., Moller, M., Gaildrat, P., and Klein, D. C.
(2007) Endocrinology 148, 1475–148523. Gaildrat, P., Moller, M., Mukda, S., Humphries, A., Carter, D. A., Ga-
napathy, V., and Klein, D. C. (2005) J. Biol. Chem. 280, 16851–1686024. Stehle, J. H., Foulkes, N. S., Molina, C. A., Simonneaux, V., Pevet, P., and
Sassone-Corsi, P. (1993) Nature 365, 314–32025. Baler, R., and Klein, D. C. (1995) J. Biol. Chem. 270, 27319–2732526. Humphries, A., Klein, D., Baler, R., and Carter, D. A. (2002) J. Neuroen-
docrinol. 14, 101–10827. Borjigin, J., Deng, J., Wang,M.M., Li, X., Blackshaw, S., and Snyder, S. H.
(1999) J. Biol. Chem. 274, 35012–3501528. Borjigin, J., Deng, J., Sun, X., De Jesus, M., Liu, T., and Wang, M. M.
(2003) J. Biol. Chem. 278, 16315–1631929. Chik, C. L., Arnason, T. G., Dukewich, W. G., Price, D. M., Ranger, A.,
and Ho, A. K. (2007) Endocrinology 148, 1465–147230. Ho, A. K., Price, D. M., Dukewich, W. G., Steinberg, N., Arnason, T. G.,
and Chik, C. L. (2007) Endocrinology 148, 4592–460031. Furukawa, A., Koike, C., Lippincott, P., Cepko, C. L., and Furukawa, T.
(2002) J. Neurosci. 22, 1640–164732. Furukawa, T., Morrow, E. M., Li, T., Davis, F. C., and Cepko, C. L. (1999)
Nat. Genet. 23, 466–47033. Appelbaum, L., and Gothilf, Y. (2006)Mol. Cell. Endocrinol. 252, 27–3334. Rath, M. F., Munoz, E., Ganguly, S., Morin, F., Shi, Q., Klein, D. C., and
Moller, M. (2006) J. Neurochem. 97, 556–56635. Estivill-Torrus, G., Vitalis, T., Fernandez-Llebrez, P., and Price, D. J.
(2001)Mech. Dev. 109, 215–22436. Gehring, W. J. (2002) Int. J. Dev. Biol. 46, 65–7337. Nishida, A., Furukawa, A., Koike, C., Tano, Y., Aizawa, S., Matsuo, I., and
Furukawa, T. (2003) Nat. Neurosci. 6, 1255–126338. Klein, D. C. (2006) Chronobiol. Int. 23, 5–2039. Dinet, V., Girard-Naud, N., Voisin, P., and Bernard, M. (2006) Exp. Eye
Res. 83, 276–29040. Kimura, A., Singh, D.,Wawrousek, E. F., Kikuchi,M., Nakamura,M., and
Shinohara, T. (2000) J. Biol. Chem. 275, 1152–116041. Appelbaum, L., Anzulovich, A., Baler, R., and Gothilf, Y. (2005) J. Biol.
Chem. 280, 11544–1155142. Appelbaum, L., Toyama, R., Dawid, I. B., Klein, D. C., Baler, R., and
Gothilf, Y. (2004)Mol. Endocrinol. 18, 1210–122143. Bernard, M., Dinet, V., and Voisin, P. (2001) J. Neurochem. 79, 248–25744. Gothilf, Y., Toyama, R., Coon, S. L., Du, S. J., Dawid, I. B., and Klein, D. C.
(2002) Dev. Dyn. 225, 241–24945. Mani, S. S., Besharse, J. C., and Knox, B. E. (1999) J. Biol. Chem. 274,
15590–1559746. Young, J. E., Kasperek, E. M., Vogt, T. M., Lis, A., and Khani, S. C. (2007)
Genomics 90, 236–24847. Gothilf, Y., Coon, S. L., Toyama, R., Chitnis, A., Namboodiri, M. A., and
Klein, D. C. (1999) Endocrinology 140, 4895–490348. Munoz, E. M., Bailey, M. J., Rath, M. F., Shi, Q., Morin, F., Coon, S. L.,
Moller, M., and Klein, D. C. (2007) J. Neurochem. 102, 887–89949. Roseboom, P. H., and Klein, D. C. (1995)Mol. Pharmacol. 47, 439–44950. Baler, R., Covington, S., and Klein, D. C. (1997) J. Biol. Chem. 272,
6979–698551. Tosini, G., Chaurasia, S. S., andMichael Iuvone, P. (2006)Chronobiol. Int.
23, 381–39152. Fukuhara, C., Liu, C., Ivanova, T. N., Chan, G. C., Storm, D. R., Iuvone,
P. M., and Tosini, G. (2004) J. Neurosci. 24, 1803–181153. Iuvone, P.M., Bernard,M., Alonso-Gomez, A., Greve, P., Cassone, V.M.,
and Klein, D. C. (1997) Biol. Signals 6, 217–22454. Falcon, J., Gothilf, Y., Coon, S. L., Boeuf, G., and Klein, D. C. (2003)
J. Neuroendocrinol. 15, 378–38255. Fukuhara, C., and Tosini, G. (2008) Neurosci. Res. 60, 192–198
56. Parfitt, A., Weller, J. L., and Klein, D. C. (1976) Neuropharmacology 15,353–358
57. Yu, A.M., Idle, J. R., Byrd, L. G., Krausz, K.W., Kupfer, A., and Gonzalez,F. J. (2003) Pharmacogenetics 13, 173–181
58. Walker, J. R., Su, A. I., Self, D. W., Hogenesch, J. B., Lapp, H., Maier, R.,Hoyer, D., and Bilbe, G. (2004) Genome Res. 14, 742–749
59. Edgar, R., Domrachev, M., and Lash, A. E. (2002) Nucleic Acids Res. 30,207–210
60. Benjamini, Y., and Hochberg, Y. (1995) J. R. Stat. Soc. Ser. B 57, 289–30061. Moller, M., Phansuwan-Pujito, P., Morgan, K. C., and Badiu, C. (1997)
Cell Tissue Res. 288, 279–28462. Vandesompele, J., De Preter, K., Pattyn, F., Poppe, B., Van Roy,
N., De Paepe, A., and Speleman, F. (2002) Genome Biol. 3,research0034.1–0034.11
63. Van Loo, P., Aerts, S., Thienpont, B., De Moor, B., Moreau, Y., andMarynen, P. (2008) Genome Biol. 9, R66
64. Klein, D. C. (2004) J. Biol. Rhythms 19, 264–27965. Ho, A. K., Terriff, D. L., Price, D.M.,Wloka,M. T., and Chik, C. L. (2007)
Endocrinology 148, 743–75166. Bai, L., Zimmer, S., Rickes, O., Rohleder, N., Holthues, H., Engel, L.,
Leube, R., and Spessert, R. (2008) Brain Res. 1203, 89–9667. Insel, P. A., and Ostrom, R. S. (2003) Cell. Mol. Neurobiol. 23, 305–31468. Seamon, K. B., and Daly, J. W. (1986) Adv. Cyclic Nucleotide Protein
Phosphorylation Res. 20, 1–15069. Moller, M., Rath, M. F., and Klein, D. C. (2006) Chronobiol. Int. 23,
393–40170. Wang, X., Brownstein, M. J., and Young,W. S., III (1996) Brain Res. Mol.
Brain Res. 41, 269–27871. Wang, X., Brownstein, M. J., and Young, W. S. (1997) J. Neurosci. Meth-
ods 73, 187–19172. Kofler, B., Bulleyment, A., Humphries, A., and Carter, D. A. (2002) His-
tochem. J. 34, 167–17173. Rath, M., Bailey, M. J., Kim, J.-S., Ho, A. K., Gaildrat, P., Coon, S. L.,
Møller, M., and Klein, D. C. (2009) Endocrinology, in press74. Kim, J. S., Bailey,M. J., Ho, A. K., Moller, M., Gaildrat, P., and Klein, D. C.
(2007) Endocrinology 148, 1475–148575. Kim, J. S., Coon, S. L., Blackshaw, S., Cepko, C. L., Moller, M., Mukda, S.,
Zhao, W. Q., Charlton, C. G., and Klein, D. C. (2005) J. Biol. Chem. 280,677–684
76. Ganguly, S., Grodzki, C., Sugden, D., Moller, M., Odom, S., Gaildrat, P.,Gery, I., Siraganian, R. P., Rivera, J., and Klein, D. C. (2007) J. Biol. Chem.282, 32758–32764
77. Foulkes,N. S., Duval, G., and Sassone-Corsi, P. (1996)Nature381, 83–8578. Roseboom, P. H., Coon, S. L., Baler, R., McCune, S. K., Weller, J. L., and
Klein, D. C. (1996) Endocrinology 137, 3033–304579. Klein, D. C., Coon, S. L., Roseboom, P. H., Weller, J. L., Bernard, M.,
Gastel, J. A., Zatz, M., Iuvone, P.M., Rodriguez, I. R., Begay, V., Falcon, J.,Cahill, G.M., Cassone, V.M., and Baler, R. (1997)Recent Prog. Horm. Res.52, 307–358
80. Fukuhara, C., Dirden, J. C., and Tosini, G. (2003) J. Pineal Res. 35,196–203
81. Amelio, A. L., Miraglia, L. J., Conkright, J. J., Mercer, B. A., Batalov, S.,Cavett, V., Orth, A. P., Busby, J., Hogenesch, J. B., and Conkright, M. D.(2007) Proc. Natl. Acad. Sci. U. S. A. 104, 20314–20319
82. Ceinos, R. M., Chansard, M., Revel, F., Calgari, C., Miguez, J. M., andSimonneaux, V. (2004) NeuroSignals 13, 308–317
83. Ribelayga, C., Pevet, P., and Simonneaux, V. (1997) Brain Res. 777,247–250
84. Bernard, M., and Klein, D. C. (1996) J. Neurochem. 67, 1032–103885. Li, A., Zhu, X., Brown, B., and Craft, C. M. (2003) Investig. Ophthalmol.
Vis. Sci. 44, 996–100786. Scheetz, T. E., Kim, K. Y., Swiderski, R. E., Philp, A. R., Braun, T. A.,
Knudtson, K. L., Dorrance, A. M., DiBona, G. F., Huang, J., Casavant,T. L., Sheffield, V. C., and Stone, E. M. (2006) Proc. Natl. Acad. Sci.U. S. A. 103, 14429–14434
87. Falcon, J., Marmillon, J. B., Claustrat, B., and Collin, J. P. (1989) J. Neuro-sci. 9, 1943–1950
88. Bernard,M., Iuvone, P.M., Cassone, V.M., Roseboom, P. H., Coon, S. L.,
Interrogating the Pineal Transcriptome
MARCH 20, 2009 • VOLUME 284 • NUMBER 12 JOURNAL OF BIOLOGICAL CHEMISTRY 7621
by guest on July 6, 2018http://w
ww
.jbc.org/D
ownloaded from

and Klein, D. C. (1997) J. Neurochem. 68, 213–22489. Mansouri, A., Hallonet, M., and Gruss, P. (1996) Curr. Opin. Cell Biol. 8,
851–85790. Araki, M. (1992) Dev. Biol. 149, 440–44791. Araki, M., and Tokunaga, F. (1990) Cell Differ. Dev. 31, 129–13592. Tosini, G., Doyle, S., Geusz,M., andMenaker,M. (2000)Proc.Natl. Acad.
Sci. U. S. A. 97, 11540–1154493. Nir, I., and Hirschmann, N. (1978) J. Neural Transm. 42, 117–12694. Tanaka, K., Murakami, M., and Greer, M. A. (1987) Endocrinology 121,
74–7795. Murakami, M., Greer, S. E., McAdams, S., and Greer, M. A. (1989) Life
Sci. 44, 425–42996. Harpavat, S., and Cepko, C. L. (2003) Thyroid 13, 1013–101997. Roberts, M. R., Srinivas, M., Forrest, D., Morreale de Escobar, G., and
Reh, T. A. (2006) Proc. Natl. Acad. Sci. U. S. A. 103, 6218–622398. Forrest, D., Reh, T. A., and Rusch, A. (2002) Curr. Opin. Neurobiol. 12,
49–5699. Ng, L., Hurley, J. B., Dierks, B., Srinivas,M., Salto, C., Vennstrom, B., Reh,
T. A., and Forrest, D. (2001) Nat. Genet. 27, 94–98100. Pace-Asciak, C. R., Reynaud, D., and Demin, P. (1993) Biochem. Biophys.
Res. Commun. 197, 869–873101. Pace-Asciak, C. R., Reynaud, D., and Demin, P. (1995) J. Lipid Mediat.
Cell Signal. 12, 307–311102. Reynaud, D., Delton, I., Gharib, A., Sarda, N., Lagarde, M., and Pace-
Asciak, C. R. (1994) J. Neurochem. 62, 126–133103. Reynaud, D., Demin, P., and Pace-Asciak, C. R. (1994) J. Biol. Chem. 269,
23976–23980104. Reynaud, D., Demin, P. M., and Pace-Asciak, C. R. (1995) Adv. Prostag-
landin Thromboxane Leukotriene Res. 23, 183–185105. Reynaud, D., and Pace-Asciak, C. R. (1997) Biochim. Biophys. Acta 1346,
305–316106. Hada, T., Hagiya, H., Suzuki, H., Arakawa, T., Nakamura, M., Matsuda,
S., Yoshimoto, T., Yamamoto, S., Azekawa, T., Morita, Y., Ishimura, K.,and Kim, H.-Y. (1994) Biochim. Biophys. Acta 1211, 221–228
107. Laitinen, J. T., Laitinen, K. S., andKokkola, T. (1995)Cell.Mol. Neurobiol.15, 177–192
108. Yeh, J. J., Yasuda, R. P., Davila-Garcia, M. I., Xiao, Y., Ebert, S., Gupta, T.,Kellar, K. J., and Wolfe, B. B. (2001) J. Neurochem. 77, 336–346
109. Schomerus, C., and Korf, H. W. (1999) Reprod. Nutr. Dev. 39, 305–314110. Yamada, H., Ogura, A., Koizumi, S., Yamaguchi, A., and Moriyama, Y.
(1998) J. Neurosci. 18, 4946–4952111. Klein, D. C., Wheler, G. H., and Weller, J. L. (1983) Prog. Clin. Biol. Res.
125, 169–181112. Altshuler, D., Lo Turco, J. J., Rush, J., and Cepko, C. (1993) Development
(Camb.) 119, 1317–1328113. Auerbach, G., Herrmann, A., Bracher, A., Bader, G., Gutlich,M., Fischer,
M., Neukamm, M., Garrido-Franco, M., Richardson, J., Nar, H., Huber,R., and Bacher, A. (2000) Proc. Natl. Acad. Sci. U. S. A. 97, 13567–13572
114. Ren, J., Kotaka, M., Lockyer, M., Lamb, H. K., Hawkins, A. R., and Stam-mers, D. K. (2005) J. Biol. Chem. 280, 36912–36919
115. Kohrle, J. (2005) Thyroid 15, 841–853116. Namihira, M., Honma, S., Abe, H., Tanahashi, Y., Ikeda,M., and Honma,
K. (1999) Neurosci. Lett. 267, 69–72117. Fukada, Y., and Okano, T. (2002)Mol. Neurobiol. 25, 19–30118. Karolczak, M., Burbach, G. J., Sties, G., Korf, H. W., and Stehle, J. H.
(2004) Eur. J. Neurosci. 19, 3382–3388119. Simonneaux, V., Poirel, V. J., Garidou, M. L., Nguyen, D., Diaz-
Rodriguez, E., and Pevet, P. (2004) Brain Res. Mol. Brain Res. 120,164–172
120. Humphries, A., Wells, T., Baler, R., Klein, D. C., and Carter, D. A. (2007)Mol. Cell. Endocrinol. 270, 43–49
121. Chen, W., and Baler, R. (2000) Brain Res. Mol. Brain Res. 81, 43–50122. Davies, J. S., and Carter, D. A. (2006)Mol. Cell. Endocrinol. 252, 19–26123. Appelbaum, L., Vallone, D., Anzulovich, A., Ziv, L., Tom, M., Foulkes,
N. S., and Gothilf, Y. (2006) J. Mol. Endocrinol. 36, 337–347124. Bajic, V. B., Choudhary, V., and Hock, C. K. (2004) In Silico Biol. 4,
109–125125. Smith, S. B., Ee, H. C., Conners, J. R., and German,M. S. (1999)Mol. Cell.
Biol. 19, 8272–8280126. McLean, D. J., Friel, P. J., Pouchnik, D., and Griswold, M. D. (2002)Mol.
Endocrinol. 16, 2780–2792
Interrogating the Pineal Transcriptome
7622 JOURNAL OF BIOLOGICAL CHEMISTRY VOLUME 284 • NUMBER 12 • MARCH 20, 2009
by guest on July 6, 2018http://w
ww
.jbc.org/D
ownloaded from

Rangel, Peter J. Munson and David C. KleinJoan L. Weller, Martin F. Rath, Morten Møller, Ruben Baler, David Sugden, Zoila G.Qiong Shi, Pascaline Gaildrat, Fabrice Morin, Surajit Ganguly, John B. Hogenesch, Michael J. Bailey, Steven L. Coon, David A. Carter, Ann Humphries, Jong-so Kim,
ADRENERGIC/cAMP SIGNALINGNight/Day Changes in Pineal Expression of >600 Genes: CENTRAL ROLE OF
doi: 10.1074/jbc.M808394200 originally published online December 22, 20082009, 284:7606-7622.J. Biol. Chem.
10.1074/jbc.M808394200Access the most updated version of this article at doi:
Alerts:
When a correction for this article is posted•
When this article is cited•
to choose from all of JBC's e-mail alertsClick here
Supplemental material:
http://www.jbc.org/content/suppl/2008/12/23/M808394200.DC1
http://www.jbc.org/content/284/12/7606.full.html#ref-list-1
This article cites 124 references, 35 of which can be accessed free at
by guest on July 6, 2018http://w
ww
.jbc.org/D
ownloaded from