Embed Size (px)
DESCRIPTION
Â
Citation preview
thehagueuniversity.com
Edition September 2013 The Hague University of Applied Sciences Communication & Marketing Department Johanna Westerdijkplein 75 2521 EN The Hague [email protected]
Satisfaction with the Hague University of Applied Sciences
National Student Survey • Startmonitor • HBO-monitor • International Student Barometer
nieuw Haags Peil 2013
Nieuw Haags Peil 2013Satisfaction with The Hague University
of Applied SciencesNational Student Survey • Startmonitor
HBO-Monitor • International Student Barometer
CommuNiCatioN & marketiNg
DePartmeNt
Mounia Bahi
Kim van der Kruis
Nando Rensen
Wâtte Zijlstra
The Hague, September 2013


3
4
NIEUW HAAGS PEIL 2013
INHOUdSOpgAve1. iNtroDuCtioN 5
2. HigHligHts 9
3. sourCe JustiFiCatioN 15 3.1 Startmonitor 16 3.2 National Student Survey 17 3.3 Higher professional education Monitor 19 3.4 Comparison of international and domestic students 21 3.5 Reader’s guide 22
4. target Values For PerFormaNCe agreemeNts 27 4.1 Current situation 27 4.2 Influencing factors 28
5. satisFaCtioN witH eDuCatioN tHemes 35 5.1 Satisfiers and dissatisfiers 35 5.2 Content and structure of the programme 39 5.3 Lecturers and study supervision 42 5.4 grading and assessment 45 5.5 Career preparation and work placement 47 5.6 Support services 50
6. ComParisoN oF iNterNatioNal aND DomestiC stuDeNts 57 6.1. Main education themes 57 6.2. Content and structure of the programme 59 6.3 general skills and practice-based research 61 6.4 Career preparation 62 6.5 Lecturers 63 6.6 Information from the programme and study facilities 64 6.7 Specific supervision for international students 66
51. INTROdUCTIONThis is a new report with a new name: Nieuw Haags Peil 2013. The annual report de Reflector, which we published every year for eleven years, has ceased to exist with the introduction of this new report. As of now, the Nieuw Haags Peil will be published each year and in it we will present the results of research conducted on an institutional level and where possible connect them.
In recent years, the scope of the annual de Reflector report became increasingly broad: in addition to the results of de Reflector, attention was also paid to the results of the Startmonitor, the National Student Survey (NSe) and the HBO [Higher Professional Education] Monitor and specific analyses from the Onderzoekshuis Studiesucces [datawa-rehouse] were included. Nieuw Haags Peil has the same broad scope: we present the results of the NSe, the Start-monitor, the HBO-Monitor and the International Student Barometer. In contrast to previous years, we focused more on presenting the surveys in comparison to one another and for this reason each section has a more theme-based line of approach.
In section four, we focus on the performance agreements which were made in collaboration with the dutch Ministry of education, Culture and Science and are monitored by the NSe. To what extent are the performance agreements fulfilled and how can the target values be influenced? Section five looks at the relationship between the fourteen main themes from the NSe and satisfaction in general. This provides more information on the critical success factors for satisfaction and can be useful for developing improvement measures. The main themes are then analysed based on the NSe, the Startmonitor and the HBO-Monitor. Finally in section six, the opinions of the international students are compared to those of domestic students. This section provides input for the internationalisation policy.
Section three contains the description of the four surveys and the source justification, while the most significant results are presented in section two. This report features a selection of the large amount of data available. On Mede-werkersnet you will find all the research results from the four surveys, where possible also organised by programme. See under Organisatie & beleid > Beleidsonderzoek & Marktgegevens.
Communication & Marketing department
7
Hig
Hli
gH
ts

9
highlights
tabl
e 2.
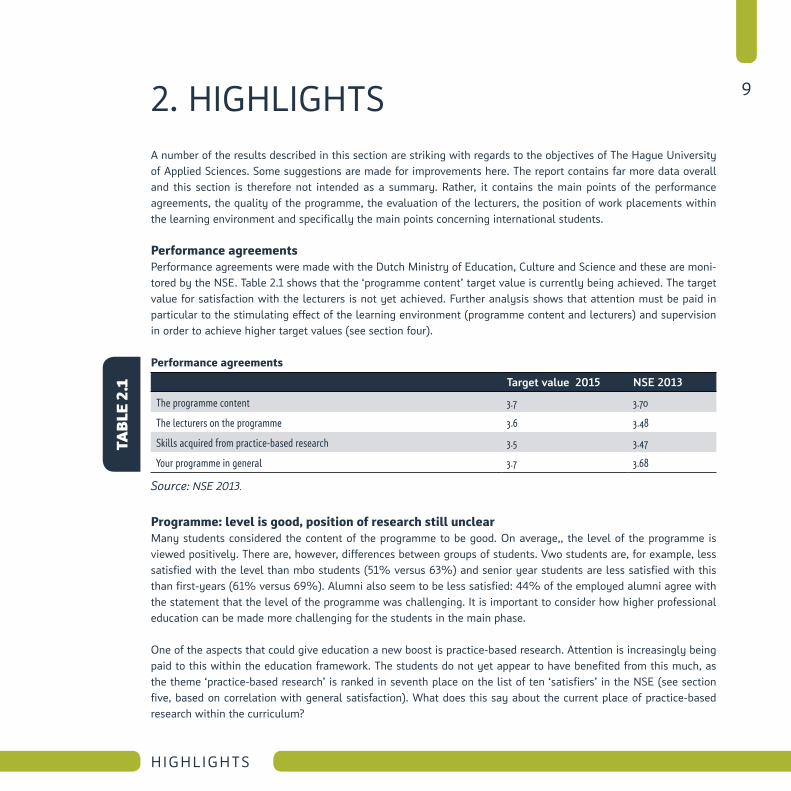
12. HIgHLIgHTS A number of the results described in this section are striking with regards to the objectives of The Hague University of Applied Sciences. Some suggestions are made for improvements here. The report contains far more data overall and this section is therefore not intended as a summary. Rather, it contains the main points of the performance agreements, the quality of the programme, the evaluation of the lecturers, the position of work placements within the learning environment and specifically the main points concerning international students.
Performance agreementsperformance agreements were made with the dutch Ministry of education, Culture and Science and these are moni-tored by the NSe. Table 2.1 shows that the ‘programme content’ target value is currently being achieved. The target value for satisfaction with the lecturers is not yet achieved. Further analysis shows that attention must be paid in particular to the stimulating effect of the learning environment (programme content and lecturers) and supervision in order to achieve higher target values (see section four).
Performance agreements
Target value 2015 NSE 2013
The programme content 3.7 3.70
The lecturers on the programme 3.6 3.48
Skills acquired from practice-based research 3.5 3.47
Your programme in general 3.7 3.68
Source: NSE 2013.
Programme: level is good, position of research still unclearMany students considered the content of the programme to be good. On average,, the level of the programme is viewed positively. There are, however, differences between groups of students. vwo students are, for example, less satisfied with the level than mbo students (51% versus 63%) and senior year students are less satisfied with this than first-years (61% versus 69%). Alumni also seem to be less satisfied: 44% of the employed alumni agree with the statement that the level of the programme was challenging. It is important to consider how higher professional education can be made more challenging for the students in the main phase. One of the aspects that could give education a new boost is practice-based research. Attention is increasingly being paid to this within the education framework. The students do not yet appear to have benefited from this much, as the theme ‘practice-based research’ is ranked in seventh place on the list of ten ‘satisfiers’ in the NSe (see section five, based on correlation with general satisfaction). What does this say about the current place of practice-based research within the curriculum?
10
NIEUW HAAGS PEIL 2013
Another way to make the programme more challenging is to take the student more seriously. A variety of comments are made on this in the open answers. Moreover, The Hague University of Applied Sciences achieved a low score for handling student complaints and the use of results of education evaluations.
lecturers: better supervision and teaching skillsThe recommendation discussed by the executive Board on the future of study success at The Hague University of Applied Sciences (28 May 2013) states that the quality and mentality of the lecturer team are of vital importance for study success. Students are in general ‘satisfied/very satisfied’ with the lecturers, they value the contact and their knowledge of the field. Lecturers have also been subject to criticism, however. The quality of the supervision, the degree to which lecturers are inspiring and the teaching quality are given a moderate score. It is noticeable in the open answers that many comments are made about lecturers who do not keep to agreements, who do not treat students equally and comments have also been made concerning lack of trust. According to the recommendation, it is precisely these arbitrary aspects that require a great deal of attention.
work placements: preparation for work placements needs to improveAnother way to make the programme more challenging in the main phase is to position the work placements more ef-fectively within the curriculum. First of all, it is noticeable that satisfaction with the preparation for work placements is low in general and is regarded as a weak point. It is also noticeable that the correlation of the work placement experiences with general satisfaction is fairly low. This may indicate that students do not really associate work place-ment experiences with the content their programme offers. The active use of work placement experiences within the curriculum and the linking of these experiences with theory may result in students linking all of these aspects together more effectively and thereby enjoying more in-depth learning.
international students: more satisfied, different expectations about researchAs internationalisation is one of the main objectives of The Hague University of Applied Sciences, a separate section has been devoted to international students. This group of students is compared with domestic students who study on one of the nine english-language bachelor’s degree programmes, but also with domestic students who study on the dutch-language bachelor’s degree programmes. First of all, it is noticeable that the international students are more satisfied than domestic students. They also seem to assign greater importance to many more aspects of their programme. There is a partial explanation for this. For example, they assign much more importance to the quality of the campus and the study facilities. International students are probably more reliant on these factors than domestic students.
In addition, it is noticeable that domestic students who are on the english-language bachelor’s degree programmes are more satisfied than domestic students who are on the dutch-language bachelor’s degree programmes. They find the programme more stimulating (59% versus 48%), they are more satisfied with the cohesion (65% versus 56%) and with the relevance of the content in light of current developments (67% versus 56%). How can these differences be explained? Is the learning climate of the international programmes really different, do these programmes attract a different type of domestic student?
11
highlights
Results show that international students have different expectations about research. The finding that international students are more satisfied does not comply to this topic. The domestic students on the english-language bachelor’s degree programmes are more satisfied with practice-based research than international students (although not signi-ficantly). The question is whether the international students had different expectations of the type of research carried out at The Hague University of Applied Sciences when they started their study.


13
sou
rC
e Ju
stiF
iCa
tio
N

15
Source juStification
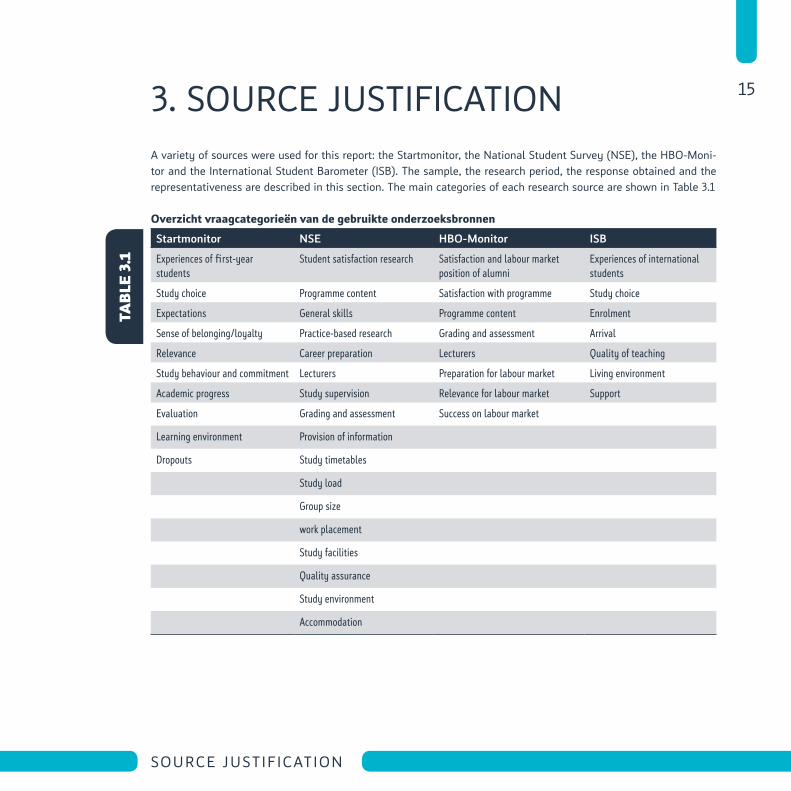
3. SOURCe jUSTIFICATIONA variety of sources were used for this report: the Startmonitor, the National Student Survey (NSe), the HBO-Moni-tor and the International Student Barometer (ISB). The sample, the research period, the response obtained and the representativeness are described in this section. The main categories of each research source are shown in Table 3.1
overzicht vraagcategorieën van de gebruikte onderzoeksbronnen
Startmonitor NSE HBO-Monitor ISB
Experiences of first-year students
Student satisfaction research Satisfaction and labour market position of alumni
Experiences of international students
Study choice Programme content Satisfaction with programme Study choice
Expectations General skills Programme content Enrolment
Sense of belonging/loyalty Practice-based research Grading and assessment Arrival
Relevance Career preparation Lecturers Quality of teaching
Study behaviour and commitment Lecturers Preparation for labour market Living environment
Academic progress Study supervision Relevance for labour market Support
Evaluation Grading and assessment Success on labour market
Learning environment Provision of information
Dropouts Study timetables
Study load
Group size
work placement
Study facilities
Quality assurance
Study environment
Accommodation
tabl
e 3.
1
16
NIEUW HAAGS PEIL 2013
representativenessFor all the surveys stated above (with the exception of the ISB), the sample is compared with the actual student population with regard to a number of background variables. Certain groups are overrepresented in each survey. Weighting factors are therefore used for the analyses. By using the weighting factors, the sample is representative for the whole student population. For the NSe, the weighting factors are: ‘institution’, ‘programme’ and ‘location’. The weighting factors used for the Startmonitor are: ‘academy’, ‘variant’ and ‘gender’ and those for the HBO-Monitor are: ‘gender’, ‘region’, ‘variant’ and ‘programme’.
3.1 Startmonitor
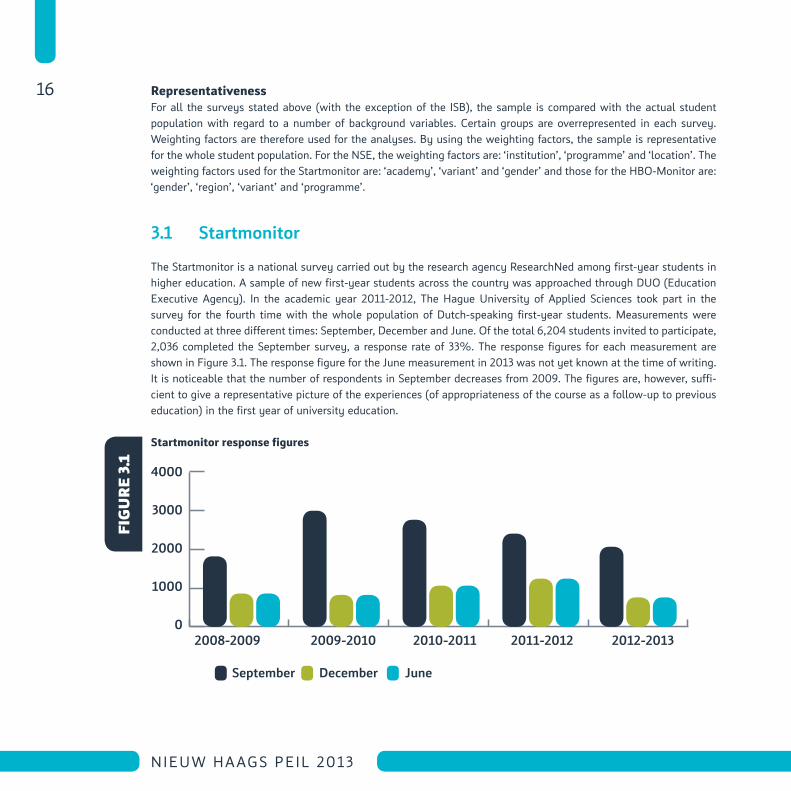
The Startmonitor is a national survey carried out by the research agency ResearchNed among first-year students in higher education. A sample of new first-year students across the country was approached through dUO (education executive Agency). In the academic year 2011-2012, The Hague University of Applied Sciences took part in the survey for the fourth time with the whole population of dutch-speaking first-year students. Measurements were conducted at three different times: September, december and june. Of the total 6,204 students invited to participate, 2,036 completed the September survey, a response rate of 33%. The response figures for each measurement are shown in Figure 3.1. The response figure for the june measurement in 2013 was not yet known at the time of writing. It is noticeable that the number of respondents in September decreases from 2009. The figures are, however, suffi-cient to give a representative picture of the experiences (of appropriateness of the course as a follow-up to previous education) in the first year of university education.
startmonitor response figures
September December June
2008-2009 2009-2010 2010-2011 2011-2012 2012-2013
4000
3000
2000
1000
0
fig
ure
3.1
17
Source juStification
The Startmonitor 2011-2012 is mainly used in this report. The Onderzoekshuis Studiesucces is also used. In this data-warehouse, the results of the Startmonitor are linked to the academic progress data of the respondents. This makes it possible to compare the students who continue on the same programme after the first year, ‘students continuing study’ (68% in 2011-2012) with the students who dropped out during or after the first year of the programme, ‘dro-pouts’ (32% in 2011-2012).
3.2 Nationale Studenten Enquête
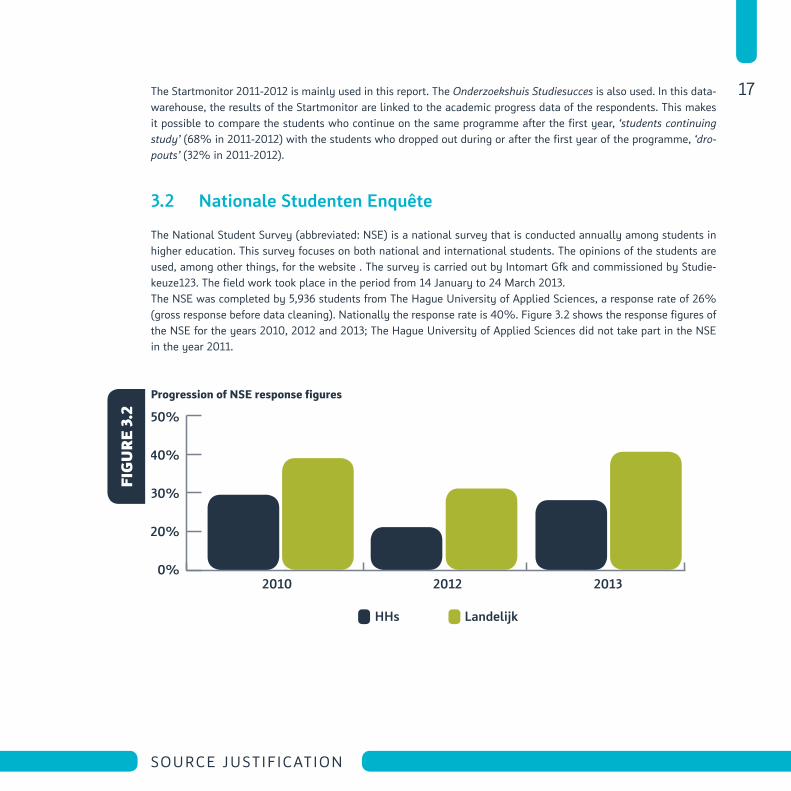
The National Student Survey (abbreviated: NSe) is a national survey that is conducted annually among students in higher education. This survey focuses on both national and international students. The opinions of the students are used, among other things, for the website . The survey is carried out by Intomart gfk and commissioned by Studie-keuze123. The field work took place in the period from 14 january to 24 March 2013. The NSe was completed by 5,936 students from The Hague University of Applied Sciences, a response rate of 26% (gross response before data cleaning). Nationally the response rate is 40%. Figure 3.2 shows the response figures of the NSe for the years 2010, 2012 and 2013; The Hague University of Applied Sciences did not take part in the NSe in the year 2011.
Progression of Nse response figures
HHs Landelijk
2010 2012 2013
50%
40%
30%
20%
0%
fig
ure
3.2
18
NIEUW HAAGS PEIL 2013
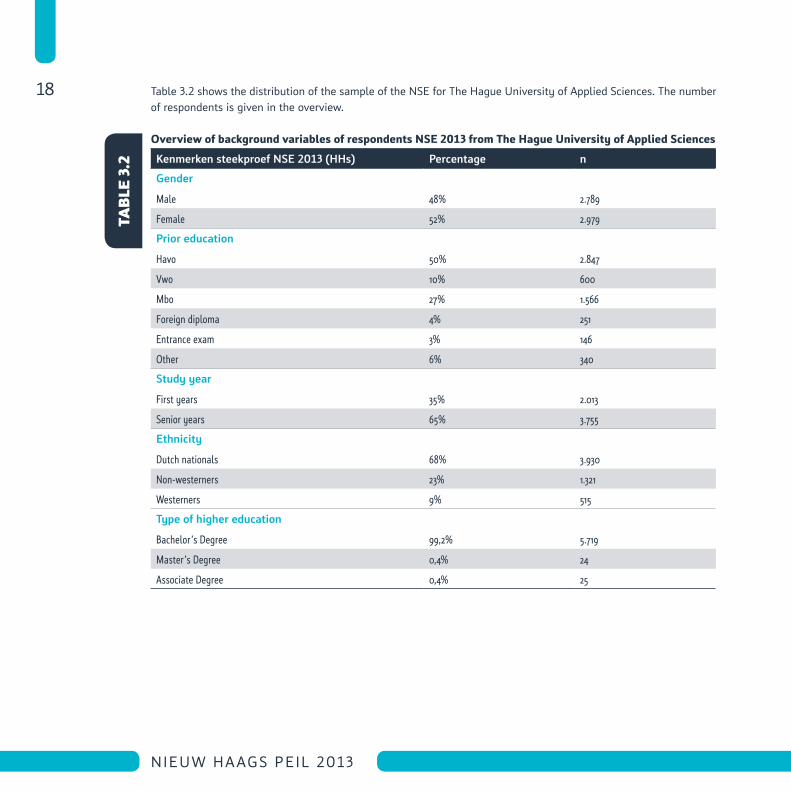
Table 3.2 shows the distribution of the sample of the NSe for The Hague University of Applied Sciences. The number of respondents is given in the overview.
overview of background variables of respondents Nse 2013 from the Hague university of applied sciences
Kenmerken steekproef NSE 2013 (HHs) Percentage n
Gender
Male 48% 2.789
Female 52% 2.979
Prior education
Havo 50% 2.847
Vwo 10% 600
Mbo 27% 1.566
Foreign diploma 4% 251
Entrance exam 3% 146
Other 6% 340
Study year
First years 35% 2.013
Senior years 65% 3.755
Ethnicity
Dutch nationals 68% 3.930
Non-westerners 23% 1.321
Westerners 9% 515
Type of higher education
Bachelor’s Degree 99,2% 5.719
Master’s Degree 0,4% 24
Associate Degree 0,4% 25
tabl
e 3.
2
19
Source juStification
3.3 HBO-Monitor
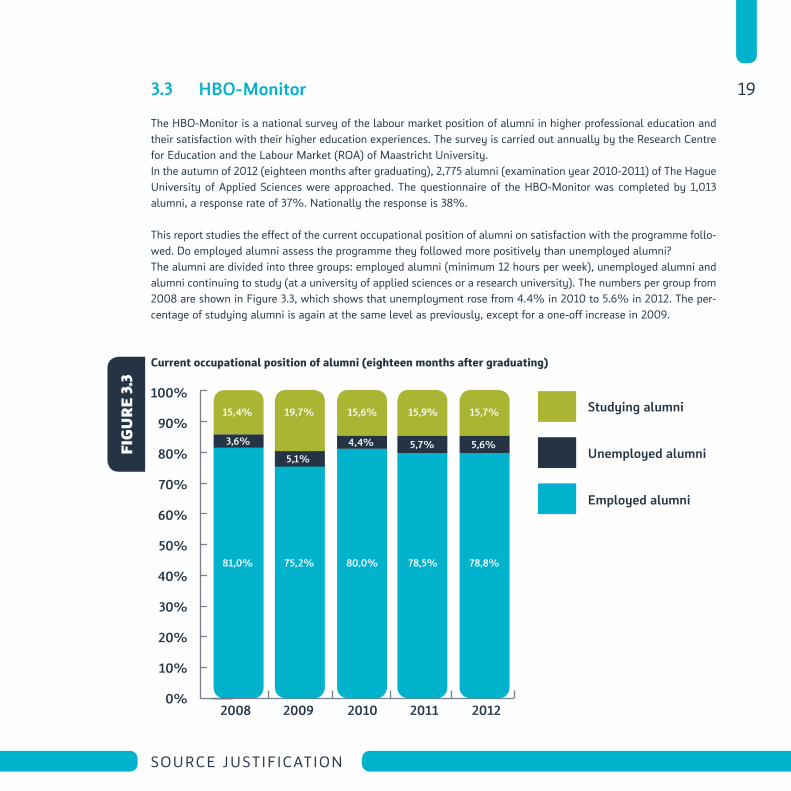
The HBO-Monitor is a national survey of the labour market position of alumni in higher professional education and their satisfaction with their higher education experiences. The survey is carried out annually by the Research Centre for education and the Labour Market (ROA) of Maastricht University. In the autumn of 2012 (eighteen months after graduating), 2,775 alumni (examination year 2010-2011) of The Hague University of Applied Sciences were approached. The questionnaire of the HBO-Monitor was completed by 1,013 alumni, a response rate of 37%. Nationally the response is 38%.
This report studies the effect of the current occupational position of alumni on satisfaction with the programme follo-wed. do employed alumni assess the programme they followed more positively than unemployed alumni? The alumni are divided into three groups: employed alumni (minimum 12 hours per week), unemployed alumni and alumni continuing to study (at a university of applied sciences or a research university). The numbers per group from 2008 are shown in Figure 3.3, which shows that unemployment rose from 4.4% in 2010 to 5.6% in 2012. The per-centage of studying alumni is again at the same level as previously, except for a one-off increase in 2009.
Current occupational position of alumni (eighteen months after graduating)
100%
90%
80%
70%
60%
50%
40%
30%
20%
10%
0%
Studying alumni
Unemployed alumni
Employed alumni
15,4%
3,6%
81,0% 75,2%
19,7%
5,1%
80,0%
15,6%
4,4%
78,5%
15,9%
5,7%
78,8%
15,7%
5,6%fig
ure
3.3
2008 2009 2010 2011 2012
20
NIEUW HAAGS PEIL 2013
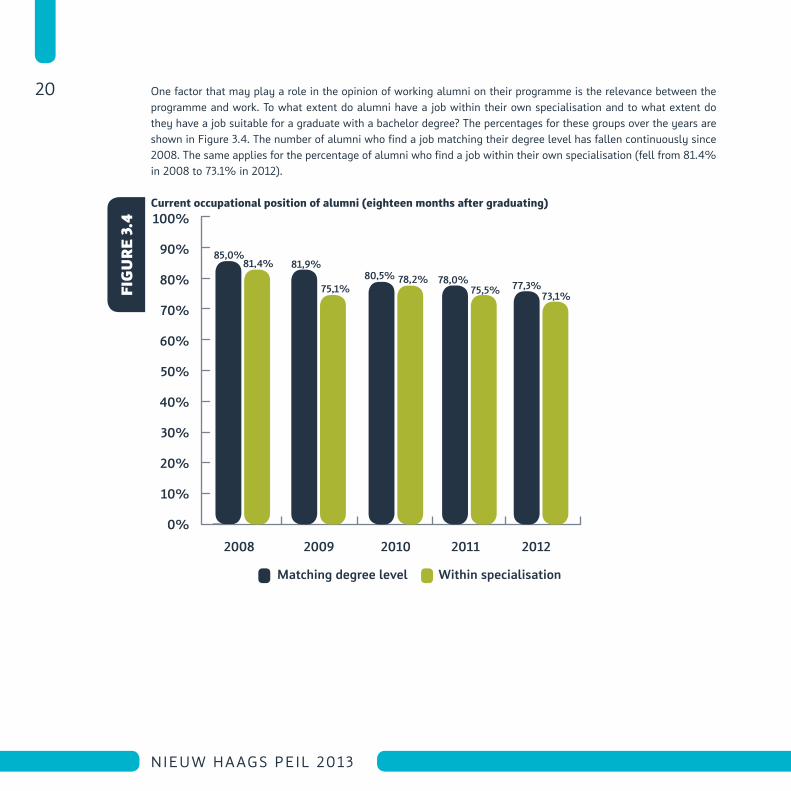
One factor that may play a role in the opinion of working alumni on their programme is the relevance between the programme and work. To what extent do alumni have a job within their own specialisation and to what extent do they have a job suitable for a graduate with a bachelor degree? The percentages for these groups over the years are shown in Figure 3.4. The number of alumni who find a job matching their degree level has fallen continuously since 2008. The same applies for the percentage of alumni who find a job within their own specialisation (fell from 81.4% in 2008 to 73.1% in 2012).
Current occupational position of alumni (eighteen months after graduating)100%
90%
80%
70%
60%
50%
40%
30%
20%
10%
0%
2008 2009 2010 2011 2012
85,0%81,4% 81,9%
75,1%80,5% 78,2% 78,0%
75,5% 77,3%73,1%
Matching degree level Within specialisation
fig
ure
3.4
21
Source juStification
3.4 Comparison of international and national students
Section six focuses on the satisfaction of international students. A distinction is made between international students and domestic students. The definition used for an international student in section six is a student with prior education in a different country. Two surveys are used for this section: the NSe and the ISB.
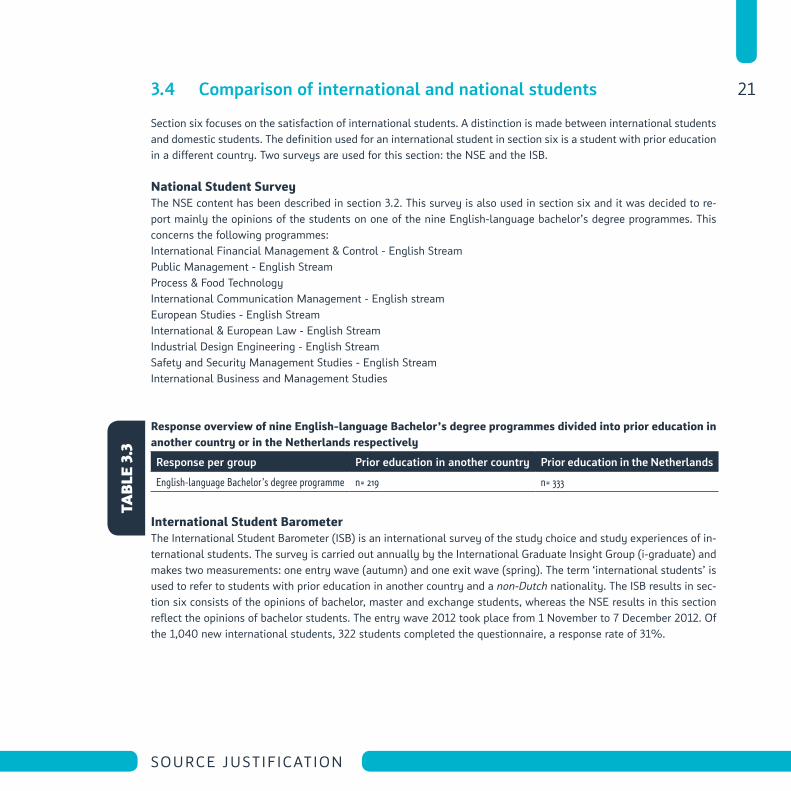
National student surveyThe NSe content has been described in section 3.2. This survey is also used in section six and it was decided to re-port mainly the opinions of the students on one of the nine english-language bachelor’s degree programmes. This concerns the following programmes:International Financial Management & Control - english Streampublic Management - english Streamprocess & Food TechnologyInternational Communication Management - english streameuropean Studies - english StreamInternational & european Law - english StreamIndustrial design engineering - english StreamSafety and Security Management Studies - english StreamInternational Business and Management Studies
response overview of nine english-language Bachelor’s degree programmes divided into prior education in another country or in the Netherlands respectively
Response per group Prior education in another country Prior education in the Netherlands
English-language Bachelor’s degree programme n= 219 n= 333
international student Barometer The International Student Barometer (ISB) is an international survey of the study choice and study experiences of in-ternational students. The survey is carried out annually by the International graduate Insight group (i-graduate) and makes two measurements: one entry wave (autumn) and one exit wave (spring). The term ‘international students’ is used to refer to students with prior education in another country and a non-Dutch nationality. The ISB results in sec-tion six consists of the opinions of bachelor, master and exchange students, whereas the NSe results in this section reflect the opinions of bachelor students. The entry wave 2012 took place from 1 November to 7 december 2012. Of the 1,040 new international students, 322 students completed the questionnaire, a response rate of 31%.
tabl
e 3.
3
22
NIEUW HAAGS PEIL 2013
3.5 Reader’s guide
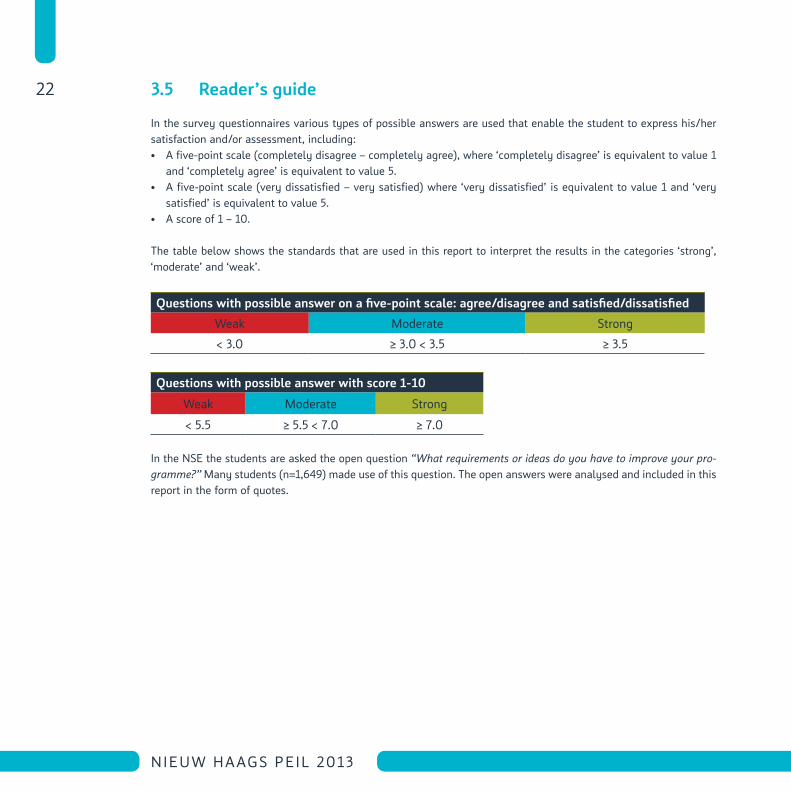
In the survey questionnaires various types of possible answers are used that enable the student to express his/her satisfaction and/or assessment, including:• A five-point scale (completely disagree – completely agree), where ‘completely disagree’ is equivalent to value 1
and ‘completely agree’ is equivalent to value 5.• A five-point scale (very dissatisfied – very satisfied) where ‘very dissatisfied’ is equivalent to value 1 and ‘very
satisfied’ is equivalent to value 5.• A score of 1 – 10.
The table below shows the standards that are used in this report to interpret the results in the categories ‘strong’, ‘moderate’ and ‘weak’.
Questions with possible answer on a five-point scale: agree/disagree and satisfied/dissatisfied
Weak Moderate Strong
< 3.0 ≥ 3.0 < 3.5 ≥ 3.5
Questions with possible answer with score 1-10
Weak Moderate Strong
< 5.5 ≥ 5.5 < 7.0 ≥ 7.0
In the NSe the students are asked the open question “What requirements or ideas do you have to improve your pro-gramme?” Many students (n=1,649) made use of this question. The open answers were analysed and included in this report in the form of quotes.
23
Source juStification

25
tar
ge
t V
alu
es
For
Pe
rFo
rm
aN
Ce
ag
re
em
eN
ts

27
TargeT values for performance agreemenTs
4. TARgeT vALUeS FOR peRFORMANCe AgReeMeNTS
In december 2011, the Association of Universities (previously the HBO council) and the dutch State Secretary for education, Culture and Science entered into the outline agreement on the improvement of quality and success rate of education and greater differentiation and profiling of the universities. For The Hague University of Applied Sciences, this has resulted in agreements with the Ministry that are laid down in the memorandum: profiling and performance agreements of The Hague University of Applied Sciences (2012). The performance agreements on satisfaction with education quality are monitored using the National Student Survey. This is covered in this section.
4.1 Current situation
Fourteen themes are covered in the NSe. First of all, the students are asked to give a general opinion on each theme and then various statements are presented for each theme. They are asked to indicate how satisfied they are with the programme in general and also how satisfied they are with the lecturers, the content of the programme, the information from the programme, etc.
The Hague University of Applied Sciences has made three performance agreements with the Ministry that are monitored using the NSe. These form target values for the general opinion on ‘programme content’, ‘lecturers on the programme’ and ‘skills acquired from practice-based research’. The target values for these themes are 3.7, 3.6 and 3.5 respectively and must be achieved in the NSe of 2015. A fourth result that is not included as a performance agreement, but that is mentioned as an indicator in the outline agreement, is satisfaction with ‘the programme in general’.
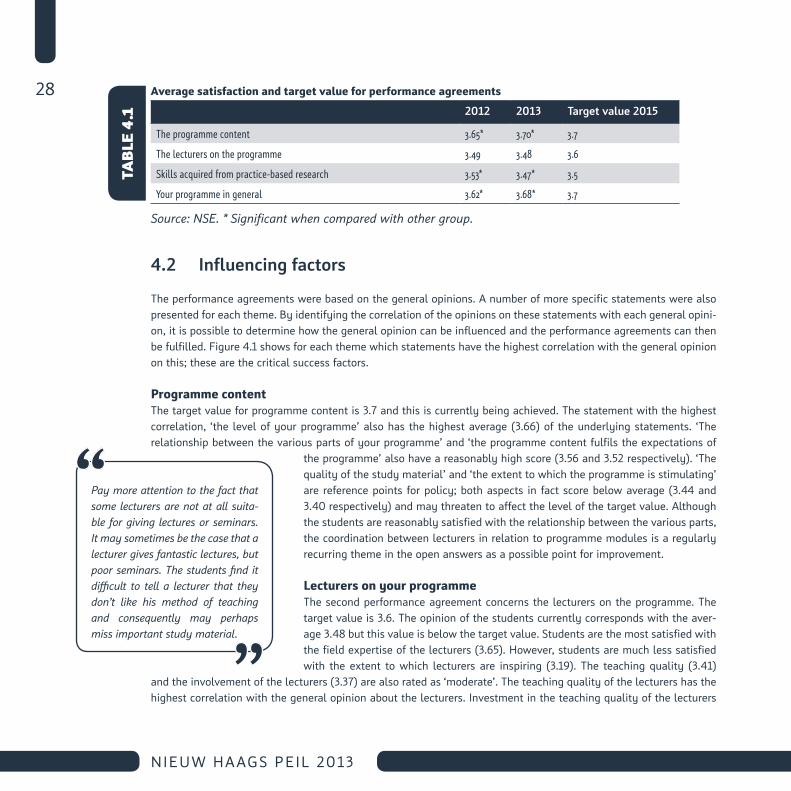
Table 4.1 shows that The Hague University of Applied Sciences meets the target value for ‘programme content’. The target value for skills acquired from practice-based research has only just been missed, while the target value for the lecturers falls short. The scores at present are 3.70, 3.47 and 3.48 respectively. The average for satisfaction with ‘your programme in general’ is 3.68. Satisfaction with the programme content and the programme in general has increased as compared to 2012. Student satisfaction with the lecturers was the same as last year, while the average satisfaction with the skills acquired from practice-based research has decreased.
28
NIEUW HAAGS PEIL 2013
average satisfaction and target value for performance agreements
2012 2013 Target value 2015
The programme content 3.65* 3.70* 3.7
The lecturers on the programme 3.49 3.48 3.6
Skills acquired from practice-based research 3.53* 3.47* 3.5
Your programme in general 3.62* 3.68* 3.7
Source: NSE. * Significant when compared with other group.
4.2 Influencing factors
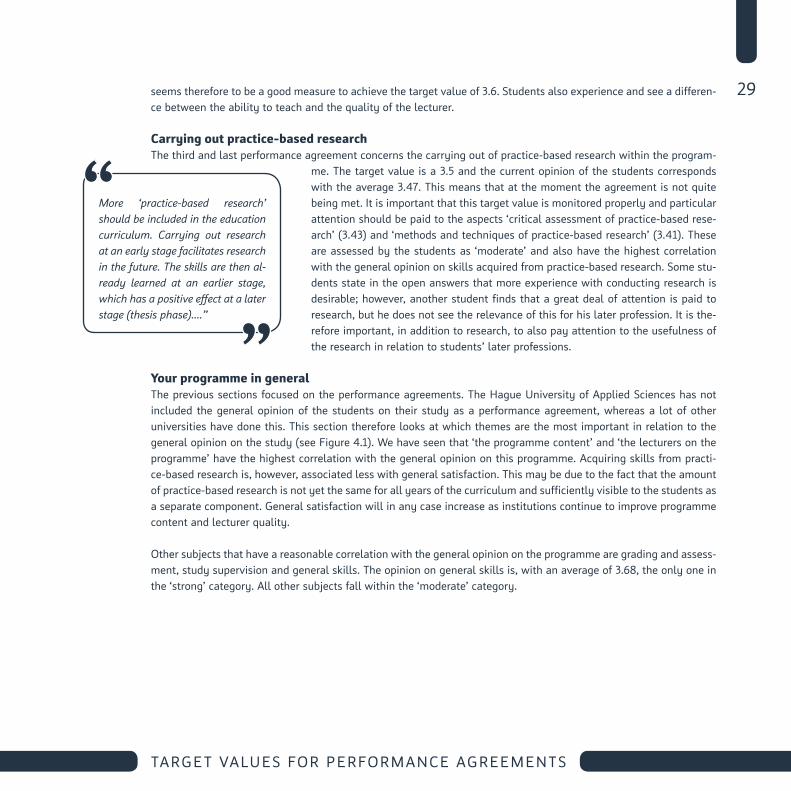
The performance agreements were based on the general opinions. A number of more specific statements were also presented for each theme. By identifying the correlation of the opinions on these statements with each general opini-on, it is possible to determine how the general opinion can be influenced and the performance agreements can then be fulfilled. Figure 4.1 shows for each theme which statements have the highest correlation with the general opinion on this; these are the critical success factors.
Programme contentThe target value for programme content is 3.7 and this is currently being achieved. The statement with the highest correlation, ‘the level of your programme’ also has the highest average (3.66) of the underlying statements. ‘The relationship between the various parts of your programme’ and ‘the programme content fulfils the expectations of
the programme’ also have a reasonably high score (3.56 and 3.52 respectively). ‘The quality of the study material’ and ‘the extent to which the programme is stimulating’ are reference points for policy; both aspects in fact score below average (3.44 and 3.40 respectively) and may threaten to affect the level of the target value. Although the students are reasonably satisfied with the relationship between the various parts, the coordination between lecturers in relation to programme modules is a regularly recurring theme in the open answers as a possible point for improvement.
lecturers on your programmeThe second performance agreement concerns the lecturers on the programme. The target value is 3.6. The opinion of the students currently corresponds with the aver-age 3.48 but this value is below the target value. Students are the most satisfied with the field expertise of the lecturers (3.65). However, students are much less satisfied with the extent to which lecturers are inspiring (3.19). The teaching quality (3.41)
and the involvement of the lecturers (3.37) are also rated as ‘moderate’. The teaching quality of the lecturers has the highest correlation with the general opinion about the lecturers. Investment in the teaching quality of the lecturers
tabl
e 4.
1
Pay more attention to the fact that some lecturers are not at all suita-ble for giving lectures or seminars. It may sometimes be the case that a lecturer gives fantastic lectures, but poor seminars. The students find it difficult to tell a lecturer that they don’t like his method of teaching and consequently may perhaps miss important study material.
29
TargeT values for performance agreemenTs
seems therefore to be a good measure to achieve the target value of 3.6. Students also experience and see a differen-ce between the ability to teach and the quality of the lecturer.
Carrying out practice-based researchThe third and last performance agreement concerns the carrying out of practice-based research within the program-
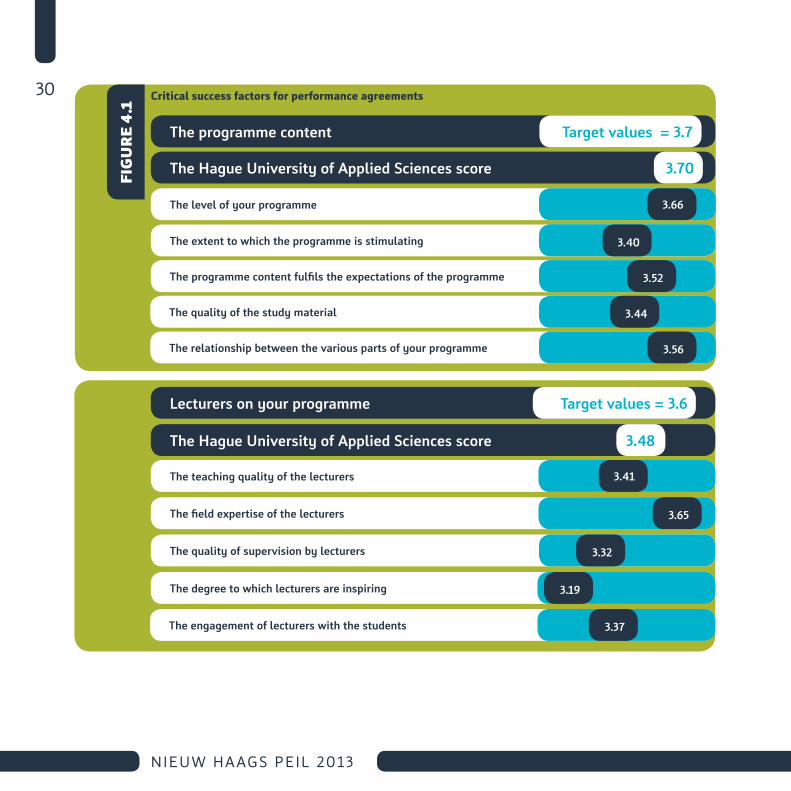
me. The target value is a 3.5 and the current opinion of the students corresponds with the average 3.47. This means that at the moment the agreement is not quite being met. It is important that this target value is monitored properly and particular attention should be paid to the aspects ‘critical assessment of practice-based rese-arch’ (3.43) and ‘methods and techniques of practice-based research’ (3.41). These are assessed by the students as ‘moderate’ and also have the highest correlation with the general opinion on skills acquired from practice-based research. Some stu-dents state in the open answers that more experience with conducting research is desirable; however, another student finds that a great deal of attention is paid to research, but he does not see the relevance of this for his later profession. It is the-refore important, in addition to research, to also pay attention to the usefulness of the research in relation to students’ later professions.
Your programme in generalThe previous sections focused on the performance agreements. The Hague University of Applied Sciences has not included the general opinion of the students on their study as a performance agreement, whereas a lot of other universities have done this. This section therefore looks at which themes are the most important in relation to the general opinion on the study (see Figure 4.1). We have seen that ‘the programme content’ and ‘the lecturers on the programme’ have the highest correlation with the general opinion on this programme. Acquiring skills from practi-ce-based research is, however, associated less with general satisfaction. This may be due to the fact that the amount of practice-based research is not yet the same for all years of the curriculum and sufficiently visible to the students as a separate component. general satisfaction will in any case increase as institutions continue to improve programme content and lecturer quality.
Other subjects that have a reasonable correlation with the general opinion on the programme are grading and assess-ment, study supervision and general skills. The opinion on general skills is, with an average of 3.68, the only one in the ‘strong’ category. All other subjects fall within the ‘moderate’ category.
More ‘practice-based research’ should be included in the education curriculum. Carrying out research at an early stage facilitates research in the future. The skills are then al-ready learned at an earlier stage, which has a positive effect at a later stage (thesis phase)....”
30
NIEUW HAAGS PEIL 2013
The programme content
The Hague University of Applied Sciences score
The level of your programme
The extent to which the programme is stimulating
The programme content fulfils the expectations of the programme
The quality of the study material
The relationship between the various parts of your programme
Target values = 3.7
3.70
3.66
3.40
3.52
3.44
3.56
Lecturers on your programme
The Hague University of Applied Sciences score
The teaching quality of the lecturers
The field expertise of the lecturers
The quality of supervision by lecturers
The degree to which lecturers are inspiring
The engagement of lecturers with the students
Target values = 3.6
3.48
3.41
3.65
3.32
3.19
3.37
Critical success factors for performance agreements
fig
ure
4.1
31
TargeT values for performance agreemenTs
Most influential success factors for achieving the target values of the performance agreements.Average score on a five-point scale. Factors sorted by highest correlation with the concerning general opinion.
Carrying out practice-based research within the programme
Your programme in general
The Hague University of Applied Sciences score
The Hague University of Applied Sciences score
Content of the programme
Critical assessment of practice-based research
Lecturers
Methods and techniques of practice-based research
Grading and assessment
Written reporting on practice-based research
Study supervision
Analytical thinking skills
General skills
Career preparation
Target values = 3.5
Target values = 3.7
3.68
3.47
3.44
3.43
3.39
3.41
3.44
3.49
3.32
3.50
3.68
3.49

33
sati
sFa
Cti
oN
wit
H
eD
uC
ati
oN
tH
em
es

35
SatiSfaction with education themeS
5. SATISFACTION WITH edUCATION THeMeS
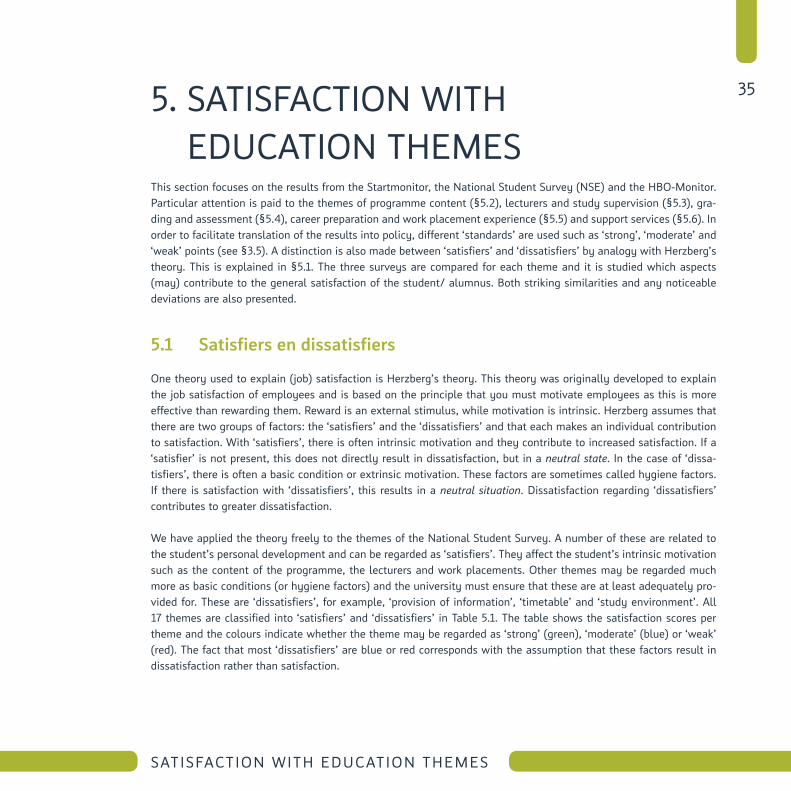
This section focuses on the results from the Startmonitor, the National Student Survey (NSe) and the HBO-Monitor. particular attention is paid to the themes of programme content (§5.2), lecturers and study supervision (§5.3), gra-ding and assessment (§5.4), career preparation and work placement experience (§5.5) and support services (§5.6). In order to facilitate translation of the results into policy, different ‘standards’ are used such as ‘strong’, ‘moderate’ and ‘weak’ points (see §3.5). A distinction is also made between ‘satisfiers’ and ‘dissatisfiers’ by analogy with Herzberg’s theory. This is explained in §5.1. The three surveys are compared for each theme and it is studied which aspects (may) contribute to the general satisfaction of the student/ alumnus. Both striking similarities and any noticeable deviations are also presented.
5.1 Satisfiers en dissatisfiers
One theory used to explain (job) satisfaction is Herzberg’s theory. This theory was originally developed to explain the job satisfaction of employees and is based on the principle that you must motivate employees as this is more effective than rewarding them. Reward is an external stimulus, while motivation is intrinsic. Herzberg assumes that there are two groups of factors: the ‘satisfiers’ and the ‘dissatisfiers’ and that each makes an individual contribution to satisfaction. With ‘satisfiers’, there is often intrinsic motivation and they contribute to increased satisfaction. If a ‘satisfier’ is not present, this does not directly result in dissatisfaction, but in a neutral state. In the case of ‘dissa-tisfiers’, there is often a basic condition or extrinsic motivation. These factors are sometimes called hygiene factors. If there is satisfaction with ‘dissatisfiers’, this results in a neutral situation. dissatisfaction regarding ‘dissatisfiers’ contributes to greater dissatisfaction.
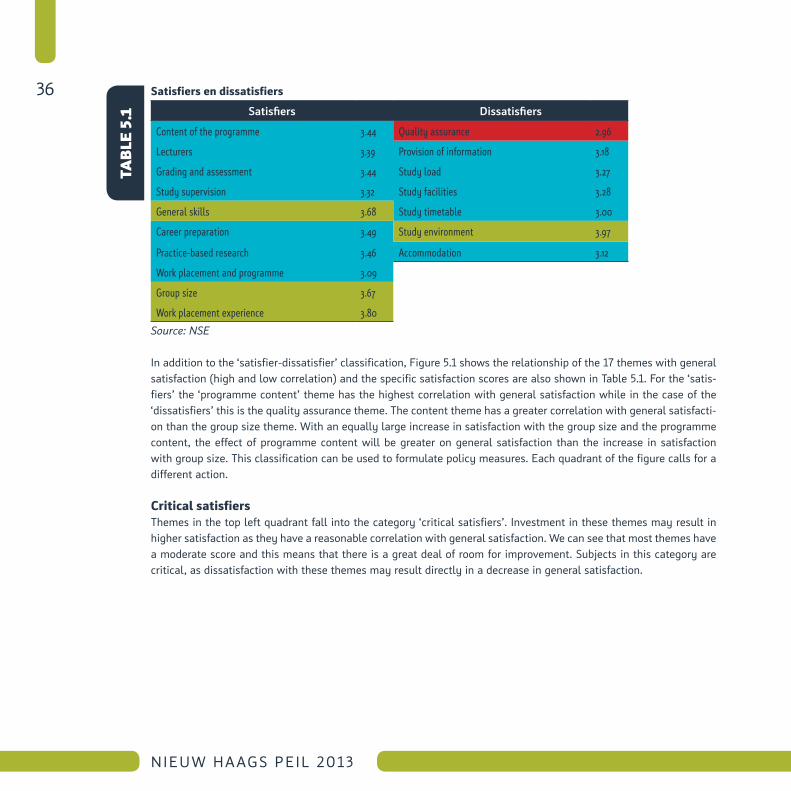
We have applied the theory freely to the themes of the National Student Survey. A number of these are related to the student’s personal development and can be regarded as ‘satisfiers’. They affect the student’s intrinsic motivation such as the content of the programme, the lecturers and work placements. Other themes may be regarded much more as basic conditions (or hygiene factors) and the university must ensure that these are at least adequately pro-vided for. These are ‘dissatisfiers’, for example, ‘provision of information’, ‘timetable’ and ‘study environment’. All 17 themes are classified into ‘satisfiers’ and ‘dissatisfiers’ in Table 5.1. The table shows the satisfaction scores per theme and the colours indicate whether the theme may be regarded as ‘strong’ (green), ‘moderate’ (blue) or ‘weak’ (red). The fact that most ‘dissatisfiers’ are blue or red corresponds with the assumption that these factors result in dissatisfaction rather than satisfaction.
36
NIEUW HAAGS PEIL 2013
satisfiers en dissatisfiers
Satisfiers Dissatisfiers
Content of the programme 3.44 Quality assurance 2.96
Lecturers 3.39 Provision of information 3.18
Grading and assessment 3.44 Study load 3.27
Study supervision 3.32 Study facilities 3.28
General skills 3.68 Study timetable 3.00
Career preparation 3.49 Study environment 3.97
Practice-based research 3.46 Accommodation 3.12
Work placement and programme 3.09
Group size 3.67
Work placement experience 3.80
Source: NSE
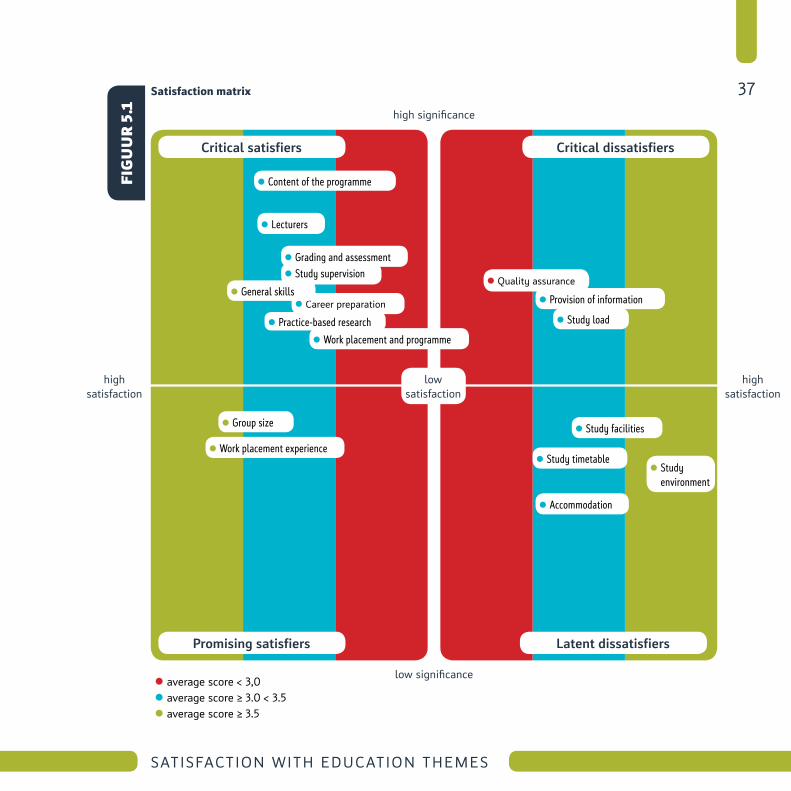
In addition to the ‘satisfier-dissatisfier’ classification, Figure 5.1 shows the relationship of the 17 themes with general satisfaction (high and low correlation) and the specific satisfaction scores are also shown in Table 5.1. For the ‘satis-fiers’ the ‘programme content’ theme has the highest correlation with general satisfaction while in the case of the ‘dissatisfiers’ this is the quality assurance theme. The content theme has a greater correlation with general satisfacti-on than the group size theme. With an equally large increase in satisfaction with the group size and the programme content, the effect of programme content will be greater on general satisfaction than the increase in satisfaction with group size. This classification can be used to formulate policy measures. each quadrant of the figure calls for a different action.
Critical satisfiersThemes in the top left quadrant fall into the category ‘critical satisfiers’. Investment in these themes may result in higher satisfaction as they have a reasonable correlation with general satisfaction. We can see that most themes have a moderate score and this means that there is a great deal of room for improvement. Subjects in this category are critical, as dissatisfaction with these themes may result directly in a decrease in general satisfaction.
tabl
e 5.
1
37
SatiSfaction with education themeS
satisfaction matrix
high significance
high satisfaction
high satisfaction
lowsatisfaction
low significance
Critical satisfiers
Promising satisfiers Latent dissatisfiers
Critical dissatisfiers
Content of the programme
Grading and assessment
Career preparation
Practice-based research
Work placement and programme
Quality assurance
Provision of information
Study load
Study timetable
Study facilities
Accommodation
Study environment
Group size
Work placement experience
Study supervision
General skills
average score < 3,0 average score ≥ 3.0 < 3.5 average score ≥ 3.5
fig
uu
r 5.
1
Lecturers
38
NIEUW HAAGS PEIL 2013
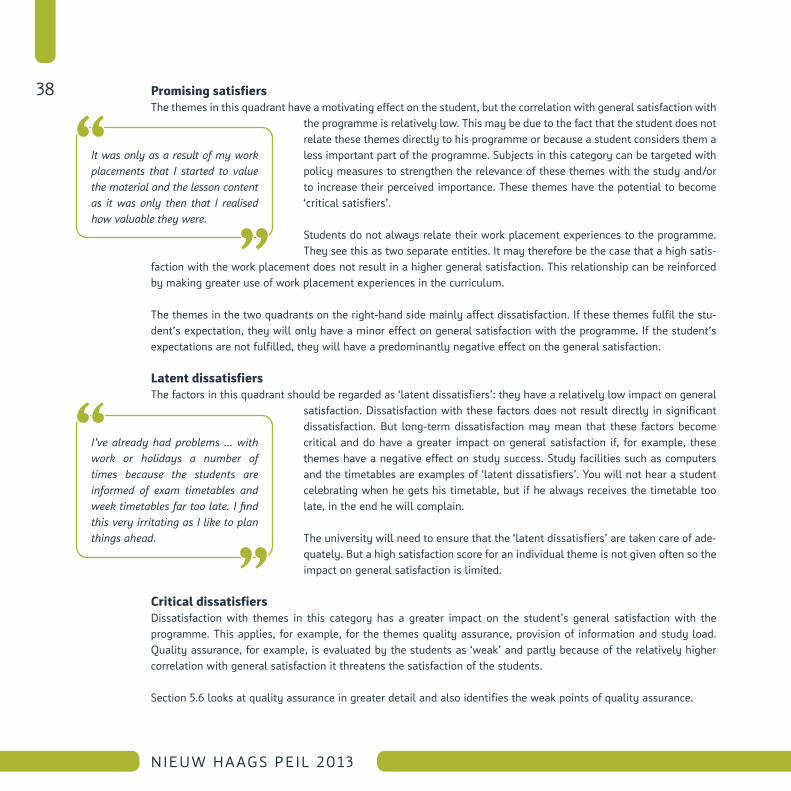
Promising satisfiersThe themes in this quadrant have a motivating effect on the student, but the correlation with general satisfaction with
the programme is relatively low. This may be due to the fact that the student does not relate these themes directly to his programme or because a student considers them a less important part of the programme. Subjects in this category can be targeted with policy measures to strengthen the relevance of these themes with the study and/or to increase their perceived importance. These themes have the potential to become ‘critical satisfiers’.
Students do not always relate their work placement experiences to the programme. They see this as two separate entities. It may therefore be the case that a high satis-
faction with the work placement does not result in a higher general satisfaction. This relationship can be reinforced by making greater use of work placement experiences in the curriculum.
The themes in the two quadrants on the right-hand side mainly affect dissatisfaction. If these themes fulfil the stu-dent’s expectation, they will only have a minor effect on general satisfaction with the programme. If the student’s expectations are not fulfilled, they will have a predominantly negative effect on the general satisfaction.
latent dissatisfiersThe factors in this quadrant should be regarded as ‘latent dissatisfiers’: they have a relatively low impact on general
satisfaction. dissatisfaction with these factors does not result directly in significant dissatisfaction. But long-term dissatisfaction may mean that these factors become critical and do have a greater impact on general satisfaction if, for example, these themes have a negative effect on study success. Study facilities such as computers and the timetables are examples of ‘latent dissatisfiers’. You will not hear a student celebrating when he gets his timetable, but if he always receives the timetable too late, in the end he will complain.
The university will need to ensure that the ‘latent dissatisfiers’ are taken care of ade-quately. But a high satisfaction score for an individual theme is not given often so the impact on general satisfaction is limited.
Critical dissatisfiersdissatisfaction with themes in this category has a greater impact on the student’s general satisfaction with the programme. This applies, for example, for the themes quality assurance, provision of information and study load. Quality assurance, for example, is evaluated by the students as ‘weak’ and partly because of the relatively higher correlation with general satisfaction it threatens the satisfaction of the students.
Section 5.6 looks at quality assurance in greater detail and also identifies the weak points of quality assurance.
It was only as a result of my work placements that I started to value the material and the lesson content as it was only then that I realised how valuable they were.
I’ve already had problems ... with work or holidays a number of times because the students are informed of exam timetables and week timetables far too late. I find this very irritating as I like to plan things ahead.
39
SatiSfaction with education themeS
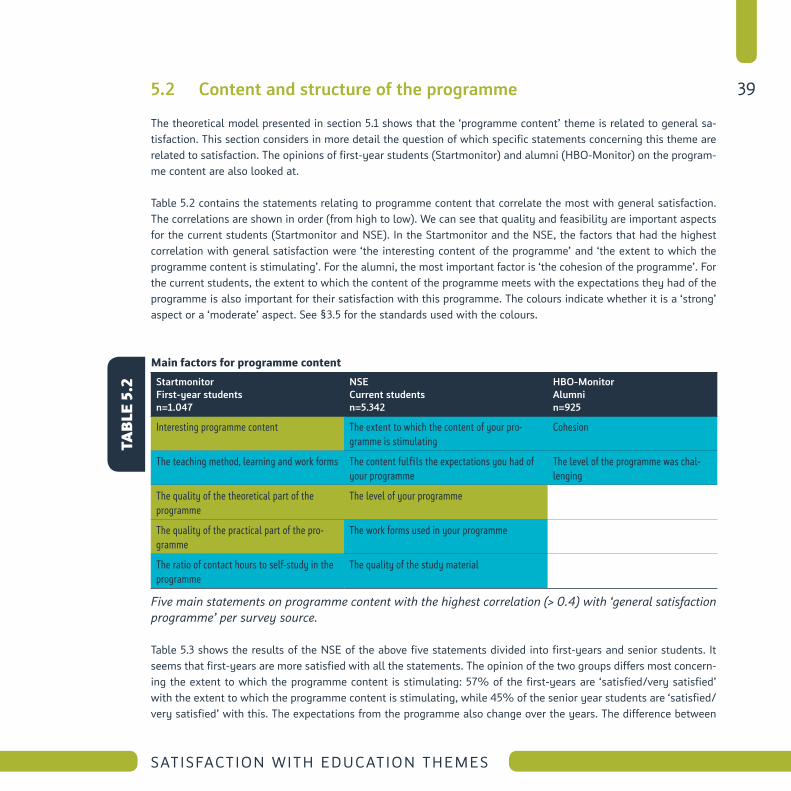
5.2 Content and structure of the programme
The theoretical model presented in section 5.1 shows that the ‘programme content’ theme is related to general sa-tisfaction. This section considers in more detail the question of which specific statements concerning this theme are related to satisfaction. The opinions of first-year students (Startmonitor) and alumni (HBO-Monitor) on the program-me content are also looked at.
Table 5.2 contains the statements relating to programme content that correlate the most with general satisfaction. The correlations are shown in order (from high to low). We can see that quality and feasibility are important aspects for the current students (Startmonitor and NSe). In the Startmonitor and the NSe, the factors that had the highest correlation with general satisfaction were ‘the interesting content of the programme’ and ‘the extent to which the programme content is stimulating’. For the alumni, the most important factor is ‘the cohesion of the programme’. For the current students, the extent to which the content of the programme meets with the expectations they had of the programme is also important for their satisfaction with this programme. The colours indicate whether it is a ‘strong’ aspect or a ‘moderate’ aspect. See §3.5 for the standards used with the colours.
main factors for programme content
StartmonitorFirst-year studentsn=1.047
NSECurrent studentsn=5.342
HBO-MonitorAlumnin=925
Interesting programme content The extent to which the content of your pro-gramme is stimulating
Cohesion
The teaching method, learning and work forms The content fulfils the expectations you had of your programme
The level of the programme was chal-lenging
The quality of the theoretical part of the programme
The level of your programme
The quality of the practical part of the pro-gramme
The work forms used in your programme
The ratio of contact hours to self-study in the programme
The quality of the study material
Five main statements on programme content with the highest correlation (> 0.4) with ‘general satisfaction programme’ per survey source.
Table 5.3 shows the results of the NSe of the above five statements divided into first-years and senior students. It seems that first-years are more satisfied with all the statements. The opinion of the two groups differs most concern-ing the extent to which the programme content is stimulating: 57% of the first-years are ‘satisfied/very satisfied’ with the extent to which the programme content is stimulating, while 45% of the senior year students are ‘satisfied/very satisfied’ with this. The expectations from the programme also change over the years. The difference between
tabl
e 5.
2
40
NIEUW HAAGS PEIL 2013
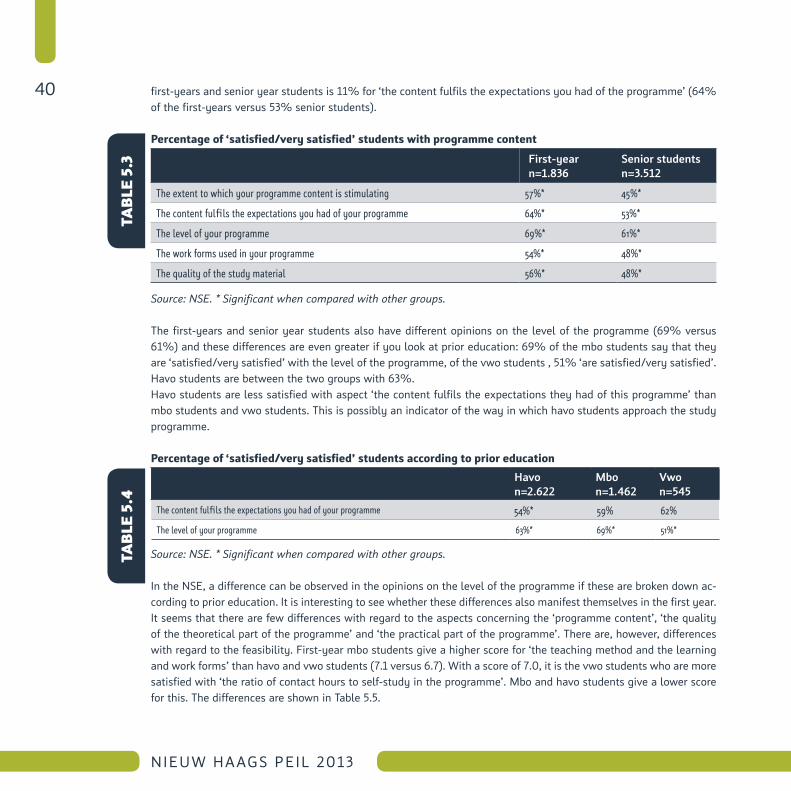
first-years and senior year students is 11% for ‘the content fulfils the expectations you had of the programme’ (64% of the first-years versus 53% senior students).
Percentage of ‘satisfied/very satisfied’ students with programme content
First-yearn=1.836
Senior studentsn=3.512
The extent to which your programme content is stimulating 57%* 45%*
The content fulfils the expectations you had of your programme 64%* 53%*
The level of your programme 69%* 61%*
The work forms used in your programme 54%* 48%*
The quality of the study material 56%* 48%*
Source: NSE. * Significant when compared with other groups.
The first-years and senior year students also have different opinions on the level of the programme (69% versus 61%) and these differences are even greater if you look at prior education: 69% of the mbo students say that they are ‘satisfied/very satisfied’ with the level of the programme, of the vwo students , 51% ‘are satisfied/very satisfied’. Havo students are between the two groups with 63%. Havo students are less satisfied with aspect ‘the content fulfils the expectations they had of this programme’ than mbo students and vwo students. This is possibly an indicator of the way in which havo students approach the study programme.
Percentage of ‘satisfied/very satisfied’ students according to prior education
Havon=2.622
Mbon=1.462
Vwon=545
The content fulfils the expectations you had of your programme 54%* 59% 62%
The level of your programme 63%* 69%* 51%*
Source: NSE. * Significant when compared with other groups.
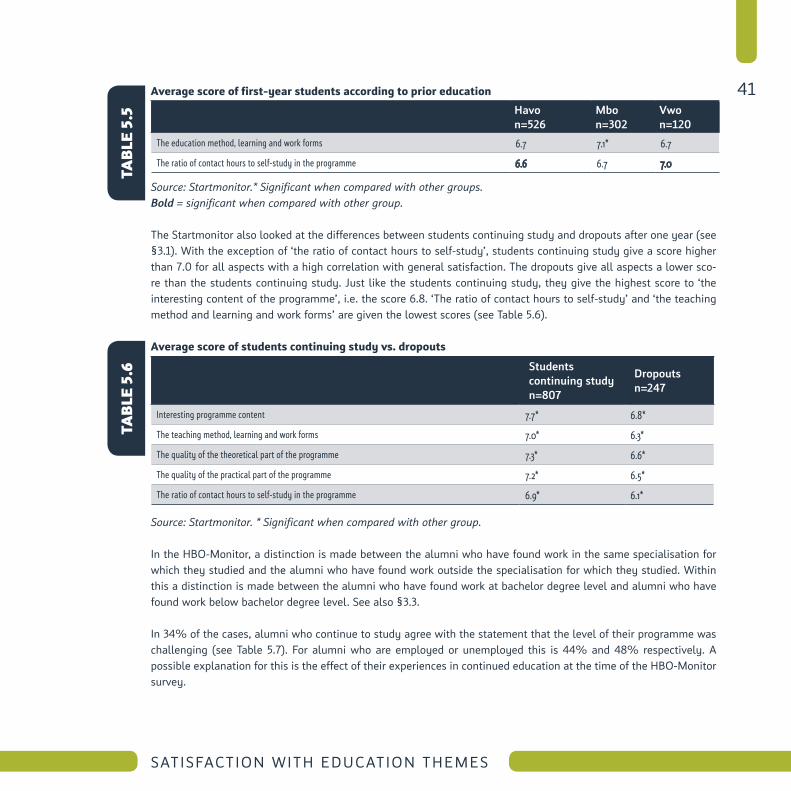
In the NSe, a difference can be observed in the opinions on the level of the programme if these are broken down ac-cording to prior education. It is interesting to see whether these differences also manifest themselves in the first year. It seems that there are few differences with regard to the aspects concerning the ‘programme content’, ‘the quality of the theoretical part of the programme’ and ‘the practical part of the programme’. There are, however, differences with regard to the feasibility. First-year mbo students give a higher score for ‘the teaching method and the learning and work forms’ than havo and vwo students (7.1 versus 6.7). With a score of 7.0, it is the vwo students who are more satisfied with ‘the ratio of contact hours to self-study in the programme’. Mbo and havo students give a lower score for this. The differences are shown in Table 5.5.
tabl
e 5.
3ta
ble
5.4
41
SatiSfaction with education themeS
average score of first-year students according to prior education
Havon=526
Mbon=302
Vwon=120
The education method, learning and work forms 6.7 7.1* 6.7
The ratio of contact hours to self-study in the programme 6.6 6.7 7.0
Source: Startmonitor.* Significant when compared with other groups. Bold = significant when compared with other group.
The Startmonitor also looked at the differences between students continuing study and dropouts after one year (see §3.1). With the exception of ‘the ratio of contact hours to self-study’, students continuing study give a score higher than 7.0 for all aspects with a high correlation with general satisfaction. The dropouts give all aspects a lower sco-re than the students continuing study. just like the students continuing study, they give the highest score to ‘the interesting content of the programme’, i.e. the score 6.8. ‘The ratio of contact hours to self-study’ and ‘the teaching method and learning and work forms’ are given the lowest scores (see Table 5.6).
average score of students continuing study vs. dropouts
Students continuing studyn=807
Dropoutsn=247
Interesting programme content 7.7* 6.8*
The teaching method, learning and work forms 7.0* 6.3*
The quality of the theoretical part of the programme 7.3* 6.6*
The quality of the practical part of the programme 7.2* 6.5*
The ratio of contact hours to self-study in the programme 6.9* 6.1*
Source: Startmonitor. * Significant when compared with other group.
In the HBO-Monitor, a distinction is made between the alumni who have found work in the same specialisation for which they studied and the alumni who have found work outside the specialisation for which they studied. Within this a distinction is made between the alumni who have found work at bachelor degree level and alumni who have found work below bachelor degree level. See also §3.3.
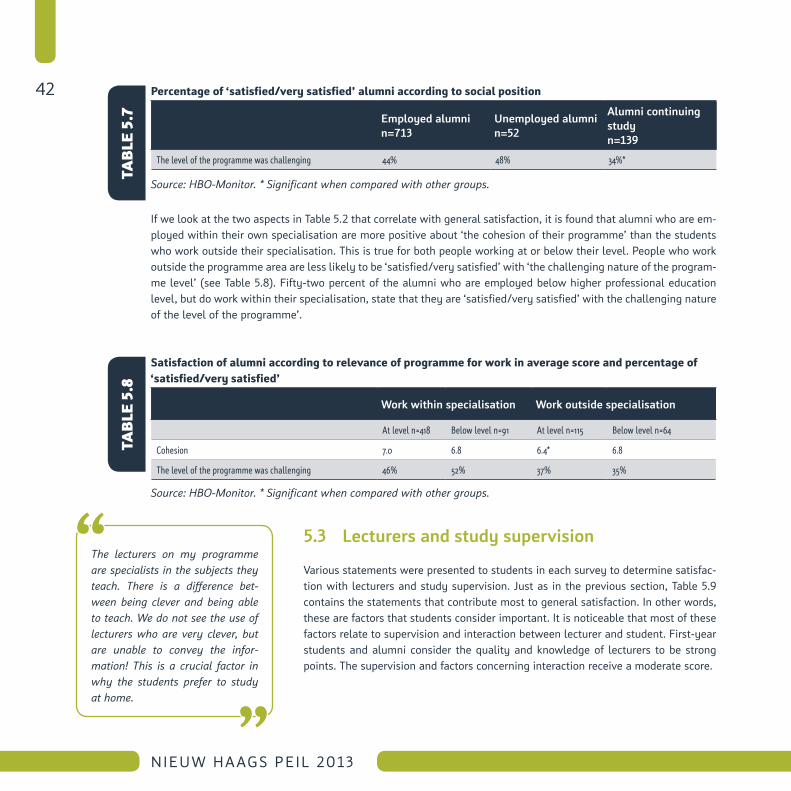
In 34% of the cases, alumni who continue to study agree with the statement that the level of their programme was challenging (see Table 5.7). For alumni who are employed or unemployed this is 44% and 48% respectively. A possible explanation for this is the effect of their experiences in continued education at the time of the HBO-Monitor survey.
tabl
e 5.
5ta
ble
5.6
42
NIEUW HAAGS PEIL 2013
Percentage of ‘satisfied/very satisfied’ alumni according to social position
Employed alumnin=713
Unemployed alumnin=52
Alumni continuing studyn=139
The level of the programme was challenging 44% 48% 34%*
Source: HBO-Monitor. * Significant when compared with other groups.
If we look at the two aspects in Table 5.2 that correlate with general satisfaction, it is found that alumni who are em-ployed within their own specialisation are more positive about ‘the cohesion of their programme’ than the students who work outside their specialisation. This is true for both people working at or below their level. people who work outside the programme area are less likely to be ‘satisfied/very satisfied’ with ‘the challenging nature of the program-me level’ (see Table 5.8). Fifty-two percent of the alumni who are employed below higher professional education level, but do work within their specialisation, state that they are ‘satisfied/very satisfied’ with the challenging nature of the level of the programme’.
satisfaction of alumni according to relevance of programme for work in average score and percentage of ‘satisfied/very satisfied’
Work within specialisation Work outside specialisation
At level n=418 Below level n=91 At level n=115 Below level n=64
Cohesion 7.0 6.8 6.4* 6.8
The level of the programme was challenging 46% 52% 37% 35%
Source: HBO-Monitor. * Significant when compared with other groups.
5.3 Lecturers and study supervision
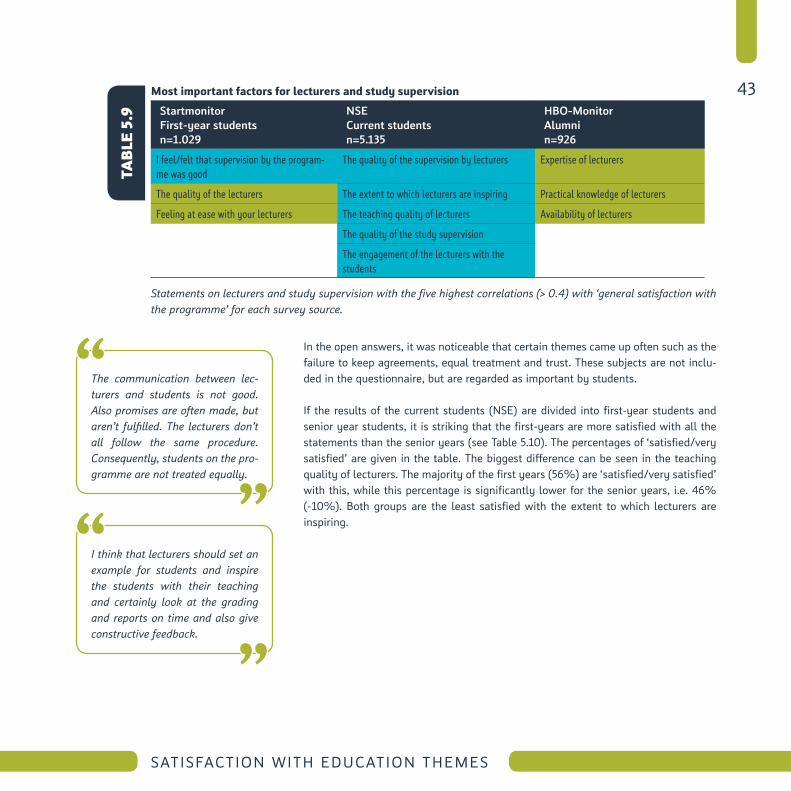
various statements were presented to students in each survey to determine satisfac-tion with lecturers and study supervision. just as in the previous section, Table 5.9 contains the statements that contribute most to general satisfaction. In other words, these are factors that students consider important. It is noticeable that most of these factors relate to supervision and interaction between lecturer and student. First-year students and alumni consider the quality and knowledge of lecturers to be strong points. The supervision and factors concerning interaction receive a moderate score.
tabl
e 5.
7ta
ble
5.8
The lecturers on my programme are specialists in the subjects they teach. There is a difference bet-ween being clever and being able to teach. We do not see the use of lecturers who are very clever, but are unable to convey the infor-mation! This is a crucial factor in why the students prefer to study at home.
43
SatiSfaction with education themeS
most important factors for lecturers and study supervision
StartmonitorFirst-year studentsn=1.029
NSECurrent studentsn=5.135
HBO-MonitorAlumnin=926
I feel/felt that supervision by the program-me was good
The quality of the supervision by lecturers Expertise of lecturers
The quality of the lecturers The extent to which lecturers are inspiring Practical knowledge of lecturers
Feeling at ease with your lecturers The teaching quality of lecturers Availability of lecturers
The quality of the study supervision
The engagement of the lecturers with the students
Statements on lecturers and study supervision with the five highest correlations (> 0.4) with ‘general satisfaction with the programme’ for each survey source.
In the open answers, it was noticeable that certain themes came up often such as the failure to keep agreements, equal treatment and trust. These subjects are not inclu-ded in the questionnaire, but are regarded as important by students.
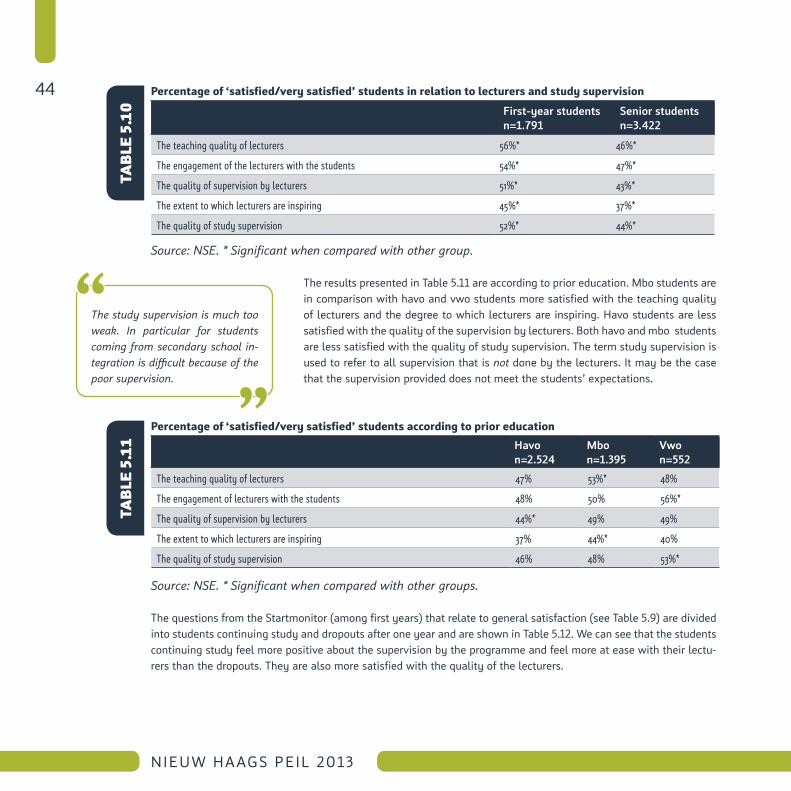
If the results of the current students (NSe) are divided into first-year students and senior year students, it is striking that the first-years are more satisfied with all the statements than the senior years (see Table 5.10). The percentages of ‘satisfied/very satisfied’ are given in the table. The biggest difference can be seen in the teaching quality of lecturers. The majority of the first years (56%) are ‘satisfied/very satisfied’ with this, while this percentage is significantly lower for the senior years, i.e. 46% (-10%). Both groups are the least satisfied with the extent to which lecturers are inspiring.
tabl
e 5.
9
The communication between lec-turers and students is not good. Also promises are often made, but aren’t fulfilled. The lecturers don’t all follow the same procedure. Consequently, students on the pro-gramme are not treated equally.
I think that lecturers should set an example for students and inspire the students with their teaching and certainly look at the grading and reports on time and also give constructive feedback.
44
NIEUW HAAGS PEIL 2013
Percentage of ‘satisfied/very satisfied’ students in relation to lecturers and study supervision
First-year studentsn=1.791
Senior studentsn=3.422
The teaching quality of lecturers 56%* 46%*
The engagement of the lecturers with the students 54%* 47%*
The quality of supervision by lecturers 51%* 43%*
The extent to which lecturers are inspiring 45%* 37%*
The quality of study supervision 52%* 44%*
Source: NSE. * Significant when compared with other group.
The results presented in Table 5.11 are according to prior education. Mbo students are in comparison with havo and vwo students more satisfied with the teaching quality of lecturers and the degree to which lecturers are inspiring. Havo students are less satisfied with the quality of the supervision by lecturers. Both havo and mbo students are less satisfied with the quality of study supervision. The term study supervision is used to refer to all supervision that is not done by the lecturers. It may be the case that the supervision provided does not meet the students’ expectations.
Percentage of ‘satisfied/very satisfied’ students according to prior education
Havon=2.524
Mbon=1.395
Vwon=552
The teaching quality of lecturers 47% 53%* 48%
The engagement of lecturers with the students 48% 50% 56%*
The quality of supervision by lecturers 44%* 49% 49%
The extent to which lecturers are inspiring 37% 44%* 40%
The quality of study supervision 46% 48% 53%*
Source: NSE. * Significant when compared with other groups.
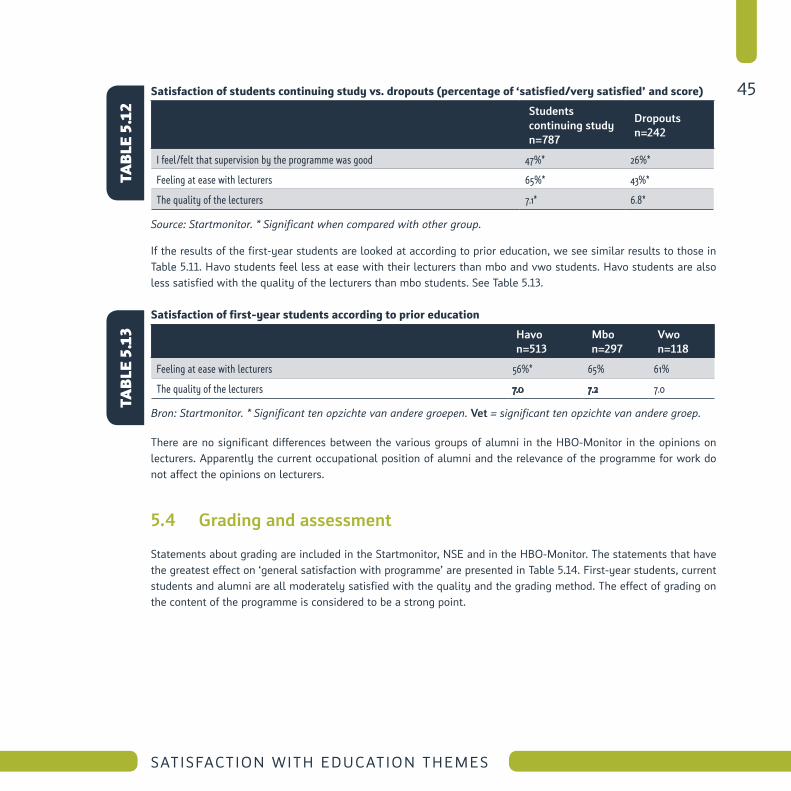
The questions from the Startmonitor (among first years) that relate to general satisfaction (see Table 5.9) are divided into students continuing study and dropouts after one year and are shown in Table 5.12. We can see that the students continuing study feel more positive about the supervision by the programme and feel more at ease with their lectu-rers than the dropouts. They are also more satisfied with the quality of the lecturers.
The study supervision is much too weak. In particular for students coming from secondary school in-tegration is difficult because of the poor supervision.
tabl
e 5.
10ta
ble
5.11
45
SatiSfaction with education themeS
satisfaction of students continuing study vs. dropouts (percentage of ‘satisfied/very satisfied’ and score)
Students continuing studyn=787
Dropoutsn=242
I feel/felt that supervision by the programme was good 47%* 26%*
Feeling at ease with lecturers 65%* 43%*
The quality of the lecturers 7.1* 6.8*
Source: Startmonitor. * Significant when compared with other group.
If the results of the first-year students are looked at according to prior education, we see similar results to those in Table 5.11. Havo students feel less at ease with their lecturers than mbo and vwo students. Havo students are also less satisfied with the quality of the lecturers than mbo students. See Table 5.13.
satisfaction of first-year students according to prior education
Havon=513
Mbon=297
Vwon=118
Feeling at ease with lecturers 56%* 65% 61%
The quality of the lecturers 7.0 7.2 7.0
Bron: Startmonitor. * Significant ten opzichte van andere groepen. Vet = significant ten opzichte van andere groep.
There are no significant differences between the various groups of alumni in the HBO-Monitor in the opinions on lecturers. Apparently the current occupational position of alumni and the relevance of the programme for work do not affect the opinions on lecturers.
5.4 Grading and assessment
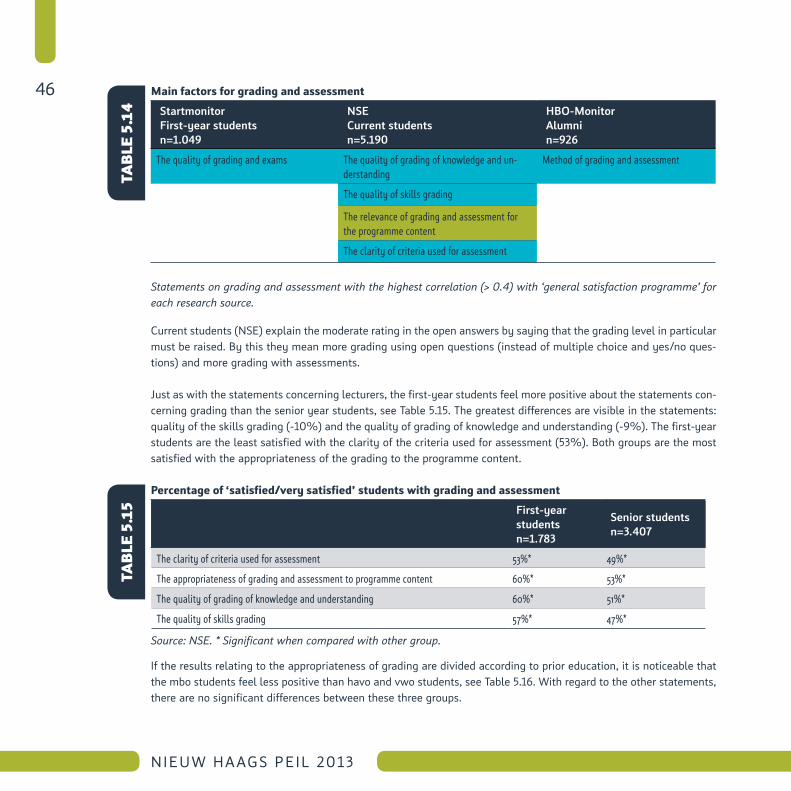
Statements about grading are included in the Startmonitor, NSe and in the HBO-Monitor. The statements that have the greatest effect on ‘general satisfaction with programme’ are presented in Table 5.14. First-year students, current students and alumni are all moderately satisfied with the quality and the grading method. The effect of grading on the content of the programme is considered to be a strong point.
tabl
e 5.
12ta
ble
5.13
46
NIEUW HAAGS PEIL 2013
main factors for grading and assessment
StartmonitorFirst-year studentsn=1.049
NSECurrent studentsn=5.190
HBO-MonitorAlumnin=926
The quality of grading and exams The quality of grading of knowledge and un-derstanding
Method of grading and assessment
The quality of skills grading
The relevance of grading and assessment for the programme content
The clarity of criteria used for assessment
Statements on grading and assessment with the highest correlation (> 0.4) with ‘general satisfaction programme’ for each research source.
Current students (NSe) explain the moderate rating in the open answers by saying that the grading level in particular must be raised. By this they mean more grading using open questions (instead of multiple choice and yes/no ques-tions) and more grading with assessments.
just as with the statements concerning lecturers, the first-year students feel more positive about the statements con-cerning grading than the senior year students, see Table 5.15. The greatest differences are visible in the statements: quality of the skills grading (-10%) and the quality of grading of knowledge and understanding (-9%). The first-year students are the least satisfied with the clarity of the criteria used for assessment (53%). Both groups are the most satisfied with the appropriateness of the grading to the programme content.
Percentage of ‘satisfied/very satisfied’ students with grading and assessment
First-year studentsn=1.783
Senior studentsn=3.407
The clarity of criteria used for assessment 53%* 49%*
The appropriateness of grading and assessment to programme content 60%* 53%*
The quality of grading of knowledge and understanding 60%* 51%*
The quality of skills grading 57%* 47%*
Source: NSE. * Significant when compared with other group.
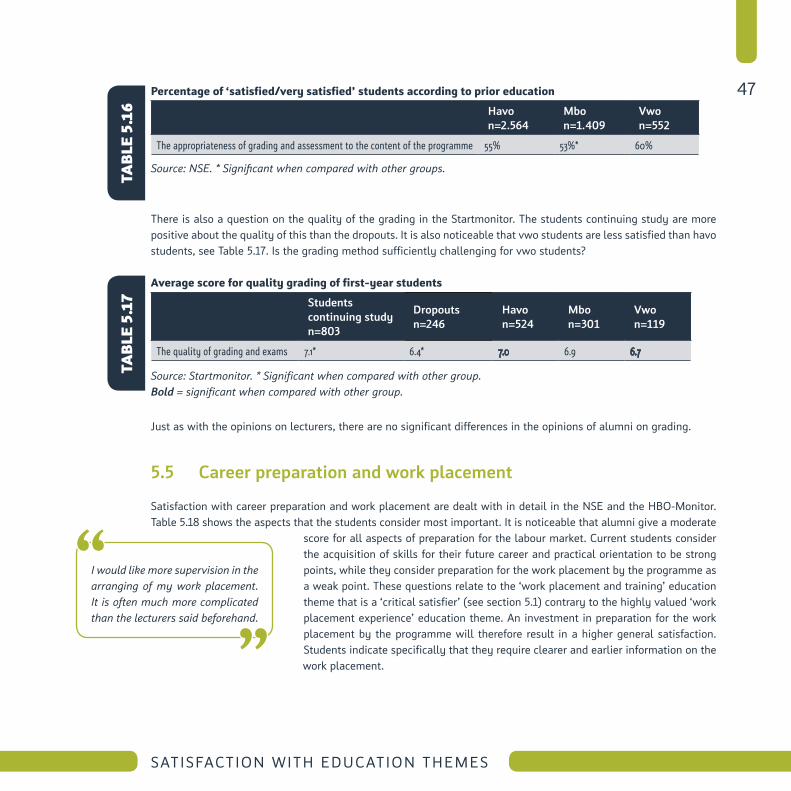
If the results relating to the appropriateness of grading are divided according to prior education, it is noticeable that the mbo students feel less positive than havo and vwo students, see Table 5.16. With regard to the other statements, there are no significant differences between these three groups.
tabl
e 5.
14ta
ble
5.15
47
SatiSfaction with education themeS
Percentage of ‘satisfied/very satisfied’ students according to prior education
Havon=2.564
Mbon=1.409
Vwon=552
The appropriateness of grading and assessment to the content of the programme 55% 53%* 60%
Source: NSE. * Significant when compared with other groups.
There is also a question on the quality of the grading in the Startmonitor. The students continuing study are more positive about the quality of this than the dropouts. It is also noticeable that vwo students are less satisfied than havo students, see Table 5.17. Is the grading method sufficiently challenging for vwo students?
average score for quality grading of first-year students
Students continuing studyn=803
Dropoutsn=246
Havon=524
Mbon=301
Vwon=119
The quality of grading and exams 7.1* 6.4* 7.0 6.9 6.7
Source: Startmonitor. * Significant when compared with other group. Bold = significant when compared with other group.
just as with the opinions on lecturers, there are no significant differences in the opinions of alumni on grading.
5.5 Career preparation and work placement
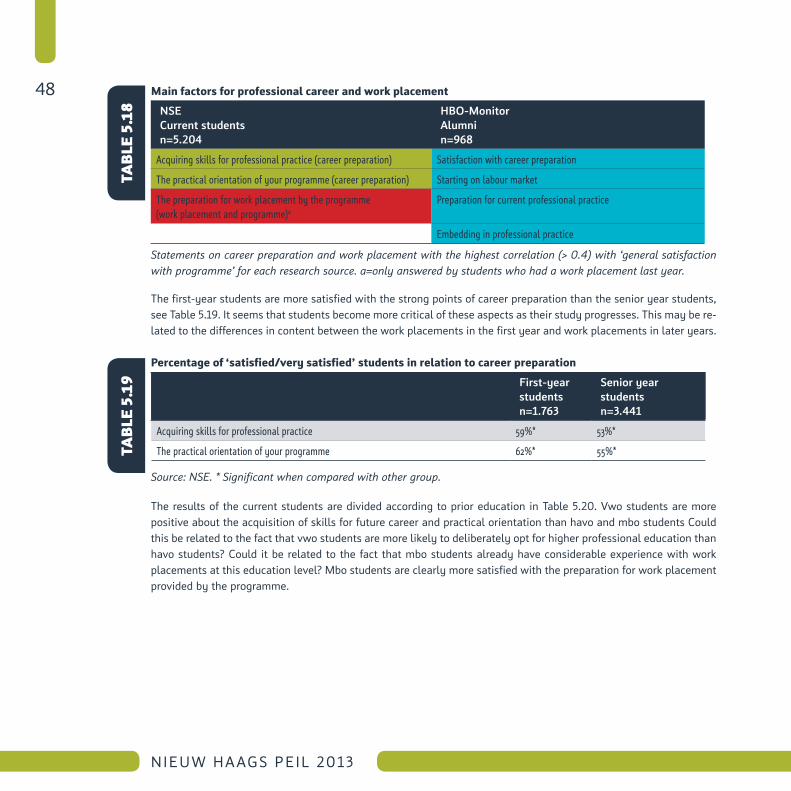
Satisfaction with career preparation and work placement are dealt with in detail in the NSe and the HBO-Monitor. Table 5.18 shows the aspects that the students consider most important. It is noticeable that alumni give a moderate
score for all aspects of preparation for the labour market. Current students consider the acquisition of skills for their future career and practical orientation to be strong points, while they consider preparation for the work placement by the programme as a weak point. These questions relate to the ‘work placement and training’ education theme that is a ‘critical satisfier’ (see section 5.1) contrary to the highly valued ‘work placement experience’ education theme. An investment in preparation for the work placement by the programme will therefore result in a higher general satisfaction. Students indicate specifically that they require clearer and earlier information on the work placement.
I would like more supervision in the arranging of my work placement. It is often much more complicated than the lecturers said beforehand.
tabl
e 5.
16ta
ble
5.17
48
NIEUW HAAGS PEIL 2013
main factors for professional career and work placement
NSECurrent studentsn=5.204
HBO-MonitorAlumnin=968
Acquiring skills for professional practice (career preparation) Satisfaction with career preparation
The practical orientation of your programme (career preparation) Starting on labour market
The preparation for work placement by the programme (work placement and programme)a
Preparation for current professional practice
Embedding in professional practice
Statements on career preparation and work placement with the highest correlation (> 0.4) with ‘general satisfaction with programme’ for each research source. a=only answered by students who had a work placement last year.
The first-year students are more satisfied with the strong points of career preparation than the senior year students, see Table 5.19. It seems that students become more critical of these aspects as their study progresses. This may be re-lated to the differences in content between the work placements in the first year and work placements in later years.
Percentage of ‘satisfied/very satisfied’ students in relation to career preparation
First-year studentsn=1.763
Senior year studentsn=3.441
Acquiring skills for professional practice 59%* 53%*
The practical orientation of your programme 62%* 55%*
Source: NSE. * Significant when compared with other group.
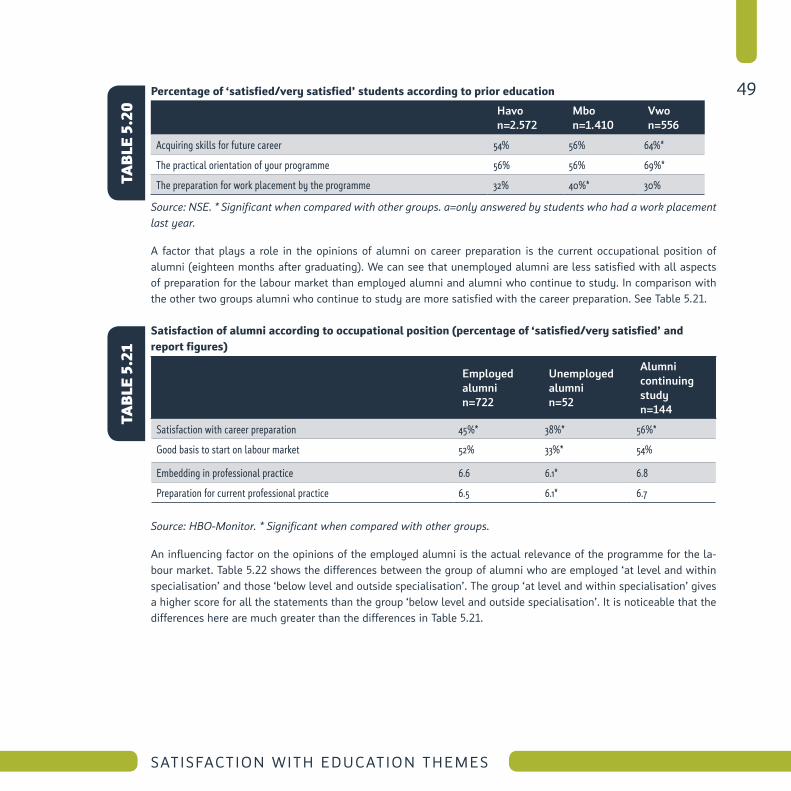
The results of the current students are divided according to prior education in Table 5.20. vwo students are more positive about the acquisition of skills for future career and practical orientation than havo and mbo students Could this be related to the fact that vwo students are more likely to deliberately opt for higher professional education than havo students? Could it be related to the fact that mbo students already have considerable experience with work placements at this education level? Mbo students are clearly more satisfied with the preparation for work placement provided by the programme.
tabl
e 5.
18ta
ble
5.19
49
SatiSfaction with education themeS
Percentage of ‘satisfied/very satisfied’ students according to prior education
Havon=2.572
Mbon=1.410
Vwon=556
Acquiring skills for future career 54% 56% 64%*
The practical orientation of your programme 56% 56% 69%*
The preparation for work placement by the programme 32% 40%* 30%
Source: NSE. * Significant when compared with other groups. a=only answered by students who had a work placement last year.
A factor that plays a role in the opinions of alumni on career preparation is the current occupational position of alumni (eighteen months after graduating). We can see that unemployed alumni are less satisfied with all aspects of preparation for the labour market than employed alumni and alumni who continue to study. In comparison with the other two groups alumni who continue to study are more satisfied with the career preparation. See Table 5.21.
satisfaction of alumni according to occupational position (percentage of ‘satisfied/very satisfied’ and report figures)
Employed alumnin=722
Unemployed alumnin=52
Alumni continuing studyn=144
Satisfaction with career preparation 45%* 38%* 56%*
Good basis to start on labour market 52% 33%* 54%
Embedding in professional practice 6.6 6.1* 6.8
Preparation for current professional practice 6.5 6.1* 6.7
Source: HBO-Monitor. * Significant when compared with other groups.
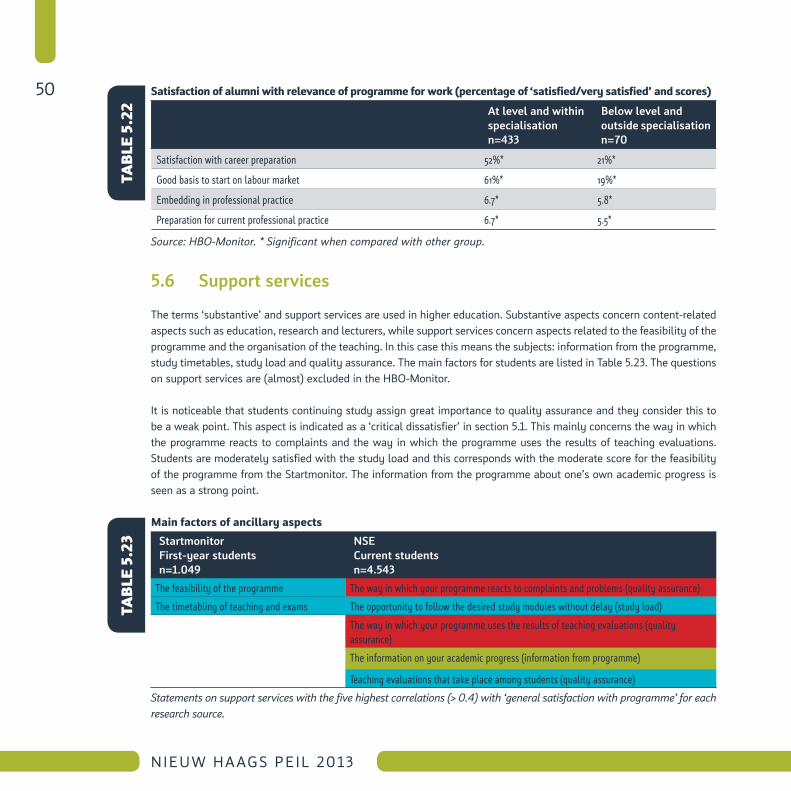
An influencing factor on the opinions of the employed alumni is the actual relevance of the programme for the la-bour market. Table 5.22 shows the differences between the group of alumni who are employed ‘at level and within specialisation’ and those ‘below level and outside specialisation’. The group ‘at level and within specialisation’ gives a higher score for all the statements than the group ‘below level and outside specialisation’. It is noticeable that the differences here are much greater than the differences in Table 5.21.
tabl
e 5.
20ta
ble
5.21
50
NIEUW HAAGS PEIL 2013
satisfaction of alumni with relevance of programme for work (percentage of ‘satisfied/very satisfied’ and scores)
At level and within specialisationn=433
Below level and outside specialisationn=70
Satisfaction with career preparation 52%* 21%*
Good basis to start on labour market 61%* 19%*
Embedding in professional practice 6.7* 5.8*
Preparation for current professional practice 6.7* 5.5*
Source: HBO-Monitor. * Significant when compared with other group.
5.6 Support services
The terms ‘substantive’ and support services are used in higher education. Substantive aspects concern content-related aspects such as education, research and lecturers, while support services concern aspects related to the feasibility of the programme and the organisation of the teaching. In this case this means the subjects: information from the programme, study timetables, study load and quality assurance. The main factors for students are listed in Table 5.23. The questions on support services are (almost) excluded in the HBO-Monitor.
It is noticeable that students continuing study assign great importance to quality assurance and they consider this to be a weak point. This aspect is indicated as a ‘critical dissatisfier’ in section 5.1. This mainly concerns the way in which the programme reacts to complaints and the way in which the programme uses the results of teaching evaluations. Students are moderately satisfied with the study load and this corresponds with the moderate score for the feasibility of the programme from the Startmonitor. The information from the programme about one’s own academic progress is seen as a strong point.
main factors of ancillary aspects
StartmonitorFirst-year studentsn=1.049
NSECurrent studentsn=4.543
The feasibility of the programme The way in which your programme reacts to complaints and problems (quality assurance)
The timetabling of teaching and exams The opportunity to follow the desired study modules without delay (study load)
The way in which your programme uses the results of teaching evaluations (quality assurance)
The information on your academic progress (information from programme)
Teaching evaluations that take place among students (quality assurance)
Statements on support services with the five highest correlations (> 0.4) with ‘general satisfaction with programme’ for each research source.
tabl
e 5.
22ta
ble
5.23
51
SatiSfaction with education themeS
The dissatisfaction with the way in which complaints are dealt with by the program-me is explained in greater detail in the open answers. Students say that they feel that no one listens to them and that their complaints are not taken seriously.
With regard to the teaching evaluations it is not clear to the students what happens to the results.
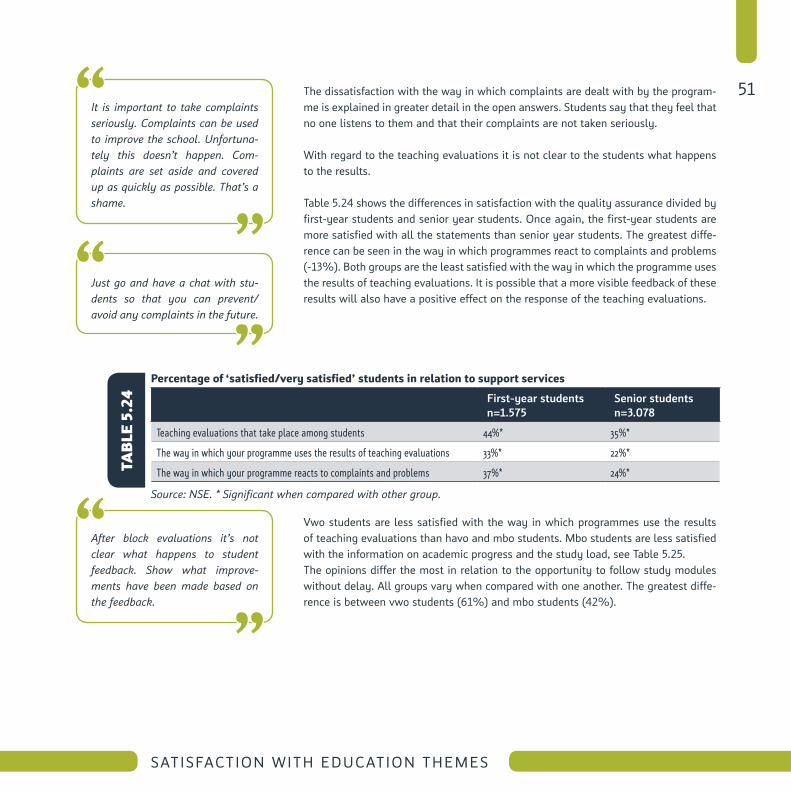
Table 5.24 shows the differences in satisfaction with the quality assurance divided by first-year students and senior year students. Once again, the first-year students are more satisfied with all the statements than senior year students. The greatest diffe-rence can be seen in the way in which programmes react to complaints and problems (-13%). Both groups are the least satisfied with the way in which the programme uses the results of teaching evaluations. It is possible that a more visible feedback of these results will also have a positive effect on the response of the teaching evaluations.
Percentage of ‘satisfied/very satisfied’ students in relation to support services
First-year studentsn=1.575
Senior students n=3.078
Teaching evaluations that take place among students 44%* 35%*
The way in which your programme uses the results of teaching evaluations 33%* 22%*
The way in which your programme reacts to complaints and problems 37%* 24%*
Source: NSE. * Significant when compared with other group.
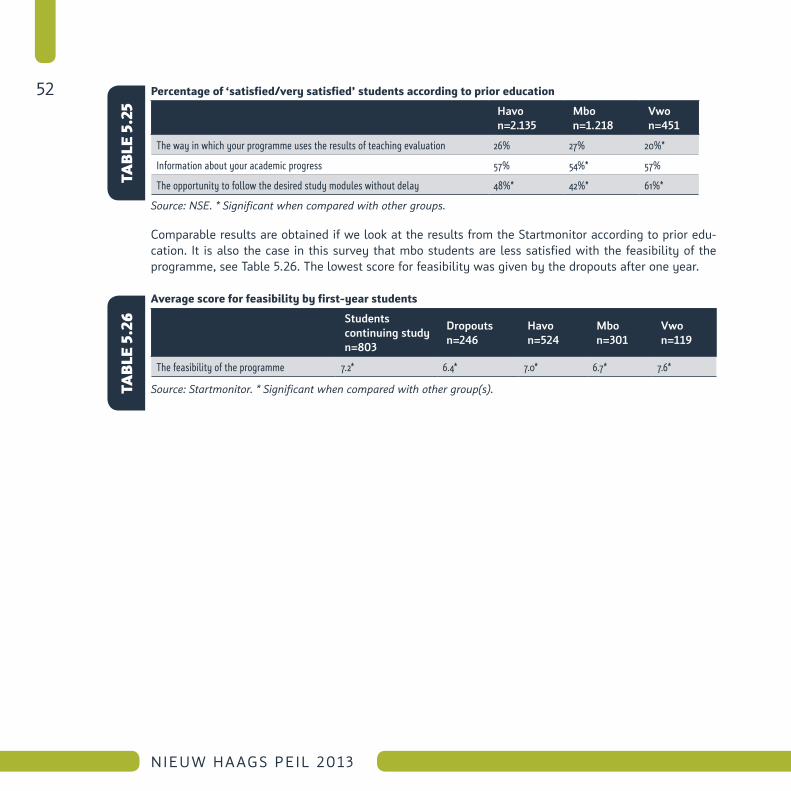
vwo students are less satisfied with the way in which programmes use the results of teaching evaluations than havo and mbo students. Mbo students are less satisfied with the information on academic progress and the study load, see Table 5.25.The opinions differ the most in relation to the opportunity to follow study modules without delay. All groups vary when compared with one another. The greatest diffe-rence is between vwo students (61%) and mbo students (42%).
It is important to take complaints seriously. Complaints can be used to improve the school. Unfortuna-tely this doesn’t happen. Com-plaints are set aside and covered up as quickly as possible. That’s a shame.
Just go and have a chat with stu-dents so that you can prevent/avoid any complaints in the future.
After block evaluations it’s not clear what happens to student feedback. Show what improve-ments have been made based on the feedback.
tabl
e 5.
24
52
NIEUW HAAGS PEIL 2013
Percentage of ‘satisfied/very satisfied’ students according to prior education
Havon=2.135
Mbon=1.218
Vwon=451
The way in which your programme uses the results of teaching evaluation 26% 27% 20%*
Information about your academic progress 57% 54%* 57%
The opportunity to follow the desired study modules without delay 48%* 42%* 61%*
Source: NSE. * Significant when compared with other groups.
Comparable results are obtained if we look at the results from the Startmonitor according to prior edu-cation. It is also the case in this survey that mbo students are less satisfied with the feasibility of the programme, see Table 5.26. The lowest score for feasibility was given by the dropouts after one year.
average score for feasibility by first-year students
Students continuing studyn=803
Dropoutsn=246
Havon=524
Mbon=301
Vwon=119
The feasibility of the programme 7.2* 6.4* 7.0* 6.7* 7.6*
Source: Startmonitor. * Significant when compared with other group(s).
tabl
e 5.
25ta
ble
5.26
53
SatiSfaction with education themeS
55
Co
mPa
ris
oN
oF
iNte
rN
ati
oN
al
aN
D
Na
tio
Na
l st
uD
eN
ts

57
COMPARISON OF INTERNATIONAL AND NATIONAL STUDENTS
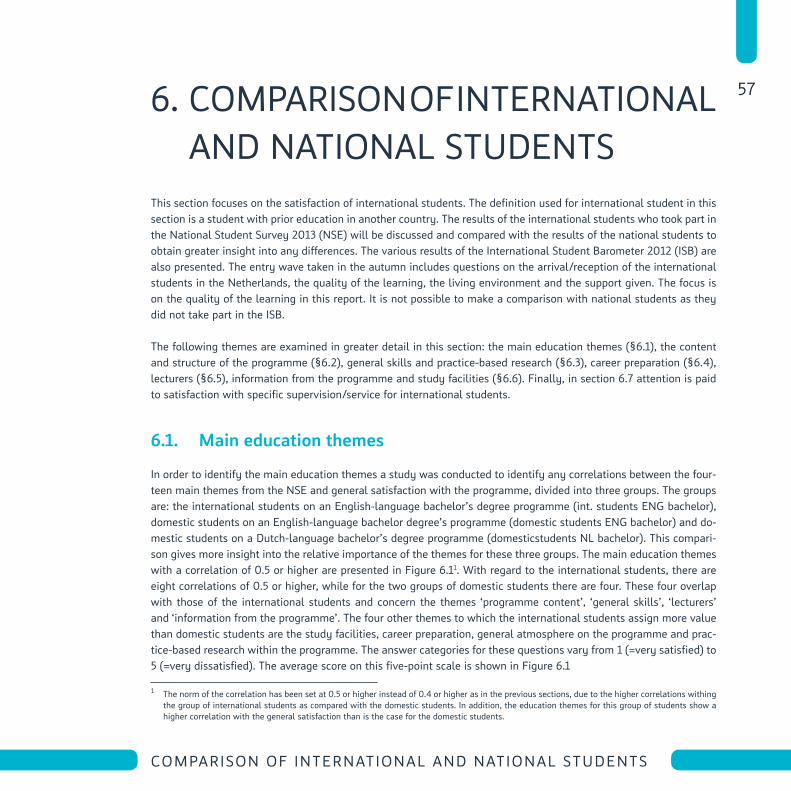
6. COMpARISON OF INTeRNATIONAL ANd NATIONAL STUdeNTS
This section focuses on the satisfaction of international students. The definition used for international student in this section is a student with prior education in another country. The results of the international students who took part in the National Student Survey 2013 (NSe) will be discussed and compared with the results of the national students to obtain greater insight into any differences. The various results of the International Student Barometer 2012 (ISB) are also presented. The entry wave taken in the autumn includes questions on the arrival/reception of the international students in the Netherlands, the quality of the learning, the living environment and the support given. The focus is on the quality of the learning in this report. It is not possible to make a comparison with national students as they did not take part in the ISB.
The following themes are examined in greater detail in this section: the main education themes (§6.1), the content and structure of the programme (§6.2), general skills and practice-based research (§6.3), career preparation (§6.4), lecturers (§6.5), information from the programme and study facilities (§6.6). Finally, in section 6.7 attention is paid to satisfaction with specific supervision/service for international students.
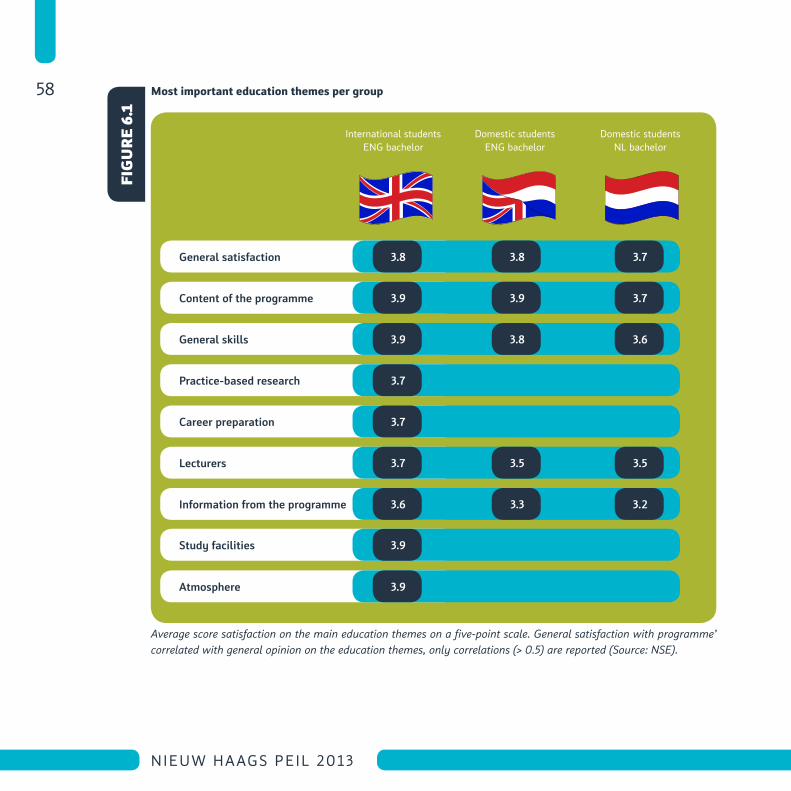
6.1. Main education themes
In order to identify the main education themes a study was conducted to identify any correlations between the four-teen main themes from the NSe and general satisfaction with the programme, divided into three groups. The groups are: the international students on an english-language bachelor’s degree programme (int. students eNg bachelor), domestic students on an english-language bachelor degree’s programme (domestic students eNg bachelor) and do-mestic students on a dutch-language bachelor’s degree programme (domesticstudents NL bachelor). This compari-son gives more insight into the relative importance of the themes for these three groups. The main education themes with a correlation of 0.5 or higher are presented in Figure 6.11. With regard to the international students, there are eight correlations of 0.5 or higher, while for the two groups of domestic students there are four. These four overlap with those of the international students and concern the themes ‘programme content’, ‘general skills’, ‘lecturers’ and ‘information from the programme’. The four other themes to which the international students assign more value than domestic students are the study facilities, career preparation, general atmosphere on the programme and prac-tice-based research within the programme. The answer categories for these questions vary from 1 (=very satisfied) to 5 (=very dissatisfied). The average score on this five-point scale is shown in Figure 6.1
1 The norm of the correlation has been set at 0.5 or higher instead of 0.4 or higher as in the previous sections, due to the higher correlations withing the group of international students as compared with the domestic students. In addition, the education themes for this group of students show a higher correlation with the general satisfaction than is the case for the domestic students.
58
NIEUW HAAGS PEIL 2013
most important education themes per group
Average score satisfaction on the main education themes on a five-point scale. General satisfaction with programme’ correlated with general opinion on the education themes, only correlations (> 0.5) are reported (Source: NSE).
General satisfaction
Content of the programme
Information from the programme
General skills
Lecturers
Practice-based research
Career preparation
Study facilities
Atmosphere
3.8
3.9
3.6
3.9
3.7
3.7
3.7
3.9
3.9
3.8
3.9
3.3
3.8
3.5
3.7
3.7
3.2
3.6
3.5
International students eNg bachelor
domestic students eNg bachelor
domestic students NL bachelor
fig
ure
6.1
59
COMPARISON OF INTERNATIONAL AND NATIONAL STUDENTS
In the further analyses, it was decided only to report on the opinions of the students who are on one of the nine english-language bachelor’s degree programmes2 (see also justification in section 3). A distinction is always made in these analyses between international and domestic students, except in relation to the education themes: the content and structure of the programme, practice-based research and lecturers. For these three themes, a comparison is also made with the group of national students on the dutch-language programmes. This extra division is based on the three performance agreements that were made with the Ministry of education, Culture and Science (see section 4).
6.2. Content and structure of the programme
International students and domestic students on the english-language bachelor’s degree programmes often have similar opinions on the content and structure of the programme (see Table 6.1). Few significant differences were found between these two groups. The only significant differences are apparent in relation to the aspects ‘the work
forms used in your programme’ (61% versus 55%) and ‘the level of your programme’ where domestic students on the english-language bachelor’s degree programmes are more likely to be ‘satisfied/very satisfied’ than international students (68% versus 60%). This is noticeable because international students are more satisfied in relation to other aspects (although not significantly). This gives rise to some questions. do international students expect more from the level of the programme? do they think the level is too high or too low?
We have also seen that international students are most likely to be ‘satisfied/very sa-tisfied’ with the relevance of the content of the programme for current developments (70%), the cohesion between the various parts of the programme (69%) and the degree to which the content meets with the expectations they had of the programme (62%). Students on an english-language bachelor’s degree programme indicate for the first two statements that they are (significantly) more satisfied than domestic students on the dutch-language bachelor’s degree programmes. The international students are the least satisfied with the way the programme follows on from their prior education (53%) and the opportunity offered by the programme to determine
the content themselves (45%, moderate score). This also applies to both groups of domestic students. There are few significant differences between international and domestic students who follow an english-language bachelor’s de-
2 International Financial Management & Control - english Stream public Management - english Stream process & Food Technology International Communication Management - english stream european Studies - english Stream International & european Law - english Stream Industrial design engineering - english Stream Safety and Security Management Studies - english Stream International Business and Management Studies
My program should include additi-onal courses, in which the student has the option of signing up to at-tend these extra courses.
The first year was totally fine in terms of workload and everyone was satisfied. As soon as the se-cond year started, frustration star-ted as well.
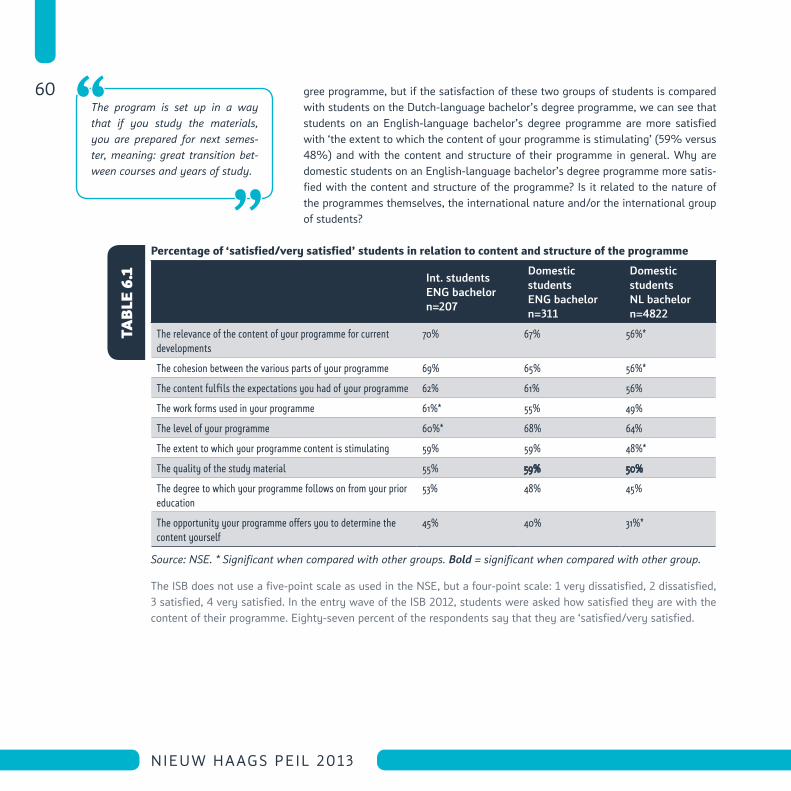
60
NIEUW HAAGS PEIL 2013
gree programme, but if the satisfaction of these two groups of students is compared with students on the dutch-language bachelor’s degree programme, we can see that students on an english-language bachelor’s degree programme are more satisfied with ‘the extent to which the content of your programme is stimulating’ (59% versus 48%) and with the content and structure of their programme in general. Why are domestic students on an english-language bachelor’s degree programme more satis-fied with the content and structure of the programme? Is it related to the nature of the programmes themselves, the international nature and/or the international group of students?
Percentage of ‘satisfied/very satisfied’ students in relation to content and structure of the programme
Int. students ENG bachelorn=207
Domestic students ENG bachelorn=311
Domestic students NL bachelorn=4822
The relevance of the content of your programme for current developments
70% 67% 56%*
The cohesion between the various parts of your programme 69% 65% 56%*
The content fulfils the expectations you had of your programme 62% 61% 56%
The work forms used in your programme 61%* 55% 49%
The level of your programme 60%* 68% 64%
The extent to which your programme content is stimulating 59% 59% 48%*
The quality of the study material 55% 59% 50%
The degree to which your programme follows on from your prior education
53% 48% 45%
The opportunity your programme offers you to determine the content yourself
45% 40% 31%*
Source: NSE. * Significant when compared with other groups. Bold = significant when compared with other group.
The ISB does not use a five-point scale as used in the NSe, but a four-point scale: 1 very dissatisfied, 2 dissatisfied, 3 satisfied, 4 very satisfied. In the entry wave of the ISB 2012, students were asked how satisfied they are with the content of their programme. eighty-seven percent of the respondents say that they are ‘satisfied/very satisfied.
The program is set up in a way that if you study the materials, you are prepared for next semes-ter, meaning: great transition bet-ween courses and years of study.
tabl
e 6.
1
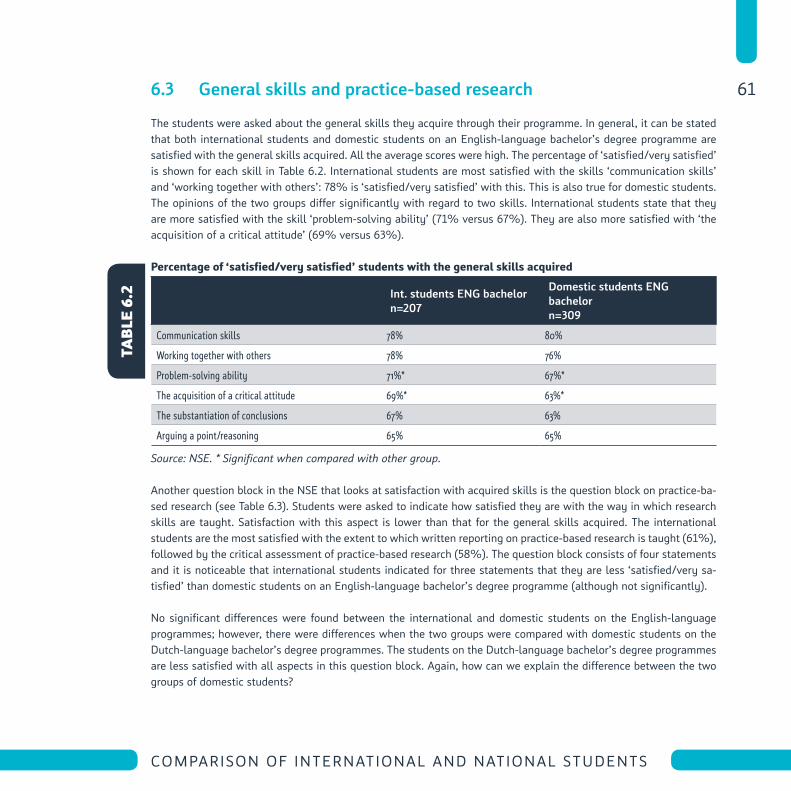
61
COMPARISON OF INTERNATIONAL AND NATIONAL STUDENTS
6.3 General skills and practice-based research
The students were asked about the general skills they acquire through their programme. In general, it can be stated that both international students and domestic students on an english-language bachelor’s degree programme are satisfied with the general skills acquired. All the average scores were high. The percentage of ‘satisfied/very satisfied’ is shown for each skill in Table 6.2. International students are most satisfied with the skills ‘communication skills’ and ‘working together with others’: 78% is ‘satisfied/very satisfied’ with this. This is also true for domestic students. The opinions of the two groups differ significantly with regard to two skills. International students state that they are more satisfied with the skill ‘problem-solving ability’ (71% versus 67%). They are also more satisfied with ‘the acquisition of a critical attitude’ (69% versus 63%).
Percentage of ‘satisfied/very satisfied’ students with the general skills acquired
Int. students ENG bachelorn=207
Domestic students ENG bachelorn=309
Communication skills 78% 80%
Working together with others 78% 76%
Problem-solving ability 71%* 67%*
The acquisition of a critical attitude 69%* 63%*
The substantiation of conclusions 67% 63%
Arguing a point/reasoning 65% 65%
Source: NSE. * Significant when compared with other group.
Another question block in the NSe that looks at satisfaction with acquired skills is the question block on practice-ba-sed research (see Table 6.3). Students were asked to indicate how satisfied they are with the way in which research skills are taught. Satisfaction with this aspect is lower than that for the general skills acquired. The international students are the most satisfied with the extent to which written reporting on practice-based research is taught (61%), followed by the critical assessment of practice-based research (58%). The question block consists of four statements and it is noticeable that international students indicated for three statements that they are less ‘satisfied/very sa-tisfied’ than domestic students on an english-language bachelor’s degree programme (although not significantly).
No significant differences were found between the international and domestic students on the english-language programmes; however, there were differences when the two groups were compared with domestic students on the dutch-language bachelor’s degree programmes. The students on the dutch-language bachelor’s degree programmes are less satisfied with all aspects in this question block. Again, how can we explain the difference between the two groups of domestic students?
tabl
e 6.
2
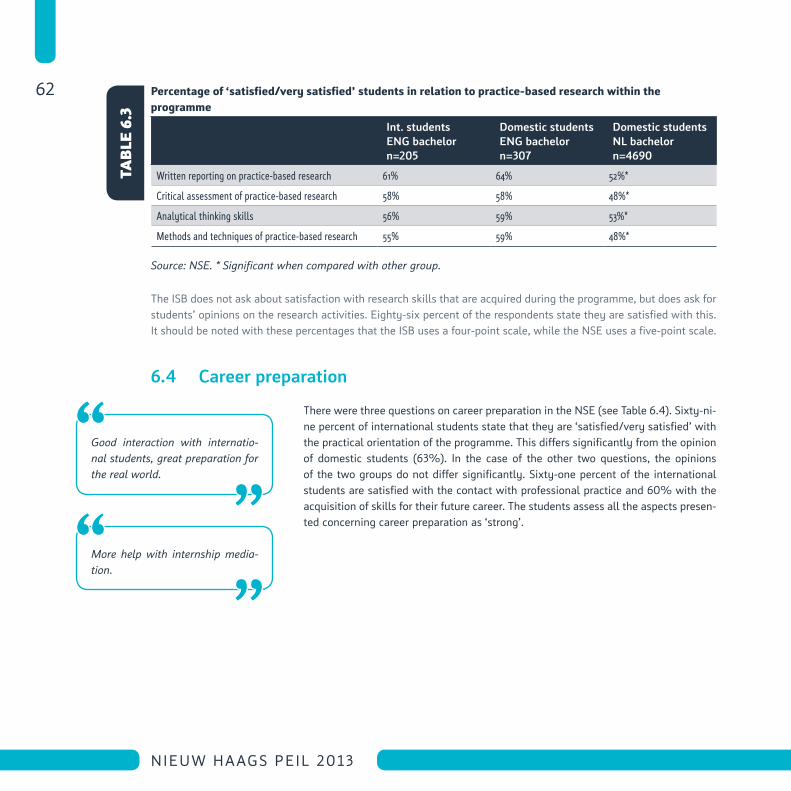
62
NIEUW HAAGS PEIL 2013
Percentage of ‘satisfied/very satisfied’ students in relation to practice-based research within the programme
Int. students ENG bachelorn=205
Domestic students ENG bachelorn=307
Domestic students NL bachelorn=4690
Written reporting on practice-based research 61% 64% 52%*
Critical assessment of practice-based research 58% 58% 48%*
Analytical thinking skills 56% 59% 53%*
Methods and techniques of practice-based research 55% 59% 48%*
Source: NSE. * Significant when compared with other group.
The ISB does not ask about satisfaction with research skills that are acquired during the programme, but does ask for students’ opinions on the research activities. eighty-six percent of the respondents state they are satisfied with this. It should be noted with these percentages that the ISB uses a four-point scale, while the NSe uses a five-point scale.
6.4 Career preparation
There were three questions on career preparation in the NSe (see Table 6.4). Sixty-ni-ne percent of international students state that they are ‘satisfied/very satisfied’ with the practical orientation of the programme. This differs significantly from the opinion of domestic students (63%). In the case of the other two questions, the opinions of the two groups do not differ significantly. Sixty-one percent of the international students are satisfied with the contact with professional practice and 60% with the acquisition of skills for their future career. The students assess all the aspects presen-ted concerning career preparation as ‘strong’.
More help with internship media-tion.
Good interaction with internatio-nal students, great preparation for the real world.
tabl
e 6.
3
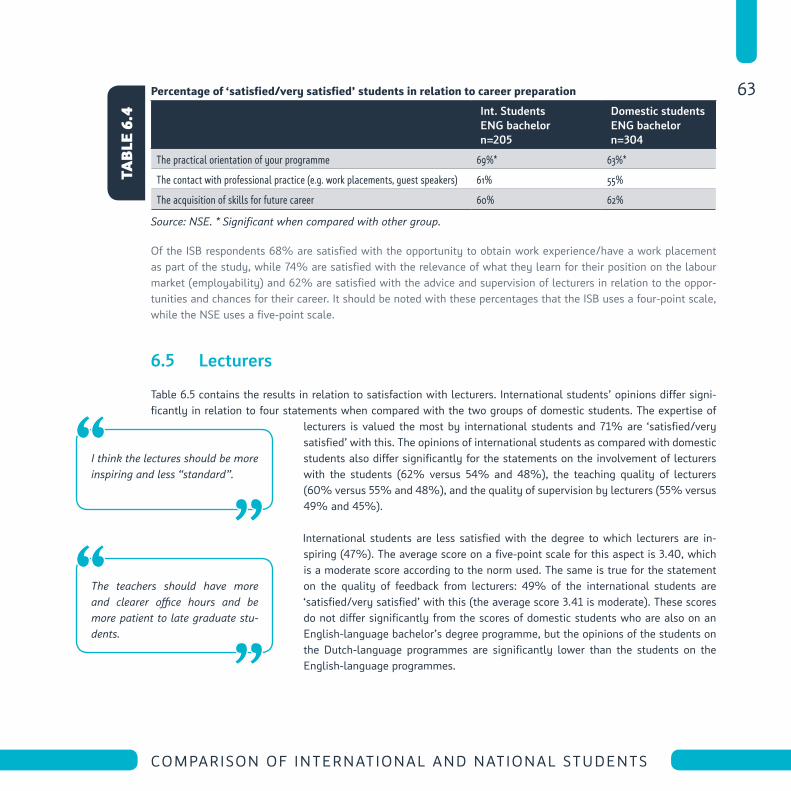
63
COMPARISON OF INTERNATIONAL AND NATIONAL STUDENTS
Percentage of ‘satisfied/very satisfied’ students in relation to career preparation
Int. Students ENG bachelorn=205
Domestic students ENG bachelorn=304
The practical orientation of your programme 69%* 63%*
The contact with professional practice (e.g. work placements, guest speakers) 61% 55%
The acquisition of skills for future career 60% 62%
Source: NSE. * Significant when compared with other group.
Of the ISB respondents 68% are satisfied with the opportunity to obtain work experience/have a work placement as part of the study, while 74% are satisfied with the relevance of what they learn for their position on the labour market (employability) and 62% are satisfied with the advice and supervision of lecturers in relation to the oppor-tunities and chances for their career. It should be noted with these percentages that the ISB uses a four-point scale, while the NSe uses a five-point scale.
6.5 Lecturers
Table 6.5 contains the results in relation to satisfaction with lecturers. International students’ opinions differ signi-ficantly in relation to four statements when compared with the two groups of domestic students. The expertise of
lecturers is valued the most by international students and 71% are ‘satisfied/very satisfied’ with this. The opinions of international students as compared with domestic students also differ significantly for the statements on the involvement of lecturers with the students (62% versus 54% and 48%), the teaching quality of lecturers (60% versus 55% and 48%), and the quality of supervision by lecturers (55% versus 49% and 45%).
International students are less satisfied with the degree to which lecturers are in-spiring (47%). The average score on a five-point scale for this aspect is 3.40, which is a moderate score according to the norm used. The same is true for the statement on the quality of feedback from lecturers: 49% of the international students are ‘satisfied/very satisfied’ with this (the average score 3.41 is moderate). These scores do not differ significantly from the scores of domestic students who are also on an english-language bachelor’s degree programme, but the opinions of the students on the dutch-language programmes are significantly lower than the students on the english-language programmes.
I think the lectures should be more inspiring and less “standard”.
The teachers should have more and clearer office hours and be more patient to late graduate stu-dents.
tabl
e 6.
4
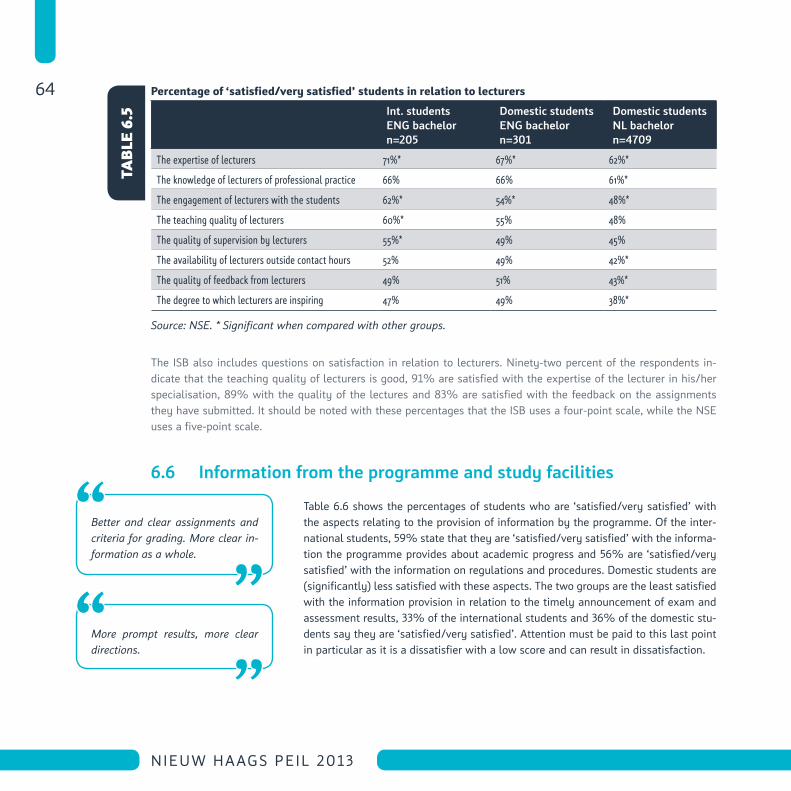
64
NIEUW HAAGS PEIL 2013
Percentage of ‘satisfied/very satisfied’ students in relation to lecturers
Int. students ENG bachelorn=205
Domestic students ENG bachelorn=301
Domestic students NL bachelor n=4709
The expertise of lecturers 71%* 67%* 62%*
The knowledge of lecturers of professional practice 66% 66% 61%*
The engagement of lecturers with the students 62%* 54%* 48%*
The teaching quality of lecturers 60%* 55% 48%
The quality of supervision by lecturers 55%* 49% 45%
The availability of lecturers outside contact hours 52% 49% 42%*
The quality of feedback from lecturers 49% 51% 43%*
The degree to which lecturers are inspiring 47% 49% 38%*
Source: NSE. * Significant when compared with other groups.
The ISB also includes questions on satisfaction in relation to lecturers. Ninety-two percent of the respondents in-dicate that the teaching quality of lecturers is good, 91% are satisfied with the expertise of the lecturer in his/her specialisation, 89% with the quality of the lectures and 83% are satisfied with the feedback on the assignments they have submitted. It should be noted with these percentages that the ISB uses a four-point scale, while the NSe uses a five-point scale.
6.6 Information from the programme and study facilities
Table 6.6 shows the percentages of students who are ‘satisfied/very satisfied’ with the aspects relating to the provision of information by the programme. Of the inter-national students, 59% state that they are ‘satisfied/very satisfied’ with the informa-tion the programme provides about academic progress and 56% are ‘satisfied/very satisfied’ with the information on regulations and procedures. domestic students are (significantly) less satisfied with these aspects. The two groups are the least satisfied with the information provision in relation to the timely announcement of exam and assessment results, 33% of the international students and 36% of the domestic stu-dents say they are ‘satisfied/very satisfied’. Attention must be paid to this last point in particular as it is a dissatisfier with a low score and can result in dissatisfaction.
Better and clear assignments and criteria for grading. More clear in-formation as a whole.
More prompt results, more clear directions.
tabl
e 6.
5
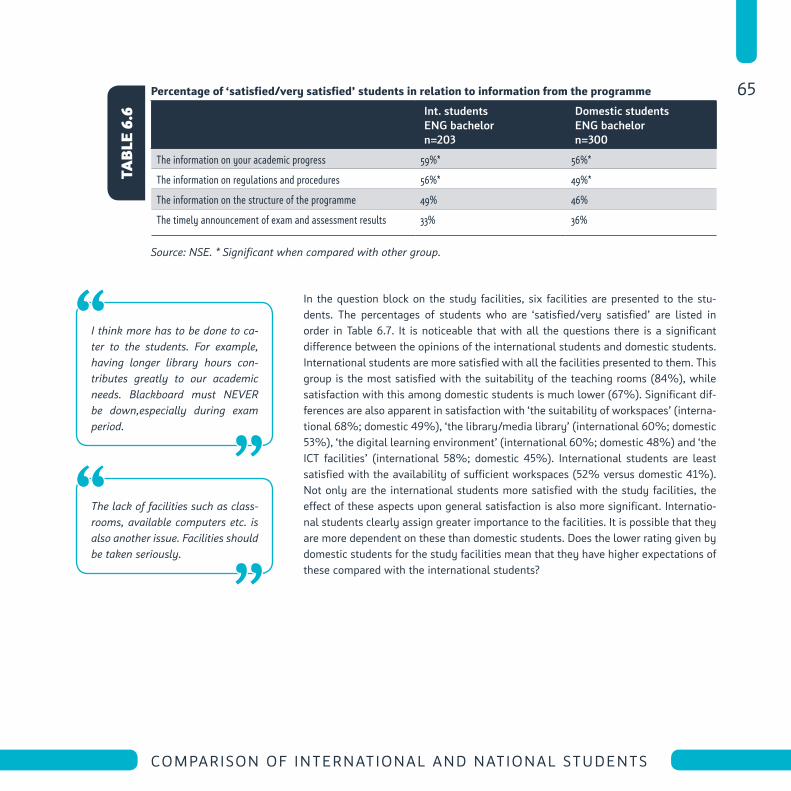
65
COMPARISON OF INTERNATIONAL AND NATIONAL STUDENTS
Percentage of ‘satisfied/very satisfied’ students in relation to information from the programme
Int. students ENG bachelorn=203
Domestic students ENG bachelorn=300
The information on your academic progress 59%* 56%*
The information on regulations and procedures 56%* 49%*
The information on the structure of the programme 49% 46%
The timely announcement of exam and assessment results 33% 36%
Source: NSE. * Significant when compared with other group.
In the question block on the study facilities, six facilities are presented to the stu-dents. The percentages of students who are ‘satisfied/very satisfied’ are listed in order in Table 6.7. It is noticeable that with all the questions there is a significant difference between the opinions of the international students and domestic students. International students are more satisfied with all the facilities presented to them. This group is the most satisfied with the suitability of the teaching rooms (84%), while satisfaction with this among domestic students is much lower (67%). Significant dif-ferences are also apparent in satisfaction with ‘the suitability of workspaces’ (interna-tional 68%; domestic 49%), ‘the library/media library’ (international 60%; domestic 53%), ‘the digital learning environment’ (international 60%; domestic 48%) and ‘the ICT facilities’ (international 58%; domestic 45%). International students are least satisfied with the availability of sufficient workspaces (52% versus domestic 41%). Not only are the international students more satisfied with the study facilities, the effect of these aspects upon general satisfaction is also more significant. Internatio-nal students clearly assign greater importance to the facilities. It is possible that they are more dependent on these than domestic students. does the lower rating given by domestic students for the study facilities mean that they have higher expectations of these compared with the international students?
I think more has to be done to ca-ter to the students. For example, having longer library hours con-tributes greatly to our academic needs. Blackboard must NEVER be down,especially during exam period.
The lack of facilities such as class-rooms, available computers etc. is also another issue. Facilities should be taken seriously.
tabl
e 6.
6
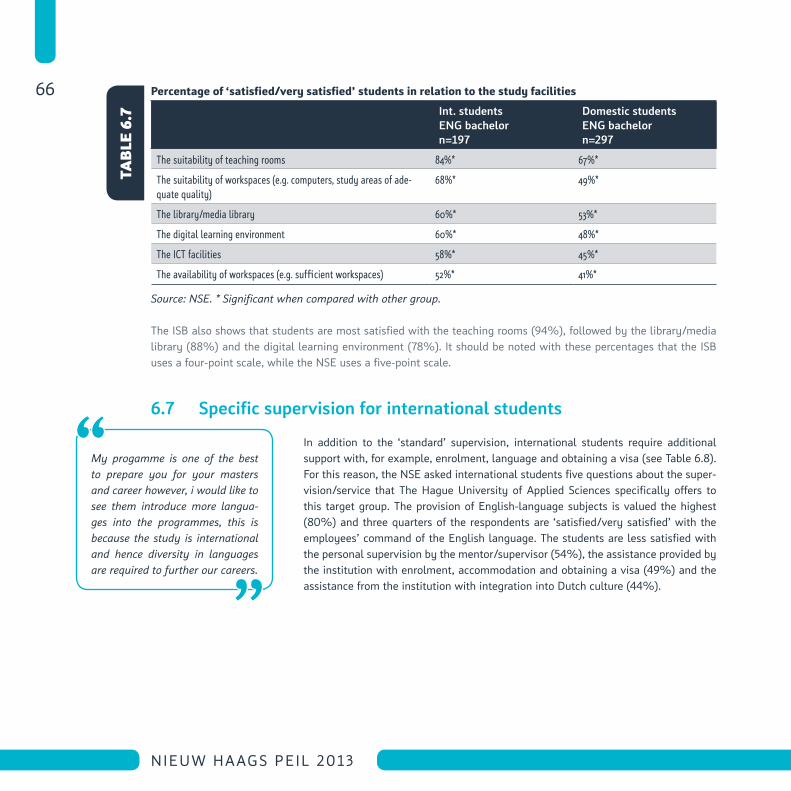
66
NIEUW HAAGS PEIL 2013
Percentage of ‘satisfied/very satisfied’ students in relation to the study facilities
Int. students ENG bachelorn=197
Domestic students ENG bachelorn=297
The suitability of teaching rooms 84%* 67%*
The suitability of workspaces (e.g. computers, study areas of ade-quate quality)
68%* 49%*
The library/media library 60%* 53%*
The digital learning environment 60%* 48%*
The ICT facilities 58%* 45%*
The availability of workspaces (e.g. sufficient workspaces) 52%* 41%*
Source: NSE. * Significant when compared with other group.
The ISB also shows that students are most satisfied with the teaching rooms (94%), followed by the library/media library (88%) and the digital learning environment (78%). It should be noted with these percentages that the ISB uses a four-point scale, while the NSe uses a five-point scale.
6.7 Specific supervision for international students
In addition to the ‘standard’ supervision, international students require additional support with, for example, enrolment, language and obtaining a visa (see Table 6.8). For this reason, the NSe asked international students five questions about the super-vision/service that The Hague University of Applied Sciences specifically offers to this target group. The provision of english-language subjects is valued the highest (80%) and three quarters of the respondents are ‘satisfied/very satisfied’ with the employees’ command of the english language. The students are less satisfied with the personal supervision by the mentor/supervisor (54%), the assistance provided by the institution with enrolment, accommodation and obtaining a visa (49%) and the assistance from the institution with integration into dutch culture (44%).
My progamme is one of the best to prepare you for your masters and career however, i would like to see them introduce more langua-ges into the programmes, this is because the study is international and hence diversity in languages are required to further our careers.
tabl
e 6.
7
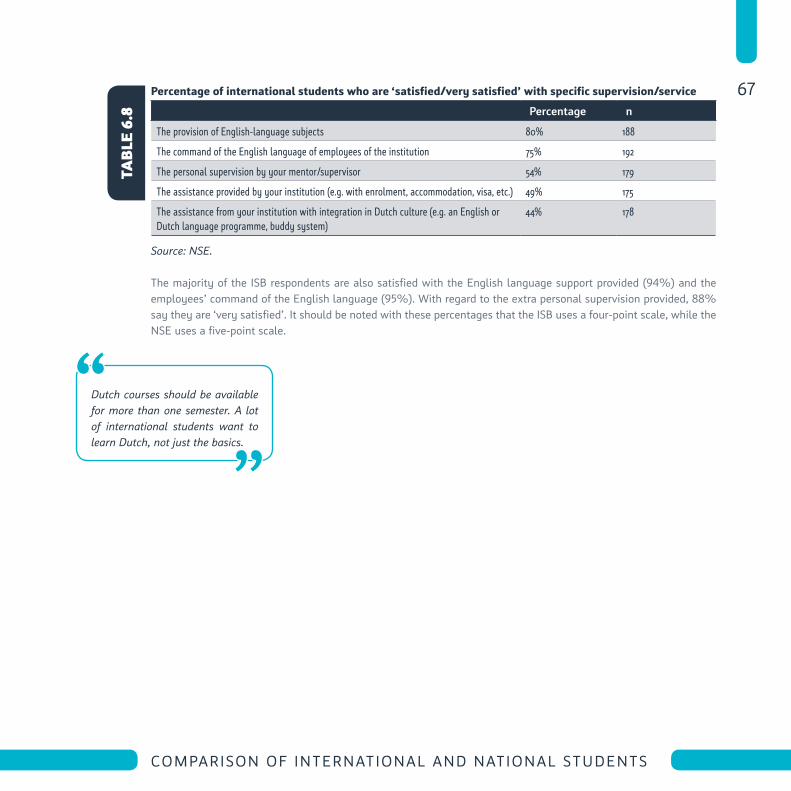
67
COMPARISON OF INTERNATIONAL AND NATIONAL STUDENTS
Percentage of international students who are ‘satisfied/very satisfied’ with specific supervision/service
Percentage n
The provision of English-language subjects 80% 188
The command of the English language of employees of the institution 75% 192
The personal supervision by your mentor/supervisor 54% 179
The assistance provided by your institution (e.g. with enrolment, accommodation, visa, etc.) 49% 175
The assistance from your institution with integration in Dutch culture (e.g. an English or Dutch language programme, buddy system)
44% 178
Source: NSE.
The majority of the ISB respondents are also satisfied with the english language support provided (94%) and the employees’ command of the english language (95%). With regard to the extra personal supervision provided, 88% say they are ‘very satisfied’. It should be noted with these percentages that the ISB uses a four-point scale, while the NSe uses a five-point scale.
Dutch courses should be available for more than one semester. A lot of international students want to learn Dutch, not just the basics.
tabl
e 6.
8
68
NIEUW HAAGS PEIL 2013
thehagueuniversity.com
Edition September 2013 The Hague University of Applied Sciences Communication & Marketing Department Johanna Westerdijkplein 75 2521 EN The Hague [email protected]
Satisfaction with the Hague University of Applied Sciences
National Student Survey • Startmonitor • HBO-monitor • International Student Barometer
nieuw Haags Peil 2013