Embed Size (px)
Citation preview
370041v1
New Zealanders’ Participation in Gambling
Results from the 2012 Health and Lifestyles Survey
December 2013
370041v1
Author: Danny Tu, Research and Evaluation Unit, Health Promotion Agency. Citation: Tu, D 2013. New Zealanders’ Participation in Gambling: Results from the 2012 Health and Lifestyles Survey. Wellington: Health Promotion Agency. PO Box 2142, Wellington, New Zealand ISBN: 978-1-927224-75-5 (online) Any queries regarding this report should be directed to the HPA at the following address: Health Promotion Agency Level 4, ASB House 101 The Terrace Wellington 6011 PO Box 2142 Wellington 6140 New Zealand December 2013 RE001
370041v1
REVIEW:
This report has undergone peer review by Dr Darren Walton, Hannah Booth, Lynzi Armstrong and
Rebecca Gray.
ACKNOWLEDGEMENTS:
CBG Research Ltd carried out the fieldwork for the 2012 Health and Lifestyles Survey The fieldwork for
the 2006/07 Gaming and Betting Activities Survey, 2008 and 2010 Health and Lifestyles Survey were
conducted by the National Research Bureau.
Dr Darren Walton, Hannah Booth, Lynzi Armstrong and Rebecca Gray provided peer review for the
report.
The 2012 Health and Lifestyles Survey gambling questionnaire was created through a collaborative
design process incorporating feedback from the Health Promotion Agency, Department of Internal Affairs
and Ministry of Health.
COPYRIGHT:
The copyright owner of this publication is the HPA. The HPA permits the reproduction of material from
this publication without prior notification, provided that fair representation is made of the material and the
HPA is acknowledged as the source.
3 370041v1
1. EXECUTIVE SUMMARY
The Health and Lifestyles Survey 2012 (HLS) is a nationally representative in-home survey
monitoring health behaviours and attitudes of New Zealand residents aged 15 years and over. The
HLS is managed by the Health Promotion Agency (HPA)1 and collects information relating to the
programme areas the HPA works in, including minimising harm from gambling. The gambling
section of the questionnaire was designed to compare with the 2006/07 Gaming and Betting
Activities Survey, a benchmark survey carried out prior to the Health Sponsorship Council’s
development of a national health promotion programme aiming to reduce gambling harm. The
results were also comparable with the 2008 and 2010 HLS. Some of the characteristics of
particular interest when looking at gambling participation include frequency of participation in
continuous and non-continuous forms of gambling and individual risk of gambling problems, as
defined by an international problem gambling index.
Overall, around five in seven (70.3%) New Zealanders aged 15 years and older (approximately 2.4
million people) had participated in some form of gambling over the past 12 months. The overall
past-year participation rate declined significantly since 2006/2007 from 82.4% to 70.3%, with the
significant reduction occurring among Māori and people of European/Other ethnicity. The reduction
also occurred among all the age groups, in particular young people aged 15 to 24 years who had
the greatest reduction. There was a significant reduction in the following gambling activities: NZ
Lotteries products2, gaming machines at pubs or clubs, and gambling as a fundraising activity,
sweepstakes and making money bets with friends or families. Playing table games at casinos was
the only activity that had increased in 2012, from 3% to 7%, however the proportion of people
engaging in this activity remains relatively low overall. In 2012 the most commonly reported form of
gambling was buying lottery tickets: seven in nine (78.3%) past-year gamblers had purchased a
lottery ticket at least once in the past year. Other gambling activities included: one in six (16.4%)
adults had bought a TAB tickets (track betting or sports betting); one in seven (13.6%) adults had
played gaming machines or pokies at pubs or clubs; one in nine (10.7%) adults had played gaming
machines or pokies at one of the six casinos. In 2012, people who had high household equivalised
incomes– that is, more money to spend per member of the household – were more likely to
participate in gambling than people with low and medium household equivalised incomes. People
aged 25 to44 years and 45 years and over also had a much higher participation rate, compared
with people aged 15 to17 years and 18 to 24 years.
Over the last six years, the decline in the proportion of the people who had gambled in the past
year was mainly due to a significant reduction in infrequent gambling (ie, people who participated
in gambling activities less than once a week). The weekly participation in purchasing of lottery
tickets remained unchanged over time: in 2012 one in five (18.5%) New Zealanders aged 15 years
and older (approximately 634,000 people) had bought a lottery ticket on a weekly basis. Males
were more likely than females, and older people were more likely than younger people to buy
1 The HPA is a New Zealand Crown entity formed in 2012 by the merger of the Health Sponsorship Council (HSC) and
the Alcohol Advisory Council (ALAC). 2 NZ Lotteries products included Lotto, Keno, Bullseye, Strike, Powerball, Big Wednesday, Instant Kiwi and other scratch
tickets.
4 370041v1
lottery tickets at least once a week. The top three most frequent monthly gambling activities were
lottery tickets, Instant Kiwi or scratch tickets and gaming machines at pubs or clubs. Most of the
other gambling activities were participated in on a less than monthly basis. People who had
participated regularly (ie, weekly or more often) in the continuous forms of gambling activities (eg,
pokie machines, sports and racing betting and table games at a casino) were more likely to be at
risk of developing gambling problems. This was particularly true in the case of playing gaming
machines or pokies at pubs or clubs.
The average number of gambling activities participated in during the previous 12 months was two
activities. It has been recognised in previous research that participation in a higher number of
different gambling activities was strongly associated with a higher likelihood of gambling problems.
The HLS results confirm this observation, with at-risk and problem gamblers participating in an
average of four different types of gambling over the previous 12 months. In 2012 the proportions of
people participating in two types of gambling activities was significantly lower than in previous
years, while the proportions of people who participated in one, three or four or more activities have
not changed significantly since 2006.

5 370041v1
CONTENTS
1. Executive Summary ...................................................................................................... 3
Contents ................................................................................................................................ 5
List of tables ........................................................................................................................... 7
List of figures ......................................................................................................................... 8
2. Introduction ................................................................................................................... 9
2.1 The Health and Lifestyles Survey.................................................................................. 9
2.2 Gambling and public health ........................................................................................... 9
3. Survey Design and Method ........................................................................................ 11
3.1 Questionnaire content ................................................................................................. 11
3.2 Data collection ............................................................................................................ 11
3.3 Sample ....................................................................................................................... 11
3.4 Weighting .................................................................................................................... 12
3.5 Sampling errors .......................................................................................................... 12
3.6 Ninety-five percent confidence intervals ...................................................................... 12
3.7 Margin of error ............................................................................................................ 12
3.8 Derived variables ........................................................................................................ 13
3.8.1 Ethnicity .................................................................................................................... 13
3.8.2 Gambling type .......................................................................................................... 13
3.8.3 Neighbourhood socioeconomic deprivation: The New Zealand Index of
Socioeconomic Deprivation 2006 ............................................................................. 14
3.8.4 Household Equivalised Income ................................................................................. 14
3.8.5 Problem Gambling Severity Index (PGSI) ................................................................. 14
3.9 Differences between sub-groups................................................................................. 15
3.10 How to read the tables ................................................................................................ 15
4. Gambling participation ............................................................................................... 17
4.1 Gambling context ........................................................................................................ 17
4.1.1 Objective of report .................................................................................................... 18
4.2 Type of gambling activities done in the previous twelve months.................................. 19
4.2.1 Past-Year Gambling Participation ............................................................................. 19
4.2.2 Comparison with previous years: Past-Year Overall Gambling Participation rate ...... 20
4.2.3 Participation in each individual gambling activity....................................................... 23
6 370041v1
4.2.4 Profile of past-year gamblers .................................................................................... 25
4.2.5 Comparison with previous years: gambling activities participated in during previous 12
months ..................................................................................................................... 28
4.3 Frequency of participation in gambling activities, 2012 ............................................... 30
4.3.1 Comparison with previous years: Frequency of engaging in gambling activities ....... 32
4.4 Participation in continuous and non-continuous forms of gambling ............................. 35
4.4.1 Gambling participation type, 2012 ............................................................................ 35
4.4.2 Comparison with previous years: gambling participation types ................................. 39
4.4.3 Frequency of participation by demographics: Lotto, Big Wednesday and Powerball
tickets 40
4.4.4 Frequency of gambling participation by demographics: Betting on horse or dog races
or sports events ...................................................................................................... 42
4.4.5 Frequency of gambling participation by demographics: Buying Instant Kiwi or scratch
tickets 44
4.4.6 Frequency of gambling participation by demographics: Playing gaming machines or
pokies at pubs or clubs ............................................................................................ 46
4.4.7 Problem gambling risk, by monthly participation in four common forms of gambling
activity 48
4.4.8 Problem gambling risk, by gambling participation frequency ..................................... 49
4.5 Number of activities taken part in during the previous 12 months................................ 50
4.5.1 Number of gambling activities, 2012 ......................................................................... 50
4.5.2 Comparison with previous years: number of gambling activities participated in during
previous 12 months .................................................................................................. 53
References ......................................................................................................................... 54
7 370041v1
LIST OF TABLES
Table 1: Overview of margin of error for gambling activities ................................................. 13
Table 2: Gambling expenditure in the four main sectors, 2006 - 2012 .................................. 17
Table 3: Past-year gambling participation, total population aged 15 years and over
(Unadjusted prevalence) ........................................................................................ 19
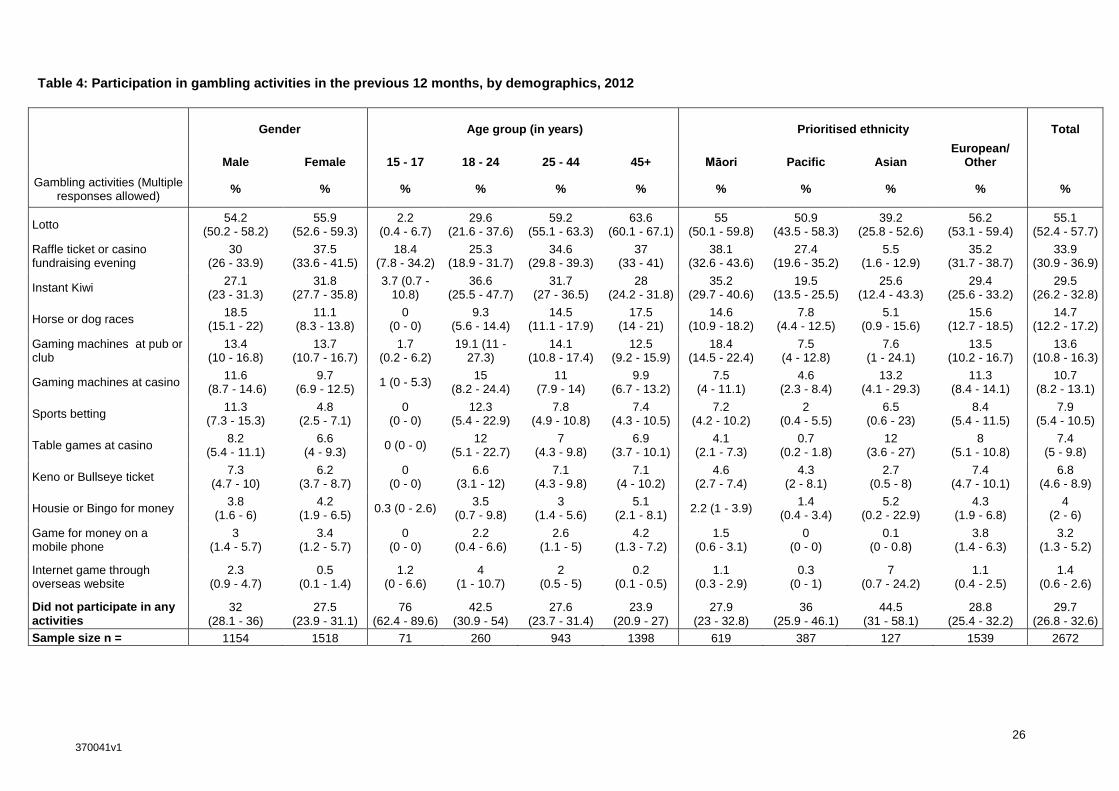
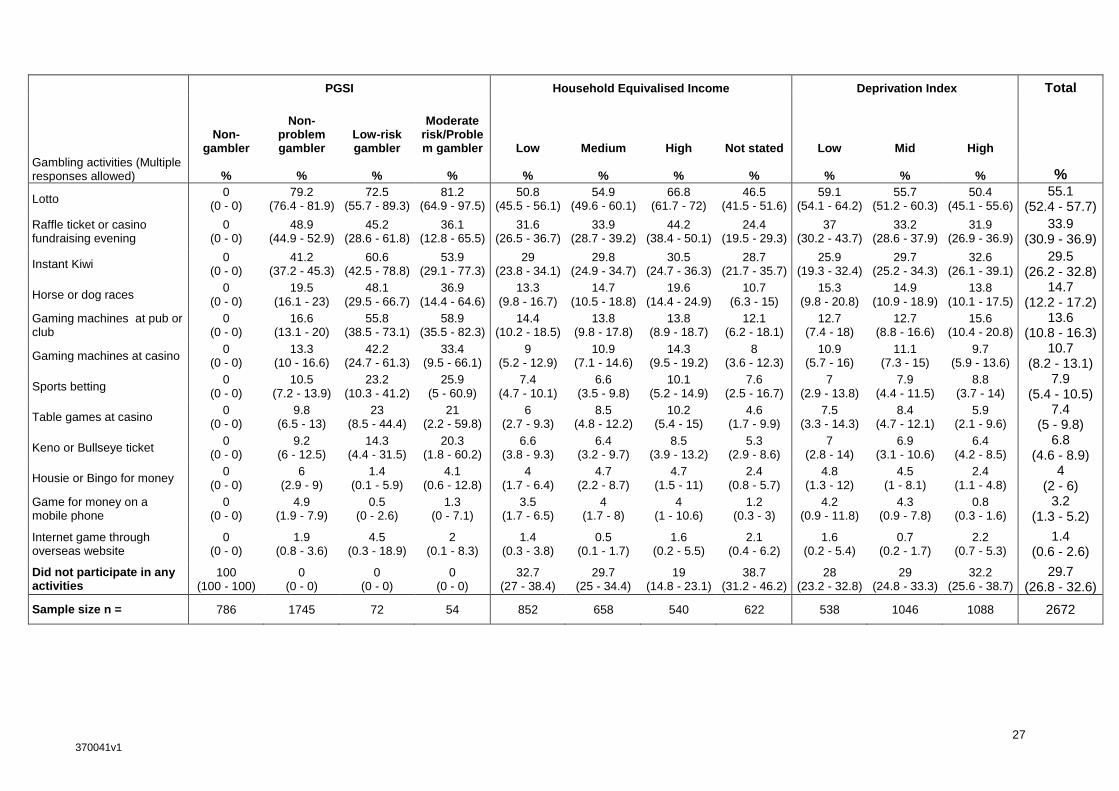
Table 4: Participation in gambling activities in the previous 12 months, by demographics,
2012 ....................................................................................................................... 26
Table 5: Frequency of participation in gambling activities, 2006/07, 2008, 2010, 2012 ........ 33
Table 6: Participation in continuous and non-continuous forms of gambling, total population
aged 15 years and over (unadjusted prevalence) ................................................... 35
Table 7: Gambling participation type, by demographics, 2012 ............................................. 37
Table 8: Frequency of buying Lottery tickets, by demographics, 2012 ................................. 40
Table 9: Frequency of betting on horse or dog races or sports events, by demographics,
2012 ....................................................................................................................... 42
Table 10: Frequency of buying Instant Kiwi or scratch tickets, by demographics, 2012 ........ 44
Table 11: Frequency of playing pokie machines in pubs or clubs, by demographics, 2012 .. 46
Table 12: Risk of problem gambling, by monthly participation in playing pokies in pubs or
clubs, sports or racing betting, buying lottery tickets and scratch tickets, 2012 ....... 48
Table 13: Risk of problem gambling, by gambling participation frequency, 2012 .................. 49
Table 14: Number of gambling activities participated in during last 12 months, total
population aged 15 years and over (unadjusted prevalence), 2012 ........................ 50
Table 15: Number of gambling activities taken part in during previous 12 months, by
demographics, 2012 ............................................................................................... 51

8 370041v1
LIST OF FIGURES
Figure 1: Past-year gambling participation prevalence rate, 2006/2007, 2008, 2010, 2012 .. 20
Figure 2: Past-year gambling participation prevalence rate by ethnicity, 2006/2007, 2008,
2010, 2012 ............................................................................................................. 21
Figure 3: Past-year gambling participation prevalence rate by age group, 2006/2007, 2008,
2010, 2012 ............................................................................................................. 22
Figure 4: Gambling activities participated in during the previous 12 months, 2012 ............... 24
Figure 5: Past-year gambling participation by type of activity, 2006/07, 2008, 2010, 2012 ... 29
Figure 6: Frequency of participation in gambling activities, among those who had done them
in the previous twelve months, 2012 ...................................................................... 31
Figure 7: Gambling participation types, 2006/07, 2008, 2010 and 2012 ............................... 39
Figure 8: Number of gambling activities participated in, 2006/07, 2008, 2010 and 2012 ...... 53

9 370041v1
2. INTRODUCTION
2.1 THE HEALTH AND LIFESTYLES SURVEY
The Health and Lifestyles Survey (HLS) is a monitor of the health behaviour and attitudes of New
Zealand adults aged 15 years and over. The HLS is managed by the HPA and collects information
relating to the programme areas the HPA works in, including minimising harm from gambling. The
HLS is carried out every two years, with the first HLS carried out in 2008.
Prior to the 2008 HLS, the Health Sponsorship Council (which later became part of the HPA)
undertook a survey to benchmark people’s opinion, knowledge and behaviour relating to gambling.
This was called the Gaming and Betting Activities Survey (GBAS) and was carried out from
December 2006 to May 2007.
Each of these surveys have included between 1,600 and 3,000 adults (aged 15 years and over).
Details of the procedures followed to ensure these surveys produced high-quality and robust data
can be found in the related methodology reports. These can be accessed at
http://www.hpa.org.nz/research-library/research-publications
The 2012 HLS included questions relating to tobacco control, healthy eating and sun safety. The
2012 HLS included a comprehensive set of items relating to minimising harm from gambling, to
enable comparisons with measures from the 2006/07 GBAS and the two previous HLSs.
This report presents descriptive results showing participation in gambling activities according to the
2012 HLS. Comparable data have been included from the GBAS, the 2008 HLS and 2010 HLS,
where this is possible.
2.2 GAMBLING AND PUBLIC HEALTH
Gambling in New Zealand is regulated by the Gambling Act 2003. Preventing and minimising the
harm caused by gambling is one of the purposes of the Act.
The Ministry of Health is responsible, under the Act, for the prevention and treatment of problem
gambling. As part of the Ministry’s strategy, the HPA has been contracted to deliver a programme
that contributes to the promotion of public health by preventing and minimising the harm from
gambling.
The HPA’s programme includes a mass media campaign, development of resources to support
public health activities and a research and evaluation component. The mass media campaign
prompts New Zealanders to be aware of the broad impacts of gambling harm on individuals,
families and communities and provides knowledge and tools to enable people to take action to
prevent and minimise this harm. The campaign activities were first launched in 2007 and the fourth
phase will be launched in 2014.
Results from the GBAS, HLS and other surveys can be used to monitor and evaluate changes and
developments in community awareness of gambling harms. These measures can also monitor the

10 370041v1
degree to which people are involved in the types of individual, family and community behaviours
that the HPA’s programme is promoting.
11 370041v1
3. SURVEY DESIGN AND METHOD
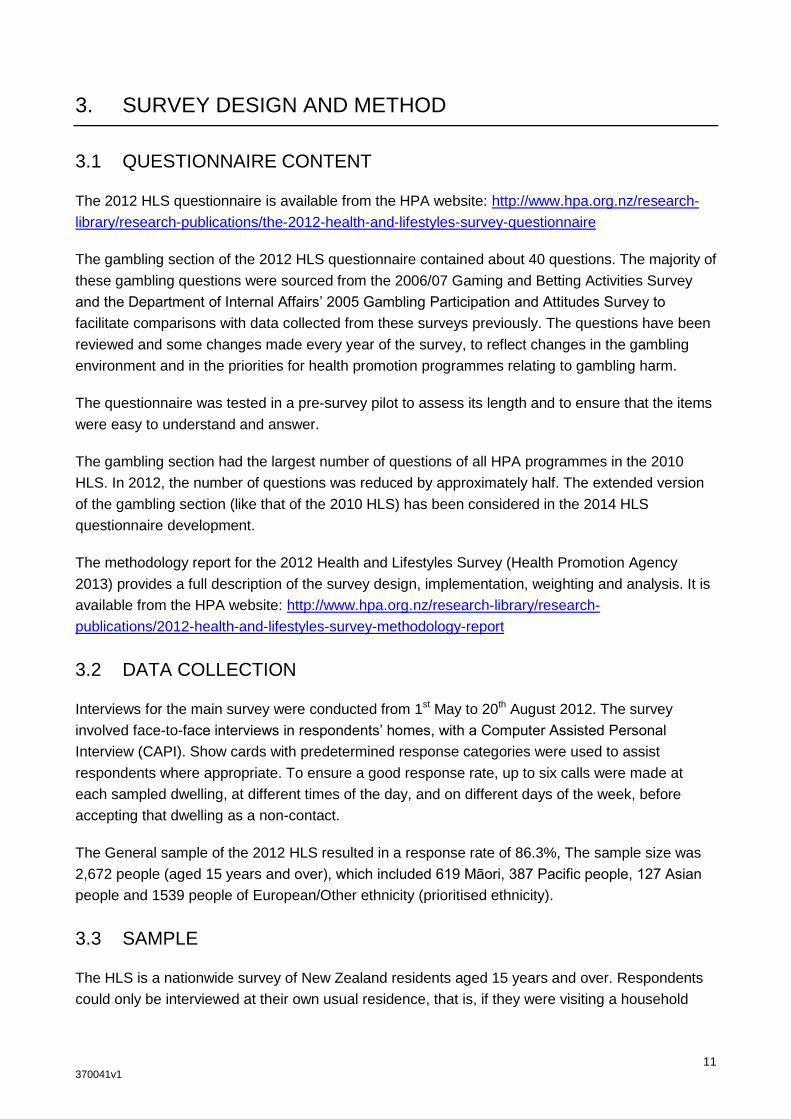
3.1 QUESTIONNAIRE CONTENT
The 2012 HLS questionnaire is available from the HPA website: http://www.hpa.org.nz/research-
library/research-publications/the-2012-health-and-lifestyles-survey-questionnaire
The gambling section of the 2012 HLS questionnaire contained about 40 questions. The majority of
these gambling questions were sourced from the 2006/07 Gaming and Betting Activities Survey
and the Department of Internal Affairs’ 2005 Gambling Participation and Attitudes Survey to
facilitate comparisons with data collected from these surveys previously. The questions have been
reviewed and some changes made every year of the survey, to reflect changes in the gambling
environment and in the priorities for health promotion programmes relating to gambling harm.
The questionnaire was tested in a pre-survey pilot to assess its length and to ensure that the items
were easy to understand and answer.
The gambling section had the largest number of questions of all HPA programmes in the 2010
HLS. In 2012, the number of questions was reduced by approximately half. The extended version
of the gambling section (like that of the 2010 HLS) has been considered in the 2014 HLS
questionnaire development.
The methodology report for the 2012 Health and Lifestyles Survey (Health Promotion Agency
2013) provides a full description of the survey design, implementation, weighting and analysis. It is
available from the HPA website: http://www.hpa.org.nz/research-library/research-
publications/2012-health-and-lifestyles-survey-methodology-report
3.2 DATA COLLECTION
Interviews for the main survey were conducted from 1st May to 20th August 2012. The survey
involved face-to-face interviews in respondents’ homes, with a Computer Assisted Personal
Interview (CAPI). Show cards with predetermined response categories were used to assist
respondents where appropriate. To ensure a good response rate, up to six calls were made at
each sampled dwelling, at different times of the day, and on different days of the week, before
accepting that dwelling as a non-contact.
The General sample of the 2012 HLS resulted in a response rate of 86.3%, The sample size was
2,672 people (aged 15 years and over), which included 619 Māori, 387 Pacific people, 127 Asian
people and 1539 people of European/Other ethnicity (prioritised ethnicity).
3.3 SAMPLE
The HLS is a nationwide survey of New Zealand residents aged 15 years and over. Respondents
could only be interviewed at their own usual residence, that is, if they were visiting a household
12 370041v1
that was selected for inclusion in the HLS they could not be interviewed as part of that household.
This process ensured that people did not have a chance of being counted twice.
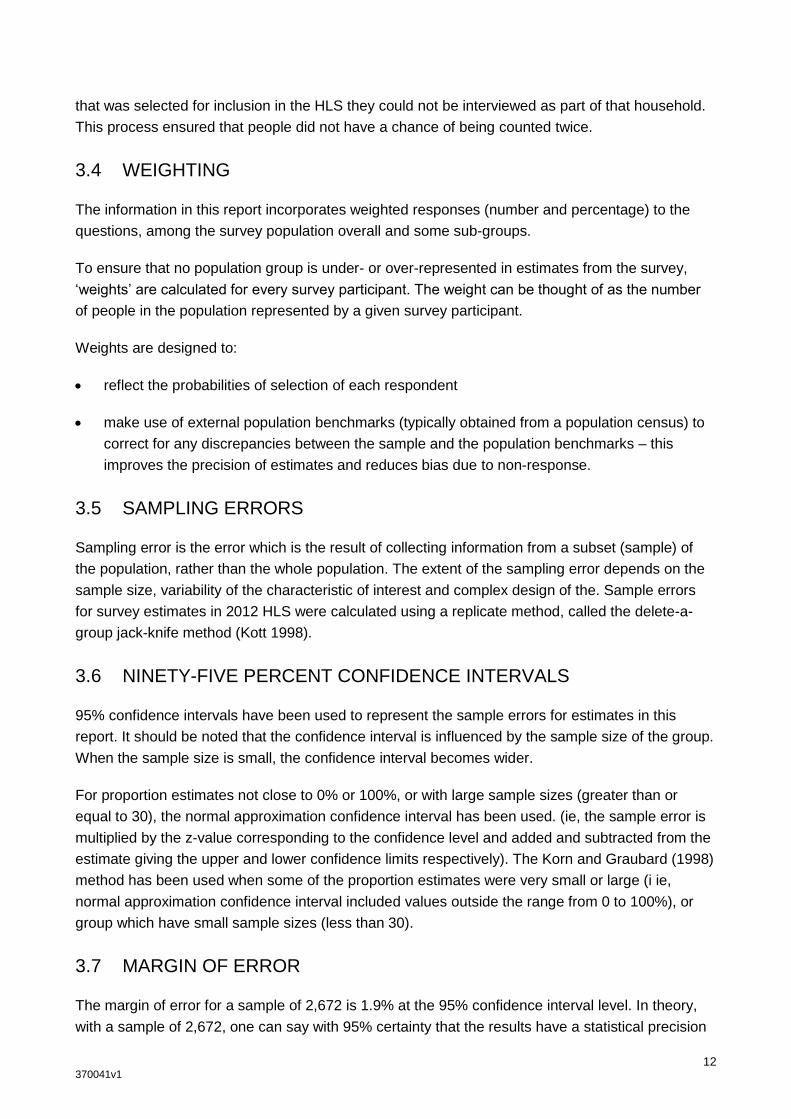
3.4 WEIGHTING
The information in this report incorporates weighted responses (number and percentage) to the
questions, among the survey population overall and some sub-groups.
To ensure that no population group is under- or over-represented in estimates from the survey,
‘weights’ are calculated for every survey participant. The weight can be thought of as the number
of people in the population represented by a given survey participant.
Weights are designed to:
reflect the probabilities of selection of each respondent
make use of external population benchmarks (typically obtained from a population census) to
correct for any discrepancies between the sample and the population benchmarks – this
improves the precision of estimates and reduces bias due to non-response.
3.5 SAMPLING ERRORS
Sampling error is the error which is the result of collecting information from a subset (sample) of
the population, rather than the whole population. The extent of the sampling error depends on the
sample size, variability of the characteristic of interest and complex design of the. Sample errors
for survey estimates in 2012 HLS were calculated using a replicate method, called the delete-a-
group jack-knife method (Kott 1998).
3.6 NINETY-FIVE PERCENT CONFIDENCE INTERVALS
95% confidence intervals have been used to represent the sample errors for estimates in this
report. It should be noted that the confidence interval is influenced by the sample size of the group.
When the sample size is small, the confidence interval becomes wider.
For proportion estimates not close to 0% or 100%, or with large sample sizes (greater than or
equal to 30), the normal approximation confidence interval has been used. (ie, the sample error is
multiplied by the z-value corresponding to the confidence level and added and subtracted from the
estimate giving the upper and lower confidence limits respectively). The Korn and Graubard (1998)
method has been used when some of the proportion estimates were very small or large (i ie,
normal approximation confidence interval included values outside the range from 0 to 100%), or
group which have small sample sizes (less than 30).
3.7 MARGIN OF ERROR
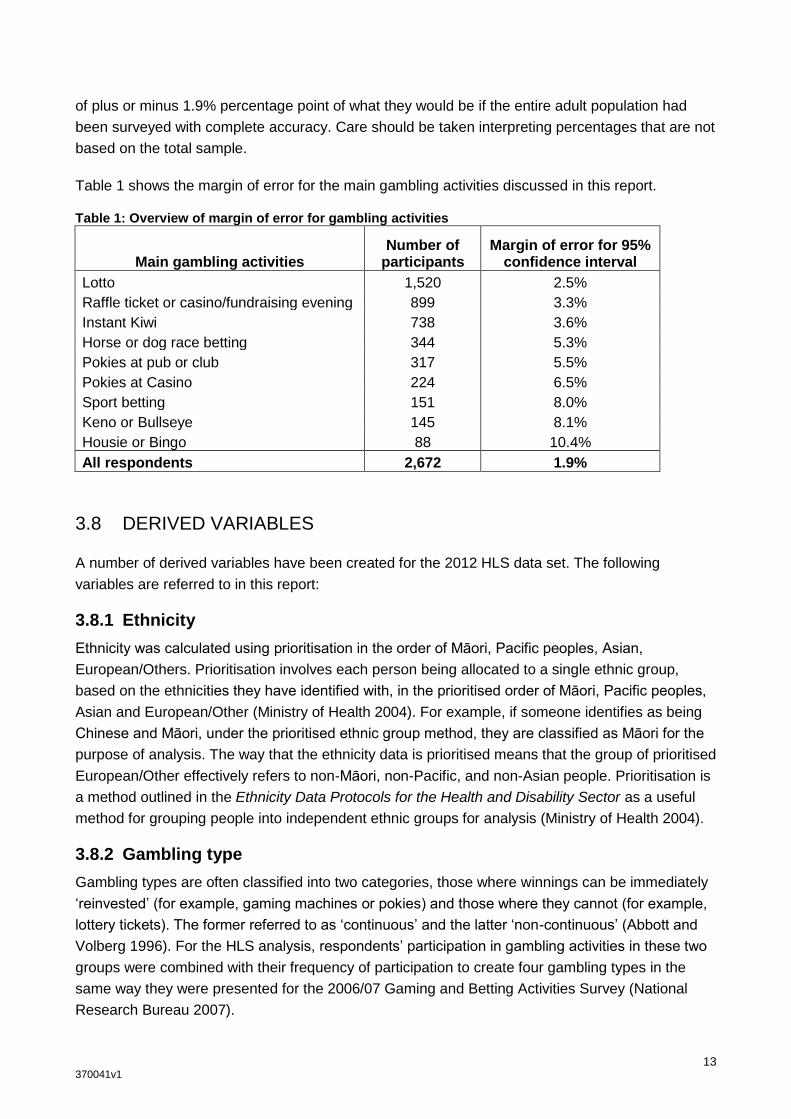
The margin of error for a sample of 2,672 is 1.9% at the 95% confidence interval level. In theory,
with a sample of 2,672, one can say with 95% certainty that the results have a statistical precision
13 370041v1
of plus or minus 1.9% percentage point of what they would be if the entire adult population had
been surveyed with complete accuracy. Care should be taken interpreting percentages that are not
based on the total sample.
Table 1 shows the margin of error for the main gambling activities discussed in this report.
Table 1: Overview of margin of error for gambling activities
Main gambling activities Number of
participants Margin of error for 95%
confidence interval
Lotto 1,520 2.5%
Raffle ticket or casino/fundraising evening 899 3.3%
Instant Kiwi 738 3.6%
Horse or dog race betting 344 5.3%
Pokies at pub or club 317 5.5%
Pokies at Casino 224 6.5%
Sport betting 151 8.0%
Keno or Bullseye 145 8.1%
Housie or Bingo 88 10.4%
All respondents 2,672 1.9%
3.8 DERIVED VARIABLES
A number of derived variables have been created for the 2012 HLS data set. The following
variables are referred to in this report:
3.8.1 Ethnicity
Ethnicity was calculated using prioritisation in the order of Māori, Pacific peoples, Asian,
European/Others. Prioritisation involves each person being allocated to a single ethnic group,
based on the ethnicities they have identified with, in the prioritised order of Māori, Pacific peoples,
Asian and European/Other (Ministry of Health 2004). For example, if someone identifies as being
Chinese and Māori, under the prioritised ethnic group method, they are classified as Māori for the
purpose of analysis. The way that the ethnicity data is prioritised means that the group of prioritised
European/Other effectively refers to non-Māori, non-Pacific, and non-Asian people. Prioritisation is
a method outlined in the Ethnicity Data Protocols for the Health and Disability Sector as a useful
method for grouping people into independent ethnic groups for analysis (Ministry of Health 2004).
3.8.2 Gambling type
Gambling types are often classified into two categories, those where winnings can be immediately
‘reinvested’ (for example, gaming machines or pokies) and those where they cannot (for example,
lottery tickets). The former referred to as ‘continuous’ and the latter ‘non-continuous’ (Abbott and
Volberg 1996). For the HLS analysis, respondents’ participation in gambling activities in these two
groups were combined with their frequency of participation to create four gambling types in the
same way they were presented for the 2006/07 Gaming and Betting Activities Survey (National
Research Bureau 2007).
14 370041v1
Non gamblers: did not participate in any gambling activities in the last 12 months.
Infrequent gamblers: participated in any gambling activities less than once a week.
Frequent, non-continuous gamblers: participated weekly or more often in non-continuous3
forms of gambling.
Frequent, continuous gamblers: participated weekly or more often in continuous4 forms of
gambling.
3.8.3 Neighbourhood socioeconomic deprivation: The New Zealand Index of
Socioeconomic Deprivation 2006
The New Zealand Index of Socioeconomic Deprivation 2006 (NZDep2006) has been linked to the
2012 HLS as a measure of neighbourhood socioeconomic deprivation and a proxy for individual
socioeconomic position. The NZDep2006 was created using nine variables5 from the 2006 Census
data, with a decile value calculated for each meshblock (Salmond et al. 2007). For some analyses
of the 2012 HLS, these deciles have been grouped, so that deciles 1–3 are referred to as low
deprivation, 4-7 as moderate (or mid) deprivation, and 8-10 as high deprivation.
3.8.4 Household Equivalised Income
Respondents were asked to choose an income range that represented their total household
income from all sources before tax in the previous 12 months. Household income by itself is not
very useful, as a two-person household with a total household income of $100,000 is likely to be
quite different in many characteristics from that of a six-person household with a total household
income of $100,000. To account for these differences, equivalised household incomes were
calculated using a revised Jensen Index (Jensen 1988). The revised Jensen Index is a recognised
equivalisation index used within New Zealand (Blakely 2002, Ministry of Health 2010) that takes
into account the number of adults, the number of children (younger than 18-years-old) and the
ages of the children living in the household.
3.8.5 Problem Gambling Severity Index (PGSI)
In addition to the term ‘problem gambler’, the terms ‘low-risk’ and ‘moderate-risk’ are also used to
describe a person’s gambling behaviour.
The Problem Gambling Severity Index (PGSI) contains nine questions that are strong predictors of
gambling harm (eg, feeling guilty about gambling, having financial difficulties, betting more than
one can afford) (Ferris and Wynne 2001).
Respondents are asked whether they have experienced these signs of harm caused by gambling
and, if so, whether this happened “sometimes, most of the time or almost always”. They are
3 Non-continuous forms of gambling include lottery games, going to casino evenings/buying raffle tickets for fundraising,
participating in sweepstakes, making bets with family/friends and other gambling activities. 4 Continuous forms of gambling include playing electronic gaming (pokie) machines, betting on horse or dog races, or
sports events, table games at casinos, housie and bingo, mobile phone games for money, online activities for money or prizes through an overseas website. 5 Receiving a means-tested benefit, low household income, not owning the home you live in, single-parent family,
unemployment, no school qualifications, household overcrowding, no access to a telephone and no access to a car (Salmond et al.2007).
15 370041v1
allocated from one point for “sometimes” to three points for “almost always”, and can therefore be
allocated up to 27 points. Respondents were then classified into the following categories:
1. Non-gamblers (those who did not answer yes to any of the questions about participation in gambling in the last 12 months),
2. Non-problem gamblers (those who had gambled, but answered “no” to all the PGSI questions about experiencing harm),
3. Low-risk gamblers (who got 1 or 2 points according to the PGSI),
4. Moderate-risk gamblers (who got 3-7 points)
5. Problem gamblers (who got 8 or more points).
Because the number of people who were classified as problem gamblers (n=14) was too small to
be analysed statistically, moderate-risk and problem gamblers have been combined into one group
for the tables in this report. In addition, in some cases low-risk and moderate-risk gambler have
been combined into a single group and are referred to as at-risk gamblers.
3.9 DIFFERENCES BETWEEN SUB-GROUPS
Differences between sub-groups are noted as “more likely/less likely” when they are proportionally
large in relation to the figures described. For ease of reading, terms such as “significant” or
“approaching significance” have been left out of the text, however, the differences reported have
been assessed for significance using appropriate statistical tests.
When the number of respondents in a sub-group is small (ie, less than 30), any differences
between this group and others is not commented on, because results are subject to a very wide
margin of error.
Some differences in the tables that appear interesting but not significant have not been reported.
While this report cannot cover all differences that may be of interest, the HLS dataset may be
made available to other groups for performing more statistical investigation.
3.10 HOW TO READ THE TABLES
The figures presented in tables and graphs in this report may not sum to 100% due to rounding.
There are also a number of questions – for instance, in this report, the question about participation
in different types of gambling – to which respondents could provide multiple responses.
When a space on the table is marked with “-”, this means that respondents in that year were not
asked, or did not provide any response to, that particular option.
The numbers in the tables about participation should be read as the proportion of the people of a
certain demographic group (shown in the top row) who have participated in a certain gambling
activity (shown in the leftmost column). The sample size for each demographic subgroup (that is,
the number of respondents in that group) is shown at the bottom of each table.
For example, in this compressed excerpt from the first table:

16 370041v1
Table 4: Participation in gambling activities in the previous 12 months, 2012, by demographics
Gender Age group (in years) Total
Male Female 15 - 17 18 - 24 25 - 44 45+ Gambling activities (Multiple responses allowed)
% % % % % % %
Lotto 54.2 (50.2 - 58.2)
55.9 (52.6 - 59.3)
2.2 (0.4 - 6.7)
29.6 (21.6 - 37.6)
59.2 (55.1 - 63.3)
63.6 (60.1 - 67.1)
55.1 (52.4 - 57.7)
Did not participate in any activities
32 (28.1 - 36)
27.5 (23.9 - 31.1)
76 (62.4 - 89.6)
42.5 (30.9 - 54)
27.6 (23.7 - 31.4)
23.9 (20.9 - 27)
29.7 (26.8 - 32.6)
Sample size n = 1154 1518 71 260 943 1398 2672
The total sample size is 2672, we can see that of the 1154 males interviewed (shown in the “sample size n=” line under “male” demographic),
54.2% (95% Confidence interval: 50.2 - 58.2) had bought a lottery ticket. Overall, 55.1% (52.4 - 57.7) of New Zealanders aged 15 years and over
had bought a lottery ticket, but among those aged 45 or over, 63.6% (60.1 - 67.1) had bought a lottery ticket. 76.0% (62.4 - 89.6) of New
Zealanders aged 15-17 year had not participated in any gambling activities. Overall, only 29.7% (26.8 - 32.6) had not participated in any gambling
activities.
In order to make a statement about the results in the table, we would first look at the group of interest in the top row (“Of those aged 45 and over”)
then look down the page from this line to the percentage shown “63.6 (60.1 - 67.1)” on the horizontal line corresponding to the activity of interest
(“Lotto”) and finally the title of the table, for further context (“in the previous 12 months”).
17 370041v1
4. GAMBLING PARTICIPATION
4.1 GAMBLING CONTEXT
This report presents information about the different types of gambling that New Zealanders have
participated in during the previous twelve months and how often they have participated in these
different types of gambling.
Gambling activities in New Zealand are classified by the Gambling Act 2003 according to the
amount of money spent and the risk of problem gambling associated with each activity. Class 1
represents low-stake, low-risk gambling while Class 4 represents the highest-risk forms of
gambling, and is subject to strict licensing criteria. Casino operations and New Zealand Lotteries
Commission lotteries are treated as separate classes (DIA 2010a).
The only organisations that are able to conduct remote interactive gambling (such as gambling
over the internet) within New Zealand are the New Zealand Racing Board and the New Zealand
Lotteries Commission. While it is illegal to advertise overseas gambling in New Zealand, it is not
illegal to participate in gambling on an overseas-based website or to gamble on overseas
competitions and games.
More information about gambling regulation in New Zealand can be accessed at the Department of
Internal Affairs: http://www.dia.govt.nz
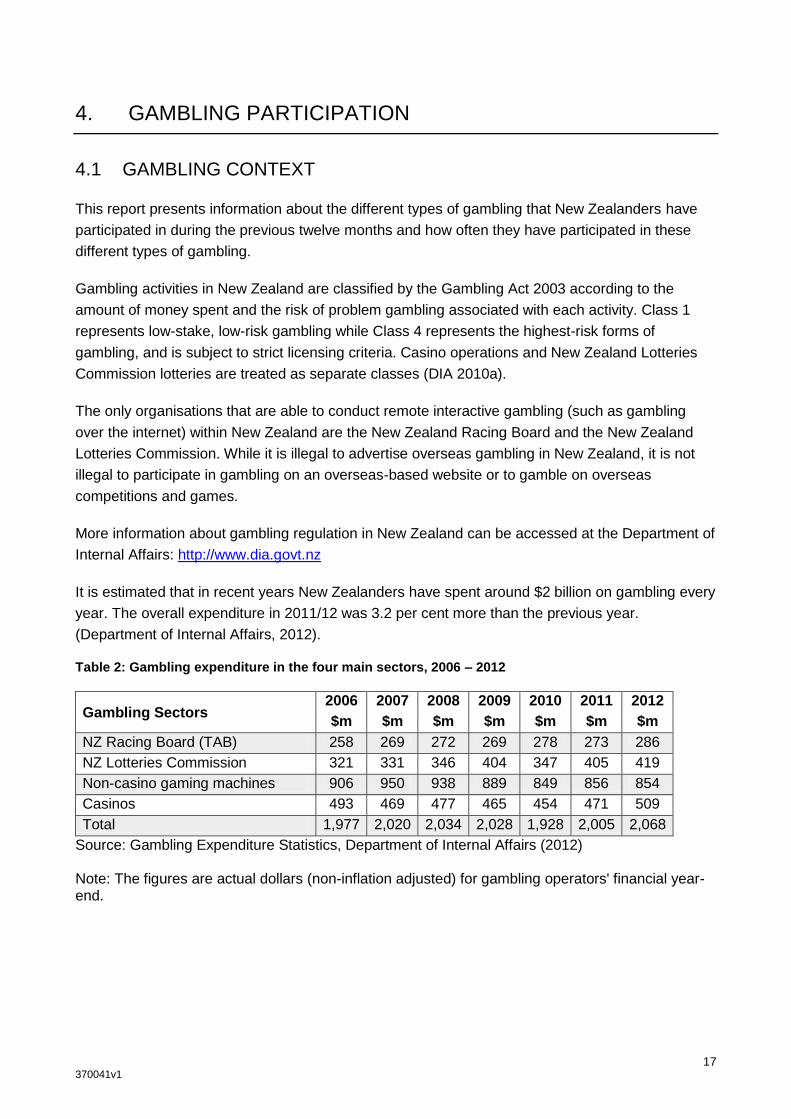
It is estimated that in recent years New Zealanders have spent around $2 billion on gambling every
year. The overall expenditure in 2011/12 was 3.2 per cent more than the previous year.
(Department of Internal Affairs, 2012).
Table 2: Gambling expenditure in the four main sectors, 2006 – 2012
Gambling Sectors 2006 2007 2008 2009 2010 2011 2012
$m $m $m $m $m $m $m
NZ Racing Board (TAB) 258 269 272 269 278 273 286
NZ Lotteries Commission 321 331 346 404 347 405 419
Non-casino gaming machines 906 950 938 889 849 856 854
Casinos 493 469 477 465 454 471 509
Total 1,977 2,020 2,034 2,028 1,928 2,005 2,068
Source: Gambling Expenditure Statistics, Department of Internal Affairs (2012) Note: The figures are actual dollars (non-inflation adjusted) for gambling operators' financial year-end.

18 370041v1
4.1.1 Objective of report
This report presents the key findings from the gambling participation components of the 2012 HLS
The objectives of this report are to:
Determine the prevalence of past-year gambling participation and frequency of gambling
participation in New Zealand, overall and among different population groups.
Determine the prevalence of different patterns of gambling behaviour among the New
Zealand population.
Examine the differences in gambling participation and frequency between population groups
(as defined by gender, age, ethnicity, PGSI, household equivalised income, deprivation
index).
Examine the changes in gambling participation and frequency over time from 2006 to 2012.
Investigate the relationship between those who are at-risk of gambling problems and the
pattern of their gambling behaviour
19 370041v1
4.2 TYPE OF GAMBLING ACTIVITIES DONE IN THE PREVIOUS TWELVE MONTHS
The following section examines the profile of people who had gambled in the past 12 months. It
focuses on general participation in gambling, as well as participation in specific gambling activities.
Particularly those activities more widely participated in.
4.2.1 Past-Year Gambling Participation
Everyone was asked whether or not they had engaged in a number of gambling activities in the
last 12 months.
In 2012, around five in seven New Zealanders aged 15 years and older (70.3%, 95% confidence
interval: 67.4% - 73.2%) had taken part at least once in at least one gambling activity in the
previous 12 months; approximately 2.4 million people (Table 3).
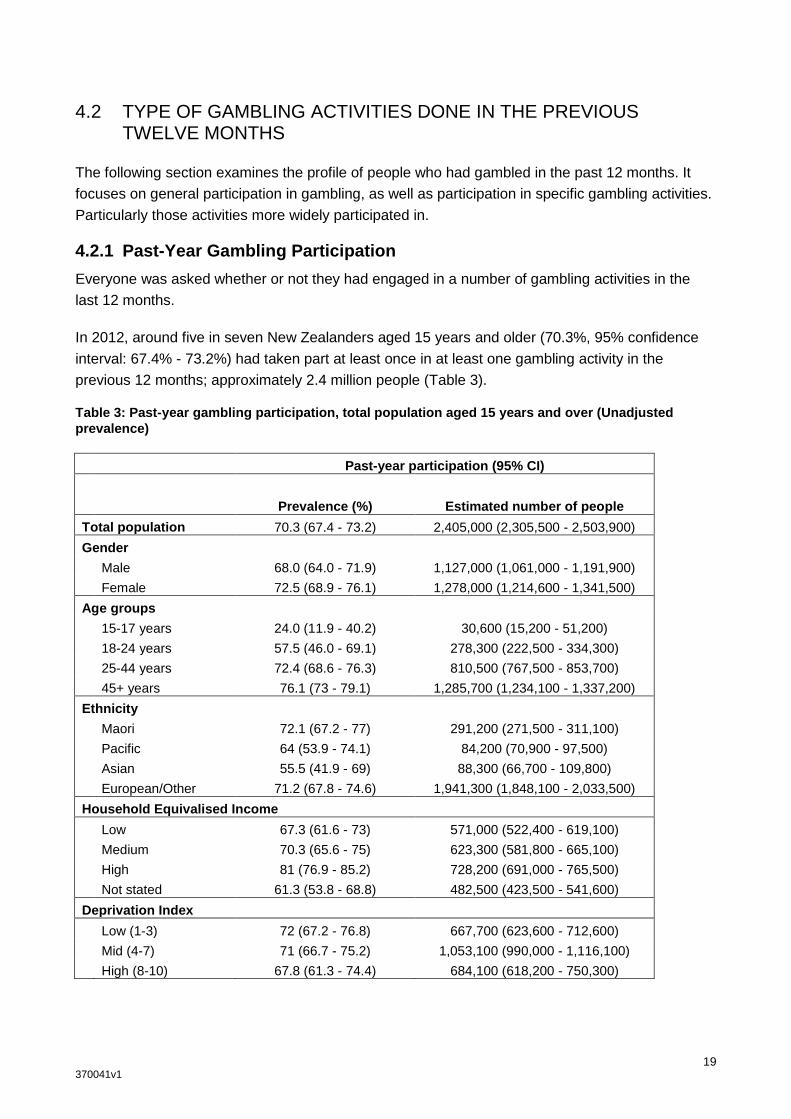
Table 3: Past-year gambling participation, total population aged 15 years and over (Unadjusted
prevalence)
Past-year participation (95% CI)
Prevalence (%) Estimated number of people
Total population 70.3 (67.4 - 73.2) 2,405,000 (2,305,500 - 2,503,900)
Gender
Male 68.0 (64.0 - 71.9) 1,127,000 (1,061,000 - 1,191,900)
Female 72.5 (68.9 - 76.1) 1,278,000 (1,214,600 - 1,341,500)
Age groups
15-17 years 24.0 (11.9 - 40.2) 30,600 (15,200 - 51,200)
18-24 years 57.5 (46.0 - 69.1) 278,300 (222,500 - 334,300)
25-44 years 72.4 (68.6 - 76.3) 810,500 (767,500 - 853,700)
45+ years 76.1 (73 - 79.1) 1,285,700 (1,234,100 - 1,337,200)
Ethnicity
Maori 72.1 (67.2 - 77) 291,200 (271,500 - 311,100)
Pacific 64 (53.9 - 74.1) 84,200 (70,900 - 97,500)
Asian 55.5 (41.9 - 69) 88,300 (66,700 - 109,800)
European/Other 71.2 (67.8 - 74.6) 1,941,300 (1,848,100 - 2,033,500)
Household Equivalised Income
Low 67.3 (61.6 - 73) 571,000 (522,400 - 619,100)
Medium 70.3 (65.6 - 75) 623,300 (581,800 - 665,100)
High 81 (76.9 - 85.2) 728,200 (691,000 - 765,500)
Not stated 61.3 (53.8 - 68.8) 482,500 (423,500 - 541,600)
Deprivation Index
Low (1-3) 72 (67.2 - 76.8) 667,700 (623,600 - 712,600)
Mid (4-7) 71 (66.7 - 75.2) 1,053,100 (990,000 - 1,116,100)
High (8-10) 67.8 (61.3 - 74.4) 684,100 (618,200 - 750,300)
20 370041v1
Key findings in Table 3 include:
There was no significant difference in overall past-year participation in gambling between
males and females. Also no significant differences were found by prioritised ethnicity or
socio-economic deprivation.
Past-year gambling participation was much lower in the younger (aged 15 to 17 years) than
in all other age groups. Compared with people aged 18 to 24 years, people aged 25 to 44
years and 45 years and over had a much higher participation rate in the past 12 months.
Compared with people with low, medium or not stated household equivalised incomes,
people with high household equivalised incomes were significantly more likely to have
participated in gambling in the past 12 months.
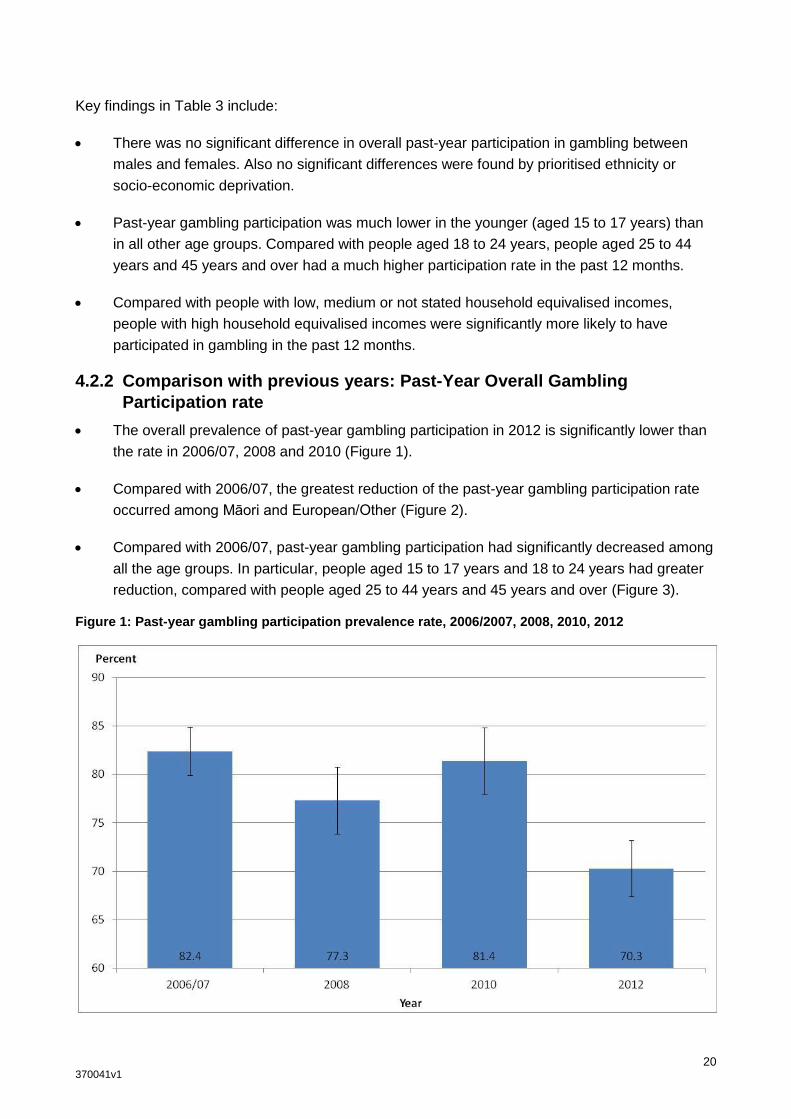
4.2.2 Comparison with previous years: Past-Year Overall Gambling
Participation rate
The overall prevalence of past-year gambling participation in 2012 is significantly lower than
the rate in 2006/07, 2008 and 2010 (Figure 1).
Compared with 2006/07, the greatest reduction of the past-year gambling participation rate
occurred among Māori and European/Other (Figure 2).
Compared with 2006/07, past-year gambling participation had significantly decreased among
all the age groups. In particular, people aged 15 to 17 years and 18 to 24 years had greater
reduction, compared with people aged 25 to 44 years and 45 years and over (Figure 3).
Figure 1: Past-year gambling participation prevalence rate, 2006/2007, 2008, 2010, 2012

21 370041v1
Figure 2: Past-year gambling participation prevalence rate by ethnicity, 2006/2007, 2008, 2010, 2012

22 370041v1
Figure 3: Past-year gambling participation prevalence rate by age group, 2006/2007, 2008, 2010, 2012

23 370041v1
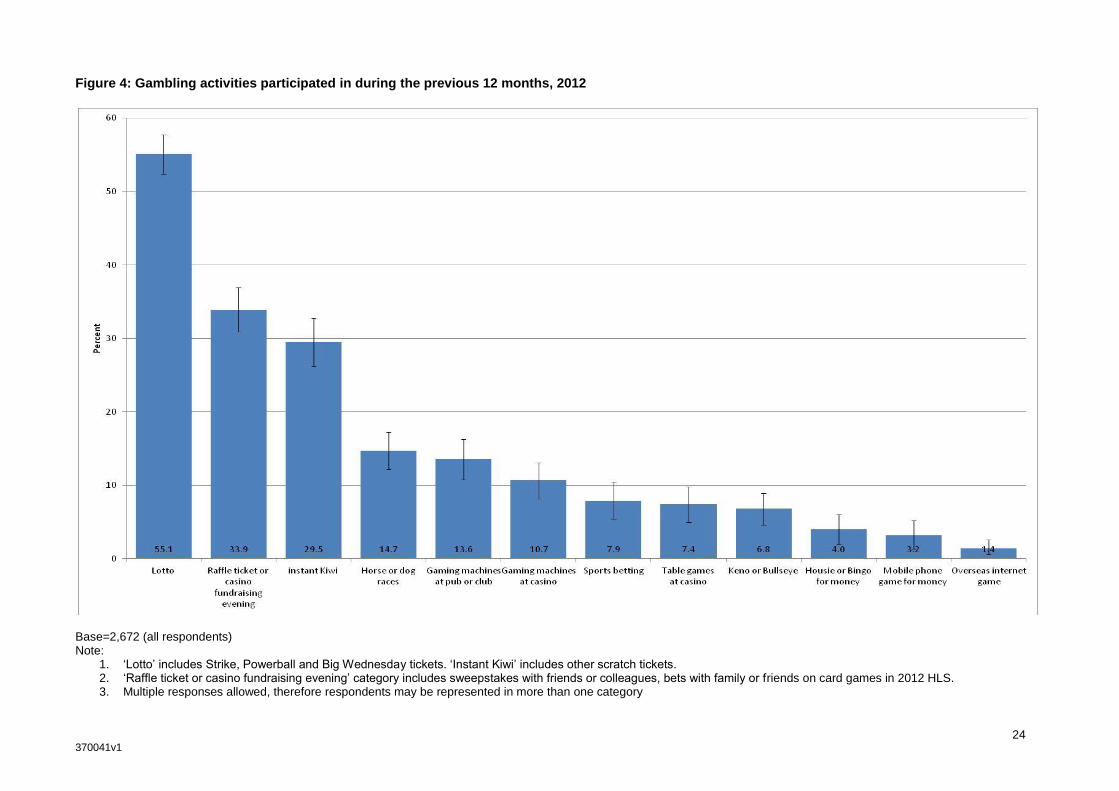
4.2.3 Participation in each individual gambling activity
As Figure 4 shows, Lotto (including Strike, Powerball and Big Wednesday) continues to be the
most common form of gambling activity, with over half (55.1%, 52.4 – 57.7) of New Zealanders
aged 15 years and older reported having purchased a lottery ticket in the previous 12 months.
Seven in nine (78.3%, 75.6 – 81.1) past-year gamblers had purchased a lottery ticket. Other NZ
Lotteries products include Instant Kiwi or scratch tickets (29.5%, 26.2 – 32.8), and Keno or
Bullseye tickets (6.8%, 4.6 – 8.9). Overall, three in every five adults had bought a NZ Lotteries
product (60.3%, 57.3 – 63.4) in the past 12 months.
One in three (33.9%, 30.9 – 36.9) adults had gone to a gaming or casino evening or bought a raffle
ticket for fundraising, sweepstakes with friends or colleagues, or made money bets with family or
friends on card games or the like.
One in seven (13.6%, 10.8 – 16.3) adults had played gaming machines or pokies at a pub or club.
One in nine (10.7%, 8.2 – 13.1) adults had played gaming machines or pokies at one of the six
casinos. And one in thirteen (7.4%, 5.0 – 9.8) adults had played table games at one of the six
casinos.
Other gambling forms participated in included betting on horse or dog races (14.7%, 12.2 – 17.2),
betting on sports events (7.9%, 5.4 – 10.5). Overall one in every six (16.4%, 13.6 – 19.2) adults
had bought a TAB tickets (track betting or sports betting) in the past 12 months.
Participation in online gambling remains at a low rate. 4.3% (2.8 - 5.7) of adults had used the NZ
Lotteries Commission’s MyLotto website to buy a lotteries ticket online, or had bet on a horse or
dog race or sports event through the NZ Racing Board’s TAB website in the previous year. 1.4%
(0.6 – 2.6) of adults had gambled online through an overseas website.
24 370041v1
Figure 4: Gambling activities participated in during the previous 12 months, 2012
Base=2,672 (all respondents) Note:
1. ‘Lotto’ includes Strike, Powerball and Big Wednesday tickets. ‘Instant Kiwi’ includes other scratch tickets. 2. ‘Raffle ticket or casino fundraising evening’ category includes sweepstakes with friends or colleagues, bets with family or friends on card games in 2012 HLS. 3. Multiple responses allowed, therefore respondents may be represented in more than one category
25 370041v1
4.2.4 Profile of past-year gamblers
Key differences (Table 4) between core demographics can be observed and are reported below.
However, some cautions is required when drawing inferences from these observations as the inter-
correlations and potential confounding are not represented in this analysis. More complex models
of the data are examined by the HPA’s Research and Evaluation Unit.
Males were significantly more likely than females to have bet on horse or dog races and sport event, but less likely to have bought a raffle ticket or gone to a casino fundraising evening or held sweepstakes with friends or colleagues or bets with family or friends on card games.
People aged 25 and over were significantly more likely than younger people aged 18 to 24 to have bought lottery tickets.
People aged 45 and over were more likely than younger people aged 18 to 24 to have bought a raffle ticket or gone to a casino fundraising evening or held sweepstakes with friends or colleagues or bets with family or friends on card games.
People of Māori and European/Other ethnicity and were more likely than Asian peoples to have bought lottery tickets.
People of Māori and European/Other ethnicity were more likely than Pacific peoples to have bought Instant Kiwi or scratch tickets,
People of Māori ethnicity were more likely than Pacific peoples to have bet on horse or dog races.
People of Māori ethnicity were more likely than Pacific peoples and European/Other to have played gaming machines at pub or club.
People living in low deprivation areas were more likely to have bought lottery tickets, compared with those people living in high deprivation areas.
Low-risk gamblers were more likely than non-problem gamblers to have played gaming machine at a casino.
People with a high household equivalised income were more likely to have bought lottery tickets, bought a raffle ticket or gone to a casino fundraising evening, compared with people with a low or medium household equivalised income.
People with a high household equivalised income were also more likely than people with a low household equivalised income to have bet on horse or dog races, played gaming machines or table game at casinos.
26 370041v1
Table 4: Participation in gambling activities in the previous 12 months, by demographics, 2012
Gender Age group (in years) Prioritised ethnicity Total
Male Female 15 - 17 18 - 24 25 - 44 45+ Māori Pacific Asian European/
Other
Gambling activities (Multiple responses allowed)
% % % % % % % % % % %
Lotto 54.2
(50.2 - 58.2) 55.9
(52.6 - 59.3) 2.2
(0.4 - 6.7) 29.6
(21.6 - 37.6) 59.2
(55.1 - 63.3) 63.6
(60.1 - 67.1) 55
(50.1 - 59.8) 50.9
(43.5 - 58.3) 39.2
(25.8 - 52.6) 56.2
(53.1 - 59.4) 55.1
(52.4 - 57.7)
Raffle ticket or casino fundraising evening
30 (26 - 33.9)
37.5 (33.6 - 41.5)
18.4 (7.8 - 34.2)
25.3 (18.9 - 31.7)
34.6 (29.8 - 39.3)
37 (33 - 41)
38.1 (32.6 - 43.6)
27.4 (19.6 - 35.2)
5.5 (1.6 - 12.9)
35.2 (31.7 - 38.7)
33.9 (30.9 - 36.9)
Instant Kiwi 27.1
(23 - 31.3) 31.8
(27.7 - 35.8) 3.7 (0.7 -
10.8) 36.6
(25.5 - 47.7) 31.7
(27 - 36.5) 28
(24.2 - 31.8) 35.2
(29.7 - 40.6) 19.5
(13.5 - 25.5) 25.6
(12.4 - 43.3) 29.4
(25.6 - 33.2) 29.5
(26.2 - 32.8)
Horse or dog races 18.5
(15.1 - 22) 11.1
(8.3 - 13.8) 0
(0 - 0) 9.3
(5.6 - 14.4) 14.5
(11.1 - 17.9) 17.5
(14 - 21) 14.6
(10.9 - 18.2) 7.8
(4.4 - 12.5) 5.1
(0.9 - 15.6) 15.6
(12.7 - 18.5) 14.7
(12.2 - 17.2)
Gaming machines at pub or club
13.4 (10 - 16.8)
13.7 (10.7 - 16.7)
1.7 (0.2 - 6.2)
19.1 (11 - 27.3)
14.1 (10.8 - 17.4)
12.5 (9.2 - 15.9)
18.4 (14.5 - 22.4)
7.5 (4 - 12.8)
7.6 (1 - 24.1)
13.5 (10.2 - 16.7)
13.6 (10.8 - 16.3)
Gaming machines at casino 11.6
(8.7 - 14.6) 9.7
(6.9 - 12.5) 1 (0 - 5.3)
15 (8.2 - 24.4)
11 (7.9 - 14)
9.9 (6.7 - 13.2)
7.5 (4 - 11.1)
4.6 (2.3 - 8.4)
13.2 (4.1 - 29.3)
11.3 (8.4 - 14.1)
10.7 (8.2 - 13.1)
Sports betting 11.3
(7.3 - 15.3) 4.8
(2.5 - 7.1) 0
(0 - 0) 12.3
(5.4 - 22.9) 7.8
(4.9 - 10.8) 7.4
(4.3 - 10.5) 7.2
(4.2 - 10.2) 2
(0.4 - 5.5) 6.5
(0.6 - 23) 8.4
(5.4 - 11.5) 7.9
(5.4 - 10.5)
Table games at casino 8.2
(5.4 - 11.1) 6.6
(4 - 9.3) 0 (0 - 0)
12 (5.1 - 22.7)
7 (4.3 - 9.8)
6.9 (3.7 - 10.1)
4.1 (2.1 - 7.3)
0.7 (0.2 - 1.8)
12 (3.6 - 27)
8 (5.1 - 10.8)
7.4 (5 - 9.8)
Keno or Bullseye ticket 7.3
(4.7 - 10) 6.2
(3.7 - 8.7) 0
(0 - 0) 6.6
(3.1 - 12) 7.1
(4.3 - 9.8) 7.1
(4 - 10.2) 4.6
(2.7 - 7.4) 4.3
(2 - 8.1) 2.7
(0.5 - 8) 7.4
(4.7 - 10.1) 6.8
(4.6 - 8.9)
Housie or Bingo for money 3.8
(1.6 - 6) 4.2
(1.9 - 6.5) 0.3 (0 - 2.6)
3.5 (0.7 - 9.8)
3 (1.4 - 5.6)
5.1 (2.1 - 8.1)
2.2 (1 - 3.9) 1.4
(0.4 - 3.4) 5.2
(0.2 - 22.9) 4.3
(1.9 - 6.8) 4
(2 - 6)
Game for money on a mobile phone
3 (1.4 - 5.7)
3.4 (1.2 - 5.7)
0 (0 - 0)
2.2 (0.4 - 6.6)
2.6 (1.1 - 5)
4.2 (1.3 - 7.2)
1.5 (0.6 - 3.1)
0 (0 - 0)
0.1 (0 - 0.8)
3.8 (1.4 - 6.3)
3.2 (1.3 - 5.2)
Internet game through overseas website
2.3 (0.9 - 4.7)
0.5 (0.1 - 1.4)
1.2 (0 - 6.6)
4 (1 - 10.7)
2 (0.5 - 5)
0.2 (0.1 - 0.5)
1.1 (0.3 - 2.9)
0.3 (0 - 1)
7 (0.7 - 24.2)
1.1 (0.4 - 2.5)
1.4 (0.6 - 2.6)
Did not participate in any activities
32 (28.1 - 36)
27.5 (23.9 - 31.1)
76 (62.4 - 89.6)
42.5 (30.9 - 54)
27.6 (23.7 - 31.4)
23.9 (20.9 - 27)
27.9 (23 - 32.8)
36 (25.9 - 46.1)
44.5 (31 - 58.1)
28.8 (25.4 - 32.2)
29.7 (26.8 - 32.6)
Sample size n = 1154 1518 71 260 943 1398 619 387 127 1539 2672
27 370041v1
PGSI Household Equivalised Income Deprivation Index Total
Non-gambler
Non-problem gambler
Low-risk gambler
Moderate risk/Problem gambler Low Medium High Not stated Low Mid High
Gambling activities (Multiple responses allowed) % % % % % % % % % % % %
Lotto 0
(0 - 0) 79.2
(76.4 - 81.9) 72.5
(55.7 - 89.3) 81.2
(64.9 - 97.5) 50.8
(45.5 - 56.1) 54.9
(49.6 - 60.1) 66.8
(61.7 - 72) 46.5
(41.5 - 51.6) 59.1
(54.1 - 64.2) 55.7
(51.2 - 60.3) 50.4
(45.1 - 55.6)
55.1 (52.4 - 57.7)
Raffle ticket or casino fundraising evening
0 (0 - 0)
48.9 (44.9 - 52.9)
45.2 (28.6 - 61.8)
36.1 (12.8 - 65.5)
31.6 (26.5 - 36.7)
33.9 (28.7 - 39.2)
44.2 (38.4 - 50.1)
24.4 (19.5 - 29.3)
37 (30.2 - 43.7)
33.2 (28.6 - 37.9)
31.9 (26.9 - 36.9)
33.9 (30.9 - 36.9)
Instant Kiwi 0
(0 - 0) 41.2
(37.2 - 45.3) 60.6
(42.5 - 78.8) 53.9
(29.1 - 77.3) 29
(23.8 - 34.1) 29.8
(24.9 - 34.7) 30.5
(24.7 - 36.3) 28.7
(21.7 - 35.7) 25.9
(19.3 - 32.4) 29.7
(25.2 - 34.3) 32.6
(26.1 - 39.1)
29.5 (26.2 - 32.8)
Horse or dog races 0
(0 - 0) 19.5
(16.1 - 23) 48.1
(29.5 - 66.7) 36.9
(14.4 - 64.6) 13.3
(9.8 - 16.7) 14.7
(10.5 - 18.8) 19.6
(14.4 - 24.9) 10.7
(6.3 - 15) 15.3
(9.8 - 20.8) 14.9
(10.9 - 18.9) 13.8
(10.1 - 17.5)
14.7 (12.2 - 17.2)
Gaming machines at pub or club
0 (0 - 0)
16.6 (13.1 - 20)
55.8 (38.5 - 73.1)
58.9 (35.5 - 82.3)
14.4 (10.2 - 18.5)
13.8 (9.8 - 17.8)
13.8 (8.9 - 18.7)
12.1 (6.2 - 18.1)
12.7 (7.4 - 18)
12.7 (8.8 - 16.6)
15.6 (10.4 - 20.8)
13.6 (10.8 - 16.3)
Gaming machines at casino 0
(0 - 0) 13.3
(10 - 16.6) 42.2
(24.7 - 61.3) 33.4
(9.5 - 66.1) 9
(5.2 - 12.9) 10.9
(7.1 - 14.6) 14.3
(9.5 - 19.2) 8
(3.6 - 12.3) 10.9
(5.7 - 16) 11.1
(7.3 - 15) 9.7
(5.9 - 13.6)
10.7 (8.2 - 13.1)
Sports betting 0
(0 - 0) 10.5
(7.2 - 13.9) 23.2
(10.3 - 41.2) 25.9
(5 - 60.9) 7.4
(4.7 - 10.1) 6.6
(3.5 - 9.8) 10.1
(5.2 - 14.9) 7.6
(2.5 - 16.7) 7
(2.9 - 13.8) 7.9
(4.4 - 11.5) 8.8
(3.7 - 14)
7.9 (5.4 - 10.5)
Table games at casino 0
(0 - 0) 9.8
(6.5 - 13) 23
(8.5 - 44.4) 21
(2.2 - 59.8) 6
(2.7 - 9.3) 8.5
(4.8 - 12.2) 10.2
(5.4 - 15) 4.6
(1.7 - 9.9) 7.5
(3.3 - 14.3) 8.4
(4.7 - 12.1) 5.9
(2.1 - 9.6)
7.4 (5 - 9.8)
Keno or Bullseye ticket 0
(0 - 0) 9.2
(6 - 12.5) 14.3
(4.4 - 31.5) 20.3
(1.8 - 60.2) 6.6
(3.8 - 9.3) 6.4
(3.2 - 9.7) 8.5
(3.9 - 13.2) 5.3
(2.9 - 8.6) 7
(2.8 - 14) 6.9
(3.1 - 10.6) 6.4
(4.2 - 8.5)
6.8 (4.6 - 8.9)
Housie or Bingo for money 0
(0 - 0) 6
(2.9 - 9) 1.4
(0.1 - 5.9) 4.1
(0.6 - 12.8) 4
(1.7 - 6.4) 4.7
(2.2 - 8.7) 4.7
(1.5 - 11) 2.4
(0.8 - 5.7) 4.8
(1.3 - 12) 4.5
(1 - 8.1) 2.4
(1.1 - 4.8)
4 (2 - 6)
Game for money on a mobile phone
0 (0 - 0)
4.9 (1.9 - 7.9)
0.5 (0 - 2.6)
1.3 (0 - 7.1)
3.5 (1.7 - 6.5)
4 (1.7 - 8)
4 (1 - 10.6)
1.2 (0.3 - 3)
4.2 (0.9 - 11.8)
4.3 (0.9 - 7.8)
0.8 (0.3 - 1.6)
3.2 (1.3 - 5.2)
Internet game through overseas website
0 (0 - 0)
1.9 (0.8 - 3.6)
4.5 (0.3 - 18.9)
2 (0.1 - 8.3)
1.4 (0.3 - 3.8)
0.5 (0.1 - 1.7)
1.6 (0.2 - 5.5)
2.1 (0.4 - 6.2)
1.6 (0.2 - 5.4)
0.7 (0.2 - 1.7)
2.2 (0.7 - 5.3)
1.4 (0.6 - 2.6)
Did not participate in any activities
100 (100 - 100)
0 (0 - 0)
0 (0 - 0)
0 (0 - 0)
32.7 (27 - 38.4)
29.7 (25 - 34.4)
19 (14.8 - 23.1)
38.7 (31.2 - 46.2)
28 (23.2 - 32.8)
29 (24.8 - 33.3)
32.2 (25.6 - 38.7)
29.7 (26.8 - 32.6)
Sample size n = 786 1745 72 54 852 658 540 622 538 1046 1088 2672
28 370041v1
4.2.5 Comparison with previous years: gambling activities participated in
during previous 12 months
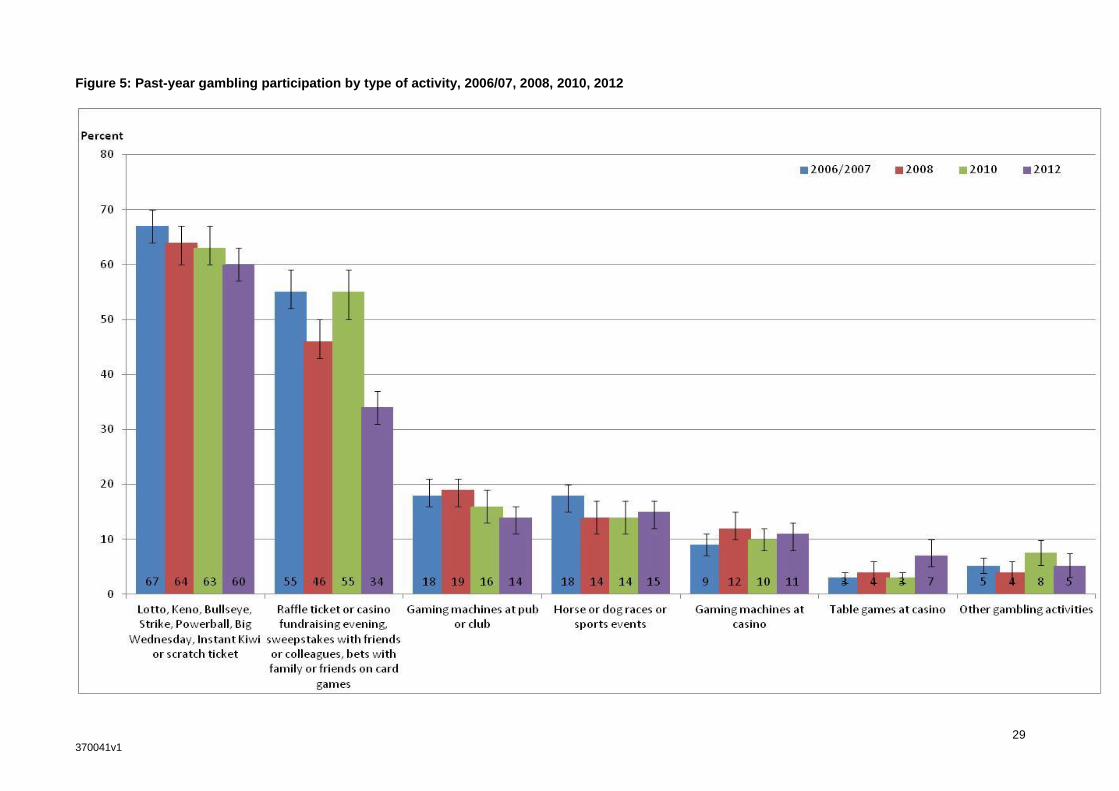
Figure 5 shows the proportions of respondents in the 2006/07 GBAS, 2008 HLS, 2010 HLS and
2012 HLS who participated in each type of gambling activity. Because some questions were asked
differently in 2010 and 2012, the wording in this table differs to that in section 4.2.3. For instance,
all NZ Lotteries products were asked about as a single category and betting on horse or dog races
or sports events were also grouped together. In the past, “bought a raffle ticket or gone to a
gaming or casino evening for fundraising”, “sweepstakes with friends or colleagues” and “made
money bets with family or friends on card games” were asked separately in the questionnaire, but
in 2012 HLS, they were combined together as one question.
The proportion of people buying raffle tickets or going to a casino evening for fundraising,
participating in sweepstakes with friends or colleagues, and making money bets with family
or friends on card games had the greatest significant reduction since 2006/2007 from 55% to
34%.
The proportion of people buying NZ Lotteries products (including Lotto, Keno, Bullseye6,
Strike, Powerball and Big Wednesday, Instant Kiwi and scratch tickets) had significant drop
since 2006/07 from 67% to 60%.
The proportion of people playing gaming machines or pokies at pub or club had decreased
significantly since 2006/07 from 18% to 14%.
The only gambling activity for which participation rates have gone up is playing table games
at casinos; the participation rate has doubled since 2006/07 from 3% to 7%.
Participation in betting on horse races, dog races or sports events and playing gaming
machines at casinos had not changed significantly over time.
6 Bullseye is a daily lottery game, launched on 19 October 2009. So it was only included in the 2010 and 2012 HLS.
29 370041v1
Figure 5: Past-year gambling participation by type of activity, 2006/07, 2008, 2010, 2012
30 370041v1
4.3 FREQUENCY OF PARTICIPATION IN GAMBLING ACTIVITIES, 2012
People who said that they participated in gambling activities were asked how often they
participated in those activities. The top four most frequent weekly gambling activities are Lotto,
Instant Kiwi, track betting and Daily Keno.
Over half (57.5%, 53.5 - 61.6) New Zealanders aged 15 years and older who had bought a
lottery tickets did at least once a month, representing an estimated 1,084,000 people. One in
three (33.7%, 30.3 – 37.0) had bought a lottery ticket did at least once a week, representing
an estimated 634,000 people. One in 28 (3.5%, 2.1 -4.9) had bought a lottery ticket more
than once a week, representing an estimated 66,000 people. A small proportion of people
(0.3%, 0.1 - 0.9) had bought a lottery ticket almost every day, representing an estimated
6,000 people
Two out of five (39.0%, 33.7 – 44.2)of those people who bought Instant Kiwi or scratch ticket
did so at least monthly, representing an estimated 393,000 people. One in seven (14.1%,
11.1 - 17.1) did so at least weekly, representing an estimated 142,000 people.
One in three (33.7%, 25.2-42.2) of those people who had played pokies in pubs or clubs did
so at least once a month, representing an estimated 464,000 people. (8.5%, 5.2 - 11.8) did
so at least weekly, representing an estimated 39,000 people.
Most other gambling activities were participated in on an occasional basis – less often than
monthly – by the majority of participants. The range is from 71.3% to 89.5%.

31 370041v1
Figure 6: Frequency of participation in gambling activities, among those who had done them in the previous twelve months, 2012
32 370041v1
4.3.1 Comparison with previous years: Frequency of engaging in gambling
activities
Table 5 shows the frequency with which respondents participated in gambling activities, in the
categories that are comparable with previous surveys. It shows responses as a proportion of all
respondents, that is, including the proportion of those who do not participate in the activity at all.
Key findings in Table 5 include:
The proportion of people buying NZ Lotteries products7 less often than monthly have
declined significantly from 28.9% to 25.0% over the last 6 years. However, the weekly and
monthly participation rate remains unchanged over the year, where the average weekly
participation rate over the years is 17.9% and the average monthly participation rate is
18.8%.
The proportion of people buying raffle tickets or going to a casino evening for fundraising,
participating in sweepstakes with friends or colleagues, and making money bets with family
or friends on card games had declined significantly across all frequency patterns over the
years, in particular with the less regular basis (less often than monthly), where the
participation rate declined since 2006/2007 from 45.1% to 12.5%.
The proportion of people playing gaming machines at pubs or clubs also declined
significantly across all frequency patterns over the years.
The proportion of people playing table games at casinos on a less regular basis (less often
than monthly) increased significantly since 2006/2007 from 2.5% to 6.1%; however the
overall participation rate remains relatively low.
Most other gambling activities were participated in less often than monthly and have not
changed significantly over time.
7 NZ Lotteries products included Lotto, Keno, Bullseye, Strike, Powerball and Big Wednesday, Instant Kiwi and scratch
tickets.

33 370041v1
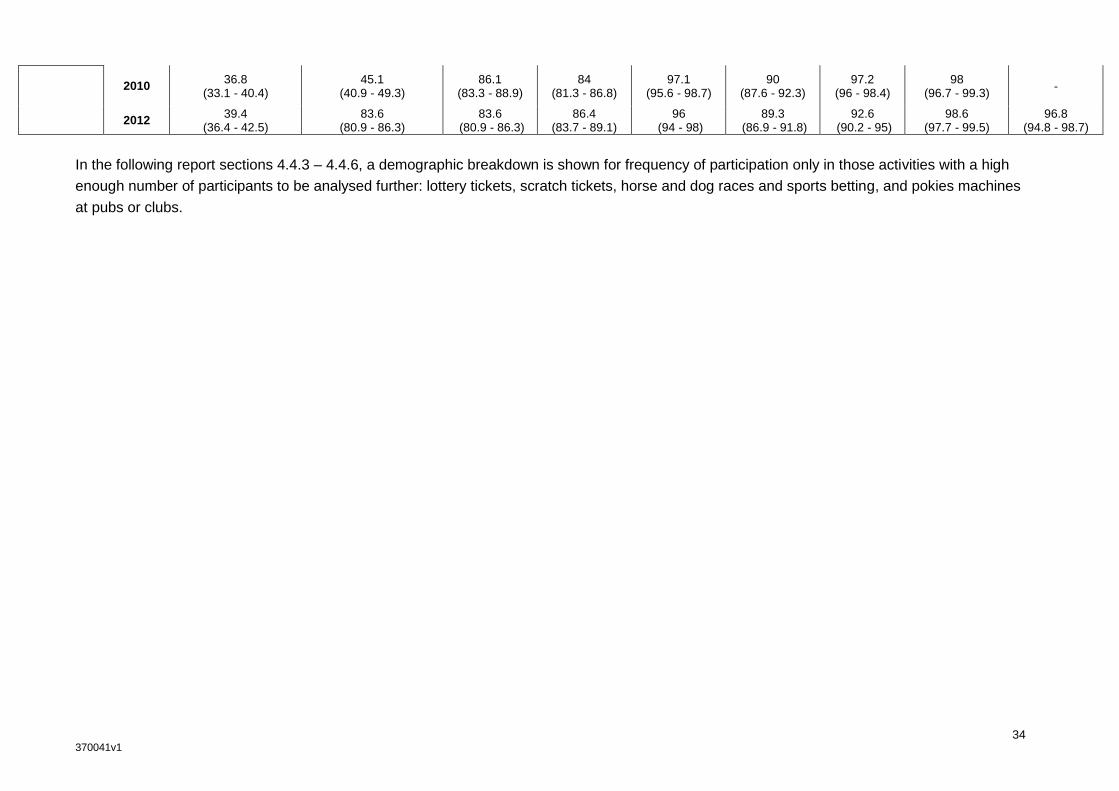
Table 5: Frequency of participation in gambling activities, 2006/07, 2008, 2010, 2012
Frequency Year
Lotto, Keno, (Bullseye), Strike,
Powerball, Big Wednesday, Instant
Kiwi or scratch tickets
Raffle ticket or casino fundraising evening,
sweepstakes with friends or colleagues,
bets with family or friends on card games
Horse or dog races or sports
events
Gaming machines at a
pub or club
Housie or Bingo for money
Gaming machines at
casinos
Table games at casinos
Internet game for money
Mobile phone game for money
At least once a week
2006/07 17.9
(15.4 - 20.4) 3.3
(2.2 - 4.3) 1.9
(1.1 - 2.6) 2
(1.2 - 2.7) 0.6
(0.3 - 1.1) 0.1
(0 - 0.3) 0
(0 - 0.1) 0
(0 - 0) 0.1
(0 - 0.5)
2008 15.8
(13.6 - 18) 2.1
(1.1 - 3.1) 2
(1.2 - 2.9) 1.2
(0.6 - 2.1) 0.7
(0.3 - 1.5) 0.2
(0.1 - 0.7) 0.1
(0 - 0.6) 0.4
(0.1 - 1.3) 0.3
(0.1 - 0.9)
2010 17.9
(15.3 - 20.4) 1.5
(0.9 - 2.2) 1.2
(0.6 - 2.1) 1
(0.6 - 1.5) 0.7
(0.3 - 1.3) 0.4
(0.1 - 1.1) -
0.4 (0.1 - 1.1)
-
2012 20.2
(18.2 - 22.2) 1.5
(0.9 - 2.1) 1.5
(0.9 - 2.1) 1.2
(0.7 - 1.6) 0.2
(0.1 - 0.5) 0.2
(0.1 - 0.6) 0.3
(0 - 0.8) 0.1
(0 - 0.3) 0
(0 - 0.1)
At least once a month
2006/07 19.9
(17.2 - 22.7) 6.9
(5.2 - 8.5) 3.2
(2 - 4.4) 4.7
(3.4 - 6) 0.5
(0.1 - 1.3) 0.5
(0.2 - 0.9) 0.2
(0 - 0.4) 0.1
(0 - 0.2) 0.2
(0 - 0.6)
2008 20.9
(17.9 - 23.9) 9.0
(6.9 - 11.2) 2.5
(1.1 - 3.8) 4.4
(2.8 - 6.1) 0.3
(0.1 - 0.5) 1.4
(0.6 - 2.8) 0.6
(0.1 - 1.5) -
0.1 (0 - 0.3)
2010 19
(16.1 - 21.9) 8.3
(6.5 - 10.1) 2
(1 - 3) 4.5
(3.1 - 5.8) 0.3
(0.1 - 0.9) 0.5
(0.2 - 1.2) 0.2
(0 - 0.9) 0.2
(0 - 0.7) -
2012 15.3
(13.3 - 17.3) 2.3
(1.3 - 3.4) 2.3
(1.3 - 3.4) 3.4
(2.2 - 4.7) 0.3
(0 - 1.1) 1.7
(0.9 - 2.9) 0.8
(0.3 - 1.9) 0.1
(0 - 0.4) 0.1
(0 - 0.3)
Less often than
monthly
2006/07 28.9
(26 - 31.9) 45.1
(41.9 - 48.4) 12.5
(10.1 - 14.8) 11.6
(9.7 - 13.6) 2.2
(1.4 - 3) 8
(6 - 10) 2.5
(1.5 - 3.5) 0.3
(0.1 - 0.8) 1.3
(0.8 - 2.2)
2008 27
(23.9 - 30.1) 35.3
(31.7 - 38.9) 9.4
(7.4 - 11.5) 13.1
(10.6 - 15.6) 1.5
(0.7 - 2.4) 10.7
(7.9 - 13.5) 3.3
(1.5 - 5) 0.7
(0 - 3.5) 0.3
(0.1 - 1)
2010 26.4
(23 - 29.8) 45.0
(40.8 - 49.2) 10.7
(8.1 - 13.3) 10.5
(8.1 - 12.9) 1.9
(0.4 - 3.3) 9.1
(6.8 - 11.5) 2.6
(1.4 - 3.8) 1.4
(0.5 - 3.2) -
2012 25
(22.1 - 27.9) 12.5
(10.2 - 14.7) 12.5
(10.2 - 14.7) 8.9
(6.7 - 11.1) 3.3
(1.5 - 5.1) 8.6
(6.4 - 10.8) 6.1
(4 - 8.1) 1.2
(0.5 - 2.4) 2.9
(1.1 - 4.7)
Not participated in activity
2006/07 33.2
(30 - 36.4) 44.7
(41.4 - 48.0) 82.4
(79.9 - 85) 81.7
(79.4 - 84.1) 96.7
(95.5 - 97.8) 91.4
(89.4 - 93.5) 97.3
(96.3 - 98.3) 99.6
(99.3 - 99.9) 98.4
(97.7 - 99.1)
2008 36.3
(32.6 - 40.1) 53.4
(49.6 - 57.4) 86.1
(83.5 - 88.6) 81.3
(78.6 - 84) 97.5
(96.5 - 98.5) 87.7
(84.8 - 90.5) 96.1
(94.2 - 97.9) 98.9
(96.4 - 99.8) 99.3
(98.7 - 99.8)
34 370041v1
2010 36.8
(33.1 - 40.4) 45.1
(40.9 - 49.3) 86.1
(83.3 - 88.9) 84
(81.3 - 86.8) 97.1
(95.6 - 98.7) 90
(87.6 - 92.3) 97.2
(96 - 98.4) 98
(96.7 - 99.3) -
2012 39.4
(36.4 - 42.5) 83.6
(80.9 - 86.3) 83.6
(80.9 - 86.3) 86.4
(83.7 - 89.1) 96
(94 - 98) 89.3
(86.9 - 91.8) 92.6
(90.2 - 95) 98.6
(97.7 - 99.5) 96.8
(94.8 - 98.7)
In the following report sections 4.4.3 – 4.4.6, a demographic breakdown is shown for frequency of participation only in those activities with a high
enough number of participants to be analysed further: lottery tickets, scratch tickets, horse and dog races and sports betting, and pokies machines
at pubs or clubs.

35 370041v1
4.4 PARTICIPATION IN CONTINUOUS AND NON-CONTINUOUS FORMS OF GAMBLING
4.4.1 Gambling participation type, 2012
As noted in section 3.5, all respondents were assigned to a gambling participation group based on
the types and frequency of gambling they reported participating in.
Nearly one in every two (47.4%, 44.2 -50.7) people were “infrequent gamblers” meaning
that they participated in any gambling activities less often than once a week, representing
an estimated 1,621,700 people.
One in five (19.8%, 17.7 – 21.8) people were frequent, non-continuous gamblers, meaning
that they participated in non-continuous gambling forms (such as buying lottery tickets,
going to casino evenings/buying raffle tickets for fundraising) on a weekly basis or more
often, representing an estimated 676,600 people.
One in 33 (3.1%, 2.3 – 3.9) people were frequent, continuous gamblers, meaning that they
participated in continuous gambling activities such as betting on races or sports events,
playing pokie machines or playing table games at casinos, on a weekly basis or more often,
representing an estimated 106,700 people.
Table 6: Participation in continuous and non-continuous forms of gambling, total population aged 15
years and over (unadjusted prevalence)
Gambling participation types
Past-year participation (95% CI)
Prevalence (%) for total adults
Prevalence (%) for past-year
gamblers
Estimated number of people
Non-gambler 29.7
(26.8 - 32.6) -
1,014,900 (916,500 - 1,114,900)
Infrequent gambler 47.4
(44.2 - 50.7) 67.4
(64.4 - 70.4) 1,621,700
(1,511,600 - 1,733,900)
Frequent, non-continuous gambler
19.8 (17.7 - 21.8)
28.1 (25.2 - 31.1)
676,600 (605,300 - 745,500)
Frequent, continuous gambler 3.1
(2.3 - 3.9) 4.4
(3.3 - 5.6) 106,700
(78,700 - 133,400)
36 370041v1
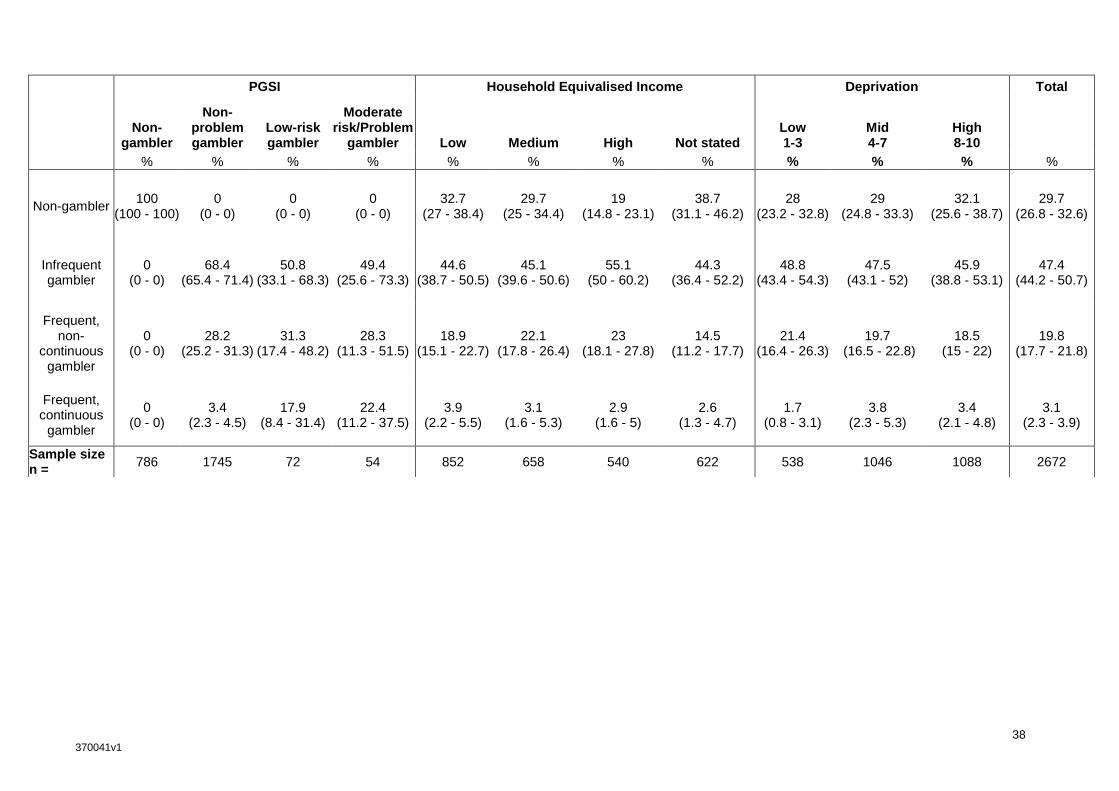
Key findings in Table 7 include:
Male were more likely than females to be frequent, non-continuous gamblers or continuous
gamblers, while females were more likely than males to be infrequent gamblers. This
means that generally females were more likely than males to participate in casual gambling
activities (i.e. less often than once a week)
As age goes up, older people were more likely than younger people to be frequent, non-
continuous gamblers.
People aged 45 and over were more likely than younger people to be frequent, continuous
gamblers.
There was a strong association between participation in frequent, continuous gambling
activities and being at risk of gambling problems. Table 7 shows that nearly one in five
(22.4%) moderate risk and problem gamblers and one in six (17.9%) low-risk gamblers
were frequent, continuous gamblers, compared with 3.4% of non-problem gamblers.

37 370041v1
Table 7: Gambling participation type, by demographics, 2012
Gender Age group (in years) Prioritised ethnicity Total
Male Female 15 - 17 18 - 24 25 - 44 45+ Māori Pacific Asian European/Oth
er
% % % % % % % % % % %
Non-gambler 32
(28 - 36) 27.5
(23.9 - 31.1) 76
(62.4 - 89.6) 42.4
(30.9 - 53.9) 27.6
(23.7 - 31.4) 23.9
(20.9 - 27) 27.9
(23 - 32.8) 36
(25.9 - 46.1) 44.5
(31 - 58.1) 28.8
(25.4 - 32.1) 29.7
(26.8 - 32.6)
Infrequent gambler 41
(36.6 - 45.4) 53.5
(49.6 - 57.3) 21.2
(9.6 - 37.5) 49.9
(37.7 - 62.2) 55.1
(50.5 - 59.8) 43.6
(39.8 - 47.3) 46
(40.9 - 51.1) 37.5
(27.6 - 47.5) 40.3
(25.7 - 54.9) 48.5
(44.9 - 52.2) 47.4
(44.2 - 50.7)
Frequent, non-continuous gambler
22.4 (19.2 - 25.7)
17.3 (14.8 - 19.8)
1.6 (0.2 - 5.9)
6.2 (3.4 - 10.4)
15.9 (12.4 - 19.4)
27.6 (24.5 - 30.7)
22 (17.5 - 26.5)
21.9 (17.2 - 26.7)
15 (6 - 29.2)
19.6 (17.3 - 22)
19.8 (17.7 - 21.8)
Frequent, continuous gambler
4.6 (3.2 - 6)
1.7 (0.9 - 2.5)
1.2 (0 - 6.6)
1.5 (0.3 - 4.3)
1.4 (0.7 - 2.7)
4.8 (3.4 - 6.3)
4.1 (2.2 - 6.1)
4.5 (2.2 - 8.3)
0.2 (0 - 1.1)
3.1 (2.1 - 4)
3.1 (2.3 - 3.9)
Sample size n =
1154 1518 71 260 943 1398 619 387 127 1539 2672
38 370041v1
PGSI Household Equivalised Income Deprivation Total
Non-
gambler
Non-problem gambler
Low-risk gambler
Moderate risk/Problem
gambler Low Medium High Not stated Low 1-3
Mid 4-7
High 8-10
% % % % % % % % % % % %
Non-gambler 100
(100 - 100) 0
(0 - 0) 0
(0 - 0) 0
(0 - 0) 32.7
(27 - 38.4) 29.7
(25 - 34.4) 19
(14.8 - 23.1) 38.7
(31.1 - 46.2) 28
(23.2 - 32.8) 29
(24.8 - 33.3) 32.1
(25.6 - 38.7) 29.7
(26.8 - 32.6)
Infrequent gambler
0 (0 - 0)
68.4 (65.4 - 71.4)
50.8 (33.1 - 68.3)
49.4 (25.6 - 73.3)
44.6 (38.7 - 50.5)
45.1 (39.6 - 50.6)
55.1 (50 - 60.2)
44.3 (36.4 - 52.2)
48.8 (43.4 - 54.3)
47.5 (43.1 - 52)
45.9 (38.8 - 53.1)
47.4 (44.2 - 50.7)
Frequent, non-
continuous gambler
0 (0 - 0)
28.2 (25.2 - 31.3)
31.3 (17.4 - 48.2)
28.3 (11.3 - 51.5)
18.9 (15.1 - 22.7)
22.1 (17.8 - 26.4)
23 (18.1 - 27.8)
14.5 (11.2 - 17.7)
21.4 (16.4 - 26.3)
19.7 (16.5 - 22.8)
18.5 (15 - 22)
19.8 (17.7 - 21.8)
Frequent, continuous
gambler
0 (0 - 0)
3.4 (2.3 - 4.5)
17.9 (8.4 - 31.4)
22.4 (11.2 - 37.5)
3.9 (2.2 - 5.5)
3.1 (1.6 - 5.3)
2.9 (1.6 - 5)
2.6 (1.3 - 4.7)
1.7 (0.8 - 3.1)
3.8 (2.3 - 5.3)
3.4 (2.1 - 4.8)
3.1 (2.3 - 3.9)
Sample size n =
786 1745 72 54 852 658 540 622 538 1046 1088 2672
39 370041v1
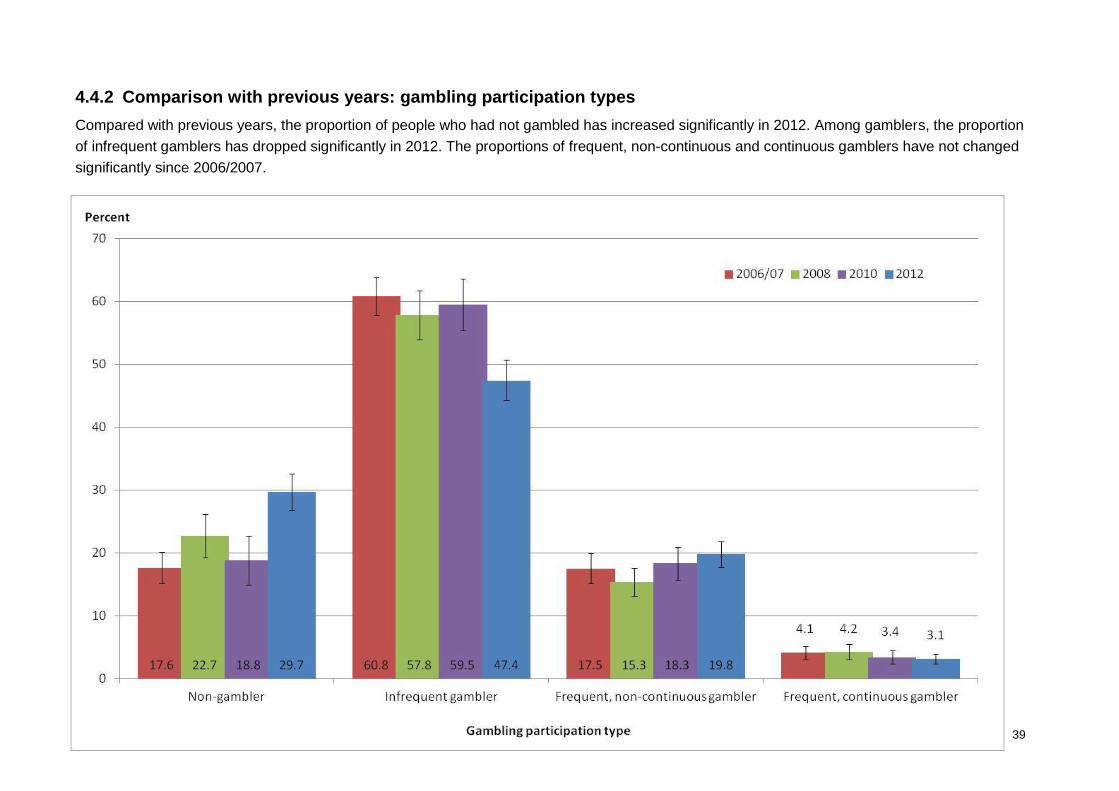
4.4.2 Comparison with previous years: gambling participation types
Compared with previous years, the proportion of people who had not gambled has increased significantly in 2012. Among gamblers, the proportion
of infrequent gamblers has dropped significantly in 2012. The proportions of frequent, non-continuous and continuous gamblers have not changed
significantly since 2006/2007.
Figure 7: Gambling participation types, 2006/07, 2008, 2010 and 2012
40 370041v1
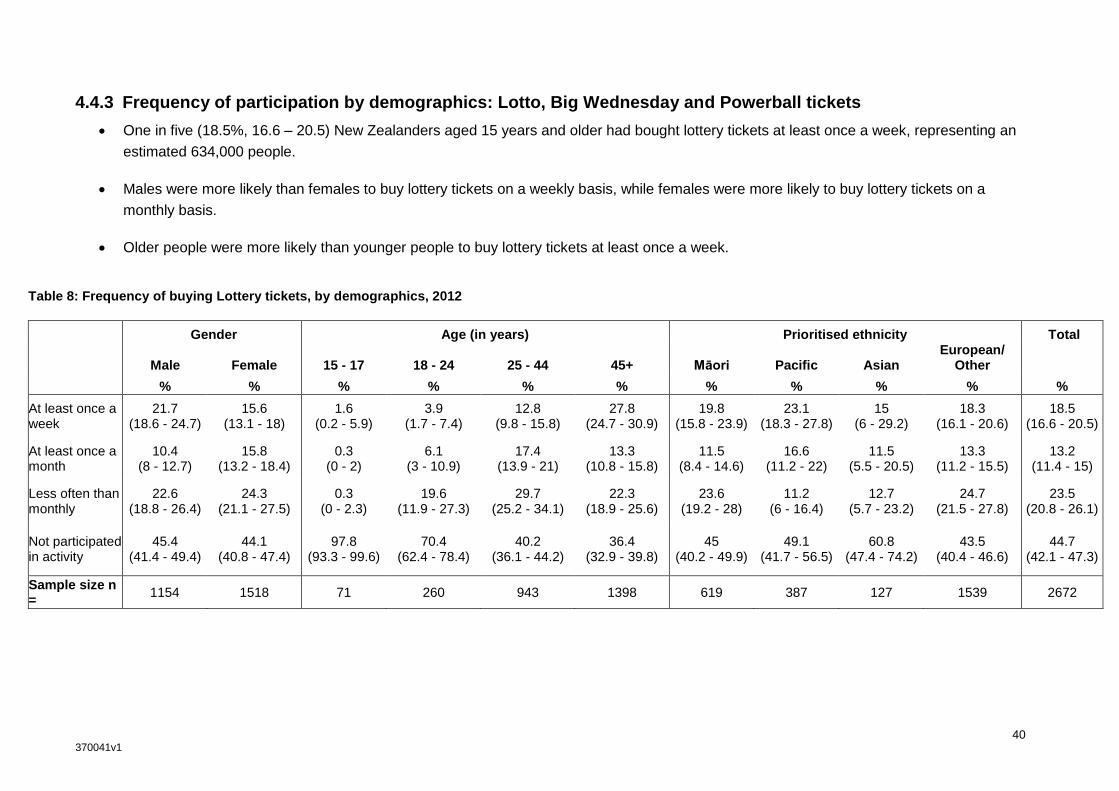
4.4.3 Frequency of participation by demographics: Lotto, Big Wednesday and Powerball tickets
One in five (18.5%, 16.6 – 20.5) New Zealanders aged 15 years and older had bought lottery tickets at least once a week, representing an
estimated 634,000 people.
Males were more likely than females to buy lottery tickets on a weekly basis, while females were more likely to buy lottery tickets on a
monthly basis.
Older people were more likely than younger people to buy lottery tickets at least once a week.
Table 8: Frequency of buying Lottery tickets, by demographics, 2012
Gender Age (in years) Prioritised ethnicity Total
Male Female 15 - 17 18 - 24 25 - 44 45+ Māori Pacific Asian European/
Other
% % % % % % % % % % %
At least once a week
21.7 (18.6 - 24.7)
15.6 (13.1 - 18)
1.6 (0.2 - 5.9)
3.9 (1.7 - 7.4)
12.8 (9.8 - 15.8)
27.8 (24.7 - 30.9)
19.8 (15.8 - 23.9)
23.1 (18.3 - 27.8)
15 (6 - 29.2)
18.3 (16.1 - 20.6)
18.5 (16.6 - 20.5)
At least once a month
10.4 (8 - 12.7)
15.8 (13.2 - 18.4)
0.3 (0 - 2)
6.1 (3 - 10.9)
17.4 (13.9 - 21)
13.3 (10.8 - 15.8)
11.5 (8.4 - 14.6)
16.6 (11.2 - 22)
11.5 (5.5 - 20.5)
13.3 (11.2 - 15.5)
13.2 (11.4 - 15)
Less often than monthly
22.6 (18.8 - 26.4)
24.3 (21.1 - 27.5)
0.3 (0 - 2.3)
19.6 (11.9 - 27.3)
29.7 (25.2 - 34.1)
22.3 (18.9 - 25.6)
23.6 (19.2 - 28)
11.2 (6 - 16.4)
12.7 (5.7 - 23.2)
24.7 (21.5 - 27.8)
23.5 (20.8 - 26.1)
Not participated in activity
45.4 (41.4 - 49.4)
44.1 (40.8 - 47.4)
97.8 (93.3 - 99.6)
70.4 (62.4 - 78.4)
40.2 (36.1 - 44.2)
36.4 (32.9 - 39.8)
45 (40.2 - 49.9)
49.1 (41.7 - 56.5)
60.8 (47.4 - 74.2)
43.5 (40.4 - 46.6)
44.7 (42.1 - 47.3)
Sample size n =
1154 1518 71 260 943 1398 619 387 127 1539 2672

41 370041v1
PGSI Household Equivalised Income Deprivation Total
Non-gambler
Non-problem gambler
Low-risk gambler
Moderate-risk/Probl
em gambler Low Medium High Not stated
Low 1-3
Mid 4-7
High 8-10
% % % % % % % % % % % %
At least once a week
0 (0 - 0)
26.2 (23.3 - 29.1)
30.7 (16.8 - 44.5)
34.7 (16 - 57.8)
18.4 (14.7 - 22.2)
21.5 (17.3 - 25.8)
20.3 (15.9 - 24.8)
13.2 (9.9 - 16.5)
19.5 (15.2 - 23.9)
19.4 (16.2 - 22.7)
16.3 (13.1 - 19.6)
18.5 (16.6 - 20.5)
At least once a month
0 (0 - 0)
18.8 (16.2 - 21.5)
22.8 (8.6 - 43.9)
10.3 (3.4 - 22.5)
12.1 (8.7 - 15.4)
11 (8.1 - 13.8)
16.8 (12.5 - 21.1)
12.7 (8.9 - 16.4)
15.1 (11 - 19.2)
13 (10.2 - 15.9)
11.6 (8.6 - 14.5)
13.2 (11.4 - 15)
Less often than monthly
0 (0 - 0) 34.3
(30.9 - 37.6) 19
(6.2 - 39.7)
36.1 (10.4 - 69.7)
20.1 (15.9 - 24.2)
22.4 (17.6 - 27.1)
30.3 (25.2 - 35.3)
20.7 (14.8 - 26.5)
25.3 (20 - 30.6)
23 (19.2 - 26.8)
22.5 (17.4 - 27.7)
23.5 (20.8 - 26.1)
Not participated in activity
100 (100 - 100)
20.5 (17.9 - 23.2)
27.5 (12.4 - 47.5)
18.8 (5.8 - 40.4)
49.2 (43.9 - 54.5)
45.1 (39.9 - 50.4)
32.4 (27.3 - 37.4)
53.5 (48.4 - 58.5)
40.1 (35.1 - 45.1)
44.3 (39.8 - 48.7)
49.6 (44.4 - 54.9)
44.7 (42.1 - 47.3)
Sample size n =
786 1745 72 54 852 658 540 622 538 1046 1088 2672
42 370041v1
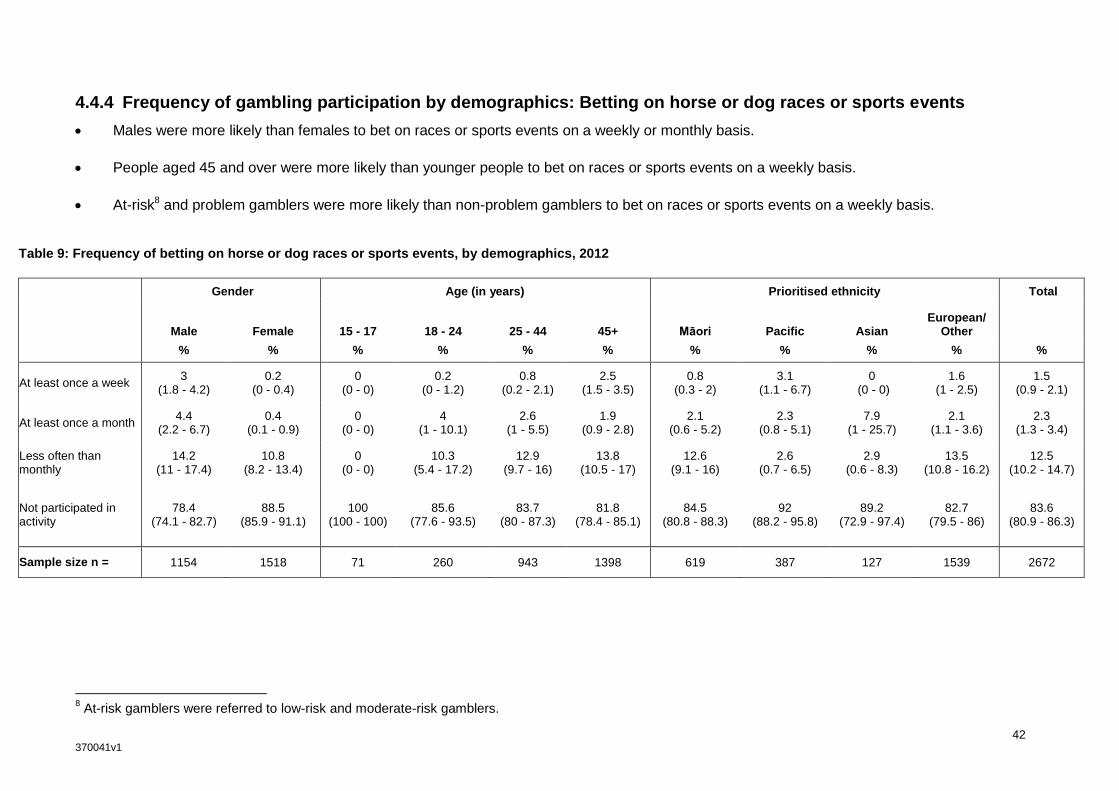
4.4.4 Frequency of gambling participation by demographics: Betting on horse or dog races or sports events
Males were more likely than females to bet on races or sports events on a weekly or monthly basis.
People aged 45 and over were more likely than younger people to bet on races or sports events on a weekly basis.
At-risk8 and problem gamblers were more likely than non-problem gamblers to bet on races or sports events on a weekly basis.
Table 9: Frequency of betting on horse or dog races or sports events, by demographics, 2012
Gender Age (in years) Prioritised ethnicity Total
Male Female 15 - 17 18 - 24 25 - 44 45+ Māori Pacific Asian European/
Other
% % % % % % % % % % %
At least once a week 3
(1.8 - 4.2) 0.2
(0 - 0.4) 0
(0 - 0) 0.2
(0 - 1.2) 0.8
(0.2 - 2.1) 2.5
(1.5 - 3.5) 0.8
(0.3 - 2) 3.1
(1.1 - 6.7) 0
(0 - 0) 1.6
(1 - 2.5) 1.5
(0.9 - 2.1)
At least once a month 4.4
(2.2 - 6.7) 0.4
(0.1 - 0.9) 0
(0 - 0) 4
(1 - 10.1) 2.6
(1 - 5.5) 1.9
(0.9 - 2.8) 2.1
(0.6 - 5.2) 2.3
(0.8 - 5.1) 7.9
(1 - 25.7) 2.1
(1.1 - 3.6) 2.3
(1.3 - 3.4)
Less often than monthly
14.2 (11 - 17.4)
10.8 (8.2 - 13.4)
0 (0 - 0)
10.3 (5.4 - 17.2)
12.9 (9.7 - 16)
13.8 (10.5 - 17)
12.6 (9.1 - 16)
2.6 (0.7 - 6.5)
2.9 (0.6 - 8.3)
13.5 (10.8 - 16.2)
12.5 (10.2 - 14.7)
Not participated in activity
78.4 (74.1 - 82.7)
88.5 (85.9 - 91.1)
100 (100 - 100)
85.6 (77.6 - 93.5)
83.7 (80 - 87.3)
81.8 (78.4 - 85.1)
84.5 (80.8 - 88.3)
92 (88.2 - 95.8)
89.2 (72.9 - 97.4)
82.7 (79.5 - 86)
83.6 (80.9 - 86.3)
Sample size n = 1154 1518 71 260 943 1398 619 387 127 1539 2672
8 At-risk gamblers were referred to low-risk and moderate-risk gamblers.
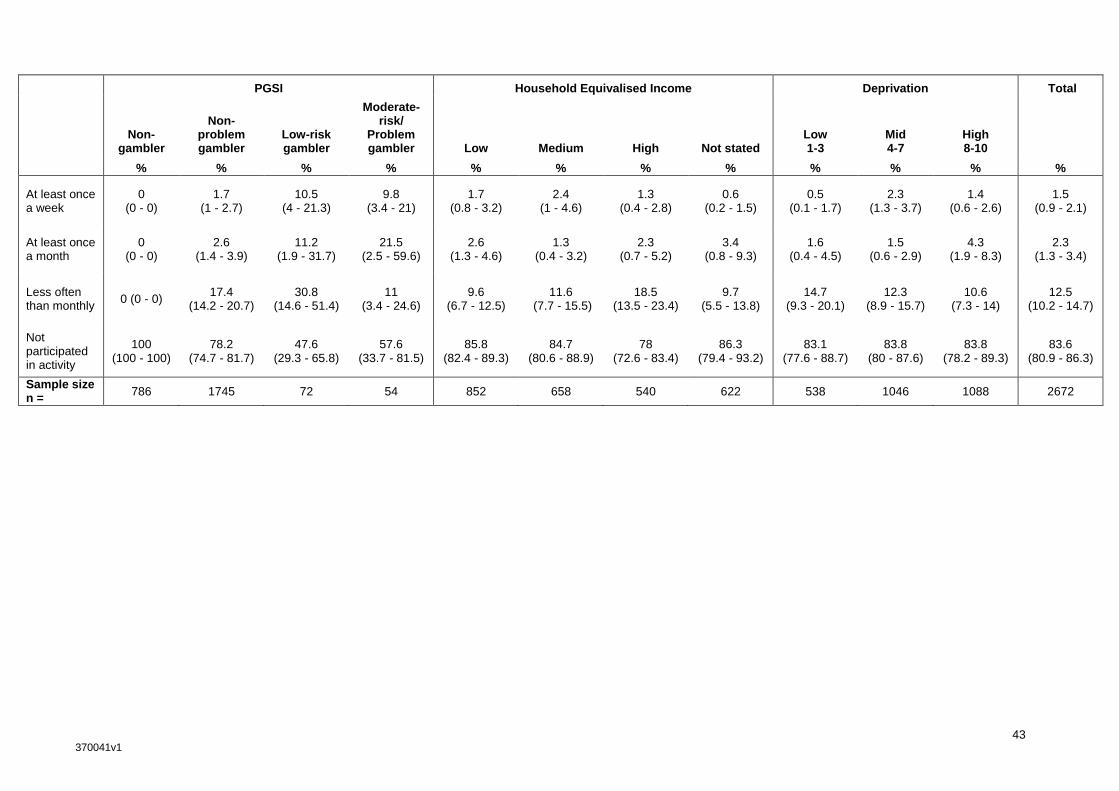
43 370041v1
PGSI Household Equivalised Income Deprivation Total
Non-gambler
Non-problem gambler
Low-risk gambler
Moderate-risk/
Problem gambler Low Medium High Not stated
Low 1-3
Mid 4-7
High 8-10
% % % % % % % % % % % %
At least once a week
0 (0 - 0)
1.7 (1 - 2.7)
10.5 (4 - 21.3)
9.8 (3.4 - 21)
1.7 (0.8 - 3.2)
2.4 (1 - 4.6)
1.3 (0.4 - 2.8)
0.6 (0.2 - 1.5)
0.5 (0.1 - 1.7)
2.3 (1.3 - 3.7)
1.4 (0.6 - 2.6)
1.5 (0.9 - 2.1)
At least once a month
0 (0 - 0)
2.6 (1.4 - 3.9)
11.2 (1.9 - 31.7)
21.5 (2.5 - 59.6)
2.6 (1.3 - 4.6)
1.3 (0.4 - 3.2)
2.3 (0.7 - 5.2)
3.4 (0.8 - 9.3)
1.6 (0.4 - 4.5)
1.5 (0.6 - 2.9)
4.3 (1.9 - 8.3)
2.3 (1.3 - 3.4)
Less often than monthly
0 (0 - 0) 17.4
(14.2 - 20.7) 30.8
(14.6 - 51.4) 11
(3.4 - 24.6) 9.6
(6.7 - 12.5) 11.6
(7.7 - 15.5) 18.5
(13.5 - 23.4) 9.7
(5.5 - 13.8) 14.7
(9.3 - 20.1) 12.3
(8.9 - 15.7) 10.6
(7.3 - 14) 12.5
(10.2 - 14.7)
Not participated in activity
100 (100 - 100)
78.2 (74.7 - 81.7)
47.6 (29.3 - 65.8)
57.6 (33.7 - 81.5)
85.8 (82.4 - 89.3)
84.7 (80.6 - 88.9)
78 (72.6 - 83.4)
86.3 (79.4 - 93.2)
83.1 (77.6 - 88.7)
83.8 (80 - 87.6)
83.8 (78.2 - 89.3)
83.6 (80.9 - 86.3)
Sample size n =
786 1745 72 54 852 658 540 622 538 1046 1088 2672

44 370041v1
4.4.5 Frequency of gambling participation by demographics: Buying Instant Kiwi or scratch tickets
Low-risk gamblers were more likely than non-problem gamblers to buy scratch tickets weekly.
Table 10: Frequency of buying Instant Kiwi or scratch tickets, by demographics, 2012
Gender Age (in years) Prioritised ethnicity Total
Male Female 15 - 17 18 - 24 25 - 44 45+ Māori Pacific Asian European/
Other
% % % % % % % % % % %
At least once a week
4.8 (3.1 - 6.6)
3.9 (2.7 - 5.2)
0.7 (0 - 3.7)
2.8 (1.1 - 5.6)
3.3 (1.5 - 5.1)
5.8 (4.1 - 7.5)
6.7 (4.1 - 9.2)
2.9 (1.1 - 6.1)
0.5 (0 - 2.9)
4.3 (3.1 - 5.6)
4.4 (3.3 - 5.4)
At least once a month
6.9 (4.6 - 9.2)
7.7 (5.7 - 9.8)
0.5 (0 - 3.6)
11.1 (5.8 - 18.7)
8.1 (5.3 - 10.9)
6.3 (4.5 - 8)
8.4 (5.5 - 11.2)
4.3 (2.1 - 7.7)
18.4 (6.4 - 37.5)
6.7 (5 - 8.4)
7.3 (5.8 - 8.9)
Less often than monthly
15.8 (12.6 - 19)
19.9 (16.4 - 23.4)
2.5 (0.2 - 9.9)
22.8 (14.6 - 31)
21 (17 - 24.9)
15.6 (12.6 - 18.7)
20.2 (15.6 - 24.7)
12.3 (7.8 - 16.8)
6.8 (2.6 - 13.9)
18.5 (15.4 - 21.6)
17.9 (15.3 - 20.5)
Not participated in activity
72.4 (68.3 - 76.6)
68.2 (64.3 - 72.2)
96.3 (89.2 - 99.3)
63.4 (52.3 - 74.5)
67.6 (62.9 - 72.4)
72 (68.3 - 75.7)
64.8 (59.4 - 70.3)
80.5 (74.5 - 86.5)
74.4 (59.7 - 89.1)
70.3 (66.5 - 74.1)
70.3 (67 - 73.5)
Sample size n =
1154 1518 71 260 943 1398 619 387 127 1539 2672
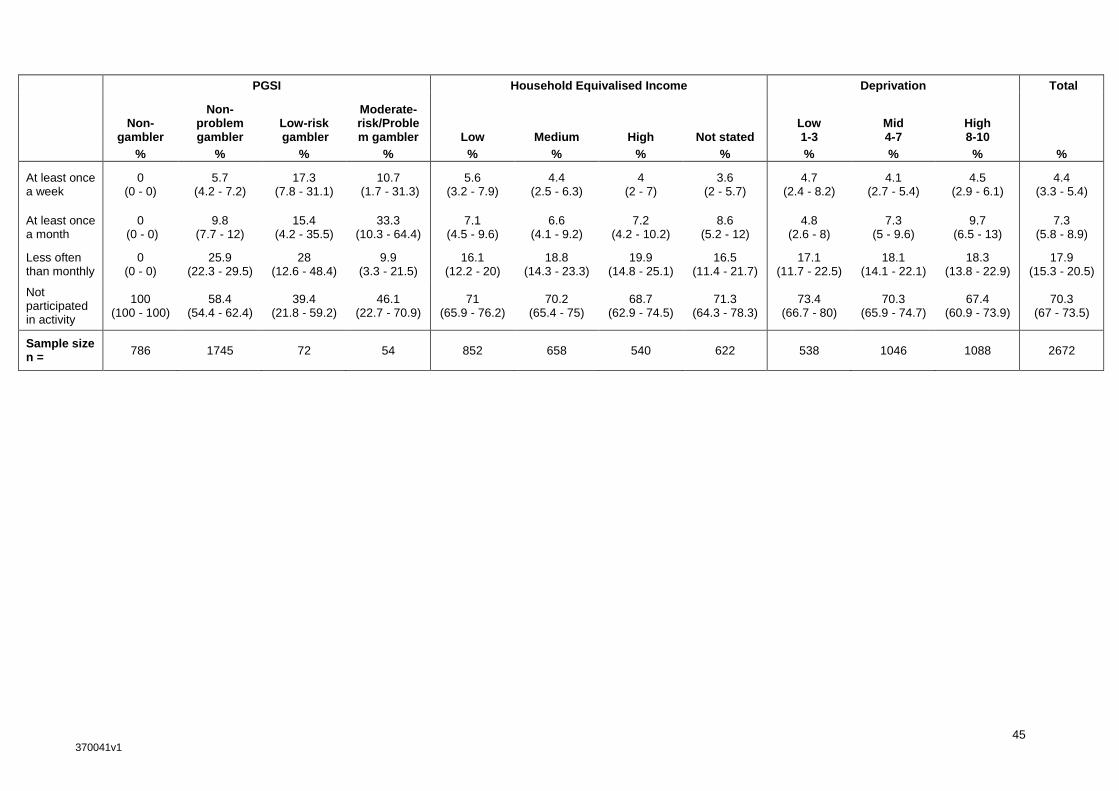
45 370041v1
PGSI Household Equivalised Income Deprivation Total
Non-gambler
Non-problem gambler
Low-risk gambler
Moderate-risk/Problem gambler Low Medium High Not stated
Low 1-3
Mid 4-7
High 8-10
% % % % % % % % % % % %
At least once a week
0 (0 - 0)
5.7 (4.2 - 7.2)
17.3 (7.8 - 31.1)
10.7 (1.7 - 31.3)
5.6 (3.2 - 7.9)
4.4 (2.5 - 6.3)
4 (2 - 7)
3.6 (2 - 5.7)
4.7 (2.4 - 8.2)
4.1 (2.7 - 5.4)
4.5 (2.9 - 6.1)
4.4 (3.3 - 5.4)
At least once a month
0 (0 - 0)
9.8 (7.7 - 12)
15.4 (4.2 - 35.5)
33.3 (10.3 - 64.4)
7.1 (4.5 - 9.6)
6.6 (4.1 - 9.2)
7.2 (4.2 - 10.2)
8.6 (5.2 - 12)
4.8 (2.6 - 8)
7.3 (5 - 9.6)
9.7 (6.5 - 13)
7.3 (5.8 - 8.9)
Less often than monthly
0 (0 - 0)
25.9 (22.3 - 29.5)
28 (12.6 - 48.4)
9.9 (3.3 - 21.5)
16.1 (12.2 - 20)
18.8 (14.3 - 23.3)
19.9 (14.8 - 25.1)
16.5 (11.4 - 21.7)
17.1 (11.7 - 22.5)
18.1 (14.1 - 22.1)
18.3 (13.8 - 22.9)
17.9 (15.3 - 20.5)
Not participated in activity
100 (100 - 100)
58.4 (54.4 - 62.4)
39.4 (21.8 - 59.2)
46.1 (22.7 - 70.9)
71 (65.9 - 76.2)
70.2 (65.4 - 75)
68.7 (62.9 - 74.5)
71.3 (64.3 - 78.3)
73.4 (66.7 - 80)
70.3 (65.9 - 74.7)
67.4 (60.9 - 73.9)
70.3 (67 - 73.5)
Sample size n =
786 1745 72 54 852 658 540 622 538 1046 1088 2672
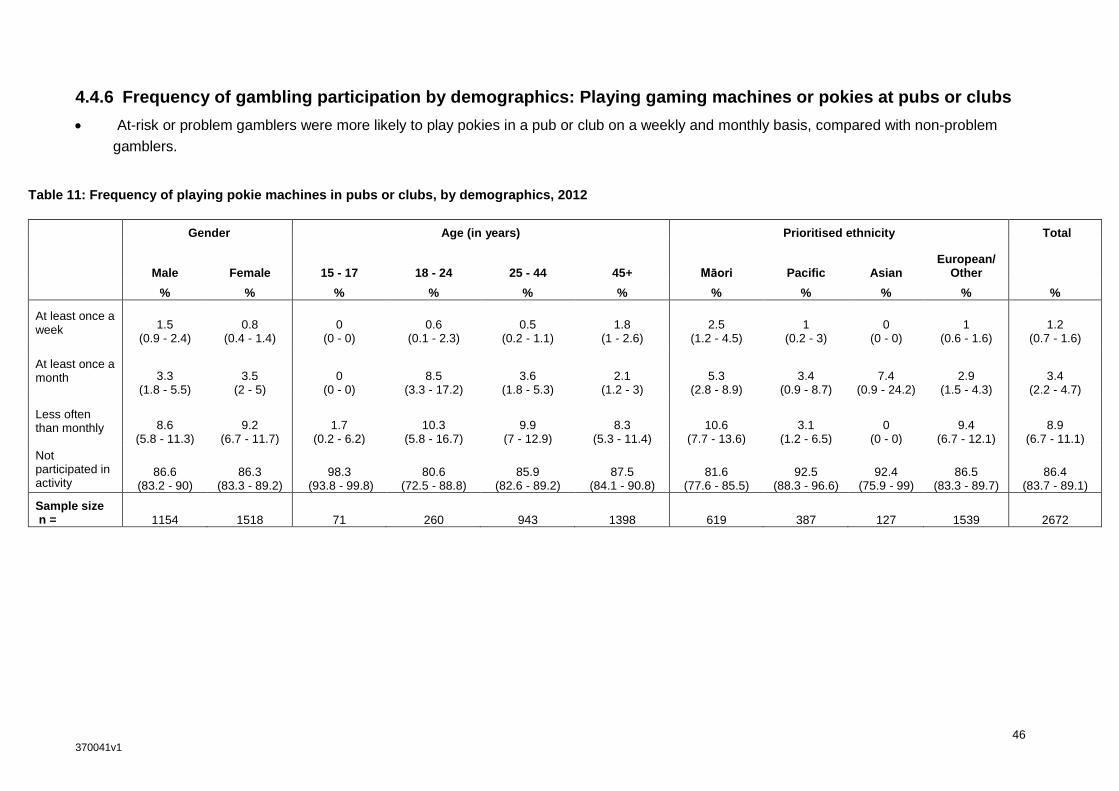
46 370041v1
4.4.6 Frequency of gambling participation by demographics: Playing gaming machines or pokies at pubs or clubs
At-risk or problem gamblers were more likely to play pokies in a pub or club on a weekly and monthly basis, compared with non-problem
gamblers.
Table 11: Frequency of playing pokie machines in pubs or clubs, by demographics, 2012
Gender Age (in years) Prioritised ethnicity Total
Male Female 15 - 17 18 - 24 25 - 44 45+ Māori Pacific Asian European/
Other
% % % % % % % % % % %
At least once a week 1.5
(0.9 - 2.4) 0.8
(0.4 - 1.4) 0
(0 - 0) 0.6
(0.1 - 2.3) 0.5
(0.2 - 1.1) 1.8
(1 - 2.6) 2.5
(1.2 - 4.5) 1
(0.2 - 3) 0
(0 - 0) 1
(0.6 - 1.6) 1.2
(0.7 - 1.6)
At least once a month 3.3
(1.8 - 5.5) 3.5
(2 - 5) 0
(0 - 0) 8.5
(3.3 - 17.2) 3.6
(1.8 - 5.3) 2.1
(1.2 - 3) 5.3
(2.8 - 8.9) 3.4
(0.9 - 8.7) 7.4
(0.9 - 24.2) 2.9
(1.5 - 4.3) 3.4
(2.2 - 4.7)
Less often than monthly 8.6
(5.8 - 11.3) 9.2
(6.7 - 11.7) 1.7
(0.2 - 6.2) 10.3
(5.8 - 16.7) 9.9
(7 - 12.9) 8.3
(5.3 - 11.4) 10.6
(7.7 - 13.6) 3.1
(1.2 - 6.5) 0
(0 - 0) 9.4
(6.7 - 12.1) 8.9
(6.7 - 11.1)
Not participated in activity
86.6 (83.2 - 90)
86.3 (83.3 - 89.2)
98.3 (93.8 - 99.8)
80.6 (72.5 - 88.8)
85.9 (82.6 - 89.2)
87.5 (84.1 - 90.8)
81.6 (77.6 - 85.5)
92.5 (88.3 - 96.6)
92.4 (75.9 - 99)
86.5 (83.3 - 89.7)
86.4 (83.7 - 89.1)
Sample size n = 1154 1518 71 260 943 1398 619 387 127 1539 2672
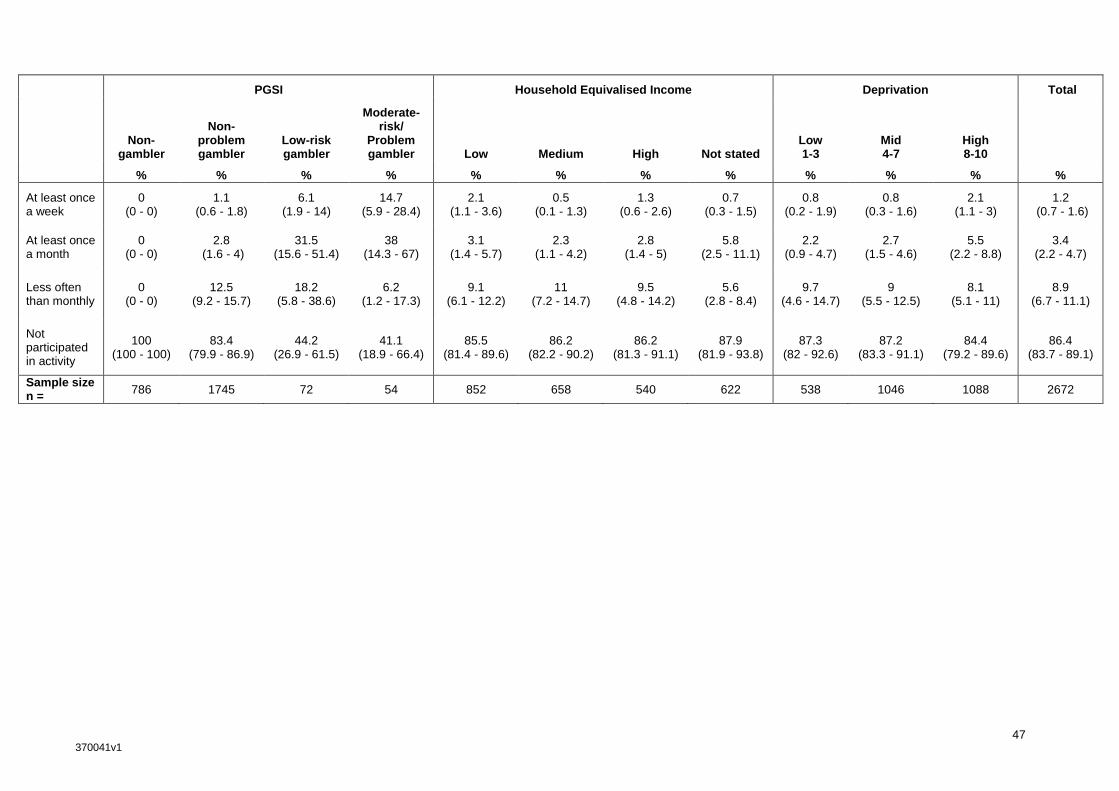
47 370041v1
PGSI Household Equivalised Income Deprivation Total
Non-gambler
Non-problem gambler
Low-risk gambler
Moderate-risk/
Problem gambler Low Medium High Not stated
Low 1-3
Mid 4-7
High 8-10
% % % % % % % % % % % %
At least once a week
0 (0 - 0)
1.1 (0.6 - 1.8)
6.1 (1.9 - 14)
14.7 (5.9 - 28.4)
2.1 (1.1 - 3.6)
0.5 (0.1 - 1.3)
1.3 (0.6 - 2.6)
0.7 (0.3 - 1.5)
0.8 (0.2 - 1.9)
0.8 (0.3 - 1.6)
2.1 (1.1 - 3)
1.2 (0.7 - 1.6)
At least once a month
0 (0 - 0)
2.8 (1.6 - 4)
31.5 (15.6 - 51.4)
38 (14.3 - 67)
3.1 (1.4 - 5.7)
2.3 (1.1 - 4.2)
2.8 (1.4 - 5)
5.8 (2.5 - 11.1)
2.2 (0.9 - 4.7)
2.7 (1.5 - 4.6)
5.5 (2.2 - 8.8)
3.4 (2.2 - 4.7)
Less often than monthly
0 (0 - 0)
12.5 (9.2 - 15.7)
18.2 (5.8 - 38.6)
6.2 (1.2 - 17.3)
9.1 (6.1 - 12.2)
11 (7.2 - 14.7)
9.5 (4.8 - 14.2)
5.6 (2.8 - 8.4)
9.7 (4.6 - 14.7)
9 (5.5 - 12.5)
8.1 (5.1 - 11)
8.9 (6.7 - 11.1)
Not participated in activity
100 (100 - 100)
83.4 (79.9 - 86.9)
44.2 (26.9 - 61.5)
41.1 (18.9 - 66.4)
85.5 (81.4 - 89.6)
86.2 (82.2 - 90.2)
86.2 (81.3 - 91.1)
87.9 (81.9 - 93.8)
87.3 (82 - 92.6)
87.2 (83.3 - 91.1)
84.4 (79.2 - 89.6)
86.4 (83.7 - 89.1)
Sample size n =
786 1745 72 54 852 658 540 622 538 1046 1088 2672
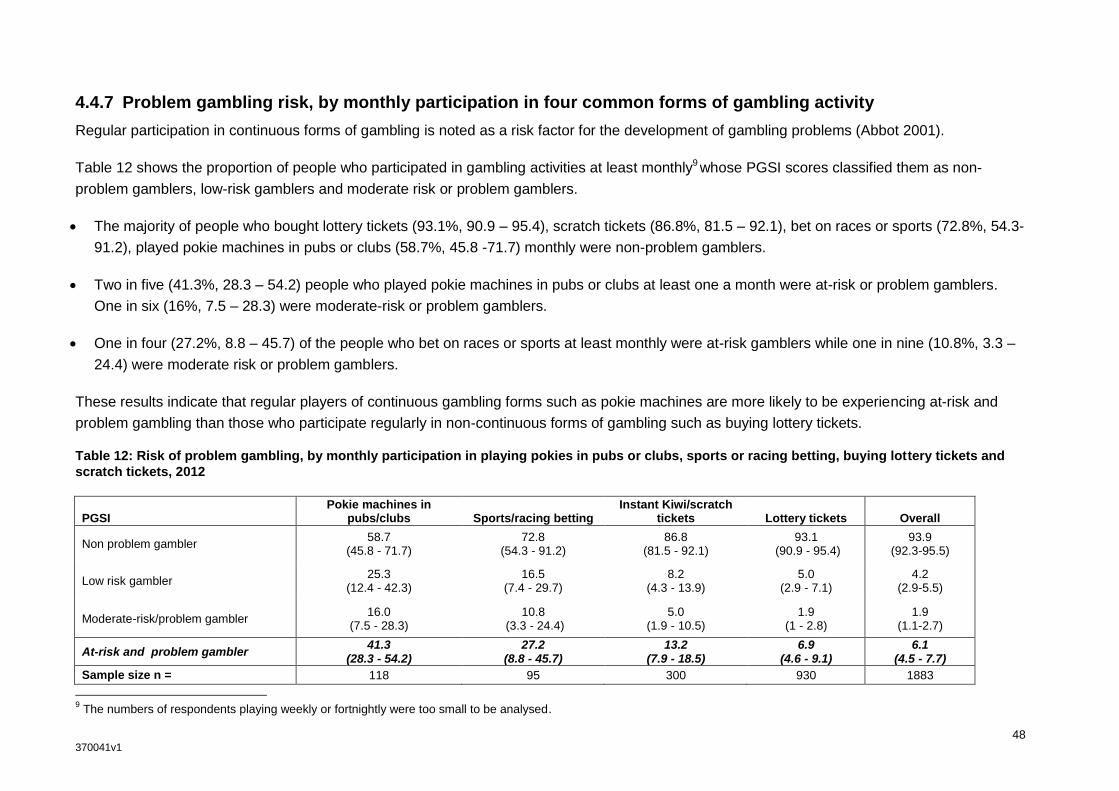
48 370041v1
4.4.7 Problem gambling risk, by monthly participation in four common forms of gambling activity
Regular participation in continuous forms of gambling is noted as a risk factor for the development of gambling problems (Abbot 2001).
Table 12 shows the proportion of people who participated in gambling activities at least monthly9 whose PGSI scores classified them as non-
problem gamblers, low-risk gamblers and moderate risk or problem gamblers.
The majority of people who bought lottery tickets (93.1%, 90.9 – 95.4), scratch tickets (86.8%, 81.5 – 92.1), bet on races or sports (72.8%, 54.3-
91.2), played pokie machines in pubs or clubs (58.7%, 45.8 -71.7) monthly were non-problem gamblers.
Two in five (41.3%, 28.3 – 54.2) people who played pokie machines in pubs or clubs at least one a month were at-risk or problem gamblers.
One in six (16%, 7.5 – 28.3) were moderate-risk or problem gamblers.
One in four (27.2%, 8.8 – 45.7) of the people who bet on races or sports at least monthly were at-risk gamblers while one in nine (10.8%, 3.3 –
24.4) were moderate risk or problem gamblers.
These results indicate that regular players of continuous gambling forms such as pokie machines are more likely to be experiencing at-risk and
problem gambling than those who participate regularly in non-continuous forms of gambling such as buying lottery tickets.
Table 12: Risk of problem gambling, by monthly participation in playing pokies in pubs or clubs, sports or racing betting, buying lottery tickets and
scratch tickets, 2012
PGSI Pokie machines in
pubs/clubs Sports/racing betting Instant Kiwi/scratch
tickets Lottery tickets Overall
Non problem gambler 58.7
(45.8 - 71.7) 72.8
(54.3 - 91.2) 86.8
(81.5 - 92.1) 93.1
(90.9 - 95.4) 93.9
(92.3-95.5)
Low risk gambler 25.3
(12.4 - 42.3) 16.5
(7.4 - 29.7) 8.2
(4.3 - 13.9) 5.0
(2.9 - 7.1) 4.2
(2.9-5.5)
Moderate-risk/problem gambler 16.0
(7.5 - 28.3) 10.8
(3.3 - 24.4) 5.0
(1.9 - 10.5) 1.9
(1 - 2.8) 1.9
(1.1-2.7)
At-risk and problem gambler 41.3
(28.3 - 54.2) 27.2
(8.8 - 45.7) 13.2
(7.9 - 18.5) 6.9
(4.6 - 9.1) 6.1
(4.5 - 7.7)
Sample size n = 118 95 300 930 1883
9 The numbers of respondents playing weekly or fortnightly were too small to be analysed.
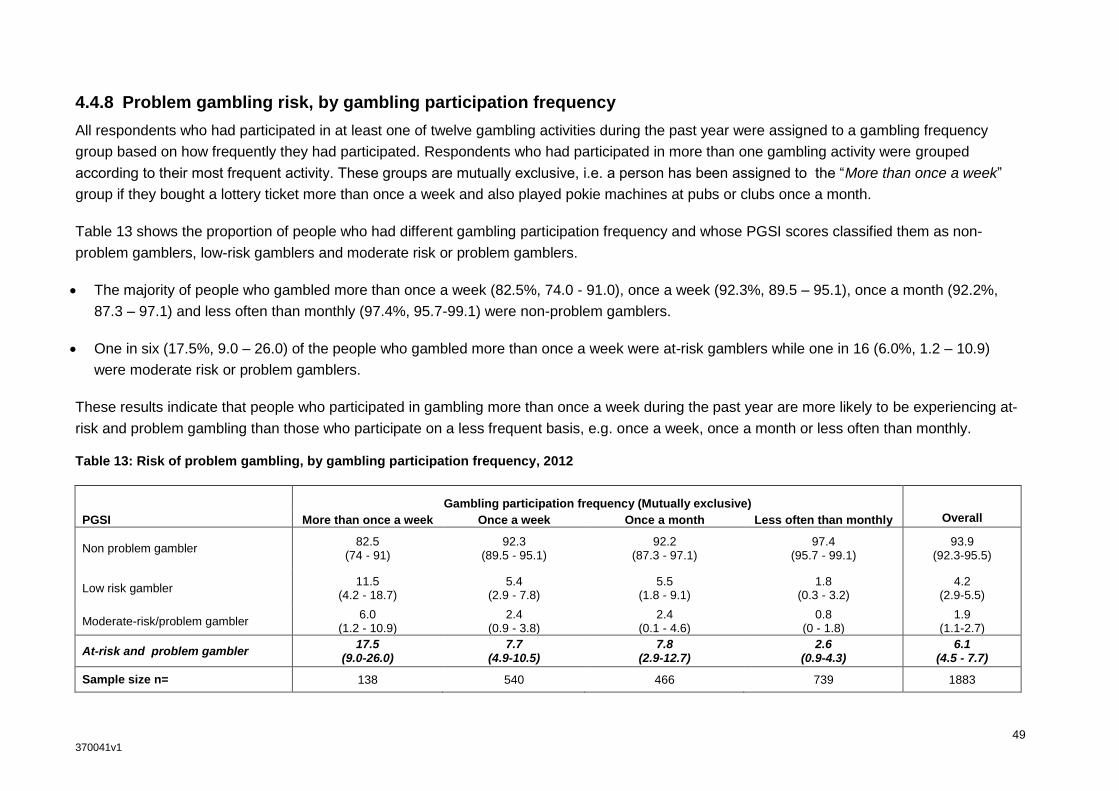
49 370041v1
4.4.8 Problem gambling risk, by gambling participation frequency
All respondents who had participated in at least one of twelve gambling activities during the past year were assigned to a gambling frequency
group based on how frequently they had participated. Respondents who had participated in more than one gambling activity were grouped
according to their most frequent activity. These groups are mutually exclusive, i.e. a person has been assigned to the “More than once a week”
group if they bought a lottery ticket more than once a week and also played pokie machines at pubs or clubs once a month.
Table 13 shows the proportion of people who had different gambling participation frequency and whose PGSI scores classified them as non-
problem gamblers, low-risk gamblers and moderate risk or problem gamblers.
The majority of people who gambled more than once a week (82.5%, 74.0 - 91.0), once a week (92.3%, 89.5 – 95.1), once a month (92.2%,
87.3 – 97.1) and less often than monthly (97.4%, 95.7-99.1) were non-problem gamblers.
One in six (17.5%, 9.0 – 26.0) of the people who gambled more than once a week were at-risk gamblers while one in 16 (6.0%, 1.2 – 10.9)
were moderate risk or problem gamblers.
These results indicate that people who participated in gambling more than once a week during the past year are more likely to be experiencing at-
risk and problem gambling than those who participate on a less frequent basis, e.g. once a week, once a month or less often than monthly.
Table 13: Risk of problem gambling, by gambling participation frequency, 2012
PGSI
Gambling participation frequency (Mutually exclusive)
More than once a week Once a week Once a month Less often than monthly Overall
Non problem gambler 82.5
(74 - 91) 92.3
(89.5 - 95.1) 92.2
(87.3 - 97.1) 97.4
(95.7 - 99.1) 93.9
(92.3-95.5)
Low risk gambler 11.5
(4.2 - 18.7) 5.4
(2.9 - 7.8) 5.5
(1.8 - 9.1) 1.8
(0.3 - 3.2) 4.2
(2.9-5.5)
Moderate-risk/problem gambler 6.0
(1.2 - 10.9) 2.4
(0.9 - 3.8) 2.4
(0.1 - 4.6) 0.8
(0 - 1.8) 1.9
(1.1-2.7)
At-risk and problem gambler 17.5
(9.0-26.0) 7.7
(4.9-10.5) 7.8
(2.9-12.7) 2.6
(0.9-4.3) 6.1
(4.5 - 7.7)
Sample size n= 138 540 466 739 1883

50 370041v1
4.5 NUMBER OF ACTIVITIES TAKEN PART IN DURING THE PREVIOUS 12 MONTHS
4.5.1 Number of gambling activities, 2012
Overall, around one in four (24.6%, 22.2 – 27.0) adults had gambled on one activity, and one in five (19.0%, 16.9 – 21.1) had gambled on two
activities.
Almost one in nine (11.7%, 10.1 – 13.3) had taken part in three activities and around one in seven (15.0%, 12.3 – 17.7) had taken part in four or
more activities.
The average number of activities people had participated in during the previous 12 months was 1.9 (1.7 -2.1).
Table 14: Number of gambling activities participated in during last 12 months, total population aged 15 years and over (unadjusted prevalence), 2012
Number of gambling activities in last year
Past-year participation (95% CI)
Prevalence (%) for total adults Prevalence (%) for past-year
gamblers Estimated number of people
None 29.7 (26.8 - 32.6) - 1,014,900 (916,500 - 1,114,900)
1 24.6 (22.2 – 27.0) 35 (31.3 - 38.6) 840,600 (752,800 - 928,300)
2 19.0 (16.9 - 21.1) 27.1 (24.3 - 29.8) 650,900 (584,400 - 716,700)
3 11.7 (10.1 - 13.3) 16.7 (14.5 - 18.8) 400,400 (348,700 - 452,100)
4 or more 15.0 (12.3 - 17.7) 21.3 (17.8 - 24.8) 513,000 (428,100 - 596,400)
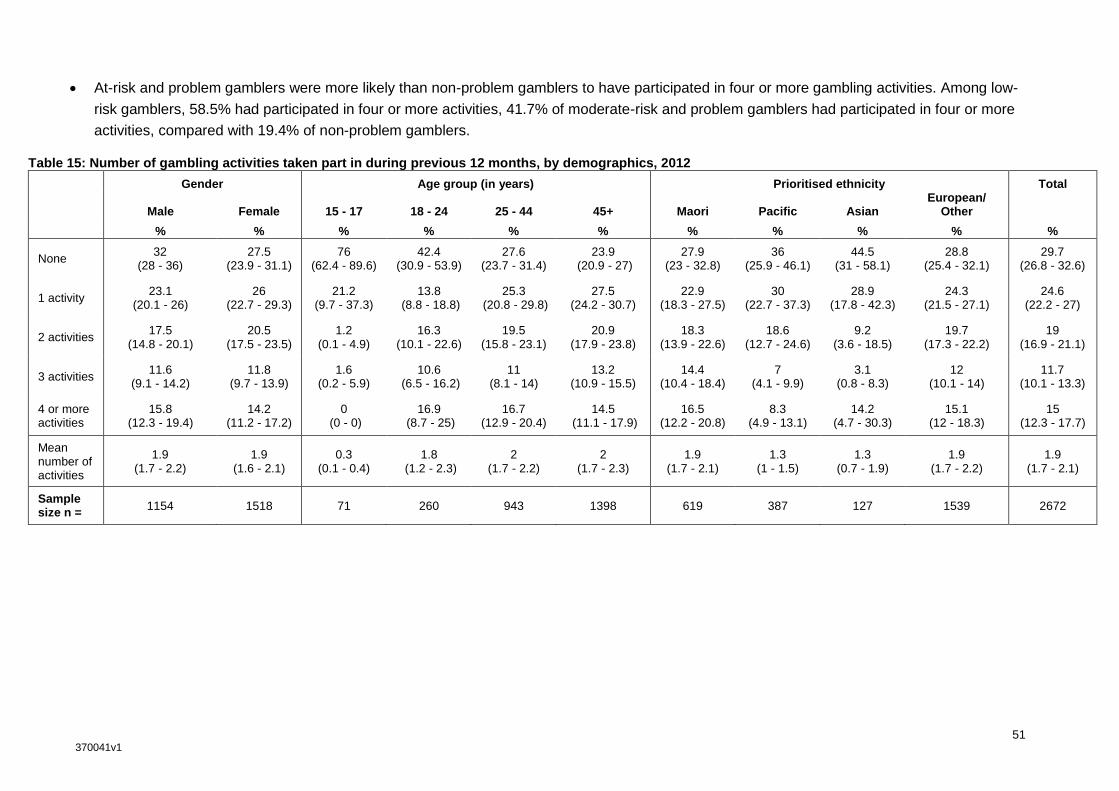
51 370041v1
At-risk and problem gamblers were more likely than non-problem gamblers to have participated in four or more gambling activities. Among low-
risk gamblers, 58.5% had participated in four or more activities, 41.7% of moderate-risk and problem gamblers had participated in four or more
activities, compared with 19.4% of non-problem gamblers.
Table 15: Number of gambling activities taken part in during previous 12 months, by demographics, 2012
Gender Age group (in years) Prioritised ethnicity Total
Male Female 15 - 17 18 - 24 25 - 44 45+ Maori Pacific Asian European/
Other
% % % % % % % % % % %
None 32
(28 - 36) 27.5
(23.9 - 31.1) 76
(62.4 - 89.6) 42.4
(30.9 - 53.9) 27.6
(23.7 - 31.4) 23.9
(20.9 - 27) 27.9
(23 - 32.8) 36
(25.9 - 46.1) 44.5
(31 - 58.1) 28.8
(25.4 - 32.1) 29.7
(26.8 - 32.6)
1 activity 23.1
(20.1 - 26) 26
(22.7 - 29.3) 21.2
(9.7 - 37.3) 13.8
(8.8 - 18.8) 25.3
(20.8 - 29.8) 27.5
(24.2 - 30.7) 22.9
(18.3 - 27.5) 30
(22.7 - 37.3) 28.9
(17.8 - 42.3) 24.3
(21.5 - 27.1) 24.6
(22.2 - 27)
2 activities 17.5
(14.8 - 20.1) 20.5
(17.5 - 23.5) 1.2
(0.1 - 4.9) 16.3
(10.1 - 22.6) 19.5
(15.8 - 23.1) 20.9
(17.9 - 23.8) 18.3
(13.9 - 22.6) 18.6
(12.7 - 24.6) 9.2
(3.6 - 18.5) 19.7
(17.3 - 22.2) 19
(16.9 - 21.1)
3 activities 11.6
(9.1 - 14.2) 11.8
(9.7 - 13.9) 1.6
(0.2 - 5.9) 10.6
(6.5 - 16.2) 11
(8.1 - 14) 13.2
(10.9 - 15.5) 14.4
(10.4 - 18.4) 7
(4.1 - 9.9) 3.1
(0.8 - 8.3) 12
(10.1 - 14) 11.7
(10.1 - 13.3)
4 or more activities
15.8 (12.3 - 19.4)
14.2 (11.2 - 17.2)
0 (0 - 0)
16.9 (8.7 - 25)
16.7 (12.9 - 20.4)
14.5 (11.1 - 17.9)
16.5 (12.2 - 20.8)
8.3 (4.9 - 13.1)
14.2 (4.7 - 30.3)
15.1 (12 - 18.3)
15 (12.3 - 17.7)
Mean number of activities
1.9 (1.7 - 2.2)
1.9 (1.6 - 2.1)
0.3 (0.1 - 0.4)
1.8 (1.2 - 2.3)
2 (1.7 - 2.2)
2 (1.7 - 2.3)
1.9 (1.7 - 2.1)
1.3 (1 - 1.5)
1.3 (0.7 - 1.9)
1.9 (1.7 - 2.2)
1.9 (1.7 - 2.1)
Sample size n =
1154 1518 71 260 943 1398 619 387 127 1539 2672

52 370041v1
PGSI Household Equivalised Income Deprivation Total
Non-gambler Non-problem
gambler Low-risk gambler
Moderate risk/Problem
gambler Low Medium High Not stated Low 1-3
Mid 4-7
High 8-10
% % % % % % % % % % % %
None 100
(100 - 100) 0
(0 - 0) 0
(0 - 0) 0
(0 - 0) 32.7
(27 - 38.4) 29.7
(25 - 34.4) 19
(14.8 - 23.1) 38.7
(31.1 - 46.2) 28
(23.2 - 32.8) 29
(24.8 - 33.3) 32.1
(25.6 - 38.7) 29.7
(26.8 - 32.6)
1 activity 0
(0 - 0) 35.9
(32.1 - 39.8) 9.4
(2.2 - 24.2) 24.7
(7.7 - 50.7) 23.8
(19 - 28.5) 25.5
(21.1 - 29.8) 25.4
(20.6 - 30.3) 23.5
(18.9 - 28.1) 26.4
(20.4 - 32.3) 26
(22.3 - 29.7) 20.9
(17.1 - 24.6) 24.6
(22.2 - 27)
2 activities 0
(0 - 0) 28
(25.1 - 30.9) 11.3
(3.4 - 25.4) 20.6
(8.1 - 39.3) 18.3
(14.4 - 22.2) 18.9
(15.2 - 22.7) 21.8
(17.5 - 26.1) 16.7
(12.6 - 20.9) 17.9
(13.9 - 22) 20.3
(16.7 - 23.8) 18.2
(15 - 21.5) 19
(16.9 - 21.1)
3 activities 0
(0 - 0) 16.7
(14.3 - 19) 20.8
(8.7 - 38.3) 13
(4.7 - 26.7) 11.6
(8.3 - 14.9) 11
(7.8 - 14.2) 14.7
(10.8 - 18.5) 9.3
(5.7 - 12.8) 12.8
(9.5 - 16.2) 10.1
(7.8 - 12.4) 13.1
(9.7 - 16.4) 11.7
(10.1 - 13.3)
4 or more activities 0
(0 - 0) 19.4
(15.9 - 22.9) 58.5
(40.7 - 76.4) 41.7
(17.5 - 69.2) 13.6
(9.3 - 18) 14.9
(10.8 - 19) 19.1
(13.7 - 24.6) 11.9
(6.7 - 17.1) 14.9
(9.3 - 20.4) 14.6
(10.6 - 18.6) 15.7
(10.9 - 20.5) 15
(12.3 - 17.7)
Mean number of activities
0 (0 - 0)
2.6 (2.4 - 2.9)
3.9 (3.3 - 4.6)
3.8 (1.8 - 5.7)
1.8 (1.5 - 2)
1.9 (1.6 - 2.2)
2.3 (1.9 - 2.7)
1.5 (1.2 - 1.9)
1.9 (1.5 - 2.4)
1.9 (1.6 - 2.2)
1.8 (1.5 - 2.1)
1.9 (1.7 - 2.1)
Sample size n = 786 1745 72 54 852 658 540 622 538 1046 1088 2672
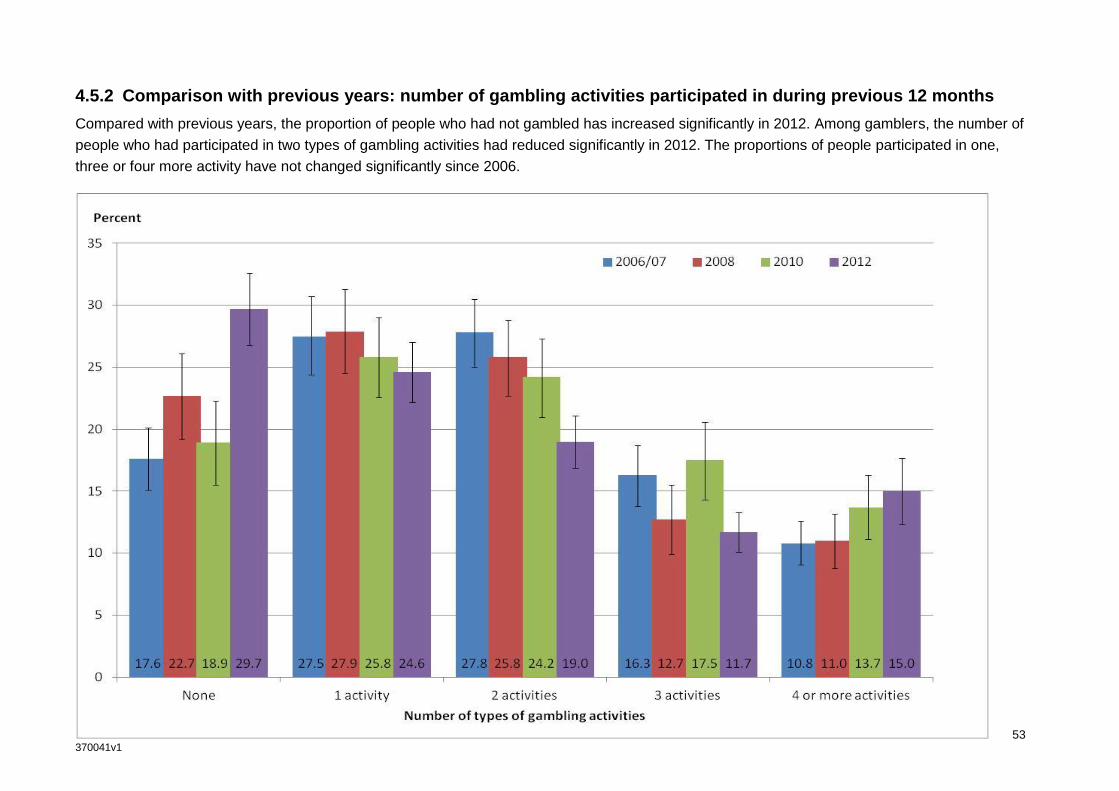
53 370041v1
4.5.2 Comparison with previous years: number of gambling activities participated in during previous 12 months
Compared with previous years, the proportion of people who had not gambled has increased significantly in 2012. Among gamblers, the number of
people who had participated in two types of gambling activities had reduced significantly in 2012. The proportions of people participated in one,
three or four more activity have not changed significantly since 2006.
Figure 8: Number of gambling activities participated in, 2006/07, 2008, 2010 and 2012

54 370041v1
REFERENCES
• Abbott, M.W. and Volberg, R.A. 1996. The New Zealand national survey of problem and pathological gambling. Journal of Gambling Studies 12(2): 143-160
• Abbott, M.W. 2001. What do we know about gambling and problem gambling in New Zealand. • Wellington, NZ: Department of Internal Affairs. • Blakely, T. 2002. The New Zealand Census-Mortality Study: Socioeconomic inequalities and
adult mortality 1991-94. Wellington: Ministry of Health • Department of Internal Affairs 2008. People’s Participation in, and Attitudes to, Gambling,
1985-2005. Wellington: Department of Internal Affairs • Department of Internal Affairs 2010a. Gambling Fact Sheet 3: Classes of Gambling. Accessed
from: http://www.dia.govt.nz/diawebsite.nsf/wpg_URL/Services-Casino-and-Non-Casino-Gaming- Fact-Sheets-(Gambling-Act-2003)?OpenDocument
• Department of Internal Affairs 2012. Gambling Expenditure Statistics. Retrieved from
http://www.dia.govt.nz/Resource-material-Information-We-Provide-Gaming-Statistics#two • Ferris, J and Wynne, H. 2001. The Canadian Problem Gambling Index: Final Report. Ottawa:
Canada • Health Promotion Agency. 2013. Methodology report for the 2012 Health and Lifestyles Survey.
Wellington: Health Promotion Agency Research and Evaluation Unit • Jensen, J. 1988. Income Equivalences and the Estimation of Family Expenditure on Children.
Wellington: Ministry of Health • Korn EL, Graubard BI. 1998. Confidence intervals for proportions with small expected number
of positive counts estimated from survey data. Survey Methodology 24: 193–201.
• Kott PS. 1998. Using the Delete-a-group Variance Estimator in NASS Surveys [revised July 2001]. Washington DC: National Agricultural Statistics Service, US Department of Agriculture.
• Ministry of Health 2004. Ethnicity Data Protocols for the Health and Disability Sector.
Wellington: Ministry of Health • Ministry of Health 2005. Preventing and Minimising Gambling Harm: Strategic Plan 2004-2010.
Wellington: Ministry of Health • Ministry of Health 2010. Living Standards and Health: New Zealand 2006/07. Wellington:
Ministry of Health • National Research Bureau 2007. 2006/07 Gaming and Betting Activities Survey: New
Zealanders’ knowledge, views and experience of gambling and gambling-related harm. Auckland: National Research Bureau
• Salmond, C. Crampton, P and Atkinson, J. 2007. NZDep2006 Index of Deprivation. Wellington: Department of Public Health, University of Otago