Embed Size (px)
Citation preview
New York State Youth Development Survey
2008 Results Report for:
Provided byNew York State Office of Alcoholism and Substance Abuse Services
April 2009
David A. Paterson, Governor
Karen M. Carpenter-Palumbo,Commissioner
7-12th Grade StudentsNew York City

Message from Commissioner Karen M. Carpenter-Palumbo I am pleased to present the New York State 2008 Youth Development Survey Report for your school district. Your support will allow us to better plan for prevention services to address our common goals of improving academic achievement and reducing the problem behaviors that can impede academic success, such as substance use, violence and dropping out of school. You and your students have helped us to measure the risk and protective factors that your community can modify to improve their long-term success. This report will help us to prioritize where and how to focus our resources. Thanks to the time, energy and commitment of many devoted individuals, more than 100,000 students were surveyed in over 400 schools, making this one of the largest student surveys New York State has ever conducted. I would like to thank each of the school district superintendents who approved the use of precious class time, and the faculty, prevention staff and coalition volunteers who administered the survey. While it is not possible for a single social institution to address all of our challenges, we have developed a data-driven planning process to better address the needs of our diverse schools, communities, county and state partners. Our prevention service providers and community coalitions can assist you in using the survey results to better address the risk & protective factors identified in this report. You can use our online prevention directory to locate a prevention provider serving within your county or borough:
http://www.oasas.state.ny.us/preventionDirectory/index.cfm
OASAS plans to support this survey every two years so that collectively we can track our progress in reducing substance use and other problem behaviors. Together we can improve our students’ academic achievements and help them live a healthy, happy and productive life.
Karen M. Carpenter-Palumbo
Commissioner

A special thanks to these planning improvement partners:
Council of Local Mental Hygiene Directors (CLMHD)
Association of Substance Abuse Professionals (ASAP) - Prevention Committee
Council on Addictions of New York State (CANYS)
Onondaga-Cortland-Madison B.O.C.E.S.
Tompkins-Seneca-Tioga B.O.C.E.S.
NYS School Boards Association
New York State O�ce of Alcoholism and Substance Abuse Services
Division of Outcome Management and System Investment
William J. Phillips, Associate Commissioner
Bureau of Research, Epidemiology and Practice Improvement
Robert J. Gallati, Dr. Gregory A. Rainone
Division of Prevention, Recovery, Technology and Management Services
Mary Ann DiChristopher, Acting Associate Commissioner
Bureau of Prevention Services
Dr. Barry R. Donovan
The New York State Youth Development Survey was produced by International Survey Associates/Pride Surveys under a contract with the NewYork State O�ce of Alcoholism and Substance Abuse Services. For more information, visit www.pridesurveys.com

Contents
1 INTRODUCTION 7
2 RISK AND PROTECTIVE FACTORS 10
2.1 HOW TO READ THE CHARTS . . . . . . . . . . . . . . . . . . . 11
3 ALCOHOL, TOBACCO, AND OTHER DRUG USE 18
3.1 HOW TO READ THE CHARTS . . . . . . . . . . . . . . . . . . . 18
4 GAMBLING PREVALENCE INFORMATION 28
4.1 HOW TO READ THE CHARTS . . . . . . . . . . . . . . . . . . . 28
5 SCHOOL SAFETY ISSUES 32
5.1 HOW TO READ THE CHARTS . . . . . . . . . . . . . . . . . . . 32
6 DRUG-FREE COMMUNITIES SUPPORT PROGRAM COREMEASURES 36
APPENDICES
A SCHOOL IMPROVEMENT USING SURVEY DATA 38
A.1 What are the numbers telling you? . . . . . . . . . . . . . . . . . . 38
A.2 How to decide if a rate is ”unacceptable.” . . . . . . . . . . . . . . 38
A.3 Use these data for planning: . . . . . . . . . . . . . . . . . . . . . 38
B PREVENTION RESOURCES 40
B.1 Additional Needs Assessment Resources . . . . . . . . . . . . . . . 40
C MODEL PROGRAMS RELATED TO RISK AND PROTECTIVEFACTORS 41
D RISK AND PROTECTIVE FACTORS DEFINITIONS 51
E COMPARISIONS OF CTC VS NYS YDS ON RISK ANDPROTECTIVE FACTORS 56
F DATA TABLES 57
F.1 Risk and Protective Factors . . . . . . . . . . . . . . . . . . . . . . 57
F.2 Lifetime Prevalence of Alcohol, Tobacco and Other Drugs . . . . . 65
F.3 Past 30 Day Prevalence of Alcohol, Tobacco and Other Drugs . . . 67
F.4 Heavy Use and Antisocial Behaviors . . . . . . . . . . . . . . . . . 69
F.5 Average Age of First Incidence . . . . . . . . . . . . . . . . . . . . 71
F.6 Sources and Locations of Alcohol Use . . . . . . . . . . . . . . . . 73
F.7 Gambling Behaviors . . . . . . . . . . . . . . . . . . . . . . . . . . 75
F.8 School Safety Issues . . . . . . . . . . . . . . . . . . . . . . . . . . 78
4

List of Tables
1 Student Totals . . . . . . . . . . . . . . . . . . . . . . . . . . . . . 7
2 Grade . . . . . . . . . . . . . . . . . . . . . . . . . . . . . . . . . 8
3 Sex . . . . . . . . . . . . . . . . . . . . . . . . . . . . . . . . . . . 8
4 Are you Hispanic or Latino? . . . . . . . . . . . . . . . . . . . . . . 8
5 Ethnic Origin . . . . . . . . . . . . . . . . . . . . . . . . . . . . . 9
6 Risk Factors That Inhibit Healthy Youth Development . . . . . . . . 10
7 Protective Factors That Promote Healthy Youth Development . . . 11
8 Core Measure by Grade for Past 30 Day Use . . . . . . . . . . . . . 36
9 Core Measure by Grade for Perception of Risk . . . . . . . . . . . . 36
10 Core Measure by Grade for Parental Disapproval . . . . . . . . . . . 36
11 Core Measure by Grade for Age of Onset . . . . . . . . . . . . . . . 37
12 Core Measure by Sex for Past 30 Day Use . . . . . . . . . . . . . . 37
13 Core Measure by Sex for Perception of Risk . . . . . . . . . . . . . 37
14 Core Measure by Sex for Parental Disapproval . . . . . . . . . . . . 37
15 Core Measure by Sex for Age of Onset . . . . . . . . . . . . . . . . 37
16 Risk and Protective Factor Scale Definition . . . . . . . . . . . . . 51
17 Percentage of Students Reporting Risks for Community Domain . . 57
18 Percentage of Students Reporting Risks for Family Domain . . . . . 58
19 Percentage of Students Reporting Risks for School Domain . . . . . 59
20 Percentage of Students Reporting Risks for Peer Domain . . . . . . 60
21 Percentage of Students Reporting Protection for Community Domain 61
22 Percentage of Students Reporting Protection for Family Domain . . 62
23 Percentage of Students Reporting Protection for School Domain . . 63
24 Percentage of Students Reporting Protection for Peer Domain . . . 64
25 Lifetime Prevalence of Alcohol, Tobacco and Other Drugs, By GradeLevel and Group . . . . . . . . . . . . . . . . . . . . . . . . . . . . 65
26 Lifetime Prevalence of Alcohol, Tobacco and Other Drugs, By GradeLevel and Group (continued) . . . . . . . . . . . . . . . . . . . . . 66
27 Past 30 Day Prevalence of Alcohol, Tobacco and Other Drugs, ByGrade Level and Group . . . . . . . . . . . . . . . . . . . . . . . . 67
28 Past 30 Day Prevalence of Alcohol, Tobacco and Other Drugs, ByGrade Level and Group (continued) . . . . . . . . . . . . . . . . . . 68
29 Percentage of Students With Heavy Use of Alcohol and Cigarettes . 69
30 Percentage of Students With Antisocial Behavior in the Past Year . 70
31 Average Age of First ATOD Use . . . . . . . . . . . . . . . . . . . 71
32 Average Age of First Antisocial Behavior . . . . . . . . . . . . . . . 72
33 Students’ Response to ”If you drank alcohol in the past year, howdid you usually get it?” . . . . . . . . . . . . . . . . . . . . . . . . 73
34 Students’ Response to ”If you drank alcohol in the past year, wheredid you usually drink it?” . . . . . . . . . . . . . . . . . . . . . . . 74
35 Percentage of Students Engaged in Gambling Activities . . . . . . . 75
36 Percentage of Students Engaged in Gambling Activities (continued) 76
37 Percentage of Students Engaged in Gambling Activities (continued) 77
38 Students’ Response to ”How many times in the past have you takena handgun to school?” . . . . . . . . . . . . . . . . . . . . . . . . 78
39 Students’ Response to ”How wrong do you think it is for someoneyour age to take a handgun to school?” . . . . . . . . . . . . . . . 79
5

List of Figures
1 Risk Factors - Grades 7-8 . . . . . . . . . . . . . . . . . . . . . . . 12
2 Risk Factors - Grades 9-10 . . . . . . . . . . . . . . . . . . . . . . 13
3 Risk Factors - Grades 11-12 . . . . . . . . . . . . . . . . . . . . . . 14
4 Protective Factors - Grades 7-8 . . . . . . . . . . . . . . . . . . . . 15
5 Protective Factors - Grades 9-10 . . . . . . . . . . . . . . . . . . . 16
6 Protective Factors - Grades 11-12 . . . . . . . . . . . . . . . . . . 17
7 Alcohol, Tobacco and Other Drug Use - Grades 7-8 . . . . . . . . . 19
8 Alcohol, Tobacco and Other Drug Use - Grades 9-10 . . . . . . . . 20
9 Alcohol, Tobacco and Other Drug Use - Grades 11-12 . . . . . . . . 21
10 No Child Left Behind Profile - Grades 7-8 . . . . . . . . . . . . . . 22
11 No Child Left Behind Profile - Grades 9-10 . . . . . . . . . . . . . . 23
12 No Child Left Behind Profile - Grades 11-12 . . . . . . . . . . . . . 24
13 Sources and Locations of Alcohol Use - Grades 7-8 . . . . . . . . . 25
14 Sources and Locations of Alcohol Use - Grades 9-10 . . . . . . . . . 26
15 Sources and Locations of Alcohol Use - Grades 11-12 . . . . . . . . 27
16 Gambling Behaviors - Grades 7-8 . . . . . . . . . . . . . . . . . . . 29
17 Gambling Behaviors - Grades 9-10 . . . . . . . . . . . . . . . . . . 30
18 Gambling Behaviors - Grades 11-12 . . . . . . . . . . . . . . . . . . 31
19 School Safety Profile - Grades 7-8 . . . . . . . . . . . . . . . . . . 33
20 School Safety Profile - Grades 9-10 . . . . . . . . . . . . . . . . . . 34
21 School Safety Profile - Grades 11-12 . . . . . . . . . . . . . . . . . 35
6

1. INTRODUCTION
This report summarizes findings from the New York State Youth DevelopmentSurvey conducted in the Fall of 2008. The survey instrument was designed to assessrisk and protective factors that predict substance use and other problem behaviorssuch as delinquency. The survey also measures substance use, youth gamblingand other problem behaviors. In addition, grade groups and gender comparisonsoften are provided as well. This survey was completed by students in 409 selectedschools throughout the state of New York. Of the estimated total of 125,000students eligible to participate in the survey, 111,647 did so, for an overall responserate of 89.3%.
OASAS uses a number of surveys in assessing the prevalence of substance use,gambling and related problems. The YDS is especially valuable because it providesinformation on risk and protective factors for school districts and county planning.However, due to di↵erences in survey design, sampling methods, months of admin-istration and estimation methods, the substance use, gambling and other resultswill di↵er somewhat across the di↵erent surveys, such as, the Youth DevelopmentSurvey conducted by ISA/PRIDE, the Youth Risk Behavior Survey (YRBS) con-ducted by the Centers for Disease Control and Prevention, and The National Surveyon Drug Use and Health (NSDUH) conducted by the Substance Abuse and MentalHealth Services Administration (SAMHSA) as well as other OASAS Surveys.All these surveys are used by OASAS for policy development and planning at thestate and regional levels.
An important measure of the statistical precision of the survey is called the confi-dence interval. The size of the confidence interval is determined, in large part, bythe number of students participating in the survey. Because of the large number ofstudents participating in the NYS YDS, for all of the statewide analyses we estimatethat the confidence interval is quite small, typically ±1% or smaller. To understandwhat this means, suppose that 50% of the survey students reported using alcoholsometime in their lifetime. A confidence interval of ±1% means that there is a95% likelihood that the true percentage of students who have tried alcohol is 50%±1%, or from 49% to 51%. (When examining results at the county- or district-levels, the number of students included in the analyses is smaller, and the size ofthe confidence interval will increase. The calculated confidence intervals will benoted in those reports.)
As noted above, 111,647 students from the 7th-12th grades returned survey formsfor scoring. Following receipt of the surveys, all survey forms were checked todetermine the validity and reliability of the data. A small percentage of studentswere judged to have returned invalid survey data. For example, students whoclaimed to use all drugs at the highest levels of use were eliminated from the finaldata set. In total, five separate checks of the logical consistency and validity of
the students’ responses were conducted. In addition, additional checks were madeof survey findings aggregated at the classroom- and school-levels. For example, ina small number of cases it was clear that students did not have su�cient time toappropriately respond to the surveys, and students from these classes were excludedfrom the data set. In total, 19,565 surveys, or 17.5% of the total, were excludedfrom further analyses. This process resulted in a final count of 92,082 valid surveysfrom 7th-12th grade New York students.
Tables 1-5 contain comparisons to New York City and state data.
Table 1 contains a count of the students included in this report. Table 2 providesinformation on the number and percent of students surveyed at each grade level.Table 3 provides information on the number and percent of students surveyed bysex. Table 4 provides information on the number and percent of students surveyedby Hispanic status. Table 5 provides information on the number and percent ofstudents surveyed by race and ethnicity.
Table 1: Student Totals
Response Group 2008Total Students new york city 33,782
state 92,082
7

Table 2: Grade
2008Response Group pct n7 new york city 23.2 7,853
state 19.8 18,265
8 new york city 26.9 9,078state 21.4 19,668
9 new york city 12.3 4,150state 15.2 14,029
10 new york city 12.7 4,306state 15.2 13,990
11 new york city 12.5 4,219state 14.2 13,090
12 new york city 12.4 4,176state 14.2 13,040
Table 3: Sex
2008Response Group pct nMale new york city 46.2 14,862
state 46.6 41,487
Female new york city 53.8 17,311state 53.4 47,511
Table 4: Are you Hispanic or Latino?
2008Response Group pct nNo new york city 57.0 18,549
state 77.5 68,578
Yes new york city 43.0 13,967state 22.5 19,883
8

Table 5: Ethnic Origin
2008Response Group pct nAsian American new york city 11.2 3,594
state 5.8 5,197
Black or African American new york city 30.2 9,691state 14.3 12,760
Native American or Alaska Native new york city 0.6 206state 1.2 1,040
Native Hawaiian or Pacific Islander new york city 0.7 220state 0.5 479
White new york city 10.2 3,286state 52.4 46,790
Multi Racial new york city 10.4 3,329state 8.0 7,180
Other new york city 36.7 11,793state 17.8 15,881
9

2. RISK AND PROTECTIVE FACTORS
Risk and protective factor-focused prevention is based on a simple premise: Toprevent a problem from happening, we need to identify the factors that increasethe risk of that problem developing and then find ways to reduce the risks. Just asmedical researchers have found risk factors for heart attacks such as diets high infats, lack of exercise, and smoking, a team of researchers, the Social DevelopmentResearch Group (SDRG), at the University of Washington has defined a set of riskfactors for drug abuse. The research team also found that some children exposedto multiple risk factors manage to avoid behavior problems later even though theywere exposed to the same risks as children who exhibited behavior problems. Basedon research, the team identified protective factors and processes that work togetherto bu↵er children from the e↵ects of high risk exposure and lead to the developmentof healthy behaviors.
Risk factors include characteristics of school, community, and family environments,as well as characteristics of students and their peer groups that are known to predictincreased likelihood of drug use, delinquency, and violent behaviors among youth(Hawkins, Catalano & Miller, 1992; Hawkins, Arthur & Catalano, 1995; Brewer,Hawkins, Catalano & Neckerman, 1995).
Protective factors exert a positive influence or bu↵er against the negative influ-ence of risk, thus reducing the likelihood that adolescents will engage in problembehaviors. Protective factors identified through research reviewed by the SocialDevelopment Research Group include: Social bonding to family, school, commu-nity and peers; and healthy beliefs and clear standards for behavior.
Research on risk and protective factors has important implications for preventione↵orts. The premise of this approach is that in order to promote positive youthdevelopment and prevent problem behaviors, it is necessary to address those factorsthat predict the problem. By measuring risk and protective factors in a population,specific risk factors that are elevated and widespread can be identified and tar-geted by preventive interventions that also promote related protective factors. Forexample, if academic failure is identified as an elevated risk factor in a commu-nity, then mentoring and tutoring interventions can be provided that will improveacademic performance, and also increase opportunities and rewards for classroomparticipation.
Risk and protective factor-focused drug abuse prevention is based on the work of J.David Hawkins, Ph.D., Richard F. Catalano, Ph.D.; and a team of researchers atthe University of Washington in Seattle. Beginning in the early 1980’s, the groupresearched adolescent problem behaviors and identified risk factors for adolescentdrug abuse and delinquency. The chart below shows the links between the 16 riskfactors and the five problem behaviors. The check marks have been placed in the
chart to indicate where at least two well designed, published research studies haveshown a link between the risk factor and the problem behavior.
Table 6: Risk Factors That Inhibit Healthy Youth Development
PROBLEM BEHAVIORS
Risk Factors Subst
ance
Abuse
Del
inquen
cy
Tee
nPre
gnan
cy
Sch
ool
Dro
p-O
ut
Vio
lence
Community
Availability of Alcohol and Other Drugs 3 3
Community Laws and Norms Favorable
Toward Substance Use3 3 3
Transitions and Mobility 3 3 3
Low Neighborhood Attachment 3 3 3
Community Disorganization 3 3 3
Extreme Economic Deprivation 3 3 3 3 3
Family
Family History of the Problem Behavior 3 3 3 3 3
Family Management Problems 3 3 3 3 3
Family Conflict 3 3 3 3 3
Parental Attitudes Favorable Towards
Drugs/Other Problem Behavior3 3 3
School
Academic Failure 3 3 3 3 3
Low Commitment to School 3 3 3 3 3
Individual/Peer
Early Initiation of Drug Use 3 3 3 3 3
Early Initiation of Problem Behavior 3 3 3 3 3
Rebelliousness 3 3 3
Friends Who Use Drugs/
Engage in Other Problem Behavior3 3 3 3 3
Favorable Attitudes Towards Drug Use/
Other Problem Behavior3 3 3 3
Perceived Risk of Drug Use 3
Peer Rewards for Drug Use 3
Depressive Symptoms 3
3 Indicates that 2 or more epidemiological prospective studies havefound the risk factor to predict youth problem behavior.
10

Table 7: Protective Factors That Promote Healthy Youth Development
Community
Community Opportunities for Prosocial Involvement
Community Rewards for Prosocial Involvement
Family
Family Opportunities for Prosocial Involvement
Family Rewards for Prosocial Involvement
Family Attachment
School
School Opportunities for Prosocial Involvement
School Prosocial Involvement
School Rewards for Prosocial Involvement
Individual/Peer
Religiosity
Belief in the Moral Order
Social Skills
2.1. HOW TO READ THE CHARTS
1. Brief definitions of the risk and protective factors can be found on page 51.
2. The factors are grouped into 4 domains: community, family, school, and peer-individual.
3. Scanning across these charts, you can easily determine which factors are most(or least) prevalent, thus identifying which are the most important for yourcommunity to address.
4. Actual percentages are provided in the data tables in Appendix F on page 57.The tables provide percentage figures for New York City and state level. Theheaders for each column represent the factors for each domain and the per-centage figures represent the percent of students whose factor score exceedsthe cuto↵ point for the particular factor. Suppose, for a specific risk factor,that the percentage figure for the line ”Combined” and ”State” is 42.3. Thatwould mean that 42.3 percent of all surveyed students in the state were abovethe cuto↵ point for that factor.
5. The bars represent the percent of students in the grouped grades who reportedelevated risk or protection.
6. Bars are complemented by a red dash. The red dash shows the comparisonfrom the state and provides additional information for you in determining therelative importance of each risk or protective factor.
7. A dashed line on each risk and protective factor chart represents the percentageof youth at risk or with protection for the seven state sample upon which thecut-points were developed. The seven states included in the norm group wereColorado, Illinois, Kansas, Maine, Oregon, Utah and Washington. This givesyou a comparison to a large multi-state baseline sample.
8. The following abbreviations are sometimes used in the tables and charts dueto space constraints:
ATOD stands for Alcohol, Tobacco and Other Drug Use.ASB stands for Antisocial Behaviors.PSI stands for Prosocial Involvement.
11

Risk Factors - Grades 7-8
Risk Factors - Grades 7-8
Low
Neig
hbor
hood
Atta
chm
ent
High
Com
mun
ity D
isorg
aniza
tion
Laws
and
Nor
ms
Favo
rabl
e to
Dru
g Us
e
Perc
eive
d Av
aila
bility
of D
rugs
Poor
Fam
ily M
anag
emen
t
Fam
ily C
onflic
t
Fam
ily H
istor
y of
Ant
isocia
l Beh
avio
r
Pare
ntal
Atti
tude
s Fa
vora
ble
to A
TOD
Pare
ntal
Atti
tude
s Fa
vora
ble
to A
SB
Acad
emic
Failu
re
Low
Com
mitm
ent t
o Sc
hool
Rebe
llious
ness
Early
Initia
tion
of D
rug
Use
Early
Initia
tion
of A
SB
Favo
rabl
e At
titud
es to
Dru
g Us
e
Favo
rabl
e At
titud
es to
ASB
Perc
eive
d Ri
sk o
f Dru
g Us
e
Inte
ract
ion
with
Ant
isocia
l Pee
rs
Frie
nds'
Use
of D
rugs
Depr
essiv
e Sy
mpt
oms
Peer
Rew
ards
for A
ntiso
cial B
ehav
ior0
10
20
30
40
50
60 Community Family School Individual/Peer
Perc
enta
ges
(%)
New York City 2008
State 2008
7-State Norm
Figure 1: Risk Factors - Grades 7-8
12

Risk Factors - Grades 9-10
Risk Factors - Grades 9-10
Low
Neig
hbor
hood
Atta
chm
ent
High
Com
mun
ity D
isorg
aniza
tion
Laws
and
Nor
ms
Favo
rabl
e to
Dru
g Us
e
Perc
eive
d Av
aila
bility
of D
rugs
Poor
Fam
ily M
anag
emen
t
Fam
ily C
onflic
t
Fam
ily H
istor
y of
Ant
isocia
l Beh
avio
r
Pare
ntal
Atti
tude
s Fa
vora
ble
to A
TOD
Pare
ntal
Atti
tude
s Fa
vora
ble
to A
SB
Acad
emic
Failu
re
Low
Com
mitm
ent t
o Sc
hool
Rebe
llious
ness
Early
Initia
tion
of D
rug
Use
Early
Initia
tion
of A
SB
Favo
rabl
e At
titud
es to
Dru
g Us
e
Favo
rabl
e At
titud
es to
ASB
Perc
eive
d Ri
sk o
f Dru
g Us
e
Inte
ract
ion
with
Ant
isocia
l Pee
rs
Frie
nds'
Use
of D
rugs
Depr
essiv
e Sy
mpt
oms
Peer
Rew
ards
for A
ntiso
cial B
ehav
ior0
10
20
30
40
50
60
70 Community Family School Individual/Peer
Perc
enta
ges
(%)
New York City 2008
State 2008
7-State Norm
Figure 2: Risk Factors - Grades 9-10
13

Risk Factors - Grades 11-12
Risk Factors - Grades 11-12
Low
Neig
hbor
hood
Atta
chm
ent
High
Com
mun
ity D
isorg
aniza
tion
Laws
and
Nor
ms
Favo
rabl
e to
Dru
g Us
e
Perc
eive
d Av
aila
bility
of D
rugs
Poor
Fam
ily M
anag
emen
t
Fam
ily C
onflic
t
Fam
ily H
istor
y of
Ant
isocia
l Beh
avio
r
Pare
ntal
Atti
tude
s Fa
vora
ble
to A
TOD
Pare
ntal
Atti
tude
s Fa
vora
ble
to A
SB
Acad
emic
Failu
re
Low
Com
mitm
ent t
o Sc
hool
Rebe
llious
ness
Early
Initia
tion
of D
rug
Use
Early
Initia
tion
of A
SB
Favo
rabl
e At
titud
es to
Dru
g Us
e
Favo
rabl
e At
titud
es to
ASB
Perc
eive
d Ri
sk o
f Dru
g Us
e
Inte
ract
ion
with
Ant
isocia
l Pee
rs
Frie
nds'
Use
of D
rugs
Depr
essiv
e Sy
mpt
oms
Peer
Rew
ards
for A
ntiso
cial B
ehav
ior0
10
20
30
40
50
60
70
80 Community Family School Individual/Peer
Perc
enta
ges
(%)
New York City 2008
State 2008
7-State Norm
Figure 3: Risk Factors - Grades 11-12
14

Protective Factors - Grades 7-8
Protective Factors - Grades 7-8
Opp
ortu
nitie
s fo
r Pro
socia
l Inv
olve
men
t
Rewa
rds
for P
roso
cial I
nvol
vem
ent
Fam
ily A
ttach
men
t
Fam
ily O
ppor
tuni
ties
for P
SI
Fam
ily R
ewar
ds fo
r PSI
Scho
ol O
ppor
tuni
ties
for P
SI
Scho
ol R
ewar
ds fo
r PSI
Relig
iosit
y
Socia
l Skil
ls
Belie
f in
a M
oral
Ord
er
Pros
ocia
l Inv
olve
men
t
Peer
Rew
ards
for P
roso
cial I
nvol
vem
ent0
10
20
30
40
50
60
70
80 Community Family School Individual/Peer
Perc
enta
ges
(%)
New York City 2008
State 2008
7-State Norm
Figure 4: Protective Factors - Grades 7-8
15

Protective Factors - Grades 9-10
Protective Factors - Grades 9-10
Opp
ortu
nitie
s fo
r Pro
socia
l Inv
olve
men
t
Rewa
rds
for P
roso
cial I
nvol
vem
ent
Fam
ily A
ttach
men
t
Fam
ily O
ppor
tuni
ties
for P
SI
Fam
ily R
ewar
ds fo
r PSI
Scho
ol O
ppor
tuni
ties
for P
SI
Scho
ol R
ewar
ds fo
r PSI
Relig
iosit
y
Socia
l Skil
ls
Belie
f in
a M
oral
Ord
er
Pros
ocia
l Inv
olve
men
t
Peer
Rew
ards
for P
roso
cial I
nvol
vem
ent0
10
20
30
40
50
60
70
80
90 Community Family School Individual/Peer
Perc
enta
ges
(%)
New York City 2008
State 2008
7-State Norm
Figure 5: Protective Factors - Grades 9-10
16

Protective Factors - Grades 11-12
Protective Factors - Grades 11-12
Opp
ortu
nitie
s fo
r Pro
socia
l Inv
olve
men
t
Rewa
rds
for P
roso
cial I
nvol
vem
ent
Fam
ily A
ttach
men
t
Fam
ily O
ppor
tuni
ties
for P
SI
Fam
ily R
ewar
ds fo
r PSI
Scho
ol O
ppor
tuni
ties
for P
SI
Scho
ol R
ewar
ds fo
r PSI
Relig
iosit
y
Socia
l Skil
ls
Belie
f in
a M
oral
Ord
er
Pros
ocia
l Inv
olve
men
t
Peer
Rew
ards
for P
roso
cial I
nvol
vem
ent0
10
20
30
40
50
60
70
80
90 Community Family School Individual/Peer
Perc
enta
ges
(%)
New York City 2008
State 2008
7-State Norm
Figure 6: Protective Factors - Grades 11-12
17

3. ALCOHOL, TOBACCO, AND OTHER DRUGUSE
The graphs in this section of the report are six di↵erent areas of ATOD use andAntisocial Behavior. These are:
Lifetime Use of ... The questions ”On how many occasions have you used ... inyour lifetime?” are used to measure this statistic by reporting the percentageof students who reported any use of a particular substance in their lifetime.
Past 30 Day Use of ... The questions ”On how many occasions have you used ...during the past 30 days?” are used to measure this statistic by reporting thepercentage of students who reported any use of a particular substance duringthe past 30 days.
Heavy Use of Alcohol and Cigarettes The questions ”How many times in thepast two weeks have you had five or more drinks of alcohol in a row?” and”How frequently have you smoked cigarettes during the past 30 days?” areused to measure this statistic by reporting the percentage of students whoreport any binge drinking or smoking a pack or more of cigarettes per dayduring the past 30 days.
Average Age of First Use of ATOD and Antisocial Behaviors The questions”How old were you when you first ...?” are used to measure this statisticby reporting the average age of first exhibiting the particular behavior whetherit be using a particular drug or engaging in a particular behavior. The averageis based on only those students who reported the behavior.
How Students Get Alcohol and Where They Use It The questions ”How didyou usually get alcohol?” and ”Where Did You Usually Drink it?” are used tomeasure this statistic by reporting the percentage of students for each methodof acquiring alcohol and the locations where they used alcohol.
3.1. HOW TO READ THE CHARTS
1. Student responses for substance use and antisocial behavior questions are dis-played by grade groupings on the following pages.
2. Actual percentages are provided in the data tables in Appendix F on page 65.The tables provide percentage figures for New York City and state level and,for students in grades 8, 10 and 12, estimates of lifetime and past 30 dayssubstance use from a national survey (MTF - Monitoring the Future). Theheaders represent the various drugs or activities and the percentage figuresrepresent the percent of students who responded positively to the question.For example, for the table ”Lifetime Prevalence of Use”, if the ”Combined”and ”State” percentage figure for a specific drug is 32.3, then 32.3 percent ofall surveyed students in the state responded that they had used that drug atleast once in their lifetime. In the case of the average age tables, the figuresrepresent the average age of the first use of a particular drug or first incidenceof a particular behavior. In the case of the average age tables, the figuresrepresent the average age of the first use of a particular drug or first incidenceof a particular behavior.
3. The bars represent the percent of students in the grouped grades who reportedsubstance use.
4. Bars are complemented by a red dash. The red dash shows the comparisonfrom the state and provides additional information for you in determining therelative importance of each behavior.
5. The following abbreviations are sometimes used in the tables and charts dueto space constraints:
ATOD stands for Alcohol, Tobacco and Other Drug Use.ASB stands for Antisocial Behaviors.
18

Alcohol, Tobacco and Other Drug Use - Grades 7-8
Alcohol, Tobacco and Other Drug Use - Grades 7-8
*Any Illicit Drug - all drugs except for alcohol and tobacco**Binge Drinking - having five or more drinks in a row within the past two weeks.***Pack of Cigarettes means smoking a pack or more per day.
Alco
hol
Mar
ijuan
a
Ciga
rette
s
Chew
ing
Toba
cco
Pres
crip
tion
Drug
s
OTC
Col
d M
edici
ne
OTC
Caf
fein
e/Di
et P
ills
Inha
lant
s
Coca
ine
Hero
in
Any
Illicit
Dru
g*
Alco
hol
Mar
ijuan
a
Ciga
rette
s
Chew
ing
Toba
cco
Pres
crip
tion
Drug
s
OTC
Col
d M
edici
ne
OTC
Caf
fein
e/Di
et P
ills
Inha
lant
s
Coca
ine
Hero
in
Any
Illicit
Dru
g*
Bing
e Dr
inkin
g**
Pack
of C
igar
ette
s***
0
10
20
30
40 Lifetime Use Past 30 Days Heavy Use
Perc
enta
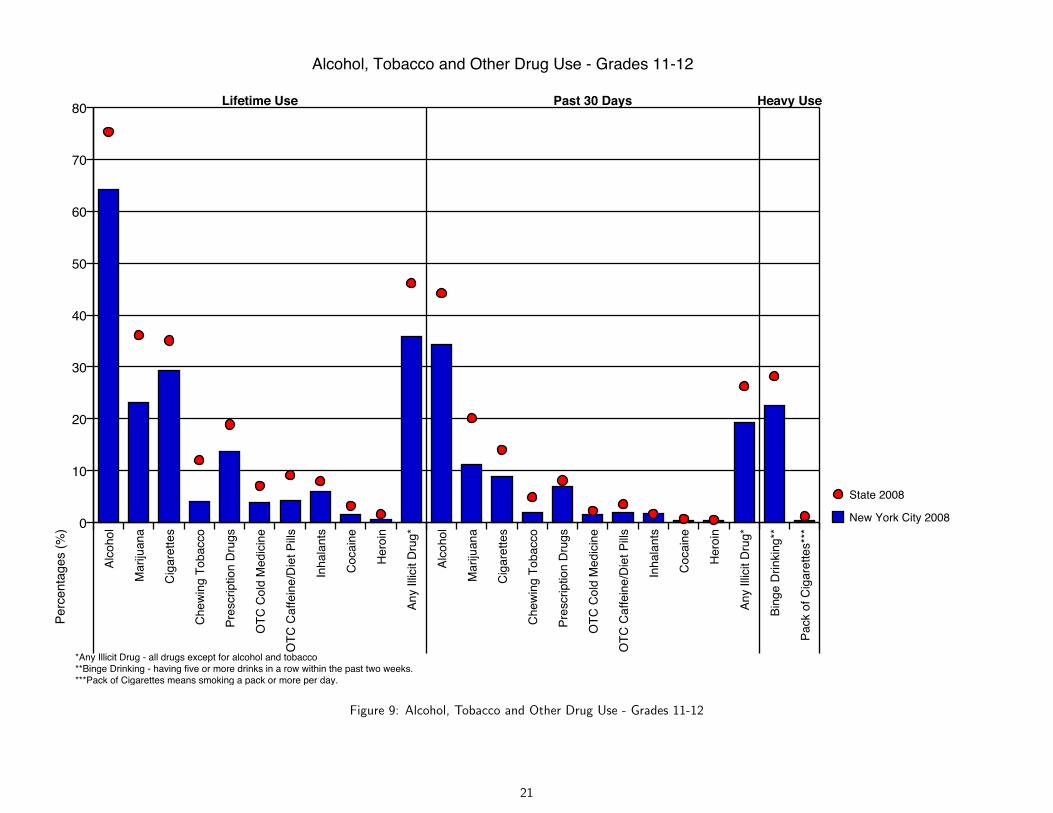
ges
(%)
New York City 2008
State 2008
Figure 7: Alcohol, Tobacco and Other Drug Use - Grades 7-8
19

Alcohol, Tobacco and Other Drug Use - Grades 9-10
Alcohol, Tobacco and Other Drug Use - Grades 9-10
*Any Illicit Drug - all drugs except for alcohol and tobacco**Binge Drinking - having five or more drinks in a row within the past two weeks.***Pack of Cigarettes means smoking a pack or more per day.
Alco
hol
Mar
ijuan
a
Ciga
rette
s
Chew
ing
Toba
cco
Pres
crip
tion
Drug
s
OTC
Col
d M
edici
ne
OTC
Caf
fein
e/Di
et P
ills
Inha
lant
s
Coca
ine
Hero
in
Any
Illicit
Dru
g*
Alco
hol
Mar
ijuan
a
Ciga
rette
s
Chew
ing
Toba
cco
Pres
crip
tion
Drug
s
OTC
Col
d M
edici
ne
OTC
Caf
fein
e/Di
et P
ills
Inha
lant
s
Coca
ine
Hero
in
Any
Illicit
Dru
g*
Bing
e Dr
inkin
g**
Pack
of C
igar
ette
s***
0
10
20
30
40
50
60 Lifetime Use Past 30 Days Heavy Use
Perc
enta
ges
(%)
New York City 2008
State 2008
Figure 8: Alcohol, Tobacco and Other Drug Use - Grades 9-10
20
Alcohol, Tobacco and Other Drug Use - Grades 11-12
Alcohol, Tobacco and Other Drug Use - Grades 11-12
*Any Illicit Drug - all drugs except for alcohol and tobacco**Binge Drinking - having five or more drinks in a row within the past two weeks.***Pack of Cigarettes means smoking a pack or more per day.
Alco
hol
Mar
ijuan
a
Ciga
rette
s
Chew
ing
Toba
cco
Pres
crip
tion
Drug
s
OTC
Col
d M
edici
ne
OTC
Caf
fein
e/Di
et P
ills
Inha
lant
s
Coca
ine
Hero
in
Any
Illicit
Dru
g*
Alco
hol
Mar
ijuan
a
Ciga
rette
s
Chew
ing
Toba
cco
Pres
crip
tion
Drug
s
OTC
Col
d M
edici
ne
OTC
Caf
fein
e/Di
et P
ills
Inha
lant
s
Coca
ine
Hero
in
Any
Illicit
Dru
g*
Bing
e Dr
inkin
g**
Pack
of C
igar
ette
s***
0
10
20
30
40
50
60
70
80 Lifetime Use Past 30 Days Heavy Use
Perc
enta
ges
(%)
New York City 2008
State 2008
Figure 9: Alcohol, Tobacco and Other Drug Use - Grades 11-12
21

No Child Left Behind Profile - Grades 7-8
No Child Left Behind Profile - Grades 7-8
ATOD - Alcohol, Tobacco and Other Drug UseASB - Antisocial Behavior
Mar
ijuan
a
Ciga
rette
s
Alco
hol
Regu
lar A
lcoho
l Use
Scho
ol S
uspe
nsio
n
Been
Arre
sted
Carri
ed a
Gun
Atta
cked
to H
arm
Belo
nged
to a
Gan
g0
5
10
15
20 Avg. Age of First ATOD Avg. Age of First ASB
Avg.
Age
of F
irst I
ncid
ence
New York City 2008
State 2008
Figure 10: No Child Left Behind Profile - Grades 7-8
22

No Child Left Behind Profile - Grades 9-10
No Child Left Behind Profile - Grades 9-10
ATOD - Alcohol, Tobacco and Other Drug UseASB - Antisocial Behavior
Mar
ijuan
a
Ciga
rette
s
Alco
hol
Regu
lar A
lcoho
l Use
Scho
ol S
uspe
nsio
n
Been
Arre
sted
Carri
ed a
Gun
Atta
cked
to H
arm
Belo
nged
to a
Gan
g0
5
10
15
20 Avg. Age of First ATOD Avg. Age of First ASB
Avg.
Age
of F
irst I
ncid
ence
New York City 2008
State 2008
Figure 11: No Child Left Behind Profile - Grades 9-10
23

No Child Left Behind Profile - Grades 11-12
No Child Left Behind Profile - Grades 11-12
ATOD - Alcohol, Tobacco and Other Drug UseASB - Antisocial Behavior
Mar
ijuan
a
Ciga
rette
s
Alco
hol
Regu
lar A
lcoho
l Use
Scho
ol S
uspe
nsio
n
Been
Arre
sted
Carri
ed a
Gun
Atta
cked
to H
arm
Belo
nged
to a
Gan
g0
5
10
15
20 Avg. Age of First ATOD Avg. Age of First ASB
Avg.
Age
of F
irst I
ncid
ence
New York City 2008
State 2008
Figure 12: No Child Left Behind Profile - Grades 11-12
24

Sources and Locations of Alcohol Use - Grades 7-8
Sources and Locations of Alcohol Use - Grades 7-8
Did
not d
rink
alco
hol in
the
past
yea
r
Boug
ht it
mys
elf w
ith a
fake
ID
Boug
ht it
mys
elf w
ithou
t a fa
ke ID
Som
eone
I kn
ow a
ge 2
1 or
old
er
Som
eone
I kn
ow u
nder
age
21
My
brot
her o
r sist
er
Hom
e wi
th m
y pa
rent
s' pe
rmiss
ion
Hom
e wi
thou
t my
pare
nts'
perm
issio
n
Anot
her r
elat
ive
A st
rang
er b
ough
t it f
or m
e
Took
it fr
om a
sto
re o
r sho
p
Oth
er
Did
not d
rink
alco
hol in
the
past
yea
r
My
hom
e
Som
eone
else
's ho
me
Ope
n ar
ea lik
e a
park
, etc
.
Spor
ting
even
t or c
once
rt
Rest
aura
nt, b
ar, o
r a n
ight
club
Empt
y bu
ildin
g or
a c
onst
ruct
ion
site
Hote
l/mot
el
In a
car
At s
choo
l0
10
20
30
40
50
60
70
80 Source of Alcohol Location of Acohol Use
Perc
enta
ges
(%)
New York City 2008
State 2008
Figure 13: Sources and Locations of Alcohol Use - Grades 7-8
25

Sources and Locations of Alcohol Use - Grades 9-10
Sources and Locations of Alcohol Use - Grades 9-10
Did
not d
rink
alco
hol in
the
past
yea
r
Boug
ht it
mys
elf w
ith a
fake
ID
Boug
ht it
mys
elf w
ithou
t a fa
ke ID
Som
eone
I kn
ow a
ge 2
1 or
old
er
Som
eone
I kn
ow u
nder
age
21
My
brot
her o
r sist
er
Hom
e wi
th m
y pa
rent
s' pe
rmiss
ion
Hom
e wi
thou
t my
pare
nts'
perm
issio
n
Anot
her r
elat
ive
A st
rang
er b
ough
t it f
or m
e
Took
it fr
om a
sto
re o
r sho
p
Oth
er
Did
not d
rink
alco
hol in
the
past
yea
r
My
hom
e
Som
eone
else
's ho
me
Ope
n ar
ea lik
e a
park
, etc
.
Spor
ting
even
t or c
once
rt
Rest
aura
nt, b
ar, o
r a n
ight
club
Empt
y bu
ildin
g or
a c
onst
ruct
ion
site
Hote
l/mot
el
In a
car
At s
choo
l0
10
20
30
40
50
60 Source of Alcohol Location of Acohol Use
Perc
enta
ges
(%)
New York City 2008
State 2008
Figure 14: Sources and Locations of Alcohol Use - Grades 9-10
26

Sources and Locations of Alcohol Use - Grades 11-12
Sources and Locations of Alcohol Use - Grades 11-12
Did
not d
rink
alco
hol in
the
past
yea
r
Boug
ht it
mys
elf w
ith a
fake
ID
Boug
ht it
mys
elf w
ithou
t a fa
ke ID
Som
eone
I kn
ow a
ge 2
1 or
old
er
Som
eone
I kn
ow u
nder
age
21
My
brot
her o
r sist
er
Hom
e wi
th m
y pa
rent
s' pe
rmiss
ion
Hom
e wi
thou
t my
pare
nts'
perm
issio
n
Anot
her r
elat
ive
A st
rang
er b
ough
t it f
or m
e
Took
it fr
om a
sto
re o
r sho
p
Oth
er
Did
not d
rink
alco
hol in
the
past
yea
r
My
hom
e
Som
eone
else
's ho
me
Ope
n ar
ea lik
e a
park
, etc
.
Spor
ting
even
t or c
once
rt
Rest
aura
nt, b
ar, o
r a n
ight
club
Empt
y bu
ildin
g or
a c
onst
ruct
ion
site
Hote
l/mot
el
In a
car
At s
choo
l0
10
20
30
40
50 Source of Alcohol Location of Acohol Use
Perc
enta
ges
(%)
New York City 2008
State 2008
Figure 15: Sources and Locations of Alcohol Use - Grades 11-12
27

4. GAMBLING PREVALENCE INFORMATION
OASAS is the New York State agency principally responsible for the preventionand treatment of substance use and gambling problems. OASAS, New York Cityand county governments, school districts and prevention service providers, developand implement policies, plans and services to address substance use and gamblingproblems. A series of questions were developed for the OASAS 2006 School Surveyto address and measure various gambling activities. Students were asked to respondwith the number of days, if any, that they had participated in various gamblingactivities. All the gambling questions, with one exception, refer to activity measuredover the past year. The one exception measures activity over the past 30 days. Thetables that follow detail the percentage of students who reported engaging in anyof the listed activities.
4.1. HOW TO READ THE CHARTS
1. Student responses for questions on gambling and gambling behaviors are re-ported by grade groupings on the following pages.
2. Actual percentages are provided in the data tables in Appendix F on page 75.The tables provide percentage figures for New York City and state level. Theheaders represent the various gambling activities and the percentage figuresrepresent the percent of students who responded positively to the question.For example, suppose that for a specific gambling behavior, the percentagefigure for the line ”Combined” and ”state” is 10.5. That means that 10.5percent of all surveyed students in the state responded that they had engagedin that behavior at least once in the past year.
3. The bars represent the percent of students’ grade groups levels who reportedgambling behaviors.
4. Bars are complemented by a red dash. The red dash shows the comparisonfrom the state and provides additional information for you in determining therelative importance of each behavior.
28

Gambling Behaviors - Grades 7-8
Gambling Behaviors - Grades 7-8
Gam
bled
In T
he P
ast Y
ear
Play
ed B
ingo
for M
oney
Bet M
oney
on
Raffl
es o
r Cha
rity
Gam
es
Bet o
r Spe
nt M
oney
on
Pull T
abs
Play
ed C
ards
for M
oney
Play
ed P
ool,
Bask
etba
ll, et
c. fo
r Mon
ey
Bet M
oney
on
Spor
ts
Play
ed "Q
uick
Dra
w"
Play
ed L
otte
ry, L
otto
or S
crat
ch O
ff
Play
ed D
ice G
ames
for M
oney
Play
ed th
e Nu
mbe
rs o
r "Bo
lita"
Bet M
oney
on
Arca
de o
r Vid
eo G
ames
Bet o
n Sl
ots,
Pok
er M
achi
nes,
etc
Bet o
n Ho
rses
, Dog
s, O
ther
Ani
mal
s
Bet M
oney
at a
Cas
ino
Bet M
oney
Ove
r the
Inte
rnet
0
10
20
30
40
50
Perc
enta
ges
(%)
New York City 2008
State 2008
Figure 16: Gambling Behaviors - Grades 7-8
29

Gambling Behaviors - Grades 9-10
Gambling Behaviors - Grades 9-10
Gam
bled
In T
he P
ast Y
ear
Play
ed B
ingo
for M
oney
Bet M
oney
on
Raffl
es o
r Cha
rity
Gam
es
Bet o
r Spe
nt M
oney
on
Pull T
abs
Play
ed C
ards
for M
oney
Play
ed P
ool,
Bask
etba
ll, et
c. fo
r Mon
ey
Bet M
oney
on
Spor
ts
Play
ed "Q
uick
Dra
w"
Play
ed L
otte
ry, L
otto
or S
crat
ch O
ff
Play
ed D
ice G
ames
for M
oney
Play
ed th
e Nu
mbe
rs o
r "Bo
lita"
Bet M
oney
on
Arca
de o
r Vid
eo G
ames
Bet o
n Sl
ots,
Pok
er M
achi
nes,
etc
Bet o
n Ho
rses
, Dog
s, O
ther
Ani
mal
s
Bet M
oney
at a
Cas
ino
Bet M
oney
Ove
r the
Inte
rnet
0
10
20
30
40
50
Perc
enta
ges
(%)
New York City 2008
State 2008
Figure 17: Gambling Behaviors - Grades 9-10
30

Gambling Behaviors - Grades 11-12
Gambling Behaviors - Grades 11-12
Gam
bled
In T
he P
ast Y
ear
Play
ed B
ingo
for M
oney
Bet M
oney
on
Raffl
es o
r Cha
rity
Gam
es
Bet o
r Spe
nt M
oney
on
Pull T
abs
Play
ed C
ards
for M
oney
Play
ed P
ool,
Bask
etba
ll, et
c. fo
r Mon
ey
Bet M
oney
on
Spor
ts
Play
ed "Q
uick
Dra
w"
Play
ed L
otte
ry, L
otto
or S
crat
ch O
ff
Play
ed D
ice G
ames
for M
oney
Play
ed th
e Nu
mbe
rs o
r "Bo
lita"
Bet M
oney
on
Arca
de o
r Vid
eo G
ames
Bet o
n Sl
ots,
Pok
er M
achi
nes,
etc
Bet o
n Ho
rses
, Dog
s, O
ther
Ani
mal
s
Bet M
oney
at a
Cas
ino
Bet M
oney
Ove
r the
Inte
rnet
0
10
20
30
40
50
60
Perc
enta
ges
(%)
New York City 2008
State 2008
Figure 18: Gambling Behaviors - Grades 11-12
31

5. SCHOOL SAFETY ISSUES
School safety has been an area of growing concern among students, parents andschool personnel. This section details how students responded to questions regard-ing their general feelings of safety and their attitudes and experiences regardinghandguns at school.
5.1. HOW TO READ THE CHARTS
1. Student responses for questions on school safety are reported by grade group-ings on the following pages.
2. Actual percentages are provided in the data tables in Appendix F on page78. The tables provide percentage figures for New York City and state level.The headers represent the responses to questions regarding handguns and thepercentage figures represent the percent of students who responded to thequestion with that response. For example, for a specific antisocial behavior,if under the header ”Never” the percentage figure for the line ”Combined”and ”state” is 98.2, then 98.2 percent of all surveyed students in the stateresponded that they had never engaged in that antisocial behavior.
3. The bars represent the percent of students in the grade groups who reportedschool safety concerns.
4. Bars are complemented by a red dash. The red dash shows the comparisonfrom the state and provides additional information for you in determining therelative importance of each safety question.
32
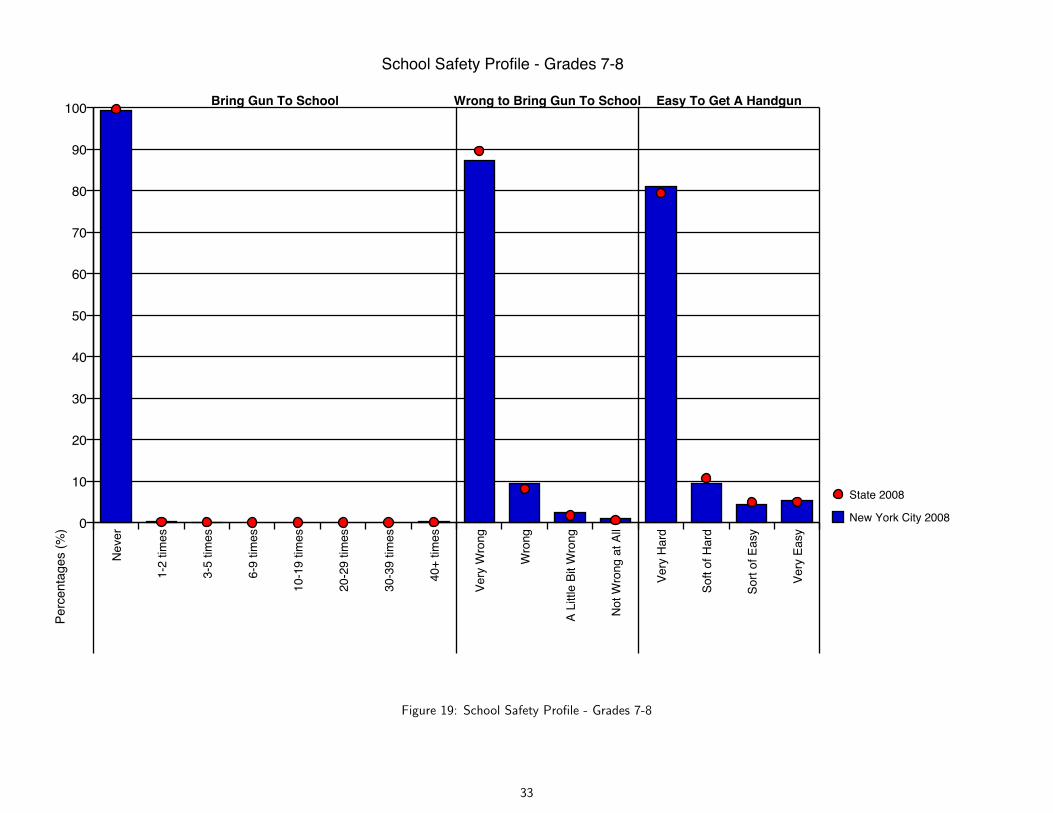
School Safety Profile - Grades 7-8
School Safety Profile - Grades 7-8
Nev
er
1-2
times
3-5
times
6-9
times
10-1
9 tim
es
20-2
9 tim
es
30-3
9 tim
es
40+
times
Very
Wro
ng
Wro
ng
A Li
ttle
Bit W
rong
Not
Wro
ng a
t All
Very
Har
d
Soft
of H
ard
Sort
of E
asy
Very
Eas
y0
10
20
30
40
50
60
70
80
90
100 Bring Gun To School Wrong to Bring Gun To School Easy To Get A Handgun
Perc
enta
ges
(%)
New York City 2008
State 2008
Figure 19: School Safety Profile - Grades 7-8
33

School Safety Profile - Grades 9-10
School Safety Profile - Grades 9-10
Nev
er
1-2
times
3-5
times
6-9
times
10-1
9 tim
es
20-2
9 tim
es
30-3
9 tim
es
40+
times
Very
Wro
ng
Wro
ng
A Li
ttle
Bit W
rong
Not
Wro
ng a
t All
Very
Har
d
Soft
of H
ard
Sort
of E
asy
Very
Eas
y0
10
20
30
40
50
60
70
80
90
100 Bring Gun To School Wrong to Bring Gun To School Easy To Get A Handgun
Perc
enta
ges
(%)
New York City 2008
State 2008
Figure 20: School Safety Profile - Grades 9-10
34
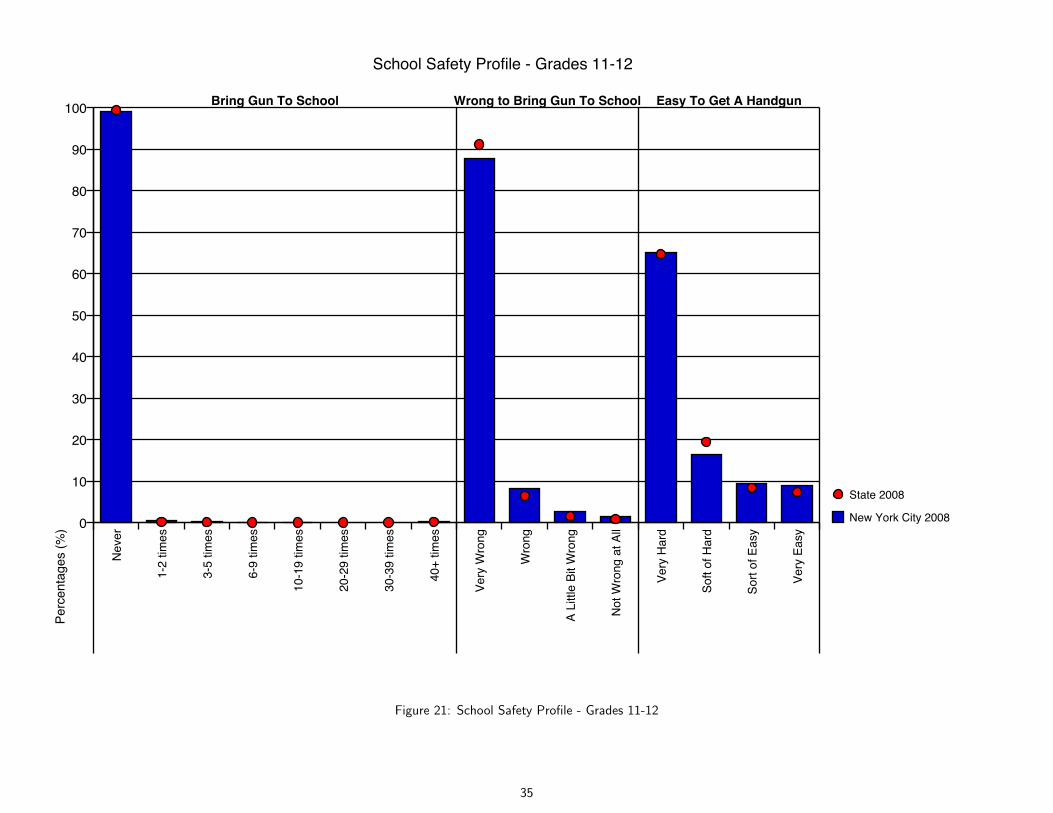
School Safety Profile - Grades 11-12
School Safety Profile - Grades 11-12
Nev
er
1-2
times
3-5
times
6-9
times
10-1
9 tim
es
20-2
9 tim
es
30-3
9 tim
es
40+
times
Very
Wro
ng
Wro
ng
A Li
ttle
Bit W
rong
Not
Wro
ng a
t All
Very
Har
d
Soft
of H
ard
Sort
of E
asy
Very
Eas
y0
10
20
30
40
50
60
70
80
90
100 Bring Gun To School Wrong to Bring Gun To School Easy To Get A Handgun
Perc
enta
ges
(%)
New York City 2008
State 2008
Figure 21: School Safety Profile - Grades 11-12
35

6. DRUG-FREE COMMUNITIES SUPPORTPROGRAM CORE MEASURES
The Drug-Free Communities Support Program, administered by the Center forSubstance Abuse Prevention, requests specific data which are typically referred toas the Core Measures. The drug categories measured are tobacco, alcohol andmarijuana and the table is broken down by grade level. For each drug, and at eachgrade level, the percentage of students who responded positively to the questionand the number of students who responded to the question are reported. For ”Ageof First Use”, the average age of first use for those students who reported use isreported.
Past 30-Day Use The question ”On how many occasions have you used ... in thepast 30 days?” is used to measure this statistic by reporting the percentage ofstudents who report any use in the past 30 days.
Perception of Risk The question ”How much do you think people risk harmingthemselves if they ...?” is used to measure this statistic by reporting the per-centage of students who report that using the drug is a ”Moderate Risk” or a”Great Risk” to their health.
Perception of Parental Disapproval The question ”How wrong do your parentsfeel it would be for you to ...?” is used to measure this statistic by reportingthe percentage of students who report that parents would feel it is ”Wrong”or ”Very Wrong” to use tobacco, alcohol and marijuana.
Age of Onset The question ”How old were you when you first...?” is used tomeasure this statistic. The possible responses to this question range from 10or Under to 17 or Older. The table shows the average age of onset of use ofthose students who answered the question with a response other than NeverUsed.
Table 8: Core Measure by Grade for Past 30 Day Use
Alcohol Cigarettes MarijuanaGrade pct n pct n pct n
Grade 7 8.1 7056 1.5 6844 0.9 7081Grade 8 15.4 8166 2.9 7969 2.7 8229Grade 9 23.3 3450 6.7 3342 6.0 3463Grade 10 27.6 3584 6.2 3439 9.1 3601Grade 11 31.9 3581 7.8 3471 10.5 3600Grade 12 36.9 3582 9.8 3519 11.9 3618
Combined 20.7 29419 4.9 28584 5.5 29592
Table 9: Core Measure by Grade for Perception of Risk
Alcohol Cigarettes MarijuanaGrade pct n pct n pct n
Grade 7 66.6 7183 73.2 7210 58.6 7185Grade 8 70.7 8387 78.2 8414 57.2 8386Grade 9 67.9 3626 77.8 3642 48.5 3628Grade 10 70.5 3744 79.7 3756 46.4 3744Grade 11 72.3 3742 81.3 3760 45.6 3749Grade 12 76.4 3735 84.2 3737 44.8 3728
Combined 70.3 30417 78.3 30519 52.2 30420
Table 10: Core Measure by Grade for Parental Disapproval
Alcohol Cigarettes MarijuanaGrade pct n pct n pct n
Grade 7 94.2 6581 97.9 6569 98.8 6512Grade 8 91.4 7726 97.7 7717 97.9 7674Grade 9 87.3 3147 96.4 3141 95.7 3127Grade 10 86.4 3271 96.5 3262 95.2 3251Grade 11 85.2 3337 96.2 3329 95.4 3311Grade 12 81.9 3377 94.8 3371 94.8 3357
Combined 89.1 27439 96.9 27389 96.8 27232
36

Table 11: Core Measure by Grade for Age of Onset
Alcohol Cigarettes MarijuanaGrade pct n age pct n age pct n age
Grade 7 28.5 7523 11.1 9.9 7548 10.9 2.5 7589 11.8Grade 8 42.0 8702 11.6 16.4 8745 11.5 6.1 8781 12.2Grade 9 54.2 3913 12.2 22.6 3933 12.1 13.9 3966 12.9Grade 10 57.8 4051 12.9 25.4 4074 12.7 19.4 4100 13.5Grade 11 62.5 3984 13.5 29.3 3991 13.1 24.6 4015 14.1Grade 12 67.8 3939 14.0 34.3 3967 13.6 28.9 3997 14.7
Combined 48.0 32112 12.5 20.6 32258 12.4 13.0 32448 13.7
Table 12: Core Measure by Sex for Past 30 Day Use
Alcohol Cigarettes MarijuanaSex pct n pct n pct n
Male 18.0 12465 4.6 11973 5.6 12516Female 22.9 15691 5.0 15396 5.4 15806
Combined 20.7 28156 4.9 27369 5.5 28322
Table 13: Core Measure by Sex for Perception of Risk
Alcohol Cigarettes MarijuanaSex pct n pct n pct n
Male 67.5 12930 76.9 12982 51.3 12933Female 72.9 16167 79.9 16210 53.1 16166
Combined 70.5 29097 78.6 29192 52.3 29099
Table 14: Core Measure by Sex for Parental Disapproval
Alcohol Cigarettes MarijuanaSex pct n pct n pct n
Male 89.7 11418 96.9 11386 96.7 11314Female 88.6 14852 97.0 14837 97.0 14764
Combined 89.1 26270 96.9 26223 96.8 26078
Table 15: Core Measure by Sex for Age of Onset
Alcohol Cigarettes MarijuanaSex pct n age pct n age pct n age
Male 45.7 13943 12.4 19.2 14008 12.3 13.3 14094 13.5Female 50.3 16726 12.7 21.7 16802 12.5 12.7 16884 13.8
Combined 48.2 30669 12.5 20.6 30810 12.4 13.0 30978 13.7
37

Appendices
A. SCHOOL IMPROVEMENT USING SURVEYDATA
Data from the New York State Youth Development Survey can be used to helpschool and community planners assess current conditions and prioritize areas ofgreatest need.
Each risk and protective factor can be linked to specific types of interventions thathave been shown to be e↵ective in either reducing the risk factor(s) or enhancingthe protective factor(s) (see Appendix C). The steps outlined below will help yourschool and community make key decisions regarding allocation of resources, howand when to address specific needs, and which strategies are most e↵ective andknown to produce results.
A.1. What are the numbers telling you?
Review the charts and data tables presented in this report. Using the table insection A.3, note your findings as you discuss the following questions
• Which 3 to 5 risk factors appear to be higher than you would want?
• Which 3 to 5 protective factors appear to be lower than you would want?
• Which levels of 30 day drug use are unacceptably high?
– Which substances are your students using the most?
– At which grades do you see unacceptable usage levels?
• Which levels of antisocial behaviors are unacceptably high?
– Which behaviors are your students exhibiting the most?
– At which grades do you see unacceptable behavior levels?
A.2. How to decide if a rate is ”unacceptable.”
• Look across the charts to determine which items stand out as either muchhigher or much lower than the others.
• Compare your data to statewide data and national data. Di↵erences of 5% ormore between the local and other data should be carefully reviewed.
• Determine the standards and values held in your area. For example: Is itacceptable in your community for 75% of high school students to drink alcoholregularly even when the statewide percentage is 90%?
A.3. Use these data for planning:
• Substance use and antisocial behavior data - raise awareness about the prob-lems and promote dialogue.
• Risk and protective factor data - identify exactly where the community needsto take action.
• Evidence-based Programs and Practices - use the resources in Appendix B andidentify EBP programs in the chart provided in Appendix C.
Unacceptable Unacceptable Unacceptable Unacceptable
Measure Rate #1 Rate #2 Rate #3 Rate #4
30 Day
Drug Use
Antisocial
Behavior
Risk
Factors
Protective
Factors
38

How do I decide which intervention(s) to employ?
• Strategies should be selected based on the risk factors that are high in yourcommunity and the protective factors that are low.
• Strategies should be age appropriate and employed prior to the onset of theproblem behavior.
• Strategies chosen should address more than a single risk and protective factor.
• No single strategy o↵ers the solution.
How do I know whether or not the intervention was e↵ective?
• Participation in the administration of the YDS survey every two years will pro-vide trend data necessary for determining the e↵ectiveness of the implementedintervention(s) and also provides data for determining any new e↵orts that areneeded.
39

B. PREVENTION RESOURCES
NYS O�ce of Alcoholism andSubstance Abuse Services1450 Western Avenue
Albany, New York 12203-3526
Website: http://www.oasas.state.ny.us
International Survey Associatesdba Pride Surveys160 Vanderbilt Court
Bowling Green, KY 42103
Telephone: (800) 279-6361
FAX: (270) 746-9598
Website: http://www.pridesurveys.com
Safe and Drug Free Schools andCommunitiesU.S. Department of Education
Website: http://www.ed.gov/offices/OESE/SDFS
B.1. Additional Needs Assessment Resources
Using Surveys For Planning:
• http://captus.samhsa.gov/southwest/resources/documents/
Pathways_8-03.pdf Chapter 1 of this document provides informationon using Survey Data for Program Planning
Key Informant Interview Resources:
• http://ppa.aces.uiuc.edu/NeedsAsmnt.htm
• http://www.accessproject.org/getting_the_lay_of_the_land_on_
health.pdf
Focus Group Resources:
• http://www.extension.iastate.edu/agdm/wholefarm/html/c5-31.
html
• http://www.extension.iastate.edu/Publications/PM1969A.pdf
• http://www.extension.iastate.edu/Publications/PM1969B.pdf
Archival Data Resources:
• Kids’ Well-Being Indicators Clearinghouse www.nyskwic.org
• NYS School Report Card www.emsc.nysed.gov/irts/reportcard/
• PRISMS: http://www.oasas.state.ny.us/hps/datamart/prisms_
home.cfm
OASAS Needs Assessment Links:
• http://www.oasas.state.ny.us/prevention/needs/
needsassessment.cfm
40

C. MODEL PROGRAMS RELATED TO RISK AND PROTECTIVE FACTORS
Community Risk Factors
MODEL PROGRAMS Ava
ilabi
lity
ofD
rugs
Com
mun
ity
Law
san
dN
orm
sFav
orab
leTow
ard
Dru
gU
se
Tra
nsitio
nan
dM
obili
ty
Low
Nei
ghbor
hood
Att
achm
ent
Com
mun
ity
Disor
gani
zation
Ext
rem
eEco
nom
icD
epriva
tion
1 Across Ages
2 All StarsTM
3 Al’s Pals: Kids Making Healthy Choices
4 ATLAS (Athletes Training and Learning to Avoid Steroids) X
5 Border Binge-Drinking Reduction Program X X
6 Brief Alcohol Screening and Intervention for College Students(BASICS)
7 Brief Strategic Family Therapy (BSFT)
8 CASASTART – Striving Together to Achieve Rewarding Tomorrows(CASASTART)
X
9 Challenging College Alcohol Abuse X X
10 Child Development Project (CDP)
11 Children in the Middle
12 Class Action
13 Communities Mobilizing for Change on Alcohol (CMCA) X X
14 Community Trials Intervention to Reduce High-Risk Drinking (RHRD) X X
15 Coping with Work and Family Stress-TP is adults-R/P factors notapplicable
16 Creating Lasting Family Connections (CLFC)
17 DARE To Be You (DTBY)
18 Early Risers Skills for Success
19 Families And Schools Together (FAST)
20 Family E↵ectiveness Training (FET)
21 Family Matters
22 Guiding Good Choices (GGC) – Families that Care – Guiding GoodChoices – Preparing for the Drug Free Years (PDFY)
23 Healthy Workplace-TP is adults-R/P factors not applicable
24 High/Scope Perry Preschool Program X
25 Incredible Years
26 Keep A Clear Mind (KACM)
(Grid is based on content from SAMHSA and model developer websites. Contact developers for more information).
41

Community Risk Factors
MODEL PROGRAMS Ava
ilabi
lity
ofD
rugs
Com
mun
ity
Law
san
dN
orm
sFav
orab
leTow
ard
Dru
gU
se
Tra
nsitio
nan
dM
obili
ty
Low
Nei
ghbor
hood
Att
achm
ent
Com
mun
ity
Disor
gani
zation
Ext
rem
eEco
nom
icD
epriva
tion
27 keepin’ It REAL
28 Leadership and Resiliency Program (LRP)
29 LifeSkills Training (LST)
30 Lions-Quest Skills for Adolescence
31 Multidimensional Family Therapy
32 Multisystemic Therapy (MST)
33 Nurse-Family Partnership (NFP) X
34 Olweus Bullying Prevention
35 Parenting Wisely
36 Positive Action (PA)
37 Project ACHIEVE
38 Project ALERT
39 Project Northland X X
40 Project SUCCESS – (Schools Using Coordinated Community E↵ortsto Strengthen Students)
41 Project Toward No Drug Abuse (TND)
42 Project Towards No Tobacco Use (TNT)
43 Project Venture
44 Promoting Alternative THinking Strategies (PATHS)
45 Protecting You/Protecting Me R�46 Reconnecting Youth (RY)
47 Residential Student Assistance Program (RSAP)
48 Responding in Peaceful and Positive Ways (RIPP)
49 Schools and Families Educating Children (SAFE Children) X
50 Second Step
51 Start Taking Alcohol Risks Seriously (STARS) for Families
52 Strengthening Families Program (SFP)
53 Strengthening Families Program 10-14
54 Students Managing Anger and Resolution Together (SMART) Team
55 Too Good For Drugs (TGFD)
56 Too Good for Violence
57 Wellness Outreach At Work-TP is adults-R/P factors not applicable
(Grid is based on content from SAMHSA and model developer websites. Contact developers for more information).
42

School Risk Factors
MODEL PROGRAMS Aca
dem
icFai
lure
Beg
inni
ngin
Lat
eEle
men
tary
Low
Com
mitm
ent
toSch
ool
1 Across Ages X X
2 All StarsTM
3 Al’s Pals: Kids Making Healthy Choices
4 ATLAS (Athletes Training and Learning to Avoid Steroids)
5 Border Binge-Drinking Reduction Program
6 Brief Alcohol Screening and Intervention for College Students(BASICS)
7 Brief Strategic Family Therapy (BSFT)
8 CASASTART – Striving Together to Achieve Rewarding Tomorrows(CASASTART)
X
9 Challenging College Alcohol Abuse
10 Child Development Project (CDP) X
11 Children in the Middle
12 Class Action
13 Communities Mobilizing for Change on Alcohol (CMCA)
14 Community Trials Intervention to Reduce High-Risk Drinking (RHRD)
15 Coping with Work and Family Stress-TP is adults-R/P factors notapplicable
16 Creating Lasting Family Connections (CLFC)
17 DARE To Be You (DTBY)
18 Early Risers Skills for Success X
19 Families And Schools Together (FAST) X
20 Family E↵ectiveness Training (FET)
21 Family Matters
22 Guiding Good Choices (GGC) – Families that Care – Guiding GoodChoices – Preparing for the Drug Free Years (PDFY)
23 Healthy Workplace-TP is adults-R/P factors not applicable
24 High/Scope Perry Preschool Program X X
25 Incredible Years
26 Keep A Clear Mind (KACM)
(Grid is based on content from SAMHSA and model developer websites. Contact developers for more information).
43

School Risk Factors
MODEL PROGRAMS Aca
dem
icFai
lure
Beg
inni
ngin
Lat
eEle
men
tary
Low
Com
mitm
ent
toSch
ool
27 keepin’ It REAL
28 Leadership and Resiliency Program (LRP) X
29 LifeSkills Training (LST)
30 Lions-Quest Skills for Adolescence X
31 Multidimensional Family Therapy
32 Multisystemic Therapy (MST)
33 Nurse-Family Partnership (NFP)
34 Olweus Bullying Prevention X
35 Parenting Wisely
36 Positive Action (PA) X X
37 Project ACHIEVE X X
38 Project ALERT
39 Project Northland
40 Project SUCCESS – (Schools Using Coordinated Community E↵ortsto Strengthen Students)
41 Project Toward No Drug Abuse (TND)
42 Project Towards No Tobacco Use (TNT)
43 Project Venture X
44 Promoting Alternative THinking Strategies (PATHS)
45 Protecting You/Protecting Me R�46 Reconnecting Youth (RY)
47 Residential Student Assistance Program (RSAP)
48 Responding in Peaceful and Positive Ways (RIPP) X
49 Schools and Families Educating Children (SAFE Children) X
50 Second Step
51 Start Taking Alcohol Risks Seriously (STARS) for Families
52 Strengthening Families Program (SFP)
53 Strengthening Families Program 10-14
54 Students Managing Anger and Resolution Together (SMART) Team
55 Too Good For Drugs (TGFD)
56 Too Good for Violence
57 Wellness Outreach At Work-TP is adults-R/P factors not applicable
(Grid is based on content from SAMHSA and model developer websites. Contact developers for more information).
44

Family Risk Factors
MODEL PROGRAMS Fam
ilyH
isto
ryof
Sub
stan
ceA
buse
Fam
ilyM
anag
emen
tPro
blem
s
Fam
ilyCon
flict
Fav
orab
lePar
enta
lAtt
itud
esan
dIn
volv
emen
t
1 Across Ages
2 All StarsTM
3 Al’s Pals: Kids Making Healthy Choices
4 ATLAS (Athletes Training and Learning to Avoid Steroids) X
5 Border Binge-Drinking Reduction Program
6 Brief Alcohol Screening and Intervention for College Students(BASICS)
7 Brief Strategic Family Therapy (BSFT) X X
8 CASASTART – Striving Together to Achieve Rewarding Tomorrows(CASASTART)
9 Challenging College Alcohol Abuse
10 Child Development Project (CDP)
11 Children in the Middle X
12 Class Action
13 Communities Mobilizing for Change on Alcohol (CMCA)
14 Community Trials Intervention to Reduce High-Risk Drinking (RHRD)
15 Coping with Work and Family Stress-TP is adults-R/P factors notapplicable
16 Creating Lasting Family Connections (CLFC) X X X
17 DARE To Be You (DTBY) X
18 Early Risers Skills for Success
19 Families And Schools Together (FAST) X X
20 Family E↵ectiveness Training (FET) X
21 Family Matters
22 Guiding Good Choices (GGC) – Families that Care – Guiding GoodChoices – Preparing for the Drug Free Years (PDFY)
X X X
23 Healthy Workplace-TP is adults-R/P factors not applicable
24 High/Scope Perry Preschool Program
25 Incredible Years X
26 Keep A Clear Mind (KACM) X
(Grid is based on content from SAMHSA and model developer websites. Contact developers for more information).
45

Family Risk Factors
MODEL PROGRAMS Fam
ilyH
isto
ryof
Sub
stan
ceA
buse
Fam
ilyM
anag
emen
tPro
blem
s
Fam
ilyCon
flict
Fav
orab
lePar
enta
lAtt
itud
esan
dIn
volv
emen
t
27 keepin’ It REAL
28 Leadership and Resiliency Program (LRP)
29 LifeSkills Training (LST)
30 Lions-Quest Skills for Adolescence
31 Multidimensional Family Therapy X X
32 Multisystemic Therapy (MST) X
33 Nurse-Family Partnership (NFP) X X
34 Olweus Bullying Prevention
35 Parenting Wisely X
36 Positive Action (PA) X X
37 Project ACHIEVE
38 Project ALERT
39 Project Northland
40 Project SUCCESS – (Schools Using Coordinated Community E↵ortsto Strengthen Students)
41 Project Toward No Drug Abuse (TND)
42 Project Towards No Tobacco Use (TNT)
43 Project Venture
44 Promoting Alternative THinking Strategies (PATHS)
45 Protecting You/Protecting Me R�46 Reconnecting Youth (RY)
47 Residential Student Assistance Program (RSAP) X
48 Responding in Peaceful and Positive Ways (RIPP)
49 Schools and Families Educating Children (SAFE Children) X
50 Second Step
51 Start Taking Alcohol Risks Seriously (STARS) for Families
52 Strengthening Families Program (SFP) X X X
53 Strengthening Families Program 10-14 X X
54 Students Managing Anger and Resolution Together (SMART) Team
55 Too Good For Drugs (TGFD)
56 Too Good for Violence
57 Wellness Outreach At Work-TP is adults-R/P factors not applicable
(Grid is based on content from SAMHSA and model developer websites. Contact developers for more information).
46
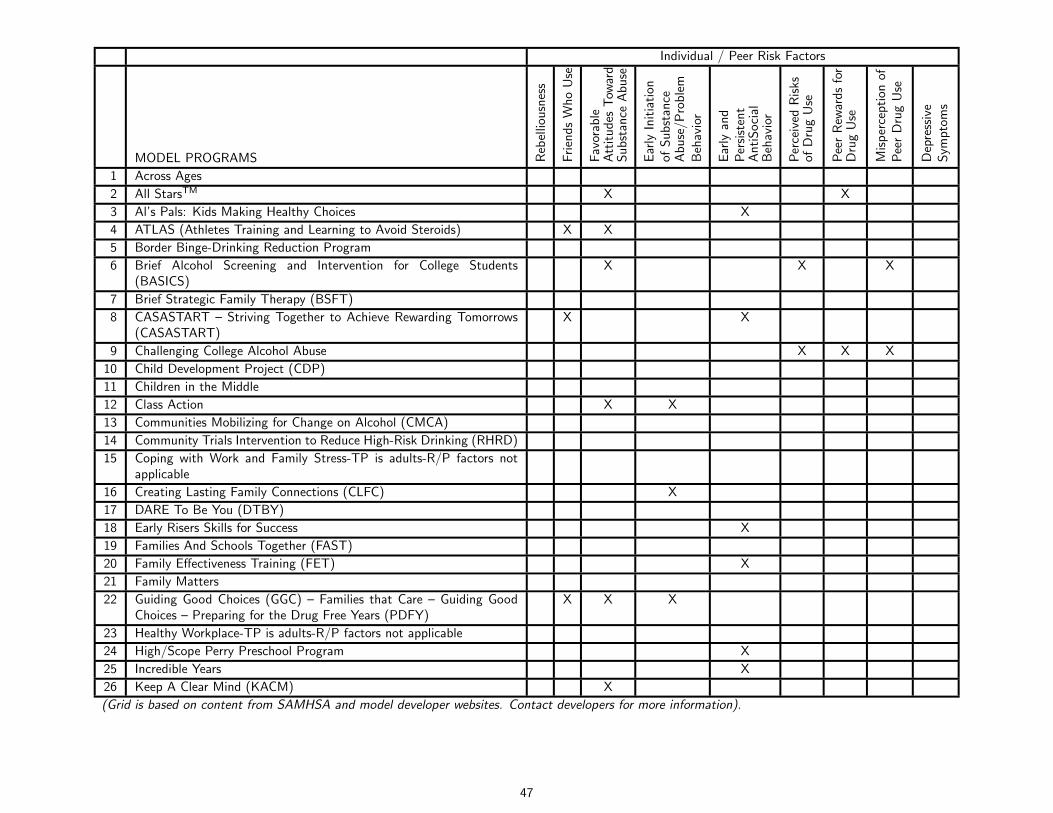
Individual / Peer Risk Factors
MODEL PROGRAMS Reb
ellio
usne
ss
Frien
dsW
hoU
se
Fav
orab
leAtt
itud
esTow
ard
Sub
stan
ceA
buse
Ear
lyIn
itia
tion
ofSub
stan
ceA
buse
/Pro
blem
Beh
avio
r
Ear
lyan
dPer
sist
ent
Ant
iSoc
ial
Beh
avio
r
Per
ceiv
edRisks
ofD
rug
Use
Pee
rRew
ards
for
Dru
gU
se
Misper
cept
ion
ofPee
rD
rug
Use
Dep
ress
ive
Sym
ptom
s
1 Across Ages
2 All StarsTM X X
3 Al’s Pals: Kids Making Healthy Choices X
4 ATLAS (Athletes Training and Learning to Avoid Steroids) X X
5 Border Binge-Drinking Reduction Program
6 Brief Alcohol Screening and Intervention for College Students(BASICS)
X X X
7 Brief Strategic Family Therapy (BSFT)
8 CASASTART – Striving Together to Achieve Rewarding Tomorrows(CASASTART)
X X
9 Challenging College Alcohol Abuse X X X
10 Child Development Project (CDP)
11 Children in the Middle
12 Class Action X X
13 Communities Mobilizing for Change on Alcohol (CMCA)
14 Community Trials Intervention to Reduce High-Risk Drinking (RHRD)
15 Coping with Work and Family Stress-TP is adults-R/P factors notapplicable
16 Creating Lasting Family Connections (CLFC) X
17 DARE To Be You (DTBY)
18 Early Risers Skills for Success X
19 Families And Schools Together (FAST)
20 Family E↵ectiveness Training (FET) X
21 Family Matters
22 Guiding Good Choices (GGC) – Families that Care – Guiding GoodChoices – Preparing for the Drug Free Years (PDFY)
X X X
23 Healthy Workplace-TP is adults-R/P factors not applicable
24 High/Scope Perry Preschool Program X
25 Incredible Years X
26 Keep A Clear Mind (KACM) X
(Grid is based on content from SAMHSA and model developer websites. Contact developers for more information).
47

Individual / Peer Risk Factors
MODEL PROGRAMS Reb
ellio
usne
ss
Frien
dsW
hoU
se
Fav
orab
leAtt
itud
esTow
ard
Sub
stan
ceA
buse
Ear
lyIn
itia
tion
ofSub
stan
ceA
buse
/Pro
blem
Beh
avio
r
Ear
lyan
dPer
sist
ent
Ant
iSoc
ial
Beh
avio
r
Per
ceiv
edRisks
ofD
rug
Use
Pee
rRew
ards
for
Dru
gU
se
Misper
cept
ion
ofPee
rD
rug
Use
Dep
ress
ive
Sym
ptom
s
27 keepin’ It REAL X
28 Leadership and Resiliency Program (LRP) X
29 LifeSkills Training (LST) X X X
30 Lions-Quest Skills for Adolescence X X
31 Multidimensional Family Therapy X X
32 Multisystemic Therapy (MST) X
33 Nurse-Family Partnership (NFP)
34 Olweus Bullying Prevention X X
35 Parenting Wisely X
36 Positive Action (PA) X X
37 Project ACHIEVE X
38 Project ALERT X X
39 Project Northland X X X
40 Project SUCCESS – (Schools Using Coordinated Community E↵ortsto Strengthen Students)
X
41 Project Toward No Drug Abuse (TND) X
42 Project Towards No Tobacco Use (TNT) X
43 Project Venture X X X X
44 Promoting Alternative THinking Strategies (PATHS) X
45 Protecting You/Protecting Me R� X
46 Reconnecting Youth (RY) X X X
47 Residential Student Assistance Program (RSAP) X
48 Responding in Peaceful and Positive Ways (RIPP) X X
49 Schools and Families Educating Children (SAFE Children) X
50 Second Step X
51 Start Taking Alcohol Risks Seriously (STARS) for Families X X
52 Strengthening Families Program (SFP) X
53 Strengthening Families Program 10-14
54 Students Managing Anger and Resolution Together (SMART) Team
55 Too Good For Drugs (TGFD) X X
56 Too Good for Violence
57 Wellness Outreach At Work-TP is adults-R/P factors not applicable
(Grid is based on content from SAMHSA and model developer websites. Contact developers for more information).
48

Protective Factors Addressed
MODEL PROGRAMS Bel
iefin
the
Mor
alO
rder
Bon
ding
-Fam
ilyAtt
achm
ent
Bon
ding
-Pro
soci
alIn
volv
emen
t
Ski
lls
Rec
ogni
tion
-Com
mun
ity
Rew
ards
Rec
ogni
tion
-Fam
ilyRew
ards
Rec
ogni
tion
-Sch
oolRew
ards
Opp
ortu
nities
-Com
mun
ity
Opp
ortu
nities
-Fam
ily
Opp
ortu
nities
-Sch
ool
1 Across Ages X X X X
2 All StarsTM X X X
3 Al’s Pals: Kids Making Healthy Choices X
4 ATLAS (Athletes Training and Learning to Avoid Steroids) X
5 Border Binge-Drinking Reduction Program X
6 Brief Alcohol Screening and Intervention for College Students(BASICS)
7 Brief Strategic Family Therapy (BSFT) X
8 CASASTART – Striving Together to Achieve Rewarding Tomorrows(CASASTART)
X X
9 Challenging College Alcohol Abuse
10 Child Development Project (CDP) X
11 Children in the Middle X
12 Class Action X X
13 Communities Mobilizing for Change on Alcohol (CMCA) X
14 Community Trials Intervention to Reduce High-Risk Drinking (RHRD) X
15 Coping with Work and Family Stress-TP is adults-R/P factors notapplicable
16 Creating Lasting Family Connections (CLFC) X X
17 DARE To Be You (DTBY) X X
18 Early Risers Skills for Success X
19 Families And Schools Together (FAST) X
20 Family E↵ectiveness Training (FET) X
21 Family Matters X X
22 Guiding Good Choices (GGC) – Families that Care – Guiding GoodChoices – Preparing for the Drug Free Years (PDFY)
X X X X
23 Healthy Workplace-TP is adults-R/P factors not applicable
24 High/Scope Perry Preschool Program X X
25 Incredible Years X
26 Keep A Clear Mind (KACM) X X
(Grid is based on content from SAMHSA and model developer websites. Contact developers for more information).
49

Protective Factors Addressed
MODEL PROGRAMS Bel
iefin
the
Mor
alO
rder
Bon
ding
-Fam
ilyAtt
achm
ent
Bon
ding
-Pro
soci
alIn
volv
emen
t
Ski
lls
Rec
ogni
tion
-Com
mun
ity
Rew
ards
Rec
ogni
tion
-Fam
ilyRew
ards
Rec
ogni
tion
-Sch
oolRew
ards
Opp
ortu
nities
-Com
mun
ity
Opp
ortu
nities
-Fam
ily
Opp
ortu
nities
-Sch
ool
27 keepin’ It REAL X X
28 Leadership and Resiliency Program (LRP) X X X
29 LifeSkills Training (LST) X X
30 Lions-Quest Skills for Adolescence X X X
31 Multidimensional Family Therapy X
32 Multisystemic Therapy (MST) X X
33 Nurse-Family Partnership (NFP) X X X
34 Olweus Bullying Prevention X X
35 Parenting Wisely X
36 Positive Action (PA) X X X
37 Project ACHIEVE X X
38 Project ALERT X
39 Project Northland X X X
40 Project SUCCESS – (Schools Using Coordinated Community E↵ortsto Strengthen Students)
X
41 Project Toward No Drug Abuse (TND) X
42 Project Towards No Tobacco Use (TNT) X
43 Project Venture X X X X X X
44 Promoting Alternative THinking Strategies (PATHS) X
45 Protecting You/Protecting Me R� X X X
46 Reconnecting Youth (RY) X
47 Residential Student Assistance Program (RSAP)
48 Responding in Peaceful and Positive Ways (RIPP) X X X X
49 Schools and Families Educating Children (SAFE Children) X X
50 Second Step X
51 Start Taking Alcohol Risks Seriously (STARS) for Families X
52 Strengthening Families Program (SFP) X
53 Strengthening Families Program 10-14 X X X
54 Students Managing Anger and Resolution Together (SMART) Team X
55 Too Good For Drugs (TGFD) X X
56 Too Good for Violence X
57 Wellness Outreach At Work-TP is adults-R/P factors not applicable
(Grid is based on content from SAMHSA and model developer websites. Contact developers for more information).
50

D. RISK AND PROTECTIVE FACTORSDEFINITIONS
The following table provides a definition for each of the risk and protective factorsin this report. Each definition consists of the name of the factor, a short definitionof the factor and the survey questions used to calculate the factor.
Table 16: Risk and Protective Factor Scale Definition
Community Domain Risk Factors
Low Neighborhood
Attachment
A low level of bonding to the neighborhood is related to higher
levels of juvenile crime and drug selling.
114. I’d like to get out of my neighborhood.113. I like my neighborhood.111. If I had to move, I would miss the neighborhood I now live in.
Community
Disorganization
Research has shown that neighborhoods with high population
density, lack of natural surveillance of public places, physical
deterioration, and high rates of adult crime also have higher
rates of juvenile crime and drug selling.
110a. How much do each of the following statements describe your neighborhood?crime and/or drug selling110b. How much do each of the following statements describe your neighborhood?fights110c. How much do each of the following statements describe your neighborhood?lots of empty or abandoned buildings110d. How much do each of the following statements describe your neighborhood?lots of gra�ti
Laws and Norms
Favorable Toward
Drug Use
Research has shown that legal restrictions on alcohol and to-
bacco use, such as raising the legal drinking age, restricting
smoking in public places, and increased taxation have been fol-
lowed by decreases in consumption. Moreover, national surveys
of high school seniors have shown that shifts in normative atti-
tudes toward drug use have preceded changes in prevalence of
use.
109a. How wrong would most adults (over 21) in your neighborhood think it is forkids your age: to use marijuana?109b. How wrong would most adults (over 21) in your neighborhood think it is forkids your age: to drink alcohol?109c. How wrong would most adults (over 21) in your neighborhood think it is forkids your age: to smoke cigarettes?119. If a kid drank some beer, wine or hard liquor (for example, vodka, whiskey, orgin) in your neighborhood would he or she be caught by the police?118. If a kid smoked marijuana in your neighborhood would he or she be caught bythe police?120. If a kid carried a handgun in your neighborhood would he or she be caught bythe police?
continued on the next column
51

Risk and Protective Factor Scale Definition (continued)
Perceived Availability
of Drugs
The availability of cigarettes, alcohol, marijuana, and other il-
legal drugs has been related to the use of these substances by
adolescents.
122. If you wanted to get some beer, wine or hard liquor (for example, vodka, whiskey,or gin), how easy would it be for you to get some?121. If you wanted to get some cigarettes, how easy would it be for you to get some?125. If you wanted to get some marijuana, how easy would it be for you to get some?123. If you wanted to get a drug like cocaine, LSD, or amphetamines, how easy wouldit be for you to get some?
Perceived Availability
of Handguns
The availability of handguns has also been related to the use of
these substances by adolescents.
124. If you wanted to get a handgun, how easy would it be for you to get one?
Community Domain Protective Factors
Opportunities for
Prosocial
Involvement
When opportunities are available in a community for positive
participation, children are less likely to engage in substance use
and other problem behaviors.
117a. Which of the following activities for people your age are available in your com-munity? sports teams117b. Which of the following activities for people your age are available in your com-munity? scouting117c. Which of the following activities for people your age are available in your com-munity? boys and girls clubs117d. Which of the following activities for people your age are available in your com-munity? 4-H clubs117e. Which of the following activities for people your age are available in your com-munity? service clubs
Rewards for
Prosocial
Involvement
Rewards for positive participation in activities help children bond
to the community, thus lowering their risk for substance use.
112. My neighbors notice when I am doing a good job and let me know about it.116. There are people in my neighborhood who encourage me to do my best.115. There are people in my neighborhood who are proud of me when I do somethingwell.
Family Domain Risk Factors
Poor Family
Management
Parents’ use of inconsistent and/or unusually harsh or severe
punishment with their children places them at higher risk for
substance use and other problem behaviors. Also, parents’ fail-
ure to provide clear expectations and to monitor their children’s
behavior makes it more likely that they will engage in drug abuse
whether or not there are family drug problems.
continued on the next column
Risk and Protective Factor Scale Definition (continued)
101. My parents ask if I’ve gotten my homework done.103. Would your parents know if you did not come home on time?87. When I am not at home, one of my parents knows where I am and who I am with.85. The rules in my family are clear.90. My family has clear rules about alcohol and drug use.89. If you drank some beer or wine or liquor (for example, vodka, whiskey, or gin)without your parents’ permission, would you be caught by your parents?91. If you skipped school would you be caught by your parents?
Family Conflict Children raised in families high in conflict, whether or not the
child is directly involved in the conflict, appear at risk for both
delinquency and drug use.
86. People in my family often insult or yell at each other.102. People in my family have serious arguments.88. We argue about the same things in my family over and over.
Family History of
Antisocial Behavior
When children are raised in a family with a history of problem
behaviors (e.g., violence or ATOD use), the children are more
likely to engage in these behaviors.
107. Has anyone in your family ever had severe alcohol or drug problems?83a. Have any of your brothers or sisters ever: drunk beer, wine or hard liquor (forexample, vodka, whiskey or gin)?83b. Have any of your brothers or sisters ever: smoked marijuana?83c. Have any of your brothers or sisters ever: smoked cigarettes?108a. About how many adults (over 21) have you known personally who in the pastyear have: used marijuana, crack, cocaine, or other drugs?108b. About how many adults (over 21) have you known personally who in the pastyear have: sold or dealt drugs?108c. About how many adults (over 21) have you known personally who in the pastyear have: done other things that could get them in trouble with the police, likestealing, selling stolen goods, mugging or assaulting others, etc.?108d. About how many adults (over 21) have you known personally who in the pastyear have: gotten drunk or high?
Parental Attitudes
Favorable Toward
Drug Use
In families where parents use illegal drugs, are heavy users of
alcohol, or are tolerant of children’s use, children are more likely
to become drug abusers during adolescence. The risk is further
increased if parents involve children in their own drug (or alco-
hol) using behavior, for example, asking the child to light the
parent’s cigarette or get the parent a beer from the refrigerator.
82a. How wrong do your parents feel it would be for YOU to: drink beer, wine or hardliquor (for example, vodka, whiskey or gin) regularly?82b. How wrong do your parents feel it would be for YOU to: smoke cigarettes?82c. How wrong do your parents feel it would be for YOU to: smoke marijuana?
Parental Attitudes
Favorable Toward
Antisocial Behavior
In families where parents are tolerant of their child’s antisocial
behavior (i.e. fighting, stealing, defacing property, etc.), chil-
dren are more likely to become drug abusers during adolescence.
continued on the next column
52

Risk and Protective Factor Scale Definition (continued)
82d. How wrong do your parents feel it would be for YOU to: steal something worthmore than $5?82e. How wrong do your parents feel it would be for YOU to: draw gra�ti, write things,or draw pictures on buildings or other property (without the owner’s permission)?82f. How wrong do your parents feel it would be for YOU to: pick a fight withsomeone?
Family Domain Protective Factors
Family Attachment Young people who feel that they are a valued part of their family
are less likely to engage in substance use and other problem
behaviors.
92. Do you feel very close to your mother?93. Do you share your thoughts and feelings with your mother?99. Do you feel very close to your father?95. Do you share your thoughts and feelings with your father?
Opportunities for
Prosocial
Involvement
Young people who are exposed to more opportunities to par-
ticipate meaningfully in the responsibilities and activities of the
family are less likely to engage in drug use and other problem
behaviors.
100. My parents give me lots of chances to do fun things with them.94. My parents ask me what I think before most family decisions a↵ecting me aremade.98. If I had a personal problem, I could ask my mom or dad for help.
Rewards for Prosocial
Involvement
When parents, siblings, and other family members praise, en-
courage, and attend to things done well by their child, children
are less likely to engage in substance use and problem behaviors.
105. My parents notice when I am doing a good job and let me know about it.106. How often do your parents tell you they’re proud of you for something you’vedone?96. Do you enjoy spending time with your mother?97. Do you enjoy spending time with your father?
School Domain Risk Factors
Academic Failure Beginning in the late elementary grades (grades 4-6) academic
failure increases the risk of both drug abuse and delinquency. It
appears that the experience of failure itself, for whatever reasons,
increases the risk of problem behaviors.
16. Putting them all together, what were your grades like last year?12. Are your school grades better than the grades of most students in your class?
Low Commitment
to School
Surveys of high school seniors have shown that the use of hal-
lucinogens, cocaine, heroin, stimulants, and sedatives or non-
medically prescribed tranquilizers is significantly lower among
students who expect to attend college than among those who do
not. Factors such as liking school, spending time on homework,
and perceiving the coursework as relevant are also negatively
related to drug use.
continued on the next column
Risk and Protective Factor Scale Definition (continued)
15. How often do you feel that the school work you are assigned is meaningful andimportant?18. How interesting are most of your courses to you?17. How important do you think the things you are learning in school are going to befor your later life?14a. Now thinking back over the past year in school, how often did you: enjoy beingin school?14b. Now thinking back over the past year in school, how often did you: hate beingin school?14c. Now thinking back over the past year in school, how often did you: try to doyour best work in school?19. During the LAST FOUR WEEKS how many whole days of school have you missedbecause you skipped or ’cut’?
School Domain Protective Factors
Opportunities for
Prosocial
Involvement
When young people are given more opportunities to participate
meaningfully in important activities at school, they are less likely
to engage in drug use and other problem behaviors.
6. In my school, students have lots of chances to help decide things like class activitiesand rules.9. There are lots of chances for students in my school to talk with a teacher one-on-one.8. There are lots of chances for students in my school to get involved in sports, clubs,and other school activities outside of class.13. I have lots of chances to be part of class discussions or activities.
Rewards for
Prosocial
Involvement
When young people are recognized and rewarded for their contri-
butions at school, they are less likely to be involved in substance
use and other problem behaviors.
7. My teacher(s) notices when I am doing a good job and lets me know about it.10. The school lets my parents know when I have done something well.11. My teachers praise me when I work hard in school.
Peer-Individual Risk Factors
Rebelliousness Young people who do not feel part of society, are not bound by
rules, don’t believe in trying to be successful or responsible, or
who take an active rebellious stance toward society, are at higher
risk of abusing drugs. In addition, high tolerance for deviance,
a strong need for independence and normlessness have all been
linked with drug use.
32. I do the opposite of what people tell me, just to get them mad.34. I ignore rules that get in my way.33. I like to see how much I can get away with.
Early Initiation
of Drug Use
Early onset of drug use predicts misuse of drugs. The earlier the
onset of any drug use, the greater the involvement in other drug
use and the greater frequency of use. Onset of drug use prior to
the age of 15 is a consistent predictor of drug abuse, and a later
age of onset of drug use has been shown to predict lower drug
involvement and a greater probability of discontinuation of use.
continued on the next column
53

Risk and Protective Factor Scale Definition (continued)
22a. How old were you when you first: smoked marijuana?22b. How old were you when you first: smoked a cigarette, even just a pu↵?22c. How old were you when you first: had more than a sip or two of beer, wine orhard liquor (for example, vodka, whiskey, or gin)?22d. How old were you when you first: began drinking alcoholic beverages regularly,that is, at least once or twice a month?
Early Initiation
of Antisocial Behavior
Early onset of antisocial behaviors such as being suspended from
school, arrests, carrying handguns, fighting, etc. makes young
people more likely to be involved in substance abuse.
22g. How old were you when you first: got suspended from school?22h. How old were you when you first: got arrested?22i. How old were you when you first: carried a handgun?22j. How old were you when you first: attacked someone with the idea of seriouslyhurting them?
Attitudes Favorable
Toward Drug Use and
Antisocial Behavior
During the elementary school years, most children express anti-
drug, anti-crime, and pro-social attitudes and have di�culty
imagining why people use drugs or engage in antisocial behav-
iors. However, in middle school, as more youth are exposed to
others who use drugs and engage in antisocial behavior, their at-
titudes often shift toward greater acceptance of these behaviors.
Youth who express positive attitudes toward drug use and anti-
social behavior are more likely to engage in a variety of problem
behaviors, including drug use.
23a. How wrong do you think it is for someone your age to: take a handgun to school?23b. How wrong do you think it is for someone your age to: steal anything worth morethan $5?23c. How wrong do you think it is for someone your age to: pick a fight with someone?23d. How wrong do you think it is for someone your age to: attack someone with theidea of seriously hurting them?23e. How wrong do you think it is for someone your age to: stay away from school allday when their parents think they are at school?23f. How wrong do you think it is for someone your age to: drink beer, wine or hardliquor (for example, vodka, whiskey, or gin) regularly?23g. How wrong do you think it is for someone your age to: smoke cigarettes?23h. How wrong do you think it is for someone your age to: smoke marijuana?23i. How wrong do you think it is for someone your age to: use LSD, cocaine,amphetamines or another illegal drug?
continued on the next column
Risk and Protective Factor Scale Definition (continued)
Perceived Risk of
Drug Use
Young people who do not perceive drug use to be risky are far
more likely to engage in drug use.
35a. How much do you think people risk harming themselves (physically or in otherways) if they: smoked one or more packs of cigarettes per day?35b. How much do you think people risk harming themselves (physically or in otherways) if they: try marijuana once or twice?35c. How much do you think people risk harming themselves (physically or in otherways) if they: smoke marijuana regularly?35d. How much do you think people risk harming themselves (physically or in otherways) if they: take one or two drinks of an alcoholic beverage (beer, wine, liquor)nearly every day?
Interaction with
Antisocial Peers
Young people who associate with peers who engage in problem
behaviors are at higher risk for engaging in antisocial behavior
themselves.
20e. Think of your four best friends (the friends you feel closest to). In the past year(12 months), how many of your best friends have: been suspended from school?20f. Think of your four best friends (the friends you feel closest to). In the past year(12 months), how many of your best friends have: carried a handgun?20g. Think of your four best friends (the friends you feel closest to). In the past year(12 months), how many of your best friends have: sold illegal drugs?20i. Think of your four best friends (the friends you feel closest to). In the past year(12 months), how many of your best friends have: stolen or tried to steal a motorvehicle such as a car or motorcycle?20j. Think of your four best friends (the friends you feel closest to). In the past year(12 months), how many of your best friends have: been arrested?20k. Think of your four best friends (the friends you feel closest to). In the past year(12 months), how many of your best friends have: dropped out of school?
Friends’ Use of Drugs Young people who associate with peers who engage in alcohol or
substance abuse are much more likely to engage in the same be-
havior. Peer drug use has consistently been found to be among
the strongest predictors of substance use among youth. Even
when young people come from well-managed families and do not
experience other risk factors, spending time with friends who use
drugs greatly increases the risk of that problem developing.
20a. Think of your four best friends (the friends you feel closest to). In the past year(12 months), how many of your best friends have: smoked cigarettes?20b. Think of your four best friends (the friends you feel closest to). In the past year(12 months), how many of your best friends have: tried beer, wine or hard liquor (forexample, vodka, whiskey, or gin) when their parents didn’t know about it?20c. Think of your four best friends (the friends you feel closest to). In the past year(12 months), how many of your best friends have: used marijuana?20d. Think of your four best friends (the friends you feel closest to). In the past year(12 months), how many of your best friends have: used LSD, cocaine, amphetamines,or other illegal drugs?
continued on the next column
54

Risk and Protective Factor Scale Definition (continued)
Depressive
Symptoms
Young people who express feelings of sadness for long periods
over the past year and who have negative attitudes about them-
selves and life in general are more likely to use drugs.
37. Sometimes I think that life is not worth it.38. At times I think I am no good at all.39. All in all, I am inclined to think that I am a failure.40. In the past year, have you felt depressed or sad MOST days, even if you felt okaysometimes?
Rewards for
Antisocial Behavior
Young people who receive rewards for their antisocial behavior
are at higher risk for engaging further in antisocial behavior and
substance use.
21a. What are the chances you would be seen as cool if you: smoked cigarettes?21c. What are the chances you would be seen as cool if you: began drinking alcoholicbeverages regularly, that is, at least once or twice a month?21e. What are the chances you would be seen as cool if you: smoked marijuana?
Peer-Individual Protective Factors
Religiosity Young people who regularly attend religious services are less
likely to engage in problem behaviors.
31. How often do you attend religious services or activities?
Social Skills Young people who are socially competent and engage in positive
interpersonal relations with their peers are less likely to use drugs
and engage in other problem behaviors.
26. You’re looking at CD’s in a music store with a friend. You look up and see herslip a CD under her coat. She smiles and says ’Which one do you want? Go ahead,take it while nobody’s around.’ There is nobody in sight, no employees and no othercustomers. What would you do now?29. It’s 8:00 on a weeknight and you are about to go over to a friend’s home whenyour mother asks you where you are going. You say ’Oh, just going to go hang outwith some friends.’ She says, ’No, you’ll just get into trouble if you go out. Stay hometonight.’ What would you do now?27. You are visiting another part of town, and you don’t know any of the peopleyour age there. You are walking down the street, and some teenager you don’t knowis walking toward you. He is about your size, and as he is about to pass you, hedeliberately bumps into you and you almost lose your balance. What would you say ordo?28. You are at a party at someone’s house, and one of your friends o↵ers you a drinkcontaining alcohol. What would you say or do?
continued on the next column
Risk and Protective Factor Scale Definition (continued)
Belief in the
Moral Order
Young people who have a belief in what is ”right” or ”wrong”
are less likely to use drugs.
42. I think it is okay to take something without asking if you can get away with it.36. I think sometimes it’s okay to cheat at school.41. It is all right to beat up people if they start the fight.104. It is important to be honest with your parents, even if they become upset or youget punished.
Prosocial
Involvement
Participation in positive school and community activities helps
provide protection for youth.
30e. How many times in the past year (12 months) have you: participated in clubs,organizations or activities at school?30f. How many times in the past year (12 months) have you: participated in clubs,organizations or activities outside school?30j. How many times in the past year (12 months) have you: volunteered to docommunity service?
Rewards for
Prosocial
Involvement
Young people who are rewarded for working hard in school and
volunteering in the community are less likely to engage in prob-
lem behavior.
21b. What are the chances you would be seen as cool if you: worked hard at school?21d. What are the chances you would be seen as cool if you: defended someone whowas being verbally abused at school?21f. What are the chances you would be seen as cool if you: volunteered to docommunity service?
55

E. COMPARISIONS OF CTC VS NYS YDS ONRISK AND PROTECTIVE FACTORS
Comparison of the number of items from each risk and protective factor includedin the 2008 New York Youth Development Survey (NY YDS) versus the standard2002 Communities That Care (CTC) survey form.
N of Items
CTC NY YDS COMMUNITY PROTECTION
6 5 Community Opportunities for Prosocial Involvement3 3 Community Rewards for Prosocial Involvement
CTC NY YDS COMMUNITY RISK
5 4 Community Disorganization7 6 Laws and Norms Favorable to Drug Use3 3 Low Neighborhood Attachment4 4 Perceived Availability of Drugs1 1 Perceived Availability of Handguns4 0 Transitions and Mobility (Not in 2008 NY YDS)
CTC NY YDS FAMILY PROTECTION
4 4 Family Attachment3 3 Family Opportunities for Prosocial Involvement4 4 Family Rewards for Prosocial Involvement
CTC NY YDS FAMILY RISK
3 3 Family Conflict10 8 Family History of Antisocial Behavior3 3 Parental Attitudes Favorable Toward Drug Use3 3 Parental Attitudes Favorable toward Antisocial Behavior8 7 Poor Family Management
CTC NY YDS SCHOOL PROTECTION
5 4 School Opportunities for Prosocial Involvement4 3 School Rewards for Prosocial Involvement
CTC NY YDS SCHOOL RISK
2 2 Academic Failure7 7 Low Commitment to School
continued on next column
N of Items
CTC NY YDS PEER-INDIVIDUAL PROTECTION
4 4 Belief in the Moral Order4 0 Interactions with Prosocial Peers (Not in 2008 NY YDS)4 3 Peer Rewards for Prosocial Involvement3 3 Prosocial Involvement1 1 Religiosity4 4 Social Skills
CTC NY YDS PEER-INDIVIDUAL RISK
4 4 Depressive Symptoms4 4 Early Initiation of Antisocial Behavior4 4 Early Initiation of Drug Use5 5 Favorable Attitudes Toward Antisocial Behavior4 4 Favorable Attitudes Toward Drug Use4 4 Friends’ Use of Drugs4 2 Gang Involvement6 6 Interaction with Antisocial Peers3 0 Intentions to Use (Not in 2008 NY YDS)4 4 Perceived Risks of Drug Use4 3 Peer Rewards for Antisocial Behavior(PRRAB)3 3 Rebelliousness3 0 Sensation Seeking (Not in 2008 NY YDS)
CTC NY YDS BEHAVIORAL OUTCOMES
11 8 Antisocial Behavior
56

F. DATA TABLES
F.1. Risk and Protective Factors
Table 17: Percentage of Students Reporting Risks for Community Domain
Laws and
Low High Norms Perceived
Neighborhood Community Favorable Availability
Attachment Disorganization to Drug Use of Drugs
7-8 new york city 51.8 56.6 24.6 25.3state 42.2 42.0 20.9 25.0
9-10 new york city 50.6 65.7 42.0 29.0state 42.4 55.3 37.5 34.6
11-12 new york city 57.6 70.2 38.8 27.0state 46.7 58.2 39.5 35.5
Combined new york city 52.9 62.0 32.1 26.5state 43.8 51.7 32.5 31.7
57

Table 18: Percentage of Students Reporting Risks for Family Domain
Family Parental Parental
History of Attitudes Attitudes
Poor Family Family Antisocial Favorable Favorable
Management Conflict Behavior to ATOD to ASB
7-8 new york city 49.9 47.9 16.3 21.0 40.5state 43.2 46.5 16.5 21.6 42.5
9-10 new york city 53.2 48.5 21.3 33.9 45.5state 46.6 49.2 24.2 36.3 51.1
11-12 new york city 43.7 41.5 19.6 32.2 43.0state 39.5 40.7 24.8 43.0 54.3
Combined new york city 49.2 46.5 18.3 26.8 42.3state 43.1 45.5 21.7 33.3 49.1
58

Table 19: Percentage of Students Reporting Risks for School Domain
Low
Academic Commitment
Failure to School
7-8 new york city 50.4 33.2state 44.3 37.0
9-10 new york city 55.3 40.0state 48.3 40.5
11-12 new york city 53.0 39.8state 44.4 43.9
Combined new york city 52.3 36.5state 45.7 40.3
59

Table 20: Percentage of Students Reporting Risks for Peer Domain
Interaction Peer
Early Early Favorable Favorable Perceived with Friends’ Rewards for
Initiation Initiation Attitudes Attitudes Risk of Antisocial Use of Depressive Antisocial
Rebelliousness of Drug Use of ASB to Drug Use to ASB Drug Use Peers Drugs Symptoms Behavior
7-8 new york city 43.9 24.9 31.6 19.9 37.6 40.0 50.3 24.7 42.6 30.1state 40.3 23.6 26.4 18.2 36.5 32.4 42.1 22.7 36.5 30.4
9-10 new york city 49.2 23.9 41.0 30.7 42.8 42.5 59.8 30.2 47.0 37.4state 46.5 24.2 34.2 32.8 43.3 37.2 51.4 32.7 43.2 45.1
11-12 new york city 46.6 23.5 39.6 14.8 36.1 35.4 54.2 24.8 44.6 38.0state 46.7 28.1 32.6 25.4 43.9 39.9 49.1 35.7 38.9 55.2
Combined new york city 45.8 24.3 35.9 21.3 38.5 39.5 53.6 26.1 44.2 33.8state 44.4 25.2 30.9 25.3 41.1 36.3 47.4 30.1 39.5 43.1
60
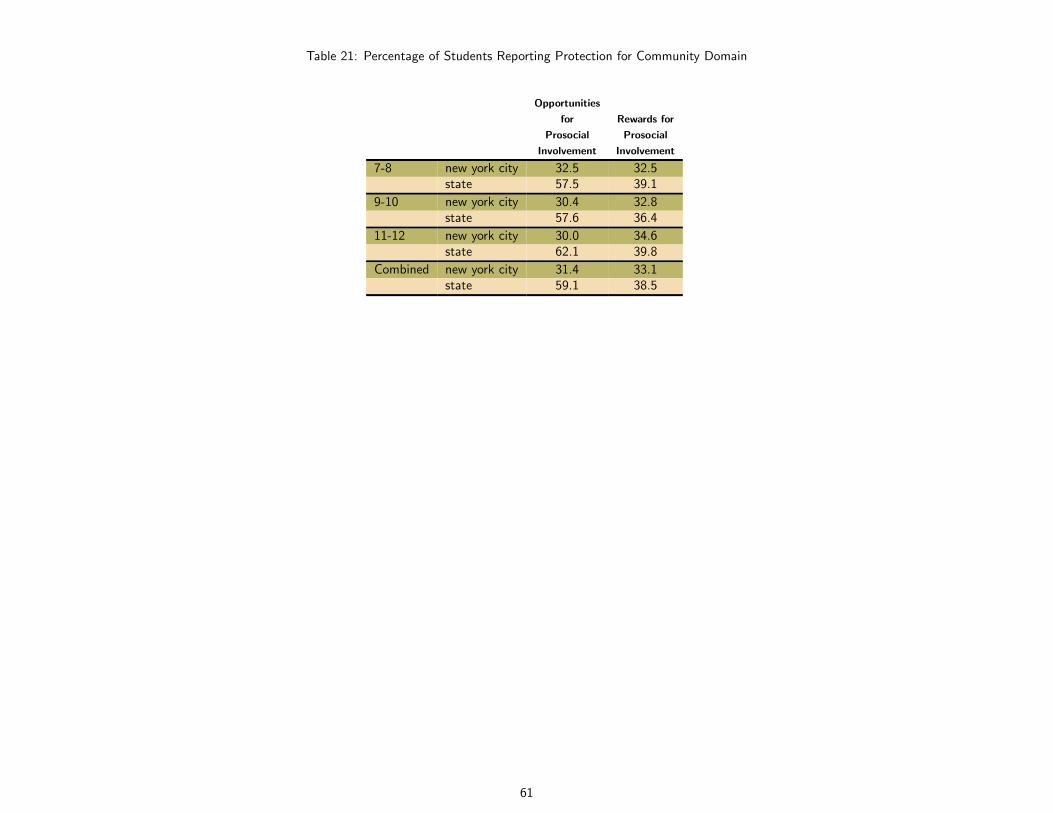
Table 21: Percentage of Students Reporting Protection for Community Domain
Opportunities
for Rewards for
Prosocial Prosocial
Involvement Involvement
7-8 new york city 32.5 32.5state 57.5 39.1
9-10 new york city 30.4 32.8state 57.6 36.4
11-12 new york city 30.0 34.6state 62.1 39.8
Combined new york city 31.4 33.1state 59.1 38.5
61

Table 22: Percentage of Students Reporting Protection for Family Domain
Family Family
Family Opportunities Rewards for
Attachment for PSI PSI
7-8 new york city 44.4 50.9 52.5state 49.5 54.9 59.1
9-10 new york city 38.5 46.7 45.6state 41.3 50.0 50.9
11-12 new york city 41.1 46.4 41.7state 46.2 48.5 47.0
Combined new york city 42.2 48.8 48.2state 45.7 51.2 52.5
62

Table 23: Percentage of Students Reporting Protection for School Domain
School School
Opportunities Rewards for
for PSI PSI
7-8 new york city 60.1 56.4state 73.2 55.9
9-10 new york city 73.9 56.7state 82.4 57.0
11-12 new york city 71.5 53.6state 81.6 54.0
Combined new york city 66.4 55.8state 78.9 55.7
63
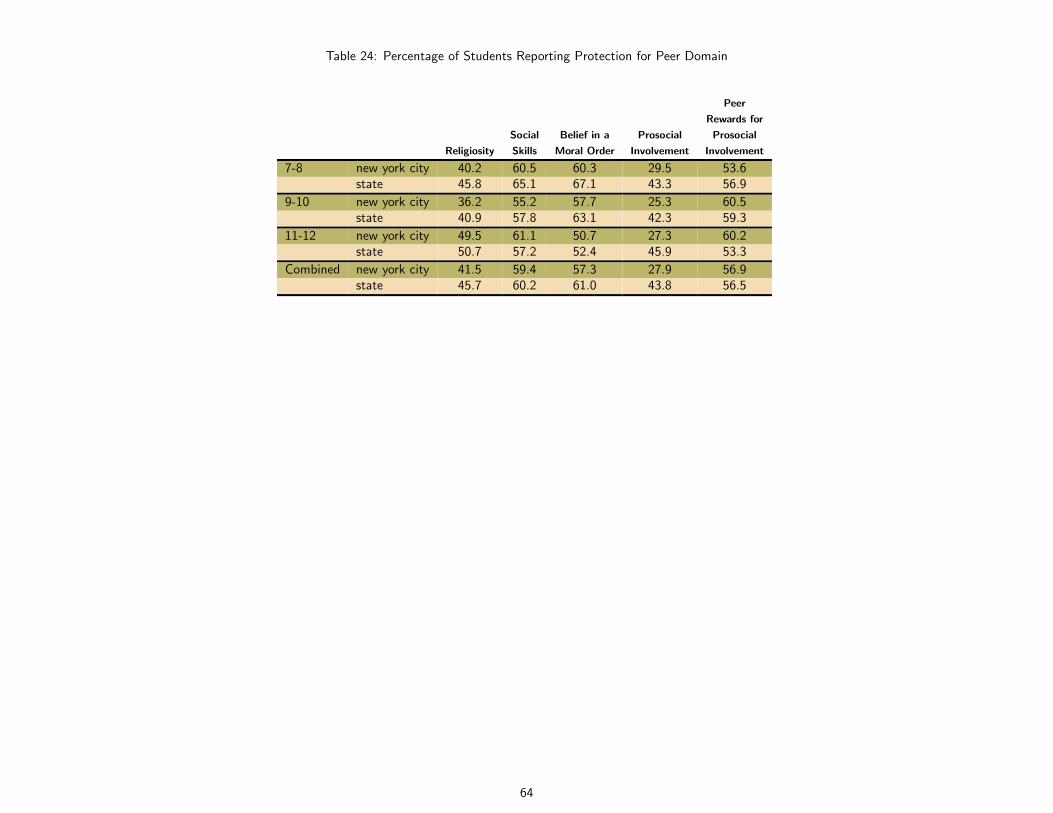
Table 24: Percentage of Students Reporting Protection for Peer Domain
Peer
Rewards for
Social Belief in a Prosocial Prosocial
Religiosity Skills Moral Order Involvement Involvement
7-8 new york city 40.2 60.5 60.3 29.5 53.6state 45.8 65.1 67.1 43.3 56.9
9-10 new york city 36.2 55.2 57.7 25.3 60.5state 40.9 57.8 63.1 42.3 59.3
11-12 new york city 49.5 61.1 50.7 27.3 60.2state 50.7 57.2 52.4 45.9 53.3
Combined new york city 41.5 59.4 57.3 27.9 56.9state 45.7 60.2 61.0 43.8 56.5
64

F.2. Lifetime Prevalence of Alcohol, Tobacco and Other Drugs
Table 25: Lifetime Prevalence of Alcohol, Tobacco and Other Drugs, By Grade Level and Group
OTC
Chewing OTC Cold Ca↵eine/Diet
Alcohol Cigarettes Tobacco Marijuana Hallucinogens Cocaine Inhalants Medicine Pills
7 new york city 26.0 8.7 1.6 2.1 0.2 0.6 9.1 1.7 2.5state 24.9 8.8 2.4 2.5 0.2 0.6 9.6 1.8 3.1
8 new york city 41.6 15.0 3.0 5.8 0.3 0.9 12.4 2.7 4.2state 40.3 15.8 3.8 6.8 0.5 1.0 11.5 2.7 4.8
MTF 8th Grade 38.9 20.5 9.8 14.6 3.1 3.1 15.7 – –
9 new york city 51.7 20.8 3.9 11.4 0.9 1.4 10.6 3.0 3.9state 54.2 21.0 4.7 14.0 0.9 1.3 12.3 3.9 6.3
10 new york city 56.6 22.9 3.6 16.7 0.8 1.3 8.1 3.1 4.1state 64.5 25.9 6.6 22.9 1.6 1.7 9.8 5.1 7.2
MTF 10th Grade 58.3 31.7 12.2 29.9 6.3 5.2 12.8 – –
11 new york city 61.1 27.1 3.9 20.7 1.0 1.1 6.4 3.3 4.3state 72.1 32.4 10.7 32.8 3.3 2.5 8.4 6.6 8.6
12 new york city 67.5 31.6 4.1 25.8 1.5 2.0 5.6 4.3 4.4state 78.5 37.8 13.4 39.4 4.4 4.0 7.7 7.5 9.6
MTF 12th Grade 71.9 44.7 15.6 42.6 8.1 7.8 9.9 5.9 –
Combined new york city 46.5 18.6 3.1 11.1 0.6 1.1 9.3 2.8 3.8state 55.0 23.3 6.8 19.1 1.8 1.8 9.9 4.5 6.5
65

Table 26: Lifetime Prevalence of Alcohol, Tobacco and Other Drugs, By Grade Level and Group (continued)
Presc. Pain Presc. Presc. Any Illicit
Killers Tranquilizers Sedatives Meth Stimulants Heroin Ecstasy Drug*
7 new york city 6.7 0.7 0.4 0.4 0.3 0.2 0.2 16.7state 7.1 0.6 0.5 0.4 0.3 0.4 0.2 17.4
8 new york city 9.8 1.3 0.8 0.7 0.4 0.7 0.4 24.9state 9.2 1.1 0.6 0.8 0.8 0.6 0.6 23.5
MTF 8th Grade – – 3.9 2.3 6.8 1.4 2.4 –
9 new york city 10.8 1.9 0.8 0.9 0.8 0.7 1.5 27.9state 12.1 1.8 0.8 0.8 1.4 0.9 1.4 31.3
10 new york city 12.1 2.0 0.8 0.6 0.8 0.5 1.2 31.2state 14.7 2.3 0.9 1.0 2.3 0.9 1.6 37.1
MTF 10th Grade – – 6.8 2.4 9.0 1.2 4.3 –
11 new york city 12.8 2.0 0.9 0.9 0.9 0.6 1.4 34.1state 16.5 3.4 1.2 1.3 3.7 1.4 2.6 43.4
12 new york city 12.3 2.7 0.7 0.5 1.4 0.6 1.4 37.6state 18.1 5.0 1.2 1.0 5.2 1.8 3.3 48.9
MTF 12th Grade 13.2 – 8.9 2.8 10.5 1.3 6.2 –
Combined new york city 10.1 1.6 0.7 0.7 0.7 0.5 0.8 26.8state 12.8 2.3 0.8 0.9 2.2 1.0 1.6 33.1
*Any Illicit Drug - all drugs except for alcohol and tobacco
66

F.3. Past 30 Day Prevalence of Alcohol, Tobacco and Other Drugs
Table 27: Past 30 Day Prevalence of Alcohol, Tobacco and Other Drugs, By Grade Level and Group
OTC
Chewing OTC Cold Ca↵eine/Diet
Alcohol Cigarettes Tobacco Marijuana Hallucinogens Cocaine Inhalants Medicine Pills
7 new york city 8.1 1.5 0.8 0.9 0.1 0.2 4.3 1.0 1.3state 6.6 2.1 0.8 1.1 0.1 0.3 4.2 0.8 1.4
8 new york city 15.4 2.9 1.1 2.7 0.1 0.4 5.3 1.1 1.9state 13.8 4.5 1.5 3.4 0.2 0.4 4.7 1.1 2.1
MTF 8th Grade 15.9 6.8 3.5 5.8 0.9 0.8 4.1 – –
9 new york city 23.3 6.7 2.1 6.0 0.3 0.7 4.7 1.2 2.2state 24.9 7.4 2.1 7.6 0.4 0.5 4.0 1.5 2.7
10 new york city 27.6 6.2 1.9 9.1 0.4 0.5 2.9 1.3 2.0state 31.9 8.7 2.9 12.9 0.5 0.6 2.8 2.1 3.0
MTF 10th Grade 28.8 12.3 5.0 13.8 1.7 1.3 2.1 – –
11 new york city 31.9 7.8 2.1 10.5 0.4 0.4 1.7 1.4 1.9state 39.6 12.3 4.6 18.4 1.0 0.7 1.8 2.3 3.4
12 new york city 36.9 9.8 2.0 11.9 0.5 0.4 1.9 1.6 1.9state 48.8 15.6 5.1 21.9 1.1 0.7 1.6 2.2 3.6
MTF 12th Grade 43.1 20.4 6.5 19.4 1.6 2.0 1.4 – –
Combined new york city 20.7 4.9 1.5 5.5 0.2 0.4 3.8 1.2 1.8state 26.9 8.3 2.8 10.5 0.5 0.5 3.2 1.7 2.7
67

Table 28: Past 30 Day Prevalence of Alcohol, Tobacco and Other Drugs, By Grade Level and Group (continued)
Presc. Pain Presc. Presc. Any Illicit
Killers Tranquilizers Sedatives Meth Stimulants Heroin Ecstasy Drug*
7 new york city 2.5 0.2 0.2 0.2 0.2 0.2 0.1 8.3state 2.7 0.2 0.2 0.2 0.2 0.2 0.1 8.4
8 new york city 4.2 0.5 0.4 0.4 0.2 0.2 0.2 12.3state 3.7 0.3 0.3 0.3 0.3 0.2 0.2 11.6
MTF 8th Grade – – – 0.7 2.2 0.4 0.8 –
9 new york city 4.9 0.8 0.4 0.4 0.4 0.4 0.6 15.1state 5.5 0.8 0.4 0.3 0.6 0.5 0.5 16.2
10 new york city 6.4 1.0 0.4 0.3 0.4 0.3 0.5 18.0state 6.7 0.9 0.3 0.3 0.8 0.3 0.4 20.7
MTF 10th Grade – – – 0.7 2.8 0.4 1.1 –
11 new york city 7.3 1.0 0.6 0.5 0.5 0.4 0.4 19.2state 6.9 1.1 0.5 0.4 1.3 0.5 0.8 24.7
12 new york city 5.5 0.8 0.3 0.3 0.5 0.2 0.2 19.2state 7.2 1.7 0.4 0.3 1.9 0.5 0.9 28.0
MTF 12th Grade 3.8 – 2.8 0.6 2.9 0.4 1.8 –
Combined new york city 4.7 0.6 0.4 0.3 0.3 0.3 0.3 14.1state 5.4 0.8 0.3 0.3 0.8 0.3 0.5 18.0
*Any Illicit Drug - all drugs except for alcohol and tobacco
68

F.4. Heavy Use and Antisocial Behaviors
Table 29: Percentage of Students With Heavy Use of Alcohol and Cigarettes
Binge Pack of
Drinking** Cigarettes***
7-8 new york city 10.3 0.1state 7.2 0.2
9-10 new york city 18.5 0.5state 17.8 0.6
11-12 new york city 22.5 0.4state 28.2 1.2
Combined new york city 15.3 0.3state 17.4 0.7
**Binge Drinking - having five or more drinks in a row within the past two weeks.
***Pack of Cigarettes means smoking a pack or more per day.
69

Table 30: Percentage of Students With Antisocial Behavior in the Past Year
Drunk or Sold
Suspended High at Illegal Stolen a Been Attacked to Carried a Handgun to
from School School Drugs Vehicle Arrested Harm Handgun School
7-8 new york city 13.8 4.4 1.1 1.3 3.1 16.1 2.1 0.7state 11.5 4.1 1.0 1.1 2.6 13.7 2.2 0.4
9-10 new york city 16.2 11.3 3.2 2.0 7.3 19.0 4.2 1.3state 12.3 11.1 3.8 1.5 4.9 16.3 3.1 0.7
11-12 new york city 12.7 12.8 4.0 1.6 7.2 15.0 4.3 0.9state 9.6 16.8 7.4 1.6 5.2 12.3 3.1 0.6
Combined new york city 14.1 8.1 2.3 1.5 5.1 16.6 3.2 0.9state 11.2 10.4 4.0 1.4 4.2 14.1 2.8 0.5
70
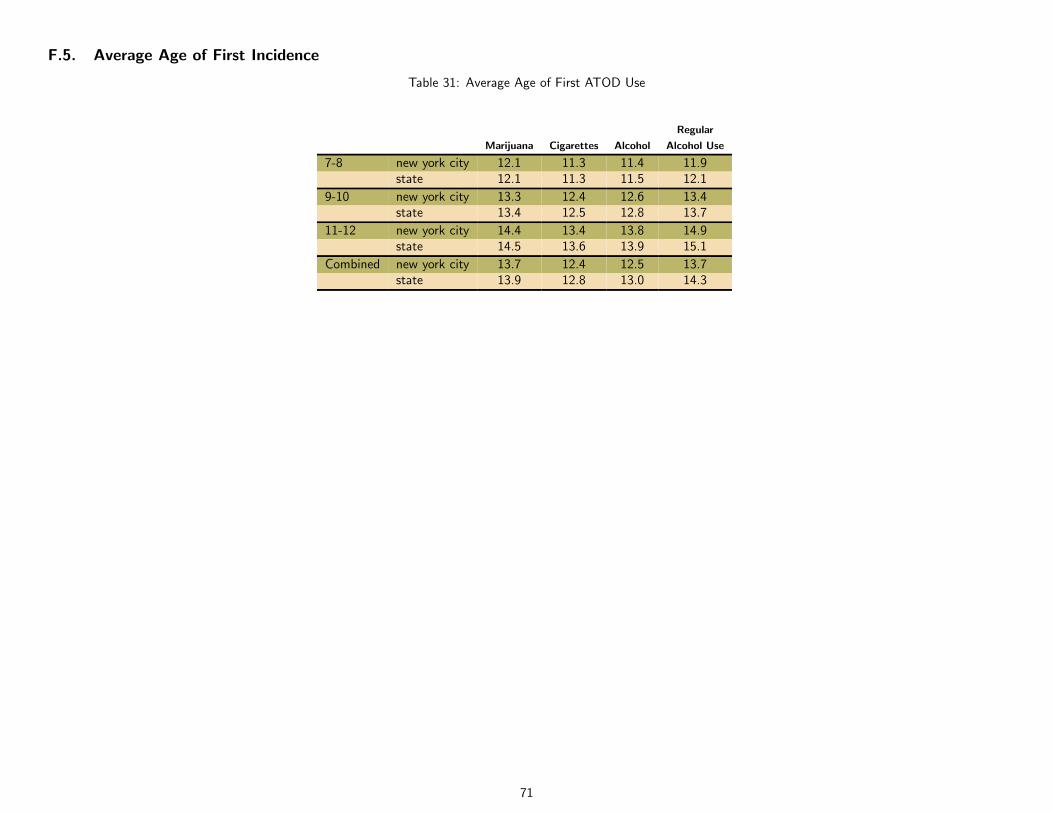
F.5. Average Age of First Incidence
Table 31: Average Age of First ATOD Use
Regular
Marijuana Cigarettes Alcohol Alcohol Use
7-8 new york city 12.1 11.3 11.4 11.9state 12.1 11.3 11.5 12.1
9-10 new york city 13.3 12.4 12.6 13.4state 13.4 12.5 12.8 13.7
11-12 new york city 14.4 13.4 13.8 14.9state 14.5 13.6 13.9 15.1
Combined new york city 13.7 12.4 12.5 13.7state 13.9 12.8 13.0 14.3
71

Table 32: Average Age of First Antisocial Behavior
School Been Carried a Attacked to Belonged to
Suspension Arrested Gun Harm a Gang
7-8 new york city 11.2 12.0 11.6 11.3 11.8state 11.3 11.9 11.5 11.4 11.9
9-10 new york city 12.1 13.3 12.9 12.3 12.9state 12.2 13.4 12.8 12.4 12.8
11-12 new york city 12.9 14.7 14.0 13.0 13.8state 13.1 14.8 13.8 13.1 13.6
Combined new york city 12.0 13.5 12.9 12.0 12.6state 12.2 13.7 12.9 12.3 12.7
72

F.6. Sources and Locations of Alcohol Use
Table 33: Students’ Response to ”If you drank alcohol in the past year, how did you usually get it?”
Did not
drink Bought it Home Took it
alcohol in Bought it myself Someone I Someone I Home with without my A stranger from a
the past myself with without a know age 21 know under My brother my parents’ parents’ Another bought it store or
year a fake ID fake ID or older age 21 or sister permission permission relative for me shop Other
7-8 new york city 75.4 0.2 0.2 3.4 1.9 0.9 5.6 2.5 3.0 0.4 0.2 6.5state 78.0 0.1 0.1 3.0 1.8 0.9 5.1 3.0 2.2 0.2 0.2 5.3
9-10 new york city 55.7 0.5 1.2 8.3 5.2 1.8 7.8 3.4 5.2 1.1 0.3 9.6state 51.7 0.3 0.6 9.9 8.2 2.0 7.1 5.6 3.5 1.1 0.2 9.6
11-12 new york city 45.5 0.8 2.7 13.9 7.1 2.1 8.0 2.2 4.9 1.3 0.4 11.1state 34.0 1.1 2.2 20.5 13.6 2.2 7.0 3.4 3.1 1.5 0.3 11.0
Combined new york city 63.4 0.4 1.0 7.1 3.9 1.4 6.7 2.6 4.0 0.8 0.3 8.3state 57.5 0.5 0.9 10.1 7.1 1.6 6.2 3.9 2.9 0.9 0.2 8.2
73

Table 34: Students’ Response to ”If you drank alcohol in the past year, where did you usually drink it?”
Did not Empty
drink building or
alcohol in Open area Sporting Restaurant, a
the past Someone like a event or bar, or a construction
year My home else’s home park, etc. concert nightclub site Hotel/motel In a car At school
7-8 new york city 77.8 10.1 7.4 1.8 0.3 1.5 0.2 0.2 0.1 0.5state 79.7 9.2 7.1 1.9 0.3 1.0 0.2 0.2 0.1 0.3
9-10 new york city 58.1 15.9 16.3 4.4 0.6 3.3 0.2 0.3 0.2 0.8state 53.0 14.4 23.4 5.5 0.5 1.7 0.2 0.4 0.3 0.5
11-12 new york city 47.6 16.2 24.2 4.0 0.6 5.9 0.2 0.3 0.2 0.7state 35.1 13.9 39.2 6.2 0.6 3.3 0.2 0.5 0.4 0.5
Combined new york city 65.8 13.0 13.6 3.0 0.4 3.0 0.2 0.2 0.2 0.6state 58.9 12.1 21.2 4.2 0.4 1.9 0.2 0.4 0.3 0.4
74

F.7. Gambling Behaviors
Table 35: Percentage of Students Engaged in Gambling Activities
Bet Money on Bet or Spent Played Pool,
Gambled In The Played Bingo Ra✏es or Money on Pull Played Cards Basketball,
Past Year for Money Charity Games Tabs for Money etc. for Money
7-8 new york city 35.1 14.4 14.7 4.2 20.0 17.3state 44.6 15.1 20.7 5.2 20.6 16.9
9-10 new york city 29.5 14.0 14.3 5.3 21.8 18.3state 47.5 15.1 21.6 6.2 23.2 18.0
11-12 new york city 30.2 10.6 11.6 4.0 19.0 16.3state 50.8 12.4 20.8 6.3 25.1 19.0
Combined new york city 32.5 13.4 13.8 4.4 20.1 17.3state 47.5 14.2 21.0 5.9 22.9 18.0
75

Table 36: Percentage of Students Engaged in Gambling Activities (continued)
Played Lottery, Played the Bet Money on
Bet Money on Played ”Quick Lotto or Played Dice Numbers or Arcade or Video
Sports Draw” Scratch O↵ Games for Money ”Bolita” Games
7-8 new york city 15.7 5.8 20.9 8.4 2.8 15.6state 18.0 7.7 29.2 7.9 2.0 13.4
9-10 new york city 16.5 6.9 19.9 10.2 4.1 14.0state 19.7 8.3 29.7 9.7 2.5 13.2
11-12 new york city 15.6 5.5 18.5 9.1 3.0 12.5state 21.7 8.6 30.9 10.5 2.2 11.9
Combined new york city 15.9 6.0 20.1 9.0 3.2 14.5state 19.8 8.2 29.9 9.4 2.3 12.8
76

Table 37: Percentage of Students Engaged in Gambling Activities (continued)
Bet on Slots, Bet on Horses,
Poker Machines, Dogs, Other Bet Money at a Bet Money Over
etc Animals Casino the Internet
7-8 new york city 8.0 3.5 2.5 4.5state 6.7 5.1 1.9 3.8
9-10 new york city 8.2 4.3 3.7 4.9state 6.9 5.6 2.7 3.9
11-12 new york city 6.5 3.2 3.3 4.1state 6.7 6.2 4.3 4.1
Combined new york city 7.7 3.6 3.0 4.5state 6.8 5.6 3.0 4.0
77

F.8. School Safety Issues
Table 38: Students’ Response to ”How many times in the past have you taken a handgun to school?”
Never 1-2 times 3-5 times 6-9 times 10-19 times 20-29 times 30-39 times 40+ times
7-8 new york city 99.3 0.3 0.1 0.0 0.0 0.0 0.0 0.2state 99.6 0.2 0.1 0.0 0.0 0.0 0.0 0.1
9-10 new york city 98.7 0.6 0.1 0.1 0.1 0.0 0.0 0.2state 99.4 0.3 0.0 0.0 0.0 0.0 0.0 0.1
11-12 new york city 99.1 0.4 0.2 0.1 0.1 0.0 0.0 0.2state 99.4 0.2 0.1 0.0 0.0 0.0 0.0 0.2
Combined new york city 99.1 0.4 0.1 0.1 0.1 0.0 0.0 0.2state 99.5 0.2 0.1 0.0 0.0 0.0 0.0 0.1
78

Table 39: Students’ Response to ”How wrong do you think it is for someone your age to take a handgun to school?”
A Little Not Wrong
Very Wrong Wrong Bit Wrong at All
7-8 new york city 87.3 9.3 2.5 0.9state 89.6 8.1 1.7 0.6
9-10 new york city 83.4 11.7 3.4 1.4state 88.2 9.0 2.1 0.7
11-12 new york city 87.7 8.3 2.6 1.4state 91.1 6.5 1.5 0.8
Combined new york city 86.4 9.7 2.7 1.2state 89.6 7.9 1.8 0.7
79