Embed Size (px)
DESCRIPTION
Latino Youth in New York City. School, Work, and Income Trends for New York’s Largest Group of Young People. Lazar Treschan, Director of Youth Policy January 31, 2011. Outline of Presentation. Background & Methodology Demographics School and Work Income and Poverty Further Questions. - PowerPoint PPT Presentation
Citation preview
www.cssny.org 1
Latino Youth in New York City
School, Work, and Income Trends for New York’s Largest Group of Young People
Lazar Treschan, Director of Youth Policy
January 31, 2011
www.cssny.org 2
Outline of Presentation
1.Background & Methodology
2.Demographics
3.School and Work
4.Income and Poverty
5.Further Questions
www.cssny.org 3
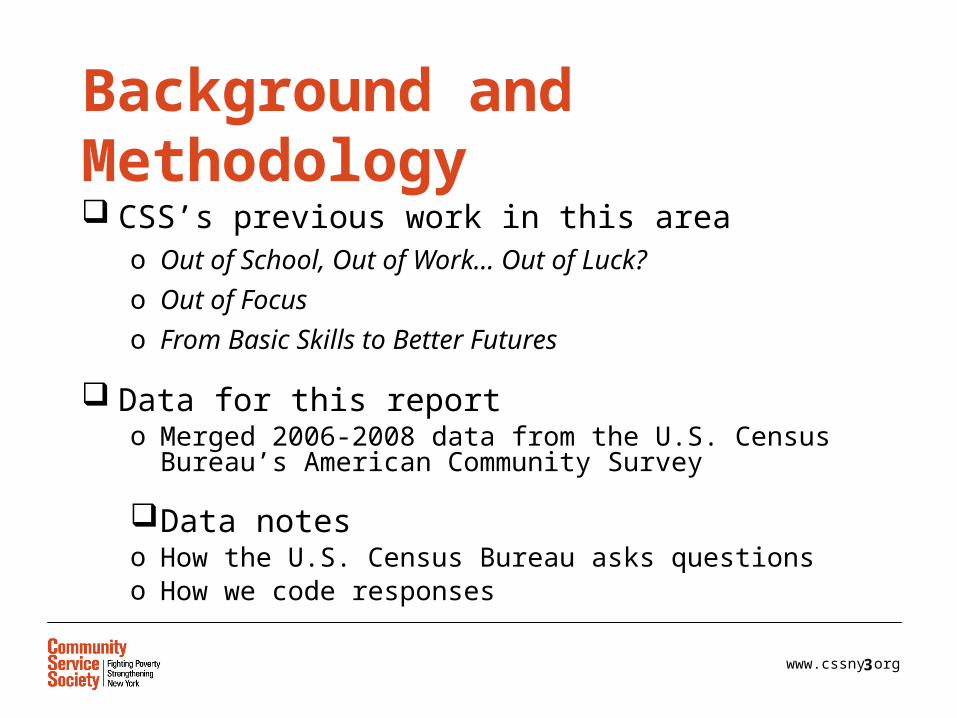
Background and Methodology CSS’s previous work in this area
o Out of School, Out of Work… Out of Luck?o Out of Focuso From Basic Skills to Better Futures
Data for this reporto Merged 2006-2008 data from the U.S. Census Bureau’s
American Community Survey
Data noteso How the U.S. Census Bureau asks questionso How we code responses

Demographics of Latino Youth
4
www.cssny.org 5
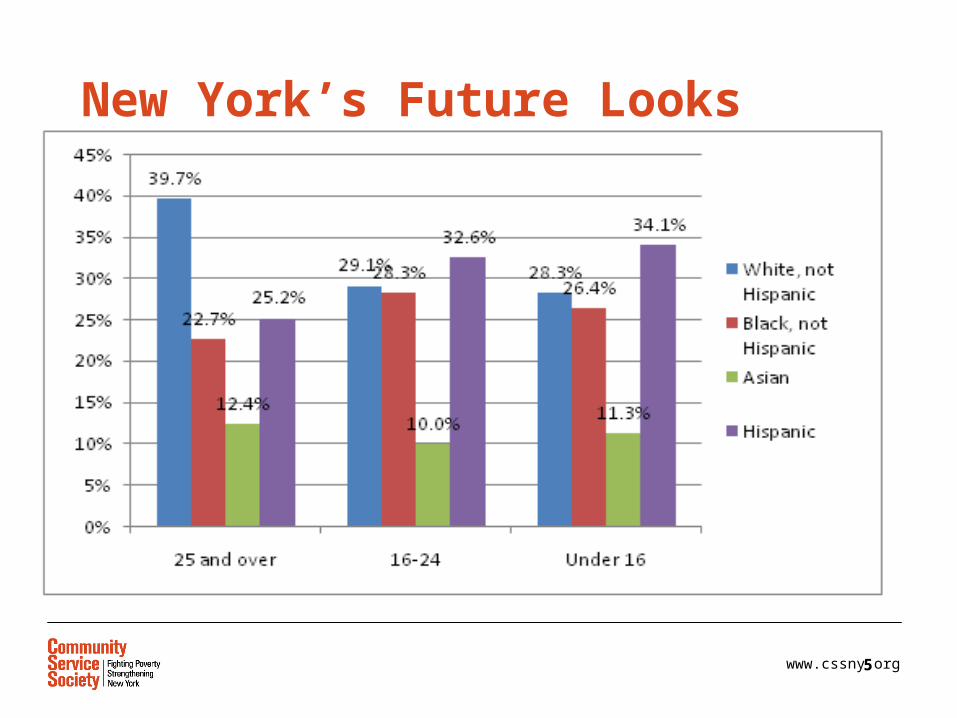
New York’s Future Looks Latino
www.cssny.org 6
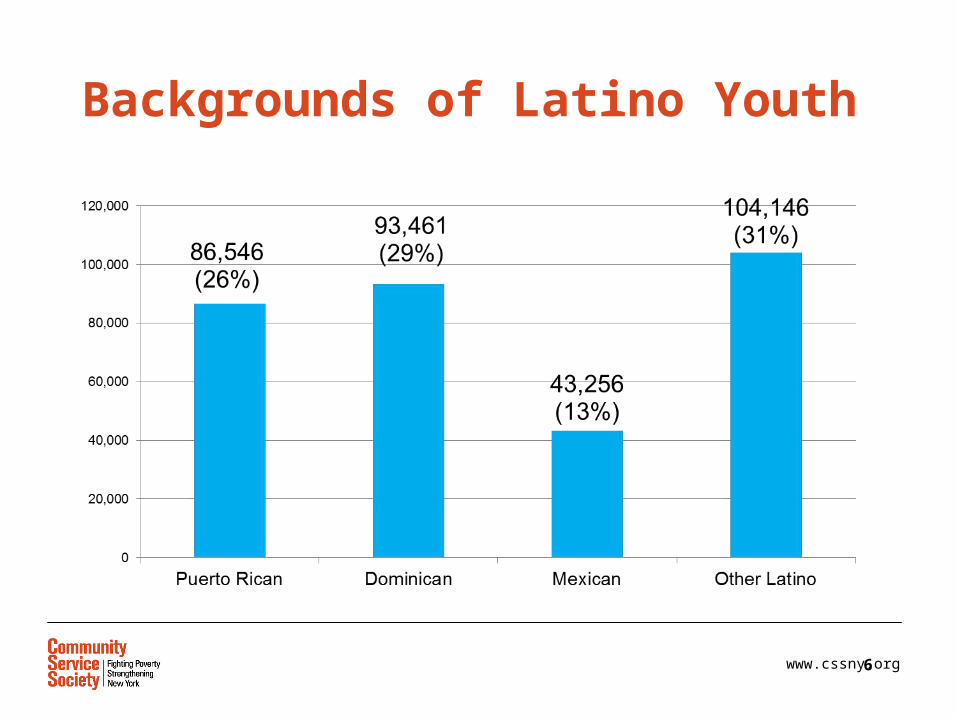
Backgrounds of Latino Youth
www.cssny.org 7
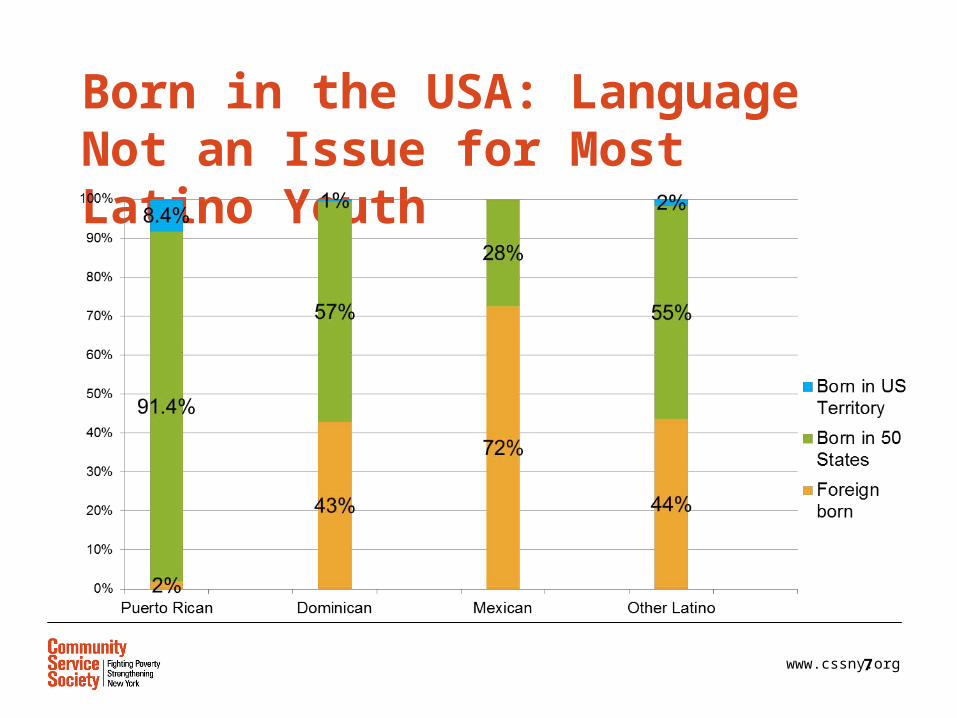
Born in the USA: Language Not an Issue for Most Latino Youth
School and Work
8

www.cssny.org 9
School Enrollment
School Enrollment White Black Asian All Latino
Foreign-born 68.3% 59.4% 69.1% 34.9%
Native 66.9% 60.9% 79.1% 61.9%
School Enrollment Puerto Rican Dominican Mexican
Other Latino
Foreign-born 84.8% 50.0% 13.4% 36.1%
Native 55.1% 68.2% 66.8% 65.0%
www.cssny.org 10
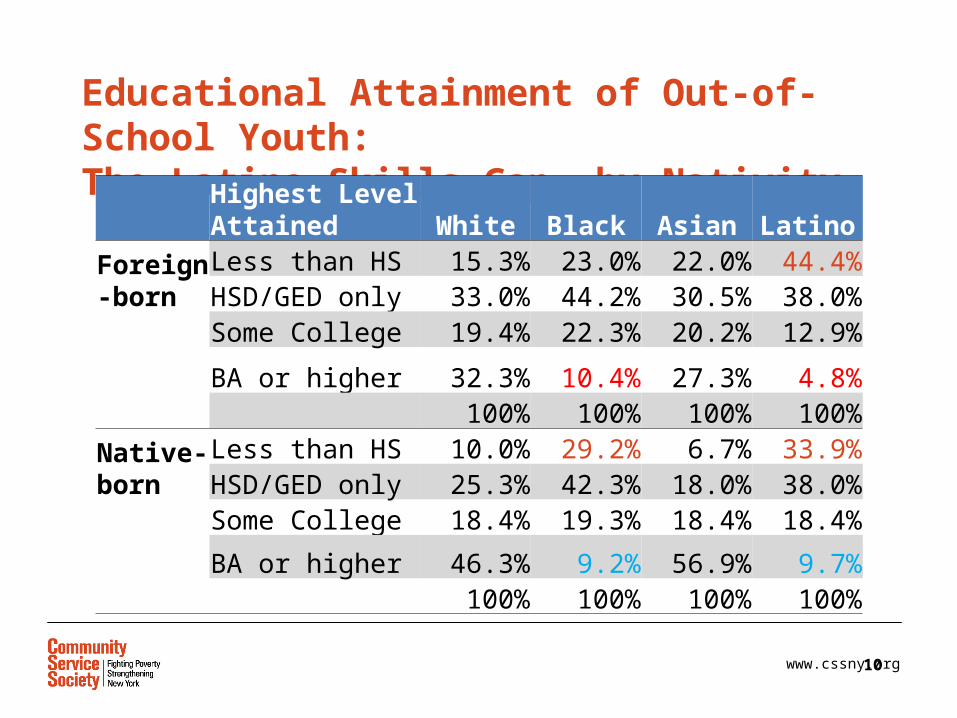
Educational Attainment of Out-of-School Youth:The Latino Skills Gap, by NativityHighest Level
Attained White Black Asian LatinoForeign-born
Less than HS 15.3% 23.0% 22.0% 44.4%HSD/GED only 33.0% 44.2% 30.5% 38.0%Some College 19.4% 22.3% 20.2% 12.9%
BA or higher 32.3% 10.4% 27.3% 4.8%100% 100% 100% 100%
Native-born
Less than HS 10.0% 29.2% 6.7% 33.9%HSD/GED only 25.3% 42.3% 18.0% 38.0%Some College 18.4% 19.3% 18.4% 18.4%
BA or higher 46.3% 9.2% 56.9% 9.7%100% 100% 100% 100%

www.cssny.org 11
Educational Attainment of Out-of-School Youth:The Latino Skills Gap, by GenderHighest Level
Attained Puerto Rican
Dominican MexicanOther
Latino
MalesLess than HS 41.9% 36.7% 52.6% 40.4%HSD/GED only 36.6% 41.5% 39.3% 38.0%Some College 16.6% 15.6% 5.7% 15.6%
BA or higher 4.9% 6.2% 2.4% 5.9%
100% 100% 100% 100%
FemalesLess than HS 32.4% 29.9% 29.9% 32.8%HSD/GED only 40.8% 34.1% 35.4% 36.4%Some College 17.4% 25.6% 7.7% 19.0%
BA or higher 9.3% 10.5% 7.5% 11.7%
100% 100% 100% 100%
www.cssny.org 12
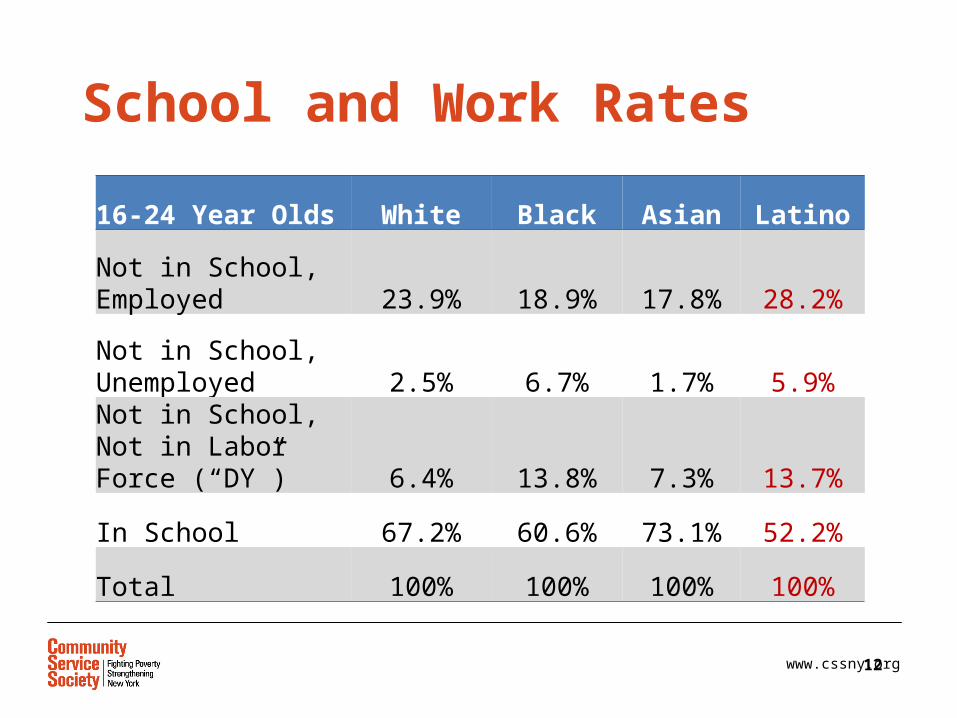
School and Work Rates
16-24 Year Olds White Black Asian Latino
Not in School, Employed 23.9% 18.9% 17.8% 28.2%
Not in School, Unemployed 2.5% 6.7% 1.7% 5.9%Not in School, Not in Labor Force (“DY”) 6.4% 13.8% 7.3% 13.7%
In School 67.2% 60.6% 73.1% 52.2%
Total 100% 100% 100% 100%
www.cssny.org 13
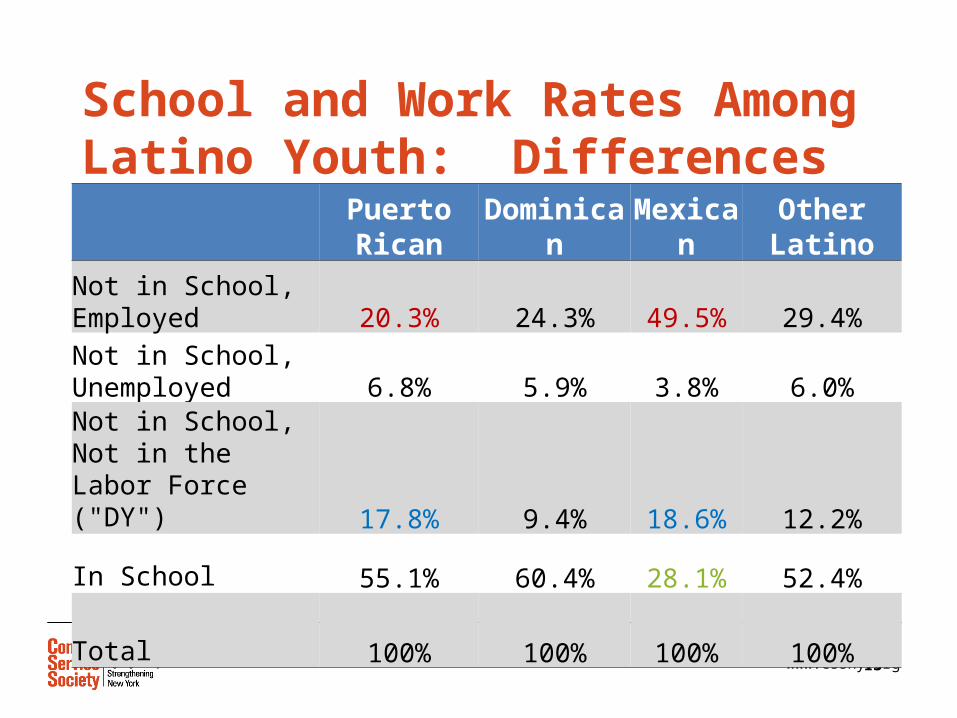
School and Work Rates Among Latino Youth: Differences Emerge
Puerto Rican Dominican Mexican Other LatinoNot in School, Employed 20.3% 24.3% 49.5% 29.4%Not in School, Unemployed 6.8% 5.9% 3.8% 6.0%Not in School, Not in the Labor Force ("DY") 17.8% 9.4% 18.6% 12.2%
In School 55.1% 60.4% 28.1% 52.4%
Total 100% 100% 100% 100%

www.cssny.org 14
School and Work Rates Among Latino Youth:More Differences Puerto Rican Dominican Mexican
Other Latino
Males
Not in School, Employed 21.2% 28.0% 68.1% 35.8%
Not in School, Unemployed 7.4% 6.6% 3.4% 7.2%Not in School, Not in Labor Force 16.7% 9.3% 8.0% 8.5%In School 54.7% 56.1% 20.5% 48.4%Females
Not in School, Employed 19.5% 20.8% 22.7% 23.0%Not in School, Unemployed 6.2% 5.3% 4.3% 4.9%Not in School, Not in Labor Force 18.7% 9.4% 33.9% 15.8%In School 55.5% 64.6% 39.0% 56.3%
Income and Poverty
15

www.cssny.org 16
Incomes:Latino Youth Know Poverty

www.cssny.org 17
Incomes and Poverty:Differences Among Latino Youth
Puerto Rican Dominican Mexican Other Latino
Poor 33.4% 29.3% 27.4% 22.2%
Near Poor 22.0% 31.1% 36.7% 26.3%
Moderate Income 28.3% 31.2% 29.2% 33.7%
Higher Income 16.3% 8.4% 6.7% 17.9%
100% 100% 100% 100%

Summary Notes &Policy Considerations
18

www.cssny.org 19
Summary Notes
As the largest group of young people in New York City, Latino youth are a population that deserves policy attention.
While it is important to understand their key commonalities, Latinos are a diverse ethnic group, and we see divergent stories among the major sub-populations.

www.cssny.org 20
Summary Notes Dominican young people, the largest sub-group of
Latino youth, do relatively well in terms of school, work, and poverty when compared with Puerto Ricans and other Latino youth, but poorly when compared with Whites and Asians.
Dominican young people, particularly young women, do show particularly strong outcomes in terms of attending college, a gateway to the middle class.

www.cssny.org 21
Summary Notes Puerto Ricans face the greatest challenges of all youth sub-
groups, despite the fact that they are born here.
Puerto Rican youth have lower rates of school enrollment, educational attainment, and alarmingly higher rates of disconnection and poverty than other native-born Latino youth.
Puerto Rican males have rates of inactivity in school and work that exceed those of black male youth, a population that receives more public policy discussion.

www.cssny.org 22
Summary Notes
Mexican young people are not easily comparable to any other Latino youth group – a largely immigrant population that comes to New York seeking employment.
Despite lower rates of educational attainment than any other group, Mexican youth are able to find work, and these jobs appear to help keep their households from falling below the federal poverty line.
Households in which young Mexicans live largely have near-poverty incomes, which likely lead to vulnerability and many financial hardships.
www.cssny.org 23
Summary Notes
Other Latinos, who are largely comprised of South and Central Americans, show promising tendencies in terms of household incomes.
Despite rates of school enrollment, educational attainment,
and employment that do not stand out as particularly strong, they have some of the lowest rates of household poverty and the highest shares of moderate-income households.
www.cssny.org 24
Summary Notes
Poverty is impacting school and work rates, and/or the reverse is true -- it is possible that these dynamics affect one another, thus snowballing each of these challenges.
Targeting social policy interventions on Latino youth: the challenges Latino young people face in terms of school enrollment and educational attainment will not be solved just with better English Language Learner (ELL) programs; overwhelmingly, Latino young people are strong English speakers.

www.cssny.org 25
Considerations for Policy Native-born Latino youth, Puerto Ricans in particular, are
out of school in high numbers, having attained very low levels of education before they left school, and are having difficulties entering the workforce.
Efforts to address these issues that only focus on school reform are ignorant of the fact that tens of thousands of Latino youth have already been left behind.
The out-of-school youth population needs to be at the center of community development policy.

www.cssny.org 26
Considerations for Policy Due to their low levels of educational attainment, if Latino
youth are to succeed in the workforce they will first need the basic skills that will allow them to obtain and perform in their early job experiences.
Any efforts to prepare the young adult workforce must focus on the development of basic skills – literacy and math. More than ever, adult literacy and GED preparation need
to be at the center of public policy for the large population of out of school youth.