Embed Size (px)
Citation preview

1 SocialCompact| www.socialcompact.org
New York Financial Environment
Prepared by
Social Compact
for
The New York City Department of Consumer Affairs
November, 2009

2 SocialCompact| www.socialcompact.org
Office of Financial Empowerment (OFE)Office of Financial Empowerment (OFE)
To educate, empower, and protect New Yorkers with low incomes.
• Launched by Mayor Bloomberg in December 2006 as the first program under the Center for Economic Opportunity.
• First local government initiative in the nation focused exclusively on anti-poverty and financial empowerment efforts for those with low incomes.

3 SocialCompact| www.socialcompact.org
Research ObjectiveResearch Objective• Quantify the unbanked marketplace in New York City
• Establish baseline for critical indicators of financial behavior and household financial stability
• Inform the development and targeting of financial counseling services, asset-building programs, and financial product initiatives.
MethodsMethods• DCA Commissioned Social Compact and Axciom to complete analytic
estimates of banking patterns
• Draws on public and private data sets, including InfoBase-X data, the largest collection of U.S. consumer data available in one source

4 SocialCompact| www.socialcompact.org
Context

5 SocialCompact| www.socialcompact.org
New York City: Context Map

6 SocialCompact| www.socialcompact.org
New York CityBOROUGH POPULATION HOUSEHOLDS ADULTS HH SIZE
New York City 8,246,310 3,022,151 6,164,931 2.7
Manhattan 1,613,257 735,382 1,284,060 2.1
Bronx 1,369,859 468,735 939,663 2.8
Brooklyn 2,520,835 877,714 1,839,491 2.8
Queens 2,263,858 774,251 1,751,426 2.9
Staten Island 478,501 166,069 350,291 2.8

7 SocialCompact| www.socialcompact.org
Presence & Access Financial Institutions
8 SocialCompact| www.socialcompact.org
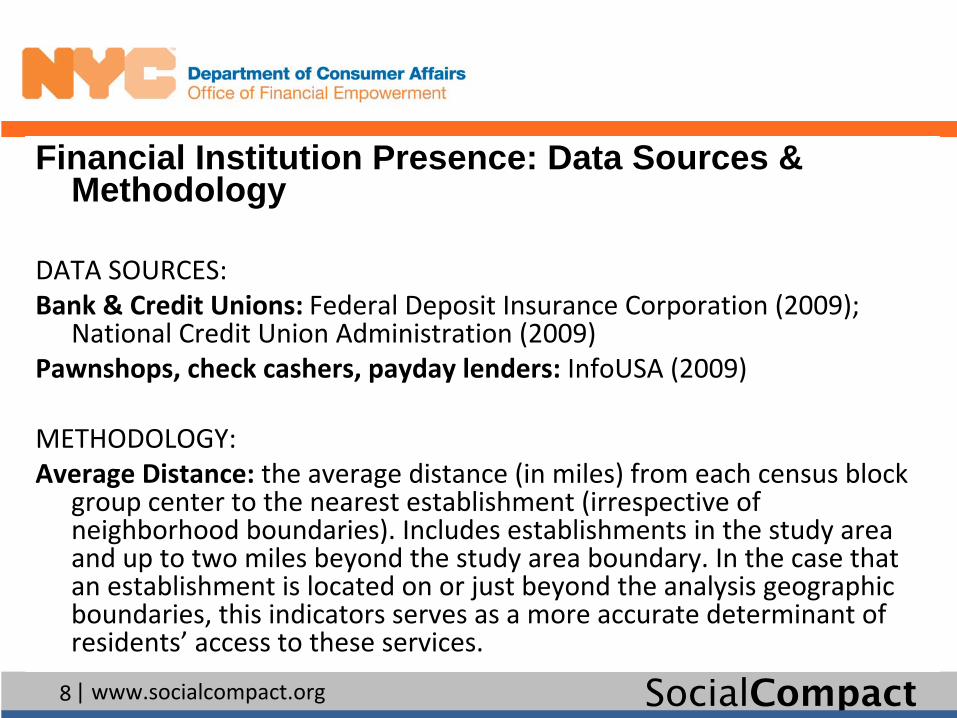
Financial Institution Presence: Data Sources & Methodology
DATA SOURCES: Bank & Credit Unions:
Federal Deposit Insurance Corporation (2009);
National Credit Union Administration (2009)
Pawnshops, check cashers, payday lenders: InfoUSA (2009)
METHODOLOGY: Average Distance: the average distance (in miles) from each census block
group center to the nearest establishment (irrespective of
neighborhood boundaries). Includes establishments in the study area
and up to two miles beyond the study area boundary. In the case that
an establishment is located on or just beyond the analysis geographic
boundaries, this indicators serves as a more accurate determinant of
residents’
access to these services.

9 SocialCompact| www.socialcompact.org
Financial Institution Presence: New York City BOROUGH BANKS CREDIT UNIONS TRADITIONAL
FINANCIAL
INSTITUTIONS
NON
TRADITIONAL
FINANCIAL
INSTITUTIONS
New York City 1,418 153 1571 1,026
Manhattan 604 65 669 302
Bronx 131 9 140 206
Brooklyn 279 41 320 265
Queens 337 36 373 216
Staten Island 67 2 69 37
10 SocialCompact| www.socialcompact.org
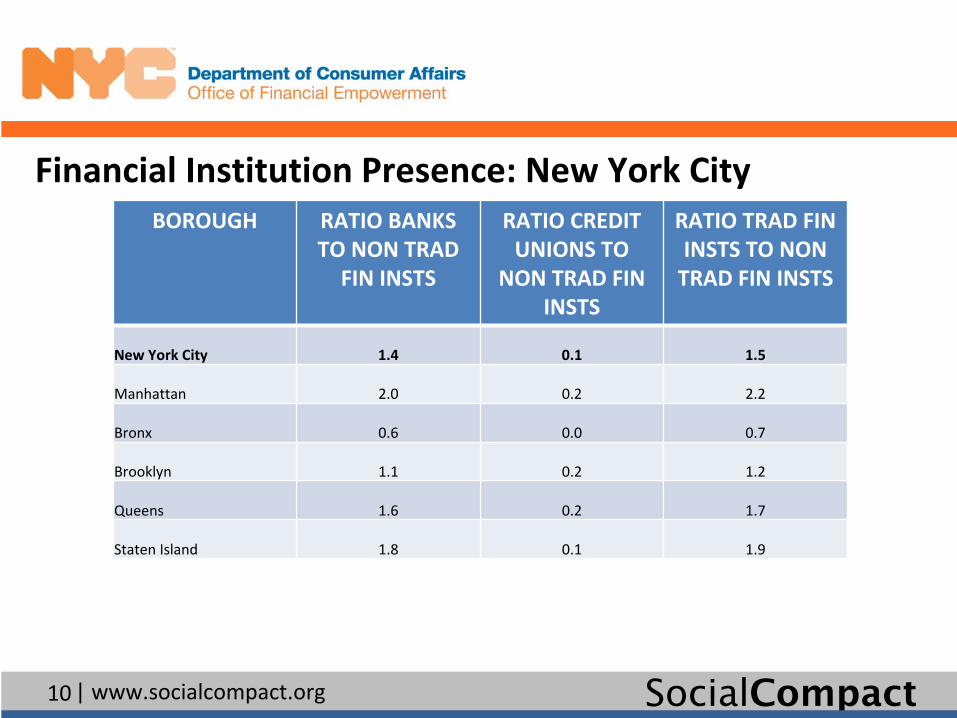
Financial Institution Presence: New York City BOROUGH RATIO BANKS
TO NON TRAD
FIN INSTS
RATIO CREDIT
UNIONS TO
NON TRAD FIN
INSTS
RATIO TRAD FIN
INSTS TO NON
TRAD FIN INSTS
New York City 1.4 0.1 1.5
Manhattan 2.0 0.2 2.2
Bronx 0.6 0.0 0.7
Brooklyn 1.1 0.2 1.2
Queens 1.6 0.2 1.7
Staten Island 1.8 0.1 1.9
11 SocialCompact| www.socialcompact.org
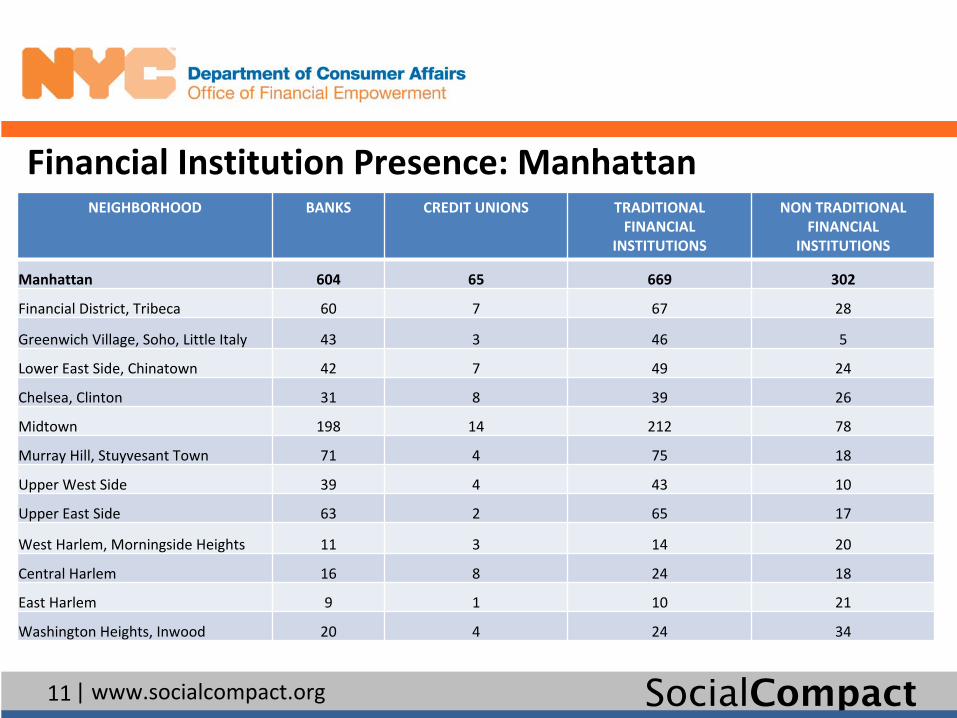
Financial Institution Presence: Manhattan NEIGHBORHOOD BANKS CREDIT UNIONS TRADITIONAL
FINANCIAL
INSTITUTIONS
NON TRADITIONAL
FINANCIAL
INSTITUTIONS
Manhattan 604 65 669 302
Financial District, Tribeca 60 7 67 28
Greenwich Village, Soho, Little Italy 43 3 46 5
Lower East Side, Chinatown 42 7 49 24
Chelsea, Clinton 31 8 39 26
Midtown 198 14 212 78
Murray Hill, Stuyvesant Town 71 4 75 18
Upper West Side 39 4 43 10
Upper East Side 63 2 65 17
West Harlem, Morningside Heights 11 3 14 20
Central Harlem 16 8 24 18
East Harlem 9 1 10 21
Washington Heights, Inwood 20 4 24 34
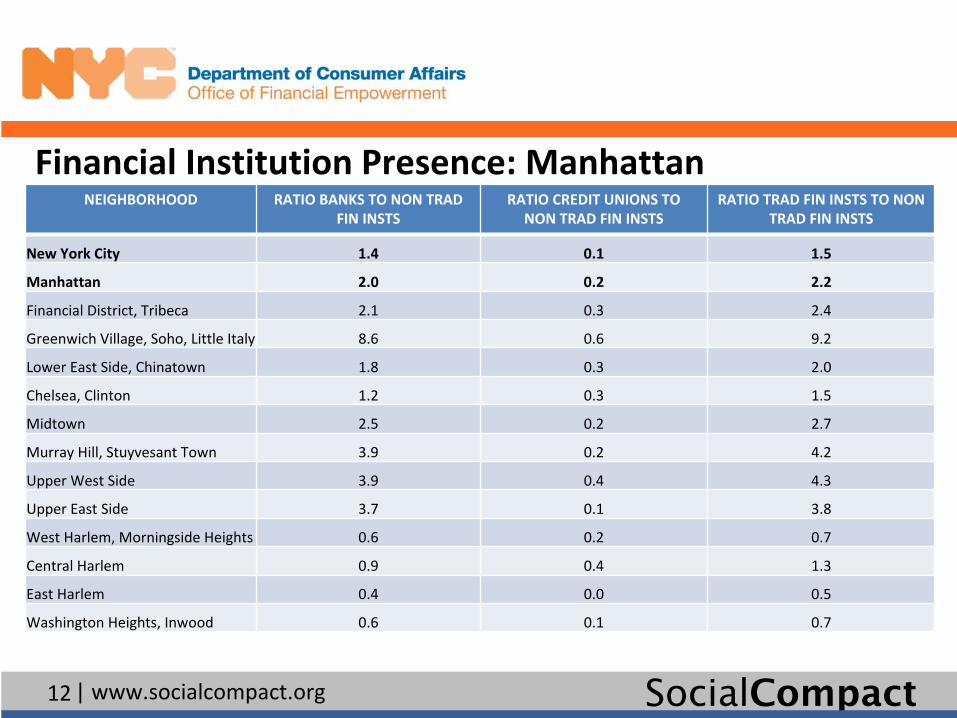
12 SocialCompact| www.socialcompact.org
Financial Institution Presence: Manhattan NEIGHBORHOOD RATIO BANKS TO NON TRAD
FIN INSTSRATIO CREDIT UNIONS TO
NON TRAD FIN INSTSRATIO TRAD FIN INSTS TO NON
TRAD FIN INSTS
New York City 1.4 0.1 1.5
Manhattan 2.0 0.2 2.2
Financial District, Tribeca 2.1 0.3 2.4
Greenwich Village, Soho, Little Italy 8.6 0.6 9.2
Lower East Side, Chinatown 1.8 0.3 2.0
Chelsea, Clinton 1.2 0.3 1.5
Midtown 2.5 0.2 2.7
Murray Hill, Stuyvesant Town 3.9 0.2 4.2
Upper West Side 3.9 0.4 4.3
Upper East Side 3.7 0.1 3.8
West Harlem, Morningside Heights 0.6 0.2 0.7
Central Harlem 0.9 0.4 1.3
East Harlem 0.4 0.0 0.5
Washington Heights, Inwood 0.6 0.1 0.7

13 SocialCompact| www.socialcompact.org
NEIGHBORHOOD BANKS CREDIT UNIONS TRADITIONAL
FINANCIAL
INSTITUTIONS
NON TRADITIONAL
FINANCIAL
INSTITUTIONS
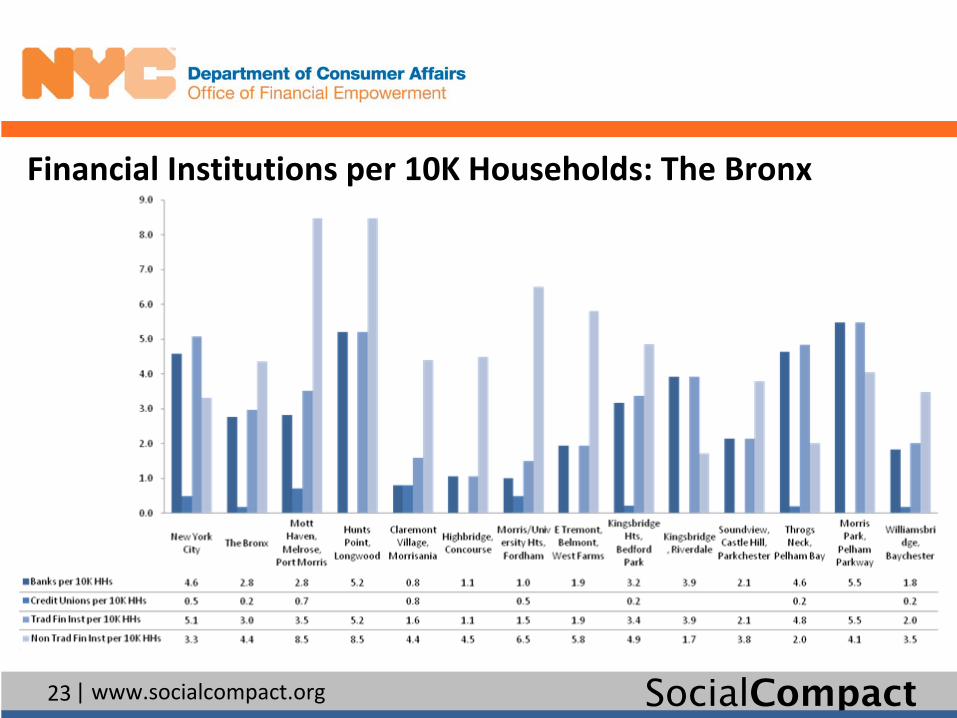
Bronx 131 9 140 206
Mott Haven, Melrose, Port Morris 8 2 10 24
Hunts Point, Longwood 8 0 8 13
Claremont Village, Morrisania 2 2 4 11
Highbridge, Concourse 5 0 5 21
Morris/University Hts, Fordham 4 2 6 26
E Tremont, Belmont, West Farms 5 0 5 15
Kingsbridge Hts, Bedford Park 15 1 16 23
Kingsbridge, Riverdale 16 0 16 7
Soundview, Castle Hill, Parkchester 13 0 13 23
Throgs Neck, Pelham Bay 23 1 24 10
Morris Park, Pelham Parkway 23 0 23 17
Williamsbridge, Baychester 10 1 11 19
Financial Institution Presence: Bronx

14 SocialCompact| www.socialcompact.org
Financial Institution Presence: BronxNEIGHBORHOOD RATIO BANKS TO NON TRAD
FIN INSTSRATIO CREDIT UNIONS TO
NON TRAD FIN INSTSRATIO TRAD FIN INSTS TO NON
TRAD FIN INSTS
New York City 1.4 0.1 1.5
Bronx 0.6 0.0 0.7
Mott Haven, Melrose, Port Morris 0.3 0.1 0.4
Hunts Point, Longwood 0.6 0.0 0.6
Claremont Village, Morrisania 0.2 0.2 0.4
Highbridge, Concourse 0.2 0.0 0.2
Morris/University Hts, Fordham 0.2 0.1 0.2
E Tremont, Belmont, West Farms 0.3 0.0 0.3
Kingsbridge Hts, Bedford Park 0.7 0.0 0.7
Kingsbridge, Riverdale 2.3 0.0 2.3
Soundview, Castle Hill, Parkchester 0.6 0.0 0.6
Throgs Neck, Pelham Bay 2.3 0.1 2.4
Morris Park, Pelham Parkway 1.4 0.0 1.4
Williamsbridge, Baychester 0.5 0.1 0.6

15 SocialCompact| www.socialcompact.org
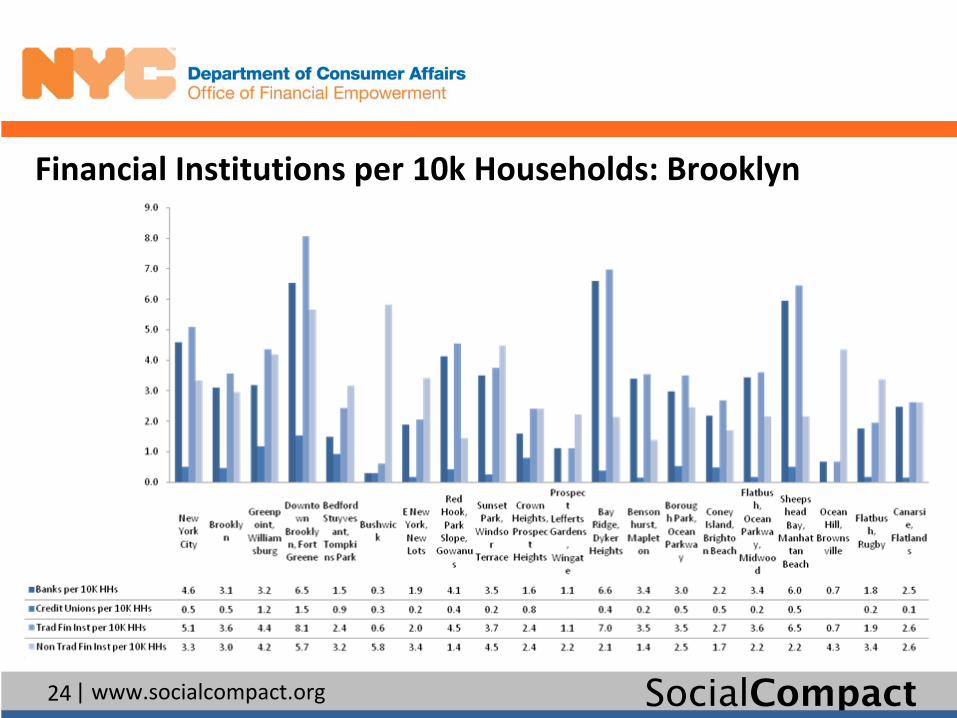
Financial Institution Presence: Brooklyn NEIGHBORHOOD BANKS CREDIT UNIONS TRADITIONAL FINANCIAL
INSTITUTIONSNON TRADITIONAL
FINANCIAL INSTITUTIONS
Brooklyn 279 41 320 265Greenpoint, Williamsburg 19 7 26 25
Downtown Brooklyn, Fort Greene 30 7 37 26
Bedford Stuyvesant, Tompkins Park 8 5 13 17
Bushwick 1 1 2 19
E New York, New Lots 11 1 12 20
Red Hook, Park Slope, Gowanus 20 2 22 7Sunset Park, Windsor Terrace 14 1 15 18
Crown Heights, Prospect Heights 6 3 9 9
Prospect Lefferts Gardens, Wingate 4 4 8
Bay Ridge, Dyker Heights 34 2 36 11
Bensonhurst, Mapleton 22 1 23 9
Borough Park, Ocean Parkway 17 3 20 14
Coney Island, Brighton Beach 9 2 11 7Flatbush, Ocean Parkway, Midwood 19 1 20 12Sheepshead Bay, Manhattan Beach 36 3 39 13Ocean Hill, Brownsville 2 2 13Flatbush, Rugby 10 1 11 19Canarsie, Flatlands 17 1 18 18

16 SocialCompact| www.socialcompact.org
Financial Institution Presence: Brooklyn NEIGHBORHOOD RATIO BANKS TO NON
TRAD FIN INSTSRATIO CREDIT UNIONS TO
NON TRAD FIN INSTSRATIO TRAD FIN INSTS TO NON
TRAD FIN INSTS
New York City 1.4 0.1 1.5Brooklyn 1.1 0.2 1.2Greenpoint, Williamsburg 0.8 0.3 1.0Downtown Brooklyn, Fort Greene 1.2 0.3 1.4Bedford Stuyvesant, Tompkins Park 0.5 0.3 0.8Bushwick 0.1 0.1 0.1E New York, New Lots 0.6 0.1 0.6Red Hook, Park Slope, Gowanus 2.9 0.3 3.1Sunset Park, Windsor Terrace 0.8 0.1 0.8Crown Heights, Prospect Heights 0.7 0.3 1.0Prospect Lefferts Gardens, Wingate 0.5 0.0 0.5Bay Ridge, Dyker Heights 3.1 0.2 3.3Bensonhurst, Mapleton 2.4 0.1 2.6Borough Park, Ocean Parkway 1.2 0.2 1.4Coney Island, Brighton Beach 1.3 0.3 1.6Flatbush, Ocean Parkway, Midwood 1.6 0.1 1.7Sheepshead Bay, Manhattan Beach 2.8 0.2 3.0Ocean Hill, Brownsville 0.2 0.0 0.2Flatbush, Rugby 0.5 0.1 0.6Canarsie, Flatlands 0.9 0.1 1.0

17 SocialCompact| www.socialcompact.org
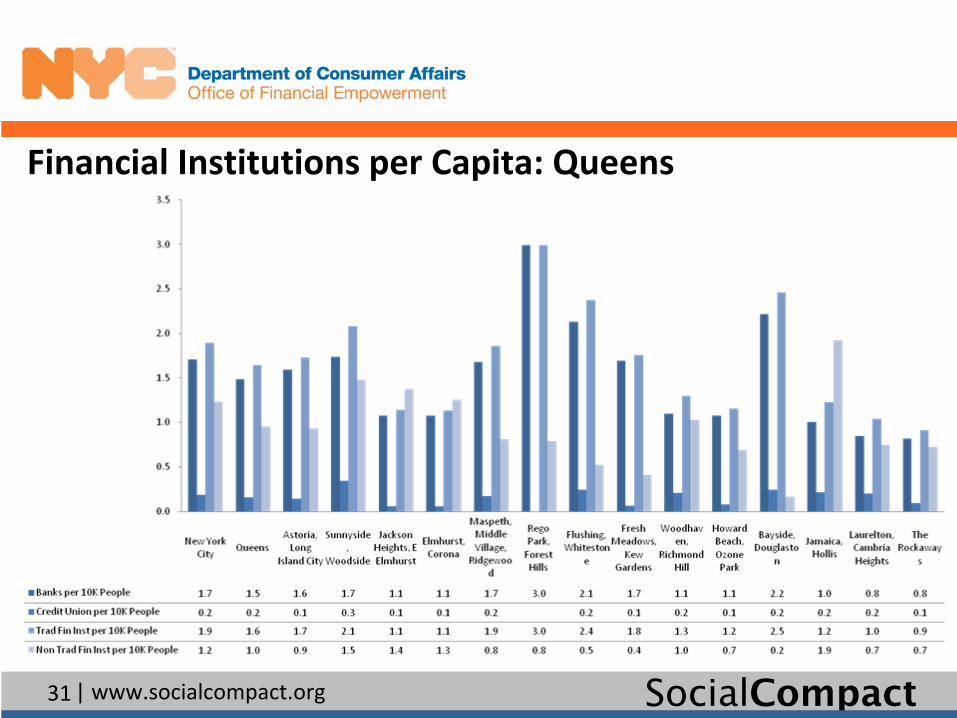
Financial Institution Presence: Queens NEIGHBORHOOD BANKS CREDIT UNIONS TRADITIONAL
FINANCIAL
INSTITUTIONS
NON TRADITIONAL
FINANCIAL
INSTITUTIONS
Queens 337 36 373 216
Astoria, Long Island City 34 3 37 20
Sunnyside, Woodside 20 4 24 17
Jackson Heights, E Elmhurst 18 1 19 23
Elmhurst, Corona 18 1 19 21
Maspeth, Middle Village, Ridgewood 29 3 32 14
Rego Park, Forest Hills 34 0 34 9
Flushing, Whitestone 53 6 59 13
Fresh Meadows, Kew Gardens 25 1 26 6
Woodhaven, Richmond Hill 16 3 19 15
Howard Beach, Ozone Park 14 1 15 9
Bayside, Douglaston 27 3 30 2
Jamaica, Hollis 23 5 28 44
Laurelton, Cambria Heights 17 4 21 15
The Rockaways 9 1 10 8

18 SocialCompact| www.socialcompact.org
Financial Institution Presence: Queens NEIGHBORHOOD RATIO BANKS TO NON
TRAD FIN INSTSRATIO CREDIT UNIONS TO
NON TRAD FIN INSTSRATIO TRAD FIN INSTS TO
NON TRAD FIN INSTS
New York City 1.4 0.1 1.5
Queens 1.6 0.2 1.7
Astoria, Long Island City 1.7 0.2 1.9
Sunnyside, Woodside 1.2 0.2 1.4
Jackson Heights, E Elmhurst 0.8 0.0 0.8
Elmhurst, Corona 0.9 0.0 0.9
Maspeth, Middle Village, Ridgewood 2.1 0.2 2.3
Rego Park, Forest Hills 3.8 0.0 3.8
Flushing, Whitestone 4.1 0.5 4.5
Fresh Meadows, Kew Gardens 4.2 0.2 4.3
Woodhaven, Richmond Hill 1.1 0.2 1.3
Howard Beach, Ozone Park 1.6 0.1 1.7
Bayside, Douglaston 13.5 1.5 15.0
Jamaica, Hollis 0.5 0.1 0.6
Laurelton, Cambria Heights 1.1 0.3 1.4
The Rockaways 1.1 0.1 1.3
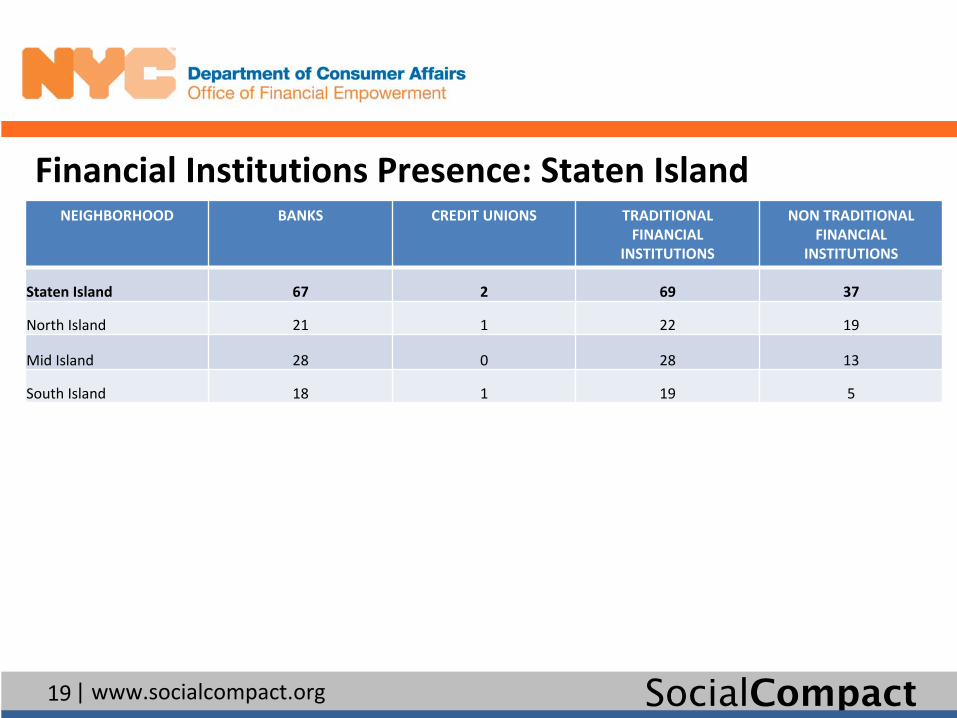
19 SocialCompact| www.socialcompact.org
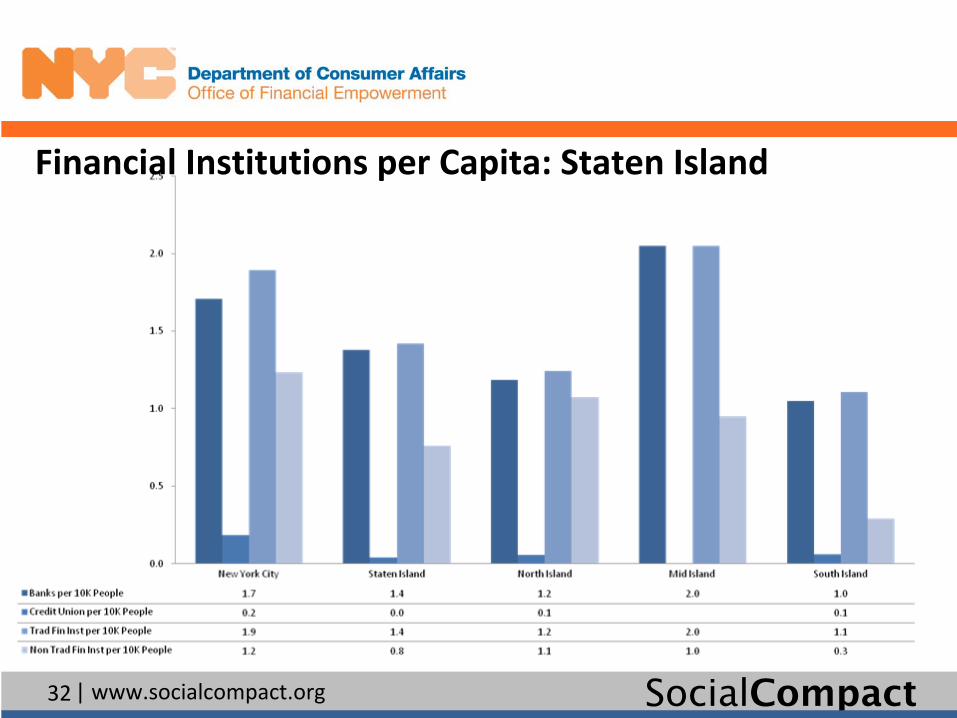
Financial Institutions Presence: Staten Island NEIGHBORHOOD BANKS CREDIT UNIONS TRADITIONAL
FINANCIAL
INSTITUTIONS
NON TRADITIONAL
FINANCIAL
INSTITUTIONS
Staten Island 67 2 69 37
North Island 21 1 22 19
Mid Island 28 0 28 13
South Island 18 1 19 5

20 SocialCompact| www.socialcompact.org
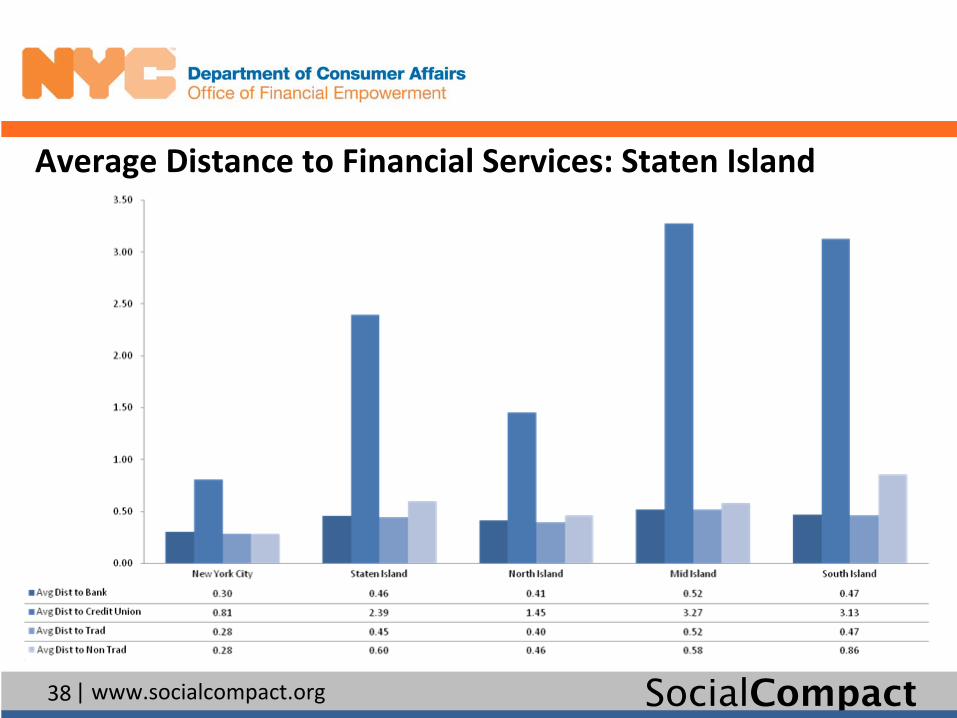
Financial Institution Presence: Staten Island NEIGHBORHOOD RATIO BANKS TO NON TRAD
FIN INSTSRATIO CREDIT UNIONS TO
NON TRAD FIN INSTSRATIO TRAD FIN INSTS TO NON
TRAD FIN INSTS
New York City 1.4 0.1 1.5
Staten Island 1.8 0.1 1.9
North Island 1.1 0.1 1.2
Mid Island 2.2 0.0 2.2
South Island 3.6 0.2 3.8
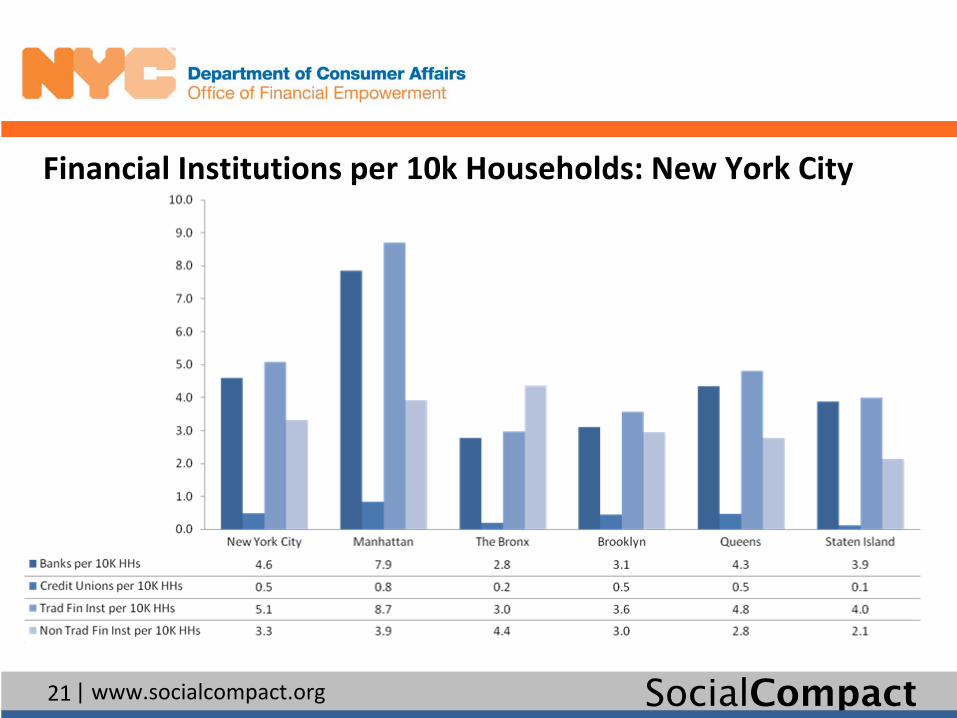
21 SocialCompact| www.socialcompact.org
Financial Institutions per 10k Households: New York City
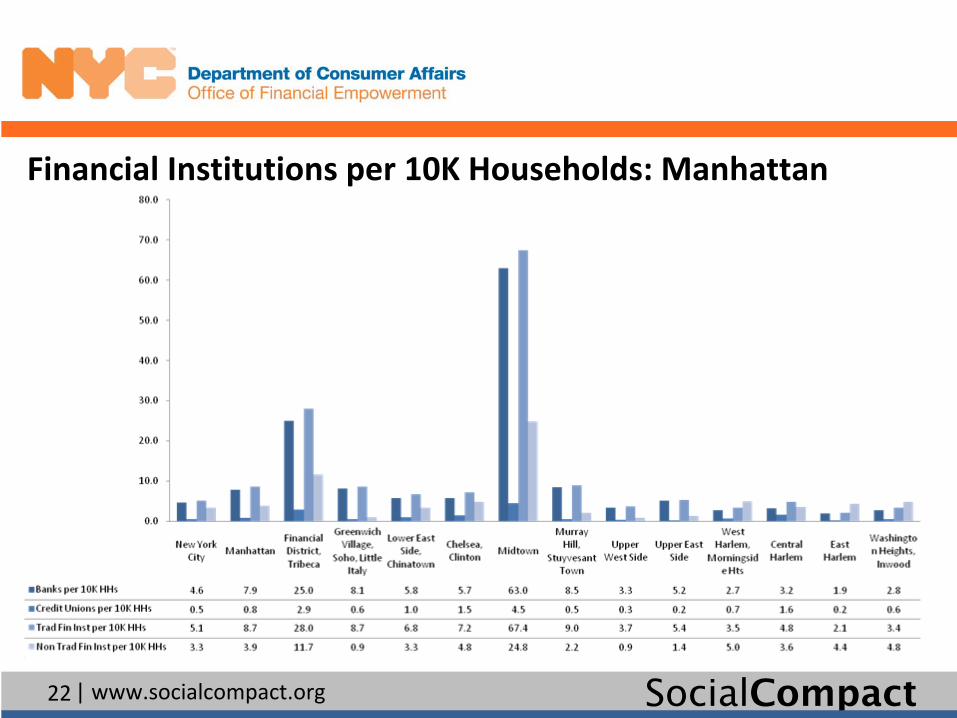
22 SocialCompact| www.socialcompact.org
Financial Institutions per 10K Households: Manhattan
23 SocialCompact| www.socialcompact.org
Financial Institutions per 10K Households: The Bronx
24 SocialCompact| www.socialcompact.org
Financial Institutions per 10k Households: Brooklyn

25 SocialCompact| www.socialcompact.org
Financial Institutions per 10K Households: Queens

26 SocialCompact| www.socialcompact.org
Financial Institutions per 10K Households: Staten Island

27 SocialCompact| www.socialcompact.org
Financial Institutions per Capita: New York City

28 SocialCompact| www.socialcompact.org
Financial Institutions per Capita: Manhattan

29 SocialCompact| www.socialcompact.org
Financial Institutions per Capita: The Bronx

30 SocialCompact| www.socialcompact.org
Financial Institutions per Capita: Brooklyn
31 SocialCompact| www.socialcompact.org
Financial Institutions per Capita: Queens
32 SocialCompact| www.socialcompact.org
Financial Institutions per Capita: Staten Island

33 SocialCompact| www.socialcompact.org
Average Distance to Financial Services: New York City

34 SocialCompact| www.socialcompact.org
Average Distance to Financial Services: Manhattan

35 SocialCompact| www.socialcompact.org
Average Distance to Financial Services: The Bronx

36 SocialCompact| www.socialcompact.org
Average Distance to Financial Services: Brooklyn

37 SocialCompact| www.socialcompact.org
Average Distance to Financial Services: Queens
38 SocialCompact| www.socialcompact.org
Average Distance to Financial Services: Staten Island

39 SocialCompact| www.socialcompact.org
Unbanked
40 SocialCompact| www.socialcompact.org
Data Sources and MethodologyDATA SOURCE: Acxiom (February 2009). Estimates based on data from the Federal
Reserve Board's Survey of Consumer Finances; U.S. Census Bureau
American Community Survey; and Medium Research Incorporated Survey
METHODOLOGY:The unbanked indicator is derived from a predictive model that uses
household data (including home equity, debt ratios, income,
homeownership, home values), living location, household behavior
(psychographic), demographics, and warranty registration data to
evaluate
households’
banking relationships and provides a score that ranges from 1
to 20. Households scoring 1 are described as “unbanked”
meaning they
have no evidence of any relationship with traditional financial institutions.

41 SocialCompact| www.socialcompact.org
Percent Unbanked Households: New York City
42 SocialCompact| www.socialcompact.org
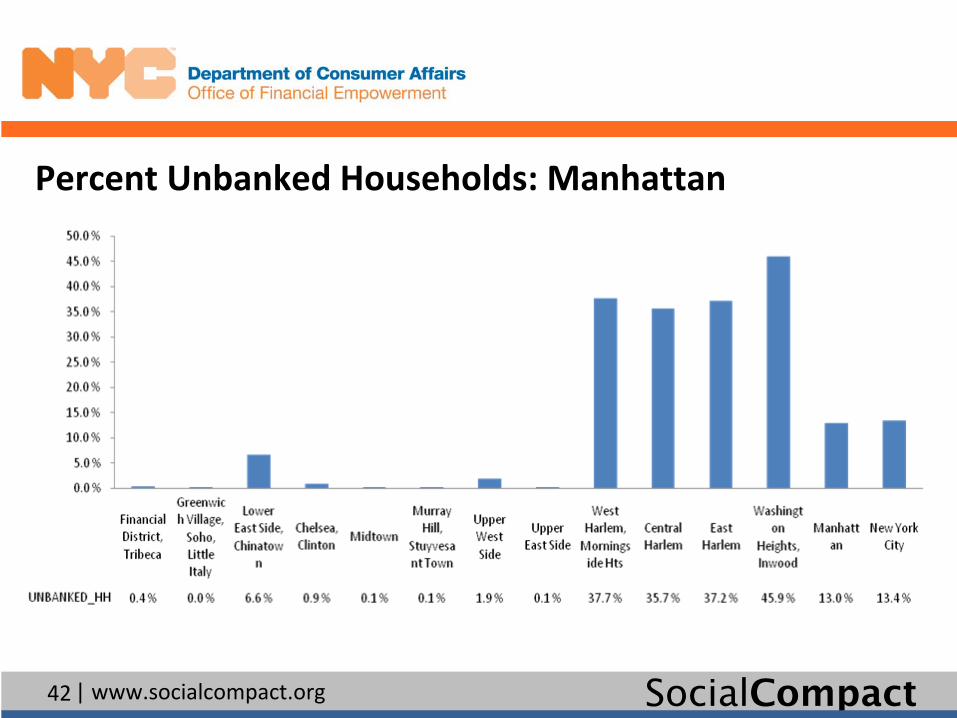
Percent Unbanked Households: Manhattan
43 SocialCompact| www.socialcompact.org
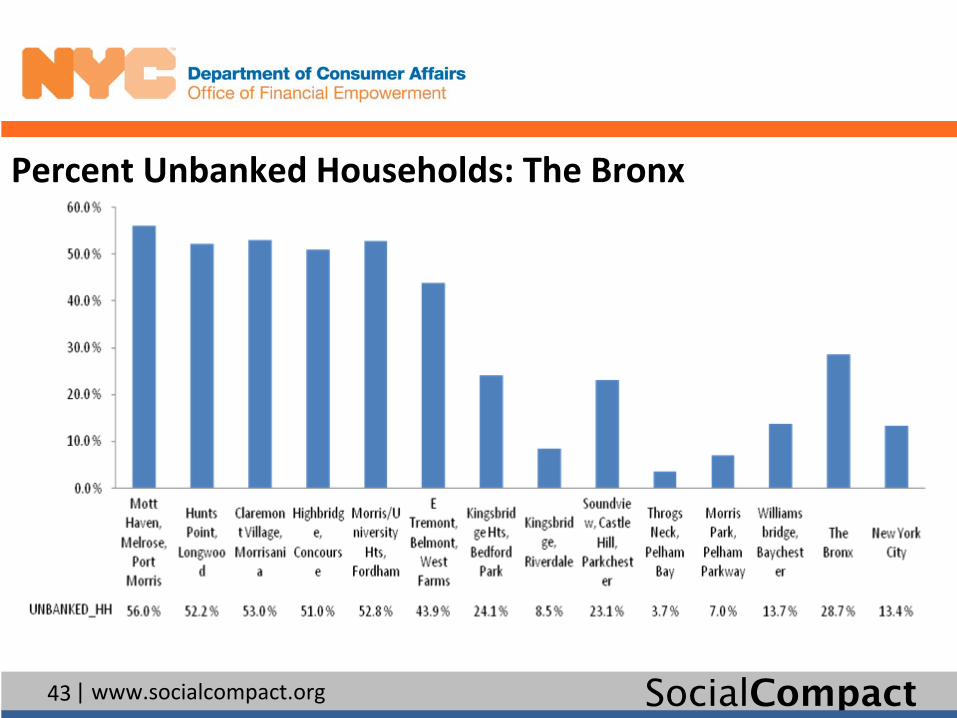
Percent Unbanked Households: The Bronx

44 SocialCompact| www.socialcompact.org
Percent Unbanked Households: Brooklyn

45 SocialCompact| www.socialcompact.org
Percent Unbanked Households: Queens

46 SocialCompact| www.socialcompact.org
Percent Unbanked Households: Staten Island

47 SocialCompact| www.socialcompact.org
Unbanked Households: New York City

48 SocialCompact| www.socialcompact.org
Unbanked Households: Manhattan
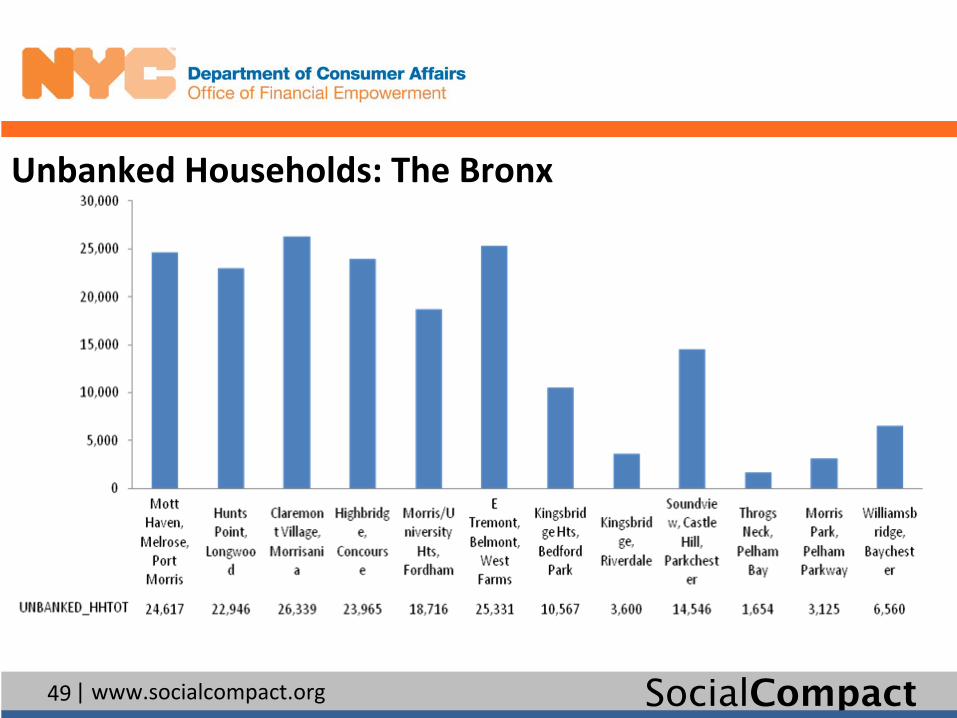
49 SocialCompact| www.socialcompact.org
Unbanked Households: The Bronx

50 SocialCompact| www.socialcompact.org
Unbanked Households: Brooklyn

51 SocialCompact| www.socialcompact.org
Unbanked Households: Queens

52 SocialCompact| www.socialcompact.org
Unbanked Households: Staten Island
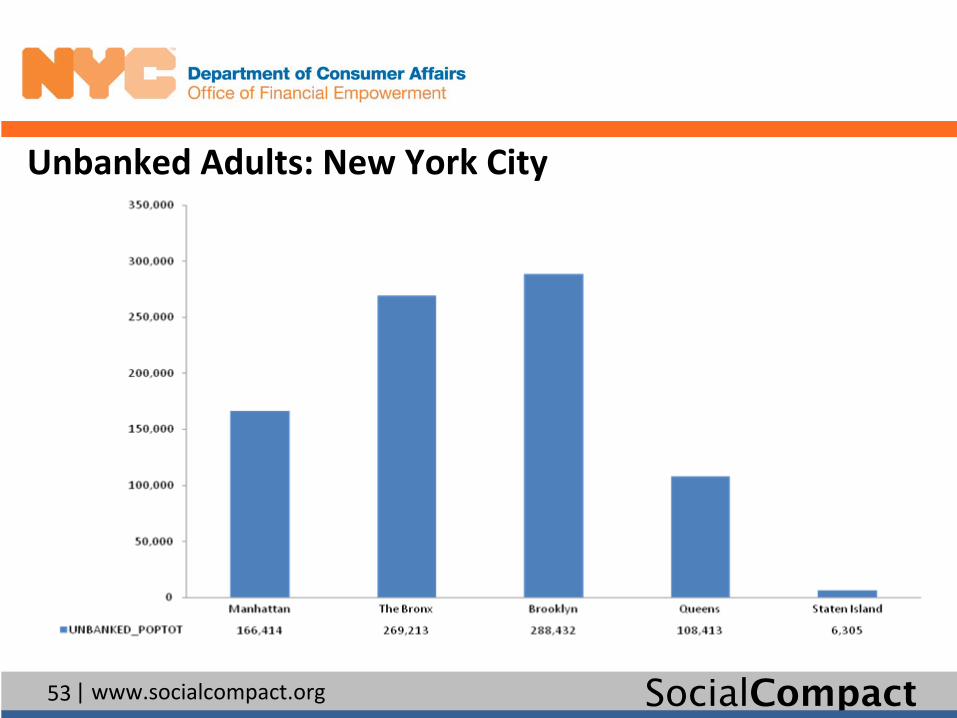
53 SocialCompact| www.socialcompact.org
Unbanked Adults: New York City
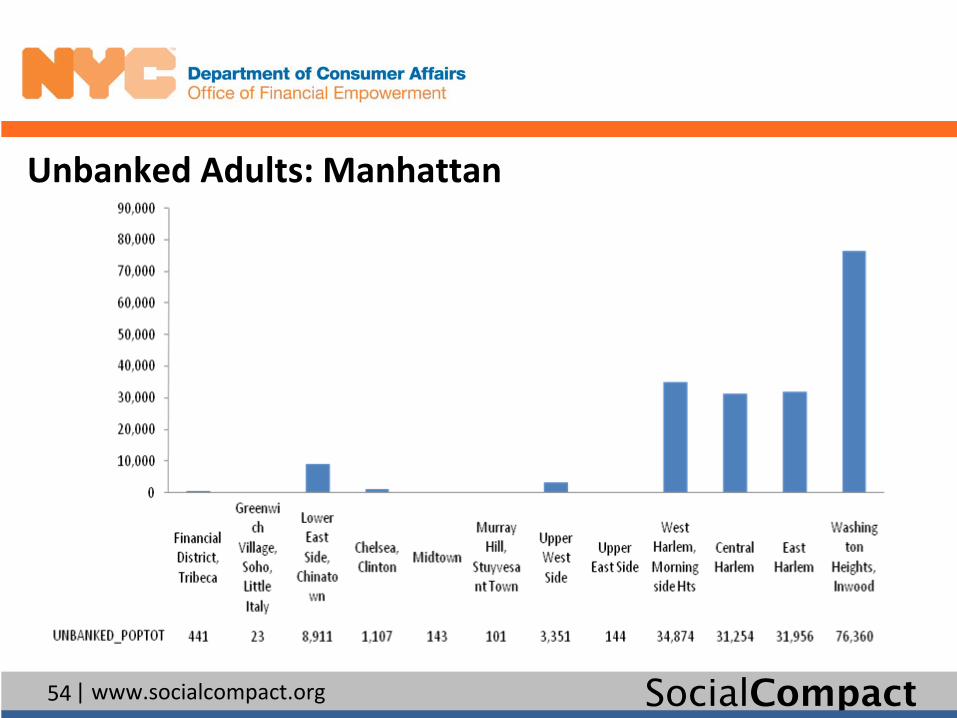
54 SocialCompact| www.socialcompact.org
Unbanked Adults: Manhattan
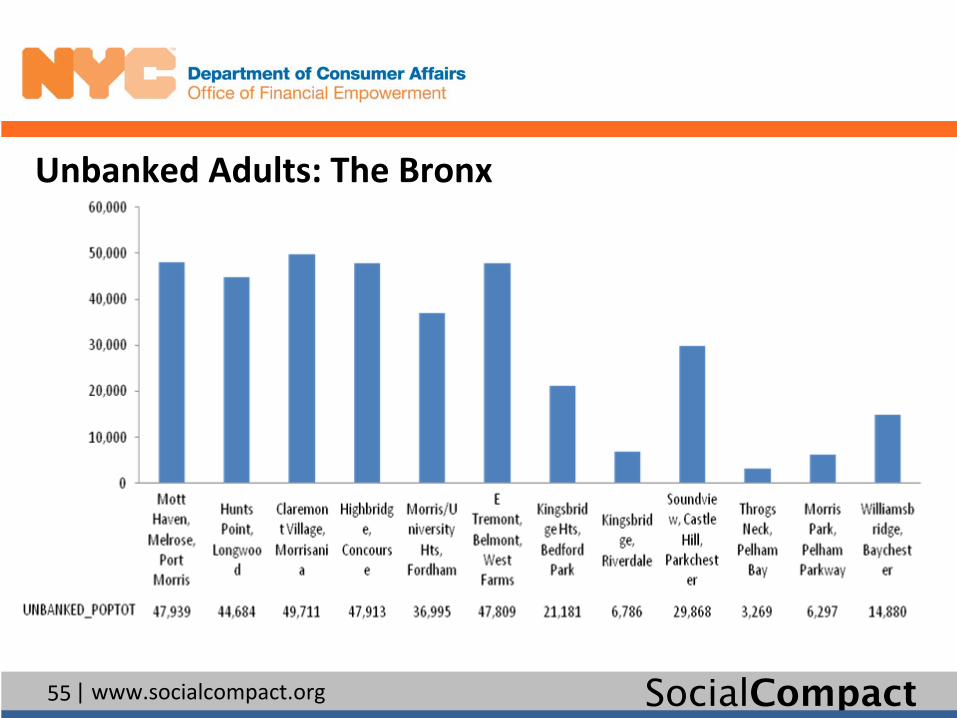
55 SocialCompact| www.socialcompact.org
Unbanked Adults: The Bronx

56 SocialCompact| www.socialcompact.org
Unbanked Adults: Brooklyn
57 SocialCompact| www.socialcompact.org
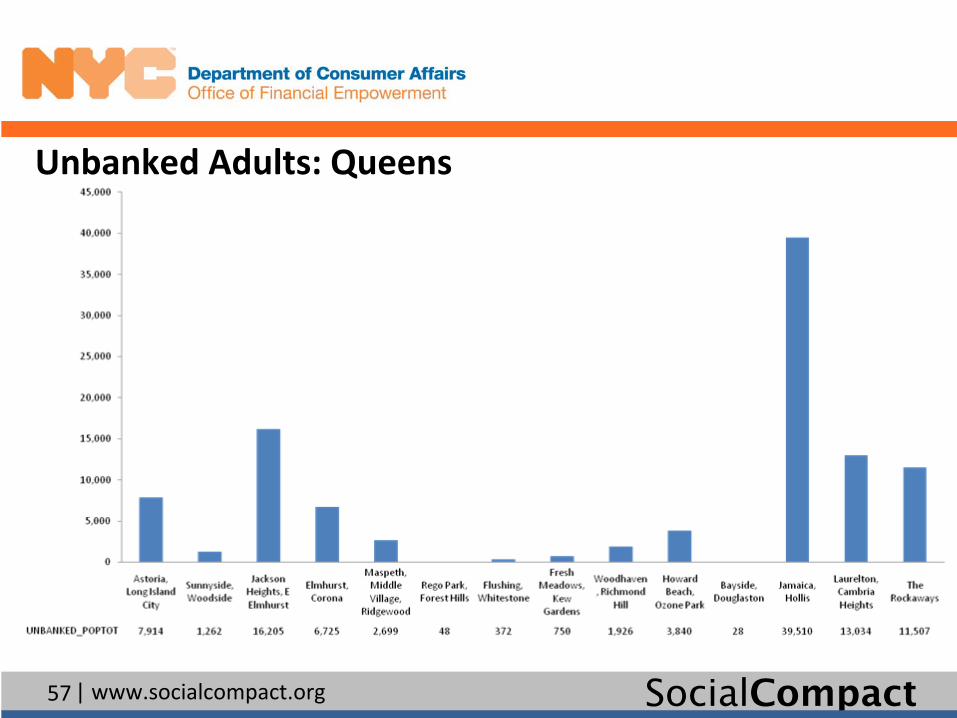
Unbanked Adults: Queens

58 SocialCompact| www.socialcompact.org
Unbanked Adults: Staten Island

59 SocialCompact| www.socialcompact.org
For more information, contact:
Department of Consumer Affairs42 Broadway, 8th Floor New York, NY 10004
www.nyc.gov/ofe