Embed Size (px)
Citation preview
New York City Natural Hazard Mitigation Plan March 2009
Section III: Natural Hazard Risk Assessment Page 12 of 179
3) New York City’s Hazard Environment With more than 8.2 million people, New York City is the most populous city in the United States and ranks among the largest urban areas in the world. It is also one of the most densely populated cities in the United States with an area of just 305 square miles. For more than a century, New York City has been a global center for commerce, finance, politics, foreign affairs, media, and the arts. Many of the City’s neighborhoods and landmarks are known around the world. To accommodate its dense population and maintain its international prominence, New York City has developed a complex and interconnected network of transportation and infrastructure systems. However, New York City’s defining characteristics – its dense population, international stature, and complex infrastructure – also increase the potential significance of hazards, making it more susceptible to their effects than many other cities.
a) The Natural Environment New York City’s geographic location, climate, and topography have influenced its growth and prominence in the United States. However, the City’s natural features also increase its vulnerability to certain natural hazards.
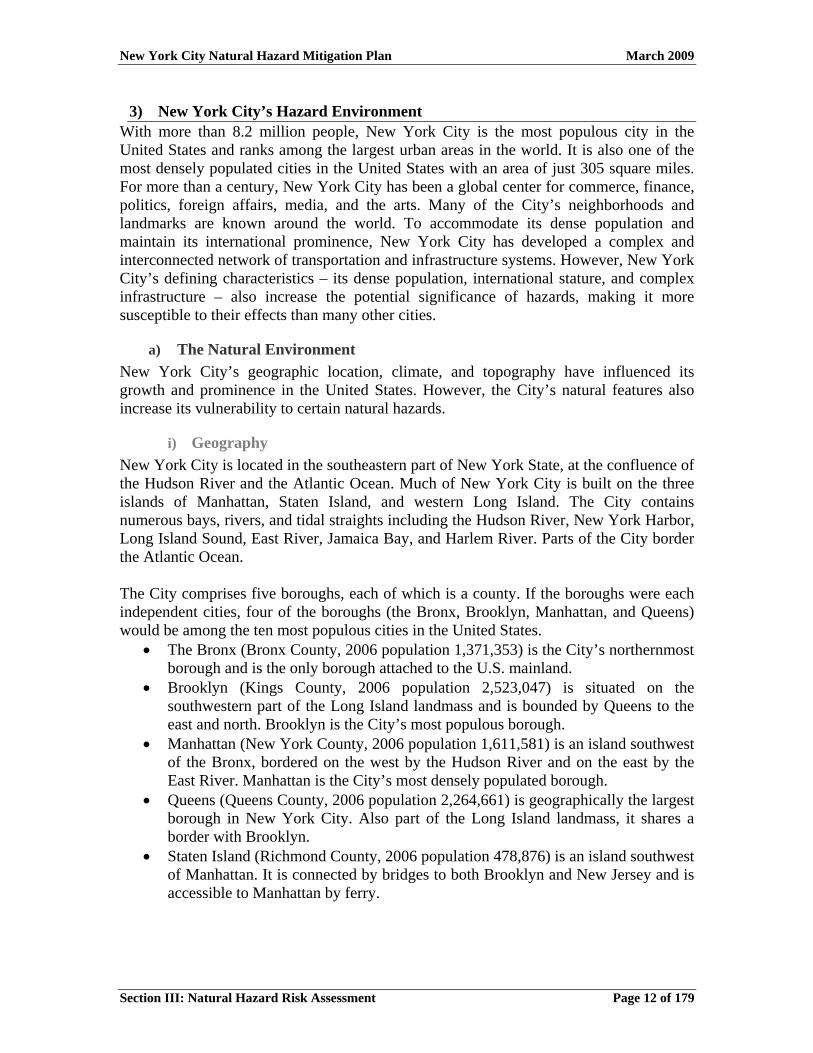
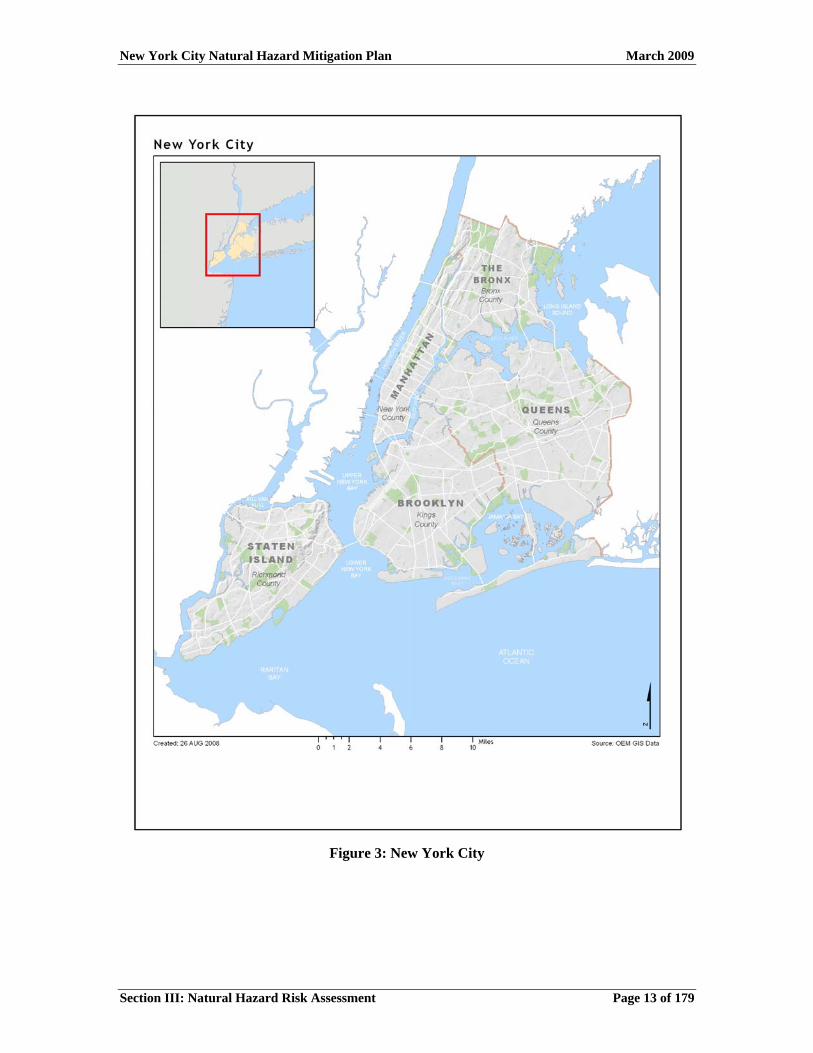
i) Geography New York City is located in the southeastern part of New York State, at the confluence of the Hudson River and the Atlantic Ocean. Much of New York City is built on the three islands of Manhattan, Staten Island, and western Long Island. The City contains numerous bays, rivers, and tidal straights including the Hudson River, New York Harbor, Long Island Sound, East River, Jamaica Bay, and Harlem River. Parts of the City border the Atlantic Ocean. The City comprises five boroughs, each of which is a county. If the boroughs were each independent cities, four of the boroughs (the Bronx, Brooklyn, Manhattan, and Queens) would be among the ten most populous cities in the United States.
• The Bronx (Bronx County, 2006 population 1,371,353) is the City’s northernmost borough and is the only borough attached to the U.S. mainland.
• Brooklyn (Kings County, 2006 population 2,523,047) is situated on the southwestern part of the Long Island landmass and is bounded by Queens to the east and north. Brooklyn is the City’s most populous borough.
• Manhattan (New York County, 2006 population 1,611,581) is an island southwest of the Bronx, bordered on the west by the Hudson River and on the east by the East River. Manhattan is the City’s most densely populated borough.
• Queens (Queens County, 2006 population 2,264,661) is geographically the largest borough in New York City. Also part of the Long Island landmass, it shares a border with Brooklyn.
• Staten Island (Richmond County, 2006 population 478,876) is an island southwest of Manhattan. It is connected by bridges to both Brooklyn and New Jersey and is accessible to Manhattan by ferry.
New York City Natural Hazard Mitigation Plan March 2009
Figure 3: New York City
Section III: Natural Hazard Risk Assessment Page 13 of 179
New York City Natural Hazard Mitigation Plan March 2009
Section III: Natural Hazard Risk Assessment Page 14 of 179
ii) Climate New York City has a humid, continental climate with cold winters and hot, moist summers. The temperature has ranged from -15° F on February 9, 1934 to 106° F on July 9, 1936. The average annual temperature is 55° F. January’s average temperature is 32° F, and July’s is 77° F. The City’s average annual precipitation, which is spread throughout the year, is 47 inches. Its average annual snowfall is 22 inches.
The New York City region encounters most storms and fronts from the west as they move across the North American continent. The result is hotter summers and colder winters than most continental coastal areas that share similar latitudes. The frequent weather systems passing through the region diminish warm and cold periods.
The ocean affects New York City’s climate to a lesser degree. Wind coming off the sea often moderates afternoon heat, though less so inland because of the concentration of buildings and pavement and the resulting urban heat island effect. In winter, the relative warmth of the ocean compared to the land keeps the central City slightly warmer than inland suburbs. Additionally, the lag in water temperature delays winter snows and keeps spring temperatures cooler, longer.
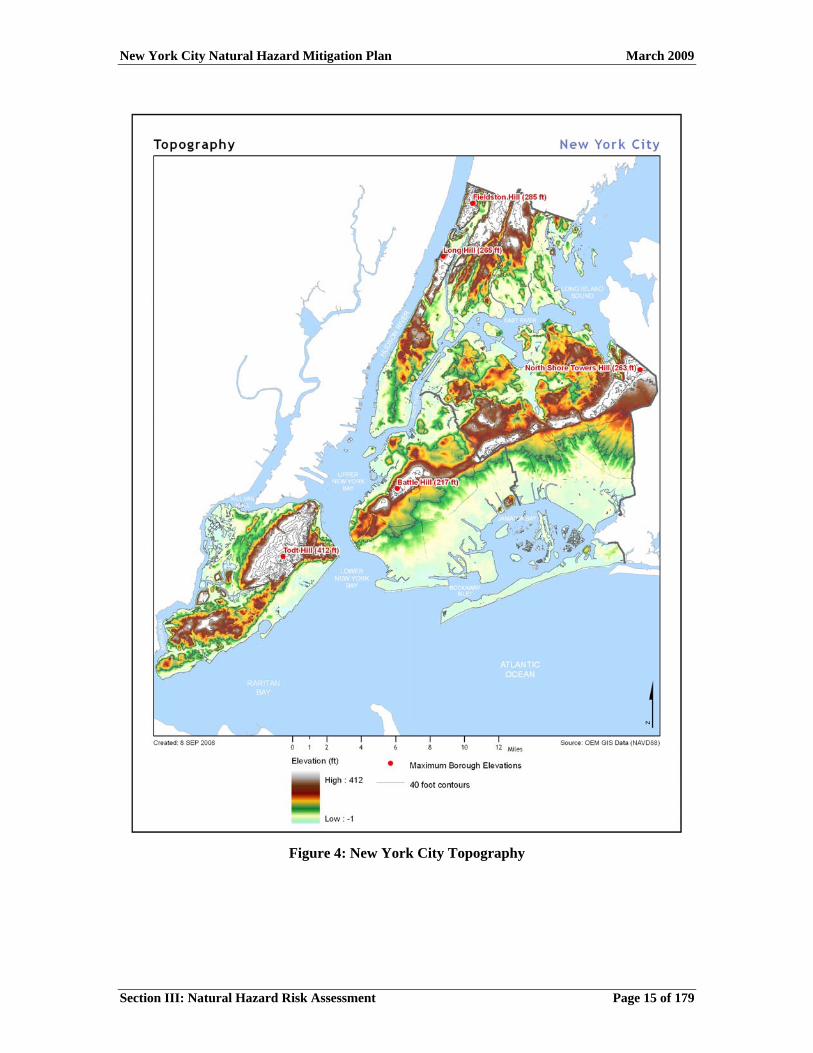
iii) Topography Elevation ranges from less than 50 feet for most of Manhattan, Brooklyn, and Queens to nearly 300 feet in northern Manhattan and the Bronx. The highest point in New York City is Todt Hill on Staten Island at 412 feet above sea level. Figure 4 shows New York City’s topography and the highest point for each borough. Human intervention and land reclamation along the waterfronts has altered the City’s land considerably. Reclamation is most notable in Lower Manhattan, with developments such as Battery Park City built entirely on fill. Human intervention has also evened out some of the natural variations in topography, particularly in Manhattan.
New York City Natural Hazard Mitigation Plan March 2009
Figure 4: New York City Topography
Section III: Natural Hazard Risk Assessment Page 15 of 179
New York City Natural Hazard Mitigation Plan March 2009
Section III: Natural Hazard Risk Assessment Page 16 of 179
b) The Social Environment New York City’s social environment – its history, demographics, and economy – influences how New Yorkers plan for and respond to disasters.
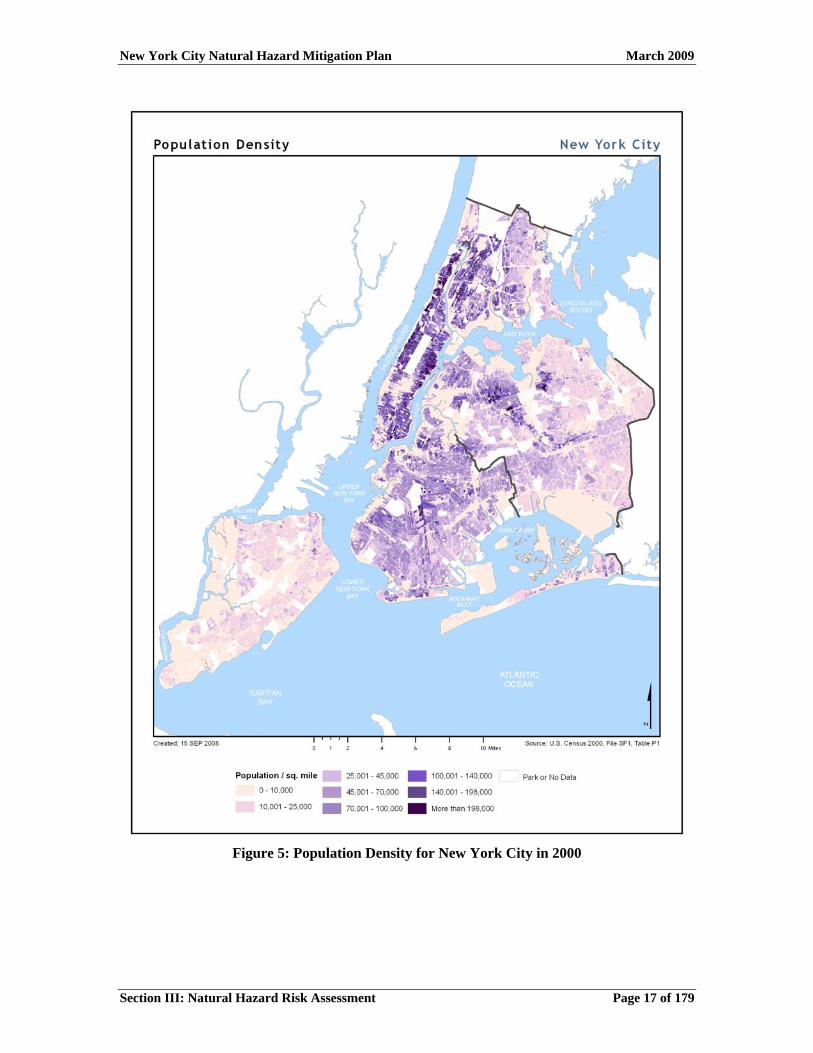
i) Demographics Population Density: 8.2 million people live in the 305 square miles of New York City. Manhattan is the most densely populated borough with more than 67,000 people per square mile. Staten Island is the least densely populated borough with approximately 4,000 people per square mile.
New York City Natural Hazard Mitigation Plan March 2009
Figure 5: Population Density for New York City in 2000
Section III: Natural Hazard Risk Assessment Page 17 of 179
New York City Natural Hazard Mitigation Plan March 2009
Section III: Natural Hazard Risk Assessment Page 18 of 179
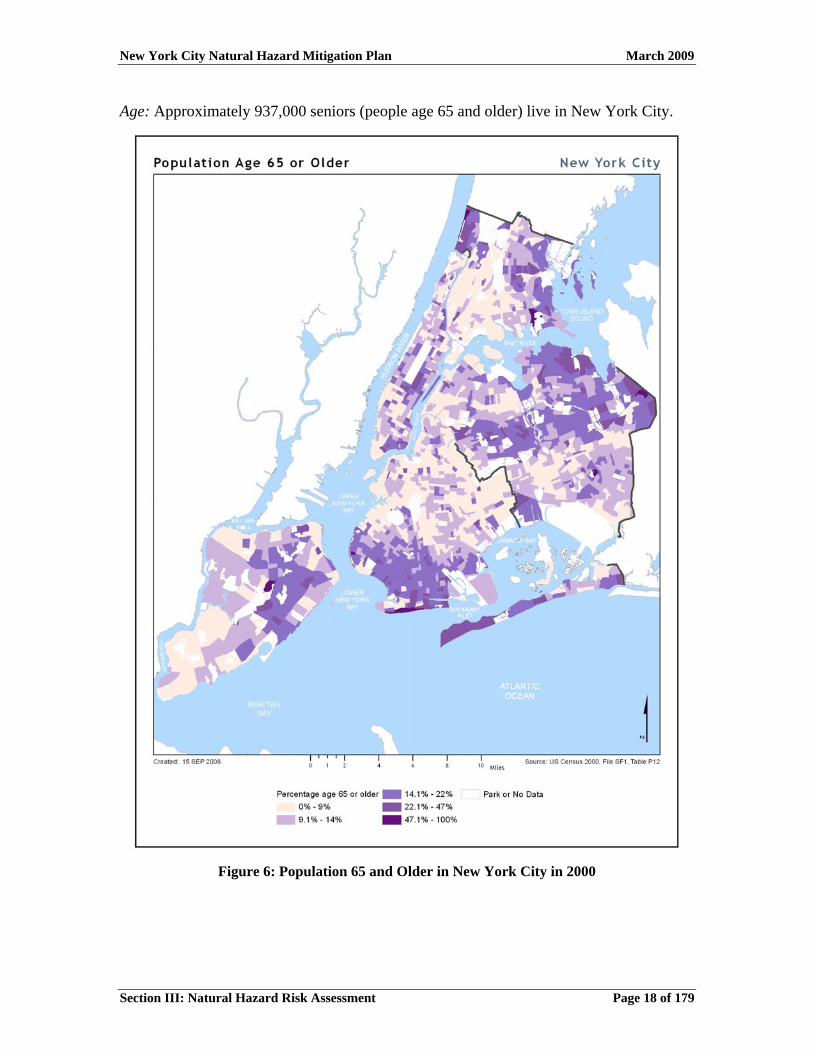
Age: Approximately 937,000 seniors (people age 65 and older) live in New York City.
Figure 6: Population 65 and Older in New York City in 2000
New York City Natural Hazard Mitigation Plan March 2009
Section III: Natural Hazard Risk Assessment Page 19 of 179
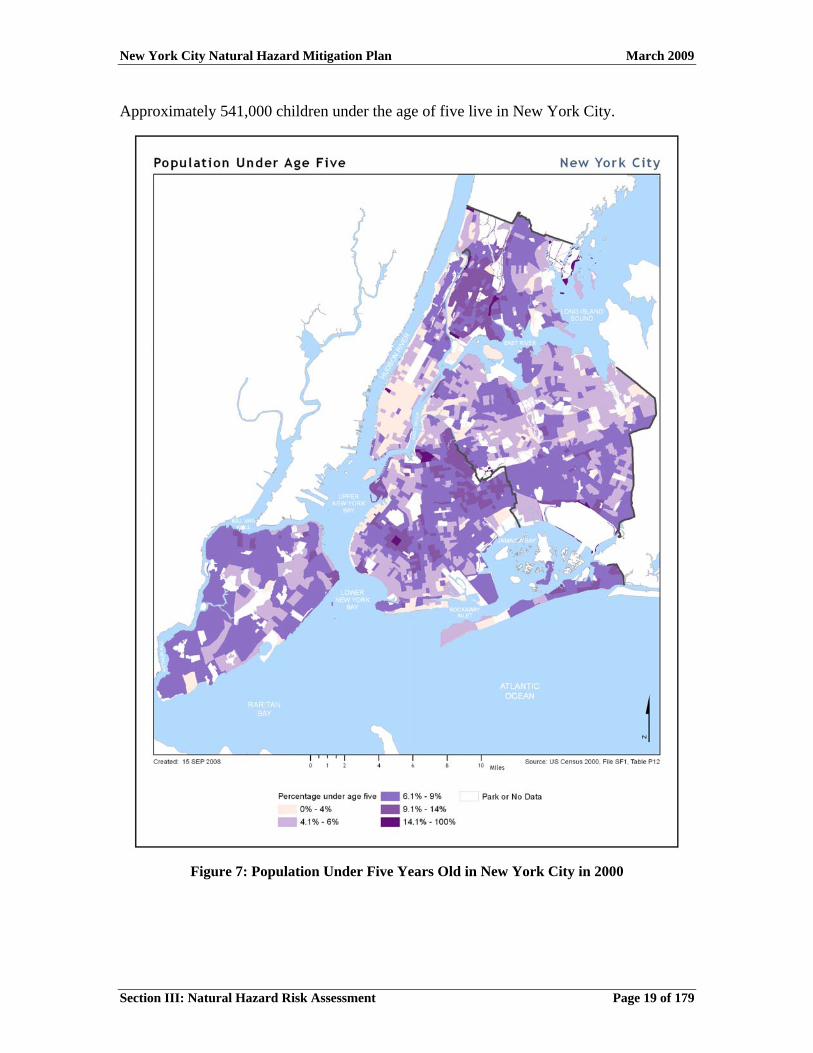
Approximately 541,000 children under the age of five live in New York City.
Figure 7: Population Under Five Years Old in New York City in 2000
New York City Natural Hazard Mitigation Plan March 2009
Section III: Natural Hazard Risk Assessment Page 20 of 179
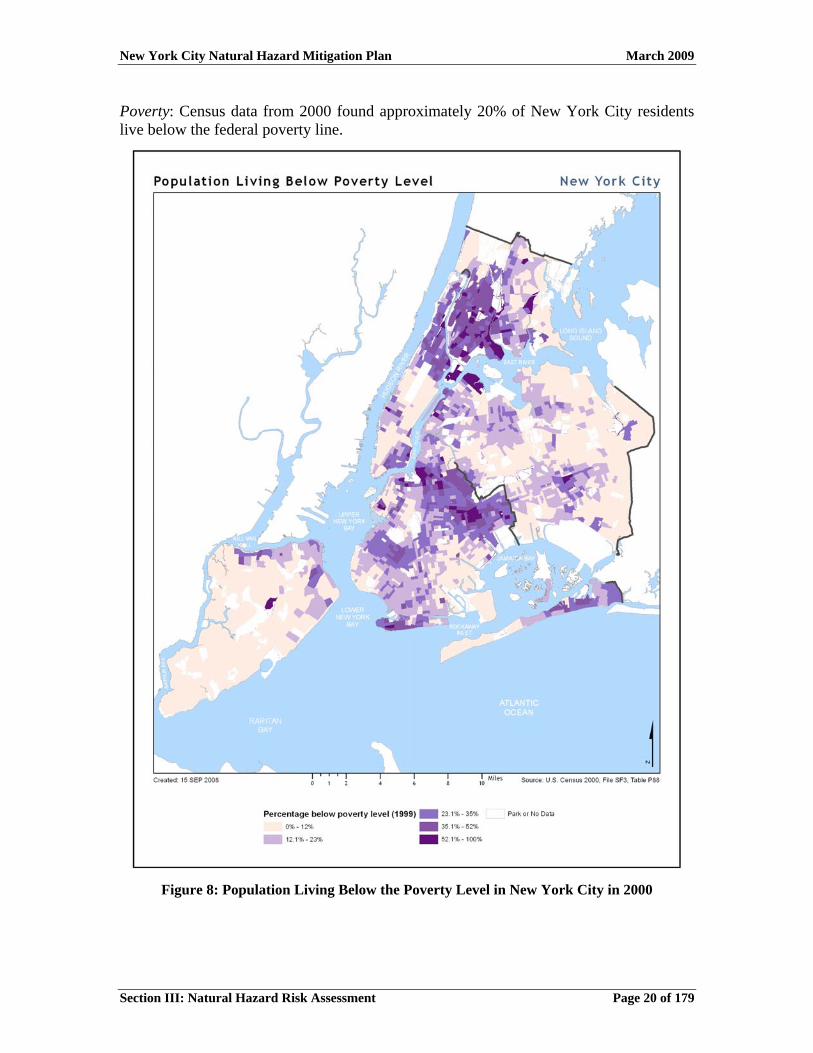
Poverty: Census data from 2000 found approximately 20% of New York City residents live below the federal poverty line.
Figure 8: Population Living Below the Poverty Level in New York City in 2000
New York City Natural Hazard Mitigation Plan March 2009
Section III: Natural Hazard Risk Assessment Page 21 of 179
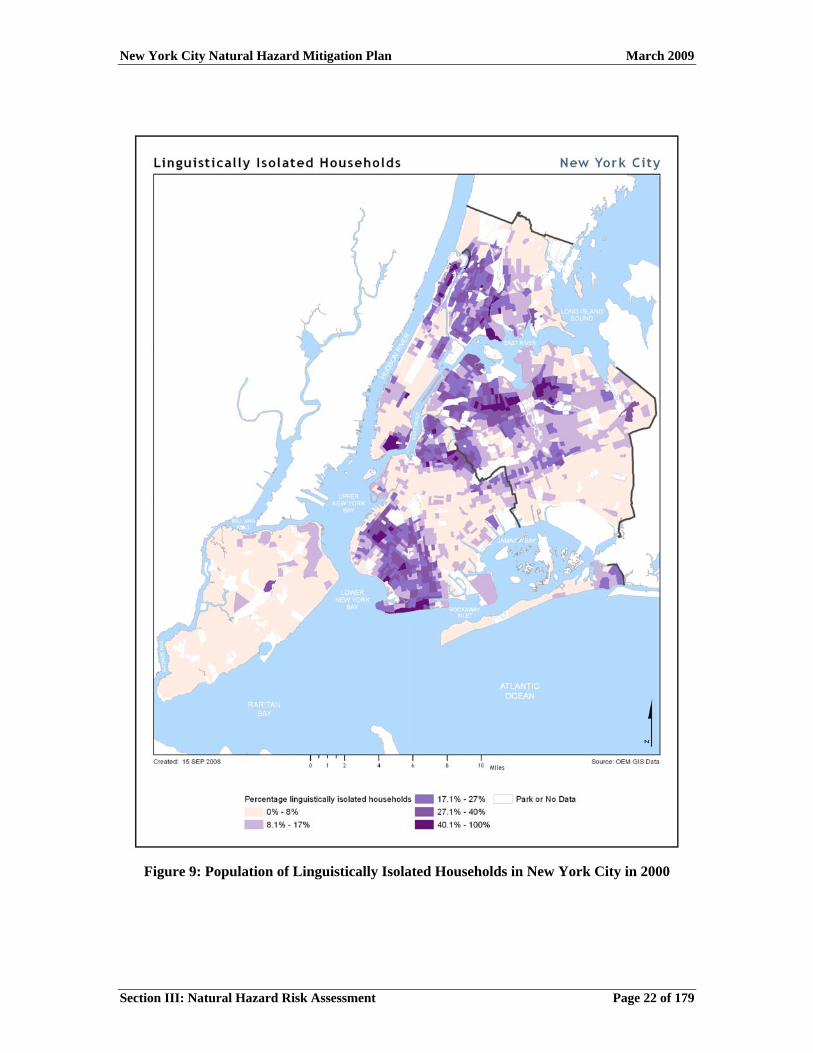
Linguistically Isolated: New York City is exceptionally diverse and has been a major point of entry for immigrants throughout its history. Today, 38% of the City’s population is foreign-born and New Yorkers speak about 200 different languages and dialects. People who do not speak English very well are of special concern during a natural hazard event. An estimated 440,000 households, or 15% of the City’s total households, are linguistically isolated.
New York City Natural Hazard Mitigation Plan March 2009
Section III: Natural Hazard Risk Assessment Page 22 of 179
Figure 9: Population of Linguistically Isolated Households in New York City in 2000
New York City Natural Hazard Mitigation Plan March 2009
Section III: Natural Hazard Risk Assessment Page 23 of 179
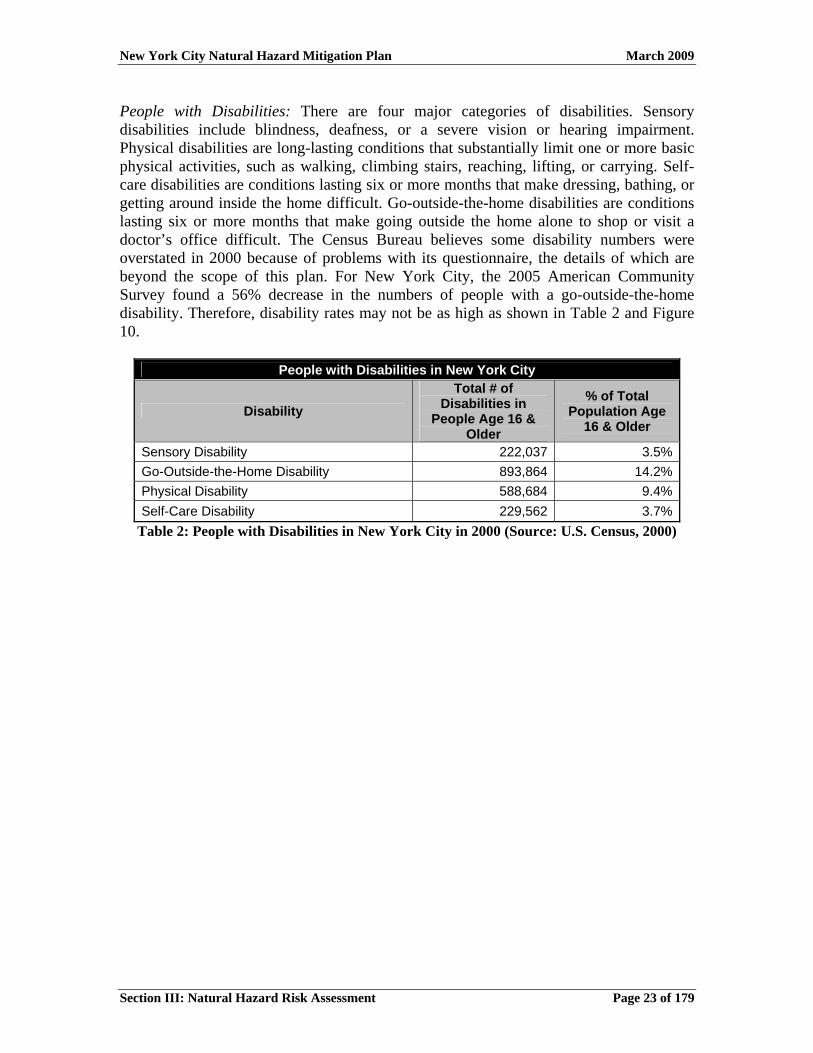
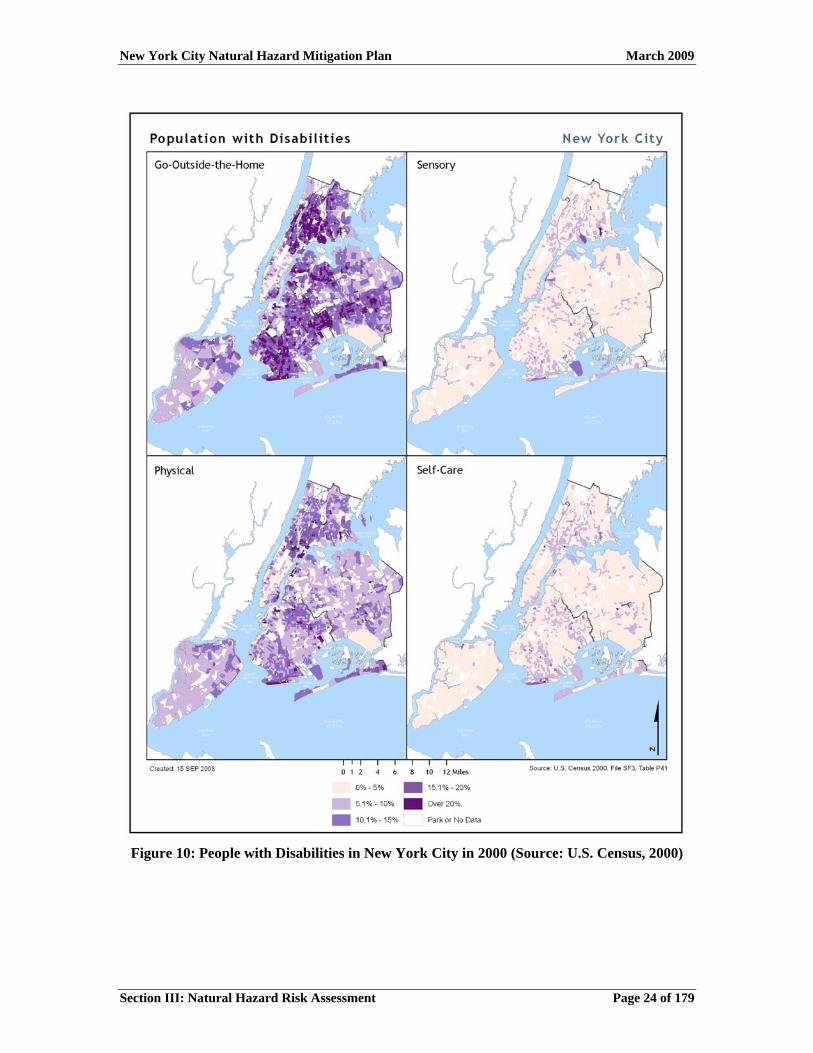
People with Disabilities: There are four major categories of disabilities. Sensory disabilities include blindness, deafness, or a severe vision or hearing impairment. Physical disabilities are long-lasting conditions that substantially limit one or more basic physical activities, such as walking, climbing stairs, reaching, lifting, or carrying. Self-care disabilities are conditions lasting six or more months that make dressing, bathing, or getting around inside the home difficult. Go-outside-the-home disabilities are conditions lasting six or more months that make going outside the home alone to shop or visit a doctor’s office difficult. The Census Bureau believes some disability numbers were overstated in 2000 because of problems with its questionnaire, the details of which are beyond the scope of this plan. For New York City, the 2005 American Community Survey found a 56% decrease in the numbers of people with a go-outside-the-home disability. Therefore, disability rates may not be as high as shown in Table 2 and Figure 10.
People with Disabilities in New York City
Disability Total # of
Disabilities in People Age 16 &
Older
% of Total Population Age
16 & Older
Sensory Disability 222,037 3.5%Go-Outside-the-Home Disability 893,864 14.2%Physical Disability 588,684 9.4%Self-Care Disability 229,562 3.7%
Table 2: People with Disabilities in New York City in 2000 (Source: U.S. Census, 2000)
New York City Natural Hazard Mitigation Plan March 2009
Figure 10: People with Disabilities in New York City in 2000 (Source: U.S. Census, 2000)
Section III: Natural Hazard Risk Assessment Page 24 of 179
New York City Natural Hazard Mitigation Plan March 2009
Section III: Natural Hazard Risk Assessment Page 25 of 179
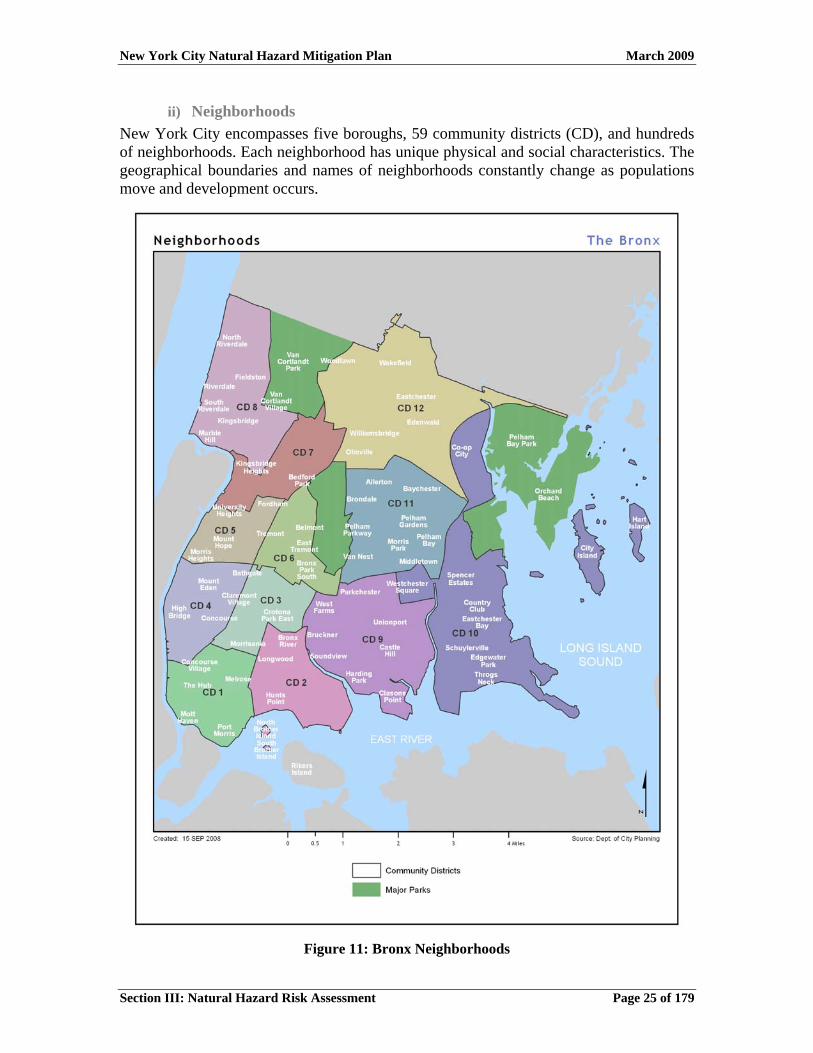
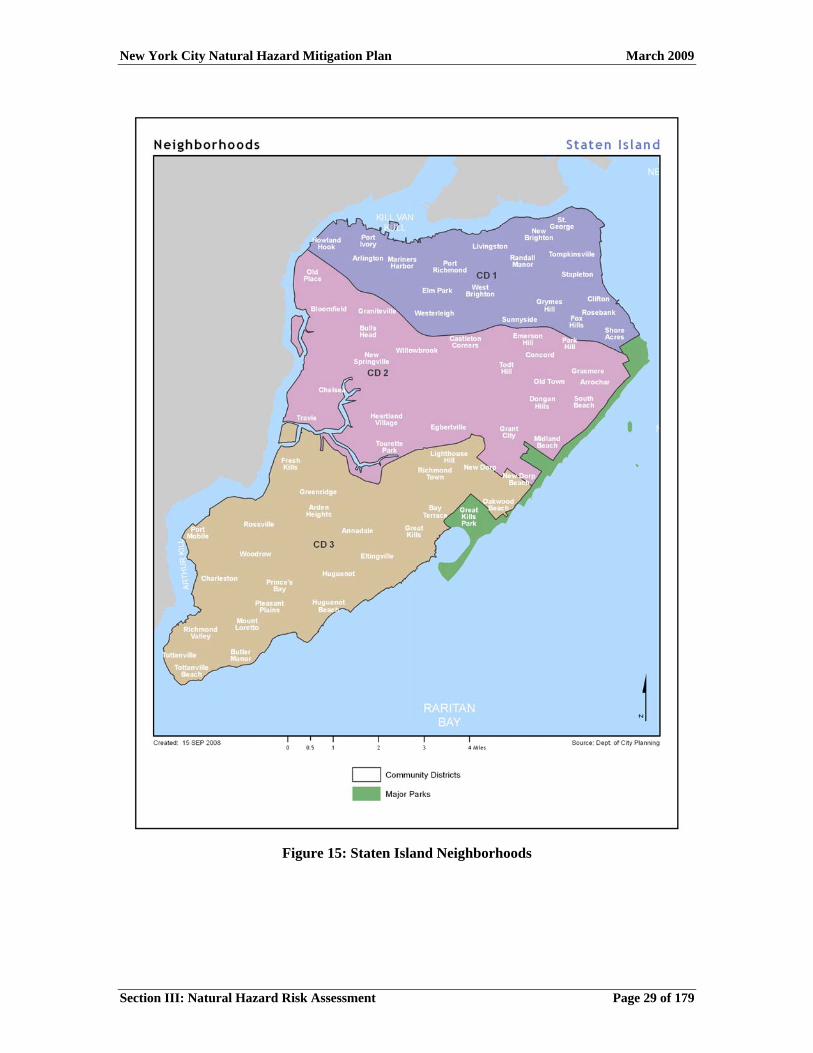
ii) Neighborhoods New York City encompasses five boroughs, 59 community districts (CD), and hundreds of neighborhoods. Each neighborhood has unique physical and social characteristics. The geographical boundaries and names of neighborhoods constantly change as populations move and development occurs.
Figure 11: Bronx Neighborhoods
New York City Natural Hazard Mitigation Plan March 2009
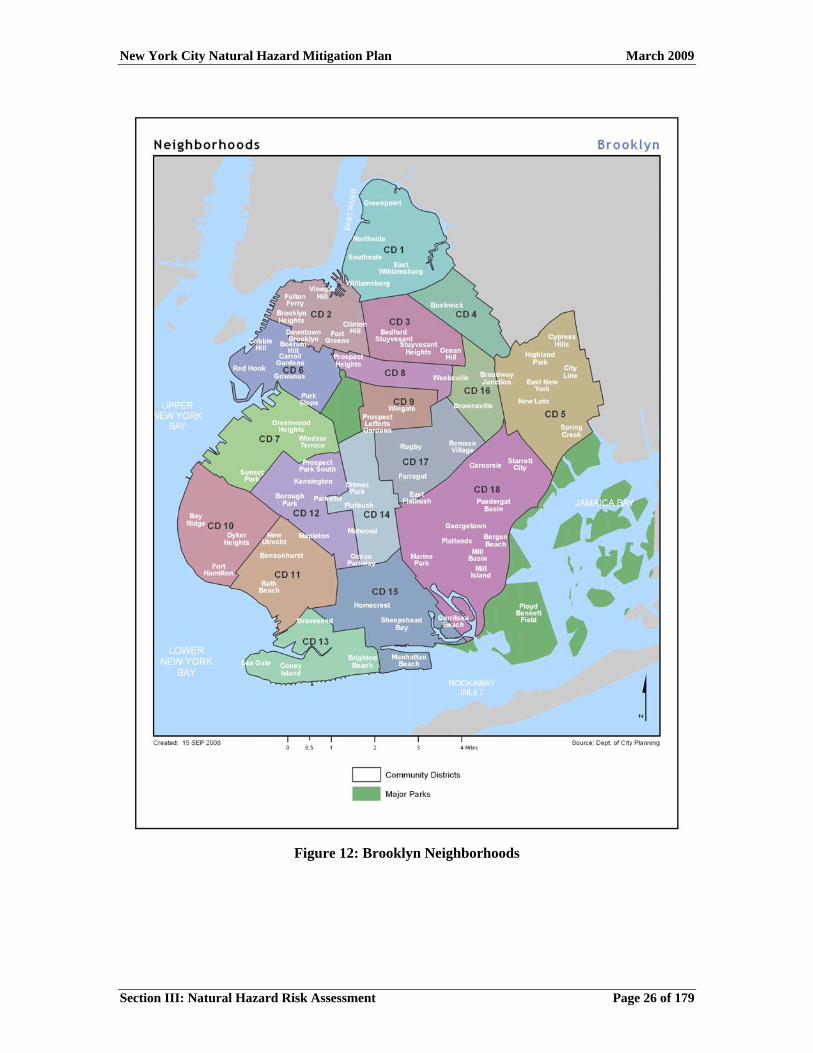
Figure 12: Brooklyn Neighborhoods
Section III: Natural Hazard Risk Assessment Page 26 of 179
New York City Natural Hazard Mitigation Plan March 2009
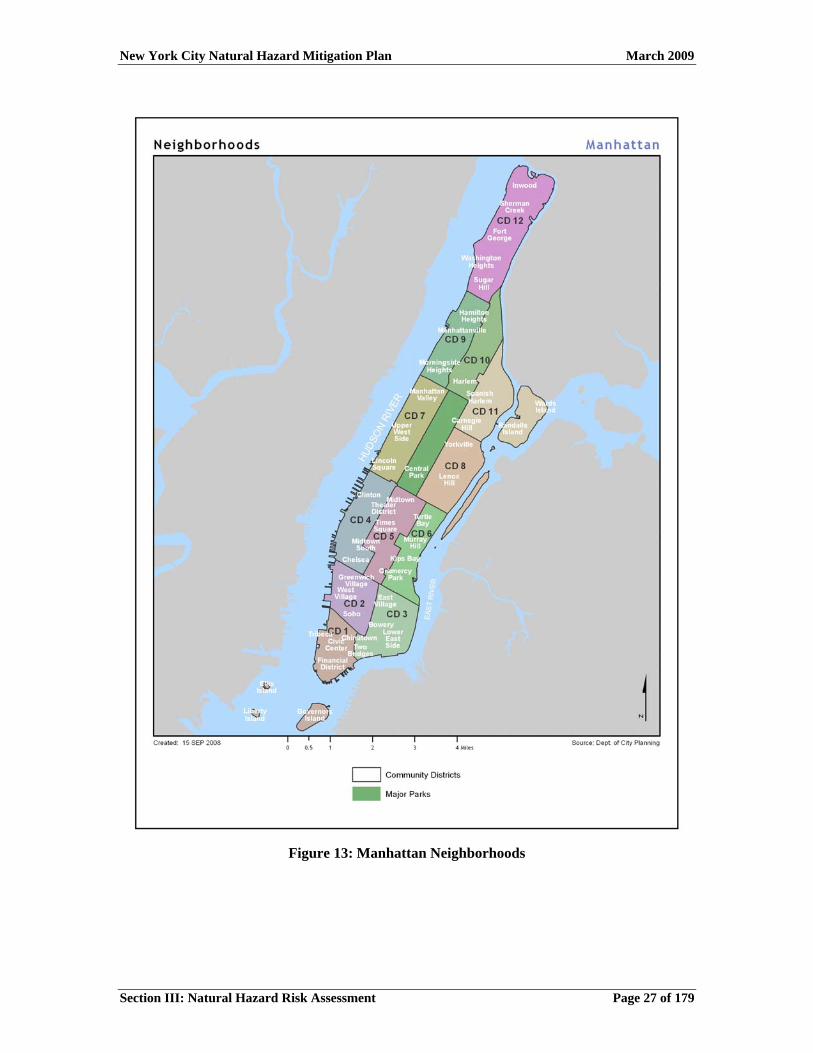
Figure 13: Manhattan Neighborhoods
Section III: Natural Hazard Risk Assessment Page 27 of 179
New York City Natural Hazard Mitigation Plan March 2009
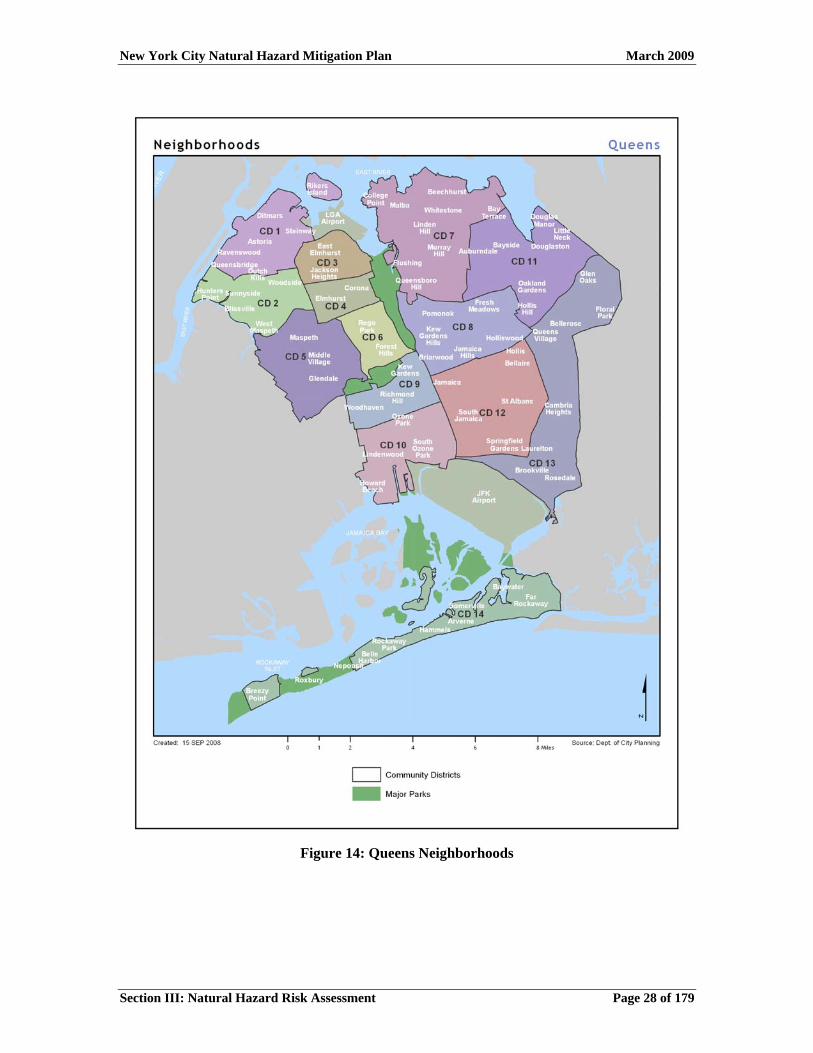
Figure 14: Queens Neighborhoods
Section III: Natural Hazard Risk Assessment Page 28 of 179
New York City Natural Hazard Mitigation Plan March 2009
Figure 15: Staten Island Neighborhoods
Section III: Natural Hazard Risk Assessment Page 29 of 179
New York City Natural Hazard Mitigation Plan March 2009
Section III: Natural Hazard Risk Assessment Page 30 of 179
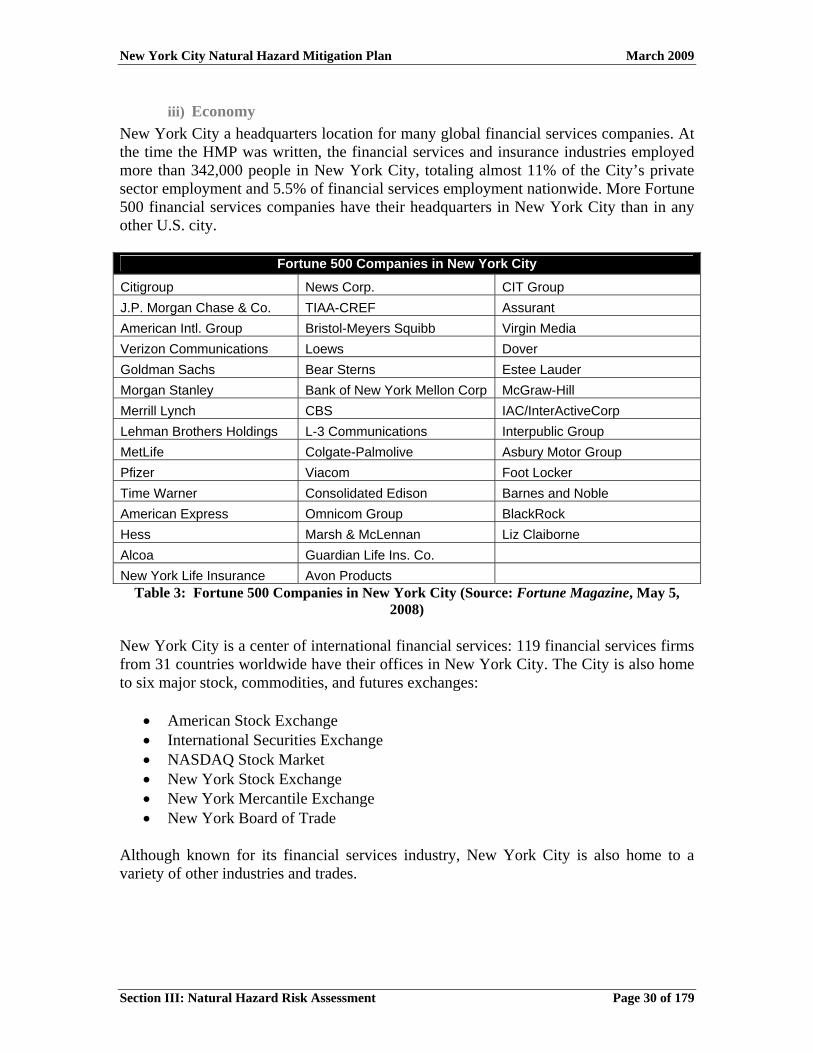
iii) Economy New York City a headquarters location for many global financial services companies. At the time the HMP was written, the financial services and insurance industries employed more than 342,000 people in New York City, totaling almost 11% of the City’s private sector employment and 5.5% of financial services employment nationwide. More Fortune 500 financial services companies have their headquarters in New York City than in any other U.S. city.
Fortune 500 Companies in New York City
Citigroup News Corp. CIT Group J.P. Morgan Chase & Co. TIAA-CREF Assurant American Intl. Group Bristol-Meyers Squibb Virgin Media Verizon Communications Loews Dover Goldman Sachs Bear Sterns Estee Lauder Morgan Stanley Bank of New York Mellon Corp McGraw-Hill Merrill Lynch CBS IAC/InterActiveCorp Lehman Brothers Holdings L-3 Communications Interpublic Group MetLife Colgate-Palmolive Asbury Motor Group Pfizer Viacom Foot Locker Time Warner Consolidated Edison Barnes and Noble American Express Omnicom Group BlackRock Hess Marsh & McLennan Liz Claiborne Alcoa Guardian Life Ins. Co. New York Life Insurance Avon Products
Table 3: Fortune 500 Companies in New York City (Source: Fortune Magazine, May 5, 2008)
New York City is a center of international financial services: 119 financial services firms from 31 countries worldwide have their offices in New York City. The City is also home to six major stock, commodities, and futures exchanges:
• American Stock Exchange • International Securities Exchange • NASDAQ Stock Market • New York Stock Exchange • New York Mercantile Exchange • New York Board of Trade
Although known for its financial services industry, New York City is also home to a variety of other industries and trades.
New York City Natural Hazard Mitigation Plan March 2009
Section III: Natural Hazard Risk Assessment Page 31 of 179
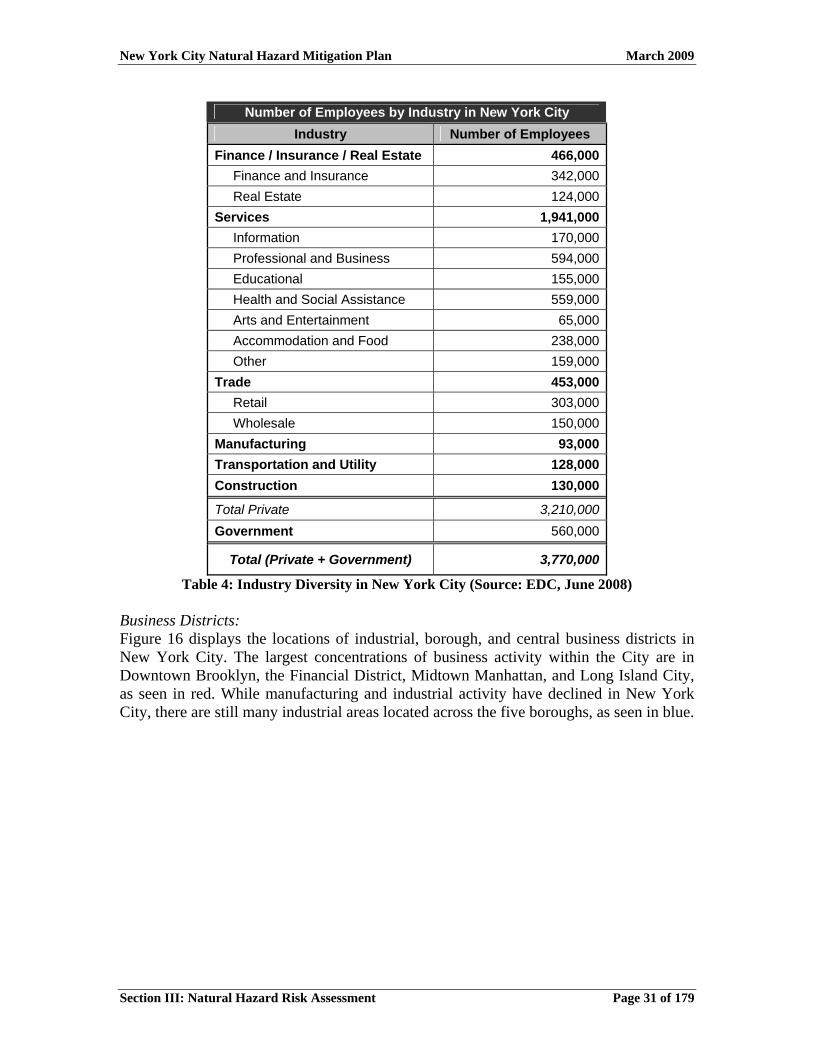
Number of Employees by Industry in New York City Industry Number of Employees
Finance / Insurance / Real Estate 466,000 Finance and Insurance 342,000 Real Estate 124,000 Services 1,941,000 Information 170,000 Professional and Business 594,000 Educational 155,000 Health and Social Assistance 559,000 Arts and Entertainment 65,000 Accommodation and Food 238,000 Other 159,000 Trade 453,000 Retail 303,000 Wholesale 150,000 Manufacturing 93,000 Transportation and Utility 128,000 Construction 130,000
Total Private 3,210,000 Government 560,000
Total (Private + Government) 3,770,000
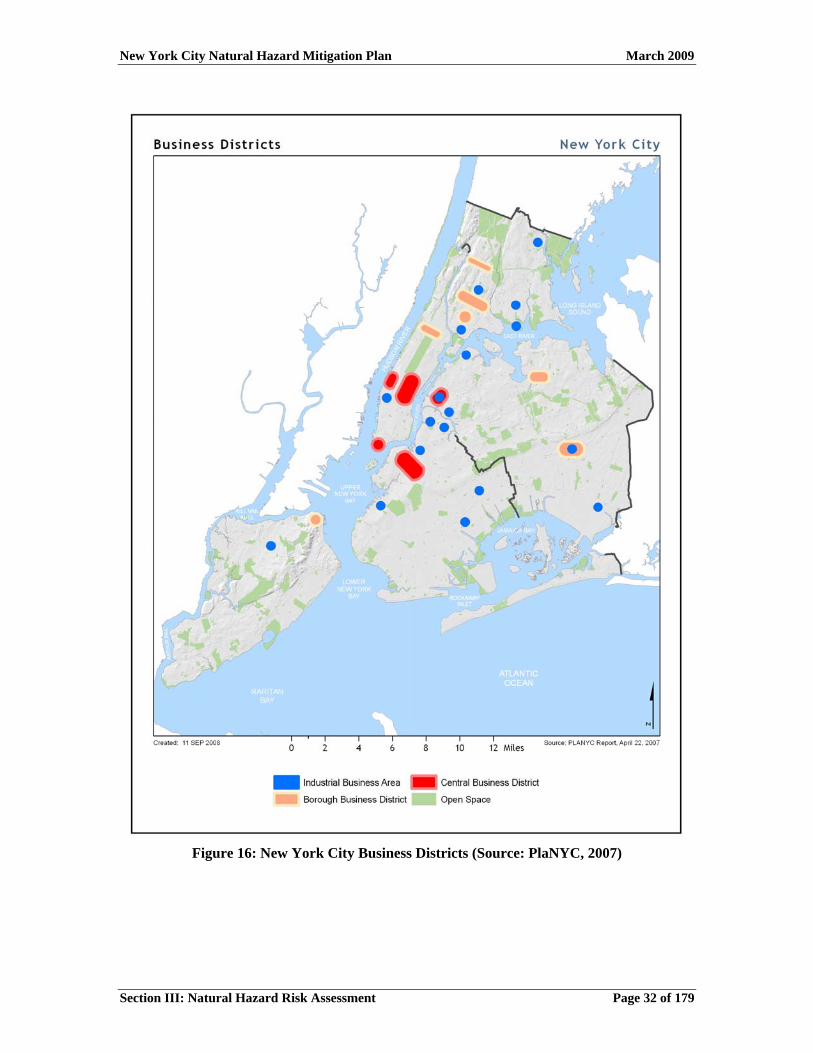
Table 4: Industry Diversity in New York City (Source: EDC, June 2008) Business Districts: Figure 16 displays the locations of industrial, borough, and central business districts in New York City. The largest concentrations of business activity within the City are in Downtown Brooklyn, the Financial District, Midtown Manhattan, and Long Island City, as seen in red. While manufacturing and industrial activity have declined in New York City, there are still many industrial areas located across the five boroughs, as seen in blue.
New York City Natural Hazard Mitigation Plan March 2009
Figure 16: New York City Business Districts (Source: PlaNYC, 2007)
Section III: Natural Hazard Risk Assessment Page 32 of 179
New York City Natural Hazard Mitigation Plan March 2009
Section III: Natural Hazard Risk Assessment Page 33 of 179
c) The Built Environment No other American city can match the diversity of New York’s built environment. From the skyscrapers and vast network of underground infrastructure in Manhattan, to the brownstones and houses of Brooklyn and Queens, to the expanses of parkland and beaches in the Bronx and Staten Island, New York is one of the most complex cities in the world. It has 578 miles of waterfront, more than 6,000 miles of streets and highways, over 800 miles of subway track, more than 2,000 bridges, and four major tunnels. There are over 800,000 buildings in the City, more than 2,200 schools, 66 hospitals, four major stadiums, and two major airports. While millions of physical assets exist throughout the City, certain assets are vital to the City’s security, public health and safety, economy, and way of life. In the event of a major natural disaster, the City will need these critical assets to continue operating and sustain daily activities for its residents.
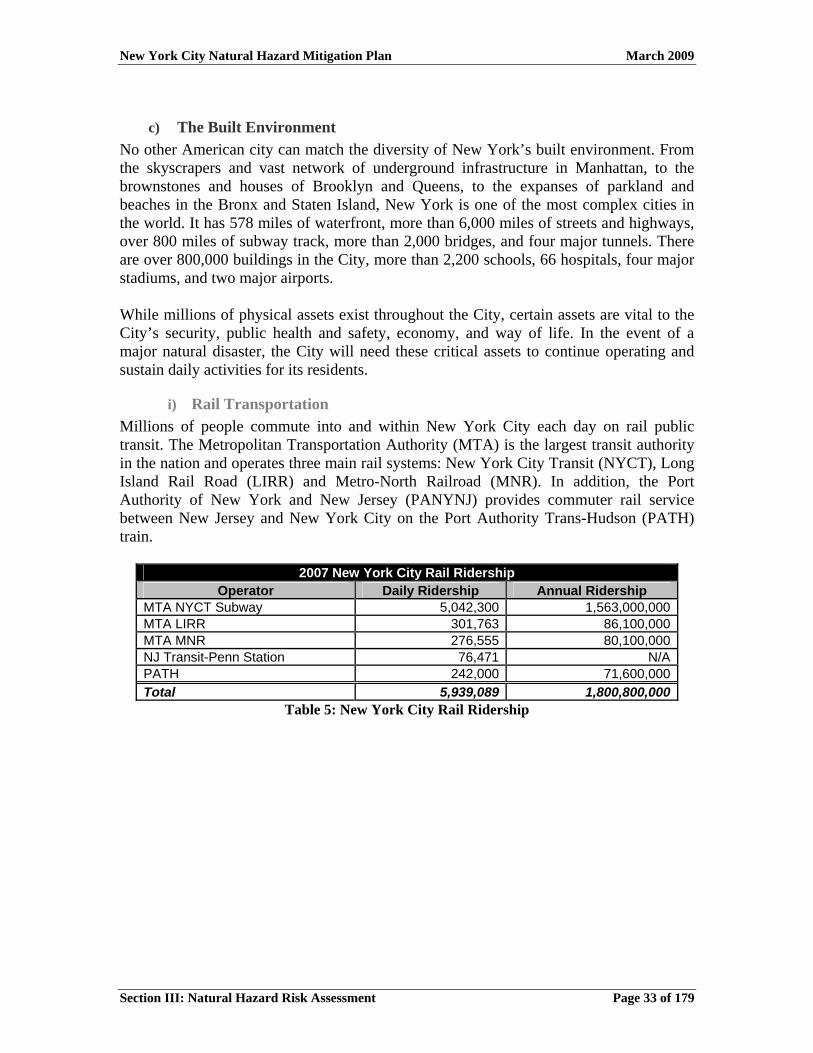
i) Rail Transportation Millions of people commute into and within New York City each day on rail public transit. The Metropolitan Transportation Authority (MTA) is the largest transit authority in the nation and operates three main rail systems: New York City Transit (NYCT), Long Island Rail Road (LIRR) and Metro-North Railroad (MNR). In addition, the Port Authority of New York and New Jersey (PANYNJ) provides commuter rail service between New Jersey and New York City on the Port Authority Trans-Hudson (PATH) train.
2007 New York City Rail Ridership Operator Daily Ridership Annual Ridership
MTA NYCT Subway 5,042,300 1,563,000,000MTA LIRR 301,763 86,100,000MTA MNR 276,555 80,100,000NJ Transit-Penn Station 76,471 N/APATH 242,000 71,600,000Total 5,939,089 1,800,800,000
Table 5: New York City Rail Ridership
New York City Natural Hazard Mitigation Plan March 2009
Section III: Natural Hazard Risk Assessment Page 34 of 179
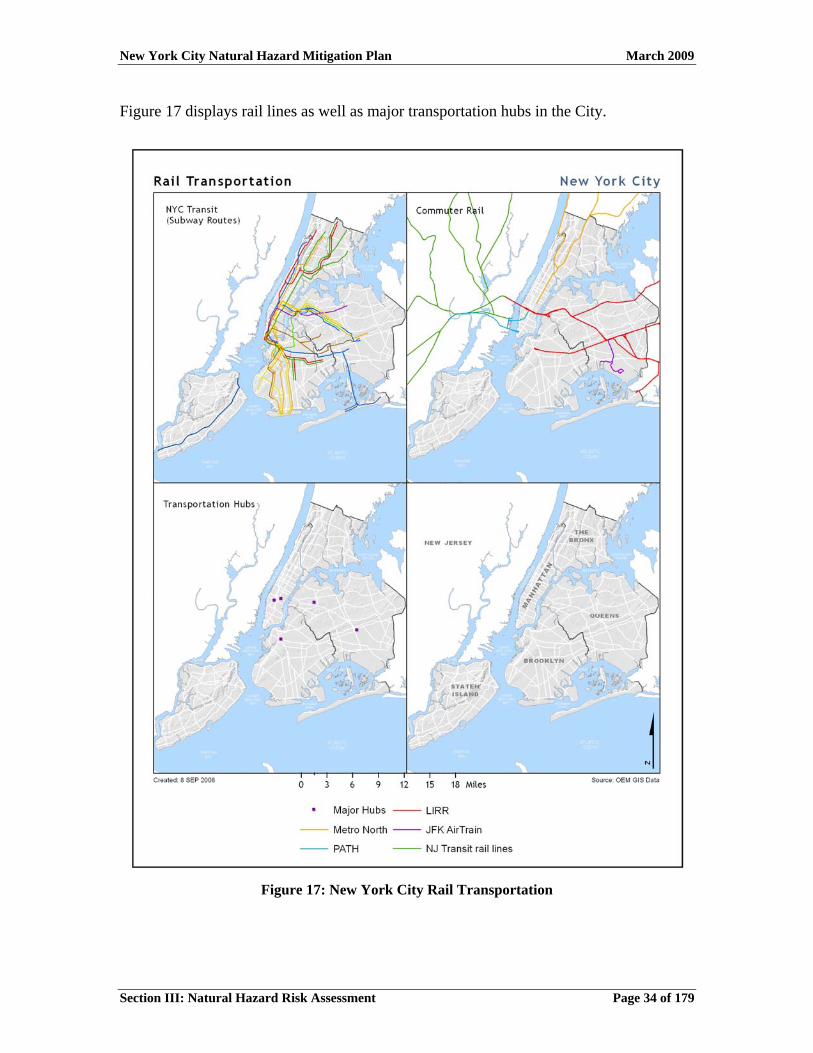
Figure 17 displays rail lines as well as major transportation hubs in the City.
Figure 17: New York City Rail Transportation
New York City Natural Hazard Mitigation Plan March 2009
Section III: Natural Hazard Risk Assessment Page 35 of 179
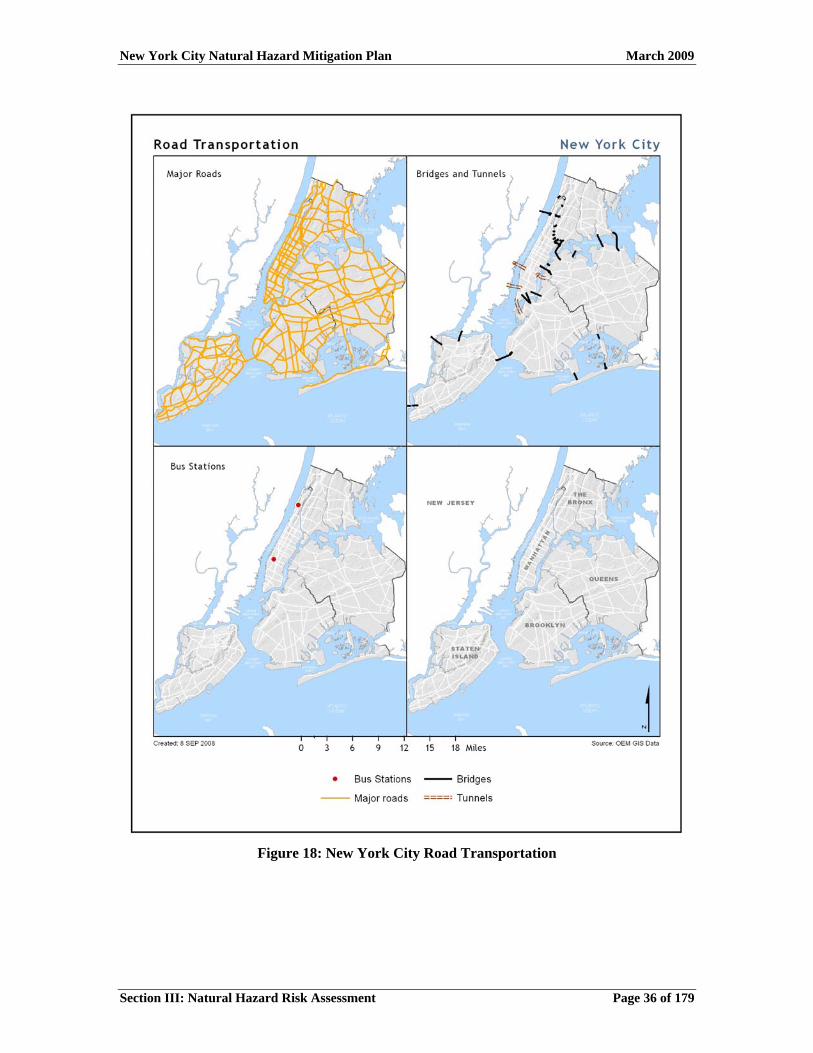
ii) Roadway Transportation The New York City Department of Transportation (DOT), New York State Department of Transportation (NYS DOT), MTA, and PANYNJ manage roadway travel in New York City. Bridges and tunnels are vital, providing inter-borough transit for vehicles and public transit as well as access into and out of the City. In total, New York City has 2,027 bridges. DOT manages 789 bridge structures including six tunnels. DOT also maintains approximately 5,800 miles of streets, sidewalks, and highways. The MTA operates 324 bus routes throughout the City and oversees seven bridges and two tunnels that service more than 300 million vehicles each year. PANYNJ manages most of the transportation between New York and New Jersey including four bridges, two tunnels, and two bus terminals. Figure 18 represents the major roads, highways, bridges, tunnels, and bus stations in New York City.
New York City Natural Hazard Mitigation Plan March 2009
Figure 18: New York City Road Transportation
Section III: Natural Hazard Risk Assessment Page 36 of 179
New York City Natural Hazard Mitigation Plan March 2009
Section III: Natural Hazard Risk Assessment Page 37 of 179
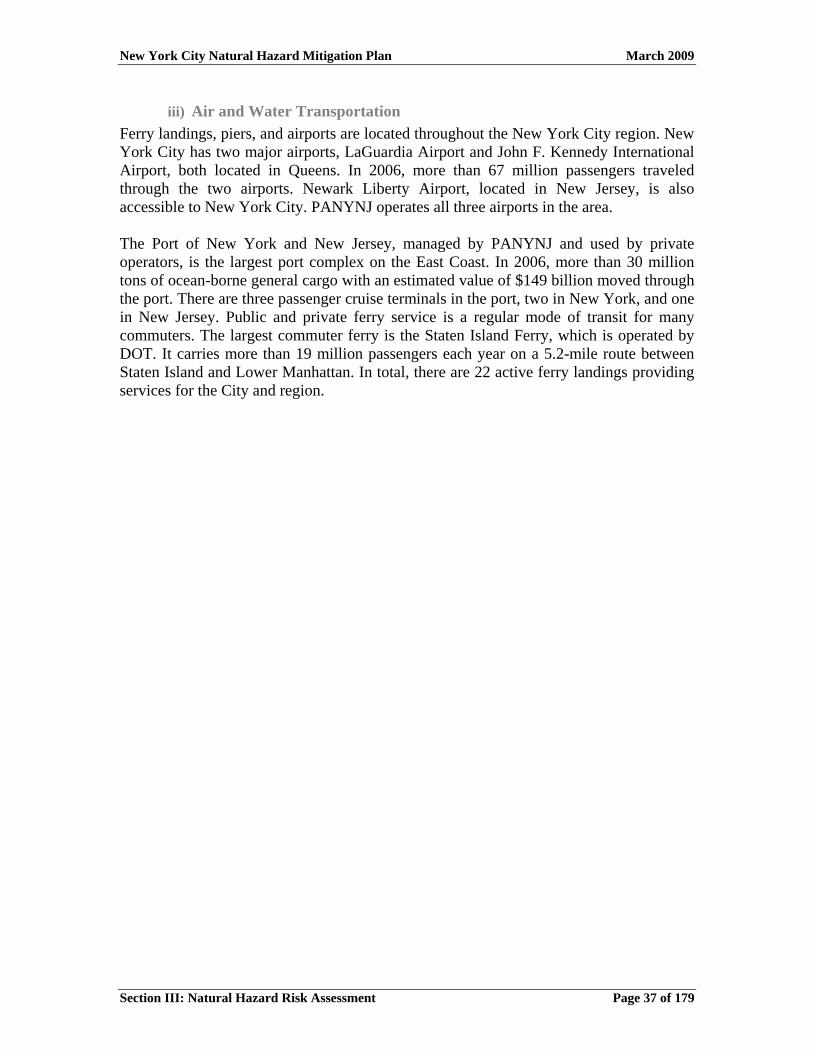
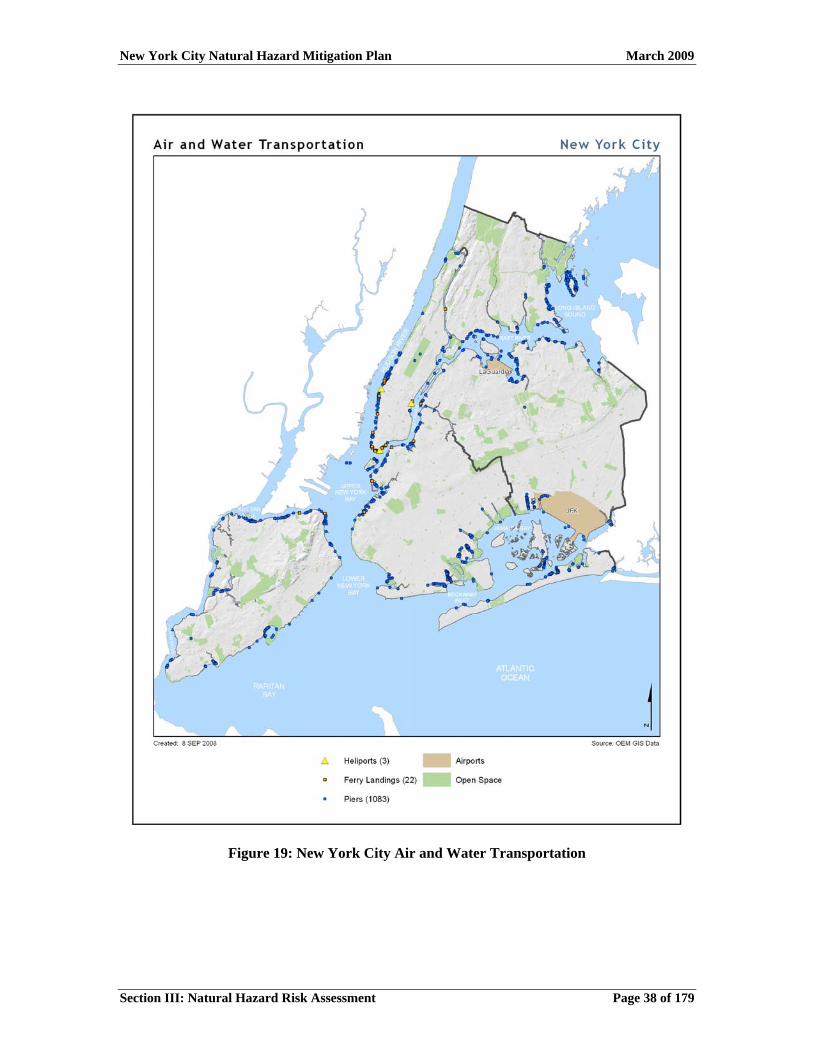
iii) Air and Water Transportation Ferry landings, piers, and airports are located throughout the New York City region. New York City has two major airports, LaGuardia Airport and John F. Kennedy International Airport, both located in Queens. In 2006, more than 67 million passengers traveled through the two airports. Newark Liberty Airport, located in New Jersey, is also accessible to New York City. PANYNJ operates all three airports in the area. The Port of New York and New Jersey, managed by PANYNJ and used by private operators, is the largest port complex on the East Coast. In 2006, more than 30 million tons of ocean-borne general cargo with an estimated value of $149 billion moved through the port. There are three passenger cruise terminals in the port, two in New York, and one in New Jersey. Public and private ferry service is a regular mode of transit for many commuters. The largest commuter ferry is the Staten Island Ferry, which is operated by DOT. It carries more than 19 million passengers each year on a 5.2-mile route between Staten Island and Lower Manhattan. In total, there are 22 active ferry landings providing services for the City and region.
New York City Natural Hazard Mitigation Plan March 2009
Figure 19: New York City Air and Water Transportation
Section III: Natural Hazard Risk Assessment Page 38 of 179
New York City Natural Hazard Mitigation Plan March 2009
Section III: Natural Hazard Risk Assessment Page 39 of 179
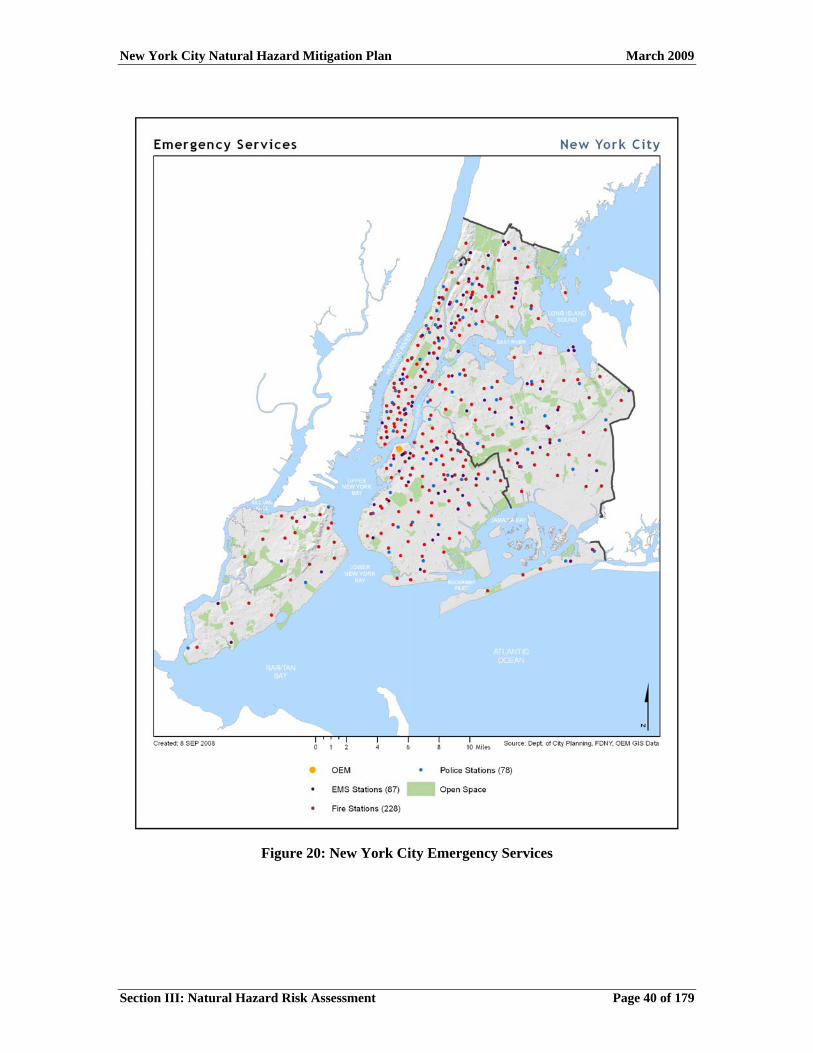
iv) Emergency Services New York City’s emergency services include the Police Department (NYPD), Fire Department (FDNY), Fire Department Emergency Medical Services (FDNY-EMS), and OEM. A number of other City agencies, including the Department of Health and Mental Hygiene (DOHMH), Department of Environmental Protection (DEP), and Department of Buildings (DOB) also have emergency response functions. Emergency services are generally well dispersed across the City and correlate to population density. Figure 20 shows the locations of police and fire stations as well as OEM’s headquarters.
New York City Natural Hazard Mitigation Plan March 2009
Figure 20: New York City Emergency Services
Section III: Natural Hazard Risk Assessment Page 40 of 179
New York City Natural Hazard Mitigation Plan March 2009
Section III: Natural Hazard Risk Assessment Page 41 of 179
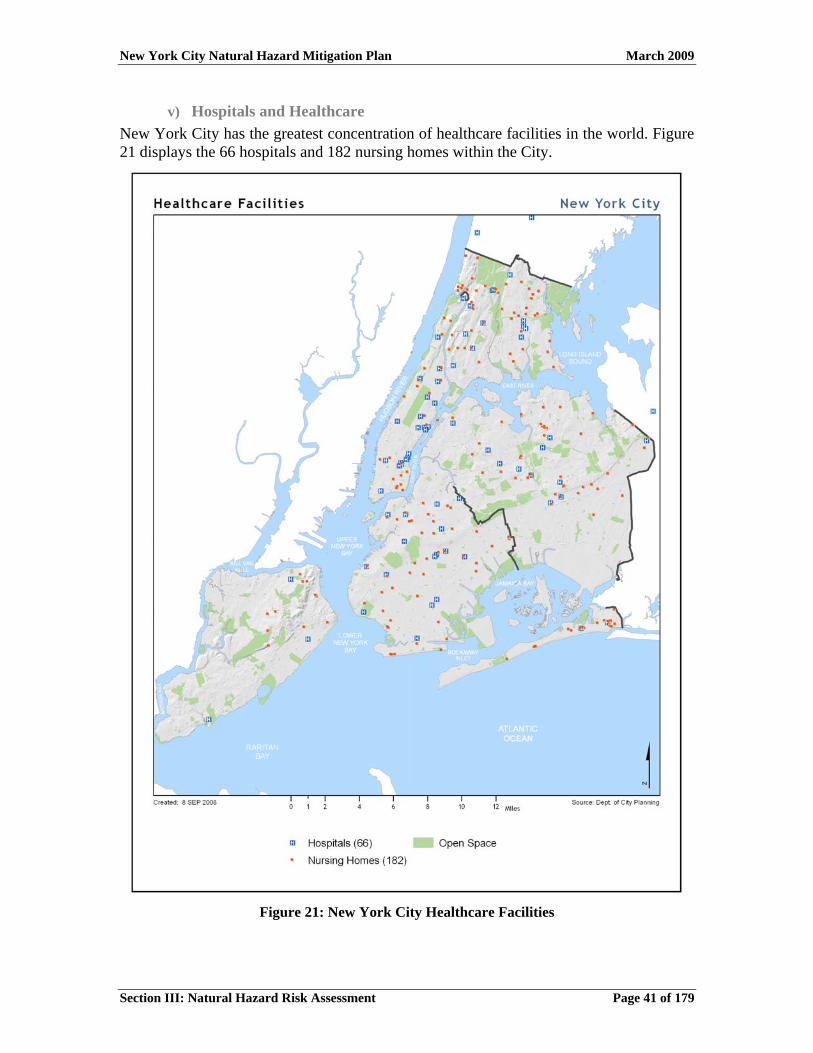
v) Hospitals and Healthcare New York City has the greatest concentration of healthcare facilities in the world. Figure 21 displays the 66 hospitals and 182 nursing homes within the City.
Figure 21: New York City Healthcare Facilities
New York City Natural Hazard Mitigation Plan March 2009
Section III: Natural Hazard Risk Assessment Page 42 of 179
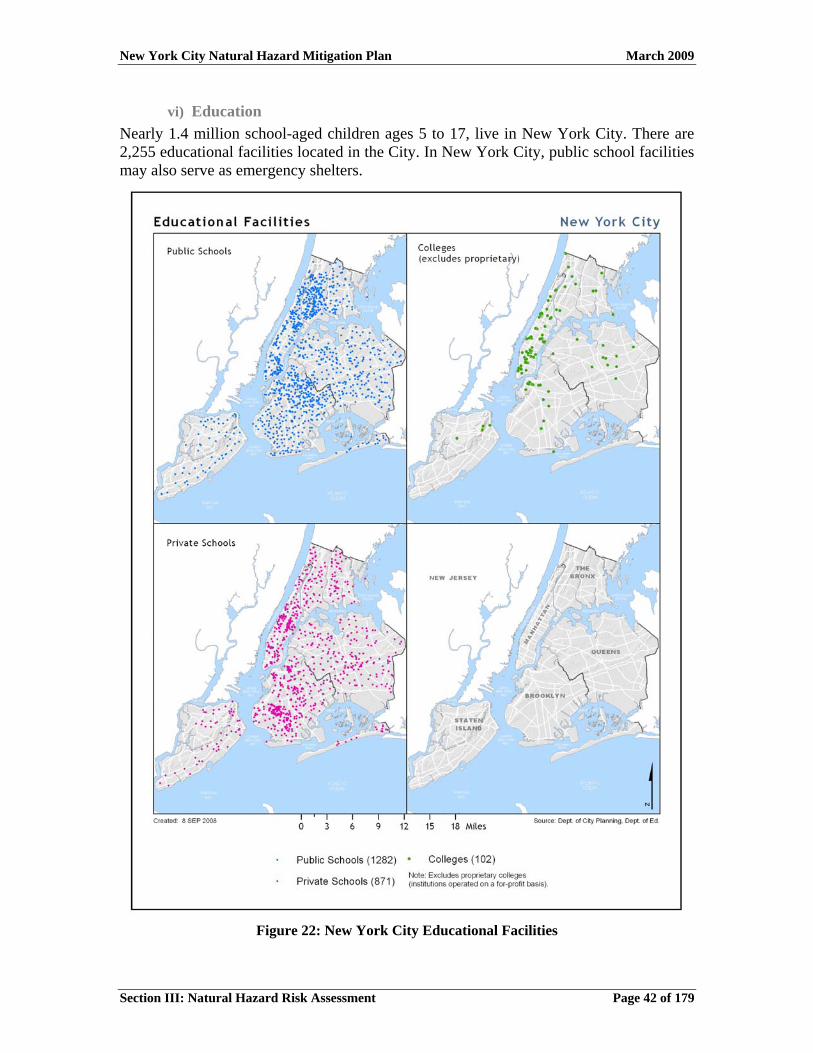
vi) Education Nearly 1.4 million school-aged children ages 5 to 17, live in New York City. There are 2,255 educational facilities located in the City. In New York City, public school facilities may also serve as emergency shelters.
Figure 22: New York City Educational Facilities
New York City Natural Hazard Mitigation Plan March 2009
Section III: Natural Hazard Risk Assessment Page 43 of 179
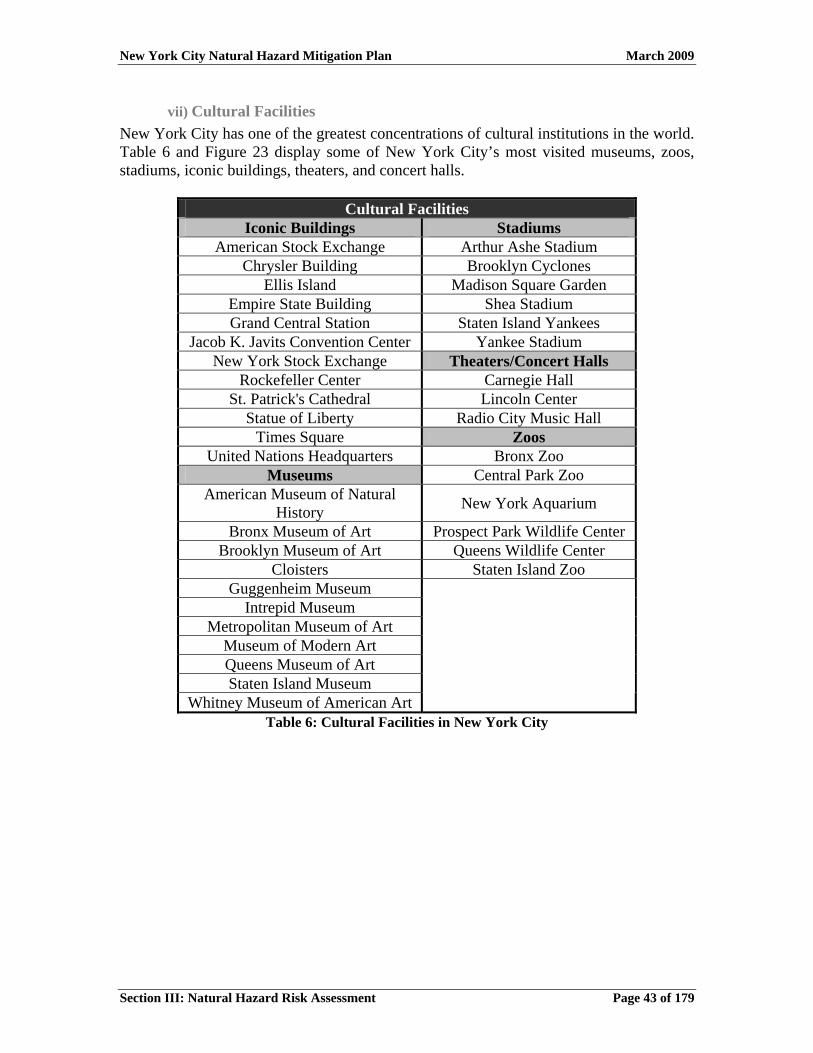
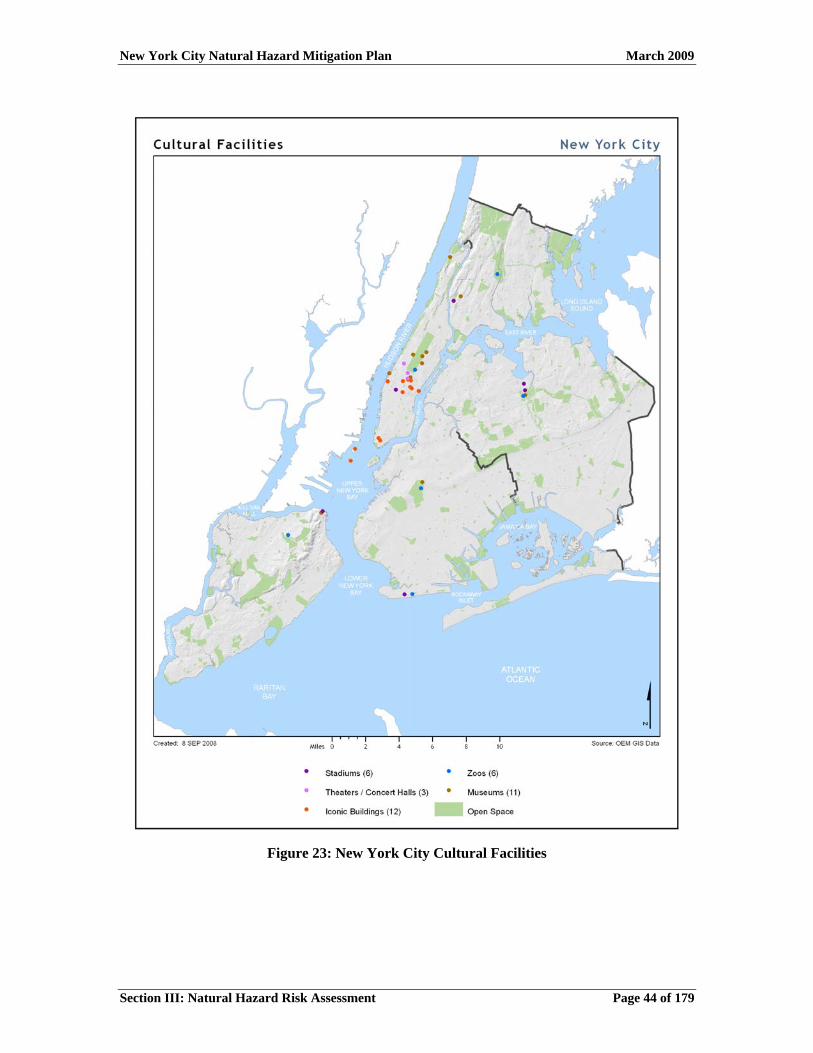
vii) Cultural Facilities New York City has one of the greatest concentrations of cultural institutions in the world. Table 6 and Figure 23 display some of New York City’s most visited museums, zoos, stadiums, iconic buildings, theaters, and concert halls.
Cultural Facilities Iconic Buildings Stadiums
American Stock Exchange Arthur Ashe Stadium Chrysler Building Brooklyn Cyclones
Ellis Island Madison Square Garden Empire State Building Shea Stadium Grand Central Station Staten Island Yankees
Jacob K. Javits Convention Center Yankee Stadium New York Stock Exchange Theaters/Concert Halls
Rockefeller Center Carnegie Hall St. Patrick's Cathedral Lincoln Center
Statue of Liberty Radio City Music Hall Times Square Zoos
United Nations Headquarters Bronx Zoo Museums Central Park Zoo
American Museum of Natural History New York Aquarium
Bronx Museum of Art Prospect Park Wildlife Center Brooklyn Museum of Art Queens Wildlife Center
Cloisters Staten Island Zoo Guggenheim Museum
Intrepid Museum Metropolitan Museum of Art
Museum of Modern Art Queens Museum of Art Staten Island Museum
Whitney Museum of American Art
Table 6: Cultural Facilities in New York City
New York City Natural Hazard Mitigation Plan March 2009
Figure 23: New York City Cultural Facilities
Section III: Natural Hazard Risk Assessment Page 44 of 179
New York City Natural Hazard Mitigation Plan March 2009
Section III: Natural Hazard Risk Assessment Page 45 of 179
viii) Energy In electrical terms, New York City is a load pocket, which means transmission lines cannot carry enough energy into the City to meet its peak load. Regulations require in-city generation to supply 80% of the forecasted demand. Transmission lines connecting the City to upstate New York, Long Island, and New Jersey import the balance. New York City’s transmission and distribution system is unique in that approximately 70% of the 130,000 miles is underground. The following parties own almost all of the in-city generation:
• US Power Generating Company • NRG Energy • TransCanada • New York Power Authority • Astoria Energy
The following parties own and operate New York City’s electric transmission and distribution system:
• Con Edison (majority of New York City electric customers) • Long Island Power Authority/National Grid (Rockaway peninsula, Queens
customers) Three interstate pipeline companies and five interconnections serve New York City with natural gas. Con Edison and National Grid operate gas systems within New York City. Each company has its own distribution system that carries gas from delivery points in the City, and to interconnections between the companies. New Yorkers rely on natural gas for heat, hot water, and cooking. Con Edison operates the largest district steam system in the United States. The system contains 105 miles of mains and service pipes, providing steam for heating, hot water, and air conditioning to approximately 1,800 customers in Manhattan.
ix) Telecommunications New York City’s telecommunications networks are vitally important components of its basic infrastructure and essential to public safety. Multiple companies provide voice, data, and video services using a variety of technologies. Although New York City’s telecommunications systems are generally very reliable, a large volume of traffic is routed through a small number of collocation facilities in Lower Manhattan. This centralization may increase the network’s vulnerability. The primary fixed-line telephone provider in New York City is Verizon, although there are a number of other companies that provide this service to residential and business customers. Major wireless carriers that serve New York City include:
• AT&T
New York City Natural Hazard Mitigation Plan March 2009
Section III: Natural Hazard Risk Assessment Page 46 of 179
• Sprint/Nextel • T-Mobile • Verizon Wireless
Cable and open video service providers in New York City include:
• Cablevision • RCN Telecom Services of New York • Staten Island Cable • Time Warner Cable
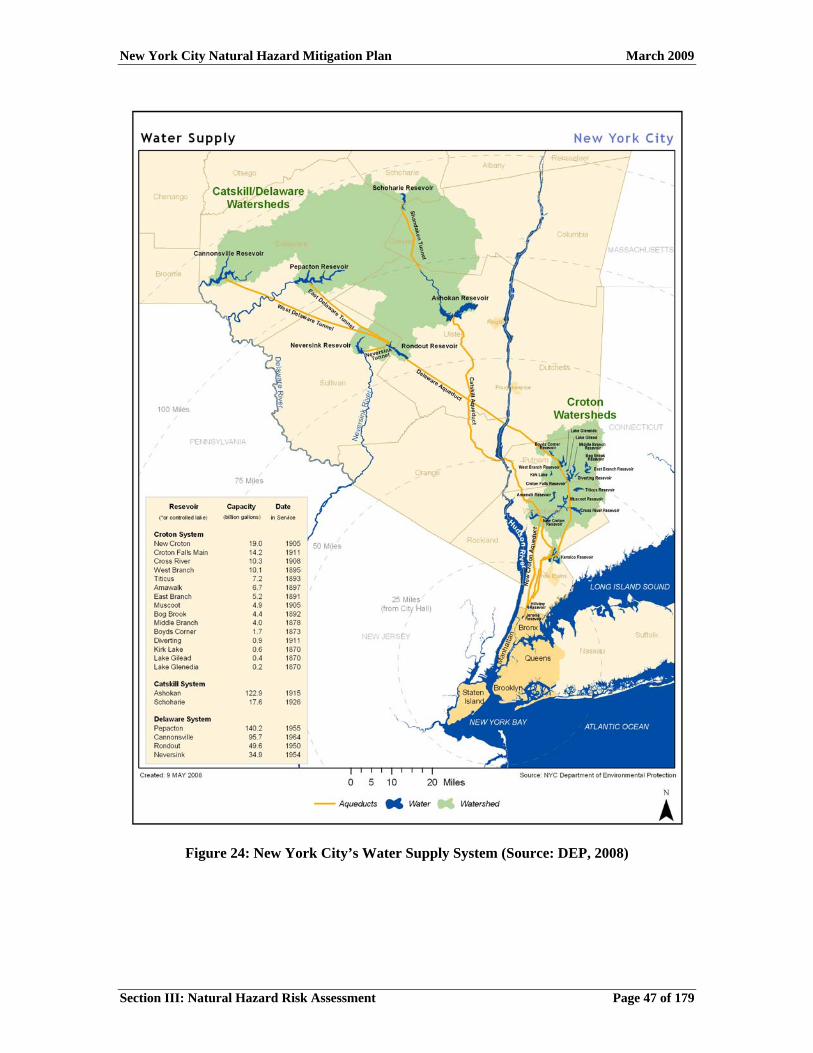
x) Water Supply and Wastewater Treatment DEP maintains and operates the City’s surface water supply system. It provides approximately 1.1 billion gallons of drinking water daily to more than eight million residents of New York City; approximately one million people living in Westchester, Putnam, Ulster, and Orange counties; as well as the millions of tourists and commuters who visit the City throughout the year. In addition to the surface water supplies, fewer than 100,000 people in southeastern Queens may receive groundwater or a blend of groundwater and surface water. In all, the City system supplies nearly half the population of New York State with water. Three upstate reservoir systems, including 19 reservoirs and three controlled lakes with a total storage capacity of approximately 580 billion gallons, impound water for the system. The City designed and built the three water collection systems with various interconnections to increase flexibility by permitting exchange of water from one to another. New York City’s water distribution system is almost entirely dependent on gravity alone. Water travels from the reservoirs with sufficient pressure to reach up to the sixth floor of most buildings. High-rise buildings rely on rooftop water towers or pump systems to provide water to upper floors.
New York City Natural Hazard Mitigation Plan March 2009
Figure 24: New York City’s Water Supply System (Source: DEP, 2008)
Section III: Natural Hazard Risk Assessment Page 47 of 179
New York City Natural Hazard Mitigation Plan March 2009
Section III: Natural Hazard Risk Assessment Page 48 of 179
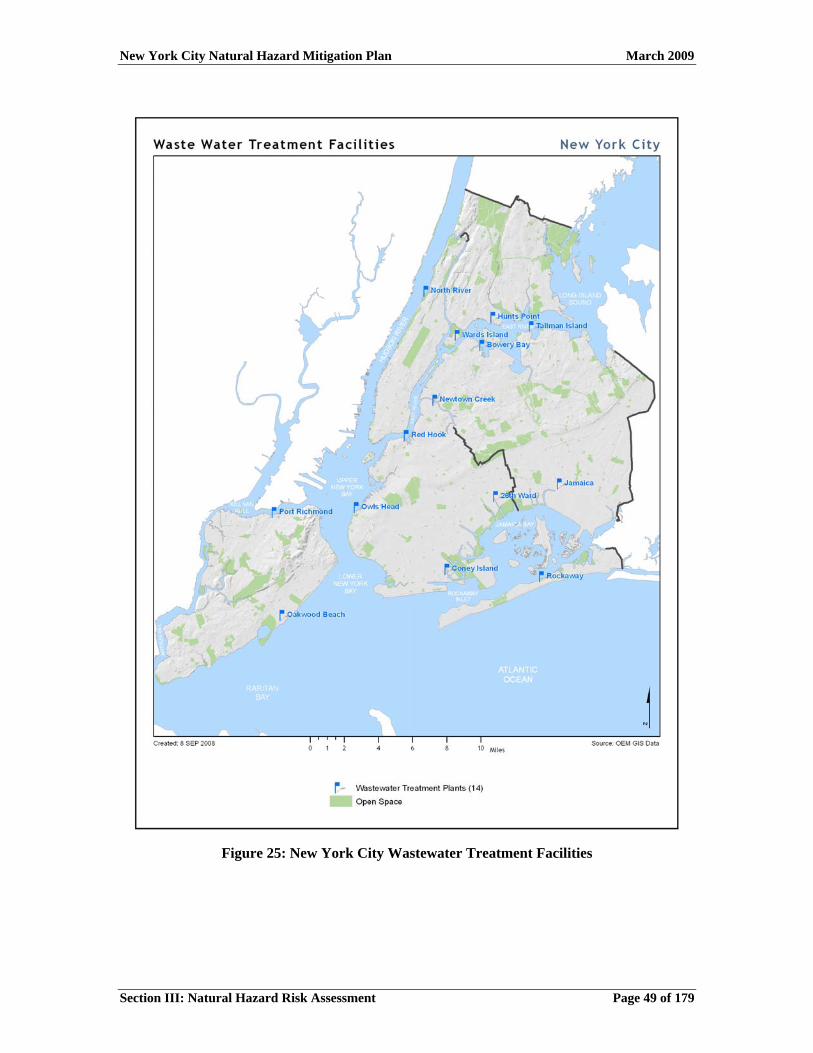
Every day, wastewater goes down toilets and drains in homes, schools, businesses, and factories and then flows into New York City's sewer system. Runoff from rain and melting snow, street and sidewalk washing, and other outdoor activities flows into catch basins in the streets and from there into the sewers. In some New York City neighborhoods, separate storm sewers carry runoff from the streets directly to local streams, rivers, and bays. In most areas of the City, a combined sewer system collects both sanitary and industrial wastewater, rainwater, and street runoff and conveys all of it to the City's treatment plants. Sometimes, during heavy rains or snow, combined sewers fill to capacity and are unable to carry the combined sanitary and storm sewage to the plants. When this occurs, the mix of excess storm water and untreated sewage flows directly into the City's waterways. This is called combined sewer overflow. Approximately 70% of the City sewers are combined.
New York City’s 14 wastewater treatment plants remove most pollutants from wastewater before releasing it to local waterways. At the plants, physical and biological processes closely duplicate how wetlands, rivers, streams, and lakes naturally purify water. Treatment at these plants is quick, taking only about seven hours to remove most of the pollutants from the wastewater. In the natural environment, this process could take many weeks and nature alone cannot handle the volume of wastewater New York City produces.
New York City Natural Hazard Mitigation Plan March 2009
Figure 25: New York City Wastewater Treatment Facilities
Section III: Natural Hazard Risk Assessment Page 49 of 179
New York City Natural Hazard Mitigation Plan March 2009
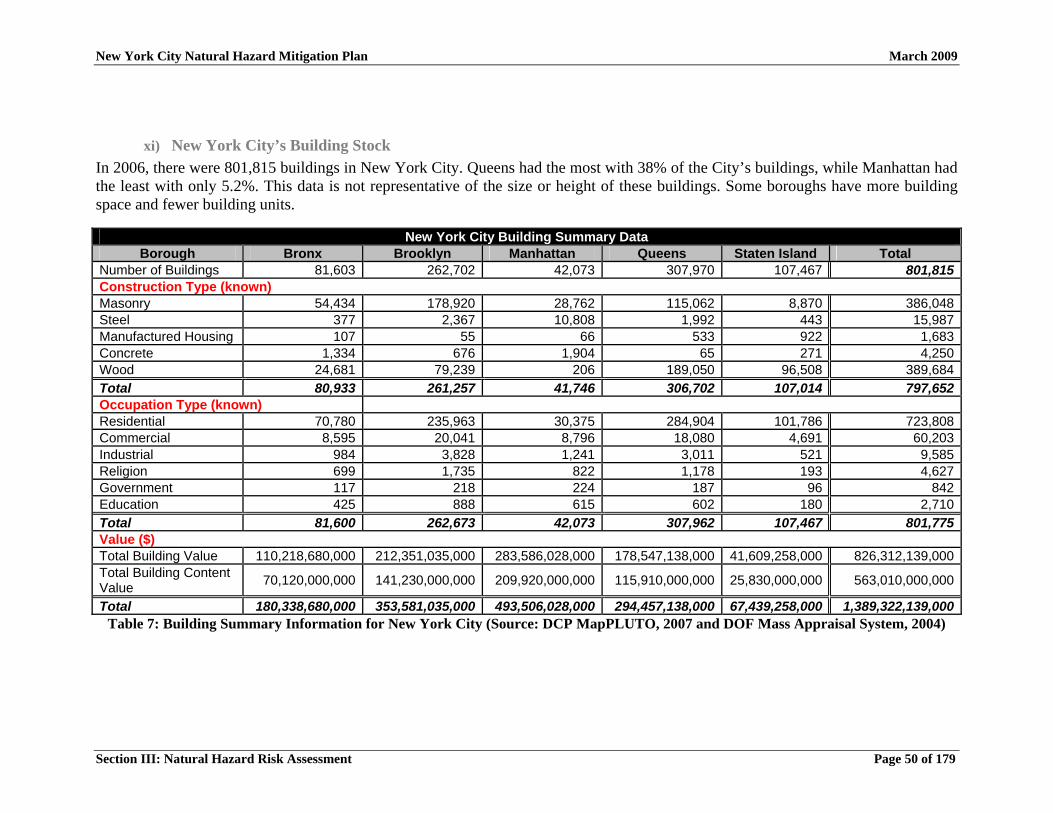
xi) New York City’s Building Stock In 2006, there were 801,815 buildings in New York City. Queens had the most with 38% of the City’s buildings, while Manhattan had the least with only 5.2%. This data is not representative of the size or height of these buildings. Some boroughs have more building space and fewer building units.
Table 7: Building Summary Information for New York City (Source: DCP MapPLUTO, 2007 and DOF Mass Appraisal System, 2004)
New York City Building Summary Data Borough Bronx Brooklyn Manhattan Queens Staten Island Total
Number of Buildings 81,603 262,702 42,073 307,970 107,467 801,815Construction Type (known) Masonry 54,434 178,920 28,762 115,062 8,870 386,048Steel 377 2,367 10,808 1,992 443 15,987Manufactured Housing 107 55 66 533 922 1,683Concrete 1,334 676 1,904 65 271 4,250Wood 24,681 79,239 206 189,050 96,508 389,684Total 80,933 261,257 41,746 306,702 107,014 797,652Occupation Type (known) Residential 70,780 235,963 30,375 284,904 101,786 723,808Commercial 8,595 20,041 8,796 18,080 4,691 60,203Industrial 984 3,828 1,241 3,011 521 9,585Religion 699 1,735 822 1,178 193 4,627Government 117 218 224 187 96 842Education 425 888 615 602 180 2,710Total 81,600 262,673 42,073 307,962 107,467 801,775Value ($) Total Building Value 110,218,680,000 212,351,035,000 283,586,028,000 178,547,138,000 41,609,258,000 826,312,139,000Total Building Content Value 70,120,000,000 141,230,000,000 209,920,000,000 115,910,000,000 25,830,000,000 563,010,000,000
Total 180,338,680,000 353,581,035,000 493,506,028,000 294,457,138,000 67,439,258,000 1,389,322,139,000
Section III: Natural Hazard Risk Assessment Page 50 of 179
New York City Natural Hazard Mitigation Plan March 2009
Section III: Natural Hazard Risk Assessment
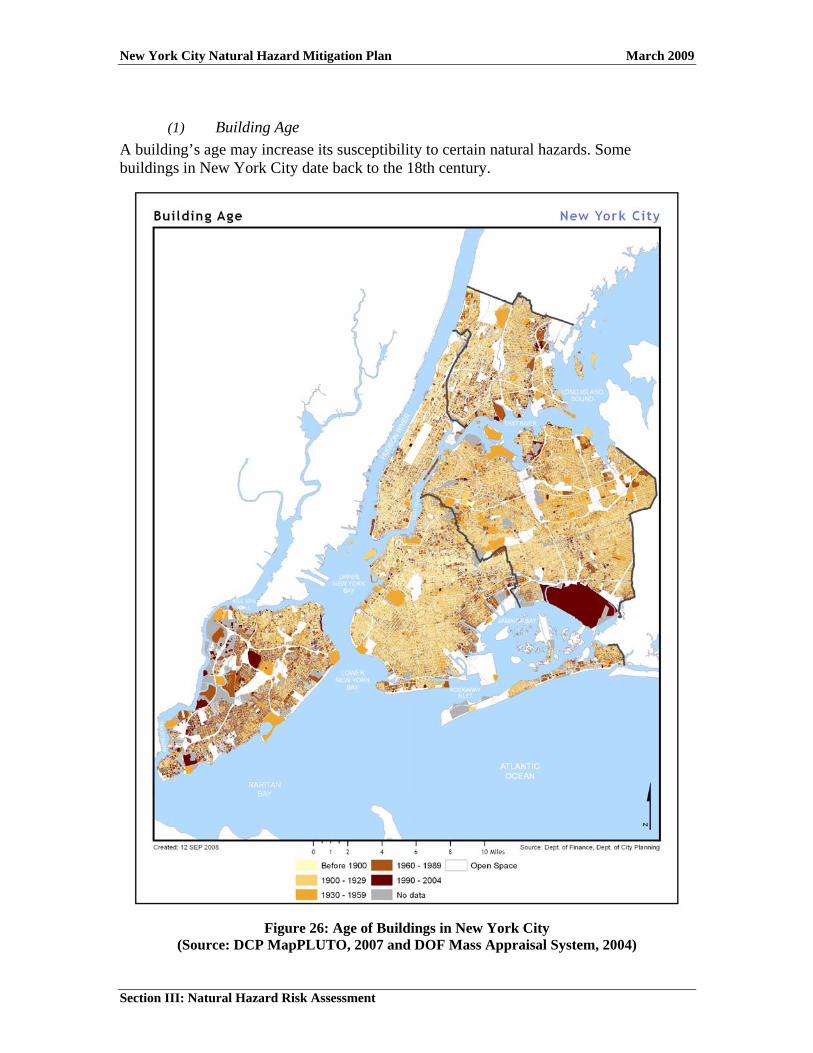
(1) Building Age A building’s age may increase its susceptibility to certain natural hazards. Some buildings in New York City date back to the 18th century.
Figure 26: Age of Buildings in New York City
(Source: DCP MapPLUTO, 2007 and DOF Mass Appraisal System, 2004)
New York City Natural Hazard Mitigation Plan March 2009
Section III: Natural Hazard Risk Assessment
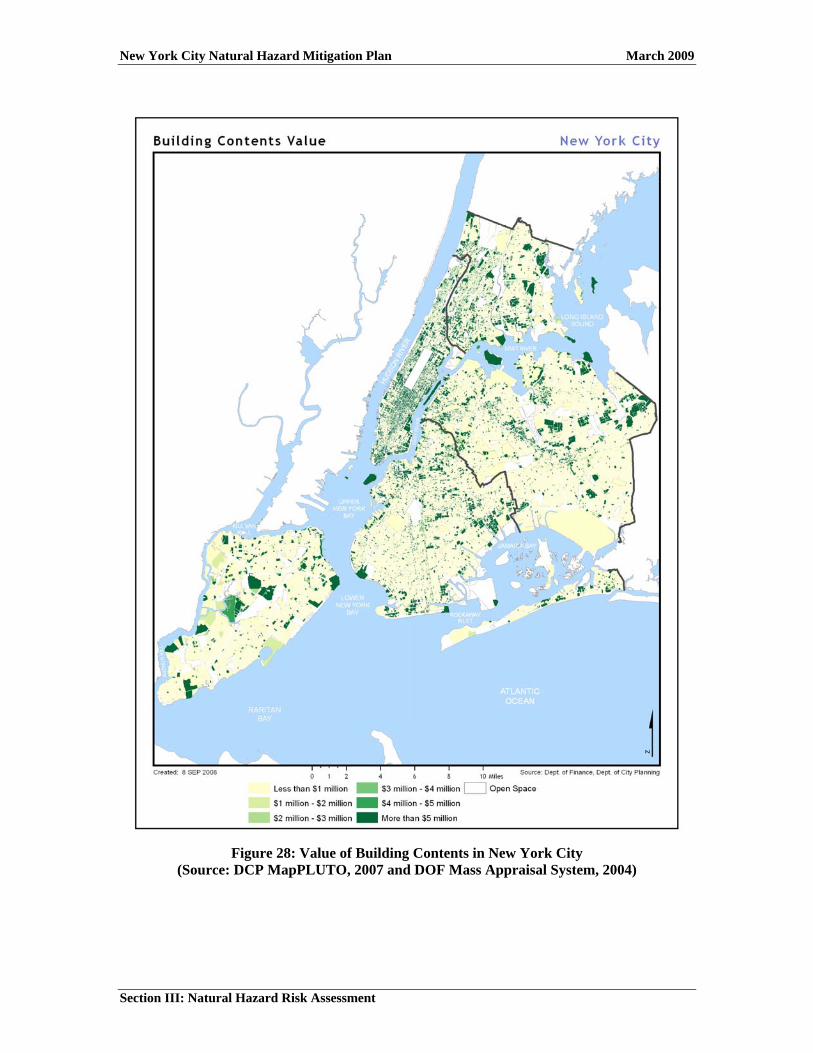
(2) Building Value Hazards U.S. Multi-Hazard (HAZUS-MH) estimates New York City’s total building value at $826 billion and the content value within these buildings at $563 billion. Manhattan accounts for the largest proportion with 35% of the City’s building value and 34% of its contents value. However, the physical value of a building and its contents are not representative of the overall value. The businesses and industries housed in many of these buildings, especially in Manhattan’s financial district and midtown, are sometimes worth billions more.

New York City Natural Hazard Mitigation Plan March 2009
Figure 27: Value of Buildings in New York City
(Source: DCP MapPLUTO, 2007 and DOF Mass Appraisal System, 2004)
Section III: Natural Hazard Risk Assessment
New York City Natural Hazard Mitigation Plan March 2009
Figure 28: Value of Building Contents in New York City
(Source: DCP MapPLUTO, 2007 and DOF Mass Appraisal System, 2004)
Section III: Natural Hazard Risk Assessment
New York City Natural Hazard Mitigation Plan March 2009
Section III: Natural Hazard Risk Assessment
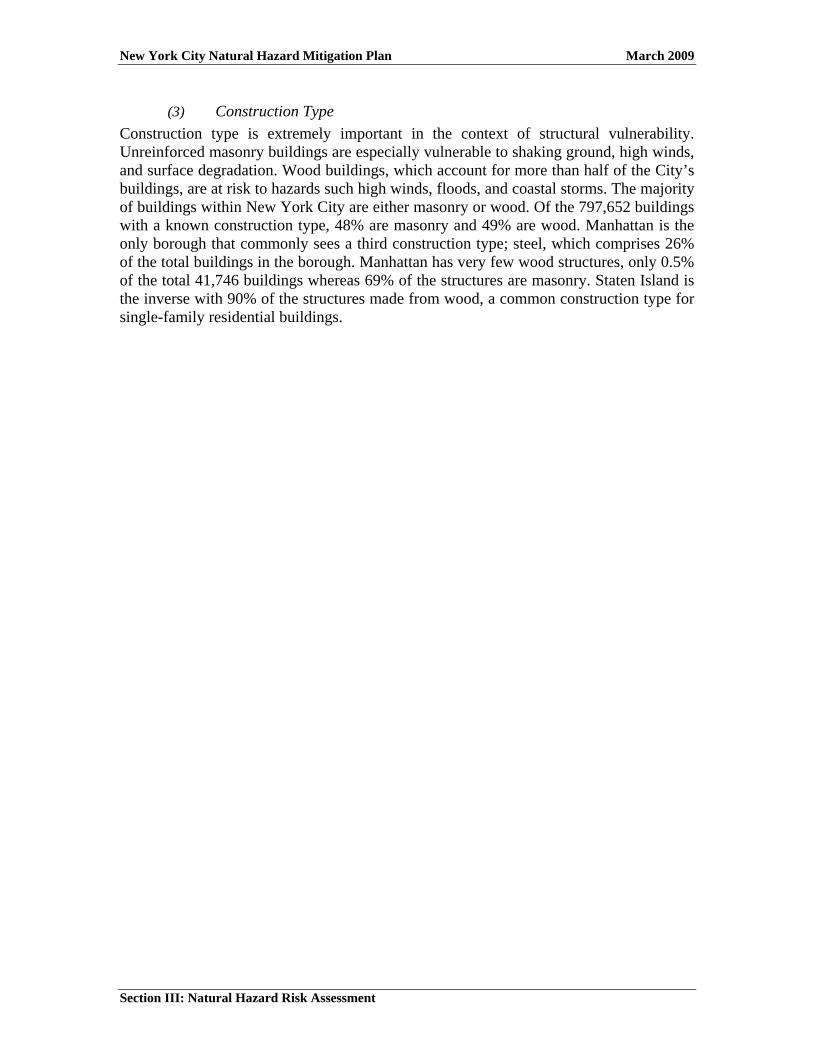
(3) Construction Type Construction type is extremely important in the context of structural vulnerability. Unreinforced masonry buildings are especially vulnerable to shaking ground, high winds, and surface degradation. Wood buildings, which account for more than half of the City’s buildings, are at risk to hazards such high winds, floods, and coastal storms. The majority of buildings within New York City are either masonry or wood. Of the 797,652 buildings with a known construction type, 48% are masonry and 49% are wood. Manhattan is the only borough that commonly sees a third construction type; steel, which comprises 26% of the total buildings in the borough. Manhattan has very few wood structures, only 0.5% of the total 41,746 buildings whereas 69% of the structures are masonry. Staten Island is the inverse with 90% of the structures made from wood, a common construction type for single-family residential buildings.
New York City Natural Hazard Mitigation Plan March 2009
Figure 29: Building Construction Type in New York City
(Source: DCP MapPLUTO, 2007 and DOF Mass Appraisal System, 2004)
Section III: Natural Hazard Risk Assessment
New York City Natural Hazard Mitigation Plan March 2009
Section III: Natural Hazard Risk Assessment
xii) Structural Vulnerability to Natural Hazards New York City’s physical assets are vulnerable to a variety of hazards. For example, buildings and infrastructure located within the floodplain or storm surge zone are susceptible to flooding and/or coastal storms. Buildings along the coastline are also vulnerable to the results of long-term coastal erosion. Unreinforced masonry buildings are at a higher risk to earthquake damage than buildings made from sturdier materials, or buildings that are reinforced. Extreme temperatures can cause pavement to buckle and damage overhead electric and telephone lines. Windstorms can cause trees and power lines to fall and debris to fly in the air. High-wind events, such as coastal storms or tornadoes, can cause less robustly built structures to suffer roof failures and building collapses. Winter weather can cause surface degradation to buildings and roadways, and disrupt movement on the roadway. Overall, a structure’s geographic and physical attributes generally affect its susceptibility to certain hazards.
xiii) New York City Construction Code Enacted in 1968, the New York City Building Code was one of the country’s most stringent building codes. However, decades of piecemeal modifications produced a long, cumbersome code that was difficult to interpret. In 2002, Mayor Bloomberg assembled an advisory committee to study the possibility of adopting a Model Code. The committee, led by DOB, concluded adopting the International Building Code (IBC) format would ensure an up-to-date and comprehensive building code to meet the present and future challenges of New York City’s dense urban environment. Using the ICB, the Committee developed a new code for the City. The revised New York City Construction Code (Construction Code) became effective on July 1, 2008 and applies to all new construction within the City. Many of the new code provisions address natural hazard mitigation, including new standards to protect buildings from drought, earthquakes, extreme temperatures, flooding, wind, and winter weather.
(1) Drought The Construction Code addresses water conservation by providing rebates to encourage the use of products and engineering that reduce consumption, such as waterless urinals and rain/wastewater recycling for non-potable uses in the construction of new and sustainable buildings.
(2) Earthquakes The Construction Code updates the seismic engineering requirements to current national standards. In addition, the Construction Code takes soil and foundation underpinning into account during construction for the first time. It requires seismic detailing and inspections to ensure compliance with new construction standards.
(3) Extreme Temperatures The Construction Code adopts sustainable elements in the design of new and old buildings. It allows the construction of green roofs as a right, whereas the previous code required special permission before a green roof could be constructed. The Construction Code also requires heat-reflective coverings on roofs or setbacks with a slope less than
New York City Natural Hazard Mitigation Plan March 2009
Section III: Natural Hazard Risk Assessment
25%. These two provisions will help New York City reduce the urban heat island effect and mitigate extreme heat.
(4) Flooding The Construction Code requires the installation of overflow drains to protect the roof should the primary drains fail. The new requirement for secondary drainage systems also requires the structural members of roofs must support the load of the accumulated rainwater. For construction in flood zones, the Construction Code clarifies current flood regulations and adopts the latest national standards, meeting or exceeding state and federal flood regulations. In addition, the Construction Code requires critical facilities located in flood zones, such as fire stations and hospitals, be elevated to protect the structures.
(5) Wind The Construction Code updates wind load requirements and brings them in line with current wind-design practices used throughout the United States. It also establishes wind exposure categories that take into account the influence of surrounding ground surface irregularities and building heights in wind design.
(6) Winter Storms The Construction Code updates snow-load requirements to incorporate thermal factors for heated and unheated buildings, as well as provisions for snowdrifts caused by parapets and adjacent buildings.